Embed Size (px)
Citation preview
Materials Sciences and Applications, 2017, 8, 685-707 http://www.scirp.org/journal/msa
ISSN Online: 2153-1188 ISSN Print: 2153-117X
DOI: 10.4236/msa.2017.810049 Sep. 5, 2017 685 Materials Sciences and Applications
Thermal Analysis of Laser Chemical Machining: Part I: Static Irradiation
Hamza Messaoudi1, Sandro Eckert1, Frank Vollertsen1,2
1BIAS—Bremer Institut für angewandte Strahltechnik, Bremen, Germany 2Faculty of Production Engineering-Mechanical Engineering & Process Engineering, University of Bremen, Bremen, Germany
Abstract
The laser chemical machining is a non-conventional substractive processing method. It is based on the laser-activation of a material dissolution of metals in electrolyte ambient via local-induced temperature gradients and allows a gentle and smooth processing of especially temperature-sensitive metals. However, the material removal is characterized by a narrow process window and is restricted by occurring disturbances, which are supposed to be related to the localized electrolyte boiling. In order to control the removal quality and avoid disturbances, the correlation between the laser-induced temperatures and the resulting removal geometry has to be better understood. In this work an analytical modeling of the laser-induced temperatures at the surface of ti-tanium based on a Green-function approach is presented. The main influen-cing factors (laser, electrolyte, material) as well as possible heat transfer into the electrolyte are included and discussed. To verify the calculated tempera-tures, single spot experiments are performed and characterized for titanium in phosphoric acid solution within laser irradiation of 1 s. The correlation between the temperature distribution and the resulting removal geometry is investi-gated based on a spatial superposition. Thereby, the bottom limit temperature is found to range between 63˚C and 70˚C whereas the upper limit is related to the nucleate boiling regime. Based on the performed correlation an indicator is identified to predict the ruling removal regime and thereby to reduce the ex-perimental expenditure.
Keywords
Laser Micro Machining, Laser Chemical Removal, Modeling, Temperature, Process Stability, Titanium
How to cite this paper: Messaoudi, H., Eckert, S. and Vollertsen, F. (2017) Ther-mal Analysis of Laser Chemical Machining: Part I: Static Irradiation. Materials Sciences and Applications, 8, 685-707. https://doi.org/10.4236/msa.2017.810049 Received: July 20, 2017 Accepted: September 2, 2017 Published: September 5, 2017 Copyright © 2017 by authors and Scientific Research Publishing Inc. This work is licensed under the Creative Commons Attribution International License (CC BY 4.0). http://creativecommons.org/licenses/by/4.0/
Open Access
H. Messaoudi et al.
DOI: 10.4236/msa.2017.810049 686 Materials Sciences and Applications
1. Introduction
Within the ever-increasing trend of miniaturization, traditional mechanical ma-chining reaches more and more its performance limits due to the enhanced com-plexity and amount of micro-components as well as occurring size effects [1]. At the same time, non-conventional machining is quickly taking root in the produc-tion of especially metallic micro tools and components [2].
Among others, these include the laser chemical machining (LCM) that unifies the advantages of laser machining with its precise and localized energy deposi-tion and the electrochemical machining with its smooth processing without sig-nificant thermal impacts [3]. Laser chemical machining is a further development of the hybrid laser-assisted electrochemical machining, in which the laser beam is coaxially positioned to the electrolyte jet [4]. Within this process the laser beam heats up the workpiece, which is immerged in a continuously pumped electrolyte [5]. Depending on the laser parameters such as the laser power and spot diameter, the induced temperature fields at the workpiece surface can change the electro-chemical potential in a range within it the anodic material dissolution is activated and results thereby in the removal of the base material [6]. This laser-activated chemical dissolution was observed for different self-passivating metals, e.g. stain-less steel and titanium alloys [7]. Within suitable process windows a gentle re-moval occurs without significant heat affected zones or a recast formation. This gentle processing represents the main advantage compared with the laser ma-chining, in which micro-cracks, distortion and stress can result when using short laser pulses [8].
However, the dynamics of the laser light absorption, heat, chemical reactions, hydrodynamics and transport phenomena causes within a certain range of para-meters a disturbance of material removal [9]. As Laser chemical machining is main-ly a temperature-driven process, it was experimentally demonstrated that occur-ring disturbances are strongly related to the electrolyte boiling and the ensuing gas bubble formation [9] as well as to the electrolyte-metal combination [10]. Nev-ertheless, it is still a lack of knowledge about the direct correlation between the laser-induced temperatures and the resulting removal geometry.
Within this work, an analytical modeling of the laser-induced surface temper-atures is presented based on a Green-function approach. It takes into account the main influencing factors (laser, electrolyte and material) as well as possible heat transfer into the electrolyte and is used to identify the influence of single process parameters on the temperature distribution. In addition, the removal properties are experimentally characterized in order to validate the modeling results. Therefore, single spot experiments are performed for titanium in phos-phoric acid solution within laser irradiation of 1 s. The correlation between the temperature distribution and the resulting removal geometry is investigated based on a spatial superposition. In dependence of laser power and beam di-ameter the starting temperature for a laser chemical removal as well as its upper limit temperature are determined. Furthermore, it is shown that once validated
H. Messaoudi et al.
DOI: 10.4236/msa.2017.810049 687 Materials Sciences and Applications
the presented model can be used to predict the process window for a distur-bance-free LCM-process and there by helps reducing the experimental expendi-ture.
2. Process Fundamentals
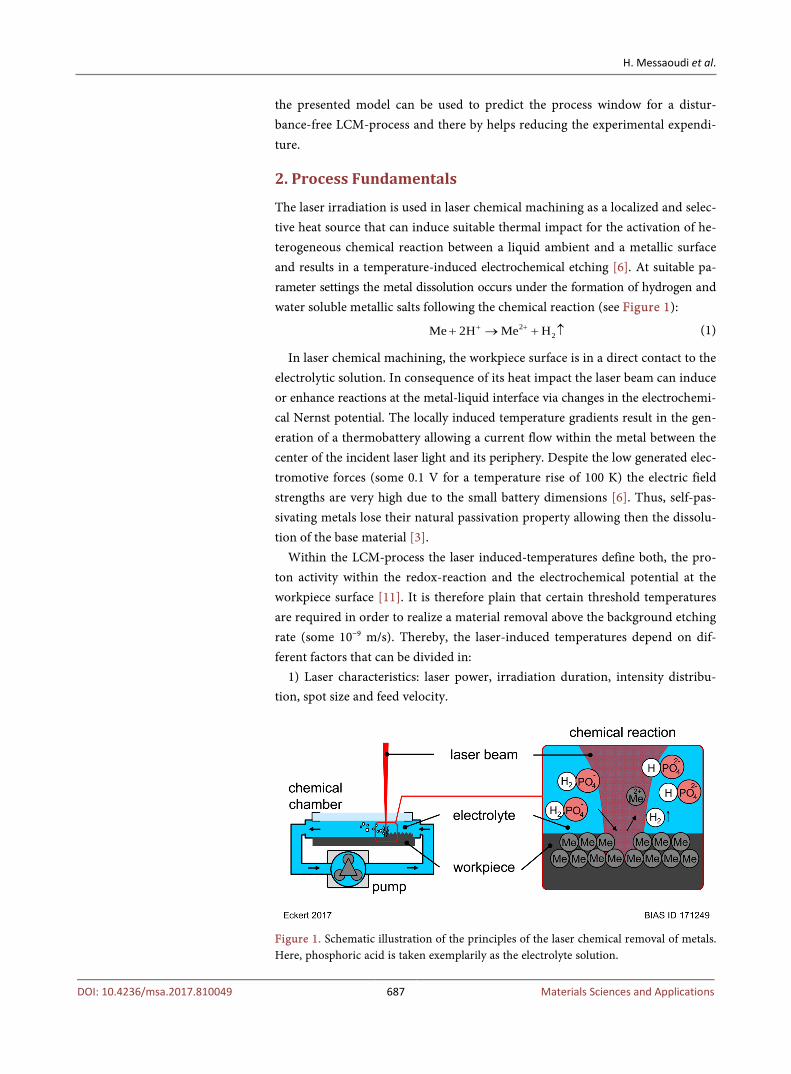
The laser irradiation is used in laser chemical machining as a localized and selec-tive heat source that can induce suitable thermal impact for the activation of he-terogeneous chemical reaction between a liquid ambient and a metallic surface and results in a temperature-induced electrochemical etching [6]. At suitable pa-rameter settings the metal dissolution occurs under the formation of hydrogen and water soluble metallic salts following the chemical reaction (see Figure 1):
22Me 2H Me H+ ++ → + ↑ (1)
In laser chemical machining, the workpiece surface is in a direct contact to the electrolytic solution. In consequence of its heat impact the laser beam can induce or enhance reactions at the metal-liquid interface via changes in the electrochemi-cal Nernst potential. The locally induced temperature gradients result in the gen-eration of a thermobattery allowing a current flow within the metal between the center of the incident laser light and its periphery. Despite the low generated elec-tromotive forces (some 0.1 V for a temperature rise of 100 K) the electric field strengths are very high due to the small battery dimensions [6]. Thus, self-pas- sivating metals lose their natural passivation property allowing then the dissolu-tion of the base material [3].
Within the LCM-process the laser induced-temperatures define both, the pro-ton activity within the redox-reaction and the electrochemical potential at the workpiece surface [11]. It is therefore plain that certain threshold temperatures are required in order to realize a material removal above the background etching rate (some 10−9 m/s). Thereby, the laser-induced temperatures depend on dif-ferent factors that can be divided in:
1) Laser characteristics: laser power, irradiation duration, intensity distribu-tion, spot size and feed velocity.
Figure 1. Schematic illustration of the principles of the laser chemical removal of metals. Here, phosphoric acid is taken exemplarily as the electrolyte solution.
H. Messaoudi et al.
DOI: 10.4236/msa.2017.810049 688 Materials Sciences and Applications
2) Material properties: wavelength-dependent absorption coefficient, chemical composition, thermal diffusivity, specific heat, density…
3) Electrolyte properties: acidic/basic solution, concentration, layer thickness, wavelength-dependent transmission coefficient.
Beside the temperature, the electrochemical potential is also depending on the chemical activity of the dissolved metal ions and on the mass transport limita-tion [3]. Latter one is mainly determining the removal speed within the aqueous electrolytes. Further, the convective flow represents also an important factor by determining the transport of reaction products as well as the provision and ex-change of reactants. An increased convection can enhance the reaction rates by several orders of magnitude. At high laser intensities an electrolyte boiling can occur resulting on the formation of vapor gas bubble. Among others, Mehrafsun et al. [9] and Yavas et al. [12] have reported that the formed bubbles result in removal disturbances that impede the controllability of the LCM process. There- fore, it is recommended to avoid electrolyte boiling.
3. Methodology 3.1. Model Assumptions
As already mentioned, the laser irradiation has the function of thermally activate the chemical etching reaction. Because of the high number of influence factors as well as the complex interaction nature (chemically, physically and flow dynam-ics) it is still a lack of knowledge about the mechanisms occurring during LCM- process.
The laser radiation propagates throughout the etchant solution, is absorbed at the workpiece surface, induces a temperature distribution that define the area and properties of the chemical dissolution reaction and thereby the quality of the material removal. Therefore, a determination of the temperature distribution over the workpiece surface would help to understand the influences of the main process parameters. To build up a theoretical description of the surface temper-ature following assumptions have been made:
1) The laser beam—as the heat source—is a TEM00-mode with a Gaussian in-tensity distribution
( )
22
0, ex y
x yr r
I x y I
+ = ⋅ (2)
where 0 absI P A= with Pabs is the absorbed laser power and A is the laser beam area at the workpiece surface, π x yA r r= and x yr r= .
2) The workpiece/laser beam is moving with a constant speed v and in x-di- rection. In this work the feed velocity v = 0, as only the case of a static irradiation is studied.
3) The material is supposed to be isotropic with temperature-independent properties.
4) Phase changes do not occur. On the one hand laser melting cannot occur at the applied laser powers and on the other hand the formation of metallic salt lay-
H. Messaoudi et al.
DOI: 10.4236/msa.2017.810049 689 Materials Sciences and Applications
ers is neglected. 5) The laser power is affected by the transmission coefficient Eτ that de-
scribes the power loss during the propagation throughout the etchant solution and by the absorption coefficient absα of the metallic material. Both coeffi-cients are assumed to be constant and temperature-independent. The absorbed laser power Pabs is then described as:
abs L abs EP P α τ⋅ ⋅= (3)
6) The thermal interaction takes place only between laser beam and work-piece. Additional contributions, such as the heat of reaction, are neglected.
7) Heat transfer into the etchant solution is considered. The heat equation in-cludes heat loss rates dependent on constant heat transfer coefficients of the electrolyte.
8) For the description of the heat equation a rectangular coordinate system is used. This is fixed in the workpiece, where the origin is directly beneath the beam center, x-y-plane is the workpiece surface and the positive z-axis points into the workpiece. The laser beam interacts with the workpiece at z = 0. All re-levant modeling parameters are listed in Table A1 (see Supplementary Materi-al).
3.2. Green’s Function Based Model
The interaction between laser irradiation and metallic surface is assumed to be dominated by conduction during the electron-lattice heating. The conduction is related to the thermal diffusivity D, the volumetric heat capacity Cp and the ma-terial density ρ . The resulting temperature distribution T in the material is as-sociated to the power density Q through the diffusion equation:
2 2 2
2 2 2p
T T T T QDt Cx y z ρ
∂ ∂ ∂ ∂= + + − ∂ ∂ ∂ ∂
(4)
Here, Q represents the contribution of the heat source (laser beam) and can be described as:
( )2 2
22e e2π ²
x vt yzabs rPQ
rα
− +−
−= ⋅ ⋅ (5)
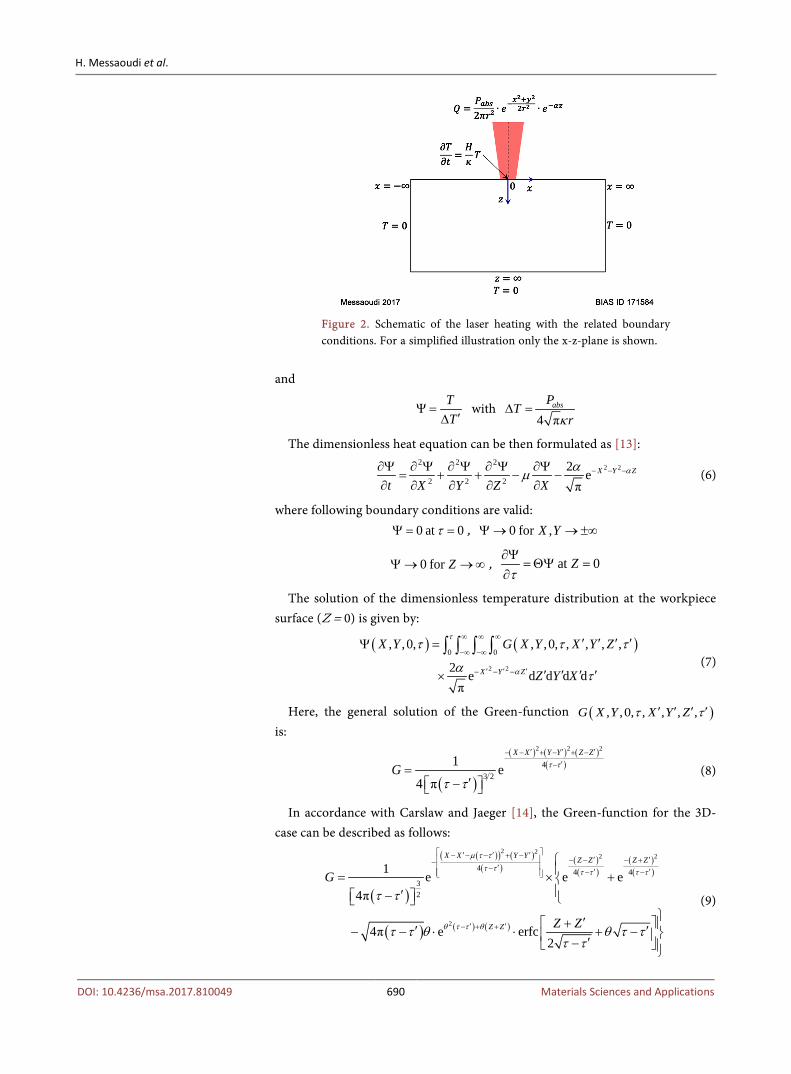
The temperature rise ( ), , ,T x y z t is valid for x > −∞ , y < ∞ , 0 z≤ ≤ ∞ and 0t > and follows the boundary conditions (see Figure 2):
0 at 0T t= = , 0 for ,T x y→ →±∞
0 forT z→ →∞ , at 0T H T zt κ
∂= =
∂
For a simplified mathematical treatment a dimensionless formulation of Equ-ation (4) has to be provided. Therefore, following dimensionless variables were defined:
2, , , , , ,²
x y z Dt v r r H rX Y Zr r r r D l
τ µ ακ
⋅ ⋅= = = = = = Θ =
H. Messaoudi et al.
DOI: 10.4236/msa.2017.810049 690 Materials Sciences and Applications
Figure 2. Schematic of the laser heating with the related boundary conditions. For a simplified illustration only the x-z-plane is shown.
and
Ψ TT
=′∆
with 4 π
absPTrκ
∆ =
The dimensionless heat equation can be then formulated as [13]:
2 22 2 2
2 2 2
2 eπ
X Y Z
t XX Y Zαα
µ − − −∂Ψ ∂ Ψ ∂ Ψ ∂ Ψ ∂Ψ= + + − −
∂ ∂∂ ∂ ∂ (6)
where following boundary conditions are valid: 0 at 0τΨ = = , 0 for ,X YΨ→ →±∞
0 for ZΨ→ →∞ , at 0Zτ
∂Ψ= ΘΨ =
∂
The solution of the dimensionless temperature distribution at the workpiece surface (Z = 0) is given by:
( ) ( )2 2
0 0, ,0, , ,0, , , , ,
2 e d d d dπ
X Y Z
X Y G X Y X Y Z
Z Y X
τ
α
τ τ τ
α τ
∞ ∞ ∞
−∞ −∞
′ ′ ′− − −
′ ′ ′ ′Ψ =
′ ′ ′ ′×
∫ ∫ ∫ ∫ (7)
Here, the general solution of the Green-function ( ), ,0, , , , ,G X Y X Y Zτ τ′ ′ ′ ′ is:
( )
( ) ( ) ( )( )
2 2 2
43 2
1 e4 π
X X Y Y Z Z
G τ τ
τ τ
′ ′ ′− − + − + −′−=
′− (8)
In accordance with Carslaw and Jaeger [14], the Green-function for the 3D- case can be described as follows:
( )
( )( ) ( )( )
( )( )
( )( )
( ) ( ) ( )
2 22 2
2
4 4 432
1 e e e4π
4π e erfc2
X X Y Y Z Z Z Z
Z Z
G
Z Z
µ τ ττ τ τ τ τ τ
θ τ τ θ
τ τ
τ τ θ θ τ ττ τ
′ ′ ′− − − + − ′ ′− − − +− ′− ′ ′− −
′ ′− + +
= × +′−
′+ ′ ′− − ⋅ ⋅ + − ′−
(9)
H. Messaoudi et al.
DOI: 10.4236/msa.2017.810049 691 Materials Sciences and Applications
Using the substitution φ τ τ ′= − and taking into account the velocity related term µ; the dimensionless Equation (Equation (7)) at Z = 0 can be transformed into:
[ ]
( ) ( ) ( )
[ ]
( ) ( ) ( )
[ ]
( ) ( )
2 2 2
2 2
2 2 2
2 2
2 2
4 430 02
4 430 02
4
32
2 1 e eπ 4π
e d d d d
2 1 e eπ 4π
2 1e d d d d eπ 4π
X X Y Y Z Z
X Y Z
X X Y Y Z Z
X X Y Y
X Y Z
Z Y X
Z Y X
µφφτ φ
α
µφφτ φ
µφφα
α
φ
φ
α
φ
αφφ
′ ′− − + − ′− − − ∞ ∞ ∞
−∞ −∞
′ ′ ′− − −
′ ′− − + − ′− + − ∞ ∞ ∞
−∞ −∞
′ ′− − + −−
′ ′ ′− − −
Ψ = ⋅
′ ′ ′⋅
+ ⋅
′ ′ ′⋅ −
∫ ∫ ∫ ∫
∫ ∫ ∫ ∫
( ) ( )( )
2 2
2
2 2
0 0
4 4e e 4π e erfc2
e d d d d
Z Z Z ZZ Z
X Y Z
Z Z
Z Y X
τ
θ φ θφ φ
α
φθ θ φφ
φ
∞ ∞ ∞
−∞ −∞
′ ′− − − +′+ +
′ ′ ′− − −
′+ ⋅ + − ⋅ ⋅ +
′ ′ ′⋅
∫ ∫ ∫ ∫
(10)
In Equation (10) the first two integrals represent the lossless heat equation, whereas the third term includes the heat losses when considering heat transfer into the electrolyte (i.e. H > 0). This formulation is in good agreement with the work of Yung et al. [15], in which a similar approach was used.
With help of the closed-form approximation of the error function, described in [16]:
( )( ) 2 2
e erfc1 π π
x axa x x a
≈− + +
⋅ (11)
where ( )π π 2a = − , the surface temperature rise T(x, y, 0, t) can be finally simplified and described as:
( )
( )
( )
( )
2 2
2 2
2
1 4
0 2 2 2
1 4
0
02 2 2
4
1 e d4π 1 4 1 π π
1 e4π 1 4
1 π π4 4
e e d d
X Y
Abs E
X Y
Abs E
ZZ
P aTl a a
Pl
a
Z Za Z Z a
Z
µφτ φ
µφτ φ
αφ
α τφ
κ φ α φ α φ
α τθ
κ φ
φ φφ φ
φ
− + −+
− + −+
∞
′−
′−
⋅ ⋅= ⋅ ⋅ ⋅
⋅ ⋅ + − + +
⋅ ⋅− ⋅
⋅ ⋅ +
⋅′ ′ ′ ′− +Θ +Θ + +Θ +Θ +
′⋅ ⋅
∫
∫
∫ (12)
3.3. Experimental
As laser source a cw-fiber laser JK400 (from JK Lasers) was used. Its TEM00 cw-laser radiation of 1080 nm is focused by a telecentric f-theta optic and guided using the galvanometer scanning system Raylase Superscan III-15 to the surface.
H. Messaoudi et al.
DOI: 10.4236/msa.2017.810049 692 Materials Sciences and Applications
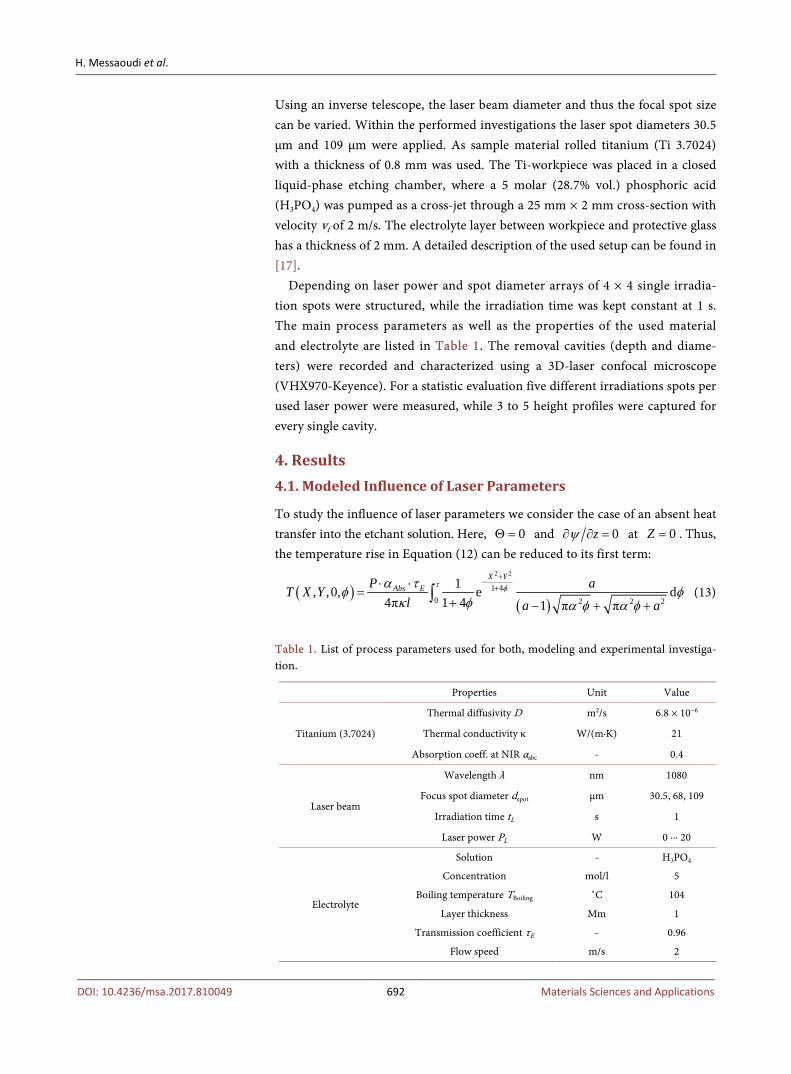
Using an inverse telescope, the laser beam diameter and thus the focal spot size can be varied. Within the performed investigations the laser spot diameters 30.5 µm and 109 µm were applied. As sample material rolled titanium (Ti 3.7024) with a thickness of 0.8 mm was used. The Ti-workpiece was placed in a closed liquid-phase etching chamber, where a 5 molar (28.7% vol.) phosphoric acid (H3PO4) was pumped as a cross-jet through a 25 mm × 2 mm cross-section with velocity vf of 2 m/s. The electrolyte layer between workpiece and protective glass has a thickness of 2 mm. A detailed description of the used setup can be found in [17].
Depending on laser power and spot diameter arrays of 4 × 4 single irradia-tion spots were structured, while the irradiation time was kept constant at 1 s. The main process parameters as well as the properties of the used material and electrolyte are listed in Table 1. The removal cavities (depth and diame-ters) were recorded and characterized using a 3D-laser confocal microscope (VHX970-Keyence). For a statistic evaluation five different irradiations spots per used laser power were measured, while 3 to 5 height profiles were captured for every single cavity.
4. Results 4.1. Modeled Influence of Laser Parameters
To study the influence of laser parameters we consider the case of an absent heat transfer into the etchant solution. Here, 0Θ = and 0zψ∂ ∂ = at 0Z = . Thus, the temperature rise in Equation (12) can be reduced to its first term:
( )( )
2 2
1 40 2 2 2
1, ,0, e d4π 1 4 1 π π
X YAbs EP aT X Y
l a a
τ φα τφ φ
κ φ α φ α φ
+−
+⋅ ⋅=
+ − + +∫ (13)
Table 1. List of process parameters used for both, modeling and experimental investiga-tion.
Properties Unit Value
Titanium (3.7024)
Thermal diffusivity D m2/s 6.8 × 10⁻⁶
Thermal conductivity κ W/(m·K) 21
Absorption coeff. at NIR αabc - 0.4
Laser beam
Wavelength λ nm 1080
Focus spot diameter dspot µm 30.5, 68, 109
Irradiation time tL s 1
Laser power PL W 0 ∙∙∙ 20
Electrolyte
Solution - H3PO4
Concentration mol/l 5
Boiling temperature TBoiling ˚C 104
Layer thickness Mm 1
Transmission coefficient τE - 0.96
Flow speed m/s 2
H. Messaoudi et al.
DOI: 10.4236/msa.2017.810049 693 Materials Sciences and Applications
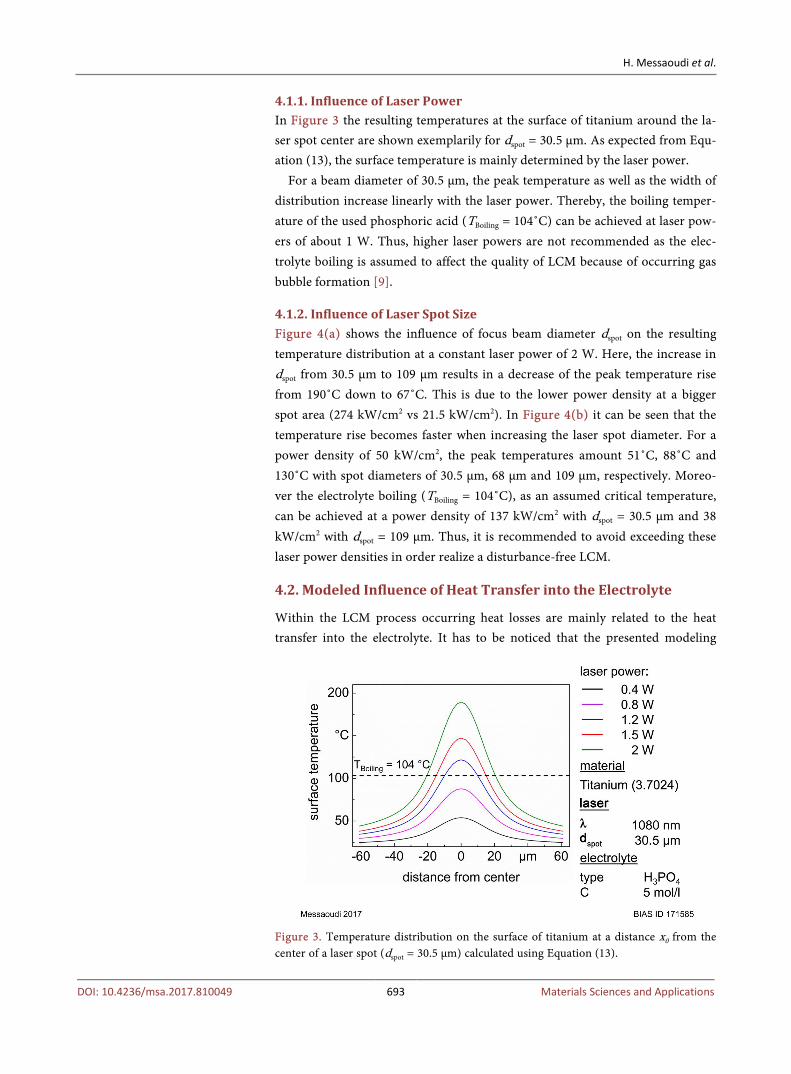
4.1.1. Influence of Laser Power In Figure 3 the resulting temperatures at the surface of titanium around the la-ser spot center are shown exemplarily for dspot = 30.5 µm. As expected from Equ-ation (13), the surface temperature is mainly determined by the laser power.
For a beam diameter of 30.5 µm, the peak temperature as well as the width of distribution increase linearly with the laser power. Thereby, the boiling temper-ature of the used phosphoric acid (TBoiling = 104˚C) can be achieved at laser pow-ers of about 1 W. Thus, higher laser powers are not recommended as the elec-trolyte boiling is assumed to affect the quality of LCM because of occurring gas bubble formation [9].
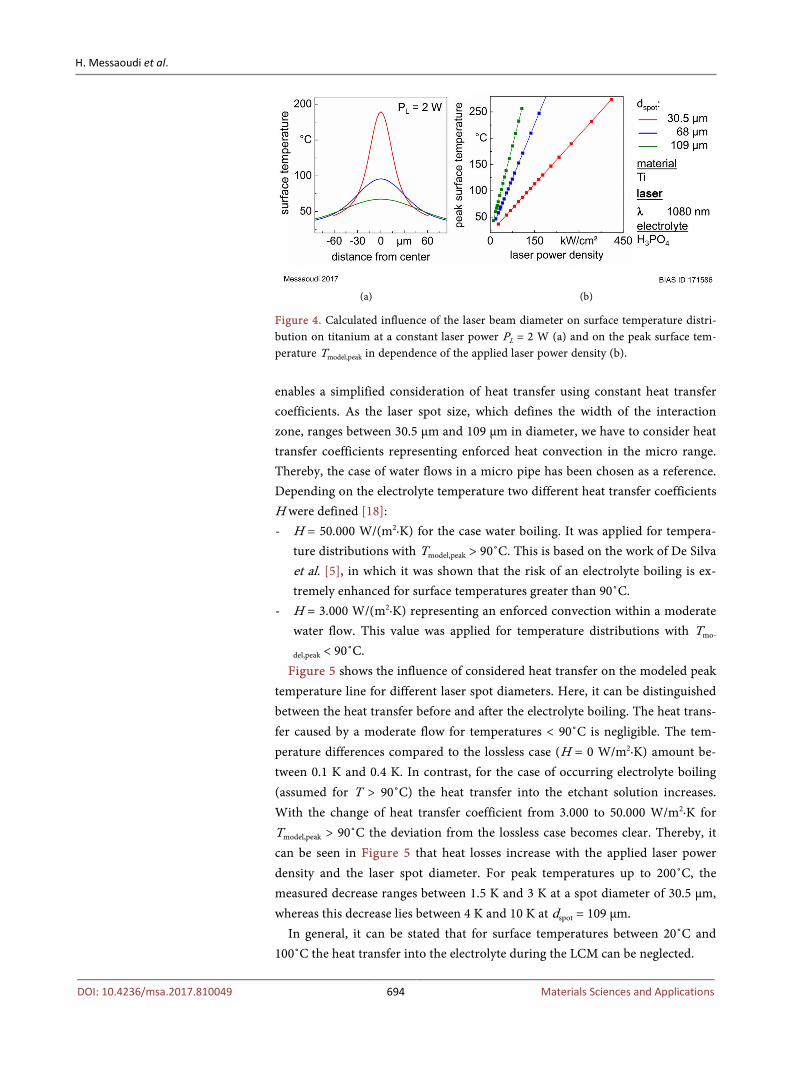
4.1.2. Influence of Laser Spot Size Figure 4(a) shows the influence of focus beam diameter dspot on the resulting temperature distribution at a constant laser power of 2 W. Here, the increase in dspot from 30.5 µm to 109 µm results in a decrease of the peak temperature rise from 190˚C down to 67˚C. This is due to the lower power density at a bigger spot area (274 kW/cm2 vs 21.5 kW/cm2). In Figure 4(b) it can be seen that the temperature rise becomes faster when increasing the laser spot diameter. For a power density of 50 kW/cm2, the peak temperatures amount 51˚C, 88˚C and 130˚C with spot diameters of 30.5 µm, 68 µm and 109 µm, respectively. Moreo-ver the electrolyte boiling (TBoiling = 104˚C), as an assumed critical temperature, can be achieved at a power density of 137 kW/cm2 with dspot = 30.5 µm and 38 kW/cm2 with dspot = 109 µm. Thus, it is recommended to avoid exceeding these laser power densities in order realize a disturbance-free LCM.
4.2. Modeled Influence of Heat Transfer into the Electrolyte
Within the LCM process occurring heat losses are mainly related to the heat transfer into the electrolyte. It has to be noticed that the presented modeling
Figure 3. Temperature distribution on the surface of titanium at a distance x0 from the center of a laser spot (dspot = 30.5 μm) calculated using Equation (13).
H. Messaoudi et al.
DOI: 10.4236/msa.2017.810049 694 Materials Sciences and Applications
(a) (b)
Figure 4. Calculated influence of the laser beam diameter on surface temperature distri-bution on titanium at a constant laser power PL = 2 W (a) and on the peak surface tem-perature Tmodel,peak in dependence of the applied laser power density (b). enables a simplified consideration of heat transfer using constant heat transfer coefficients. As the laser spot size, which defines the width of the interaction zone, ranges between 30.5 µm and 109 µm in diameter, we have to consider heat transfer coefficients representing enforced heat convection in the micro range. Thereby, the case of water flows in a micro pipe has been chosen as a reference. Depending on the electrolyte temperature two different heat transfer coefficients H were defined [18]: - H = 50.000 W/(m2∙K) for the case water boiling. It was applied for tempera-
ture distributions with Tmodel,peak > 90˚C. This is based on the work of De Silva et al. [5], in which it was shown that the risk of an electrolyte boiling is ex-tremely enhanced for surface temperatures greater than 90˚C.
- H = 3.000 W/(m2∙K) representing an enforced convection within a moderate water flow. This value was applied for temperature distributions with Tmo-
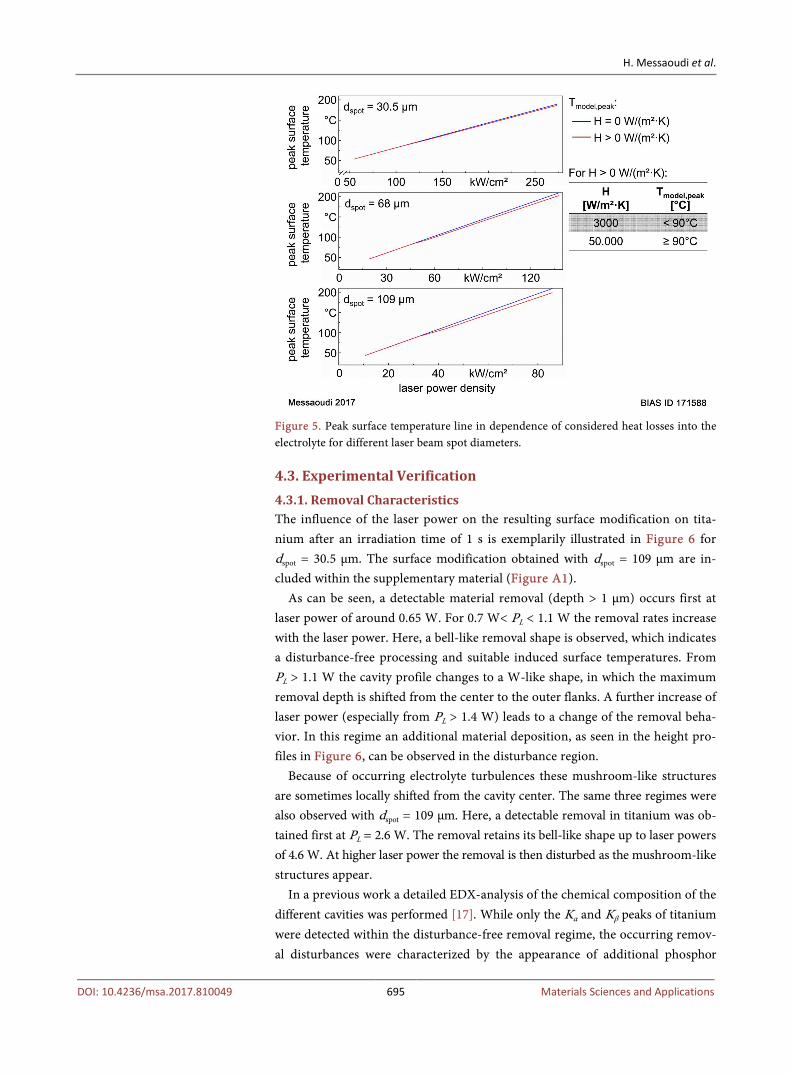
del,peak < 90˚C. Figure 5 shows the influence of considered heat transfer on the modeled peak
temperature line for different laser spot diameters. Here, it can be distinguished between the heat transfer before and after the electrolyte boiling. The heat trans-fer caused by a moderate flow for temperatures < 90˚C is negligible. The tem-perature differences compared to the lossless case (H = 0 W/m2∙K) amount be-tween 0.1 K and 0.4 K. In contrast, for the case of occurring electrolyte boiling (assumed for T > 90˚C) the heat transfer into the etchant solution increases. With the change of heat transfer coefficient from 3.000 to 50.000 W/m2∙K for Tmodel,peak > 90˚C the deviation from the lossless case becomes clear. Thereby, it can be seen in Figure 5 that heat losses increase with the applied laser power density and the laser spot diameter. For peak temperatures up to 200˚C, the measured decrease ranges between 1.5 K and 3 K at a spot diameter of 30.5 µm, whereas this decrease lies between 4 K and 10 K at dspot = 109 µm.
In general, it can be stated that for surface temperatures between 20˚C and 100˚C the heat transfer into the electrolyte during the LCM can be neglected.
H. Messaoudi et al.
DOI: 10.4236/msa.2017.810049 695 Materials Sciences and Applications
Figure 5. Peak surface temperature line in dependence of considered heat losses into the electrolyte for different laser beam spot diameters.
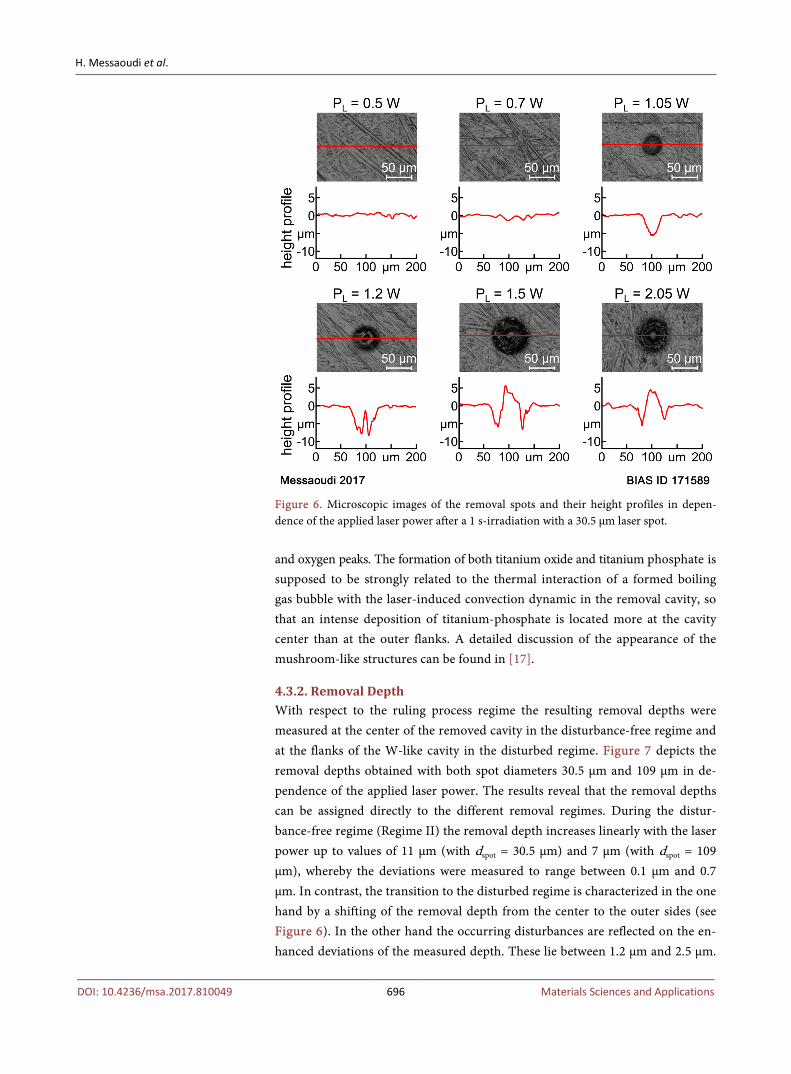
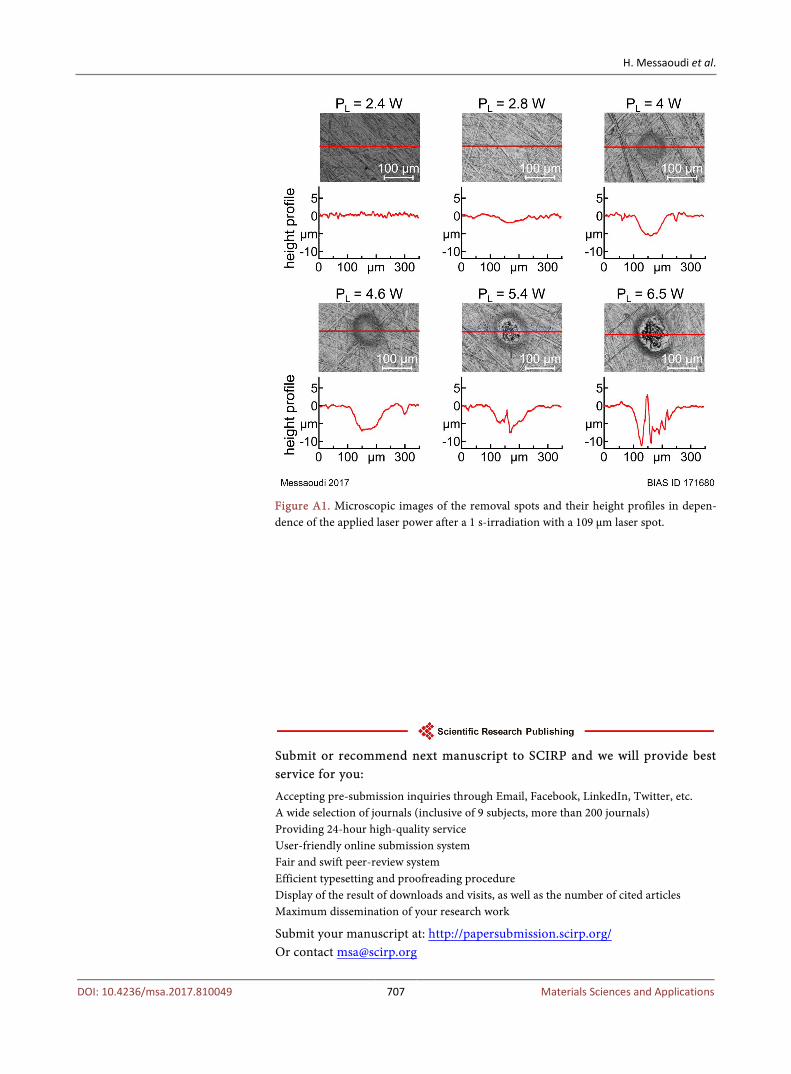
4.3. Experimental Verification 4.3.1. Removal Characteristics The influence of the laser power on the resulting surface modification on tita-nium after an irradiation time of 1 s is exemplarily illustrated in Figure 6 for dspot = 30.5 µm. The surface modification obtained with dspot = 109 µm are in-cluded within the supplementary material (Figure A1).
As can be seen, a detectable material removal (depth > 1 µm) occurs first at laser power of around 0.65 W. For 0.7 W< PL < 1.1 W the removal rates increase with the laser power. Here, a bell-like removal shape is observed, which indicates a disturbance-free processing and suitable induced surface temperatures. From PL > 1.1 W the cavity profile changes to a W-like shape, in which the maximum removal depth is shifted from the center to the outer flanks. A further increase of laser power (especially from PL > 1.4 W) leads to a change of the removal beha-vior. In this regime an additional material deposition, as seen in the height pro-files in Figure 6, can be observed in the disturbance region.
Because of occurring electrolyte turbulences these mushroom-like structures are sometimes locally shifted from the cavity center. The same three regimes were also observed with dspot = 109 µm. Here, a detectable removal in titanium was ob-tained first at PL = 2.6 W. The removal retains its bell-like shape up to laser powers of 4.6 W. At higher laser power the removal is then disturbed as the mushroom-like structures appear.
In a previous work a detailed EDX-analysis of the chemical composition of the different cavities was performed [17]. While only the Kα and Kβ peaks of titanium were detected within the disturbance-free removal regime, the occurring remov-al disturbances were characterized by the appearance of additional phosphor
H. Messaoudi et al.
DOI: 10.4236/msa.2017.810049 696 Materials Sciences and Applications
Figure 6. Microscopic images of the removal spots and their height profiles in depen-dence of the applied laser power after a 1 s-irradiation with a 30.5 µm laser spot. and oxygen peaks. The formation of both titanium oxide and titanium phosphate is supposed to be strongly related to the thermal interaction of a formed boiling gas bubble with the laser-induced convection dynamic in the removal cavity, so that an intense deposition of titanium-phosphate is located more at the cavity center than at the outer flanks. A detailed discussion of the appearance of the mushroom-like structures can be found in [17].
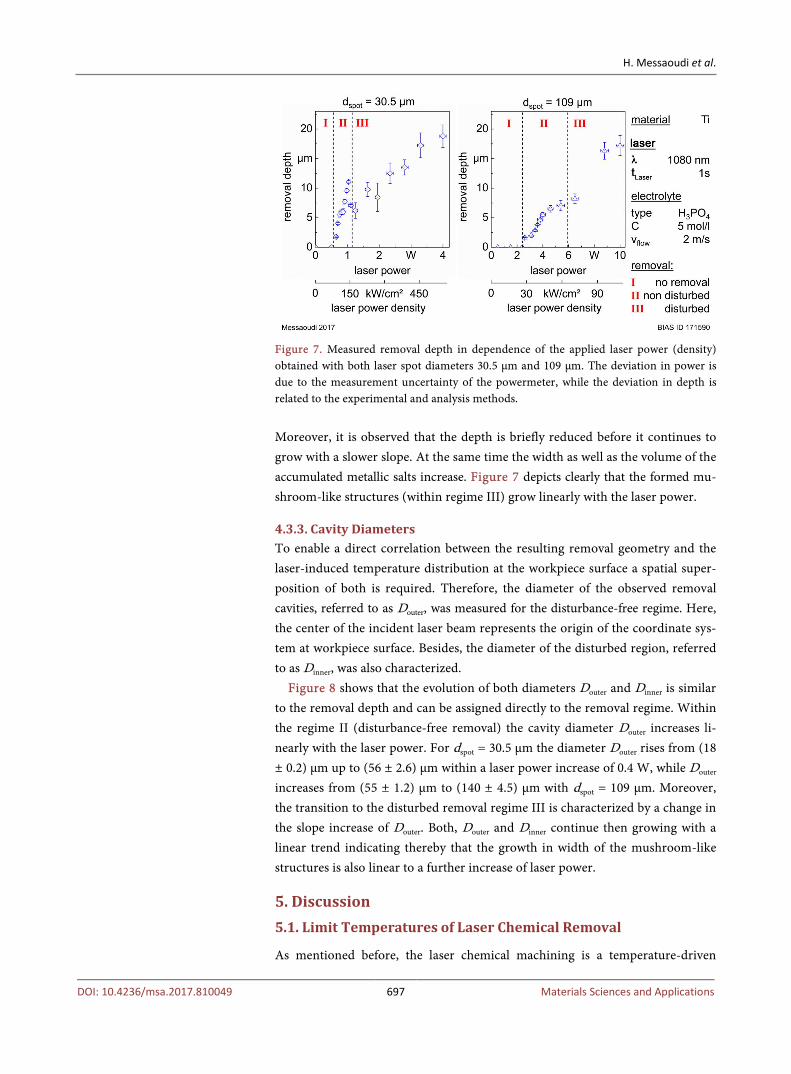
4.3.2. Removal Depth With respect to the ruling process regime the resulting removal depths were measured at the center of the removed cavity in the disturbance-free regime and at the flanks of the W-like cavity in the disturbed regime. Figure 7 depicts the removal depths obtained with both spot diameters 30.5 µm and 109 µm in de-pendence of the applied laser power. The results reveal that the removal depths can be assigned directly to the different removal regimes. During the distur-bance-free regime (Regime II) the removal depth increases linearly with the laser power up to values of 11 µm (with dspot = 30.5 µm) and 7 µm (with dspot = 109 µm), whereby the deviations were measured to range between 0.1 µm and 0.7 µm. In contrast, the transition to the disturbed regime is characterized in the one hand by a shifting of the removal depth from the center to the outer sides (see Figure 6). In the other hand the occurring disturbances are reflected on the en-hanced deviations of the measured depth. These lie between 1.2 µm and 2.5 µm.
H. Messaoudi et al.
DOI: 10.4236/msa.2017.810049 697 Materials Sciences and Applications
Figure 7. Measured removal depth in dependence of the applied laser power (density) obtained with both laser spot diameters 30.5 µm and 109 µm. The deviation in power is due to the measurement uncertainty of the powermeter, while the deviation in depth is related to the experimental and analysis methods. Moreover, it is observed that the depth is briefly reduced before it continues to grow with a slower slope. At the same time the width as well as the volume of the accumulated metallic salts increase. Figure 7 depicts clearly that the formed mu-shroom-like structures (within regime III) grow linearly with the laser power.
4.3.3. Cavity Diameters To enable a direct correlation between the resulting removal geometry and the laser-induced temperature distribution at the workpiece surface a spatial super-position of both is required. Therefore, the diameter of the observed removal cavities, referred to as Douter, was measured for the disturbance-free regime. Here, the center of the incident laser beam represents the origin of the coordinate sys-tem at workpiece surface. Besides, the diameter of the disturbed region, referred to as Dinner, was also characterized.
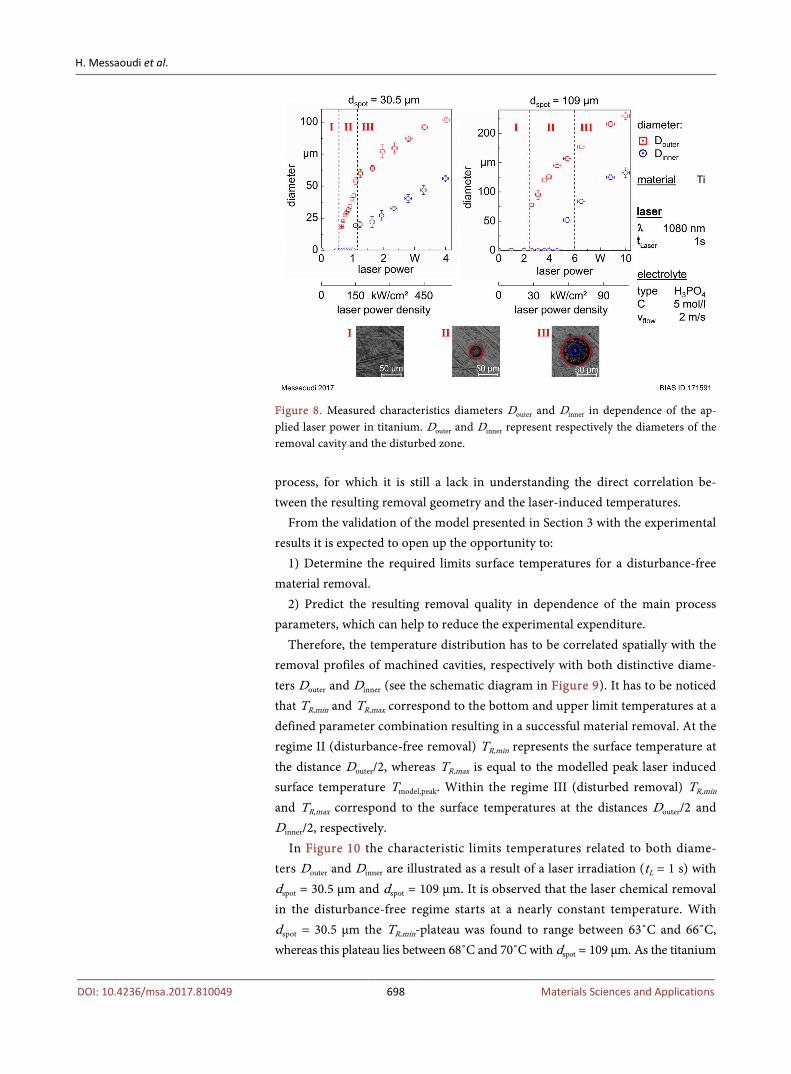
Figure 8 shows that the evolution of both diameters Douter and Dinner is similar to the removal depth and can be assigned directly to the removal regime. Within the regime II (disturbance-free removal) the cavity diameter Douter increases li-nearly with the laser power. For dspot = 30.5 µm the diameter Douter rises from (18 ± 0.2) µm up to (56 ± 2.6) µm within a laser power increase of 0.4 W, while Douter increases from (55 ± 1.2) µm to (140 ± 4.5) µm with dspot = 109 µm. Moreover, the transition to the disturbed removal regime III is characterized by a change in the slope increase of Douter. Both, Douter and Dinner continue then growing with a linear trend indicating thereby that the growth in width of the mushroom-like structures is also linear to a further increase of laser power.
5. Discussion 5.1. Limit Temperatures of Laser Chemical Removal
As mentioned before, the laser chemical machining is a temperature-driven
H. Messaoudi et al.
DOI: 10.4236/msa.2017.810049 698 Materials Sciences and Applications
Figure 8. Measured characteristics diameters Douter and Dinner in dependence of the ap-plied laser power in titanium. Douter and Dinner represent respectively the diameters of the removal cavity and the disturbed zone. process, for which it is still a lack in understanding the direct correlation be-tween the resulting removal geometry and the laser-induced temperatures.
From the validation of the model presented in Section 3 with the experimental results it is expected to open up the opportunity to:
1) Determine the required limits surface temperatures for a disturbance-free material removal.
2) Predict the resulting removal quality in dependence of the main process parameters, which can help to reduce the experimental expenditure.
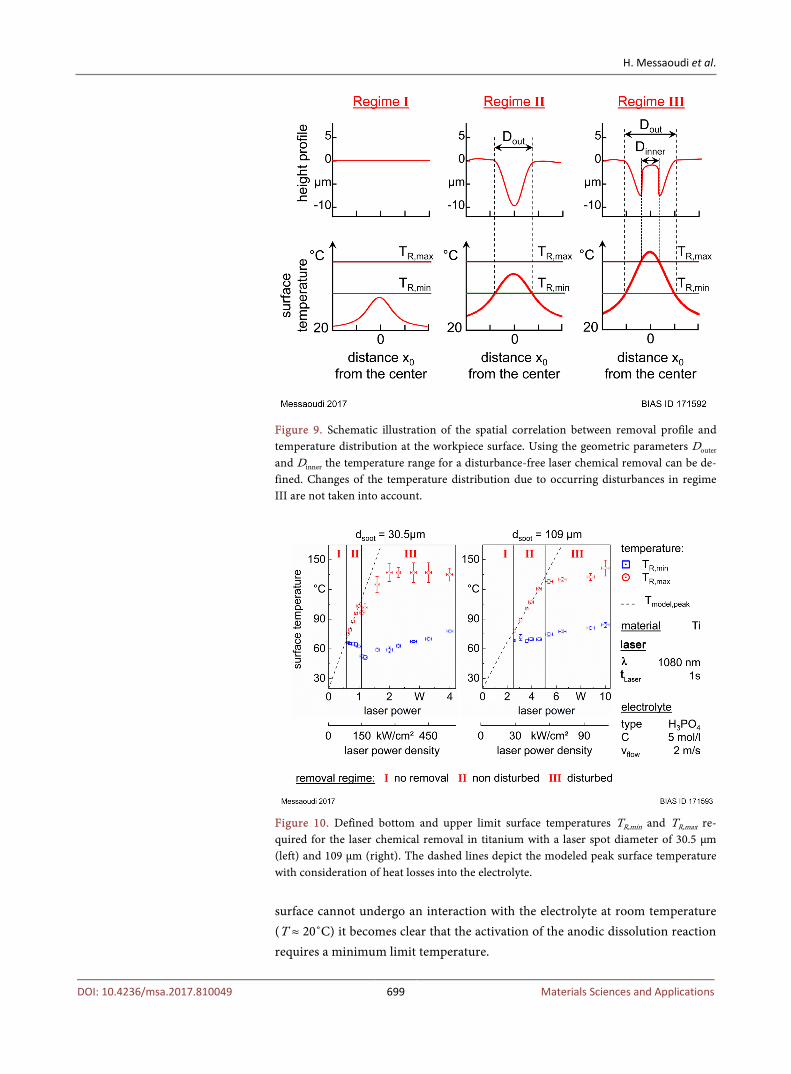
Therefore, the temperature distribution has to be correlated spatially with the removal profiles of machined cavities, respectively with both distinctive diame-ters Douter and Dinner (see the schematic diagram in Figure 9). It has to be noticed that TR,min and TR,max correspond to the bottom and upper limit temperatures at a defined parameter combination resulting in a successful material removal. At the regime II (disturbance-free removal) TR,min represents the surface temperature at the distance Douter/2, whereas TR,max is equal to the modelled peak laser induced surface temperature Tmodel,peak. Within the regime III (disturbed removal) TR,min and TR,max correspond to the surface temperatures at the distances Douter/2 and Dinner/2, respectively.
In Figure 10 the characteristic limits temperatures related to both diame-ters Douter and Dinner are illustrated as a result of a laser irradiation (tL = 1 s) with dspot = 30.5 µm and dspot = 109 µm. It is observed that the laser chemical removal in the disturbance-free regime starts at a nearly constant temperature. With dspot = 30.5 µm the TR,min-plateau was found to range between 63˚C and 66˚C, whereas this plateau lies between 68˚C and 70˚C with dspot = 109 µm. As the titanium
H. Messaoudi et al.
DOI: 10.4236/msa.2017.810049 699 Materials Sciences and Applications
Figure 9. Schematic illustration of the spatial correlation between removal profile and temperature distribution at the workpiece surface. Using the geometric parameters Douter and Dinner the temperature range for a disturbance-free laser chemical removal can be de-fined. Changes of the temperature distribution due to occurring disturbances in regime III are not taken into account.
Figure 10. Defined bottom and upper limit surface temperatures TR,min and TR,max re-quired for the laser chemical removal in titanium with a laser spot diameter of 30.5 µm (left) and 109 µm (right). The dashed lines depict the modeled peak surface temperature with consideration of heat losses into the electrolyte. surface cannot undergo an interaction with the electrolyte at room temperature (T ≈ 20˚C) it becomes clear that the activation of the anodic dissolution reaction requires a minimum limit temperature.
H. Messaoudi et al.
DOI: 10.4236/msa.2017.810049 700 Materials Sciences and Applications
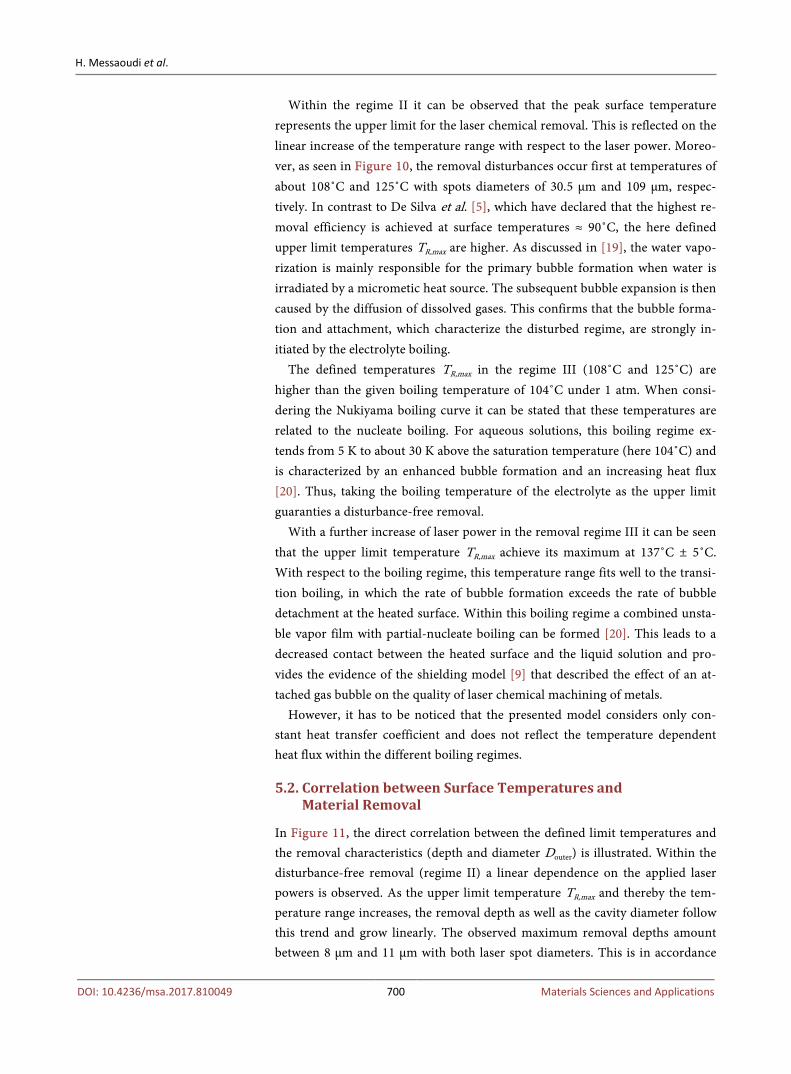
Within the regime II it can be observed that the peak surface temperature represents the upper limit for the laser chemical removal. This is reflected on the linear increase of the temperature range with respect to the laser power. Moreo-ver, as seen in Figure 10, the removal disturbances occur first at temperatures of about 108˚C and 125˚C with spots diameters of 30.5 µm and 109 µm, respec-tively. In contrast to De Silva et al. [5], which have declared that the highest re-moval efficiency is achieved at surface temperatures ≈ 90˚C, the here defined upper limit temperatures TR,max are higher. As discussed in [19], the water vapo-rization is mainly responsible for the primary bubble formation when water is irradiated by a micrometic heat source. The subsequent bubble expansion is then caused by the diffusion of dissolved gases. This confirms that the bubble forma-tion and attachment, which characterize the disturbed regime, are strongly in-itiated by the electrolyte boiling.
The defined temperatures TR,max in the regime III (108˚C and 125˚C) are higher than the given boiling temperature of 104˚C under 1 atm. When consi-dering the Nukiyama boiling curve it can be stated that these temperatures are related to the nucleate boiling. For aqueous solutions, this boiling regime ex-tends from 5 K to about 30 K above the saturation temperature (here 104˚C) and is characterized by an enhanced bubble formation and an increasing heat flux [20]. Thus, taking the boiling temperature of the electrolyte as the upper limit guaranties a disturbance-free removal.
With a further increase of laser power in the removal regime III it can be seen that the upper limit temperature TR,max achieve its maximum at 137˚C ± 5˚C. With respect to the boiling regime, this temperature range fits well to the transi-tion boiling, in which the rate of bubble formation exceeds the rate of bubble detachment at the heated surface. Within this boiling regime a combined unsta-ble vapor film with partial-nucleate boiling can be formed [20]. This leads to a decreased contact between the heated surface and the liquid solution and pro-vides the evidence of the shielding model [9] that described the effect of an at-tached gas bubble on the quality of laser chemical machining of metals.
However, it has to be noticed that the presented model considers only con-stant heat transfer coefficient and does not reflect the temperature dependent heat flux within the different boiling regimes.
5.2. Correlation between Surface Temperatures and Material Removal
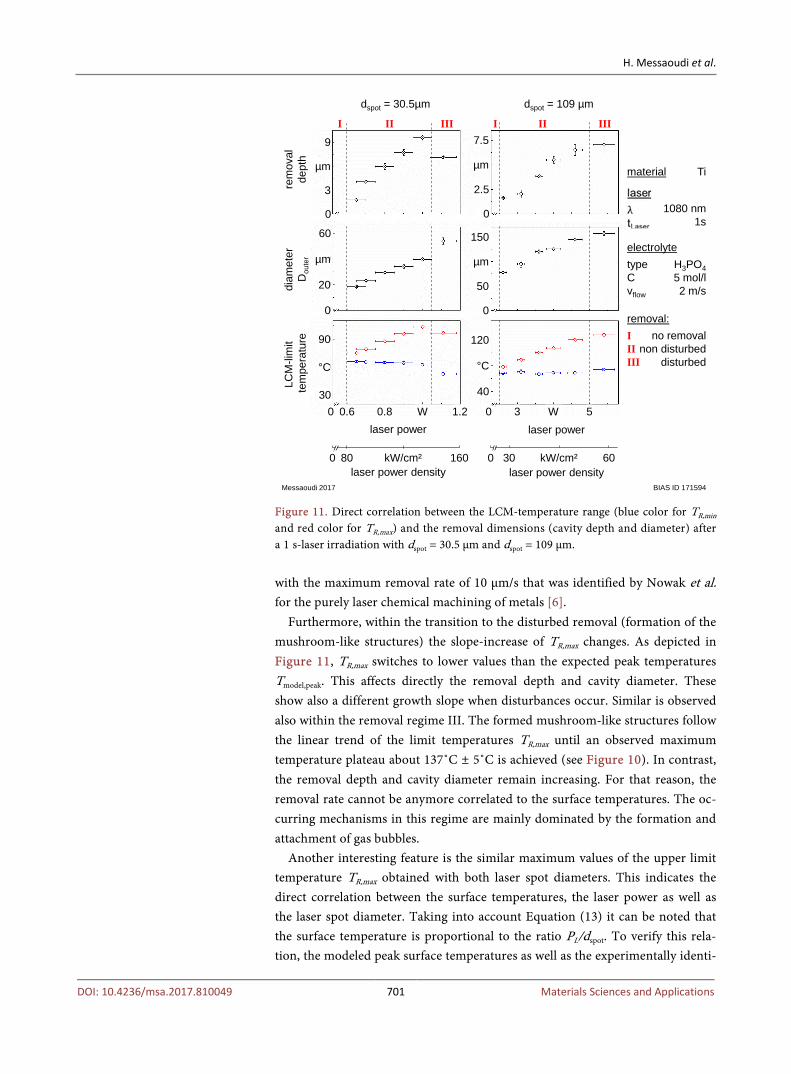
In Figure 11, the direct correlation between the defined limit temperatures and the removal characteristics (depth and diameter Douter) is illustrated. Within the disturbance-free removal (regime II) a linear dependence on the applied laser powers is observed. As the upper limit temperature TR,max and thereby the tem-perature range increases, the removal depth as well as the cavity diameter follow this trend and grow linearly. The observed maximum removal depths amount between 8 µm and 11 µm with both laser spot diameters. This is in accordance
H. Messaoudi et al.
DOI: 10.4236/msa.2017.810049 701 Materials Sciences and Applications
Figure 11. Direct correlation between the LCM-temperature range (blue color for TR,min and red color for TR,max) and the removal dimensions (cavity depth and diameter) after a 1 s-laser irradiation with dspot = 30.5 µm and dspot = 109 µm. with the maximum removal rate of 10 µm/s that was identified by Nowak et al. for the purely laser chemical machining of metals [6].
Furthermore, within the transition to the disturbed removal (formation of the mushroom-like structures) the slope-increase of TR,max changes. As depicted in Figure 11, TR,max switches to lower values than the expected peak temperatures Tmodel,peak. This affects directly the removal depth and cavity diameter. These show also a different growth slope when disturbances occur. Similar is observed also within the removal regime III. The formed mushroom-like structures follow the linear trend of the limit temperatures TR,max until an observed maximum temperature plateau about 137˚C ± 5˚C is achieved (see Figure 10). In contrast, the removal depth and cavity diameter remain increasing. For that reason, the removal rate cannot be anymore correlated to the surface temperatures. The oc-curring mechanisms in this regime are mainly dominated by the formation and attachment of gas bubbles.
Another interesting feature is the similar maximum values of the upper limit temperature TR,max obtained with both laser spot diameters. This indicates the direct correlation between the surface temperatures, the laser power as well as the laser spot diameter. Taking into account Equation (13) it can be noted that the surface temperature is proportional to the ratio PL/dspot. To verify this rela-tion, the modeled peak surface temperatures as well as the experimentally identi-
LCM
-lim
it te
mpe
ratu
rere
mov
alde
pth
diam
eter
Dou
ter
1.20.80.6 W 30
90
°C
0
20
60
µm
0
3
9
µm
0
53 W
40
120
°C
0
50
150
µm
0
2.5
7.5
µm
0
0 80 kW/cm² 160laser power density
laser power
0 30 kW/cm² 60laser power density
laser power
BIAS ID 171594Messaoudi 2017
1080 nm1s
electrolytetypeCvflow
H3PO45 mol/l2 m/s
material Ti
no removalnon disturbed
disturbed
removal:IIIIII
dspot = 30.5µm dspot = 109 µm
IIIIII IIIIII
H. Messaoudi et al.
DOI: 10.4236/msa.2017.810049 702 Materials Sciences and Applications
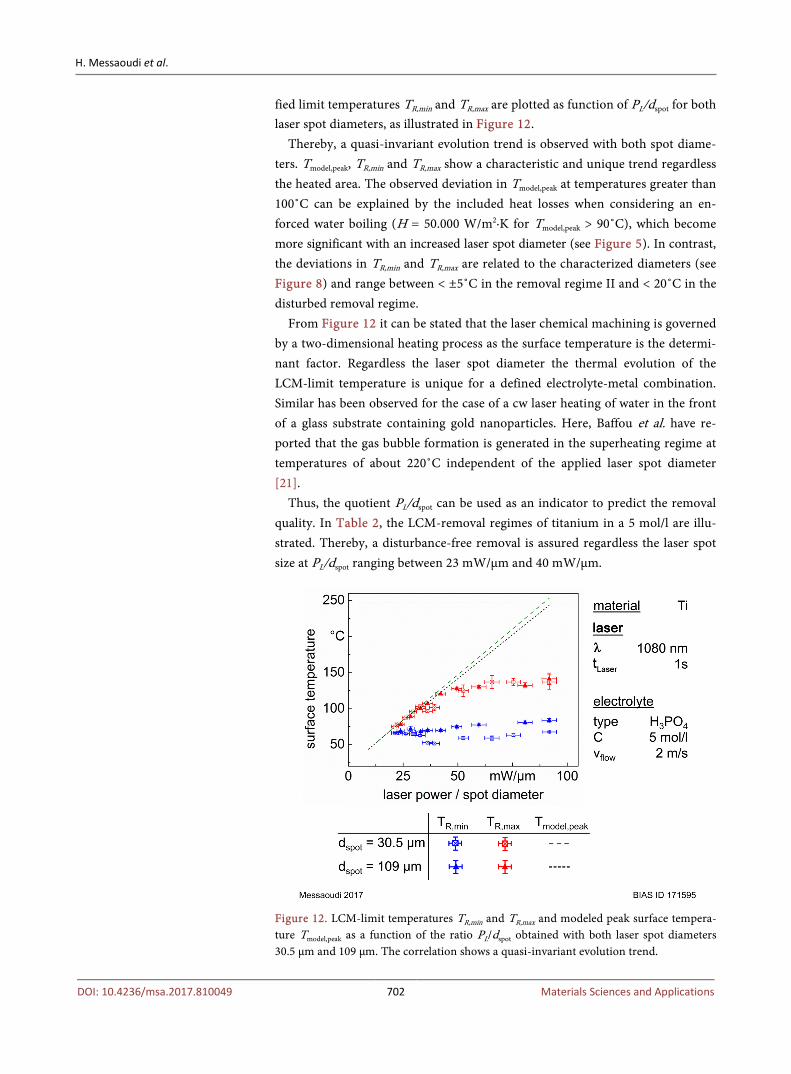
fied limit temperatures TR,min and TR,max are plotted as function of PL/dspot for both laser spot diameters, as illustrated in Figure 12.
Thereby, a quasi-invariant evolution trend is observed with both spot diame-ters. Tmodel,peak, TR,min and TR,max show a characteristic and unique trend regardless the heated area. The observed deviation in Tmodel,peak at temperatures greater than 100˚C can be explained by the included heat losses when considering an en-forced water boiling (H = 50.000 W/m2·K for Tmodel,peak > 90˚C), which become more significant with an increased laser spot diameter (see Figure 5). In contrast, the deviations in TR,min and TR,max are related to the characterized diameters (see Figure 8) and range between < ±5˚C in the removal regime II and < 20˚C in the disturbed removal regime.
From Figure 12 it can be stated that the laser chemical machining is governed by a two-dimensional heating process as the surface temperature is the determi-nant factor. Regardless the laser spot diameter the thermal evolution of the LCM-limit temperature is unique for a defined electrolyte-metal combination. Similar has been observed for the case of a cw laser heating of water in the front of a glass substrate containing gold nanoparticles. Here, Baffou et al. have re-ported that the gas bubble formation is generated in the superheating regime at temperatures of about 220˚C independent of the applied laser spot diameter [21].
Thus, the quotient PL/dspot can be used as an indicator to predict the removal quality. In Table 2, the LCM-removal regimes of titanium in a 5 mol/l are illu-strated. Thereby, a disturbance-free removal is assured regardless the laser spot size at PL/dspot ranging between 23 mW/µm and 40 mW/µm.
Figure 12. LCM-limit temperatures TR,min and TR,max and modeled peak surface tempera-ture Tmodel,peak as a function of the ratio PL/dspot obtained with both laser spot diameters 30.5 µm and 109 µm. The correlation shows a quasi-invariant evolution trend.
H. Messaoudi et al.
DOI: 10.4236/msa.2017.810049 703 Materials Sciences and Applications
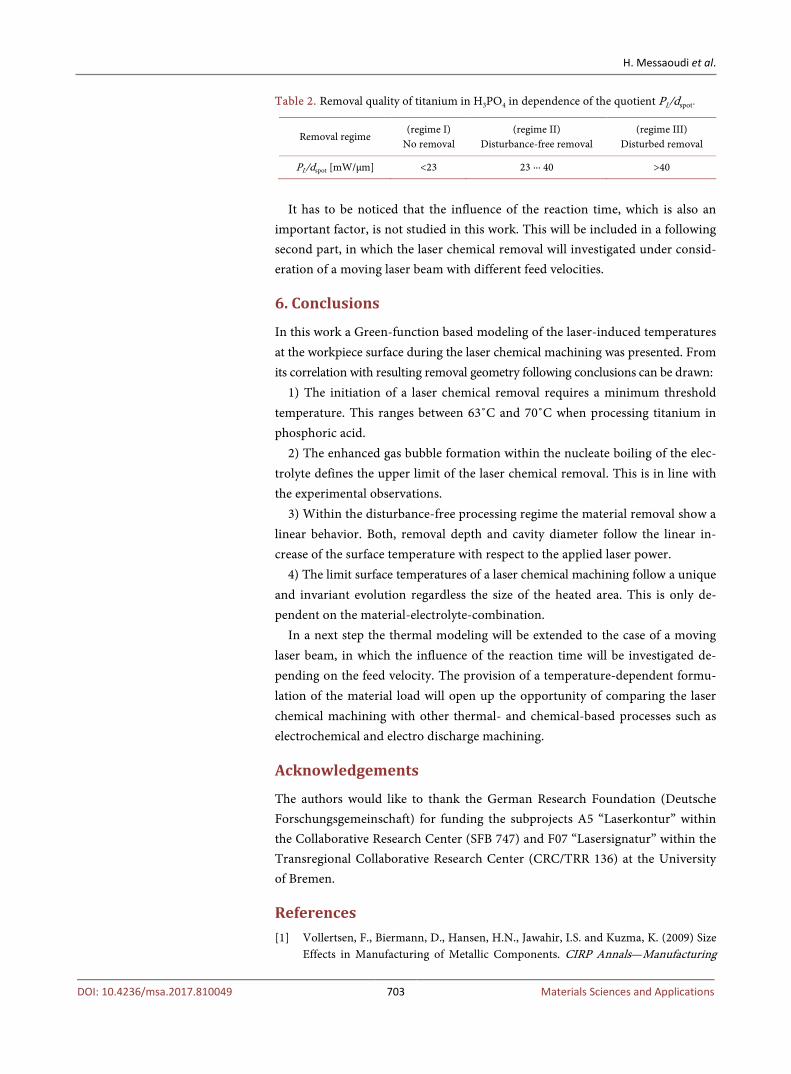
Table 2. Removal quality of titanium in H3PO4 in dependence of the quotient PL/dspot.
Removal regime (regime I)
No removal (regime II)
Disturbance-free removal (regime III)
Disturbed removal
PL/dspot [mW/µm] <23 23 ∙∙∙ 40 >40
It has to be noticed that the influence of the reaction time, which is also an
important factor, is not studied in this work. This will be included in a following second part, in which the laser chemical removal will investigated under consid-eration of a moving laser beam with different feed velocities.
6. Conclusions
In this work a Green-function based modeling of the laser-induced temperatures at the workpiece surface during the laser chemical machining was presented. From its correlation with resulting removal geometry following conclusions can be drawn:
1) The initiation of a laser chemical removal requires a minimum threshold temperature. This ranges between 63˚C and 70˚C when processing titanium in phosphoric acid.
2) The enhanced gas bubble formation within the nucleate boiling of the elec-trolyte defines the upper limit of the laser chemical removal. This is in line with the experimental observations.
3) Within the disturbance-free processing regime the material removal show a linear behavior. Both, removal depth and cavity diameter follow the linear in-crease of the surface temperature with respect to the applied laser power.
4) The limit surface temperatures of a laser chemical machining follow a unique and invariant evolution regardless the size of the heated area. This is only de-pendent on the material-electrolyte-combination.
In a next step the thermal modeling will be extended to the case of a moving laser beam, in which the influence of the reaction time will be investigated de-pending on the feed velocity. The provision of a temperature-dependent formu-lation of the material load will open up the opportunity of comparing the laser chemical machining with other thermal- and chemical-based processes such as electrochemical and electro discharge machining.
Acknowledgements
The authors would like to thank the German Research Foundation (Deutsche Forschungsgemeinschaft) for funding the subprojects A5 “Laserkontur” within the Collaborative Research Center (SFB 747) and F07 “Lasersignatur” within the Transregional Collaborative Research Center (CRC/TRR 136) at the University of Bremen.
References [1] Vollertsen, F., Biermann, D., Hansen, H.N., Jawahir, I.S. and Kuzma, K. (2009) Size
Effects in Manufacturing of Metallic Components. CIRP Annals—Manufacturing
H. Messaoudi et al.
DOI: 10.4236/msa.2017.810049 704 Materials Sciences and Applications
Technology, 58, 566-587.
[2] Hsu, T.-R. (2002) Miniaturisation—A Paradigm Shift in Advanced Manufacturing and Education. IEEE/ASME International Conference on Advanced Manufacturing Technologies and Education in the 21st Century, Chia-Yi, 10-15 August 2002, 1-19.
[3] Stephen, A. and Vollertsen, F. (2010) Mechanisms and Processing Limits in Laser Thermochemical Machining. Annals of the CIRP, 59, 251-254.
[4] Stephen, A., Lilienkamp, T., Metev, S. and Sepold, G. (1999) Laser-Assisted Micro-machining of Large-Area 3DMetallic Microparts. In: McKeown, P. and Corbett, J., Eds., Proceedings of the 1st International Conference of the European Society for Precision Engineering and Nanotechnology, Shaker Verlag, Aachen, 20-23.
[5] De Silva, A.K.M., Pajak, P.T., McGeough, J.A. and Harrison, D.K. (2011) Thermal Effects in Laser Assisted Jet Electrochemical Machining. CIRP An-nals—Manufacturing Technology, 60, 243-246.
[6] Bäuerle, D. (2011) Laser Processing and Chemistry. 2nd Edition, Springer Verlag, Berlin Heidelberg. https://doi.org/10.1007/978-3-642-17613-5
[7] Nowak, R. and Metev, S. (1996) Thermochemical Laser Etching of Stainless Steel and Titanium in Liquids. Applied Physics A, 63, 133-138. https://doi.org/10.1007/BF01567640
[8] Weikert, M., Fohl, C., Dausinger, F. and Abeln, T. (2003) Surface Structuring of Metals with Short and Ultra Short Laser Pulses. SPIE, 5063, 208-213.
[9] Mehrafsun, S. and Vollertsen, F. (2013) Disturbance of Material Removal in La-ser-Chemical Machining Bye Merging Gas. Annals of the CIRP, 62, 195-198.
[10] Mehrafsun, S., Messaoudi, H. and Vollertsen, F. (2016) Influence of Material and Surface Roughness on Gas Bubble Formation and Adhesion in Laser-Chemical Machining. Proceedings of the 5th International Conference on Nanomanufactur-ing, Macau.
[11] Butt, H.-J., Graf, K. and Kappel, M. (2003) Physics and Chemistry of Interfaces. Wiley-VCH, Weinheim.
[12] Yavas, O., Oltra, R. and Kerrec, O. (1994) Enhancement of Pulsed Laser Removal of Metal Oxides by Electrochemical Control. Applied Physics A, 63, 321-326. https://doi.org/10.1007/BF01567320
[13] Grigoropoulos, C.P. (2009) Transport in Laser Microfabrication. Cambridge Uni-versity Press, Cambridge. https://doi.org/10.1017/CBO9780511596674
[14] Carslaw, H.S. and Jaeger, J.C. (1959) Conduction of Heat in Solids. 2nd Edition, Oxford University Press, New York.
[15] Yung, E.K., Hussey, B.W., Gupta, A. and Romankiw, L.T. (1989) Laser Assisted Etch-ing of Manganese-Zinc-Ferrite. Journal of Electrochemical Society, 136, 665-673. https://doi.org/10.1149/1.2096707
[16] Ren, C. and MacKenzie, A.R. (2007) Closed-Form Approximations to the Error and Complementary Error Functions and Their Applications in Atmospheric Science. Atmospheric Science Letters, 8, 70-73. https://doi.org/10.1002/asl.154
[17] Eckert, S., Messaoudi, H., Mehrafsun, S. and Vollersten, F. (2017) Laser-Thermo-Chemical Induced Micro-Structures on Titanium. Journal of Materials Science and Surface Engineering.
[18] Whitelaw, J.H. (2011) Convective Heat Transfer, Thermopedia: Guide to Thermo-dynamics, Heat & Mass Transfer, and Fluids Engineering. https://doi.org/10.1615/AtoZ.c.convective_heat_transfer
H. Messaoudi et al.
DOI: 10.4236/msa.2017.810049 705 Materials Sciences and Applications
[19] Deguchi, S., Takahashi, S., Hiraki, H. and Tanimura, S. (2013) Direct Measurement of Force Exerted during Single Bubble Generation. Applied Physics Letters, 102, Article ID: 084101. https://doi.org/10.1063/1.4793532
[20] Faghri, A., Zhang, Y. and Howell, J.R. (2010) Advanced Heat and Mass Transfer. Global Digital Press, Columbia, 665-734.
[21] Baffou, G., Polleux, J., Rigneault, H. and Monneret, S. (2014) Super-Heating and Micro-Bubble Generation around Plasmonic Nanoparticles under CW Illumina-tion. The Journal of Physical Chemistry C, 118, 4890-4898. https://doi.org/10.1021/jp411519k
H. Messaoudi et al.
DOI: 10.4236/msa.2017.810049 706 Materials Sciences and Applications
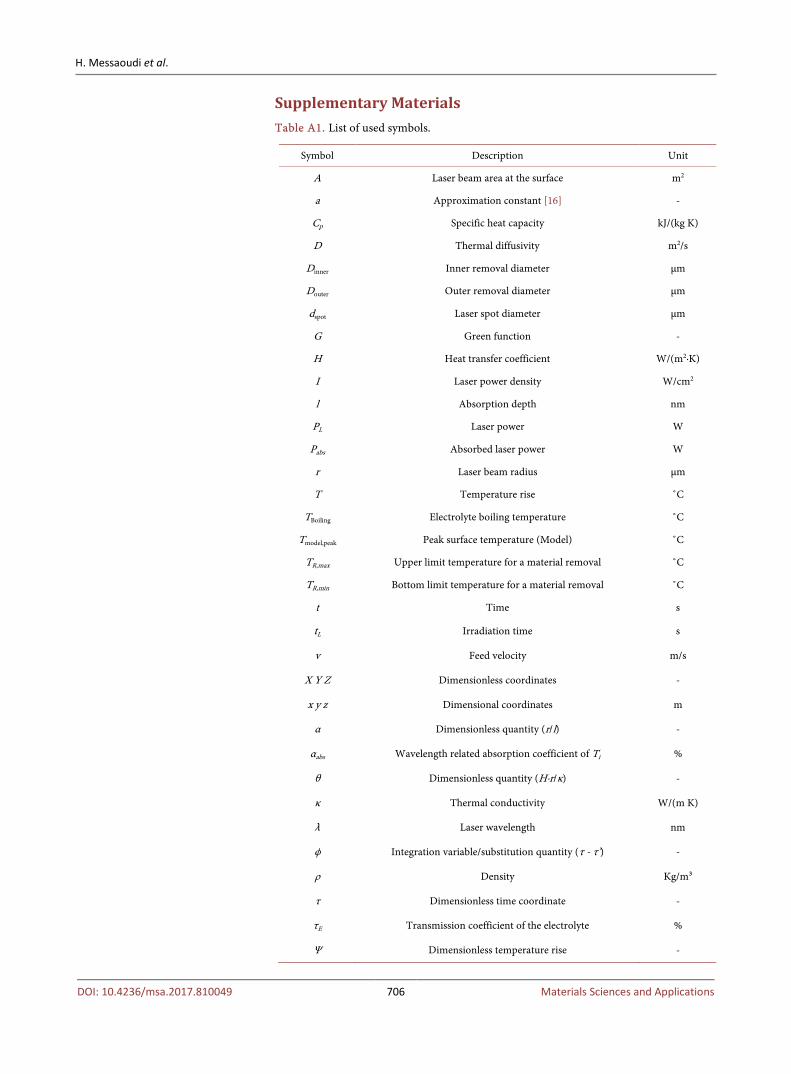
Supplementary Materials
Table A1. List of used symbols.
Symbol Description Unit
A Laser beam area at the surface m2
a Approximation constant [16] -
Cp Specific heat capacity kJ/(kg K)
D Thermal diffusivity m2/s
Dinner Inner removal diameter µm
Douter Outer removal diameter µm
dspot Laser spot diameter µm
G Green function -
H Heat transfer coefficient W/(m2∙K)
I Laser power density W/cm2
l Absorption depth nm
PL Laser power W
Pabs Absorbed laser power W
r Laser beam radius µm
T Temperature rise ˚C
TBoiling Electrolyte boiling temperature ˚C
Tmodel,peak Peak surface temperature (Model) ˚C
TR,max Upper limit temperature for a material removal ˚C
TR,min Bottom limit temperature for a material removal ˚C
t Time s
tL Irradiation time s
v Feed velocity m/s
X Y Z Dimensionless coordinates -
x y z Dimensional coordinates m
α Dimensionless quantity (r/l) -
αabs Wavelength related absorption coefficient of Ti %
θ Dimensionless quantity (H·r/κ) -
κ Thermal conductivity W/(m K)
λ Laser wavelength nm
ϕ Integration variable/substitution quantity (τ - τ’) -
ρ Density Kg/m³
τ Dimensionless time coordinate -
τE Transmission coefficient of the electrolyte %
Ψ Dimensionless temperature rise -
H. Messaoudi et al.
DOI: 10.4236/msa.2017.810049 707 Materials Sciences and Applications
Figure A1. Microscopic images of the removal spots and their height profiles in depen-dence of the applied laser power after a 1 s-irradiation with a 109 µm laser spot.
Submit or recommend next manuscript to SCIRP and we will provide best service for you:
Accepting pre-submission inquiries through Email, Facebook, LinkedIn, Twitter, etc. A wide selection of journals (inclusive of 9 subjects, more than 200 journals) Providing 24-hour high-quality service User-friendly online submission system Fair and swift peer-review system Efficient typesetting and proofreading procedure Display of the result of downloads and visits, as well as the number of cited articles Maximum dissemination of your research work
Submit your manuscript at: http://papersubmission.scirp.org/ Or contact [email protected]