Embed Size (px)
Citation preview

The Rise of China and the Natural Resource
Curse in Africa
Erik Meyersson∗
Stockholm University
Gerard Padró i Miquel†
LSE, NBER, BREAD
Nancy Qian‡
Brown University, Harvard Academy, CEPR
April 7, 2008
Abstract
This paper studies the causal impact of China’s rising demand for natural resources
(NR) on Sub-Saharan African political and economic development. We separately instru-
ment for NR exports to China, to the World, to the U.S. and India with the interaction
terms of a African country’s NR endowment and the demand for those resources for
the respective buyers. We find that exporting NR to China is unique in having large
positive effects on economic growth and investment, but is not alone in it’s detrimen-
tal effects on human rights. Exporting to the U.S. also has similar negative effects on
human rights outcomes, whereas exporting to India improves human rights. Exporting
NR overall has no effect on economic growth but has potentially negative effects on po-
litical institutions. Our results suggest that the commonly cited natural resource curse
embodies heterogenous effects of exporting NR. We provide strong novel evidence that
the characteristics of the trading partner matter.
∗[email protected]†[email protected]‡[email protected]
1

1 Introduction
From South Africa’s manganese mines to Niger’s uranium pits, from Sudan’s oil
fields to Congo’s cobalt mines, China’s hunger for resources has been a shot in the
arm, increasing revenues and helping push some of the world’s poorest countries
further up the ladder of development...“Let the Chinese come," said Mahamat
Hassan Abakar, a lawyer in Chad, a former French colony in central Africa with
deepening ties to China. “What Africa needs is investment. It needs partners. All
of these years we have been tied to France. Look what it has brought us.”
- New York Times "NEW POWER IN AFRICA: China’s Trade in Africa Car-
ries a Price Tag" August 21, 2007
In the mid 1980s, only six African countries were trading with China. Figure 1 shows that
by 2006, that number had risen to 35. Africa’s total trade with China increased from USD 1
billion in 1986 to USD 50 billion in 2006, and the bulk of African exports to China are the
Natural Resources (NR) needed to fuel Chinese economic growth.1 Figure 2 shows the rapid
increase of NR exports to China both as a fraction of total trade with China (total exports +
imports) and as a fraction of total NR exports to the world at large. These dramatic changes
might have important effects because China’s approach to Africa has been sharply different
from that of the West.2 A strict interpretation of the principle of sovereignty has allowed close
contact, investment and official development aid to regimes with dubious political, economic
and human rights records. Such dealings have generated accusations against China that have
ranged from abetting genocidal regimes to proclamations that she wants to create a “League
of Dictators” to act as a buffer against Western influence in the developing world.3
One of the most cited examples is Sudan. In the early 90s, Western oil firms scaled
back their operations due to human rights concerns and civil conflict in Southern Sudan. In
contrast, China started heavily investing in oil extraction in Sudan in 1996. By 2006, Sudan
supplied 10% of China’s oil imports. Today, the largest foreign supplier of petroleum is
Angola, which accounts for 15% of China’s total oil imports. In 2004, to combat widespread
1Value reported in CPI deflated constant USD.2As quoted in Alden (2007), Chinese diplomats have emphasized that “Non-intervention is our brand, like
intervention is the Americans’ brand.”3See accusations in Amnesty International (2006). See Kagan (2006) and Brookes and Shin (2006).
2

corruption in Angola, the IMF pressed to include transparency measures as conditions for new
loans intended for reconstruction after years of civil war. To the surprise of many observers,
the Angolese withdrew from the negotiations and instead accepted a USD 2 billion loan from
China that was tied to the supply of oil and construction contracts. The published rates were
indeed very favorable to Angola. However, it is likely that the absence of any conditionalities
was also extremely palatable.4
Critics accuse China of not using her growing economic clout to force change unto her
trading partners.5 But it is by no means clear either theoretically or empirically that external
force from a foreign power is an effective way to cause political changes.6 Nor is it obvious
that potential economic growth caused by trading with China (when no one else is willing to
trade) will not have an independent effect in improving domestic African institutions. Given
the extensive news coverage this topic has received, there are surprisingly no systematic studies
yet evaluating the effect of trading with China on political outcomes in African countries.7
This study attempts to fill this gap by using a novel empirical strategy to estimate the causal
effect of exporting natural resources to China. The outcomes examined range from economic
growth to political institutions and human rights violations. We also compare these effects
with those of exporting natural resources to democracies such as the U.S. and India, and the
world at large.
The principal contribution of this paper is to estimate the causal effect of exporting nat-
ural resources to China on sub-Saharan African outcomes. The main empirical difficulty in
interpreting a cross country comparison of outcomes between countries that export to China
and those that do not is that bad countries may choose to deal with China over other coun-
tries that pressure them. Controlling for country fixed effects will not be able to address this
4For more details, see Taylor (2006) and Alden (2005, 2007).5For instance, acclaimed American movie director and producer Steven Spielberg resigned his position as
an artistic director for the Beijing Olympics arguing that China should do more to prevent attrocities in theSudanese region of Darfur. See http://news.bbc.co.uk/2/hi/africa/7261453.stm
6On the one hand, many have argued that the end of the Cold War allowed the West to force a wave ofdemocratization in the early 90s (this argument is described in Bratton and van de Walle, 1997). And thatthe de facto roll back of those reforms is timed with the rise of NR exports to China. This is consistent withJensen and Wantchekon’s (2004) finding that democratic consolidation only ocurred in NR poor countries. Onthe other hand, it is not clear that previous attempts at proactive foreign pressure have been highly successful,as the cases of Cuba or Zimbabwe show.
7There are a number of descriptive studies on the growing economic relationships. See Broadman 2007,Deutsche Bank 2006 and Goldstein et al 2006.
3

problem if regimes change over time within countries, such that when a regime becomes bad,
it switches to trading with China. This switch may reflect the decision of the African regime,
or a choice on the part of buyers. For example, Taylor (2006) finds that China systematically
approached countries where the presence of Western companies is weak. As China’s demand
for a commodity grows, countries who have that commodity will increase their exports to
China more than countries which do not, and this increase will be orthogonal to the institu-
tional, economic or historic circumstances of the country. Using a similar logic, we instrument
for natural exports to the U.S., India and World at large with the interactions terms of the
existence of a commodity in the African country and the demand for each commodity from
those places.
Using data compiled from several existing data sources, we find the following results. First,
controlling for the total amount of NR exports, diverting NR trade to China increases economic
growth. A 1% increase in exports to China increases one year GDP growth by 0.2% and three-
year growth by 0.7%. Exporting NR to China also increases capital formation, investment in
value added industries, and decreases labor force participation. This suggests that the increase
in GDP is partly driven by increased investment in capital intensive extractive industries. If
China were to completely stop buying NR from Sub-Saharan African countries, on average,
one-year GDP growth rates would decrease by 23%, capital formation would decrease by 66%,
the value of value added industries would decrease by 21% in levels and by 56% as a fraction
of GDP and labor force participation would increase by 9.6%. Second, we find no evidence
that diverting NR exports to China causes a slide towards autocracy as measured by Polity IV
or Freedom House. Third, exporting NR to China worsens internal conflict and has adverse
effects on human rights. To investigate whether these effects are generic effects from trading
with a rich and politically powerful country or a fast growing economy, we compare the effects
to the effects of exporting NR to the U.S. and exporting to India, respectively. We find
that the positive effects on economic growth are unique to exporting to China. Surprisingly,
the negative effects on human rights are similar for exporting to China and to the U.S. For
exporting NR to the world at large, we found no evidence of negative effects on economic
outcomes but we find evidence of adverse effects on institutional development.
Our findings add to several branches of the political economy and trade literature. First,
this study provides novel evidence that the political characteristics of the trading partner
4

matters for political outcomes. Our estimates suggest that keeping total country production
and world prices constant, it makes a difference whether a country exports a barrel of oil to
China or to the rest of the world. More generally, strategic objectives, political and otherwise
may shape the effects of such trade on political and economic outcomes. These incentives and
consequences are typically absent from models of trade and international political economy.8
Second, we build on the existing studies of the natural resource "curse", which began with
cross country evidence from Sachs and Warner (1995, 2001).9 Due to potential long-standing
differences across countries, it is difficult to derive causal implications from this literature.
Our empirical strategy allows us to provide convincing evidence that exporting NR has no
negative effects on either economic growth or the development of manufacturing, although it
may increase the level of autocracy of the ruling regime. These improvements, however, come
with a drawback: because we are interested in the effect of the rise of China, we look at annual
data starting in 1990. As a consequence, we can only identify the short-term effects of an
increase in the value of NR on economic and political outcomes.10 Furthermore, the differential
effects of exporting to China suggests that aggregate consequences of NR specialization may
hide heterogeneous experiences that depend on the characteristics of the trade partner.
8There is a small related literature. Levchenko (2005), for instance, discusses the possibility that differentinstitutions might act as sources of comparative advantage, thus shaping trade patterns. He does not consider,however, how institutions might change as a result of trade patterns. Antràs and Padró i Miquel (2008) proposea simple model of international influence where political ties might be generated by economic ties.
9The basic approach in this literature is to regress long term growth (typically over two decades or more)on the percentage of NR in a country’s exports or GDP at the beginning of the period for a cross-sectionof countries. The finding that NR intensity is negatively correlated with long-term growth performance isrobust to the introduction of many controls such as geographical variables. Any causal inference is, however,impaired by the fact that NR intensity is hardly exogenous as it depends on the size of the economy andpast investment. Moreover, the effect of NR on other determinants of long term growth, such as institutions,complicates the picture even more. Mehlum, Moene and Torvik (2005), show that NR are actually a blessingfor countries with strong institutions. Furthermore, Sala-i-Martin and Subramanian (2005) show that NRdirectly impact institutional quality, showcasing the example of Nigeria. For a literature review of the hugeNatural Resource Curse literature, see Van der Ploeg (2007). These findings echo a line of research in PoliticalScience that has also found in a cross-country setting that oil and mineral wealth reduces the prospects fordemocracy (see Ross, 2001 and Jensen and Wantchekon, 2004).10Because we are interested in the effect of the rise of China, we look at annual data starting in 1990. As
a consequence, we only identify the short-term effects of an increase in the value of NR on economic andpolitical outcomes. Angus and Deaton (1995) and Raddatz (2007), using different techniques as ours, foundthat an increase in the price of commodities has a positive effect on the countries that produce them. This,of course, is not necessarily surprising, but it seems to stand in contradiction to the Natural Resource Curseliterature. In a recent paper, Collier and Goderis (2007) reconcile the short term positive effects with the longterm disappointing growth performance using panel co-integration techniques.
5

The rest of the paper is organized as follows. The next section presents the empirical
strategy. Section 3 describes the data. Section 4 discusses the results. Section 5 interprets
the results. And Section 6 offers concluding remarks.
2 Empirical Strategy
The existing literature on the natural resource curse examines cross country correlations.11
Applied to our study, this simple specification would examine the cross country relationship
between outcomes and exporting NR to China. Because countries that export more NR to
China are also more likely to export NR to the world at large, we will control for the latter so
as to not confound the two effects. This has the important advantage that the estimates for
the effect of exporting to China will not be confounded with any rise in prices that China may
induce with her impact on global demand for NR. That effect is captured by the coefficient
on the value of total NR exports. The main problem in interpreting this correlation is that
countries with certain characteristics (bad economic development policies) may invest more
intensively in NR sectors. In this case, a negative correlation between NR export to China
(or the world at large) and outcomes such as economic growth will reflect the effect of those
policies as well as any causal effect of NR exports. Including country fixed effects with a panel
of countries will mitigate this problem to the extent that these characteristics do not change
over time.
Yit = βLog(NR_ChinaExpit) + δLog(NR_WorldExpit) (1)
+ηLog(GDPpcit−1) + ρi + γt + εit
The equation above regresses outcome Yit for country i and year t on: the logarithm of
the value of NR exports to China from country i in year t as measured in constant U.S.
Dollars (USD), NR_ChinaExpit; the logarithm of the value of NR exports to the world from
country i in year t as measured in constant (USD), NR_WorldExpit; the logarithm of GDP
per capita for country i in year t − 1, GDPpcit−1; country fixed effects, ρi; and year fixed
11For a literature review, see Van der Ploeg (2007).
6
effects, γt. All standard errors are clustered at the country level. Note that we look at the
value of NR exports and we do not scale it by the size of the economy or total exports as
the literature normally does. This avoids the introduction mechanical relationships. Instead,
we introduce past GDP per capita as it can have a direct effect on growth and maybe also
on institutions, according to modernization theories. We also estimated a separate equation
controlling for total trade with the world and total trade with China and the results for β and
δ were unchanged.12
Interpreting the coefficients of this equation as causal becomes problematic in the case of
time-varying changes. For example, if bad regimes choose to trade with China or are more
likely to export NR to the world at large when they come into power, the FE strategy will once
again be confounded with underlying characteristics of the countries. For example, the FE
strategy will underestimate the positive effects of exporting to China on economic outcomes
if worsening regimes choose to export more to China and have police which cause worsening
economic outcomes. To address this problem, we exploit the plausibly exogenous variation in
NR exports to China caused by each country’s endowment of commodities and China’s rising
annual demand for each commodities. The reduced form estimate is conceptually similar to a
differences-in-differences estimate where we compare outcomes for countries with and without
a NR that China wants, before and after China wants it. Figure 3 shows the increase in NR
exports to China from Africa over time. It also shows that this increase closely follows the
increase in China’s GDP. Figure 4 plots Chinese consumption of each commodity over time.
It shows that consumption is increasing for all commodities and that there is substantial
variation in the amount of consumption across commodities.
The instruments will be the interaction terms of the existence of each endowment in a
given African country with China’s GDP, which we use to proxy for her NR demands.13
Using Chinese GDP as a proxy for demand has the benefit that while it arguably drives the
demand for NR, it is also more likely to be exogenous to other factors such as world prices of
commodities.14 However, it has the drawback that because Chinese growth is approximately
12These estimates are not reported in the paper but are available upon request.13Chinese GDP growth arguably is the main driving factor of her increasing demand for NR (Alden, 2005,
2007; Taylor, 2006).14We also use the total value of China’s NR consumption each year as an alternative proxy. The results are
not very different and are not reported in the paper.
7
linear during the period of interest (1991-2005), we will not be able to control for country-level
linear time trends. We proxy for the endowment of each NR x with a dummy variable for ever
having produced x during 1990-2006.15 This crude measure has the advantage of being more
plausibly exogenous than, say, the amount extracted each year, which would be affected by
past investment decisions that could be correlated with regime quality and other determinants
of trade decisions. Ideally, we would like to use a measure of the quantity of each NR in the
ground, but such measures are only available for oil. Since we are interested in exploiting
trade in many other minerals heavily imported by China, we settle for this measure. We will
use a similar strategy to instrument for NR exports to the world at large (and also to the U.S.
and India). The first stage equations are the following.
Log(NR_ChinaExpit) = θC(Xi × LChinaGDPt) + φC(Xi × LWorldGDPt) +
+ηCLog(GDPpcit−1) + ρCi + γCt + εit (2)
Log(NR_WorldExpit) = θW (Xi × LChinaGDPt) + φW (Xi × LWorldGDPt) +
+ηWLog(GDPpcit−1) + ρWi + γWt + it (3)
Xi is the endowment vector. Each component, x1i..xni, equals 1 if country i produced
any quantity of resource n at any point between 1990 and 2006. We regress the log of the
value of NR exports to China (or the World) for country i in year t on: the interaction of the
endowment vector and the logarithm of Chinese GDP (measured in 1996 USD), LChinaGDPt;
the interaction of the endowment vector and the logarithm of World GDP, LWorldGDPt; the
logarithm of GDP per capita for country i in year t − 1, GDPpcit−1; country fixed effects,
ρi; and year fixed effects, γt. All standard errors are clustered at the country level. θC is
a vector of θC1 ..θCn , and φ
C is a vector of φC1 ..φCn . Each of these components measures the
correlation between the corresponding instrument and Log(NR_ChinaExpit). θW and φW
have the same structure and equivalent interpretation.
To understand the identification, imagine that there are two time periods and two NRs,
15We used an alternative proxies of the average amount of NR x produced during 1990-2006 as well theamount of NR x produced in each year. These alternative proxies produced similar results because thecountries in our sample typically produce the maximum amount of each resource that they are endowed witheach year. The results for the alternative proxies are not reported in the paper.
8

oil and lead. If possessing oil is correlated with bad outcomes, then this effect is differenced
out by the presence of country FE. If there are secular changes over time in African political
and economic development, then the cross sectional comparison between oil rich countries and
lead rich countries will control for this. Identification relies on the assumption that there was
no resource-specific secular trend beyond that induced by World GDP. If, for example, during
the period of China’s rapid economic growth and increase in NR demand, oil-rich countries
deteriorated economically and politically for reasons unrelated to exporting to oil to China
and the world, then the instrument would be invalid. In the absence of such process, the
instruments are valid and useful because they exclude any determinant of NR trade that is
related to political and economic institutions and past historical experience. We predict NR
trade based exclusively on the interaction of exogenous measures of supply and demand.
3 Data
This study uses data from several sources and matches the data at the year and country level.
Because China’s role in Africa is likely to be very different during the Cold War, we restrict
the sample to be post-Cold War. The matched data set contains data for 44 sub-Saharan
African countries over 17 years (1990-2006). There are three countries for which we do not
have enough data: Sao Tome & Principe, Djibouti and Somalia. In addition, we exclude
South Africa from the sample as it is the only country with a significant industrial base and
a very different political structure.16 The data for exports come from the United Nations
Conference on Trade and Development’s (UNCTAD) Commodity Trade Statistics Database
(COMTRADE). The exports variables are the aggregate value of 17 fuels and minerals.17
All measures used in this paper are in constant CPI-deflated USD. Figure 1 shows that as
time progresses, more African countries join exporting NR to China. Figure 2 shows that NR
exports to China have increased dramatically, also as a percentage of total trade.
The ideal data for endowment of a natural resource is data from geological surveys. Un-
16Table A1 shows that South Africa produces all commodities. Since we use dummy variables for whethera country ever produces a NR, we lose little variation by excluding South Africa. Hence, its exclusion doesnot dramatically alter the results.17The list is composed by the following items: Aluminium, Chromium, Cobalt, Coltan, Copper, Iron, Lead,
Manganese, Natural Gas, Nickel, Oil, Platinum, Tin, Titanium, Tungsten/Wolfram, Uranium and Zinc.
9

fortunately, reliable survey data only exists for oil. Hence, we proxy for the endowment each
resource with a dummy variable for whether that mineral was ever produced by the country
between 1990-2006. Appendix Table A1 shows average production by resource by country for
a random sample of African countries and commodities. It shows that using dummy variables
will produce considerable variation across countries.
Economic outcomes data are sourced from the World Development Indicators. GDP per
capita is reported in constant USD (market exchange rates). We calculate growth in GDP
per capita between year t and year n simply as LogGDPpcit+n − LogGDPpcit. Table 1A
shows the average per capita growth rates. Even taking into account the African growth
acceleration from 2000, the average growth rate is below 1% for the period. It also shows
that, on average, 27% of total GDP is comprised of value added industries. Industry, however,
might be a misleading category because it includes extractive industries. Past studies on the
natural resource curse have speculated that exporting NR may retard the development of
manufacturing sectors even if the overall effect on GDP is positive. This would be reflected
in a decrease in manufacturing as a share of total GDP, and not so much on value added
industries. Indeed, in our dataset Manufacturing value added amounts for only 11% of GDP.
To examine investment, we also use Gross Fixed Capital formation as a percentage of GDP.
Some observers have commented on the fact that China is using a mainly Chinese labor force
for its infrastructure projects in Africa. To find a possible crowding out effect, we examine road
construction and labor force participation. The length of paved road is measured in kilometers
and unfortunately this data only exists for a small number of observations. Finally, we also
want to investigate whether NR specialization affects the relative size of the government and
thus we added data on Government Expenditures as a % of GDP. We also include a health
expenditure index as a possible measure of government benevolence.
The data on political and human rights outcomes in Panel C comes from the Freedom
House dataset, the CIRI data set, the Political Risk Group and the Polity IV project. The
political rights and civil liberties indices from Freedom House range from 1 to 7, with 1
representing the highest and 7 the lowest level of freedom corresponds to a range of total
points. For example, in 2005, China, Zambia and the U.S. had political rights ratings of 7,
4 and 1, respectively; and had civil liberty ratings of 6, 4 and 1, respectively. A detailed
description of the construction of these indices is included in the Data Appendix. We take
10
the Polity 2 institutional index from the Polity IV database. This index measures the extent
to which institutions in a country resemble a stylized definition of a democracy. It ranges
from -10 (strongly autocratic) to +10 (strongly democratic). In 2005, China, Zambia and the
US had a score of -7, 5 and 10, respectively. Table 1 shows that the African average in our
sample is very close to 0. From the Political Risk Services Group database we use series on
Internal Conflict, Ethnic Tensions and Democratic Accountability. Democratic accountability
ranges from 0 (autocracy) to 6 (alternating democracy). Sample values for China, Zambia
and the US in 2005 are 1, 4.5 and 6, respectively. Internal conflict measures the presence
of political violence. 0 denotes a very violent environment, denotes 12 is maximum stability.
China, Zambia and the US where stable in 2005 with scores above 10. The average value for
Africa in our sample is 7.64, well below. Finally, Ethnic Tensions ranges from 0 (high level of
tensions) to 6 (peaceful relationships). 2005 values for China, Zambia and the US were 4.5, 4
and 5. Again, the average for Africa, 3.04, falls below these levels.
The Physical Integrity Rights Index reported by CIRI is an additive index constructed from
the Torture, Extra-judicial Killing, Political Imprisonment, and Disappearance indicators (see
Data Appendix for details). It ranges from 0 (no government respect for these four rights) to
8 (full government respect for these four rights). For example, in 2005, China, Zambia and
the U.S. had ratings of 1, 4 and 5. We also independently use the Torture index. Finally, we
also extract from CIRI an index of Women’s Economic Rights. Political Terror is an index of
human rights violations reported by the U.S. State Department. It ranges from 1 to 5. Level
1 is for countries under a secure rule of law, people are not imprisoned for their view, and
torture is rare and exceptional. Political murders are extremely rare. Level 5 include countries
where murders, disappearances, and torture are a common part of life for the whole population
and the leaders of these societies place no limits on the means or thoroughness with which
they pursue personal or ideological goals. In 2005, China and Zambia were reported to have
ratings of 4 and 3, respectively. We also collect equivalent data from Amnesty International.
The results using this data is not different. Hence, we do not report them in the paper. The
descriptive statistics reported in Table 1A are measured in levels (as the data is reported
originally). To better understand these indices for the African context, Table 1B presents the
values for Kenya and Sudan.
For the regression analysis, we transform the economic outcomes to logarithms in order to
11

estimate elasticities.
4 Empirical Results
4.1 OLS
Table 2 shows the OLS estimates for the correlations between exporting NR to China and
the world with a select set of outcomes. For each outcomes, we show the estimates of β̂ and
δ̂ from equation (1) with and without country fixed effects (Panels A and B, respectively).
The coefficients are elasticities between NR exports to China and the world and outcomes.
Column (2) show that exporting NR to China has a positive and statistically significant effects
on value added industries in both specifications, although the effect is smaller controlling for
fixed effects. The estimate shows that increasing NR exports to China by 1% is correlated
with a 0.01% increase in the value of valued added industries. For political and human rights
outcomes, the effect of exporting NR to China is systematically less adverse or better once
country fixed effects are controlled for. For example, columns (4), (5) and (6) show that the
effects of exporting to China on the Polity 2 index, political rights and civil liberties are greatly
reduced once FEs are included. The relationship with Torture in column (7) also becomes
zero with FEs either. This makes sense as in adding country fixed effects we are excluding
the selection effect according to which China is trading with countries that, on average, have
worse institutions. This is the argument often cited by critics, and our findings confirm this
correlation. The estimated effect on political terror is statistically significant and positive
(more terror) in both specifications. But the effect is much smaller in magnitude with FEs.
The estimates for exporting NR to the World exhibit similar changes between the two
specifications. Columns (1) and (3) shows that the cross country correlation used in the
existing literature on the natural resource curse will produce a statistically significant negative
relationship with GDP and a positive relationship with paved road length. However, with FE,
both correlations become zero. This is strong evidence that the commonly cited evidence for
the natural resource curse is largely driven by time-invariant differences between countries
that export NR and those that do not.
To check that our regression estimates are not driven by outliers, we plot the residuals and
12

regression line from the fixed effects estimates. As examples Figures 5A and 5B show these
figures for the outcomes of per capita GDP growth over 3 years, and manufacturing as a share
of GDP.
4.2 2SLS
Table 3 shows the first stage estimates. We have two endogenous variables, Log(NR_ChinaExpit)
and Log(NR_WorldExpit) and 17 instruments for each (see equations (2) and (3)). Columns
(1A) and (2B) display the estimates for θC from equation (2) and φW from equation (3). In
column (1A), the point estimates for θ̂C, the instruments for Log(NR_ChinaExpit), are sta-
tistically significant at the 5% level. The F-statistic for joint significance is 97.36. Hence,
weak instruments problems are unlikely. In column (2B), the point estimates for φW , the
instruments for Log(NR_WorldExpit), are only significant at the 5% level for three com-
modities. The F-statistic for joint significance is 4.21. We cannot rule out the possibility
of weak instruments in this case. These estimates may be biased towards OLS due to weak
instruments. We will there more not interpret the magnitude of the 2SLS estimates for φW .
Reduced form estimates of the effects of the instruments on the outcomes of interest are not
reported in the paper for the sake of brevity.
The 2SLS estimates are presented in Tables 4 and 5, in the B Panels. In each table, Panel
A shows the OLS estimates with fixed effects as a comparison. Table 4 shows the effects on
economic outcomes. Columns (1), (2) and (3) show that exporting NR to China increased
GDP growth. The estimates are statistically significant at the 10% level for one year and
three year growth. Columns (4), (5) and (6) show that the 2SLS estimates are also positive
and statistically significant for capital formation, value added industries and value added
industries as a fraction of GDP; and negative and significant for labor force participation.
This is consistent with the idea that exports to China are mostly extractive, capital intensive
industries which do not foster direct employment growth. We find no effect on manufacturing
industries. Interestingly, we find that exporting to China significantly increases government
consumption (column (5)) while having no effect on public health expenditures or the length
of paved roads.
The 2SLS estimates from Table 4 Panel B show that if China were to completely stop
13

buying NR from Sub-Saharan African countries, one-year GDP growth rates would decrease
by 23%, capital formation would decrease by 66%, the value of value added industries would
decrease by 21% in levels and by 56% as a fraction of GDP and labor force participation
would increase by 9.6%.
The estimates for exporting to the World is not statistically different from zero except for
value added industries.
Table 5 shows the results for institutional and human rights outcomes. We find that
exporting to China has no effect on the polity 2, political rights, civil liberties, democratic ac-
countability, or ethnic tensions indices. However, it worsens internal conflict and but increases
women’s economic rights. For human rights outcomes in columns (8)-(11), the estimates in
Panel B show that exporting to China has a statistically significant and negative effect on
human rights according to all indices. The estimates for exporting NR to the World suggest
that it increases autocracy (decreases Polity 2) and decreases political rights. The estimates
for the effect on human right are not statistically different from zero. But it is interesting to
note that the coefficients all have opposite signs from the coefficients for estimating to China.
We also examined the effect of exporting to China on outcomes one and three years later. We
found no persistent or delayed effect. These estimates are not reported in the paper.
4.3 Robustness
To check our identification strategy, we used lagged outcomes (e.g. political terror in year
t− 1) as dependent variables and re-estimated the OLS and 2SLS equations. The coefficientsare close to zero (and order of magnitude smaller than the main results) and not statistically
signficant). This is evidence that our results are not driven by existing trends in African
countries. For brevity, they are not reported in the paper.
4.4 China versus the U.S.
It is difficult to determine whether the effects unveiled in the previous subsection are specific
from China. It might be, for instance, that any buyer of significant size generates them.
Alternatively, these results could be due to the fact that China is an autocracy. The latter hy-
pothesis is difficult to examine because China is the only autocracy big enough to significantly
14
affect NR trade. To investigate the former hypothesis, we compare the effects of exporting to
China versus exporting to the US. We estimate an equation similar to (1). The only differ-
ence is that we now include total NR exports to the U.S. on the right hand side. The OLS
estimates with FE are shown in Panel A of Table 6. For the sake of brevity, we only report
part of the outcomes of the previous section. These estimates show that exporting to the U.S.
is more positively correlated with one and three year GDP growth than exporting to China.
The estimates for exporting to the U.S. are statistically significant at the 1% level. But they
are not statistically different from exporting to China. Column (4) shows that exporting to
the U.S. has similar effects on value added industries as a fraction of GDP as exporting to
China. Column (13) shows that exporting to the U.S. is uncorrelated with political terror
where as exporting to China increases it. The estimate for China is statistically significant at
the 5% level.
We use the interaction terms between the existence of each commodity for a given African
country and U.S. GDP each year as instruments for the value of NR exports to the U.S.
The first stage estimates are shown in Table A2. Column (2B) shows that the estimates
for the instruments are mostly significant at the 5% and 1% levels. The F-statistic for joint
significance is 9.9 in Column (2C). Note that the F-statistic for the instruments for exports
to China and exports to the World are 269 and 14.55, respectively.
Panel B of Table 6 shows the 2SLS estimates. Columns (2)-(4) show that exporting to
China has positive effects on three-year GDP growth, capital formation and value added
industries as a fraction of GDP. The estimates are statistically significant at the 10%, 5%
and 1% levels. The estimates for exporting to the U.S. are positive, but much smaller in
magnitude, and not statistically different from zero. Column (6) shows that exporting to
China has a more negative effect on labor force participation that exporting to the U.S.
But the difference is not statistically different. Columns (8) and (10) examine outcomes
that reflect pronounced preferences of the democratic and communist regimes, democratic
accountability and women’s economic rights. The estimates show that exporting to the U.S.
increases political accountability (1% significance level) and has no effect on women’s economic
rights, where as exporting to China has no effect on democratic accountability but increases
women’s economic rights (1% significance level). Column (9) shows that exporting to China
worsens internal conflict (1% significance level) where as exporting to the U.S. has a positive
15

coefficient but is not statistically different form zero. Interestingly, for human rights outcomes,
the signs of the estimated coefficients are the same for exporting to the U.S. and China. Also,
the coefficients for torture and political terror are very similar in magnitude. However, they
are only statistically different from zero for exporting to China.
These results show that exporting to China leads to more short term economic growth,
worse democratic accountability, less internal conflict and improved economic rights for women.
The effects on human rights are not obviously different from the effect of exporting to the
U.S.
4.5 China versus India
Another possible interpretation for the main results presented in Table 5 is that there is a
trickling down effect from trading with a fast growing economy. This is especially a concern
for outcomes such as economic growth. To address this, we compare the effects of exporting
NR to China with exporting to India, whose GDP has grown at approximately 9.2% per year
compared to China’s 10%. India differs from China in two ways. First, it is a democracy.
Second, the levels of NR imports from Africa are much lower although the trends are similar.
The OLS estimates are reported in Panel A of Table 7. For the sake of brevity, we focus the
discussion on the causally identified 2SLS results in Panel B. The first stage estimates are
shown in Table A3.
Columns (1)-(4) show that exporting to China has positive and statistically significant
effects on GDP growth, capital formation and value added industries as a fraction of GDP,
where as the coefficients for exporting to India are much smaller in magnitude and not statis-
tically different from zero. Interestingly, column (5) shows that the coefficient for the effect
of exporting to India on manufacturing industries is positive and almost significant at the
15% level, where as the coefficient for exporting to China is an order of a magnitude smaller
and not statistically different from zero. Columns (9) and (10) show that exporting to China
worsens internal conflict and improves women’s economic rights where as exporting to India
has no effect on internal conflict but may decrease women’s economic rights. Interestingly,
Columns (11)-(13) show that the estimated coefficients for the effect of exporting to India on
physical integrity, torture and political terror all have the opposite signs from the coefficients
16

for China, which have the same effects as before. However, only the estimate for torture is
statistically significant at the 5% level for India. For exporting to China, the estimates for tor-
ture and political terror are statistically significant at the 1% level. Interestingly, these results
show that while exporting to India has similar effects as exporting to the U.S. for economic
and institutional outcomes, it has different effects on human rights. It is alone, amongst the
three countries we examine, in having potentially beneficial effects on human rights.
5 Interpretation
The comparison of OLS estimates with and without country FE shows that part of the cross-
sectional correlation that can be used as evidence for the adverse effects of exporting NR
to China (and the natural resource curse more generally) is generated by omitted variable
bias or selection. The finding that the 2SLS estimates for the positive effects of exporting
to China on economic and institutional outcomes are larger than the FE estimates suggest
that the selection of worsening regimes in trading with China is causing the FE estimates
to be attenuated. However, the same explanation cannot be used to explain why the FE
estimates for human rights violations are smaller than the 2SLS. If the FE is attenuated
because regimes are self-selecting to trade with China, our results suggest that regimes have
better human rights in order to trade with China. But the causal effect of exporting NR to
China is negative for human rights.
The comparison with exporting to the U.S. and India show that the benefits for economic
growth are China specific. They are not generic effects from exporting to a large country (e.g.
U.S.) or a fast growing country (e.g. India). While the data limits our empirical investigation
of the mechanisms underlying the effect on economic growth, anecdotal evidence and our
results together allow us to speculate. Our results suggest that investment in the extractive
industries is an important channel. China seems to direct more capital to the improvement of
mines, oil and oleoducts than other trade partners. There are many reasons why this might
be so. There is some anecdotal evidence that Chinese oil companies receive capital from
the Chinese government at a subsidized rate (from their huge foreign reserves, and typically
through the ExIm bank). Furthermore, Chinese oil companies use Chinese labor which greatly
reduces labor costs compared to their Western counterparts. Therefore, these companies enjoy
17

cheaper inputs which allows them to develop fields faster. Indeed, some analysts maintain
that in some cases, Chinese companies are bidding for concessions at levels that would make
Western companies operate at a loss. Moreover, the Chinese government is directing soft loans
and other forms of foreign aid to countries in which Chinese extraction companies operate.
Some of this aid includes transfer “in kind,” such as agreements for Chinese companies to
build infrastructure items such as roads, hospitals, presidential palaces and football stadiums.
These transfers also have a comparative advantage due to low labor costs.18 All in all, it might
well be that African countries are obtaining on average a better effective price for their NR
when they divert trade to China.
The findings that exporting to China has a positive effect on government consumption but
no effect on public health expenditures and length of paved road suggest that the increase in
GDP is at least in part being directed to the government, who in turn is not spending it on
the people. (We also examined other types of public spending such as education. The results
are similar to health and not reported in the paper).
Our results seem to support some popular speculation that exporting NR to China has
adverse effects on human rights records, and it also seems to generate internal conflict. It seems
clear that Chinese companies can afford to be indifferent as to the human rights performance
of their host countries in a way that Western companies cannot. Taylor (2006) cites a Chinese
director of African studies in Beijing who argues “We [China] don’t believe that human rights
should stand above sovereignty... We have a different view on this, and African countries
share our view.” Conversely, Western companies and governments have to take into account
that dealing with unpalatable regimes might create a backlash in their home countries. There
are two possible mechanisms which could drive the negative effect of exporting to China on
human rights: funds from China are abetting regimes that will behave badly regardless of the
source of revenues; or, China is actively promoting bad behavior in its suppliers (perhaps to
further alienate them from the West in an attempt to keep the competition out and prices
low). We believe that the former is more likely for several reasons. First, historical bad
behavior suggests that countries trading with China (e.g. Sudan and Angola) may have latent
demand for behaving badly when China’s demand for their resources increased. Second, while
18See Alden (2007) for a discussion of these issues. Note that some of these points are consistent with thereduction of labor force participation that NR trade with China seems to cause.
18
China takes pride in a no strings attached policy, there is no reason to think that it benefits in
any way from being systematically affiliated with countries with bad human rights outcomes.
Finally, and most importantly, the fact that the effects are not obviously different for exporting
to the U.S. (while they are different for exporting to India) suggests that trading with a rich
and politically powerful country may adversely affect human rights independently of (or in
addition to) the political leanings of the trading partner. It may very well be that a rich
and powerful trading partner offers some protection from international monitoring of human
rights. More research on this is needed.
Interestingly, we find that exporting to China improves women’s economic rights whereas
exporting to the U.S. increases democratic accountability. Insofar as these two measures reflect
the propaganda of the respective communist and democratic governments of China and the
U.S., this is our only evidence that either China or the U.S. is promoting "ideology" to their
African suppliers.
Our results for exporting NR to the world at large rejects the standard natural resource
curse argument that exporting NR is bad for economic growth or the development of man-
ufacturing. Our estimates are always positive, although imprecisely estimated. Conversely,
we do find suggestive evidence that exporting NR in general increases autocracy. This is
consistent with a large body of theoretical literature about the detrimental effects of NR on
institutions.19
6 Conclusion
China’s supposed negative influence in Africa has been one of the most commonly reported
stories in the popular media such as The Economist in the past few years. Absent systematic
evidence, anecdotal examples such as the conflict in Darfur in Sudan has been used to galvanize
world opinion. This paper uses a unique empirical strategy to provide novel evidence that
perhaps, these commonly proclaimed beliefs are not wholly true. We find that exporting
NR to China has positive effects on short term economic growth, capital formation and the
development of value added industries. A 1% increase in exports to China increases one year
19Amongst other studies, see Acemoglu, Robinson and Verdier (2004), Acemoglu and Robinson (2006), Boix(2003), Robinson and Torvik (2006), and Lam and Wantchekon (2003).
19
GDP growth by 0.2% and three-year growth by 0.7%. The economic benefits are much larger
than the obtained from exporting to the U.S. or India, another rapidly growing democracy. For
human rights, our results show that exporting NR to China has an adverse effect. However, it
is similar to the effect of exporting NR to the U.S., a rich and powerful democracy. Conversely,
exporting to India, a relatively smaller democracy, improves human rights. Hence, while we
can conclude that the characteristics of a trading partner matters, we cannot attribute the
adverse effect of exporting to China on human rights only to the fact that it is not a democracy.
Rather, the findings of this paper suggest that there is a separate effect from having a rich
and politically powerful trading partner.
For international policy makers, these results should be reassuring. They support the
hypothesis that political pressure from economic partners can be effective. Further research,
both empirical and theoretical, should explore the specific channels and reach of this interna-
tional influence. Currently, these factors are all but absent from the literature in international
economics.
20

References
[1] Acemoglu, Daron and James Robinson. 2005. Economic Origins of Dictatorship and
Democracy. New York, NY: Cambridge University Press.
[2] Acemoglu, Daron, James Robinson and Thierry Verdier. 2004. Kleptocracy and Divide-
and-Rule: a Model of Personal Rule. Journal of the European Economic Association, 2:
162-192.
[3] Alden, Chris. 2005. “China in Africa.” Survival, 47: 147—64.
[4] Alden, Chris. 2007. China in Africa. London, UK: Zed Books.
[5] Amnesty International. 2006. People’s Republic of China: Sustaining Conflict and Human
Rights Abuses: the Flow of Arms Accelerates. New York: Amnesty International
[6] Antràs, Pol and Gerard Padró i Miquel. 2008. A Theory of Foreign Influence. Harvard
University Typescript.
[7] Boix, Carles. 2003. Democracy and Redistribution. New York, NY: Cambridge University
Press.
[8] Bratton, Michael and Nicholas van de Walle. 1997. Democratic Experiments in Africa:
Regime Transition in Comparative Perspective. Cambridge, UK: Cambridge University
Press.
[9] Broadman, Harry. 2007. Africa’s Silk Road: China and India’s New Economic Frontier.
Washington, DC: World Bank.
[10] Brookes, Peter and Ji Hye Shin. 2006. “China’s influence in Africa: implications for the
United States.” Heritage Foundation Backgrounder, no. 1916
[11] Collier, Paul and Benedict Goderis. 2007. “Commodity Prices, Growth, and the Natural
Resource Curse: Reconciling a Conundrum.” Oxford University Typescript.
[12] Deaton, Angus S. and Ronald I. Miller. 1995. “International Commodity Prices, Macro-
economic Performance, and Politics in Sub-Saharan Africa.” Princeton Studies in Inter-
national Finance, 79.
21

[13] Deutsche Bank Research. 2006. China’s commodity hunger: implications for Africa and
Latin America. Deutsche Bank.
[14] Goldstein, Andrea, Nicolas Pinaud, Helmet Reisen and Xiaobao Chen. 2006. The Rise of
China and India: What’s in It for Africa? Paris: OECD Development Centre Studies.
[15] Jensen, Nathan and Leonard Wantchekon. 2004. “Resource Wealth and Political Regimes
in Africa.” Comparative Political Studies, 37: 816-841
[16] Kagan, Robert. 2006. “League of Dictators? Why China and Russia will Continue to
Support Autocracies.” Washington Post, 30 April 2006.
[17] Kaplinsky, Raphael, Dorothy McCormick and Mike Morris. 2006. The Impact of China
on Sub-Saharan Africa. Institute of Development Studies, Sussex University.
[18] Kleine-Ahlbrandt, Stephanie and Andrew Small. 2007. China’s New Dictatorship Diplo-
macy. Foreign Affairs, 87.
[19] Lam, Richard and Leonard Wantchekon. 2003. “Political Dutch Disease.” NYU type-
script.
[20] Levchenko, Andrei. 2207. “Institutional Quality and International Trade.” Review of Eco-
nomic Studies, 74: 791-819.
[21] Mehlum, Halvor, Karl Moene and Ragnar Torvik. 2006. “Institutions and the Resource
Curse.” The Economic Journal 116: 1-20.
[22] Raddatz, Claudio. 2007. “Are External Shocks Responsible for the Instability of Output
in Low-Income Countries?” Journal of Development Economics, 84: 155-187.
[23] Robinson, James A., Ragnar Torvik and Thierry Verdier. 2006. “The Political Founda-
tions of the Resource Curse.” Journal of Development Economics, 79: 447-468
[24] Ross, Michael L. 2001. “Does Oil Hinder Democracy?” World Politics 53: 325-361.
[25] Sachs, Jeffrey D. and Andrew M. Warner. 1995. “Natural Resource Abundance and Eco-
nomic Growth.” NBER Working Paper no. 5398 (revised 1997, 1999).
22
[26] Sachs, Jeffrey D. and Andrew M. Warner. 1999, “The Big Push, Natural Resource Booms
and Growth,” Journal of Development Economics, 59: 43-76.
[27] Sachs, Jeffrey D. and Andrew M. Warner. 2001. “The Curse of Natural Resources.”
European Economic Review, 45: 827-838.
[28] Sala-i-Martin, Xavier and Arvind Subramanian. 2003. “Addressing the Natural Resource
Curse: An Illustration from Nigeria.” NBER Working Paper no. 9804.
[29] Taylor, Ian. 1998. “China’s foreign policy towards Africa in the 1990s” Journal of Modern
African Studies, 36: 443—460
[30] Taylor, Ian. 2004. “The ‘all-weather friend’? Sino-African interaction in the twenty-first
century.” In Ian Taylor and Paul Williams, eds, Africa in International Politics: External
Involvement on the Continent. London, UK: Routledge.
[31] Taylor, Ian. 2006. “China’s Oil Diplomacy.” International Affairs, 82: 937-959.
[32] Taylor, Ian. 2006. China and Africa: engagement and compromise. London, UK: Rout-
ledge.
[33] Torvik, Ragnar. 2002. “Natural Resources, Rent Seeking and Welfare.” Journal of De-
velopment Economics, 67: 455-470.
[34] Van der Ploeg, Frederick. 2007. “Challenges and Opportunities for Resource Rich
Economies,” Journal of Economic Literature (forthcoming).
[35] Zweig, David and Bi Jianhai. 2005. “The Foreign Policy of a Resource Hungry State.”
Foreign Affairs, 84.
23

Figure 1: Number of African Countries Exporting Natural Resources to China
5
10
15
20
25
30
35
40
1984 1988 1992 1996 2000 2004
Year
# of
Cou
ntrie
s Ex
port
ing
NR
to C
hna

Figure 2: African Exports of Natural Resources to China over Time
0
0.02
0.04
0.06
0.08
0.1
0.12
0.14
0.16
0.18
0.2
1984 1988 1992 1996 2000 2004
Year
Tota
l Exp
orts
of N
R to
Chi
na fr
om A
fric
a (F
ract
ion
of T
otal
NR
Exp
or
Tota
l Chi
na T
rade
)
/TotNRExp /TotChnTrade

Figure 3: Chinese GDP and African Natural Resource Export to China
2.00E+11
4.00E+11
6.00E+11
8.00E+11
1.00E+12
1.20E+12
1.40E+12
1.60E+12
1.80E+12
2.00E+12
1984 1988 1992 1996 2000 2004
Year
Chi
nese
GD
P in
199
6 U
SD
0.00E+00
5.00E+09
1.00E+10
1.50E+10
2.00E+10
2.50E+10
NR
EXP
to C
hina
in 1
996
USD
CHN_GDPCHN NR
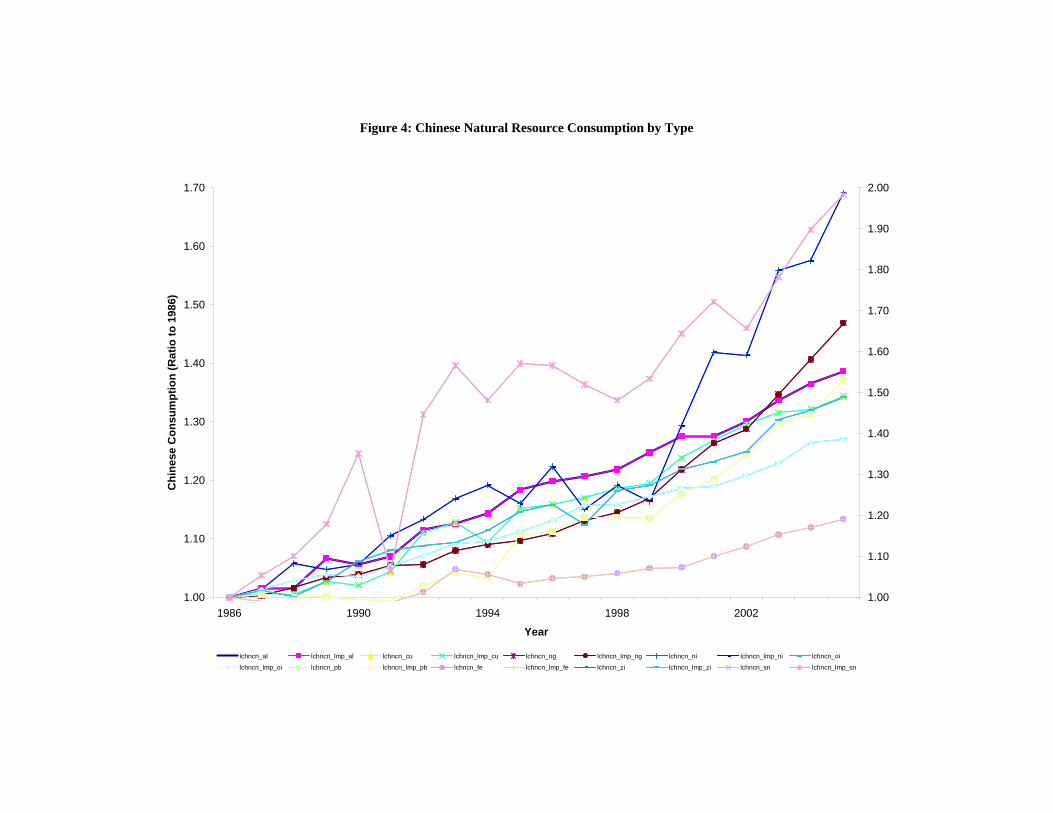
Figure 4: Chinese Natural Resource Consumption by Type
1.00
1.10
1.20
1.30
1.40
1.50
1.60
1.70
1986 1990 1994 1998 2002
Year
Chi
nese
Con
sum
ptio
n (R
atio
to 1
986)
1.00
1.10
1.20
1.30
1.40
1.50
1.60
1.70
1.80
1.90
2.00
lchncn_al lchncn_lmp_al lchncn_cu lchncn_lmp_cu lchncn_ng lchncn_lmp_ng lchncn_ni lchncn_lmp_ni lchncn_oi
lchncn_lmp_oi lchncn_pb lchncn_lmp_pb lchncn_fe lchncn_lmp_fe lchncn_zi lchncn_lmp_zi lchncn_sn lchncn_lmp_sn

Figure 5A: The OLS Estimate of the Effect of Exporting NR to China on GDP Growth (3 Years)
-50
050
100
-20 -10 0 10 20Residuals
Residuals Fitted values
Figure 5B: The OLS Estimate of the Effect of Exporting NR to China on Manufacturing as a Share of GDP
-1.5
-1-.5
0.5
-20 -10 0 10 20Residuals
Residuals Fitted values
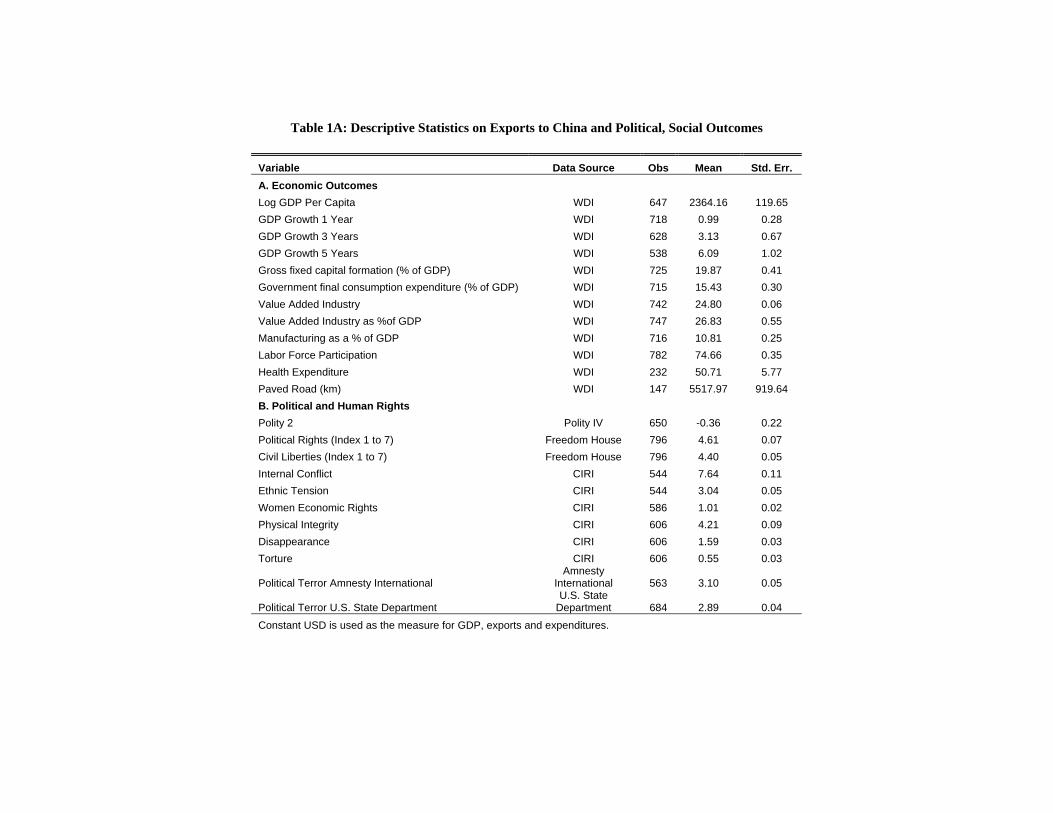
Table 1A: Descriptive Statistics on Exports to China and Political, Social Outcomes
Variable Data Source Obs Mean Std. Err. A. Economic Outcomes Log GDP Per Capita WDI 647 2364.16 119.65 GDP Growth 1 Year WDI 718 0.99 0.28 GDP Growth 3 Years WDI 628 3.13 0.67 GDP Growth 5 Years WDI 538 6.09 1.02 Gross fixed capital formation (% of GDP) WDI 725 19.87 0.41 Government final consumption expenditure (% of GDP) WDI 715 15.43 0.30 Value Added Industry WDI 742 24.80 0.06 Value Added Industry as %of GDP WDI 747 26.83 0.55 Manufacturing as a % of GDP WDI 716 10.81 0.25 Labor Force Participation WDI 782 74.66 0.35 Health Expenditure WDI 232 50.71 5.77 Paved Road (km) WDI 147 5517.97 919.64 B. Political and Human Rights Polity 2 Polity IV 650 -0.36 0.22 Political Rights (Index 1 to 7) Freedom House 796 4.61 0.07 Civil Liberties (Index 1 to 7) Freedom House 796 4.40 0.05 Internal Conflict CIRI 544 7.64 0.11 Ethnic Tension CIRI 544 3.04 0.05 Women Economic Rights CIRI 586 1.01 0.02 Physical Integrity CIRI 606 4.21 0.09 Disappearance CIRI 606 1.59 0.03 Torture CIRI 606 0.55 0.03
Political Terror Amnesty International Amnesty
International 563 3.10 0.05
Political Terror U.S. State Department U.S. State
Department 684 2.89 0.04 Constant USD is used as the measure for GDP, exports and expenditures.

Table 1B: Index Values for Kenya and Sudan
(1) (2) (3) (4) (5) (6) (7) (8) (9) (10) (11) (12) Country Name Polity 2 Pol Rights Civ Lib
Democratic Account
Internal Conflict
Ethnic Tensions
Women Econ
Physical Integrity Disappear Torture
Pol Ter Amnest
Pol Ter U.S.
Sudan -7 7 7 4 2 0 0 0 2 0 5 5 Kenya -2 6 5 8 3 2 1 2 0 0 3 3
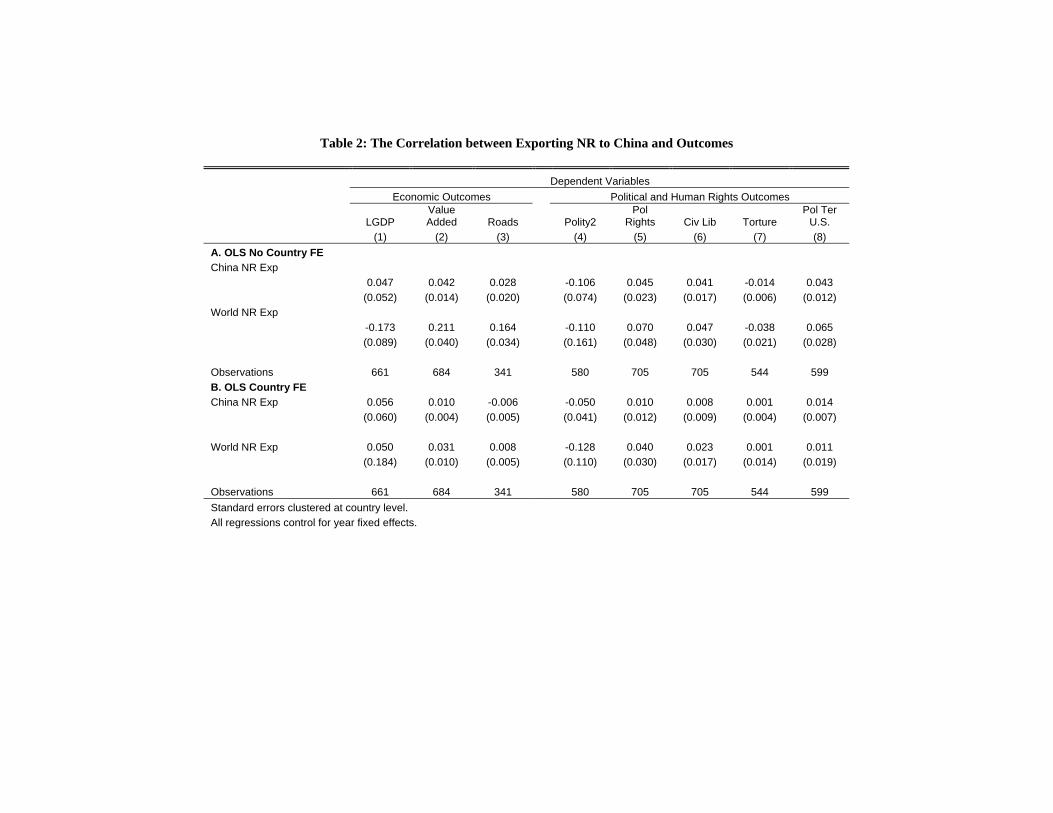
Table 2: The Correlation between Exporting NR to China and Outcomes
Dependent Variables Economic Outcomes Political and Human Rights Outcomes
LGDP Value Added Roads Polity2
Pol Rights Civ Lib Torture
Pol Ter U.S.
(1) (2) (3) (4) (5) (6) (7) (8) A. OLS No Country FE China NR Exp 0.047 0.042 0.028 -0.106 0.045 0.041 -0.014 0.043 (0.052) (0.014) (0.020) (0.074) (0.023) (0.017) (0.006) (0.012) World NR Exp -0.173 0.211 0.164 -0.110 0.070 0.047 -0.038 0.065 (0.089) (0.040) (0.034) (0.161) (0.048) (0.030) (0.021) (0.028) Observations 661 684 341 580 705 705 544 599 B. OLS Country FE China NR Exp 0.056 0.010 -0.006 -0.050 0.010 0.008 0.001 0.014 (0.060) (0.004) (0.005) (0.041) (0.012) (0.009) (0.004) (0.007) World NR Exp 0.050 0.031 0.008 -0.128 0.040 0.023 0.001 0.011 (0.184) (0.010) (0.005) (0.110) (0.030) (0.017) (0.014) (0.019) Observations 661 684 341 580 705 705 544 599 Standard errors clustered at country level. All regressions control for year fixed effects.

Table 3: First Stage Estimates of the Effect of China’s Demand for NR on NR Exports to China and the Effect of the World’s Demand for NR on NR Exports to the World
Dependent Variables China NR
Exp World NR
Exp China NR
Exp World NR
Exp (1A) (2A) (1B) (2B) cgdp_eal 18.40 -4.65 lgdpw_e_al -58.85 9.51 (10.27) (3.96) (27.15) (13.17) cgdp_ecob -26.83 2.10 lgdpw_e_cob 72.91 -4.98 (9.89) (2.53) (29.94) (10.11) cgdp_ecu -27.74 -9.87 lgdpw_e_cu 109.45 31.03 (10.75) (4.28) (34.50) (16.50) cgdp_efe 3.96 3.95 lgdpw_e_fe -9.30 -15.55 (6.50) (2.53) (22.58) (9.76) cgdp_emg -40.21 1.39 lgdpw_e_mg 147.51 -10.26 (14.43) (6.90) (41.66) (23.23) cgdp_eng 45.24 8.38 lgdpw_e_ng -151.82 -28.82 (13.99) (6.10) (41.75) (21.12) cgdp_eni 84.68 7.69 lgdpw_e_ni -284.66 -25.64 (15.10) (5.64) (48.11) (20.31) cgdp_eoi -16.68 -3.46 lgdpw_e_oi 71.64 12.76 (10.31) (3.89) (31.74) (15.76) cgdp_epb 65.48 2.33 lgdpw_e_pb -229.11 -10.86 (13.09) (4.96) (41.36) (17.99) cgdp_ept -0.57 8.97 lgdpw_e_pt -40.54 -29.57 (21.06) (10.32) (68.00) (38.63) cgdp_esn -14.29 1.46 lgdpw_e_sn 56.87 -7.18 (10.31) (3.23) (33.62) (12.42) cgdp_eti -36.30 -3.51 lgdpw_e_ti 113.18 10.38 (12.03) (4.91) (31.62) (15.82) cgdp_eur 10.84 -5.08 lgdpw_e_ur -65.78 19.34 (9.69) (4.73) (30.35) (16.23) cgdp_ew 86.75 6.09 lgdpw_e_w -269.89 -22.42 (25.57) (9.10) (76.76) (31.53) cgdp_ezi 19.50 8.51 lgdpw_e_zi -103.82 -27.24 (20.98) (8.55) (63.22) (30.04) cgdp_ecr -47.77 -12.24 lgdpw_e_ta 278.34 45.66 (14.89) (8.15) (51.81) (24.83) cgdp_eta -82.30 -13.19 lgdpw_e_cr 167.10 41.63 (17.67) (7.31) (49.21) (31.73) Observations 705 705 F Statistic 97.36 4.21 Standard errors clustered at country level. All regressions control for country and year fixed effects.

Table 4: The Effect of Exporting Natural Resources to China and the World on Economic Outcomes
Dependent Variables
LGDP LGDP3 LGDP5 Capital Gov Con VA VAGDP Manu Labor Health Road
(1) (2) (3) (4) (5) (6) (7) (8) (9) (10) (11) A. OLS China NR Exp 0.056 0.332 0.423 0.115 0.005 0.010 0.317 -0.001 0.001 -0.003 -0.006 (0.060) (0.222) (0.271) (0.080) (0.039) (0.004) (0.125) (0.027) (0.018) (0.004) (0.005) World NR Exp 0.050 0.202 0.352 0.265 0.048 0.031 0.730 0.141 -0.015 0.005 0.008 (0.184) (0.525) (0.876) (0.403) (0.191) (0.010) (0.205) (0.127) (0.048) (0.008) (0.005) Observations 661 573 485 666 657 684 684 652 688 220 341 B. IV with NR Existence * Chinese GDP China NR Exp 0.230 0.740 1.171 0.666 0.171 0.021 0.564 0.027 -0.096 -0.005 -0.009 (0.121) (0.428) (0.825) (0.296) (0.120) (0.008) (0.217) (0.093) (0.055) (0.008) (0.014) World NR Exp 0.355 1.042 -0.531 0.313 -0.530 0.057 2.186 0.643 0.043 -0.025 0.035 (0.688) (2.244) (2.718) (1.243) (0.557) (0.038) (1.029) (0.657) (0.279) (0.046) (0.033) Observations 661 573 485 666 657 684 684 652 688 220 341 Standard errors clustered at country level. All regressions control for country and year fixed effects.
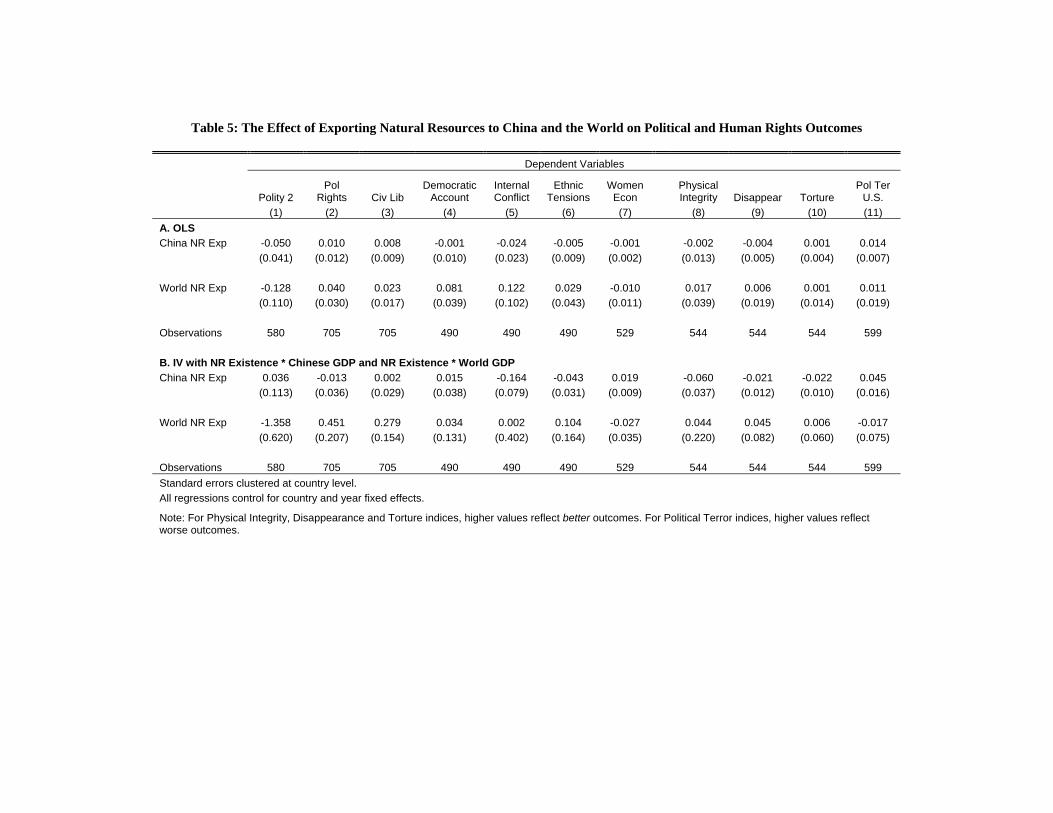
Table 5: The Effect of Exporting Natural Resources to China and the World on Political and Human Rights Outcomes
Dependent Variables
Polity 2 Pol
Rights Civ Lib Democratic
Account Internal Conflict
Ethnic Tensions
Women Econ
Physical Integrity Disappear Torture
Pol Ter U.S.
(1) (2) (3) (4) (5) (6) (7) (8) (9) (10) (11) A. OLS China NR Exp -0.050 0.010 0.008 -0.001 -0.024 -0.005 -0.001 -0.002 -0.004 0.001 0.014 (0.041) (0.012) (0.009) (0.010) (0.023) (0.009) (0.002) (0.013) (0.005) (0.004) (0.007) World NR Exp -0.128 0.040 0.023 0.081 0.122 0.029 -0.010 0.017 0.006 0.001 0.011 (0.110) (0.030) (0.017) (0.039) (0.102) (0.043) (0.011) (0.039) (0.019) (0.014) (0.019) Observations 580 705 705 490 490 490 529 544 544 544 599 B. IV with NR Existence * Chinese GDP and NR Existence * World GDP China NR Exp 0.036 -0.013 0.002 0.015 -0.164 -0.043 0.019 -0.060 -0.021 -0.022 0.045 (0.113) (0.036) (0.029) (0.038) (0.079) (0.031) (0.009) (0.037) (0.012) (0.010) (0.016) World NR Exp -1.358 0.451 0.279 0.034 0.002 0.104 -0.027 0.044 0.045 0.006 -0.017 (0.620) (0.207) (0.154) (0.131) (0.402) (0.164) (0.035) (0.220) (0.082) (0.060) (0.075) Observations 580 705 705 490 490 490 529 544 544 544 599 Standard errors clustered at country level. All regressions control for country and year fixed effects.
Note: For Physical Integrity, Disappearance and Torture indices, higher values reflect better outcomes. For Political Terror indices, higher values reflect worse outcomes.

Table 6: The Effects of Exporting NR to China and Exporting NR to the U.S. and Outcomes
Dependent Variables
LGDP LGDP3 Capital VAGDP Manu Labor Polity
2 Demo
Account Internal Conflict
Women Econ
Physical Integrity Torture
Pol Ter U.S.
(1) (2) (3) (4) (5) (6) (7) (8) (9) (10) (11) (12) (13) A. OLS China NR Exp 0.046 0.297 0.112 0.299 0.000 0.001 -0.046 -0.004 -0.026 -0.001 -0.001 0.001 0.014 (0.056) (0.201) (0.082) (0.120) (0.026) (0.018) (0.042) (0.009) (0.023) (0.002) (0.013) (0.004) (0.007) U.S. NR Exp 0.116 0.462 0.046 0.183 -0.021 0.004 -0.032 0.038 0.030 -0.005 -0.007 0.002 -0.004 (0.095) (0.272) (0.104) (0.078) (0.022) (0.014) (0.041) (0.014) (0.025) (0.006) (0.020) (0.007) (0.008) World NR Exp -0.017 -0.022 0.237 0.621 0.152 -0.017 -0.109 0.063 0.108 -0.008 0.022 0.000 0.013 (0.152) (0.432) (0.364) (0.171) (0.121) (0.049) (0.119) (0.040) (0.104) (0.011) (0.037) (0.014) (0.020) Observations 661 573 666 684 652 688 580 490 490 529 544 544 599 B. IV with NR Existence * Chinese GDP and NR Existence * U.S. GDP and NR Existence * World GDP China NR Exp 0.175 0.724 0.528 0.439 0.008 -0.083 0.032 0.002 -0.143 0.017 -0.044 -0.018 0.043 (0.120) (0.424) (0.250) (0.197) (0.071) (0.043) (0.100) (0.024) (0.062) (0.007) (0.035) (0.009) (0.015) U.S. NR Exp -0.089 0.232 0.019 0.164 -0.015 -0.035 -0.042 0.155 0.111 -0.016 -0.085 -0.023 0.032 (0.130) (0.424) (0.326) (0.256) (0.110) (0.069) (0.167) (0.047) (0.129) (0.015) (0.062) (0.020) (0.029) World NR Exp 0.323 0.611 0.095 1.631 0.522 0.053 -1.116 0.149 0.118 -0.033 0.153 0.029 -0.054 (0.607) (2.185) (1.118) (0.935) (0.584) (0.211) (0.628) (0.126) (0.311) (0.033) (0.194) (0.055) (0.075) Observations 661 573 666 684 652 688 580 490 490 529 544 544 599 Standard errors clustered at country level. All regressions control for country and year fixed effects.

Table 7: The Effects of Exporting NR to China and Exporting NR to India on Outcomes
Dependent Variables
LGDP LGDP3 Capital VAGDP Manu Labor Polity 2 Demo
Account Internal Conflict
Women Econ
Physical Integrity Torture
Pol Ter U.S.
(1) (2) (3) (4) (5) (6) (7) (8) (9) (10) (11) (12) (13) A. OLS
China NR Exp 0.056 0.332 0.114 0.315 0.001 0.001 -0.051 -0.002 -0.026 -0.001 -0.002 0.001 0.014 (0.060) (0.221) (0.080) (0.125) (0.026) (0.018) (0.041) (0.010) (0.023) (0.002) (0.013) (0.004) (0.007) India NR Exp 0.004 -0.120 -0.082 -0.076 0.100 -0.009 0.085 0.005 0.028 -0.006 0.002 0.006 0.003 (0.067) (0.146) (0.083) (0.120) (0.045) (0.017) (0.043) (0.016) (0.033) (0.004) (0.016) (0.005) (0.008)
World NR Exp 0.050 0.196 0.260 0.723 0.149 -0.016 -0.118 0.081 0.122 -0.011 0.017 0.001 0.011 (0.183) (0.519) (0.399) (0.199) (0.118) (0.048) (0.107) (0.040) (0.102) (0.011) (0.039) (0.014) (0.019)
Observations 661 573 666 684 652 688 580 490 490 529 544 544 599 B. IV with NR Existence * Chinese GDP and NR Existence * Indian GDP and NR Existence * World GDP China NR Exp 0.369 0.888 0.527 0.496 0.035 -0.073 0.000 0.000 -0.132 0.015 -0.053 -0.019 0.032 (0.195) (0.504) (0.212) (0.192) (0.061) (0.049) (0.105) (0.026) (0.055) (0.007) (0.034) (0.008) (0.016) India NR Exp 0.123 0.185 0.044 0.037 0.276 -0.047 0.280 0.034 0.105 -0.014 0.072 0.020 -0.019 (0.188) (0.467) (0.225) (0.329) (0.156) (0.047) (0.120) (0.042) (0.072) (0.009) (0.042) (0.011) (0.021) World NR Exp 0.222 0.466 -0.187 2.150 0.565 -0.021 -1.087 0.092 0.073 -0.019 0.024 0.023 0.005 (0.648) (1.699) (1.027) (0.904) (0.467) (0.234) (0.590) (0.127) (0.381) (0.034) (0.203) (0.054) (0.079) Observations 661 573 666 684 652 688 580 490 490 529 544 544 599 Standard errors clustered at country level.
All regressions control for country and year fixed effects.

APPENDIX Table A1: Average Natural Resource Production during 1990-2000 by Country
Country Silver Alum Gold Cobalt Coltan Copper Diam Iron Magn N.Gas Nickel Oil Pallad Lead Pho Plat Tin Tit Ur Tung ZincAngola 4928 1611 331372Benin 75 847Botswana 836 299 932 27 25443 28260Burkina Faso 1849 1Burundi 162 2 22Cameroon 973 12 38320 3C. African Rep. 59 431Chad 124 66Congo 11 5 8187Côte d'Ivoire 32 232 180 6419D.R. Congo 29967 2713 8248 17 127 21486 5 9317 54 17 2914Equ. Guinea 286 874 56788Eritrea 96Ethiopia 178 4194 1Gabon 137 1 944 111 115330 689Ghana 347 623 6323 98 242 2833Guinea 15425 1369 389Kenya 897 93Lesotho 82Liberia 42 99 249Madagascar 54Malawi 73Mali 26 34732 2Mauritania 1499 3 767Mozambique 9 885 31 69 4Namibia 34552 2447 22 1531 13773 9 2733 46772Niger 117 165 2 314Nigeria 32 25 177 3424 89136 155 1172Rwanda 371 37 128Senegal 583 7 3 618Sierra Leone 1315 33 326 58South Africa 13347 414423 46 22254 145 11725 2232 153 1963 3726 14131 63543 6367 146 1375 114 937 1368 586Sudan 4390 1 15675Swaziland 24Togo 550Uganda 332 44 2 29 43Tanzania 7478 2936 75 3 29 14 72 4 9Zambia 9431 315 7778 3 385 9 1Zimbabwe 6650 16496 14 3853 6 177 272 135 1624 28 275 377 1
Resource

Table A2: First Stage Estimates of the Effect of China’s Demand for NR on NR Exports to China, the Effect of the U.S.’s Demand for NR on NR Exports to the U.S., and the Effect of the World’s Demand for NR on
NR Exports to the World Dependent Variables China U.S. World China U.S. World China U.S. World (1A) (2A) (3A) (1B) (2B) (3B) (1C) (2C) (3C)
cgdp_eal 27.60 -0.56 -2.73 us_lgdp_eal -164.98 -41.84 -34.86 lgdpw_e_al 93.48 42.88 41.85 (11.48) (6.34) (3.59) (54.67) (37.54) (15.88) (53.18) (45.47) (24.84) cgdp_ecob -22.77 -17.95 1.64 us_lgdp_ecob -99.99 46.29 6.53 lgdpw_e_cob 173.92 32.92 -10.27 (8.00) (15.32) (2.66) (62.74) (46.15) (16.30) (82.37) (90.48) (17.90) cgdp_ecu -17.04 8.04 -6.95 us_lgdp_ecr -17.29 34.51 0.87 lgdpw_e_cu 269.89 162.18 74.65 (12.53) (14.61) (4.09) (55.33) (31.78) (14.17) (80.98) (126.85) (38.60) cgdp_efe 9.99 7.77 5.22 us_lgdp_ecu -177.64 -198.83 -48.28 lgdpw_e_fe 100.18 83.18 10.22 (6.54) (13.28) (3.02) (82.95) (88.85) (32.67) (47.41) (80.41) (14.29) cgdp_emg -59.49 -8.76 -0.90 us_lgdp_efe -116.98 -90.58 -27.05 lgdpw_e_mg -171.35 -224.86 -50.88 (14.82) (12.34) (6.30) (37.53) (41.97) (18.38) (98.42) (99.13) (44.33) cgdp_eng 37.95 16.11 6.51 us_lgdp_emg 345.87 236.99 43.48 lgdpw_e_ng -253.59 -238.83 -56.92 (14.17) (11.07) (5.95) (90.06) (74.20) (28.95) (74.29) (85.59) (31.81) cgdp_eni 75.09 66.45 6.90 us_lgdp_eng 115.33 172.18 31.24 lgdpw_e_ni -708.14 392.64 -62.56 (15.26) (24.27) (6.01) (62.95) (60.66) (17.83) (134.81) (173.43) (37.46) cgdp_eoi -14.38 5.51 -0.50 us_lgdp_eni 442.31 -715.54 39.03 lgdpw_e_oi 110.57 178.12 62.06 (8.93) (6.57) (3.45) (121.94) (127.88) (34.64) (78.83) (85.20) (34.05) cgdp_epb 62.31 23.95 2.84 us_lgdp_eoi -41.95 -182.26 -53.35 lgdpw_e_pb -316.82 60.06 -4.73 (14.28) (17.35) (5.20) (59.61) (69.58) (24.53) (67.41) (112.72) (25.41) cgdp_ept -5.70 -79.27 8.89 us_lgdp_epb 85.43 -138.68 -7.32 lgdpw_e_pt 122.85 -493.54 -6.99 (21.90) (26.09) (10.89) (66.02) (78.17) (21.17) (140.32) (178.67) (47.06) cgdp_esn -27.52 -18.38 0.35 us_lgdp_ept -165.04 860.71 -23.56 lgdpw_e_sn -154.19 -202.25 -25.16 (12.47) (8.93) (2.76) (121.64) (131.31) (39.38) (51.60) (74.21) (26.30) cgdp_eti -36.92 -4.85 -1.84 us_lgdp_esn 230.69 248.38 19.57 lgdpw_e_ti 107.36 95.20 38.78 (12.44) (6.39) (4.22) (62.20) (69.70) (18.30) (55.37) (46.90) (31.82) cgdp_eur 32.20 -13.35 -3.02 us_lgdp_eta -176.75 29.32 -13.40 lgdpw_e_ur 258.17 281.17 50.68 (10.32) (10.67) (4.01) (62.61) (74.62) (17.63) (72.04) (80.46) (37.39) cgdp_ew 83.85 56.86 6.56 us_lgdp_eti 7.22 -78.72 -30.65 lgdpw_e_w -310.45 68.77 -13.11 (25.07) (24.08) (9.12) (46.26) (43.89) (19.05) (139.34) (155.02) (39.57) cgdp_ezi 17.21 -15.67 6.36 us_lgdp_eur -358.94 -218.57 -34.80 lgdpw_e_zi -191.14 -155.88 -58.68 (19.51) (24.77) (8.69) (69.44) (65.52) (28.32) (128.84) (161.94) (51.16) cgdp_ecr -46.35 -6.62 -12.19 us_lgdp_ew 45.92 -256.01 -9.69 lgdpw_e_ta 436.57 23.77 57.00 (17.22) (11.76) (8.67) (113.46) (102.82) (21.83) (80.24) (105.91) (33.20) cgdp_eta -71.45 -17.96 -12.22 us_lgdp_ezi 78.56 211.35 33.86 lgdpw_e_cr 180.70 -18.80 40.30 (17.52) (13.75) (7.25) (98.16) (96.45) (44.06) (29.37) (65.64) (26.25) Observations 705 705 705 F-Statistic 269.79 9.9 14.55
All regressions control for country and year fixed effects. Standard errors are clustered at the country level.
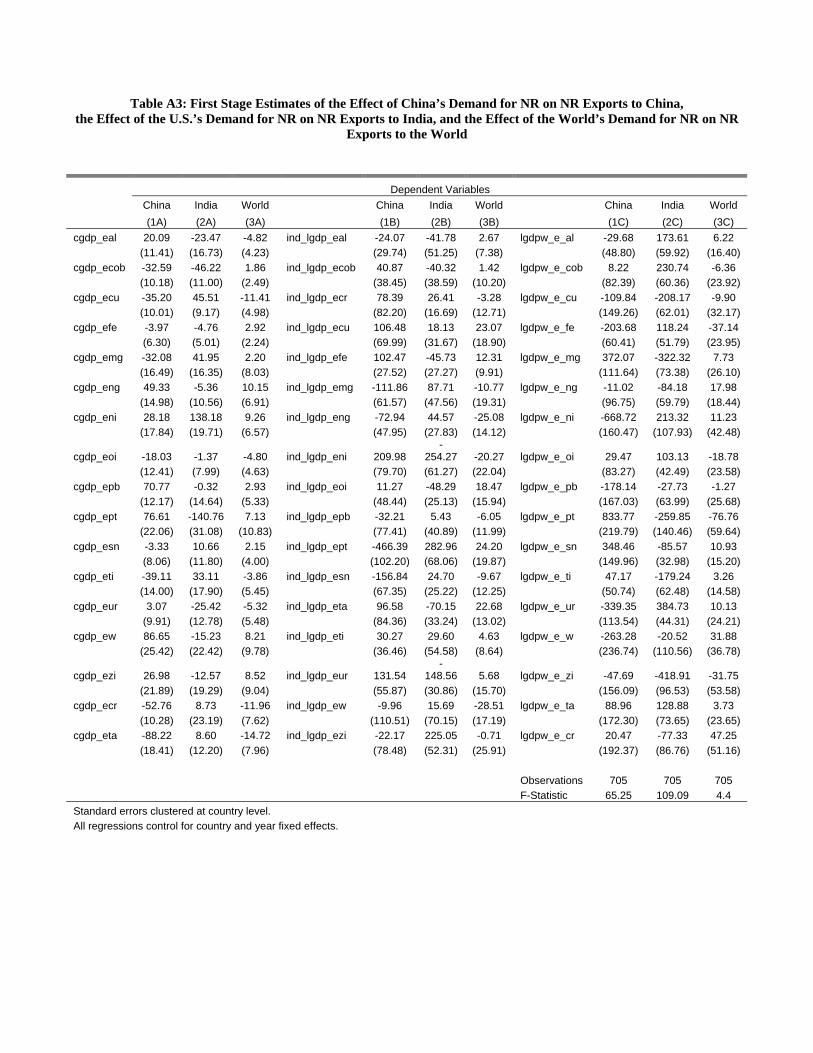
Table A3: First Stage Estimates of the Effect of China’s Demand for NR on NR Exports to China, the Effect of the U.S.’s Demand for NR on NR Exports to India, and the Effect of the World’s Demand for NR on NR
Exports to the World
Dependent Variables China India World China India World China India World (1A) (2A) (3A) (1B) (2B) (3B) (1C) (2C) (3C) cgdp_eal 20.09 -23.47 -4.82 ind_lgdp_eal -24.07 -41.78 2.67 lgdpw_e_al -29.68 173.61 6.22 (11.41) (16.73) (4.23) (29.74) (51.25) (7.38) (48.80) (59.92) (16.40) cgdp_ecob -32.59 -46.22 1.86 ind_lgdp_ecob 40.87 -40.32 1.42 lgdpw_e_cob 8.22 230.74 -6.36 (10.18) (11.00) (2.49) (38.45) (38.59) (10.20) (82.39) (60.36) (23.92) cgdp_ecu -35.20 45.51 -11.41 ind_lgdp_ecr 78.39 26.41 -3.28 lgdpw_e_cu -109.84 -208.17 -9.90 (10.01) (9.17) (4.98) (82.20) (16.69) (12.71) (149.26) (62.01) (32.17) cgdp_efe -3.97 -4.76 2.92 ind_lgdp_ecu 106.48 18.13 23.07 lgdpw_e_fe -203.68 118.24 -37.14 (6.30) (5.01) (2.24) (69.99) (31.67) (18.90) (60.41) (51.79) (23.95) cgdp_emg -32.08 41.95 2.20 ind_lgdp_efe 102.47 -45.73 12.31 lgdpw_e_mg 372.07 -322.32 7.73 (16.49) (16.35) (8.03) (27.52) (27.27) (9.91) (111.64) (73.38) (26.10) cgdp_eng 49.33 -5.36 10.15 ind_lgdp_emg -111.86 87.71 -10.77 lgdpw_e_ng -11.02 -84.18 17.98 (14.98) (10.56) (6.91) (61.57) (47.56) (19.31) (96.75) (59.79) (18.44) cgdp_eni 28.18 138.18 9.26 ind_lgdp_eng -72.94 44.57 -25.08 lgdpw_e_ni -668.72 213.32 11.23 (17.84) (19.71) (6.57) (47.95) (27.83) (14.12) (160.47) (107.93) (42.48)
cgdp_eoi -18.03 -1.37 -4.80 ind_lgdp_eni 209.98 -
254.27 -20.27 lgdpw_e_oi 29.47 103.13 -18.78 (12.41) (7.99) (4.63) (79.70) (61.27) (22.04) (83.27) (42.49) (23.58) cgdp_epb 70.77 -0.32 2.93 ind_lgdp_eoi 11.27 -48.29 18.47 lgdpw_e_pb -178.14 -27.73 -1.27 (12.17) (14.64) (5.33) (48.44) (25.13) (15.94) (167.03) (63.99) (25.68) cgdp_ept 76.61 -140.76 7.13 ind_lgdp_epb -32.21 5.43 -6.05 lgdpw_e_pt 833.77 -259.85 -76.76 (22.06) (31.08) (10.83) (77.41) (40.89) (11.99) (219.79) (140.46) (59.64) cgdp_esn -3.33 10.66 2.15 ind_lgdp_ept -466.39 282.96 24.20 lgdpw_e_sn 348.46 -85.57 10.93 (8.06) (11.80) (4.00) (102.20) (68.06) (19.87) (149.96) (32.98) (15.20) cgdp_eti -39.11 33.11 -3.86 ind_lgdp_esn -156.84 24.70 -9.67 lgdpw_e_ti 47.17 -179.24 3.26 (14.00) (17.90) (5.45) (67.35) (25.22) (12.25) (50.74) (62.48) (14.58) cgdp_eur 3.07 -25.42 -5.32 ind_lgdp_eta 96.58 -70.15 22.68 lgdpw_e_ur -339.35 384.73 10.13 (9.91) (12.78) (5.48) (84.36) (33.24) (13.02) (113.54) (44.31) (24.21) cgdp_ew 86.65 -15.23 8.21 ind_lgdp_eti 30.27 29.60 4.63 lgdpw_e_w -263.28 -20.52 31.88 (25.42) (22.42) (9.78) (36.46) (54.58) (8.64) (236.74) (110.56) (36.78)
cgdp_ezi 26.98 -12.57 8.52 ind_lgdp_eur 131.54 -
148.56 5.68 lgdpw_e_zi -47.69 -418.91 -31.75 (21.89) (19.29) (9.04) (55.87) (30.86) (15.70) (156.09) (96.53) (53.58) cgdp_ecr -52.76 8.73 -11.96 ind_lgdp_ew -9.96 15.69 -28.51 lgdpw_e_ta 88.96 128.88 3.73 (10.28) (23.19) (7.62) (110.51) (70.15) (17.19) (172.30) (73.65) (23.65) cgdp_eta -88.22 8.60 -14.72 ind_lgdp_ezi -22.17 225.05 -0.71 lgdpw_e_cr 20.47 -77.33 47.25 (18.41) (12.20) (7.96) (78.48) (52.31) (25.91) (192.37) (86.76) (51.16) Observations 705 705 705 F-Statistic 65.25 109.09 4.4 Standard errors clustered at country level. All regressions control for country and year fixed effects.

Data Appendix
Economic Data Trade Data Exports and Imports by SITC Rev2, current US Dollars from UNCTAD’s COMTRADE database Source: http://comtrade.un.org/ GDP and Government Spending Data GDP and GDP per capita growth, Government Health Spending, and Government Education Spending from World Development Indicators, World Bank. Paved Roads Length of Paved Road, kilometers. Source: World Development Indicators and Canning, David, "A Database of World Stocks of Infrastructure: 1950-1995," The World Bank Economic Review, 1998, Vol. 12(3), pp 529-548. Updated database at http://www.hsph.harvard.edu/faculty/david-canning/data-sets/
Natural Resource Data Mineral Ore Production Data, US Geological Survey Volumes of minerals. Source: All minerals: http://minerals.usgs.gov/minerals/, African Mineral Yearbooks, various issues: http://minerals.usgs.gov/minerals/pubs/country/africa.html Consumption Data World Metal Statistics Yearbook, various issues, World Bureau of Metal Statistics,. 2005 values from Streifel, Shane, 2006, “Impact of China and India on Global Commodity Markets Focus on Metals & Minerals and Petroleum”, http://siteresources.worldbank.org/INTCHIINDGLOECO/Resources/ChinaIndiaCommodityImpact.pdf
Political and Human Rights Data The indicators on Political outcomes and Human rights are from the Quality of Government Institute at Göteborg University, http://www.qog.pol.gu.se/. Below are brief descriptions of each of the variables used along with the original sources. In addition, examples of values for China, the United States and Zambia are provided. Political Terror (US State Dept) Human rights score (1 to 5 scale)

• Level 1: Countries under a secure rule of law, people are not imprisoned for their view, and torture is rare and exceptional. Political murders are extremely rare.
• Level 2: There is a limited amount of imprisonment for nonviolent political activity. However, few persons are affected, torture and beatings are exceptional. Political murder is rare.
• Level 3: There is extensive political imprisonment, or a recent history of such imprisonment. Execution or political murders and brutality may be common. Unlimited detention, with or without trial, for political view is accepted.
• Level 4: The practices of level 3 are expanded to larger number. Murders, disappearances, and torture are a common part of life. In spite of its generality, on this level terror affects those who interest themselves in politics or ideas.
• Level 5: – The terrors of level 4 have been expanded to the whole population. The leaders of these societies place no limits on the means or thoroughness with which they pursue personal or ideological goals.
Examples of values in 2005 (State Dept): China (4), the United States (n/a), Zambia. (3) Source: http://www.unca.edu/politicalscience/images/Colloquium/faculty-staff/gibney.html, http://www.unca.edu/politicalscience/DOCS/Gibney/Gibney%20and%20Dalton.pdf Freedom House Political Rights, Civil Liberties Indices Raw Points – The ratings process is based on a checklist of 10 political rights questions and 15 civil liberties questions. The political rights questions are grouped into the three sub-categories: Electoral Process (3 questions), Political Pluralism and Participation (4), and Functioning of Government (3). The civil liberties questions are grouped into four sub-categories: Freedom of Expression and Belief (4 questions), Associational and Organizational Rights (3), Rule of Law (4), and Personal Autonomy and Individual Rights (4). Raw points are awarded to each of these questions on a scale of 0 to 4, where 0 points represents the smallest degree and 4 the greatest degree of rights or liberties present. The political rights section also contains two additional discretionary questions: question A (For traditional monarchies that have no parties or electoral process, does the system provide for genuine, meaningful consultation with the people, encourage public discussion of policy choices, and allow the right to petition the ruler?) and question B (Is the government or occupying power deliberately changing the ethnic composition of a country or territory so as to destroy a culture or tip the political balance in favor of another group?). For additional discretionary question A, 1 to 4 points may be added, as applicable, while for discretionary question B, 1 to 4 points may be subtracted (the worse the situation, the more points that may be subtracted). The highest number of points that can be awarded to the political rights checklist is 40 (or a total of up to 4 points for each of the 10 questions). The highest number of points that can be awarded to the civil liberties checklist is 60 (or a total of up to 4 points for each of the 15 questions). The raw points from the previous survey edition are used as a benchmark for the current year under review. In general, a change in raw points is made only if there has been a real world development during the year that warrants a change (e.g., a crackdown on the

media, the country’s first free and fair elections) and is reflected accordingly in the narrative. In answering both the political rights and civil liberties questions, Freedom House does not equate constitutional or other legal guarantees of rights with the on-the-ground fulfillment of these rights. While both laws and actual practices are factored into the ratings decisions, greater emphasis is placed on the latter. In addition, for states and territories with small populations, the absence of pluralism in the political system or civil society is not necessarily viewed as a negative situation unless the government or other centers of domination are deliberately blocking its establishment or operation. For example, a small country without diverse political parties or media outlets or significant trade unions are not penalized if these limitations are determined to be a function of size and not overt restrictions. Political Rights and Civil Liberties Ratings – The total number of points awarded to the political rights and civil liberties checklists determines the political rights and civil liberties ratings. Each rating of 1 through 7, with 1 representing the highest and 7 the lowest level of freedom corresponds to a range of total points. Examples of values in 2005 (Political Rights): China (7), the United States (1), Zambia. (4) Examples of values in 2005 (Civil Liberties): China (6), the United States (1), Zambia. (4) Source: http://www.freedomhouse.org Physical integrity Rights Index This is an additive index constructed from the Torture, Extrajudicial Killing, Political Imprisonment, and Disappearance indicators. It ranges from 0 (no government respect for these four rights) to 8 (full government respect for these four rights). Details on its construction and use can be found in: David L. Cingranelli and David L. Richards. 1999. "Measuring the Level, Pattern, and Sequence of Government Respect for Physical Integrity Rights." International Studies Quarterly, Vol 43.2: 407-18. Examples of values in 2005: China (1), the United States (5), Zambia. (4) Source: CIRI Human Rights, http://ciri.binghamton.edu/ Disappearance Disappearances are cases in which people have disappeared, political motivation appears likely, and the victims have not been found. Knowledge of the whereabouts of the disappeared is, by definition, not public knowledge. However, while there is typically no way of knowing where victims are, it is typically known by whom they were taken and under what circumstances. A score of 0 indicates that disappearances have occurred frequently in a given year; a score of 1 indicates that disappearances occasionally occurred; and a score of 2 indicates that disappearances did not occur in a given year. Examples of values in 2005: China (1), the United States (1), Zambia. (2)

Source: CIRI Human Rights, http://ciri.binghamton.edu/ Extrajudicial killing Extrajudicial killings are killings by government officials without due process of law. They include murders by private groups if instigated by government. These killings may result from the deliberate, illegal, and excessive use of lethal force by the police, security forces, or other agents of the state whether against criminal suspects, detainees, prisoners, or others. A score of 0 indicates that extrajudicial killings were practiced frequently in a given year; a score of 1 indicates that extrajudicial killings were practiced occasionally; and a score of 2 indicates that such killings did not occur in a given year. Examples of values in 2005: China (0), the United States (1), Zambia. (1) Source: CIRI Human Rights, http://ciri.binghamton.edu/ Political Imprisonment Political imprisonment refers to the incarceration of people by government officials because of: their speech; their non-violent opposition to government policies or leaders; their religious beliefs; their non-violent religious practices including proselytizing; or their membership in a group, including an ethnic or racial group. A score of 0 indicates that there were many people imprisoned because of their religious, political, or other beliefs in a given year; a score of 1 indicates that a few people were imprisoned; and a score of 2 indicates that no persons were imprisoned for any of the above reasons in a given year. Examples of values in 2005: China (0), the United States (2), Zambia. (1) Source: CIRI Human Rights, http://ciri.binghamton.edu/ Torture Torture refers to the purposeful inflicting of extreme pain, whether mental or physical, by government officials or by private individuals at the instigation of government officials. Torture includes the use of physical and other force by police and prison guards that is cruel, inhuman, or degrading. This also includes deaths in custody due to negligence by government officials. A score of 0 indicates that torture was practiced frequently in a given year; a score of 1 indicates that torture was practiced occasionally; and a score of 2 indicates that torture did not occur in a given year. Examples of values in 2005: China (0), the United States (1), Zambia. (0) Source: CIRI Human Rights, http://ciri.binghamton.edu/