Embed Size (px)
Citation preview

1
THERE ARE 6 PAGES OF DATA INPUT
Estimate date 12-Nov-08
Fixed options for design of all alternatives of powerplant and conduit.
6 Currency, Canadian $ = 1, USA $ = 2. 17 Project design standard Industrial (1) or Utility design (2) -------- 1 Comment
8 Industrial generator (1) or utility generator (2). ---------------------- 1 Comment9 De-sander required at intake, yes = 1, no = 0. --------------------- 0 Comment
10 Dam design for extreme flood, no = 1, yes = 2. ------------------- 1 Comment
1112 Turbine and powerhouse characteristics.13 Total powerplant flow, m3/s. 2.60 Comment14 Desired number of units in powerplant. 2 Comment Comment
15 Rated head ( Iterate to = F6 ), m. =454.86 Calc head = 454.86
16 Estimated powerplant utilization factor. 0.4600 Comment 1.19617 Normal tailwater elevation m. 317.00 Water use in m3/s per year
18 Powerhouse flood tailwater level, m. 322.00 Comment
19 Average rock level at powerhouse, m. 325.00 --- Must be > 323.8720
21 Generator characteristics.
22 System frequency, Hz. 60.00 Comment
23 Generator power factor. (Range 0.9 to 1.0) 0.90 Comment
24 Generator inertia ratio to normal, "J". 1.00 Comment25
2627
28
29 Turbine type Suitability Comment Cost $M30 Horiz. axis, 1 jet, 1 runner impulse turbine. ----YES ---- 1 9.420
31 Horiz. axis, 2 jet, 1runner impulse turbine. ----YES ---- 1 6.11432 Horiz. axis, 1 jet, 2 runner impulse turbine. ----YES ---- 1 7.405
33 Horiz. axis, 2 jet/r, 2 run. impulse turbine. -------------- 1 0.000
34 Vert. axis, 1 jet, 1 runner impulse turbine. -------------- 1 0.00035 Vert. axis, 2 jet, 1 runner impulse turbine. ----YES ---- 1 7.657
36 Vert. axis, 3 jet, 1 runner impulse turbine. ----YES ---- 1 7.80037 Vert. axis, 4 jet, 1 runner impulse turbine. -------------- 1 0.000
38 Vert. axis, 5 jet, 1 run. impulse turbine. -------------- 1 0.000
39 Vert. axis, 6 jet, 1 run. impulse turbine. -------------- 1 0.00040 Horiz. axis, 1 jet, 1 turgo runer turbine. -------------- 1 0.000
41 Horiz. axis, 2 jet, 1 turgo runner turbine. -------------- 1 0.000
42 Horiz. axis BANKI (Ossberger) turbine. -------------- 1 0.00043
44 Project hydraulics.45 Normal +ve waterhammer design for penstock % 15
46 Allowable negative waterhammer on penstock % 38
4748 Side stream intakes and stream crossings.
49 Side stream intakes, ratio of flow to main intake flow. 0 Comment50 Stream crossings under/over pipe/penstock. 0
51 Input page 1.
DATA INPUT SHEET - HYDROHELP
BAKER - CHIPMUNK CREEK
Allowable waterhammer
calculated by program.
Horizontal axis, 2 jet, 1runner impulse
turbine.RECOMMENDED TURBINE TYPE

2
52 BAKER - CHIPMUNK CREEK Estimate date 12-Nov-08
53
54 Surge tank. Tank hgt, m. 0.055 Surge tank used, (1), not used (0). 0 Comment
56 Surge tank in steel =1, in rock exc. = 2 2 Comment Tank cost $M.
57 If in rock, conc lining (1), no lining, (0) 1 Comment 0.00058 Elevation rock at top of tank, if in rock, m. 800 Comment
59 Elevation at surge tank tee, meters . 710 Comment60 Tank diameter based on min for stability (1), or larger, (2) 2 0.8
61 If tank diameter is larger, select diameter, m. 3.0 Comment
6263 Main concrete weir dam.64 Design maximum (1/1000?) flood flow, m3/s. 300 Deck level, m. 847.60
65 Design weir + LL outlet flood flow (1/200?), m3/s. 300 Comment
66 Crest length between abutments at damsite, m. 100 Comment67 River bed level, m. 840.0 Comment6869 1.470 Spillway sill level, m. 845.00
71 Required depth of spill over weir, m. 2.30 Comment
72 Required number of inflatable rubber dams 2 Comment73
74 De-sander design. 2.2 Must be =< 3.4
75 Basin volume ratio. 160 Comment76 Design particle size, range 0.1mm to 0.4mm. 0.25 Comment
7778 Embankment dams - main dam.79 Normal tailwater level at dam, m. 840.00 Must be > 840.00
80 Design acceleration for earthquake, g. 0.25 = 1/1000 DBE Comment81 River or lowest ground level at dam, m. 840.00
82 Embankment material factor for dam stability 1.20 Comment83 Foundation material factor for dam stability 1.20 Comment
84 Rip-rap design.
85 Effective fetch, km. 1 Comment86 Design wind speed, km/hour. 100 or m/sec = 27.8
87 Dam quantity calculation. Comment88 Dam crest length, m. 20 Crest El. m= 848.97
89 River width, m. 5
90 Average depth of overburden excavation, m. 291 Valley shape factor (0.5 to 1.0) 0.7 Comment
92 Length of cutoff excavation, m. 3093 Average depth of cutoff to impervious material, m. 8 Comment
94 Concrete or slurry wall length, m. 30 Comment
95 Maximum depth of concrete or slurry wall to impervious material, m. 896 Slurry wall valley shape factor (0.25 to 0.75). 0.5 Comment
97
98 Embankment dams - side dam.99 Name of side dam. 1A
100 River or lowest ground level at dam, m. 840.00101 Embankment material factor for dam stability 1.65 Comment
102 Foundation material factor for dam stability 1.60 Comment
103 Input page 2.
Weir spillway. Coefficient of discharge =

3
104 BAKER - CHIPMUNK CREEK Estimate date 12-Nov-08
105
106 Rip-rap design.107 Effective fetch, km. 3 Comment
108 Design wind speed, km/hour. 100 or m/sec = 27.8
109 Side dam 1A quantity calculation.
110 Dam crest length, m. 0 Crest El. m= 849.75
111 River width at dam, m. 0112 Average depth of overburden excavation, m. 0
113 Valley shape factor (0.5 to 1.0) 0.5 Comment
114 Length of cutoff excavation, m. 0 Comment115 Average depth of cutoff to impervious material, m. 0 Comment
116 Concrete or slurry wall length, m. 0 Comment
117 Maximum depth of concrete or slurry wall to impervious material, m. 0118 Slurry wall valley shape factor (0.25 to 0.75). 0.5 Comment
119120 Conduit from reservoir to powerhouse. Comment
121 Number of conduits intake to powerhouse. 1 L/H ratio = 10.6
122 Automatic (1) or manual (2) optimization. 1 Comment123 Select pipe diam (m) for manual optimization. 10.000 Comment. <<< NOTE
124 Select penstock diam (m) for manual optimiz. 8.000125 Penstock steel ultimate strength, Mpa. 482.5 Comment
126 Penstock steel yield strength, Mpa. 344.7 Comment
127128 Intake.
129 Length of intake channel, meters. 5.0 Comment130 Average level of rock at intake, meters. 842.0 Should be > 840.76
131 Average depth of overburden excavation at intake, meters. 2.0
132 Normal FSL at trashracks, m. (by program) 847.30 Trashr. LSL, m 844.00133 Water cleanliness factor. ( 0.5 to 1.0 ) 0.90 Comment
134 Percentage of reservoir cleared. ( 10% to 100% ) 0 Comment135 Approach flow angle to racks. (45 to 0 degrees) 10 Comment
136 Rack inclination to horizontal. (60 to 90 deg. ) 80 Comment
137 Rack blockage ratio. ( 0.0 to 0.25) 0.2 Comment138 Intake pipeline concrete encased length, m. 5 Comment
139
140 Pipeline intake to surge tank.
141 Pipeline on surface (1) or buried (2). 2 Comment
142 Pipe length in rock sidehill, m. 1100143 Pipe length in earth sidehill, m. 2580
144 Elevation of end of pipeline, m. 660 Comment Read comment
145 Average sidehill slope in rock, hor. to 1 vert. 2.1 Comment146 Average sidehill earth slope, horiz. to 1 vert. 2.3 Comment
147 Sideslope roughness factor. (1.5 to 3.0) 1.5 Comment148
149 Low pressure tunnel size and cost calculation.
150 Low pressure tunnel length, m. 0 Min. length151 Adit length, m. 0 tunnel liner,
152 Ratio of length tunnel lined with concrete. 1 Comment meters153 Length of tunnel lined with steel, m. 0 Comment 78.8
154
155 Input page 3.

4
156 BAKER - CHIPMUNK CREEK Estimate date 12-Nov-08157
158 Conduit surge tank to powerhouse.159 Vertical bore.
160 Bore length, m. 0
161 Ratio of length bore lined with concrete. 0 Comment162 High pressure tunnel.163 Total high pressure tunnel length, m. 0164 Adit length, m. 0
165 Ratio of length tunnel lined with concrete. 1 Comment
166 Tunnel steel lined section length, m. 0 Comment167 Buried steel Penstock.168 Elevation at upper end of liner/penstock, m. 660.00 Must be <= 660.0
169 Penstock sideslope length in rock cut, m. 569170 Penstock sideslope length in earth cut, m. 569
171 Average sidehill slope in rock, hor. to 1 vert. 10.0 Comment172 Average sidehill earth slope, horiz. to 1 vert. 10.0 Comment
173 Sideslope roughness factor. (1.5 to 3.0) 1.5 Comment
174 Surface steel penstock.175 Surface penstock length, m. 0
176 Earth overburden average depth of cut, m. 1177 Average excavation depth in rock, m. 2
178
179 Tailrace.180 Tailrace channel length, meters. 50 Tailrace channel invert
181 Tailrace ch. rock level at powerhouse DT exit, m. 325 level, m. 322.33182 Tailrace channel average overburden depth, m. 5 Flow depth, m. 0.86
183 Tailrace Manning friction factor. 0.032
184185 Mechanical equipment
186 Spillway stoplogs for gate adjacent to intake.187 Sets of stoplogs. 0
188 Monorail hoists. 0 Gantries. 0
189 Spillway gate - adjacent to intake. Comment190 Type of gate, flat roller (1) tainter (2) 0 # of gates. 1
191 Intake stoplogs or bulkhead gates.
192 Sets of bulkhead gates. 1193 Sets of stoplogs. 0
194 Monorail hoists. 0 Gantries. 0195 Intake gates, guides and hoists.196 Hoist on tower (1) or on deck (0) 0
197 Trashracks.
198 Type of racks, sectioned (2) or single (1). 2 Comment
199200 Transmission.201 Transmission line length, km. 1
202 Transmission line voltage, kV 24203 Main transmission difficulty factor. 2 Comment
204 Local trans to intake, length, km. 6205 Local transmission voltage, kV. 4
206 Local transmission to intake, difficulty factor. 2 Comment
207 Input page 4.
L/H ratio 10.6

5
208 BAKER - CHIPMUNK CREEK Estimate date 12-Nov-08209
210 Site access and conditions.211 Access road length, km. 1.2
212 Main access road difficulty factor. 1.3 Comment
213 Local access road length, km. 8214 Local accsss road difficulty factor. 1.5 Comment
215 Temporary bridge over river, span, m. 0216 Frost days at site, from a world Atlas. 120 Comment
217 Union (2) or non-union (1) labour at site. 1
218219
220 Work item. Unit cost.
221222 Earthwork and clearing. Comment
223 Clearing, per hectare, $/H $7,404.09 $7,404.09224 Unit cost of overburden excavation, m3. $13.04 $13.04
225 Unit cost of rock excavation, $/m3. $52.17 $52.17
226 Unit cost of found excav in sand or gravel for cutoff, $/m3. $31.95 $31.95227 Rock excavation in tunnels, $/m3. $0.00 $0.00
228 Impervious fill in cofferdams, $/m3. $0.00 $0.00229 Rock fill in cofferdams, $/m3. $73.85 $73.85
230 Impervious fill in dams, $/m3. $33.43 $33.43
231 Filter material in dams, $/m3. $44.16 $44.16232 Rock or embankment material in dams, $/m3. $58.81 $58.81
233 Rock rip-rap, $/m3. $182.01 $182.01234 Sidehill rock excavation for pipeline, $/m3. $39.22 $39.22
235 Sidehill overburden excavation for pipeline, $/m3. $13.04 $13.04
236 Side creek crossing, cost per crossing. $0.00 $0.00237
238 Concrete work.239 Concrete including forms and re-bars, $/m3. $1,022.64 $1,022.64
240 Concrete only, excluding forms and re-bars, $/m3. $670.25 $670.25
241 Concrete formwork, $/m2. $94.77 $94.77242 Reinforcing bars, $/kg. $7.99 $7.99
243 Concrete in tunnel linings, $/m3. $0.00 $0.00
244 Dental concrete on rock in dam foundations, $/m3. $0.00 $0.00245 Concrete or slurry wall, $/m3. $1,870.58 $1,870.58
246247 Steelwork and powerhouse superstructure.248 Trashrack steel cost, $/kg. $6.32 $6.32
249 Pipeline steel cost, $/ton. $5,492.57 $5,492.57250 Tunnel steel lining cost, $/ton. $0.00 $0.00
251 Powerhouse superstructure steel cost $/ton. $7,038.09 $7,038.09252 Powerhouse siding, $/m2. $157.67 $157.67
253 Powerhouse roofing, $/m2. $222.99 $222.99
254 Temporary steel pile bridge over river, cost per m. $0.00 $0.00255
256 Ratio of Sclairpipe cost to equivalent steel pipe cost. 0.50 Comment
257
258 Inflation factor, 2008 to present. 1.001
259 Input page 5.
Suggested unitcost, based on
quantity of
work.

6
260 BAKER - CHIPMUNK CREEK Estimate date 12-Nov-08
261
262 Indirect costs. Estimated indirect263 Cost $M.
264 Feasibility studies and site investigations. 2.0 0.501
265 Environmental work. 2.0 0.511266 Detailed designs and contract documents. 2.0 0.522
267 Site supervision work. 4.0 1.064268 Contingencies on civil and overheads. 20.0 4.059
269 Contingencies on electromechanical work. 8.0 0.590
270271 Interest rate % 6 Interest = 1.035
272
273 Value of generation in cents/kWh. 8.0274 Operating staff manhour cost per hour, $. 80 Comment
275276
277
278 Turbine output at rated head and flow, MW. 5.13279 Powerplant output at rated head and flow, MW. 9.83
280 Turbine rated net head, m. 454.86281 Conduit average diameter, m. 0.92 Number of generating282 Powerplant average annual generation, GWh. 42.34 units = 2
283 Overburden excavation, cubic meters. 28,907284 Rock excavation, m3. 5,459
285 Rock tunnel excavation, cubic meters. 0286 Steel penstock and tunnel liner weight, tonnes. 689
287 Total concrete volume, cubic meters. 2,630288 Powerhouse footprint, width and length, m. 8.1 Length, m 22.4289 Overall turbine + generator + transformer + conduit efficiency at full load, %. 71.07
290 Average overall project efficiency, excl transmission, for energy calc. % 78.76291 Head loss in conduit as a % of rated net head on turbine. ------------------------- > 14.98
292 Speed regulation on an isolated system. Absolutely no speed regulation capability.293 Estimated time required for construction, months. ----------------------------------- > 14294
295
296297
298299
300
301302
303304
305
306307
308309
310
311 Input page 6.
Worth further analysis, but proceed cautiously.
Head iterated OK in auto
mode.
Estimated project payback in years 12.0
Turbine type selected by program.Horizontal axis, 2 jet, 1runner impulse
turbine.
Total project cost, including interest during
construction, $M.$33.4
% of directcost
Change % to
suit, based on
estimated
costs in
Column F
Summary of program output.
END OF DATA INPUT

7
OUTPUT STARTS WITH A COVER PAGE
Cost from intake to high voltage end of transmission line, including interest.
Powerplant average annual generation, GWh.
42.34
Power conduit and powerhouse generation, costs and dimensions developed with
$33.3
CAN $
BAKER - CHIPMUNK CREEK
12-Nov-08
HydroHelp 3 Impulse
An EXCEL program for optimizing hydro powerhouse capacity and conduit size.
Powerplant output at rated head and flow, MW.
9.8

8
FOLLOWED BY A SUMMARY PAGE
BAKER - CHIPMUNK CREEK Date -- 12-Nov-08
6 Project parameters determined by program.
7 Turbine output at rated head and flow, MW. 5.13
8 Powerplant output at rated head and flow, MW. 9.83
9 Turbine rated net head, m. 454.86
10 Conduit average diameter, m. 0.922
11 Powerplant average annual generation, GWh. 42.3
12 Estimated cost, in millions of dollars. $33.3 CAN $1314 Summary of input data for project.
15 Number of turbines and flow in m3. 2 Flow, m3 2.60
16 Access road and transmission lengths, km. 1.2
17 Headpond full supply level, m. (FSL) 847.30 LSL = 844.00
18 Normal tailwater level at powerhouse, m. 317.00 Trans. km. 1
19 Number of water conduits to powerhouse. 1 Length to head20 Conduit length, intake to powerhouse, m. 4,823 ratio ------ > 10.6
2122 Summary of program output for some parameters. Powerplant utilization
23 Overburden excavation, cubic meters. 28,907 factor, % 46.0
24 Rock tunnel excavation, cubic meters. 0 Rock Ex. m3. 5,459
25 Steel penstock and tunnel liner weight, tonnes. 689 Turbine runner outside
26 Total concrete volume, cubic meters. 2,630 diameter, m. 1.19
27 Turbine type selected by program.28
29Turbine type eliminated from consideration during
operation of program.30 Powerhouse footprint, width and length, m. 8.1 Length, m 22.4
31 Overall turbine + generator + transformer + conduit efficiency at full load, %. 71.07
32 Average overall project efficiency, excluding transmission, for energy calc. % 78.76
33 Head loss in conduit as a % of rated net head on turbine --------- > 14.98 Comment
34 Speed regulation on an isolated system. Absolutely no speed regulation capability.
35 Estimated time required for construction, months. -------------------------------------- > 14
3637 Data input and options selected during data input, may vary for each alternative.
38 Surge tank on conduit. No Diam., m. 0.00
39 Turbine equipped with inlet valve. Yes Diam., m. 0.395
40 Conduit optimization option. By program
4142 Fixed options for design of all alternatives of powerplant and conduit.
43 Currency, Canadian $ = 1, USA $ = 2. -------------------------------- 144 Industrial design (1) or Utility design (2) -------------------------------- 1 Comment
45 Industrial generator (1) or utility generator (2). ---------------------- 1
46 De-sander required at intake, yes = 1, no = 0. --------------------- 047 Dam design for extreme flood, no = 1, yes = 2. ------------------- 1
Page 1.
None.
An EXCEL program for optimizing hydro powerhouse capacity and conduit size.
Executive summary
HydroHelp 3 Impulse
Horizontal axis, 2 jet, 1runner impulse
turbine.

9
THERE ARE 22 PAGES OF DETAILED OUTPUT
2
3 Input data4 Total powerplant flow, m3/s. = 2.60 Comment
5 Desired number of units in powerplant. = 2.00 Comment6 Rated head ( Iterate to = F6 ), m. =454.86 Calc head = 454.86
7 System frequency, Hz. = 60.00 Comment
8 Generator power factor. (Range 0.9 to 1.0) = 0.90 Comment9 Generator inertia ratio to normal, "J". 1.00 Comment
10 Estimated powerplant utilization factor. 0.46
11 Normal tailwater elevation m. 317.0012 Powerhouse flood tailwater level, m. 322.00
13 Average rock level at powerhouse, m. 325.00 --------- Must be > 323.914
1516
17
18 TOTAL POWERPLANT RATED OUTPUT, MW. 9.819 Rated flow per unit ( cubic meters / sec. ) 1.30
20 Number of runners per unit 1.00 Runner CL El. 323.19
21 # jets per turbine 2.00 Draft tube22 System frequency ( Hz ) 60.00 sill Elev. 320.13
23 Calculated flow per jet, cubic meters/sec. 0.6524 Turbo-generator shaft alignment. HORIZONTAL Runaway
25 Calculated synchronous rotational speed ( rpm ) 900.00 speed, rpm = 1620
26 Turbine inlet spherical valve diameter, m. 0.40 Unit spacing, m. 8.5627 Calculated runner pitch circle diameter ( m ) 0.93 0.00
28 Calculated outside runner diameter ( m ) 1.19
29 Calculated jet diameter ( m ) 0.09 0.0030 Calculated peak efficiency, all jets operating, %. 0.89
31 Peak efficiency flow/jet. m3/s. 0.9832 Peak efficiency flow as % of full load flow. 75.00
33 Turbine full load efficiency, % 88.51
34 Calculated turbine full load output ( MW ) 5.1335 Calculated generator full load efficiency, %. 95.78
36 Calculated generator full load output ( MW ) 4.92
37 Calculated water to wire cost, excluding substation, millions. 6.1138
39 GENERATOR DATA40 Generator inertia, metric GD2. 7.48 Tonnes meters squared.41 Generator inertia, Imperial WR2. 44,373 Pounds feet squared.
42 Generator electrical "H" value. 1.52 kW-secs/kVA
43 Generator MVA 5.4644 Mechanical start time for unit, secs. ( Tm.) 3.38
45 Generator full load efficiency, % 0.964
46 Generator speed, rpm. 900.047 Page 2
Absolutely no speed
regulation capability.
BAKER - CHIPMUNK CREEK
RECOMMENDED TURBINE
Horizontal axis, 2 jet, 1runner impulse turbine.
TURBINE SELECTION

10
48 BAKER - CHIPMUNK CREEK # of units 2
49
5051 Powerhouse crane capacity, tonnes. 20.86 # of cranes 1
52 Powerhouse crane span, with crane over valve, m. 7.42
53 Powerhouse length, m. 22.4054 Powerhouse width, m. 8.14 Walls, m2 401
55 Powerhouse height, repair bay floor to roof, m. 6.57 Roof, m2. 182
56 Powerhouse roof elevation, m. 329.0757 Powerhouse concrete volume, m3. 265.78 PH Vol, m3. 1198
58 Powerhouse formwork, m2. 318.9459 Powerhouse structural steel weight, tonnes. 53.41
60 Powerhouse repair bay floor level, m. 322.50
61 Distance between unit centerlines, m. 8.56
6263 Comment on water to wire cost estimate. Total W/W Total generator Peak turbine64 Turbine axis, jet and runner configuration. Cost US$m. capacity, MW efficiency65 Comment Comment
66 Horiz. axis, 1 jet, 1 runner impulse turbine. 9.420 9.879 0.895
67 Combination of capacity, head and flow is suitable for this type of turbine. Reject68 Horiz. axis, 2 jet, 1runner impulse turbine. 6.114 9.833 0.890
69 Combination of capacity, head and flow is suitable for this type of turbine. SELECT70 Horiz. axis, 1 jet/r, 2 run. impulse turbine. 7.405 11.744 0.899
71 Combination of capacity, head and flow is suitable for this type of turbine. Reject
72 Comment73 Horiz. axis, 2 jet/r, 2 run. impulse turbine. 0.000 9.976 0.903
74 Combination of capacity, head and flow NOT suitable for this type of turbine. Reject
75 Vert. axis, 1 jet, 1 runner impulse turbine. 0.000 9.862 0.89376 Combination of capacity, head and flow NOT suitable for this type of turbine. Reject
77 Vert. axis, 2 jet, 1 runner impulse turbine. 7.657 9.854 0.89278 Combination of capacity, head and flow is suitable for this type of turbine. Reject
79 Vert. axis, 3 jet, 1 runner impulse turbine. 7.800 11.900 0.911
80 Combination of capacity, head and flow is suitable for this type of turbine. Reject81 Vert. axis, 4 jet, 1 runner impulse turbine. 0.000 9.992 0.912
82 Combination of capacity, head and flow NOT suitable for this type of turbine. Reject83 Vert. axis, 5 jet, 1 run. impulse turbine. 0.000 9.982 0.911
84 Combination of capacity, head and flow NOT suitable for this type of turbine. Reject
85 Vert. axis, 6 jet, 1 run. impulse turbine. 0.000 9.975 0.91086 Combination of capacity, head and flow NOT suitable for this type of turbine. Reject
87 Horiz. axis, 1 jet, 1 turgo runer turbine. 0.000 8.309 0.85488 Combination of capacity, head and flow NOT suitable for this type of turbine. Reject
89 Horiz. axis, 2 jet, 1 turgo runner turbine. 0.000 9.517 0.803
90 Combination of capacity, head and flow NOT suitable for this type of turbine. Reject91 Horiz. axis BANKI (Ossberger) turbine. 0.000 97.369 0.586
92 Combination of capacity, head and flow NOT suitable for this type of turbine. Reject93 Comment
94 Vertical axis Francis turbine. 0.000 10.168 0.912
95 Combination of capacity, head and flow NOT suitable for this type of turbine. -----------------96
97 Page 3
Powerhouse and crane data.

11
9899
100
101102
103104
105 Turbine type Suitability
106 Horiz. axis, 1 jet, 1 runner impulse turbine. ----YES ---- 1107 Horiz. axis, 2 jet, 1runner impulse turbine. ----YES ---- 1
108 Horiz. axis, 1 jet, 2 runner impulse turbine. ----YES ---- 1109 Horiz. axis, 2 jet/r, 2 run. impulse turbine. -------------- 1
110 Vert. axis, 1 jet, 1 runner impulse turbine. -------------- 1
111 Vert. axis, 2 jet, 1 runner impulse turbine. ----YES ---- 1112 Vert. axis, 3 jet, 1 runner impulse turbine. ----YES ---- 1
113 Vert. axis, 4 jet, 1 runner impulse turbine. -------------- 1114 Vert. axis, 5 jet, 1 run. impulse turbine. -------------- 1
115 Vert. axis, 6 jet, 1 run. impulse turbine. -------------- 1
116 Horiz. axis, 1 jet, 1 turgo runer turbine. -------------- 1117 Horiz. axis, 2 jet, 1 turgo runner turbine. -------------- 1
118 Horiz. axis BANKI (Ossberger) turbine. -------------- 1119
120
121122 Selected Selected
123 LV/gHTe Tm/Te
124 Deflector close 2.09 1.69125 Valve open 0.24 0.19
126127
128
129130
131132
133
134135 Overall project efficiency 78.76
136137 20 9.27 83.4
138 30 9.25 83.3
139 40 9.17 82.5140 50 8.99 80.9
141 60 8.84 79.6142 70 8.67 78.0
143 80 8.45 76.1
144 90 8.20 73.8145 100 7.92 71.2
146 0 0.000
147 0 0.000148 Page 4
BAKER - CHIPMUNK CREEK
If the recommended turbine is not satisfactory, a second recommendation (based on cost) can be
obtained by eliminating the recommended turbine from consideration with a zero (0) placed oppositethe recommended turbine in Column D. Suitable turbines are shown in Column E
SPEED REGULATION CHARACTERISTIC
0.0
0.2
0.4
0.6
0.8
0.0 0.5 1.0 1.5 2.0 2.5 3.0
Mechanical start time / governor timePensto
ckst
art
tim
e/go
vern
or
tim
e
Good above 1.0, poor below.
.
Rapid load off with
deflector, slow load onwith spear valves.
OVERALL PROJECT EFFICIENCY
60
70
80
90
20 30 40 50 60 70 80 90 100
FLOW RATIO %
EFF
ICIE
NC
Y%

12
149
150 Powerhouse plan dimensions.151 Total length, m. 22.40
152 Full width including piping and control rooms, m. 8.14
153 Length of repair bay, m. 4.28154 Distance between unit centerlines, m. 8.56
155 Powerhouse height, above repair bay floor, m. 13.51
156 Vertical axis unit Crane span. 0.00 0.00
157 Crane capacity in tonnes. 0.0
158159 0.00
160 0.00
161 El.162 0.00
163
164 0.00 0.00165
166 El. 0.00167
168 0.00
169 Repair170 bay floor
171 0.00 El. 0.00172
173 0.00
174 El. 0.00175
176 Flood TWL177 elevation
178 0.00
179 322.71180 TWL. El, m.
181 0.00182
183 0.00
184 0.000185 0.00
186
187188 Runner removal passage width, m. 0.00
189190
191
192193 Powerhouse superstructure perimeter, m. 61.08
194 Powerhouse wall area, m2. 825195 Powerhouse roof area, m2. 182
196 Powerhouse clearing, Ha. 0.2
197198
199 Page 5
BAKER - CHIPMUNK CREEK
Note - Impulse units MUST be set above flood level. They cannot operate submerged, unless
tailwater depressed by compressed air, and this is very expensive due to high demand for air.
Air demand is high due to loss from enrtainment as water falls off runner.
Unit shaft alignment is
HORIZONTAL
As selected by program.
oTop ofgenerator
Valve diameter, m.

13
200
201202
203 Crane capacity in tonnes. 21.9
204 1.63
205 3.07
206 El., m. 336.44
207208 7.14
209 4.49
210 8.14
211 4.02212 El., m. 323.19
213214 6.19 El., m. 322.93
215
216217 Flood TWL
218 m. 322.00219
220 El., m. 317.00
221222 El., m. 320.13
223
224225 Valve diameter, m. 0.40
226 Turbine runner pitch circle diameter, m. 0.935227
228 Site access and transmission. Comment
229 Access road length, km. 1.2 Cost, $M. 1.018
230 Access road difficulty factor. 1.3231
232 Local access road length, km. 8 Cost, $M. 6.805
233 Local accsss difficulty factor. 1.5234
235 Temporary steel pile bridge over river, total length, m. 0 Cost, $M. 0.000236
237 Transmission line length, km. 1 Transmission kV 24
238 Transmission line difficulty factor. 2 Cost, $M. 0.415239
240 Local transmission to intake, length, km.. 6 Local Trans kV 4241 Local transmission to intake, difficulty factor. 2 Cost, $M. 0.895
242
243 Calculated switchyard cost $M 0.124
Page 6
BAKER - CHIPMUNK CREEK
Horizontal axis unit.
Crane span

14
If there are side stream intakes, ratio of flows to main intake flow. 0 Comment
Main Dam.7 Design maximum (1/1000) flood flow, m3/s. 300 Deck level, m. 847.60
8 Design weir flood (1/200) flow, m3/s. 3009 Required height of dam to accommodate low level sluice below trashracks, m. 7.70
10 Crest length between abutments at damsite, m. 100 Comment 81.111 River bed level, m. 840
12 Low level sluice capacity, m3/s. 2.6 Comment
13 Spillway sill level, m. 845.0014 Required depth of spill over weir, m. 2.30 Comment
15 Required number of inflatable rubber dams 2 Comment16
17 Inflatable rubber Dam.18 Selected flood for weir design, m3/s. 300 From cover, line 4719 Length of one rubber dam, including sloped section, m. 34.8 Maximum ----- > 45.1920 Rubber dam cost, installed. $millions. 0.78321
22 Concrete weir. Coefficient of discharge = 1.4 Total crest length, dams23 Length of flat weir crest (upstream-downstream) , m. 12.8 and weirs, m. 10124 Low level sluice sill elev. Top just at trashrack sill, m. 840.20
25 Low level sluice width and height, m. 0.5 Height, m 0.6
26 Total length of spillway including end piers, m. 7627 Total length of weir and intake, between abutments, m. 81.1
28 Concrete volume, m3. 224029 Normal flood level for 1/200 flood, m. 847.3
30 Approximate extreme flood level, 1/1000 flood. 847.3 2.3
3132 De-sander design.33 Design flow, m3/s. 2.600 Head loss, m. 0.7134 Basin volume ratio. 160 Iterate until
35 Basin volume, m3. 416
36 Basin water depth, m. (semi-circular basin section) 2.2 Must be < 3.437 Basin length, m. 43.6 Basin width, m. 4.4
38 Design particle size, range 0.1mm to 0.4mm. 0.2539 Particle transit time, secs. 125 Clearing for desander,
40 Sander weir crest width upstream of trashracks, m. 3.1 Ha. ------------ > 0.09
41 Low level sluice from de-sander, width, height, m. 0.00 Height, m. 0.0042 Average depth of excavation at intake/weir, m. 0.1
43 Particle drop distance in basin, m. 3.444 Flow Velocity, m/s. 0.3
45 Part drop rate, m/s. 0.027
46 Concrete volume, m3. 047 Flow depth,m 0.7
48 Height, m= 0.00
49 Exc. vol, m3. 050 Page 7
BAKER - CHIPMUNK CREEK
Depth of flow overweir at extreme
flood, m. --- >
A desander is very
expensive. Would be located
downstream of dam.
Arrangement depends on
topograpy, and is not shown.
Dam weir, de-sanding chamber and access roads.

15
51 BAKER - CHIPMUNK CREEK Dam and weir
52 Schematic showing arrangement of dam, weir and low level sluice.
53 Elevation top of gate hoist tower, m. 851.67 Number rubber dams.
54 Extreme flood (1/1000) level, m. 847.30 2
55 Total length spillway including piers, m. 75.67 Dam crest elevation, m.56 847.60
57 Flood level, m.58 847.30 Rubber dam crest elevation, m.
59 847.30
60 Full supply61 level, m. Rubber dam sill elevation, m.
62 847.30 845.00
63 Low supply64 level, m. 34.8
65 844.00 2.3066 Trashrack 30.23
67 top elev, m.
68 842.45 Low level outlet gate top, m.69 1.55 840.76
70 Trashrack71 sill level, m. Low level outlet gate sill, m.
72 840.76 840.20
73 0.5774 Right angle at blue line. Expanded elevation to show intake at right angle to dam-weir centerline.
75
76 Total length of desander basin, m. 87.2 Width, m. 5.3
77
78
79
80
81
82
83
8485
8687
88 43.6
89 Number of desander basins. 190
91 Radius R, m. Nominal wall thickness, m. 0.4892 2.2
93 Concrete area in section, m2 7.63
9495 Concrete volume in desander,
96 cubic meters. 66697
98 De-sander required at intake. No
99100 Page 8
Plan typical double desander. If industrial design, 1
basin, if utility design, there should be 2 basins.
2m
Active settling
length.
Typical section through
desander. Section B - B

16
BAKER - CHIPMUNK CREEK MAIN DAM
Dam design.Flood level at dam, meters. 847.30
5 Normal full supply level at trashracks, m. 847.30
6 Normal low supply level at trashracks, m. 844.007 Normal tailwater level at dam, m. 840.00 Must be > 317.00
8 Design acceleration for earthquake, g. 0.25 = 1/1000 DBE9 River or lowest ground level at dam, m. 840.00
10 Embankment material factor for dam stability 1.20 Comment
11 Foundation material factor for dam stability 1.20 Comment12 Dam type - rock fill central core (1) or homogeneous (2) 2 Comment
13 Dam crest elevation, m. 848.97 Dam downstream14 Dam slope (x)/1 Upstream. x = 2.14 slope (x)/1 1.64
15 Dam height, crest to river/lowest bed level, m. =8.97 Crest
16 Dam base width at river level, m. 38 width, m. 5.317
18 Rip-rap design.
19 Effective fetch, km. 1 Comment20 Design wind speed, km/hour. 100 or m/sec = 27.8
21 Max. wave height, m. And period, secs. 1.1 Secs = 2.622 Wave length, m. And slope a/l 10.8 a/l = 0.11
23 Wave run-up on dam. 1.20
24 Minimum freeboard, m. 1.6725 Weight D50kg rip-rap and average size, Dm. D50kg = 144 Dm = 0.38
26 Rip-rap thickness (m). 0.727
28 Dam quantity calculation.
29 Dam crest length, m. 2030 River width, m. 5
31 Valley shape factor (0.5 to 1.0) 0.7 Comment32 Average depth of overburden excavation, m. 2
33 Length of cutoff excavation, m. 30
34 Average depth of cutoff to impervious material, m. 8 Comment35 Concrete or slurry wall length, m. 30 Comment
36 Maximum depth of concrete or slurry wall to impervious material, m. 837 Slurry wall valley shape factor (0.25 to 0.75). 0.5 Comment
38 Total embankment vol. above river bed level, m3 = 2,519 excluding cutoff
39 Rip-rap volume (m3) and average size, (m). 158 d50, m. 0.3840 Cutoff excavation and fill volume, m3. 4,725 Cutoff excavation
41 Compacted rock fill 189 slope = 1.4
42 Filter transition zone A 83 Filt. Zone B 8343 Rip - rap bedding gravel, m3. 79 Clearing for dam,
44 Till core 2,007 Hectares= 0.245 Foundation rock excavation for core contact, m3. 0 Overburden excavation
46 Dental concrete for core contact, m3. 6 vol, m3. 757
4748 Slurry or concrete cut-off wall. Elev. Top of wall, m. 842.00 Bottom El 834.00
49 Concrete or slurry wall area, m2. 120 Width, m. 0.6050 Concrete or slurry wall volume, m3. 72
51 Page 9
17
52 BAKER - CHIPMUNK CREEK MAIN DAM
5354 Crest elevation, m. 0.00 Width, m. 0.055 Upstream and downstream slopes Height, m. 0.0
56 0.00 0.00 Wall top El 842.0057 0.00 0.0 Wall bot El 834.005859
60
6162
63
6465
6667
68
6970
7172
73
74 Slurry wall option Cut-off depth, m. 0.075 Cut-off slope, x:1 = 0.076 0.0 <--Width at impervious contact, m.77
78 Crest elevation, m. 848.97 Width, m. 5.30
79 Upstream and downstream slopes Height, m. 8.9780 2.14 1.64 845.9881 842.86 5.3082
83
8485
86
8788
8990
91
9293
9495
96
9798 Slurry wall option. For level, see above. Cut-off depth, m. 8.099 8.5 <-- Width at impervious contact, m.
100 11.2 Height of rock fill toe, m. 2.99101
102 Page 10
Upstream cofferdam - option.Dam type 1 - rock fill with central core.
Dam type 2 ------------- homogeneousUpstream cofferdam option
not shown, see above.

18
BAKER - CHIPMUNK CREEK SIDE DAM # 1A
Dam design.Flood level at dam, meters. 847.30
5 Normal full supply level at trashracks, m. 847.306 Normal low supply level at trashracks, m. 844.00
7 Normal tailwater level at dam, m. 840.008 Design acceleration for earthquake, g. 0.25 = 1/1000 DBE
9 River or lowest ground level at dam, m. 840.00
10 Embankment material factor for dam stability 1.65 Comment11 Foundation material factor for dam stability 1.60 Comment
12 Dam type - rock fill central core (1) or homogeneous (2) 2 Comment
13 Dam crest elevation, m. 849.75 Dam downstream14 Dam slope (x)/1 Upstream. x = 2.84 slope (x)/1 2.34
15 Dam height, crest to river/lowest bed level, m. =9.75 Crest16 Dam base width at river level, m. 55 width, m. 5.4
17
18 Rip-rap design.19 Effective fetch, km. 3 Comment
20 Design wind speed, km/hour. 100 or m/sec = 27.821 Max. wave height, m. And period, secs. 1.9 Secs = 3.6
22 Wave length, m. And slope a/l 19.9 a/l = 0.10
23 Wave run-up on dam. 1.1224 Minimum freeboard, m. 2.45
25 Weight D50kg rip-rap and average size, Dm. D50kg = 507 Dm = 0.5826 Rip-rap thickness (m). 1.0
27
28 Dam quantity calculation.29 Dam crest length, m. 0
30 River width, m. 031 Valley shape factor (0.5 to 1.0) 0.5 Comment
32 Average depth of overburden excavation, m. 0
33 Length of cutoff excavation, m. 034 Average depth of cutoff to impervious material, m. 0 Comment
35 Concrete or slurry wall length, m. 0 Comment
36 Maximum depth of concrete or slurry wall to impervious material, m. 037 Slurry wall valley shape factor (0.25 to 0.75). 0.5 Comment
38 Total embankment vol. above river bed level, m3 = 0 excluding cutoff39 Rip-rap volume (m3) and average size, (m). 0 d50, m. 0.58
40 Cutoff excavation and fill volume, m3. 0 Cutoff excavation
41 Compacted rock fill 0 slope = 2.042 Filter transition zone A 0 Filt. Zone B 0
43 Rip - rap bedding gravel, m3. 0 Clearing for dam,44 Till core 0 Hectares= 0.0
45 Foundation rock excavation for core contact, m3. 0 Overburden excavation
46 Dental concrete for core contact, m3. 0 vol, m3. 047
48 Slurry or concrete cut-off wall. Elev. Top of wall, m. 0.00 Bottom El 0.0049 Concrete or slurry wall area, m2. 0 Width, m. 0.60
50 Concrete or slurry wall volume, m3. 0
51 Page 11
19
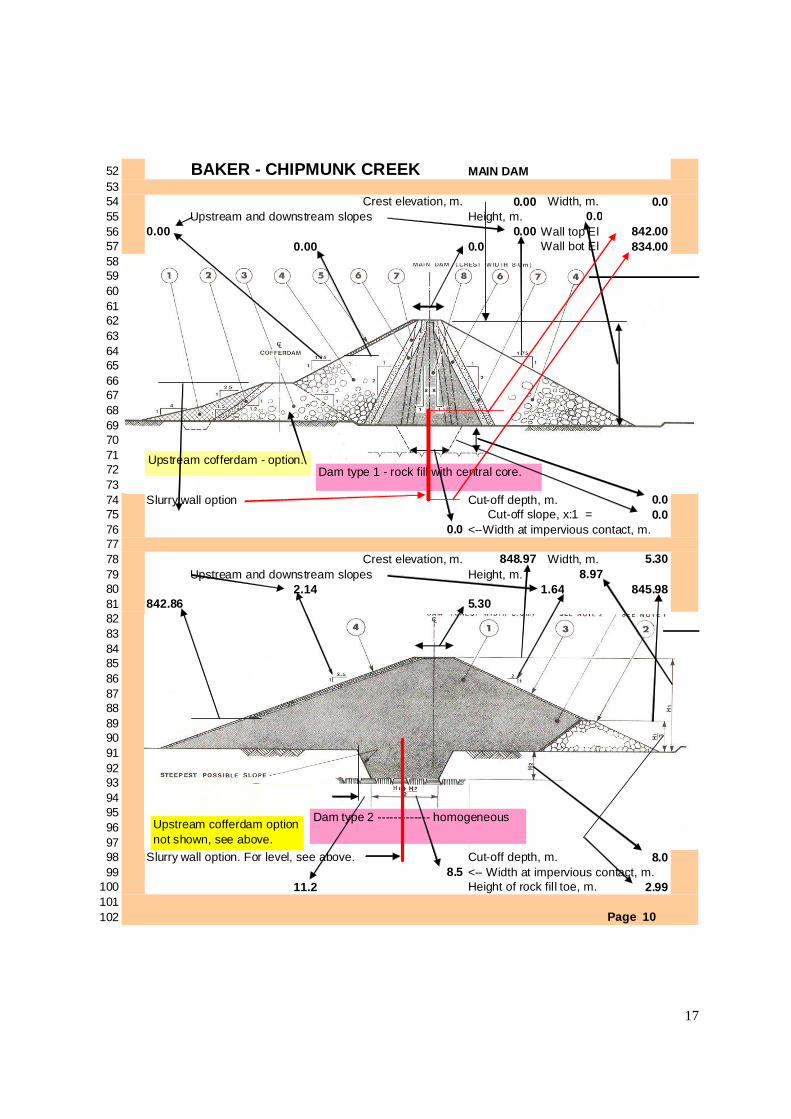
52 BAKER - CHIPMUNK CREEK SIDE DAM # 1A
5354 Crest elevation, m. 0.00 Width, m. 0.055 Upstream and downstream slopes Height, m. 0.0
56 0.00 0.00 Wall top El 0.0057 0.00 0.0 Wall bot El 0.005859
60
6162
63
6465
6667
68
6970
7172
73
74 Slurry wall option Cut-off depth, m. 0.075 380.13 Cut-off slope, x:1 = 0.076 0.0 <--Width at impervious contact, m.77
78 Crest elevation, m. 849.75 Width, m. 5.42
79 Upstream and downstream slopes Height, m. 9.7580 2.84 2.34 846.5081 842.09 5.4282
83
8485
86
8788
8990
91
9293
9495
96
9798 Slurry wall option. For level, see above. Cut-off depth, m. 0.099 4.9 <-- Width at impervious contact, m.
100 0.0 Height of rock fill toe, m. 3.25101
102 Page 12
Upstream cofferdam - option.Dam type 1 - rock fill with central core.
Dam type 2 ------------- homogeneousUpstream cofferdam option
not shown, see above.
Upstream cofferdam - option.Dam type 1 - rock fill with central core.
Dam type 2 ------------- homogeneousUpstream cofferdam option
not shown, see above.
Upstream cofferdam - option.Dam type 1 - rock fill with central core.
Dam type 2 ------------- homogeneousUpstream cofferdam option
not shown, see above.

20
2 Project hydraulics.
3 Flood level at dam, meters. 847.304 Normal full supply level at trashracks, m. 847.30
5 Low supply level at trashracks, m. 844.006 Design reservoir level for turbine rating, m. 846.2
7 Number of conduits intake to powerhouse. 1 L/H ratio = 10.6
8 Number of turbines on each conduit. 2 L = Total conduit length, m.9 Calculated rated flow per conduit, m3/s. 2.60 H = turbine rated head, m.
10 Automatic (1) or manual (2) optimization. 1 Comment11 Target automatic conduit head loss ratio % 15.85 Comment
12 Calculated head loss % 14.98 Comment
13 Calculated average diam of upstream and downstream steel pipes, m. 0.89 Comment14 Select pipe diam (m) for manual optimization. 10.000 Comment. <<< NOTE15 Program nominal pipe diam for manual optimize, m. 10.000 Penst. Diam,m 8.0016 Penstock steel ultimate strength, Mpa. 482.5 Comment
17 Penstock steel yield strength, Mpa. 344.7
18 Calculated conduit head loss at rated flow, meters. 68.2 Comment19 Rated net head (m) - must equal calc. net head. =454.86 <--- iterated cell.20 Calculated net head on turbine, m. 454.86 Comment21
22 Intake. ooooooooooooooooooooooooooooooooo23 Length of intake channel, meters. 5.0 Intake channel clearing,24 Average level of rock at intake, meters. 842.0 Ha. ----- > 0.01
25 Average depth of overburden excavation at intake, meters. 2.0
26 Intake and channel overburden excavation, m3. 6527 Intake and channel rock excavation volume. m3. 13
28 Intake gate width and height, meters. Width = 1.021 Gate height 1.27629 Head on intake gate to mid-point, m. 6.535 Intake deck
30 Intake gate flow velocity, m/sec. 2.00 elevation, m. 847.60
31 Submergence to top of intake gate, meters. 0.9932 Intake gate sill elevation, meters. (maximum elev.) 840.76
33 Bulkhead gate width and height, m. Width = 1.123 Gate height 1.53134 Head on bulkhead gate, to mid-point, m. 6.535
35 Water cleanliness factor. ( 0.5 to 1.0 ) 0.90 Comment
36 Percentage of reservoir cleared. ( 10% to 100% ) 037 Trashrack gross flow velocity, m/sec. 1.00 Intake clearing,
38 Trashrack area, square meters. 2.60 Ha ------- > 0.0139 Trashrack height, meters. 1.68
40 Total trashrack width, meters. Per intake. 1.55 Comment
41 Trashrack width between piers, meters. 1.55 Clear spacing between rack42 Total trashrack weight, kg, all intakes. 398 bars, mm. = 19
43 Maximum unsupported bar length, meters. 0.593 Comment44 Approach flow angle to racks. (45 to 0 degrees) 10 Comment
45 Rack inclination to horizontal. (60 to 90 deg. ) 80 Comment
46 Rack blockage ratio. ( 0.0 to 0.25) 0.2 Comment47 Head loss through racks, meters. 0.97 Trashrack sill
48 Head loss through intake, meters. 0.03 elevation, m. 840.76
49 Intake height, gate sill to deck, m. 7.5450 Total intake(s) concrete volume, cubic meters. 114
51 Page 13
BAKER - CHIPMUNK CREEK

21
52 BAKER - CHIPMUNK CREEK53 Side stream total cost, included in intake and equipment costs. 0.00054
55 Conduit intake to surge tank. ooooooooooooooooooooooooooooooooo56 Intake pipeline concrete encased length, m. 5 Note - pipeline steel cost57 Pipeline on surface (1) or buried (2). 2 has been reduced to58 Pipe length in rock sidehill, m. 1100 72 % based on59 Pipe length in earth sidehill, m. 2580 use of some Sclairpipe.
60 Elevation of end of pipeline, m. 66061 Total pipeline length, meters. 3685 Comment Pipe vel, m/s.
62 Pipeline diameter, meters. 0.974 Comment 3.4963 Pipeline steel thickness, millimeters. 7.0 Comment
64 Pipeline(s) steel weight, kg. 468,838
65 Pipeline(s) total conc casing pier+anchor volume, m3. 466 Length of Sclairpipe used instead of steel, m. 2,031
67 Average sidehill slope in rock, hor. to 1 vert. 2.1 Comment68 Average sidehill earth slope, horiz. to 1 vert. 2.3 Comment
69 Sideslope roughness factor. (1.5 to 3.0) 1.5 Comment
70 Rock excavation for pipeline(s), m3. 2,590 Slope fact= 0.5471 Overburden excavation for pipeline(s), m3. 20,040 Slope fact= 0.77
72 Pipeline and penstock clearing width. Pipe, m. 5 Penstock, m. 373 Pipeline and penstock(s) clearing hectares. 48.2
74
75 Low pressure tunnel size and cost calculation. ooooooooooooooooooooooooooooooooo76 Low pressure tunnel length, m. 0 Adit L, m = 0
77 Tunnel rock diameter, m. 2.400
78 Ratio of length tunnel lined with concrete. 1 Conc lined 079 Length of tunnel lined with steel, m. 0
80 Tunnel(s) excavation volume, including adit, m3. 0 Adit vol m3= 081 Tunnel(s) concrete lining volume incl. Adit plug, m3. 0 Adit plug m3 0
82 Tunnel lined section diameter, m. 1.824
83 Liner min. thickness for buckling/handling, mm. 8.2 Steel liner, kg. 084
85 Surge tank size and cost calculation. ooooooooooooooooooooooooooooooooo86 Surge tank used, (1), not used (0). 0 Comment
87 Design acceleration for earthquake, g. 0.25 = 1/1000 DBE
88 Surge tank in steel =1, in rock exc. = 2 289 If in rock, conc lining (1), no lining, (0) 1
90 Elevation rock at top of tank, if in rock, m. 800 Comment91 Elevation of surge tank tee, or conduit "knee", m. 710 Comment IMPORTANT92 Tank diameter based on min for stability (1), or larger, (2) 2
93 Tank min. diam for stability, m. 0.8 Tank cost $M 0.00094 If tank diameter is larger, select diameter, m. 3.0 Comment
95 Turbine rated head, m. 454.9 NOTE96 Upstream conduit length, meters. 3685
97 Acceleration head loss to tank, m. 47.98 Surge in tank as a % of
98 Retardation head loss to tank, m. 32.85 turbine head 0.099 Elevation of top of tank, meters. 848.3 Should be less than 8%.
100 Elevation of bottom of tank, meters. 749.8 Preferably less than 5%.
101 Tank height, top to bottom, and T to roof, meters. 98.5 T to roof, m= 138.3
102 Page 14
PVC pipe is suitable for this
application.

22
103 BAKER - CHIPMUNK CREEK
104 Conduit surge tank to powerhouse. ooooooooooooooooooooooooooooooooo105 Vertical bore size and quantity calculation.106 Bore length, m. 0 Bore diam, m. 1.171107 Ratio of length bore lined with concrete. 0
108 Bore excavation volume, m3. 0 Bore lined section
109 Bore concrete lining volume, m3. 0 diameter, m. 0.890110
111 High pressure tunnel. ooooooooooooooooooooooooooooooooo112 Total high pressure tunnel length, m. 0
113 Adit L, m = 0
114 Tunnel diameter, m. 2.300115 Ratio of length tunnel lined with concrete. 1
116 Tunnel excavation volume, including adit, m3. 0 Adit vol m3= 0117 Tunnel concrete lining volume incl. adit plug, m3. 0 Adit plug m3 0
118 Tunnel concrete lined section diameter, m. 1.748
119 Tunnel steel lined section length, m. 0 Tunnel d. m 2.748120 Calc. liner thickness ups. end for buckling, mm. 15.1 Liner d. m.= 1.748
121 Tunnel lined section excavation volume, m3. 0
122 Concrete around liner, m3. 0 Steel liner kg. 0123
124 Buried steel Penstock. ooooooooooooooooooooooooooooooooo125 Elevation at upper end of liner/penstock, m. 660.00
126 Penstock length and sideslope in rock cut, m. 569.00
127 Penstock length and sideslope in earth cut, m. 569.00128 Average sidehill slope in rock, hor. to 1 vert. 10.00 Slope fact= 0.1
129 Average sidehill earth slope, horiz. to 1 vert. 10.00 Slope fact= 0.1130 Sideslope roughness factor. (1.5 to 3.0) 1.50 Comment
131 Penstock rock excavation, m3. 724 Earth exc, m3. 1,358
132 Surface steel penstock. ooooooooooooooooooooooooooooooooo133 Surface penstock length, m. 0
134 Earth overburden average depth of cut, m. 1135 Average excavation depth in rock, m. 2
136 Penstock rock excavation, m3. 0 Earth exc, m3. 0
137 Conc. anchor & ring girder pier volume, m3. Anchor = 0 Pier vol, m3 0138 Penstock data. ooooooooooooooooooooooooooooooooo139 Total penstock/tunnel liner length, meters. 1,138 Comment140 Penstock diameter, meters. 0.798
141 Maximum penstock steel thickness, millimeters. 11.9 Comment
142 Penstock steel weight, kg. 220,148143
144 Tailrace. ooooooooooooooooooooooooooooooooo
145 Tailrace channel length, meters. 50 Tailrace channel invert146 Tailrace ch. rock level at powerhouse DT exit, m. 325 level, m. = 322.33
147 Tailrace channel average overburden depth, m. 5 Flow depth 0.86148 Tailrace channel overburden excavation volume, m3. 3,222
149 Tailrace rock excavation volume, m3. 177
150 Tailrace Manning friction factor. 0.032151 Approximate head loss in tailrace channel, m. 0.36 Note - not in conduit losses.
152153 Number of side stream crossings over penstock. 0
Page 15

23
154 Dam and spillway.155 Minimum elevation top of hoisthouse, m. 851.67
156 Flood level, m. Deck level, m.157 847.30 847.60
158 Total height of159 Full supply concrete intake
160 level, m. rock to deck, m
161 847.30 7.59162 Low supply
163 level, m. Intake gate164 844.00 lintel elev, m.
165 Rack top, m. 842.04
166 842.45167 Rack height, m. Intake gate
168 1.68 sill elev, m,.169 Stoplog height, m. 840.76
170 1.53
171 Gate height, m.172 1.28
173 Rack sill elev, m.174 840.76
175
176177 Section elevation through center of intake and pipe.178
179 Rack width, m. 1.55180 Tunnel or
181 Stoplog width, m. 1.12 pipe diam, m.182 0.974
183 Gate width, m. 1.02
184185
186187 Total rack width 1.55
188 Plan through intake at pipe level A - A
189190 Minimum distance racks to Deck width, m. 2.88 (minimum)
191 gate, m. 2.50 Deck length, m 3.95 (minimum)192 Pier width, m. 0.00
193
194195
196197
198
199200
201
202203
204 Page 16
BAKER - CHIPMUNK CREEK
Plan at deck level C - CPlan section B - B

24
205 BAKER - CHIPMUNK CREEK
206
207 Surge tank dimensions. 0.0208 El, m. Surge tank diameter, m. 0.00 m. Tank top, m.
209 0.0 El, m. 0.0
210
211 FSL Surge rise, m.212 El, m. 0.0
213 0.0214 Friction drop, m.
215 LSL 0.0
216 El, m.217 0.0 Surge drop, m.
218 0.0219
220 Tank bottom, m.
221 El, m. 0.0222
223 Upstream Riser diam, m.
224 conduit length, m. 0.0225 0
226 Level surge227 tank T, m.
228 0.0
229230
231 Penstock and conduit hydraulics.232 Allowable waterhammer at turbine on valve closure, %. 15
233 Upstream pipeline or tunnel LV, m2/s. 3588
234 Penstock pipe or tunnel LV, m2/s. 5917 Surge tank used on235 Average velocity in conduit intake to turbine, m/s. 3.89 conduit ---------- >No236 Valve times in seconds. Close (total) --> 130.4 Open (total) --- >29.1237
238 Top of tank or Maximum waterhammer
239 FSL at dam. level at turbine, m.240 0.0 925.92
241 Bottom of tank or Max waterhammer head, m.242 LSL at dam. 602.73
243 0.0
244 Minimum waterhammer245 level at turbine, m.
246 670.53
247 Min waterhammer head, m.248 347.34
249250 Turbine inlet elevation, m.
251 323.19
252 Maximum tailwater elev, m.253 322.00
Page 17
Surge tank height, from
pipe/riser "T" to roof, m.
Schematic
showing
waterhammer
conditions on
penstock or
pipeline.
Negative waterhammergradient

25
BAKER - CHIPMUNK CREEK
5 Frost days at site, from a world Atlas. 120 Frost factor. 0.72
6 Union (2) or non-union (1) labour at site. 1 Labor factor. 1.007 Site installation work cost factor ---------> 0.72
89
10 Gates, gantries, monorail hoists, stoplogs,1112 0.413
14 Spillway stoplogs for gate adjacent to intake. Width, = 0.45 Height, = 0.5715 Number of openings. 1 W^2Hh = 0
16 Sets of stoplogs. 0 Monorail hoists. 017 Hoist capacity, tonnes. 0.500 Gantries. 0
18 Supply. Install.
19 Stoplogs. 0.000 0.00020 Guides. 0.000 0.000
21 Hoist. 0.000 0.00022 Total. 0.000 0.000
23 Total cost of spillway stoplog equipment. 0.000
2425 Spillway gate - adjacent to intake. Width, = 0.45 Height, = 0.57
26 Number of openings. 1 W^2Hh = 0.032834927 Type of gate, flat roller (1) tainter (2) 0
28 Supply. Install.
29 Gates guides and hoists. 0.000 0.00030 Total cost of spillway gate equipment. 0.0003132 Intake stoplogs or bulkhead gates. Width = 1.123 Height = 1.531
33 Number of openings. 1
34 Head to sill for stoplogs/bulkhead. 6.535 W^2Hh = 1335 Sets of bulkhead gates. 1 Monorail hoists. 0
36 Sets of stoplogs. 0 Gantries. 0
37 Hoist capacity for bulkheads. 3.3 Hoist cap. for stoplogs. 0.038 Supply. Install.
39 Stoplogs or bulkhead gates. 0.010 0.00140 Guides. 0.000 0.000
41 Hoist. 0.000 0.000
42 Total. 0.010 0.00143 Total cost of intake stoplog and/or bulkhead gate equipment. 0.0114445 Intake gates, guides and hoists. Width, = 1.021 Height, = 1.276
46 Number of openings. 1 W^2Hh = 9
47 Head to sill. 6.53548 Hoist on tower (1) or on deck (0) 0
49 Supply. Install.
50 Total cost of intake gate equipment. 0.013 0.003
51 Total cost of intake gate guides and hoist equipment. 0.01652 Page 18
If there are side stream intakes, sum of ratio of flows to main intake
Mechanical equipment cost.

26
53 BAKER - CHIPMUNK CREEK54 Powerhouse crane. Number of cranes. 1
55 Capacity of main hook. 21 Nominal capacity = 21.956 Capacity of auxiliary hook. 2.1
57 Span. 7.4 WL1.5 = 443
58 Supply. Install.59 Total. 0.231 0.017
60 Total cost of powerhouse crane. 0.24861
62 Trashracks. Width = 1.546 Height = 1.68
63 Number of openings. 1 WH = 364 Height to sill 7.54 W2Hh = 27
65 Type of racks, sectioned (2) or single (1). 2 Wt. factor 1
66 Estimated weight of racks in tonnes. 0.467 Supply. Install.
68 Total. 0.003 0.00069 Total cost of trashrack equipment. 0.003
70
71 De-sander sluice gate.72 Low level outlet gates. Width, = 0.00 Height, = 0.00
73 Head to sill. 3.27 W^2Hh = 0.0074 Supply. Install.75 Total. 0.000 0.000
76 Total cost of low level outlet gate equipment. 0.00077
78 Powerhouse ancillary mechanical and electrical systems.79 Rated flow per unit, m3/s. 1.30 Number of units. 2
80 Generator rated MVA. 5.5 Generator rpm. 900.0
81 Supply. Install.82 Dewatering pumps and piping. 0.000 0.000
83 Cooling water pumps, filters and piping. 0.024 0.01184 Compressed air, 100psi. 0.020 0.009
85 Heating, ventilating, lighting. 0.011 0.009
86 Total. 0.045 0.01987 Total powerhouse ancilliary mechanical systems. 0.06488
8990
9192 In millions of CAN $
93 Total cost of spillway stoplog equipment. 0.000
94 Total cost of spillway gate equipment. 0.00195 Total cost of trashrack equipment. 0.00496 Total cost of intake stoplog and/or bulkhead gate equipment. 0.01597 Total cost of intake gate guides and hoist equipment. 0.022
98 Total cost of low level de-sander gate. 0.000
99 Total cost of powerhouse crane. 0.248100 Total powerhouse ancilliary mechanical systems. 0.064101 Total cost of major mechanical equipment,102 except turbines.----- ---------------------------------------------> $0.353
103
104 Page 19
Cost of major mechanical equipment, summary.

27
Work item. Unit cost.Estimated
quantity.
Earthwork and clearing. Comment
10 Clearing, per hectare, $/H $7,404.09 48.6 $7,404.0911 Unit cost of overburden excavation, m3. $13.04 7,509 $13.0412 Unit cost of rock excavation, $/m3. $52.17 2,145 $52.1713 Unit cost of found excav in sand or gravel for cutoff, $/m3. $31.95 4,725 $31.9514 Rock excavation in tunnels, $/m3. $0.00 0 $0.0015 Impervious fill in cofferdams, $/m3. $0.00 0 $0.00
16 Rock fill in cofferdams, $/m3. $73.85 189 $73.8517 Impervious fill in dams, $/m3. $33.43 2,007 $33.4318 Filter material in dams, $/m3. $44.16 244 $44.1619 Rock or embankment material in dams, $/m3. $58.81 189 $58.8120 Rock rip-rap, $/m3. d50 size, m. = 0.38 $182.01 158 $182.01
21 Sidehill rock excavation for pipeline, $/m3. $39.22 3,314 $39.2222 Sidehill overburden excavation for pipeline, $/m3. $13.04 21,399 $13.0423 Side creek crossing, cost per crossing. $0.00 0 $0.0024
25 Concrete work.
26 Concrete including forms and re-bars, $/m3. $1,022.64 2,358 $1,022.6427 Concrete only, excluding forms and re-bars, $/m3. $670.25 266 $670.2528 Concrete formwork, $/m2. $94.77 319 $94.7729 Reinforcing bars, $/kg. $7.99 19,770 $7.9930 Concrete in tunnel linings, $/m3. $0.00 0 $0.0031 Dental concrete on rock in dam foundations, $/m3. $0.00 0 $0.00
32 Concrete or slurry wall, $/m3. $1,870.58 72 $1,870.58
33
34 Steelwork and powerhouse superstructure.35 Trashrack steel cost, $/kg. $6.32 458 $6.3236 Pipeline steel cost, $/ton. $5,492.57 689 $5,492.5737 Tunnel steel lining cost, $/ton. $0.00 0 $0.00
38 Powerhouse superstructure steel cost $/ton. $7,038.09 53 $7,038.0939 Powerhouse siding, $/m2. $157.67 825 $157.6740 Powerhouse roofing, $/m2. $222.99 182 $222.9941 Temporary steel pile bridge over river, cost per m. $0.00 0 $0.0042
43 Ratio of overburden excavation to dam impervious fill -------- > 0.0044 Ratio of Sclairpipe cost to equivalent steel pipe cost. 0.50
Inflation factor, 2008 to present. 1.001Page 20
BAKER - CHIPMUNK CREEK
Unit prices used in cost estimate.
Suggested
unit cost,based on
quantityof
work.
Fill in unit prices (blue column) before entering data in other pages. Return to this page after
completing all data entry to see if unit prices are compatible with quantities shown in column
F.

28
1 BAKER - CHIPMUNK CREEK2
3 Approximate cost by quantities in millions $. CAN $4 Civil work item and unit of measure. Cost $/unit. Quantity. Cost $ Millions
5 Clearing for all structures. Ha. $7,404.09 48.6 0.3606 Access roads and bridge cost. 7.8237
8 Embankment dam.9 Damsite and spillway overburden exc. cost. (m3) $13.04 757 0.010
10 Damsite(s) rock excavation cost. (m3) $52.17 0 0.000
11 Cutoff trench sand/gravel excavation cost. (m3) $31.95 4,725 0.15112 Impervious fill dam and cofferdam from borrow. (m3) $33.43 2,007 0.067
13 Filter material cost. (m3) processed from exc. $44.16 244 0.011
14 Rock embankment material cost. (m3) from exc. $58.81 189 0.01115 Rip-rap cost. (m3) selected from excavations $182.01 158 0.029
16 Dental concrete for core contact, m3. $0.00 6 0.00017 Concrete or slurry wall volume, m3. $1,870.58 72 0.135
18 Sub-total cost of embankment dam. ----------------------------------------------> 0.413
1920 Side stream approx. total cost, including intake and equip. costs 0.00021 Intake, de-sander and weir spillway.22 Intake and channel overburden excavation cost. (m3) $13.04 65 0.001
23 Intake and channel rock excavation cost. (m3) $52.17 13 0.001
24 Intake+weir+desander structure concrete cost. (m3) $1,022.64 2,354 2.40725 Trashrack supports and guides cost, kg. $6.32 60 0.000
26 Sub-total intake civil work cost. ------------------------------------------------------------ > 2.40927
28 Tunnels and vertical bore.29 Tunnel rock excavation cost. (m3) $0.00 0 0.00030 Tunnel concrete lining cost. (m3) $0.00 0 0.000
31 Bore rock excavation cost. (m3) $0.00 0 0.00032 Bore concrete lining cost. (m3) $0.00 0 0.000
33 Low pressure tunnel steel lining cost, installed, ton. $0.00 0 0.000
34 High pressure tunnel steel lining cost, installed, ton. $0.00 0 0.00035 Sub-total underground work cost. --------------------------------------------------------- > 0.00036
37 Surge tank cost, if required. Lump sum. 0.00038
39 Steel pipelines and penstocks.40 Number of side creek crossings, cost per crossing. $0.00 0 0.000
41 Pipeline rock excavation cost. (m3) $52.17 3,314 0.173
42 Pipeline earth excavation cost. (m3) $13.04 21,399 0.27943 Pipeline concrete casing cost. (m3) $1,022.64 4 0.004
44 Penstock anchor and pier concrete, m3. $1,533.96 0 0.00045 Pipeline/penstock steel cost, installed, ton. $5,492.57 689 3.784
46 Sub-total pipelines and penstocks. -------------------------------------------------------- > 4.240
4748 Tailrace.49 Tailrace overburden excavation cost. (m3). $13.04 3222 0.04250 Tailrace rock excavation cost. (m3). $52.17 177 0.009
51 Sub-total tailrace excavation work. ------------------------------------------------------- > 0.05152 Page 21

29
53 BAKER - CHIPMUNK CREEK54
55 Powerhouse.56 Overburden excavation, m3. $13.04 3,464 45
57 Rock excavation, m3. $52.17 1,955 102
58 Concrete, m3. (Excluding forms, re-bar) $670.25 266 17859 Formwork, m2. $94.77 319 30
60 Reinforcing, kg. $7.99 19,770 15861 Powerhouse superstructure steel weight, tonnes. $7,038.09 53 376
62 Wall area, m2. $157.67 825 130
63 Roof area, m2. $222.99 182 4164 Total powerhouse civil work cost. ---------------------------------------------------------- > 1.06065
66 Total civil work cost, millions $ ------------------------------------------------------- > $16.35767
68 Cost of major mechanical equipment, summary.69 Total cost of trashrack equipment. 0.004
70 Total cost of intake stoplog and gate equipment. 0.037
71 Total cost of spillway low level gate and bulkhead equipment. 0.00172 Total cost of low level de-sander gate. 0.000
73 Total cost of powerhouse crane. 0.24874 Total cost rubber dams. 0.783
75 Total powerhouse ancilliary mechanical systems. 0.064
76 Sub-total cost of major mechanical equipment, except generators and valves. 1.13677
78 Generating equipment, transmission and substation at powerplant.79 Substation cost, disconnects and transformer. 0.124
80 Transmission lines cost. 1.309
81 Station service. 0.02882 6.114
83 Sub-total cost of W/W equipment, including valve(s) and transmission. 7.57584
85 Total electromechanical+transmission work cost, millions $ ---------- > $8.7118687 Total direct cost, millions $ ------------------------------------------------------------ > $25.06888
89 Indirect costs. % of direct Sub-total90 cost for %
91 Feasibility studies and site investigations. 2.0 25.068 0.50192 Environmental work. 2.0 25.570 0.511
93 Detailed designs and contract documents. 2.0 26.081 0.522
94 Site supervision work. 4.0 26.603 1.06495 Civil contingencies and unforseen cost allowance. 20.0 20.293 4.059
96 Electromechanical contingencies 8.0 7.374 0.59097 Sub-total indirect costs. 7.24798
99
100
101
102 Page 22
W/W cost of generating equipment, inlet valve, switchgear and controls.
Cost of development including transmission, no interest $32.3
30
103 BAKER - CHIPMUNK CREEK104
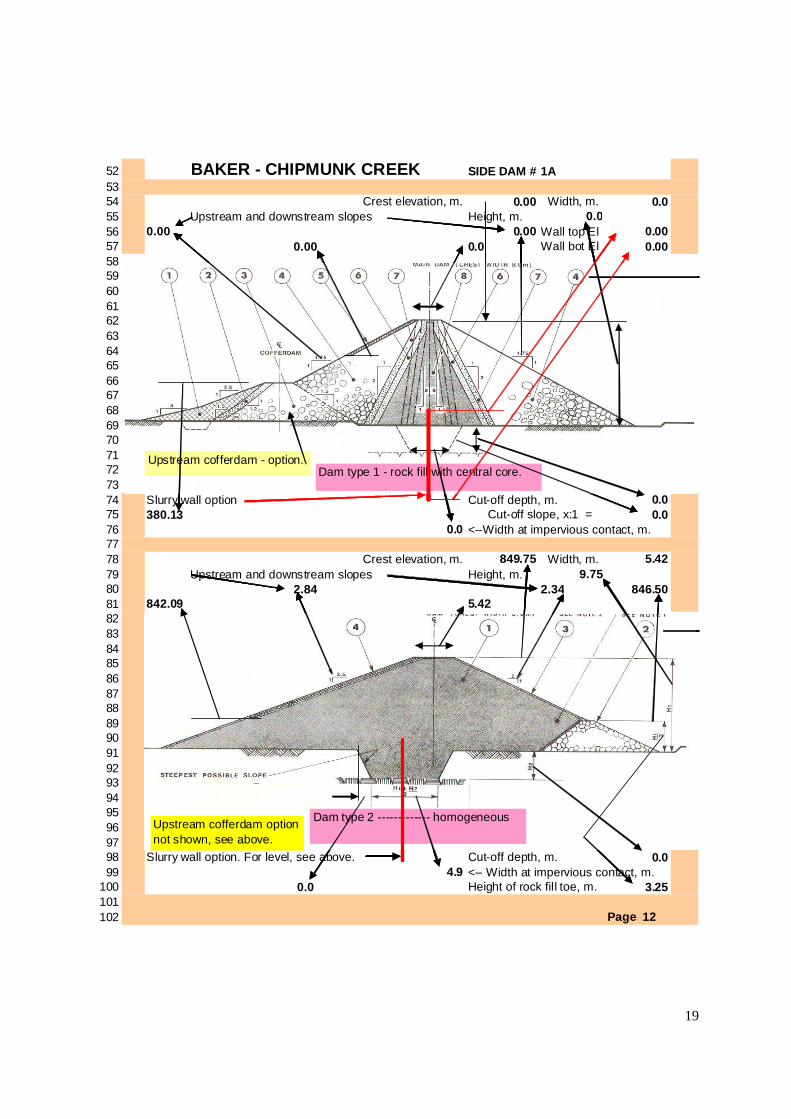
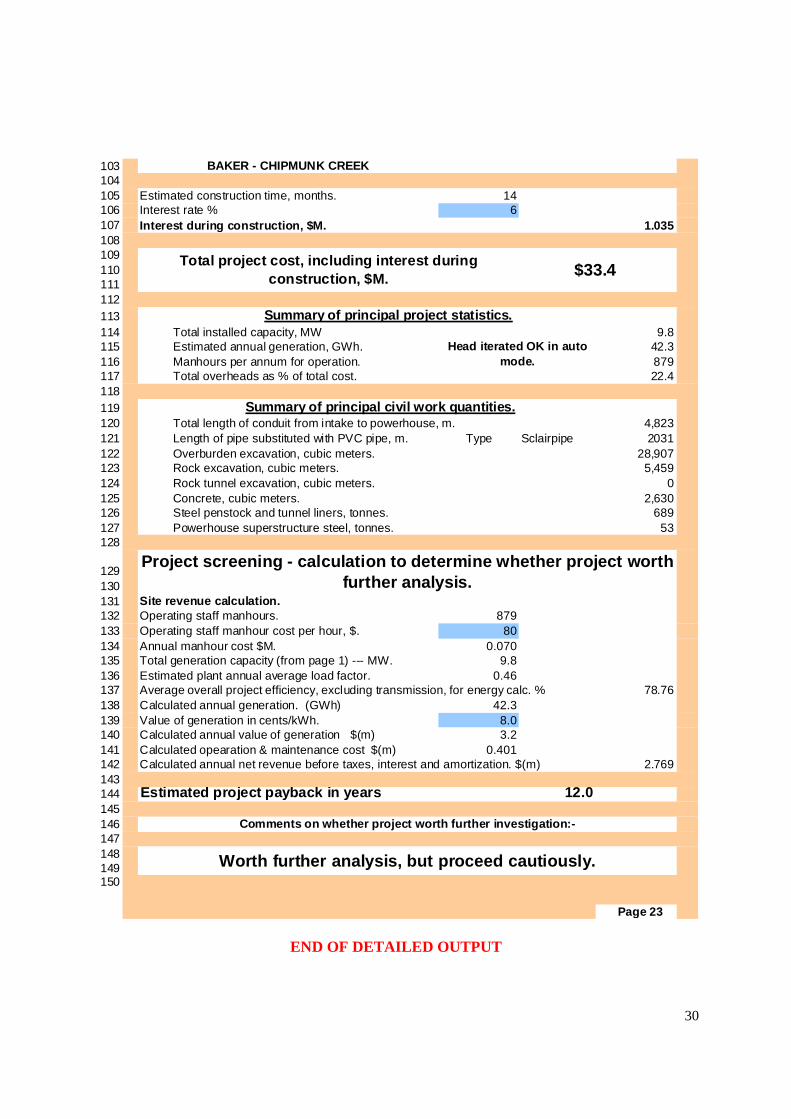
105 Estimated construction time, months. 14106 Interest rate % 6
107 Interest during construction, $M. 1.035108109
110111
112
113 Summary of principal project statistics.114 Total installed capacity, MW 9.8115 Estimated annual generation, GWh. 42.3
116 Manhours per annum for operation. 879117 Total overheads as % of total cost. 22.4
118
119 Summary of principal civil work quantities.120 Total length of conduit from intake to powerhouse, m. 4,823
121 Length of pipe substituted with PVC pipe, m. Type Sclairpipe 2031
122 Overburden excavation, cubic meters. 28,907123 Rock excavation, cubic meters. 5,459
124 Rock tunnel excavation, cubic meters. 0
125 Concrete, cubic meters. 2,630126 Steel penstock and tunnel liners, tonnes. 689
127 Powerhouse superstructure steel, tonnes. 53128
129
130
131 Site revenue calculation.132 Operating staff manhours. 879
133 Operating staff manhour cost per hour, $. 80
134 Annual manhour cost $M. 0.070135 Total generation capacity (from page 1) --- MW. 9.8
136 Estimated plant annual average load factor. 0.46137 Average overall project efficiency, excluding transmission, for energy calc. % 78.76
138 Calculated annual generation. (GWh) 42.3
139 Value of generation in cents/kWh. 8.0140 Calculated annual value of generation $(m) 3.2
141 Calculated opearation & maintenance cost $(m) 0.401142 Calculated annual net revenue before taxes, interest and amortization. $(m) 2.769
143144 Estimated project payback in years 12.0145
146147
148149150
Page 23
$33.4
Worth further analysis, but proceed cautiously.
Project screening - calculation to determine whether project worthfurther analysis.
Comments on whether project worth further investigation:-
Total project cost, including interest during
construction, $M.
Head iterated OK in auto
mode.
END OF DETAILED OUTPUT