Embed Size (px)
Citation preview

MOL #73833
Therapeutic targeting of a novel 6-substituted pyrrolo[2,3-d]pyrimidine thienoyl antifolate to human solid tumors based on selective uptake by
the proton-coupled folate transporter
Sita Kugel Desmoulin, Lei Wang, Eric Hales, Lisa Polin, Kathryn White, Juiwanna Kushner, Mark Stout, Zhanjun Hou, Christina Cherian, Aleem Gangjee, and Larry H. Matherly
Graduate Program in Cancer Biology, Wayne State University School of Medicine, Detroit, MI 48201 (SKD, LHM) Department of Oncology, Wayne State University School of Medicine, Detroit, MI 48201 (SKD, LP, EH, ZH, CC, LHM) Developmental Therapeutics Program, Barbara Ann Karmanos Cancer Institute, Detroit, MI 48201 (LP, EH, ZH, CC, LHM) Department of Pharmacology, Wayne State University School of Medicine, Detroit, MI 48201 (LHM) Department of Pediatrics, Children’s Hospital of Michigan, Detroit, MI 48201(MS) Department of Internal Medicine, Division of Hematology-Oncology, Wayne State University School of Medicine, Detroit, MI 48201 (KW, JK). Division of Medicinal Chemistry, Graduate School of Pharmaceutical Science, Duquesne University, Pittsburgh, PA 15282 (LW, AG)
1
Molecular Pharmacology Fast Forward. Published on September 22, 2011 as doi:10.1124/mol.111.073833
Copyright 2011 by the American Society for Pharmacology and Experimental Therapeutics.
This article has not been copyedited and formatted. The final version may differ from this version.Molecular Pharmacology Fast Forward. Published on September 22, 2011 as DOI: 10.1124/mol.111.073833
at ASPE
T Journals on A
ugust 23, 2019m
olpharm.aspetjournals.org
Dow
nloaded from
MOL #73833
2
Running title: Therapeutic targeting by PCFT
Address correspondence to: Larry H. Matherly, Ph.D. Developmental Therapeutics Program, Barbara Ann Karmanos Cancer Institute 110 E. Warren Ave Detroit, MI 48201 Tel.: 313-578-4280 Fax: 313-578-4287 Email: [email protected] Text pages: 39 Tables: 2 Figures: 8 Words Abstract: 248 Words Introduction: 805 Words Discussion: 1105 References: 41 Non-standard abbreviations: AICARFTase, 5-amino-4-imidazolecarboxamide ribonucleotide CHO, Chinese hamster ovary cells dFBS, dialyzed fetal bovine serum DHFR, dihydrofolate reductase DPBS, Dulbecco’s phosphate-buffered saline FITC, fluorescein isothiocyanate FR, folate receptor GAPDH, glyceraldehyde-3-phosphate dehydrogenase GAR, glycinamide ribonucleotide GARFTase, glycinamide ribonucleotide formyltransferase HEPES, 4-(2-hydroxyethyl)-1-piperazineethanesulfonic acid HPLC, high performance liquid chromatography hPCFT, human proton-coupled folate transporter hRFC, human reduced folate carrier IC50, fifty percent inhibitory concentration LCV, leucovorin Lmx, lometrexol MES, 4-morphilinopropane sulfonic MTAP, methylthioadenosine phosphorylase MTRP, 5-deoxy-5-(methylthio)ribose-1-phosphate Mtx, methotrexate PCFT, proton-coupled folate transporter PG, polyglutamate PI, propidium iodide PIPES, piperazine-N,N′-bis(2-ethanesulfonic acid) Pmx, pemetrexed RFC, reduced folate carrier
This article has not been copyedited and formatted. The final version may differ from this version.Molecular Pharmacology Fast Forward. Published on September 22, 2011 as DOI: 10.1124/mol.111.073833
at ASPE
T Journals on A
ugust 23, 2019m
olpharm.aspetjournals.org
Dow
nloaded from

MOL #73833
3
SCID, severe combined immunodeficient SEM, standard error of the mean TCA, trichloroacetic acid TS, thymidylate synthase
This article has not been copyedited and formatted. The final version may differ from this version.Molecular Pharmacology Fast Forward. Published on September 22, 2011 as DOI: 10.1124/mol.111.073833
at ASPE
T Journals on A
ugust 23, 2019m
olpharm.aspetjournals.org
Dow
nloaded from
MOL #73833
4
ABSTRACT
The proton-coupled folate transporter (PCFT) is a proton-folate symporter with an acidic
pH optimum. By real-time RT-PCR, PCFT was expressed in the majority of 53 human
tumor cell lines, with the highest levels in Caco-2 (colorectal adenocarcinoma), SKOV3
(ovarian) and HepG2 (hepatoma) cells. A novel 6-substituted pyrrolo[2,3-d]pyrimidine
thienoyl antifolate (compound 1) was used to establish whether PCFT can deliver
cytotoxic drug under pH conditions that mimic the tumor microenvironment. Both 1 and
pemetrexed (Pmx) inhibited proliferation of R1-11-PCFT4 HeLa cells engineered to
express PCFT without the reduced folate carrier (RFC), and of HepG2 cells expressing
both PCFT and RFC. Unlike Pmx, 1 did not inhibit proliferation of R1-11-RFC6 HeLa
cells, which express RFC without PCFT. Treatment of R1-11-PCFT4 cells at pH 6.8 with
1 or Pmx inhibited colony formation with dose- and time-dependence. Transport of
[3H]compound 1 into R1-11-PCFT4 and HepG2 cells was optimal at pH 5.5 but
appreciable at pH 6.8. At pH 6.8, [3H]compound 1 was metabolized to
[3H]polyglutamates. Glycinamide ribonucleotide formyltransferase (GARFTase) in R1-
11-PCFT4 cells was inhibited by 1 at pH 6.8, as measured by an in situ GARFTase assay
and was accompanied by substantially reduced ATP levels. Compound 1 caused S-phase
accumulation and a modest level of apoptosis. An in vivo efficacy trial with severe
combined immunodeficient mice implanted with subcutaneous HepG2 tumors showed
that compound 1 was active. Our findings suggest exciting new therapeutic possibilities
to selectively deliver novel antifolate drugs via transport by PCFT over RFC by
exploiting the acidic tumor microenvironment.
This article has not been copyedited and formatted. The final version may differ from this version.Molecular Pharmacology Fast Forward. Published on September 22, 2011 as DOI: 10.1124/mol.111.073833
at ASPE
T Journals on A
ugust 23, 2019m
olpharm.aspetjournals.org
Dow
nloaded from

MOL #73833
5
INTRODUCTION
Antifolates are some of the most versatile and best understood cancer chemotherapy
drugs. These agents, notably aminopterin, revolutionized the treatment of acute
lymphoblastic leukemia by inducing complete remissions in children with leukemia
(Farber and Diamond, 1948). Aminopterin and methotrexate (Mtx) were recognized to
disrupt folate metabolism by inhibiting dihydrofolate reductase (DHFR) (Monahan and
Allegra, 2006). Subsequent generations of antifolates primarily targeted other key folate-
dependent enzymes, including thymidylate synthase (TS) [Pemetrexed (Pmx)] and β-
glycinamide ribonucleotide (GAR) formyltransferase (GARFTase) [Lometrexol (Lmx)].
For all these agents, cellular uptake and metabolism to polyglutamates are critical to drug
activity (Chattopadhyay et al., 2007; Mendelsohn et al., 1999; Monahan and Allegra,
2006).
The anionic nature of antifolates precludes their diffusion across biological membranes.
Three genetically distinct and functionally diverse transport systems have evolved to
facilitate their uptake into mammalian cells. (i) The reduced folate carrier (RFC;
SLC19A1), a member of the major facilitator superfamily of solute carriers, is an anionic
antiporter and the major transport system for reduced folates in mammalian cells and
tissues at physiologic pH (Matherly et al., 2007). RFC is ubiquitously expressed in
normal and malignant tissues. (ii) Folate receptors (FRs) α and β are
glycosylphosphatidylinositol-anchored membrane proteins that transport folates by
receptor-mediated endocytosis. FRα is expressed in epithelial cells of the kidney, choroid
plexus, retina, uterus, and placenta. Malignant tissues also express FRα, including
adenocarcinomas of the cervix, uterus, and ovary (Elnakat and Ratnam, 2004). (iii) The
This article has not been copyedited and formatted. The final version may differ from this version.Molecular Pharmacology Fast Forward. Published on September 22, 2011 as DOI: 10.1124/mol.111.073833
at ASPE
T Journals on A
ugust 23, 2019m
olpharm.aspetjournals.org
Dow
nloaded from
MOL #73833
6
proton-coupled folate transporter (PCFT; SLC46A1) is a proton-folate symporter that
functions optimally at acidic pHs by coupling the downhill flow of protons to the uphill
flow of folates into cells (Nakai et al., 2007; Qiu et al., 2006; Zhao and Goldman, 2007).
PCFT is expressed in normal mouse and human tissues. High PCFT levels are present at
the apical brush-border membrane along the proximal jejunum and duodenum, and in
kidney, liver, placenta, and choroid plexus, whereas much lower levels were detected in
other tissues (Kugel Desmoulin et al., 2010a; Qiu et al., 2007; Zhao et al., 2009). While a
low pH transport activity was described in human tumor cell lines of assorted origins
(Zhao et al., 2004), presumably due to PCFT, tumor expression of PCFT has not been
systematically studied.
There is now ample precedent for using FRα to selectively target tumors with cytotoxic
agents for therapeutic benefit (Deng et al., 2008; Deng et al., 2009; Gibbs et al., 2005;
Hilgenbrink and Low, 2005; Kugel Desmoulin et al., 2010b; Salazar and Ratnam, 2007;
Wang et al., 2010). PCFT transport function may be enhanced in many solid tumors by
the acidic pH of the tumor microenvironment which has been reported to reach as low as
pH 6.2-6.8 (Helmlinger et al., 1997; Raghunand et al., 1999; Wike-Hooley et al., 1984).
Intracellular pH is normally alkaline, which creates a substantial transmembrane pH
gradient directed intracellularly (Fais et al., 2007). Clearly, harnessing this proton-motive
gradient to transport cytotoxic antifolates into tumor cells by PCFT offers a uniquely
attractive mechanism of therapeutic targeting solid tumors.
For tumor targeting of cytotoxic drugs via FR or PCFT, ideally, therapeutic agents could
be developed that are specifically transported by FRs and/or PCFT and not by RFC
This article has not been copyedited and formatted. The final version may differ from this version.Molecular Pharmacology Fast Forward. Published on September 22, 2011 as DOI: 10.1124/mol.111.073833
at ASPE
T Journals on A
ugust 23, 2019m
olpharm.aspetjournals.org
Dow
nloaded from
MOL #73833
7
(Deng et al., 2008; Deng et al., 2009; Gibbs et al., 2005; Hilgenbrink and Low, 2005;
Kugel Desmoulin et al., 2010b; Salazar and Ratnam, 2007; Wang et al., 2010). This
strategy is necessary since antifolate membrane transport by RFC precludes tumor
selectivity, as RFC is expressed in both normal and tumor cells, and RFC transport is
optimal at neutral pH characterizing most normal tissues (Matherly et al., 2007; Zhao and
Goldman, 2003). Indeed, a major obstacle in implementing this approach has been a lack
of FR- or PCFT-selective antifolates, as all of the clinically useful antifolates with
significant FR- and PCFT substrate activity (e.g., Mtx and Pmx) are also transported by
RFC (Matherly et al., 2007).
We recently described a novel 2-amino-4-oxo-6-substituted pyrrolo[2,3-d]pyrimidine
antifolate with a thienoyl for benzoyl replacement and a bridge length of 4 carbons
(compound 1) (Figure 1) (Wang et al., 2010). Cellular uptake of compound 1 by FRα was
substantial in the absence of evidence of its membrane transport by RFC, resulting in
potent antitumor activity both in vitro and in vivo due to inhibition of GARFTase in de
novo purine nucleotide biosynthesis. While transport of compound 1 by PCFT was also
inferred, neither this nor the capacity of PCFT to deliver a cytotoxic dose of compound 1
under conditions relevant to the solid tumor microenvironment was directly tested.
This report describes such experiments with compound 1 to establish the feasibility of
selectively targeting chemotherapy to human solid tumors based upon drug membrane
transport by PCFT. Experiments are also described documenting the PCFT transport and
polyglutamylation characteristics of compound 1, which account for its potent inhibition
of GARFTase leading to tumor cell death in vitro and in vivo.
This article has not been copyedited and formatted. The final version may differ from this version.Molecular Pharmacology Fast Forward. Published on September 22, 2011 as DOI: 10.1124/mol.111.073833
at ASPE
T Journals on A
ugust 23, 2019m
olpharm.aspetjournals.org
Dow
nloaded from

MOL #73833
8
MATERIALS AND METHODS
Materials. [3’,5’,7-3H]Mtx (20 Ci/mmol), [3H]Pmx (2.5 Ci/mmol) and custom-
radiolabeled [3H]compound 1 (1.3 Ci/mmol) were purchased from Moravek
Biochemicals (Brea, CA). Leucovorin (LCV) [(6R,S) 5-formyl tetrahydrofolate] was
provided by the Drug Development Branch, National Cancer Institute, Bethesda, MD.
Pmx [N-{4-[2-(2-amino-3,4-dihydro-4-oxo-7H-pyrrolo[2,3-d]pyrimidin-5-yl)ethyl]
benzoyl}-L-glutamic acid] (Alimta) was provided by Eli Lilly and Co. (Indianapolis, IN).
Synthesis and properties of the substituted pyrrolo[2,3-d]pyrimidine antifolate compound
1 were previously described (Wang et al., 2010). Other chemicals were obtained from
commercial sources in the highest available purities.
Cell lines. The sources and cell culture conditions for the panel of human solid tumor
and leukemia cell lines used for qRT-PCR assays of transcript levels for FRα, hPCFT,
and hRFC are summarized in Table 1S (Supplement). HeLa R1-11-RFC6 and R1-11-
PCFT4 cells were derived from human RFC (hRFC)- and human PCFT (hPCFT)-null
R1-11 cells by stable transfection with HA-tagged pZeoSV2(+)-RFC and pZeoSV2(+)-
PCFT constructs, respectively (Zhao et al., 2008). These HeLa sublines along with R1-
11-mock transfected cells were gifts from Dr. I. David Goldman (Albert Einstein School
of Medicine, Bronx, NY). Characteristics and maintenance of the HeLa sublines were
previously described (Zhao et al., 2008).
Real-time RT-PCR analysis of RFC, FRα, and PCFT transcripts. RNAs were
isolated from a variety of human cell lines, including solid tumor (n=53) and leukemia
(n=27) sublines (Supplement, Table 1S), and engineered R1-11 HeLa sublines (R1-11
This article has not been copyedited and formatted. The final version may differ from this version.Molecular Pharmacology Fast Forward. Published on September 22, 2011 as DOI: 10.1124/mol.111.073833
at ASPE
T Journals on A
ugust 23, 2019m
olpharm.aspetjournals.org
Dow
nloaded from

MOL #73833
9
mock, R1-11-RFC6, and R1-11-PCFT4), using TRIZOL reagent (Invitrogen). cDNAs
were synthesized using Superscript reverse transcriptase III kit (Invitrogen). cDNAs were
purified with the QIAquick PCR Purification Kit (Qiagen). Quantitative real-time RT-
PCR was performed on a Roche LightCycler 480 using Universal Probes (Roche,
Indianapolis, IN) and gene-specific primers. Primers are included in Table 2S
(Supplement). Transcript levels for FRα, hPCFT, and hRFC genes were normalized to
those for glyceraldehyde-3-phosphate dehydrogenase (GAPDH) using commercial probes
and primers (Roche 05190541001). External standard curves were constructed for each
gene of interest using serial dilutions of linearized templates, prepared by amplification
from suitable cDNA templates, subcloning into a TA-cloning vector (PCR-Topo;
Invitrogen), and restriction digestions.
Proliferation and colony-forming assays. For growth inhibition assays, R1-11-PCFT4
and R1-11-RFC6 HeLa cells, and HepG2 cells were cultured in folate-free RPMI 1640
(pH 7.2) containing 25 nM LCV, supplemented with 10% dialyzed fetal bovine serum
(dFBS), 2 mM L-glutamine and 100 units/ml penicillin/100 µg/ml streptomycin for at
least 2 weeks. Cells were plated in 96 well culture dishes (5000 cells/well; 200 μl/well) in
the above medium with a broad concentration range of drugs (depending on the
compound, drug dilutions were in DMSO or water with appropriate vehicle controls);
cells were incubated for up to 96 h at 37oC in a CO2 incubator. Metabolically active cells
(a measure of cell viability) were assayed with CellTiter-blue cell viability assay
(Promega) and a fluorescent plate reader (590 nm emission, 560 nm excitation) for
determining IC50s, corresponding to drug concentrations that result in 50% loss of cell
growth.
This article has not been copyedited and formatted. The final version may differ from this version.Molecular Pharmacology Fast Forward. Published on September 22, 2011 as DOI: 10.1124/mol.111.073833
at ASPE
T Journals on A
ugust 23, 2019m
olpharm.aspetjournals.org
Dow
nloaded from
MOL #73833
10
For colony-forming assays, folate-depleted R1-11-PCFT4 cells (500 cells) in log-phase
were plated into 60 mm dishes in folate-free RPMI 1640 medium, supplemented with 25
nM LCV, 10% dFBS, penicillin-streptomycin, and 2 mM L-glutamine (pH 7.2), and
allowed to adhere for 48 h. Cells were then treated with compound 1 or Pmx in the above
media, supplemented with 25 mM piperazine-N,N′-bis(2-ethanesulfonic acid (PIPES) and
25 mM 4-(2-hydroxyethyl)-1-piperazineethanesulfonic acid (HEPES) to maintain the pH
at 6.8. After 16, 24, or 48 h, cells were rinsed with Dulbecco’s phosphate-buffered saline
(DPBS), then incubated in drug-free, complete folate-free RPMI 1640 medium,
supplemented with 25 nM LCV (pH 7.2). Cells were allowed to outgrow for 12 days, at
which time the dishes were rinsed with DPBS, 5% trichloroacetic acid (TCA), and borate
buffer (10 mM, pH 8.8), followed by 1% methylene blue (in borate buffer). The dishes
were again rinsed with borate buffer, and colonies were counted for calculating percent
colony formation relative to the DMSO controls.
Transport assays. To determine the pH-dependent uptake of [3H]compound 1 and
[3H]Pmx (both at 0.25 µM) in R1-11-PCFT4, R1-11-mock and HepG2 cells, uptake was
assayed at 37o C in cell monolayers over 2-30 min at 37°C in complete folate-free RPMI
1640 (pH 5.5, 6.8 and 7.2), supplemented with 10% dFBS and 25 mM HEPES/25 mM
PIPES. At the end of the incubations, transport was quenched with ice-cold DPBS, cells
were washed 3 times with ice-cold DPBS, and cellular proteins were solubilized with 0.5
N NaOH. Levels of drug uptake were expressed as pmol/mg protein, calculated from
direct measurements of radioactivity and protein contents of cell homogenates. Proteins
were quantified using Folin-phenol reagent (Lowry et al., 1951).
This article has not been copyedited and formatted. The final version may differ from this version.Molecular Pharmacology Fast Forward. Published on September 22, 2011 as DOI: 10.1124/mol.111.073833
at ASPE
T Journals on A
ugust 23, 2019m
olpharm.aspetjournals.org
Dow
nloaded from

MOL #73833
11
For PCFT transport kinetic analyses, R1-11-PCFT4 cells were grown in suspension using
spinner flasks at densities of 2-5 x 10⁵ cells/mL. Cells were collected by centrifugation,
washed with DPBS, and suspended (at 1.5 x 10⁷ cells) in 2 ml transport buffer (below) for
cellular uptake assays. To determine [3H]compound 1 and [3H]Pmx kinetic constants for
PCFT (Kt and Vmax), initial uptake rates were measured at 37o C over 2 min in HEPES-
buffered saline (20 mM HEPES, 140 mM NaCl, 5 mM KCl, 2 mM MgCl2, and 5 mM
glucose) at pH 6.8, or in 4-morphilinopropane sulfonic (MES)-buffered saline (20 mM
MES, 140 mM NaCl, 5 mM KCl, 2 mM MgCl2, and 5 mM glucose) at pH 5.5 (Zhao et
al., 2004), using substrate concentrations from 0.04 to 5 μM. Kt and Vmax values were
determined from Lineweaver-Burke plots.
HPLC analysis of polyglutamyl derivatives of compound 1 and Pmx. Folate-depleted
R1-11-PCFT4 and HepG2 cells were grown in complete folate-free RPMI 1640 medium,
supplemented with 25 nM LCV and 10% dFBS. Cells were washed with DPBS and
incubated in complete RPMI 1640 with dFBS and 25 mM PIPES/25 mM HEPES (pH
6.8) with 1 μM [3H]compound 1 or [3H]Pmx at 37°C in the presence of 60 µM adenosine,
or 60 µM ade plus 10 µM thymidine, respectively. After 16 h, cells were washed three
times with ice-cold DPBS, then scraped mechanically into 5 ml of ice-cold DPBS,
pelleted and flash frozen. The cell pellets were resuspended into 0.5 ml of 50 mM sodium
phosphate buffer (pH 6)/100 mM 2-mercaptoethanol including unlabeled compound 1 (or
Pmx) and Mtx-diglutamate, -triglutamate, and –tetraglutamate standards (Schircks
Laboratories, Jona, Switzerland) (50 μM each). A portion (50 μL) was used to determine
total [3H]compound 1 or Pmx (in pmol/mg protein). Proteins were measured by the Bio-
This article has not been copyedited and formatted. The final version may differ from this version.Molecular Pharmacology Fast Forward. Published on September 22, 2011 as DOI: 10.1124/mol.111.073833
at ASPE
T Journals on A
ugust 23, 2019m
olpharm.aspetjournals.org
Dow
nloaded from

MOL #73833
12
Rad protein assay (Bio-Rad Laboratories, Richmond, CA). The remaining extract was
boiled (10 min), the supernatant containing radiolabeled compound 1 (or Pmx) and its
metabolites was centrifuged, then (250 μl) injected into a Waters 4μm Nova-Pak C-18
column (3.9 mm x 150 mm) with a Nova-Pak 4 μm C-18 guard column. A Varian 9012
ternary gradient programmable pump was used for gradient development and a 9050
Varian UV/Vis detector set to 313 nm was used for detection of compound 1, Pmx, or
Mtx polyglutamate standards. HPLC analysis involved a binary gradient. Mobile phase
A consisted of 100 mM sodium acetate at pH 5.5; mobile phase B consisted of 100%
acetonitrile. The flow rate was set at 1.6 ml/min. The gradient consisted of 100% A from
0-5 minutes, then changed to 85%A/15% B from 5 to 27.5 minutes. Fractions were
mechanically collected every min for the first 10 min and then every 10 sec for the
duration of the run. Radioactivity of the fractions was measured with a scintillation
counter. Intracellular levels of radiolabeled compounds are expressed as pmol/mg
protein, based on calculated percentages in the peaks from the HPLC chromatogram and
total pmol/mg of cellular [3H]antifolate. To confirm the identities of the early-eluting
peaks as polyglutamate metabolites of compound 1, samples were hydrolyzed to their
parent drug forms by an overnight treatment at 32˚C with a preparation of partially
purified chicken pancreas conjugase in 0.5 mL 0.1 M sodium borate containing 10 mM 2-
mercaptoethanol (Matherly et al., 1985). Samples were deproteinized by boiling (5 min),
then analyzed by HPLC.
In situ GARFT enzyme inhibition assay. Incorporation of [14C(U)]glycine into
[14C]formyl GAR as an in situ measure of endogenous GARFTase activity in folate-
depleted R1-11-PCFT4 cells at pH 6.8 was performed using a modification of published
This article has not been copyedited and formatted. The final version may differ from this version.Molecular Pharmacology Fast Forward. Published on September 22, 2011 as DOI: 10.1124/mol.111.073833
at ASPE
T Journals on A
ugust 23, 2019m
olpharm.aspetjournals.org
Dow
nloaded from
MOL #73833
13
methods (Beardsley et al., 1989; Deng et al., 2008). For these experiments, R1-11-PCFT4
cells were seeded in 5 ml of complete folate-free RPMI 1640/10% dFBS, plus 25 nM
LCV in 60 mm dishes and allowed to adhere overnight. Cells were washed twice with
DPBS and resuspended in 5 mL complete folate-free RPMI 1640/10% dFBS with 25 mM
PIPES/25 mM HEPES (pH 6.8) and 25 nM LCV. Antifolate inhibitor or an equivalent
amount of vehicle (e.g., DMSO) (“control”) was added to the culture medium and the
cells were incubated for another 16 h. Cells were washed twice with DPBS and
resuspended in 5 mL complete folate-free, L-glutamine-free RPMI 1640/10% dFBS plus
25 mM PIPES/25 mM HEPES (pH 6.8) and 25 nM LCV with or without 0.5-100 nM
antifolate and azaserine (4 μM final), and incubated for 30 min. L-glutamine (2 mM final
concentration) and [14C]glycine (final specific activity, 0.1 mCi/L) were added, followed
by incubation at 37oC for 8 h, after which time cells were washed three times with ice-
cold DPBS and trypsinized. Cell pellets were suspended in 2 mL of 5% TCA at 0o C. Cell
debris was removed by centrifugation; samples were solubilized in 0.5 N NaOH and
assayed for protein contents (Lowry et al., 1951). The supernatants were extracted twice
with 2 mL of ice-cold ether. The aqueous layer was passed through a 1 cm column of
AG1x8 (chloride form, 100-200 mesh) (BioRad Laboratories), washed with 10 mL of 0.5
N formic acid, followed by 10 mL of 4 N formic acid, and eluted with 8 mL of 1 N HCl
solution. The elutants were collected as 1 mL fractions and determined for radioactivity.
Determination of intracellular ATP levels. For analysis of ATP levels following
antifolate treatments, R1-11-PCFT4 cells were seeded in 10 ml of complete folate-free
RPMI 1640/10% dFBS, with 25 mM PIPES/25 mM HEPES (pH 6.8) and 25 nM LCV.
After 24 h, 10 μM compound 1 or DMSO (0.5% final) (control) was added to the culture
This article has not been copyedited and formatted. The final version may differ from this version.Molecular Pharmacology Fast Forward. Published on September 22, 2011 as DOI: 10.1124/mol.111.073833
at ASPE
T Journals on A
ugust 23, 2019m
olpharm.aspetjournals.org
Dow
nloaded from
MOL #73833
14
medium. Cells were incubated for an additional 24-72 h, after which they were
trypsinized and washed (2x) with ice-cold DPBS. Nucleotides were extracted and ATP
levels quantitated by HPLC exactly as previously described (Kugel Desmoulin et al.,
2010b).
Assessment of apoptosis and cell cycle distribution. R1-11-PCFT4 cells were treated
with 10 μM compound 1 for 48 h at pH 6.8 in complete folate-free RPMI 1640/10%
dFBS with 25 mM PIPES/25 mM HEPES (pH 6.8) and 25 nM LCV. Cells were
trypsinized, pelleted, and washed once with ice-cold DPBS. Samples were divided so that
the cell cycle profile and apoptosis analysis could be performed on the same sample. The
amount of apoptosis was measured by staining cells (~1 x 10⁶) with fluorescein
isothiocyanate (FITC)-conjugated annexin V and propidium iodide (PI) with the
apoptotic cells determined using the CELL LAB ApoScreen™ Annexin V-FITC
Apoptosis Kit (Beckman Coulter), as recommended by the manufacturer. Cells were
analyzed for the presence of viable (annexin V- and PI-), early apoptotic (annexin V+ and
PI-), and late apoptotic/necrotic (annexin V+ and PI+) cells by flow cytometry.
To determine compound 1 concentration-dependent effects on cell-cycle progression, R1-
11-PCFT4 cells (1 x 10⁶) treated with 0, 0.5, 1, 5, and 10 μM compound 1 in complete
folate-free RPMI 1640/10% dFBS with 25 mM PIPES/25 mM HEPES (pH 6.8) and 25
nM LCV for 48 h at pH 6.8. Cells (~1 x 10⁶) were fixed in ethanol (at least 1 h), then
stained by resuspension in 0.5 ml DPBS containing 50 μg/ml PI and 100 μg/ml RNAse
type I-A (Sigma Aldrich). The cells were analyzed by flow cytometry for determining
the percent of cells in each phase of the cell cycle.
This article has not been copyedited and formatted. The final version may differ from this version.Molecular Pharmacology Fast Forward. Published on September 22, 2011 as DOI: 10.1124/mol.111.073833
at ASPE
T Journals on A
ugust 23, 2019m
olpharm.aspetjournals.org
Dow
nloaded from
MOL #73833
15
Flow cytometry was performed at the Karmanos Cancer Institute Imaging and Cytometry
Core using the BD FACSCantoTM II operated with BD FACSDivaTM software (v6.0)
(Becton Dickinson; San Jose, California). In each experiment, 20,000 cells were assessed
for apoptosis and cell cycle distribution. Data were analyzed with the FlowJo (v7.6.1)
software (Tree Star, Inc; Oregon).
In vivo efficacy study of compound 1 in HepG2 xenografts. Cultured HepG2 human
hepatoma tumor cells were implanted subcutaneously (~ 1 x 10⁷ cells/flank) to establish a
solid tumor xenograft model in female ICR SCID mice (NIH DCT/DTP Animal
Production Program, Frederick, MD). For the efficacy study, mice were 8 weeks old on
day 0 (tumor implant) with an average body weight of 17.6 g. Mice were provided food
and water ad libitum. Study mice were maintained on either a folate-deficient diet
(Harlan-Teklad; Product ID: TD.00434) or a folate-replete diet (Lab Diet; 5021;
autoclavable mouse breeder diet) starting 16 days before subcutaneous tumor implant to
ensure serum folate levels would approximate those of humans. Folate serum levels were
determined prior to tumor implantation and post-study with a Lactobacillus casei
bioassay (Varela-Moreiras and Selhub, 1992). The animals were pooled and implanted
bilaterally subcutaneously with 30-60 mg tumor fragments by a 12-gauge trocar and
again pooled before unselective distribution to the various treatment and control groups.
Chemotherapy was begun 4 days after tumor implantation, when the number of cells was
relatively small (107-108 cells; before the established limit of palpation). Tumors were
measured with a caliper two or three times weekly. Mice were sacrificed when the
cumulative tumor burden reached 1500 mg. Tumor weights were estimated from two
This article has not been copyedited and formatted. The final version may differ from this version.Molecular Pharmacology Fast Forward. Published on September 22, 2011 as DOI: 10.1124/mol.111.073833
at ASPE
T Journals on A
ugust 23, 2019m
olpharm.aspetjournals.org
Dow
nloaded from
MOL #73833
16
dimensional measurements [i.e., tumor mass (in mg) = (ab2)/2, where a and b are the
tumor length and width in mm, respectively]. For calculation of end points, both tumors
on each mouse were added together, and the total mass per mouse was used. The
following quantitative end points were used to assess antitumor activities: (i) T/C and T-
C (tumor growth delay) [where T is the median time in days required for the treatment
group tumors to reach a predetermined size (e.g., 500 mg) and C is the median time in
days for the control group tumors to reach the same size; tumor-free survivors are
excluded from these calculations]; and (ii) calculation of tumor cell kill [log10 cell kill
total (gross) = (T - C)/(3.32)(Td), where (T – C) is the tumor growth delay, as described
above, and Td is the tumor volume doubling time in days, estimated from the best fit
straight line from a log-linear growth plot of control group tumors in exponential growth
(100-800 mg range)]. With the exception of the xenograft model, these methods are
essentially identical to those described previously (Wang et al., 2010).
RESULTS
Expression and function of RFC and PCFT in human solid tumor and leukemia cell
lines. Based on a report of a low pH transport activity in solid tumor cells lines (Zhao et
al., 2004), presumably due to PCFT, we turned our attention to establishing an expression
profile for hPCFT compared to hRFC and FRs in a number of cell lines derived from
human solid tumors and leukemias. Transcript levels for hPCFT, hRFC, and FRs α and β
were measured by qRT-PCR and normalized to GAPDH. Our results showed significant
levels of hPCFT transcripts in the majority of human solid tumor cell lines of different
origins (e.g., breast, prostate, ovarian, etc.) (Figure 2A), and uniformly low hPCFT
transcript levels in human leukemias, including both ALL and AML (Supplement, Figure
This article has not been copyedited and formatted. The final version may differ from this version.Molecular Pharmacology Fast Forward. Published on September 22, 2011 as DOI: 10.1124/mol.111.073833
at ASPE
T Journals on A
ugust 23, 2019m
olpharm.aspetjournals.org
Dow
nloaded from

MOL #73833
17
1S, panel C). hPCFT levels were highest in Caco-2 (colorectal adenocarcinoma), SKOV3
(ovarian carcinoma), HepG2 (hepatoma), and H69 (small cell lung cancer) cells, with
appreciable hPCFT levels in numerous other tumor sublines. hRFC transcripts were
detected in all solid tumor and leukemia cell lines with the exception of MDA-MB-231
breast cancer cells (Figure 2B and Supplement, Figure 1S, panel D). High levels of FRα
were detected in a small subset of ovarian, cervical, and breast cancer cell lines and low
but detectable FRα levels were measured in ALL (mostly T-cell) sublines (Supplement,
Figure 1S, panel B). FR β transcripts were consistently low to undetectable in both solid
tumors and leukemias, with the highest levels restricted to a small number of AML and
T-cell ALLs (not shown).
Effects of compound 1 on cell growth inhibition and colony formation in HeLa and
HepG2 human tumor sublines. Our previous studies (Wang et al., 2010) established
that the novel pyrrolo[2,3-d]pyrimidine thienoyl antifolate compound 1 (Figure 1) was a
potent (nM) inhibitor of proliferation of a Chinese hamster ovary (CHO) subline
engineered to express hPCFT in the absence of other folate transporters (RFC and FRs),
and of [3H]Mtx transport by hPCFT, suggesting competitive binding to the carrier (and
transport by this mechanism). Conversely, the data strongly suggested that compound 1
was not transported by hRFC in a CHO subline similarly engineered to exclusively
express hRFC.
To begin to establish the therapeutic potential of hPCFT as a selective approach for
chemotherapy drug delivery to human solid tumors, we used isogenic HeLa sublines
derived by stable transfections of hRFC- and hPCFT-null R1-11 HeLa cells, designated
This article has not been copyedited and formatted. The final version may differ from this version.Molecular Pharmacology Fast Forward. Published on September 22, 2011 as DOI: 10.1124/mol.111.073833
at ASPE
T Journals on A
ugust 23, 2019m
olpharm.aspetjournals.org
Dow
nloaded from

MOL #73833
18
R1-11-PCFT4 (express physiologic levels of hPCFT in the absence of hRFC, as
measured by real-time RT-PCR) and R1-11-RFC6 (engineered to express hRFC without
hPCFT), (Zhao et al., 2008) (Figure 3, panel A). Low levels of FRα were detected in all
the R1-11 sublines. As a tumor prototype, we used HepG2 cells, established from our
tumor cell line screen to express significant levels of hPCFT and hRFC (Figure 2)
without FRα (expression levels for hPCFT and hRFC in HepG2 cells are compared to
those for the R1-11 sublines in Figure 3, panel A).
We measured inhibition of cell proliferation by compound 1 and results were compared
to those for Pmx. Pmx inhibited cell growth in both the R1-11-PCFT4 and R1-11-RFC6
lines with IC50 values of 59.3 nM (± 7.37; standard error mean (SEM)) and 81.7 nM (±
5.49), respectively (Figure 3, panel B), demonstrating its lack of specificity for hPCFT
over hRFC in spite of its high PCFT substrate activity (Kugel Desmoulin et al., 2010b;
Zhao et al., 2008). Conversely, compound 1 inhibited cell growth in R1-11-PCFT4 cells
(IC50 = 99.2 ± 20.2 nM) but not R1-11-RFC6 (Figure 3, panel C), indicating selective
hPCFT transport. In HepG2 cells, both Pmx (IC50 = 40.63 ± 4.52 nM) and compound 1
(IC50 = 227.50 ± 8.98 nM) were growth inhibitory. The decreased sensitivity to
compound 1 for HepG2 cells compared to R1-11-PCFT4 cells likely reflects the presence
of hRFC in HepG2 cells. Although not active for transport with compound 1, hRFC still
transports folates and elevates intracellular folate pools, resulting in decreased cytotoxic
drug effects on this basis.
Proliferation assays were extended to include colony-forming assays, in which R1-11-
PCFT4 cells were exposed to a range of concentrations (1-10 μM) of compound 1 (Figure
This article has not been copyedited and formatted. The final version may differ from this version.Molecular Pharmacology Fast Forward. Published on September 22, 2011 as DOI: 10.1124/mol.111.073833
at ASPE
T Journals on A
ugust 23, 2019m
olpharm.aspetjournals.org
Dow
nloaded from

MOL #73833
19
3, panel D) or Pmx (panel E) for 16, 24 or 48 h. Drug exposures were performed at pH
6.8, after which drugs were removed and colonies allowed to outgrow for 12 days in
standard culture media. As an inhibitor of colony formation, Pmx and compound 1
showed both concentration- and time-dependence, although this effect was more
pronounced for compound 1, and Pmx was more active at 16 h for the lower drug
concentrations. In spite of the latter, the maximum extent of inhibition after 48 h at 10
μM drug was greater for compound 1 (95%) than for Pmx (87%).
Collectively, these results demonstrate that compound 1, like Pmx, is cytotoxic toward
cells that express hPCFT and under acidic conditions (pH 6.8) achievable in solid tumors.
Unlike Pmx, compound 1 is selectively active toward cells expressing hPCFT and is
inactive toward cells expressing exclusively hRFC.
Transport characteristics for [3H]6-substituted pyrrolo[2,3-d]pyrimidine thienoyl
antifolate compound 1 in HeLa R1-11-PCFT4 and HepG2 cells. To directly measure
hPCFT membrane transport of the cytotoxic antifolates into HeLa R1-11-PCFT4 and
HepG2 cells, we used radiolabeled compound 1 and Pmx. For R1-11-PCFT4 cells,
uptake of [3H]compound 1 (0.25 μM) was time- and pH-dependent with maximum drug
accumulation at pH 5.5 (Figure 4, panels A-C). Uptake in R1-11-PCFT4 cells exceeded
that of its hPCFT-null isogenic counterpart (R1-11-mock transfectant), unequivocally
establishing transport of compound 1 by hPCFT. The modest time-dependent uptake in
the hPCFT-null R1-11-mock transfected subline was particularly obvious at 30 minutes
and likely reflects the presence of low levels of FR in these cells (Figure 3, panel A).
This article has not been copyedited and formatted. The final version may differ from this version.Molecular Pharmacology Fast Forward. Published on September 22, 2011 as DOI: 10.1124/mol.111.073833
at ASPE
T Journals on A
ugust 23, 2019m
olpharm.aspetjournals.org
Dow
nloaded from

MOL #73833
20
We compared the uptake of [3H]Pmx to that of [3H]compound 1 in HepG2 cells (Figure
4, panels D and E). For compound 1, pH-dependent uptake in HepG2 cells showed a
similar profile (despite the ~2-fold increased net uptake) to R1-11-PCFT4 HeLa cells.
Net uptake of [3H]Pmx exceeded that of [3H]compound 1 in HepG2 cells by ~50-100%
and showed a greater uptake fraction at neutral pH, most likely due to the presence of
hRFC in HepG2 cells (Figure 3, panel A).
We measured transport kinetics over 2 minutes for [3H]compound 1 and [3H]Pmx in R1-
11-PCFT4 cells using a range of drug concentrations at pH 5.5 and pH 6.8 (Table 1). The
data show nearly identical Kt values for compound 1 and Pmx at pH 5.5 and only modest
(within ~40%) differences in Vmax. Increases in both Kt (increased ~300- to 400-fold,
respectively, compared to values at pH 5.5) and Vmax values (~70% increased) were
measured at pH 6.8. Vmax/Kt ratios for compound 1 and Pmx were similar (within ~2-
fold) at both pH 5.5 and pH 6.8.
These results establish that for both R1-11-PCFT4 and HepG2 cells, compound 1 is an
excellent substrate for hPCFT, essentially equivalent to Pmx.
Polyglutamylation of the 6-substituted pyrrolo[2,3-d]pyrimidine thienoyl antifolate
compound 1 in R1-11-PCFT4 and HepG2 cells. Polyglutamylation of classical
antifolates is a critical factor in drug activity, since these conjugated drug forms are
retained within cells and they typically inhibit folate-dependent enzyme targets to a
greater extent than their non-polyglutamyl forms (Goldman and Matherly, 1985; Shane,
1989). To assess the extent of this metabolism for compound 1 in R1-11-PCFT4 and
This article has not been copyedited and formatted. The final version may differ from this version.Molecular Pharmacology Fast Forward. Published on September 22, 2011 as DOI: 10.1124/mol.111.073833
at ASPE
T Journals on A
ugust 23, 2019m
olpharm.aspetjournals.org
Dow
nloaded from
MOL #73833
21
HepG2 cells, cells were treated with 1 μM [3H]compound 1 for 16 h at pH 6.8 in the
presence adenosine (60 μM). For HepG2 cells, parallel incubations were performed with
[3H]Pmx [in presence of thymidine (10 μM) and/or adenosine] . [3H] metabolites were
extracted and analyzed by reverse phase HPLC (Figure 5 shows an HPLC chromatograph
for compound 1 in HepG2 cells; additional results for R1-11-PCFT4 and HepG2 cells are
included in the Supplement, Figure 2S, panels A and B). Up to five polyglutamyl
metabolites of [3H]compound 1 and [3H]Pmx (PG2-6) were resolved by HPLC. The
identities of the peaks were confirmed by comparing elution times with those for Mtx
polyglutamyl standards and by treatment with chicken pancreas conjugase which reverted
the majority of the polyglutamyl metabolites to the parental drug (Supplement, Figure 2S,
panel C).
The distributions of the individual compound 1 and Pmx drug forms in R1-11-PCFT4
and HepG2 cells are summarized in Table 2. Although there were differences in the
relative amounts of total intracellular compound 1 between the R1-11-PCFT4 and HepG2
sublines (as expected from the transport results in Figure 4), in both cases compound 1
was predominately polyglutamylated (64% and 84% of the total intracellular drug,
respectively). For HepG2 cells, the increased accumulation of [3H]compound 1 over that
of R1-11-PCFT4 cells was reflected in the polyglutamate levels. Analogous results were
obtained with [3H]Pmx in HepG2 cells, although the net extent of drug uptake and
metabolism of [3H]Pmx was elevated over that of [3H]compound 1.
This article has not been copyedited and formatted. The final version may differ from this version.Molecular Pharmacology Fast Forward. Published on September 22, 2011 as DOI: 10.1124/mol.111.073833
at ASPE
T Journals on A
ugust 23, 2019m
olpharm.aspetjournals.org
Dow
nloaded from
MOL #73833
22
Collectively, these results establish that, like Pmx, compound 1 is an excellent substrate
for polyglutamylation under conditions (pH 6.8) that favor its membrane transport by
hPCFT.
Validation of GARFTase and de novo purine nucleotide biosynthesis as primary
cellular targets for compound 1 in R1-11-PCFT4 cells. We previously reported that the
principal intracellular target of compound 1 in hPCFT-expressing CHO cells is
GARFTase (Wang et al., 2010), the first folate-dependent enzyme in de novo purine
nucleotide biosynthesis. To confirm this result in R1-11-PCFT4 HeLa cells under acidic
conditions (pH 6.8) that favor PCFT transport, we used an in situ metabolic assay which
measures incorporation of [14C]glycine into [14C]formyl GAR as a read-out for
GARFTase inhibition. Results were compared to those of Pmx, an established GARFTase
inhibitor, along with its documented effects on thymidylate synthase (Chattopadhyay et
al., 2007) and 5-amino-4-imidazolecarboxamide ribonucleotide formyltransferase
(AICARFTase) (Racanelli et al., 2009) (Figure 6). IC50s for GARFTase inhibition in R1-
11-PCFT4 cells by compound 1 and Pmx were 43.6 nM and 69.7 nM, respectively. While
the IC50 for GARFTase inhibition by compound 1 closely approximated the IC50 for
growth inhibition of R1-11-PCFT4 cells (Figure 3, panel C), GARFTase inhibition by
Pmx was incomplete up to 5 μM. Analogous results were described for Pmx with hPCFT-
expressing CHO cells (R2/hPCFT4) (Kugel Desmoulin et al., 2010b) and in CCRF-CEM
cells by Racanelli et al. (Racanelli et al., 2009).
To confirm that potent inhibition of GARFTase in R1-11-PCFT4 cells by compound 1
also results in decreased ATP pools, we measured intracellular ATP levels in cells treated
This article has not been copyedited and formatted. The final version may differ from this version.Molecular Pharmacology Fast Forward. Published on September 22, 2011 as DOI: 10.1124/mol.111.073833
at ASPE
T Journals on A
ugust 23, 2019m
olpharm.aspetjournals.org
Dow
nloaded from

MOL #73833
23
with 10 μM compound 1 for 16, 24 and 48h under acidic conditions (pH 6.8), analogous
to those used for our clonogenicity studies (Figure 3D). Compound 1 caused a time-
dependent decrease in cellular ATP levels, such that treatment for 48 h led to an 88%
decrease in ATP pools (Figure 7, panel A).
These results demonstrate that hPCFT-delivery of compound 1 is an efficient mode of
drug uptake which effects a potent inhibition of GARFTase and ATP depletion in R1-11-
PCFT4 cells.
Effect of compound 1 on cell cycle progression and apoptosis induction in R1-11-
PCFT4 cells. To determine the impact of GARFTase inhibition and ATP depletion on
cell cycle progression, we treated R1-11-PCFT4 cells with compound 1 (10 μM) for 48 h
at pH 6.8, along with a vehicle control. Cells were fixed, stained with PI, and analyzed
for cell cycle distribution by flow cytometry. Treatment with 10 μM compound 1 caused
an accumulation of cells in S-phase such that 38.9% of cells were in S-phase, compared
to 16.8% of the control (Figure 7, panel B and Supplement 3S). When a range of
concentrations (0.5, 1, 5, and 10 μM) of compound 1 were tested for their abilities to
induce S-phase accumulation, we found that maximal arrest was achieved at 1 μM.
Since treatment with compound 1 (10 μM, 48 h at pH 6.8) causes loss of clonogencity in
R1-11-PCFT4 cells (Figure 3D) and a modest increase in the sub-G1 fraction (Figure
7B), we were interested in measuring apoptosis under these same conditions using
annexin V/PI staining. Results were compared to those for R1-11-PCFT4 cells treated
with etoposide (5 μM) and with a no-drug control. Whereas etoposide strongly induced
This article has not been copyedited and formatted. The final version may differ from this version.Molecular Pharmacology Fast Forward. Published on September 22, 2011 as DOI: 10.1124/mol.111.073833
at ASPE
T Journals on A
ugust 23, 2019m
olpharm.aspetjournals.org
Dow
nloaded from
MOL #73833
24
apoptosis (12.2% early apoptotic and 22.3% late apoptotic/necrotic) compared to the
negative control (2.9% and 10.3%, respectively), compound 1 was less apoptotic (8.4%
and 15.7%, respectively) (Figure 7, panel C). These results are consistent with previous
reports that GARFTase inhibitors are distinctly cytotoxic, yet modestly apoptotic (Deng
et al., 2008; Smith et al., 1993).
In vivo efficacy study of compound 1 against HepG2 xenografts. As proof-of-concept
that in vivo antitumor efficacy can result from tumor targeting of compound 1 via its
transport by hPCFT, an in vivo efficacy trial was performed with 8 week old female ICR
SCID mice implanted with subcutaneous HepG2 tumors, which express hPCFT and
hRFC but not FRα (Figure 3A). Mice were maintained ad libitum on folate-deficient or
standard folate-replete diets. Serum folate concentrations were measured in mice after 14
days on the folate-deficient diet by an L. casei bioassay; the value was 90.2 nM (median)
[range = 79.2-120.7 nM (n=3)]. This value slightly exceeds serum folate levels (31 and
35 nM, respectively) previously reported in humans (Ganji and Kafai, 2009). With the
standard diet, by comparison, serum folate was 715.2 nM (median) [range = 652.8-742.8
nM (n=3)]. For the trial, control and drug treatment groups were non-selectively
randomized (five mice/group); compound 1 was administered intravenously on a Q4dx3
day schedule (180 mg/kg per injection) on days 4, 8, and 12 post-implantation (total dose
540 mg/kg). Results were compared to those for taxol (Q2dx6; 7.5 mg/kg per injection).
Mice were weighed daily and tumors were measured 2-3 times per week. For the mice
maintained on the folate-deficient diet, appreciable antitumor activity was recorded with
compound 1 (T/C of 0% on day 21; T-C = 13 days; 1.4 gross log kill) (Figure 8),
exceeding that for taxol (T/C=16%; 0.8 gross log kill). Antitumor drug efficacy for 1 was
This article has not been copyedited and formatted. The final version may differ from this version.Molecular Pharmacology Fast Forward. Published on September 22, 2011 as DOI: 10.1124/mol.111.073833
at ASPE
T Journals on A
ugust 23, 2019m
olpharm.aspetjournals.org
Dow
nloaded from

MOL #73833
25
completely abolished (99% T/C) for the standard folate-replete diet. The treatment
regimen was well tolerated with dose-limiting symptoms manifesting as reversible body
weight loss for mice maintained on the folate-deficient diet. Results for the in vivo
efficacy experiment shown in Figure 8 are summarized in Table 3S in the supplement.
The results of the in vivo efficacy trial demonstrate potent antitumor activity for
compound 1 toward subcutaneously engrafted HepG2 tumors associated with significant
transport by hPCFT and a lack of membrane transport by hRFC.
DISCUSSION
In this study, we significantly expand upon previous reports (Kugel Desmoulin et al.,
2010b; Zhao and Goldman, 2007) suggesting that PCFT may be therapeutically
exploitable for treating solid tumors. We found that hPCFT, like hRFC, was widely and
highly expressed in an extensive panel of human solid tumor cell lines but not in human
leukemias. Another group showed that low pH transport activity of Mtx was prominent in
human tumor cell lines (Zhao et al., 2004), in direct support of the findings reported
herein. Twelve of the human sublines were included in both studies and for these there
was reasonable correlation between hPCFT and hRFC transcript levels and transport
activity at pH 5.5 and 7.4, respectively. We further show herein that the novel 6-
substituted pyrrolo[2,3-d]pyrimidine thienoyl antifolate compound 1 can be selectively
transported by hPCFT in a pH- and time-dependent manner. The tumor models
employed, R1-11-PCFT4 HeLa and HepG2 cells, express similar levels of hPCFT,
although they differ in the presence of hRFC and FRα.
This article has not been copyedited and formatted. The final version may differ from this version.Molecular Pharmacology Fast Forward. Published on September 22, 2011 as DOI: 10.1124/mol.111.073833
at ASPE
T Journals on A
ugust 23, 2019m
olpharm.aspetjournals.org
Dow
nloaded from

MOL #73833
26
The premise behind our drug discovery efforts, exemplified by compound 1, is that
membrane transport of cytotoxic antifolates is a critical determinant of anti-tumor drug
selectivity. Compound 1 is not transported by the ubiquitously expressed RFC (Wang et
al., 2010). This is particularly important since drugs, such as compound 1, that target FRα
and/or PCFT, yet are not substrates for RFC, have the potential to selectively target tumor
cells and decrease toxicity to normal tissues. This is a substantial advantage over
chemotherapy drugs currently in use and indeed pursuing the development of these novel
antifolates could yield a new class of clinically relevant antitumor agents. Our previous
work used engineered CHO models, as well as KB (nasopharengeal) and IGROV1
(ovarian) human tumor cells, that express FRα and/or hPCFT to deliver cytotoxic
antifolates, including compound 1, that are not substrates for hRFC (Deng et al., 2008,
2009; Wang et al., 2010). The present report significantly expands upon this concept by
demonstrating exclusive transport of compound 1 by hPCFT into human tumor cell lines
at pHs reflecting those characterizing the tumor microenvironment. For R1-11-PCFT4
and HepG2 cells, following its internalization at pH 6.8, compound 1 was extensively
polyglutamylated, such that the predominant metabolite was the pentaglutamate form
(compound 1 conjugated to 4 glutamate residues). Moreover, compound 1 potently
inhibited GARFTase, leading to R1-11-PCFT4 HeLa cell death in vitro and HepG2 tumor
growth delay in vivo.
Expression of hPCFT transcripts and protein in normal human tissues is more restrictive
than for hRFC, with high hPCFT levels observed in the liver, kidney, and small intestine
and very low levels in the bone marrow and colon (Kugel Desmoulin et al., 2010a). This
pattern of PCFT transcripts was generally observed in mouse tissues (Qiu et al., 2007).
This article has not been copyedited and formatted. The final version may differ from this version.Molecular Pharmacology Fast Forward. Published on September 22, 2011 as DOI: 10.1124/mol.111.073833
at ASPE
T Journals on A
ugust 23, 2019m
olpharm.aspetjournals.org
Dow
nloaded from
MOL #73833
27
Our finding that hPCFT transcripts are low in human bone marrow (Kugel Desmoulin et
al., 2010a) is particularly significant and suggests that hPCFT-targeted therapeutics may
be less marrow toxic than antifolates presently in clinical use.
The microenvironments for most normal tissues likely exhibit a neutral pH (Martin and
Jain, 1994), such that even if PCFT is present, the electrochemical proton gradient is
reduced, leading to less accumulation of PCFT substrates such as compound 1.
Conversely, RFC would exhibit a far greater activity under these conditions. This, when
combined with the greater capacity of RFC to transport reduced folates across the cell
membrane compared to PCFT (Zhao et al., 2008), would result in elevated levels of
cellular folates in normal tissues. The increased availability of reduced folates would
result in competition with internalized antifolates for polyglutamylation and/or for
binding to intracellular drug targets (e.g., GARFTase), thus protecting normal cells from
drug cytotoxicity. Similarly, for PCFT-targeted agents in solid tumors, if sufficient RFC
was present, enough transport of folates may occur even at slightly acidic pHs to decrease
drug efficacy on this basis. This implies that the ratio of PCFT to RFC in tumors is
critical to antitumor activities of PCFT-selective cytotoxic antifolates and that Mtx
resistant tumors that have substantially lost RFC function may be exquisitely sensitive to
the effects of PCFT-selective drugs such as compound 1. Thus, for compound 1 and
related agents, tumor selectivity is not only reliant upon differential PCFT levels between
normal tissues and solid tumors, but it is also impacted by interstitial pH, and activity of
RFC.
This article has not been copyedited and formatted. The final version may differ from this version.Molecular Pharmacology Fast Forward. Published on September 22, 2011 as DOI: 10.1124/mol.111.073833
at ASPE
T Journals on A
ugust 23, 2019m
olpharm.aspetjournals.org
Dow
nloaded from
MOL #73833
28
Another consideration involves the purine salvage pathway. Methylthioadenosine
phosphorylase (MTAP) is an enzyme that releases adenine and 5-deoxy-5-
(methylthio)ribose-1-phosphate (MTRP) from methylthioadenosine formed during
polyamine biosynthesis (Illei et al., 2003). Adenine is used in purine salvage and MTRP
is subsequently recycled to methionine. Whereas MTAP has been reported to be
abundantly expressed in normal tissues, in many solid tumors the MTAP gene is co-
deleted with CDKN2A (encodes p16INK4A) (Illei et al., 2003). Thus, many solid tumors
are deficient in purine salvage and functional purine salvage in normal tissues would
theoretically protect cells from cell death caused by GARFTase inhibition, increasing
tumor cell selectivity for agents such as compound 1 (Hori et al., 1996).
It is interesting that under nearly the same conditions, the IC50 for GARFTase inhibition
in R1-11-PCFT4 cells by the in situ GARFTase assay is virtually identical to the IC50 for
inhibition of cell proliferation. This result differs somewhat from our previous finding
with an analogous 6-substituted pyrrolo[2,3-d]pyrimidine benozyl antifolate in CHO
cells, for which the IC50 for GARFTase inhibition was substantially lower, suggesting that
sustained GARFTase inhibition was necessary to manifest as cytotoxicity (Kugel
Desmoulin et al., 2010b). This quantitative difference may reflect differences in the size
of purine pools between the human and hamster sublines such that R1-11-PCFT4 HeLa
cells would be more sensitive to the inhibition of GARFTase. Of course, other factors
could also contribute. For instance, differences in drug polyglutamylation and
polyglutamate turnover could result in disparate potencies for sustained GARFTase
inhibition in different cell lines.
This article has not been copyedited and formatted. The final version may differ from this version.Molecular Pharmacology Fast Forward. Published on September 22, 2011 as DOI: 10.1124/mol.111.073833
at ASPE
T Journals on A
ugust 23, 2019m
olpharm.aspetjournals.org
Dow
nloaded from
MOL #73833
29
Finally, our studies with compound 1 assess the impact of GARFTase inhibition on ATP
levels and the mechanism(s) of tumor cell death. Treatment of R1-11-PCFT4 cells with
compound 1 substantially reduced ATP levels and caused S-phase accumulation.
Apoptosis resulting from compound 1 was reduced compared to etoposide. This could (at
least in part) reflect the requirement of ATP for apoptosis, as ATP levels must be
maintained above a minimal level for apoptosis induction (Tsujimoto, 1997).
In conclusion, our in vitro studies suggest the feasibility of using hPCFT and the acidic
tumor microenvironment to selectively deliver a novel PCFT-targeted antifolate to human
solid tumors. Our in vivo results with HepG2 tumor cells that express only hPCFT and
hRFC provide compelling proof-of-principle validation and rationale for developing
drugs whose transport by PCFT, but not RFC, allows for GARFTase inhibition.
ACKNOWLEDGEMENTS
We thank Dr. I. David Goldman for his generous gifts of the R1-11 HeLa cell line series
(R1-11-mock, R1-11-RFC6, and R1-11-PCFT4). We thank Ms. Kelly Haagenson for her
editorial assistance in preparing this manuscript.
AUTHORSHIP CONTRIBUTIONS
Participated in research design: S. Kugel Desmoulin, L. Wang, E. Hales, L. Polin, Z.
Hou, A., Gangjee, L.H. Matherly
Conducted experiments: S. Kugel Desmoulin, L. Wang, E. Hales, L. Polin, K. White, J.
Kushner, M. Stout, Z. Hou, C. Cherian
This article has not been copyedited and formatted. The final version may differ from this version.Molecular Pharmacology Fast Forward. Published on September 22, 2011 as DOI: 10.1124/mol.111.073833
at ASPE
T Journals on A
ugust 23, 2019m
olpharm.aspetjournals.org
Dow
nloaded from

MOL #73833
30
Performed data analysis: S. Kugel Desmoulin, L. Wang, E. Hales, L. Polin, M. Stout, Z.
Hou, A. Gangjee, L.H. Matherly
Wrote or contributed to the writing of the manuscript: S. Kugel Desmoulin, L. Wang, E.
Hales, L. Polin, A. Gangjee, L.H. Matherly
This article has not been copyedited and formatted. The final version may differ from this version.Molecular Pharmacology Fast Forward. Published on September 22, 2011 as DOI: 10.1124/mol.111.073833
at ASPE
T Journals on A
ugust 23, 2019m
olpharm.aspetjournals.org
Dow
nloaded from

MOL #73833
31
REFERENCES
Beardsley GP, Moroson BA, Taylor EC and Moran RG (1989) A new folate antimetabolite, 5,10-dideaza-5,6,7,8-tetrahydrofolate is a potent inhibitor of de novo purine synthesis. J Biol Chem 264(1):328-333.
Chattopadhyay S, Moran RG and Goldman ID (2007) Pemetrexed: biochemical and cellular pharmacology, mechanisms, and clinical applications. Mol Cancer Ther 6(2):404-417.
Deng Y, Wang Y, Cherian C, Hou Z, Buck SA, Matherly LH and Gangjee A (2008) Synthesis and discovery of high affinity folate receptor-specific glycinamide ribonucleotide formyltransferase inhibitors with antitumor activity. J Med Chem 51(16):5052-5063.
Deng Y, Zhou X, Kugel Desmoulin S, Wu J, Cherian C, Hou Z, Matherly LH and Gangjee A (2009) Synthesis and biological activity of a novel series of 6-substituted thieno[2,3-d]pyrimidine antifolate inhibitors of purine biosynthesis with selectivity for high affinity folate receptors over the reduced folate carrier and proton-coupled folate transporter for cellular entry. J Med Chem 52(9):2940-2951.
Elnakat H and Ratnam M (2004) Distribution, functionality and gene regulation of folate receptor isoforms: implications in targeted therapy. Adv Drug Deliv Rev 56(8):1067-1084.
Fais S, De Milito A, You H and Qin W (2007) Targeting vacuolar H+-ATPases as a new strategy against cancer. Cancer Res 67(22):10627-10630.
Farber S and Diamond LK (1948) Temporary remissions in acute leukemia in children produced by folic acid antagonist, 4-aminopteroyl-glutamic acid. N Engl J Med 238(23):787-793.
Ganji V and Kafai MR (2009) Demographic, lifestyle, and health characteristics and serum B vitamin status are determinants of plasma total homocysteine concentration in the post-folic acid fortification period, 1999-2004. J Nutr 139(2):345-352.
Gibbs DD, Theti DS, Wood N, Green M, Raynaud F, Valenti M, Forster MD, Mitchell F, Bavetsias V, Henderson E and Jackman AL (2005) BGC 945, a novel tumor-selective thymidylate synthase inhibitor targeted to alpha-folate receptor-overexpressing tumors. Cancer Res 65(24):11721-11728.
Goldman ID and Matherly LH (1985) The cellular pharmacology of methotrexate. Pharmacol Ther 28(1):77-102.
Helmlinger G, Yuan F, Dellian M and Jain RK (1997) Interstitial pH and pO2 gradients in solid tumors in vivo: high-resolution measurements reveal a lack of correlation. Nat Med 3(2):177-182.
Hilgenbrink AR and Low PS (2005) Folate receptor-mediated drug targeting: from therapeutics to diagnostics. J Pharm Sci 94(10):2135-2146.
Hori H, Tran P, Carrera CJ, Hori Y, Rosenbach MD, Carson DA and Nobori T (1996) Methylthioadenosine phosphorylase cDNA transfection alters sensitivity to depletion of purine and methionine in A549 lung cancer cells. Cancer Res 56(24):5653-5658.
This article has not been copyedited and formatted. The final version may differ from this version.Molecular Pharmacology Fast Forward. Published on September 22, 2011 as DOI: 10.1124/mol.111.073833
at ASPE
T Journals on A
ugust 23, 2019m
olpharm.aspetjournals.org
Dow
nloaded from
MOL #73833
32
Huang D, Zhang Y and Chen X (2003) Analysis of intracellular nucleoside triphosphate levels in normal and tumor cell lines by high-performance liquid chromatography. J Chromatogr B Analyt Technol Biomed Life Sci 784(1):101-109.
Illei PB, Rusch VW, Zakowski MF and Ladanyi M (2003) Homozygous deletion of CDKN2A and codeletion of the methylthioadenosine phosphorylase gene in the majority of pleural mesotheliomas. Clin Cancer Res 9(6):2108-2113.
Kugel Desmoulin S, Wang Y, Tait L, Hou Z, Cherian C, Gangjee A and Matherly LH (2010a) Expression profiling of the major folate facilitative transporters in human tumors and normal tissues. Abstracts, American Association for Cancer Research 51:1103.
Kugel Desmoulin S, Wang Y, Wu J, Stout M, Hou Z, Fulterer A, Chang MH, Romero MF, Cherian C, Gangjee A and Matherly LH (2010b) Targeting the proton-coupled folate transporter for selective delivery of 6-substituted pyrrolo[2,3-d]pyrimidine antifolate inhibitors of de novo purine biosynthesis in the chemotherapy of solid tumors. Mol Pharmacol 78(4):577-587.
Lowry OH, Rosebrough NJ, Farr AL and Randall RJ (1951) Protein measurement with the Folin phenol reagent. J Biol Chem 193(1):265-275.
Martin GR and Jain RK (1994) Noninvasive measurement of interstitial pH profiles in normal and neoplastic tissue using fluorescence ratio imaging microscopy. Cancer Res 54(21):5670-5674.
Matherly LH, Hou Z and Deng Y (2007) Human reduced folate carrier: translation of basic biology to cancer etiology and therapy. Cancer Metastasis Rev 26(1):111-128.
Matherly LH, Voss MK, Anderson LA, Fry DW and Goldman ID (1985) Enhanced polyglutamylation of aminopterin relative to methotrexate in the Ehrlich ascites tumor cell in vitro. Cancer Res 45(3):1073-1078.
Mendelsohn LG, Worzalla JF and Walling JM (1999) Preclinical and Clinical Evaluation of the Glycinamide Ribonucleotide Formyltransferase Inhibitors Lometrexol and LY309887, in Anticancer Drug Development Guide: Antifolate Drugs in Cancer Therapy (Jackman AL ed) pp 261-280, Humana Press, Inc., Totowa, NJ.
Monahan BP and Allegra CJ (2006) Antifolates, in Cancer Chemotherapy and Biotherapy (Chabner BA, Longo, D.L. ed) pp 91-124, Lippincott Williams and Wilkins, Philadelphia, PA.
Nakai Y, Inoue K, Abe N, Hatakeyama M, Ohta KY, Otagiri M, Hayashi Y and Yuasa H (2007) Functional characterization of human proton-coupled folate transporter/heme carrier protein 1 heterologously expressed in mammalian cells as a folate transporter. J Pharmacol Exp Ther 322(2):469-476.
Qiu A, Jansen M, Sakaris A, Min SH, Chattopadhyay S, Tsai E, Sandoval C, Zhao R, Akabas MH and Goldman ID (2006) Identification of an intestinal folate transporter and the molecular basis for hereditary folate malabsorption. Cell 127(5):917-928.
Qiu A, Min SH, Jansen M, Malhotra U, Tsai E, Cabelof DC, Matherly LH, Zhao R, Akabas MH and Goldman ID (2007) Rodent intestinal folate transporters (SLC46A1): secondary structure, functional properties, and response to dietary folate restriction. Am J Physiol Cell Physiol 293(5):C1669-1678.
Racanelli AC, Rothbart SB, Heyer CL and Moran RG (2009) Therapeutics by cytotoxic metabolite accumulation: pemetrexed causes ZMP accumulation, AMPK
This article has not been copyedited and formatted. The final version may differ from this version.Molecular Pharmacology Fast Forward. Published on September 22, 2011 as DOI: 10.1124/mol.111.073833
at ASPE
T Journals on A
ugust 23, 2019m
olpharm.aspetjournals.org
Dow
nloaded from
MOL #73833
33
activation, and mammalian target of rapamycin inhibition. Cancer Res 69(13):5467-5474.
Raghunand N, Altbach MI, van Sluis R, Baggett B, Taylor CW, Bhujwalla ZM and Gillies RJ (1999) Plasmalemmal pH-gradients in drug-sensitive and drug-resistant MCF-7 human breast carcinoma xenografts measured by 31P magnetic resonance spectroscopy. Biochem Pharmacol 57(3):309-312.
Salazar MD and Ratnam M (2007) The folate receptor: what does it promise in tissue-targeted therapeutics? Cancer Metastasis Rev 26(1):141-152.
Shane B (1989) Folylpolyglutamate synthesis and role in the regulation of one-carbon metabolism. Vitam Horm 45:263-335.
Smith SG, Lehman NL and Moran RG (1993) Cytotoxicity of antifolate inhibitors of thymidylate and purine synthesis to WiDr colonic carcinoma cells. Cancer Res 53(23):5697-5706.
Tsujimoto Y (1997) Apoptosis and necrosis: intracellular ATP level as a determinant for cell death modes. Cell Death Differ 4(6):429-434.
Varela-Moreiras G and Selhub J (1992) Long-term folate deficiency alters folate content and distribution differentially in rat tissues. J Nutr 122(4):986-991.
Wang L, Cherian C, Kugel Desmoulin S, Polin L, Deng Y, Wu J, Hou Z, White K, Kushner J, Matherly LH and Gangjee A (2010) Synthesis and antitumor activity of a novel series of 6-substituted pyrrolo[2,3-d]pyrimidine thienoyl antifolate inhibitors of purine biosynthesis with selectivity for high affinity folate receptors and the proton-coupled folate transporter over the reduced folate carrier for cellular entry. J Med Chem 53(3):1306-1318.
Wike-Hooley JL, Haveman J and Reinhold HS (1984) The relevance of tumour pH to the treatment of malignant disease. Radiother Oncol 2(4):343-366.
Zhao R, Gao F, Hanscom M and Goldman ID (2004) A prominent low-pH methotrexate transport activity in human solid tumors: contribution to the preservation of methotrexate pharmacologic activity in HeLa cells lacking the reduced folate carrier. Clin Cancer Res 10(2):718-727.
Zhao R and Goldman ID (2003) Resistance to antifolates. Oncogene 22(47):7431-7457. Zhao R and Goldman ID (2007) The molecular identity and characterization of a Proton-
coupled Folate Transporter--PCFT; biological ramifications and impact on the activity of pemetrexed. Cancer Metastasis Rev 26(1):129-139.
Zhao R, Matherly LH and Goldman ID (2009) Membrane transporters and folate homeostasis: intestinal absorption and transport into systemic compartments and tissues. Expert Rev Mol Med 11:e4.
Zhao R, Qiu A, Tsai E, Jansen M, Akabas MH and Goldman ID (2008) The proton-coupled folate transporter: impact on pemetrexed transport and on antifolates activities compared with the reduced folate carrier. Mol Pharmacol 74(3):854-862.
This article has not been copyedited and formatted. The final version may differ from this version.Molecular Pharmacology Fast Forward. Published on September 22, 2011 as DOI: 10.1124/mol.111.073833
at ASPE
T Journals on A
ugust 23, 2019m
olpharm.aspetjournals.org
Dow
nloaded from
MOL #73833
34
FOOTNOTES
This study was supported by grants from the National Cancer Institute, National Institutes
of health [CA53535, CA152316, CA125153], a pilot grant from the Barbara Ann
Karmanos Cancer Institute, and a grant from the Mesothelioma Applied Research
Foundation. Ms. Kugel Desmoulin was supported by a Doctoral Research Award from
the Canadian Institutes of Health Research (CIHR).
L.H. Matherly and A. Gangjee contributed equally to this work.
To whom correspondence should be addressed:
L.H. Matherly, Developmental Therapeutics Program, Barbara Ann Karmanos Cancer
Institute, 110 E. Warren Ave, Detroit, MI 48201. Tel.: 313-578-4280; Fax: 313-578-
4287; Email: [email protected]
A. Gangjee, Division of Medicinal Chemistry, Graduate School of Pharmaceutical
Sciences, Duquesne University, 600 Forbes Avenue, Pittsburgh, PA 15282. 412-396-
6070; 412-396-5593 fax; [email protected]
This article has not been copyedited and formatted. The final version may differ from this version.Molecular Pharmacology Fast Forward. Published on September 22, 2011 as DOI: 10.1124/mol.111.073833
at ASPE
T Journals on A
ugust 23, 2019m
olpharm.aspetjournals.org
Dow
nloaded from
MOL #73833
35
FIGURE LEGENDS
Figure 1. Structure of 6-substituted pyrrolo[2,3-d]pyrimidine thienoyl antifolate
compound (Wang et al., 2010).
Figure 2. PCFT and RFC expression in human solid tumor cell lines. hPCFT (upper
panel) and hRFC (lower panel) transcripts were measured in 53 human solid tumor cell
lines by real-time RT-PCR from total RNAs using a Roche480 Light-cycler. Transcript
levels were normalized to GAPDH transcripts. Experimental details are provided in the
Materials and Methods. Results for FRα and for transporter levels in 27 human leukemia
cell lines are included in Figure 1S, panels B-E (Supplement). A table summarizing the
characteristics of the 53 tumor and 27 leukemia cell lines is also included in Table 1S
(Supplement).
Figure 3. Characterization of folate transporter expression and compound 1 and
Pmx growth inhibition and inhibition of colony formation in R1-11 sublines and
HepG2 cells. (A) FRα, hPCFT and hRFC transcript levels in R1-11 sublines and HepG2
cells was measured by real-time reverse transcriptase PCR. (B and C) Growth inhibition
curves for folate-depleted R1-11-PCFT4 and -RFC6 cells treated with Pmx or compound
1 for 96 h are shown. (D and E) R1-11-PCFT4 cells were plated in 60 mm dishes at a
density of 500 cells per dish and allowed to adhere overnight. Cells were treated at pH
6.8 in the presence or absence of different concentrations of compound 1 or Pmx from 0
to 10 µM for 16, 24 and 48 h, followed by drug wash-out. Plates were scored by counting
This article has not been copyedited and formatted. The final version may differ from this version.Molecular Pharmacology Fast Forward. Published on September 22, 2011 as DOI: 10.1124/mol.111.073833
at ASPE
T Journals on A
ugust 23, 2019m
olpharm.aspetjournals.org
Dow
nloaded from

MOL #73833
36
visible colonies after 12 days (by staining with methylene blue) and presented as a
percent of vehicle control.
Figure 4. pH- and time-dependent transport of compound 1 and Pmx into R1-11-
PCFT4 and HepG2 cells. Direct hPCFT transport activity of compound 1 (A-D) and
Pmx (E) in R1-11-PCFT4 (A-C) and HepG2 (D and E) cells was assessed by measuring
uptake of 0.25 μM [3H]compound 1 or [3H]Pmx over 2-30 min at 37°C in complete
folate-free RPMI 1640 (pH 5.5, 6.8 and 7.2), supplemented with 10% dFBS, and 25 mM
HEPES/25 mM PIPES. Internalized [3H]compound 1 and [3H]Pmx were normalized to
total protein and expressed as pmol/mg protein.
Figure 5. HPLC analysis of polyglutamyl derivatives of compound 1 in HepG2 cells
at pH 6.8. HepG2 cells were treated with 1 µM [3H]compound 1 at pH 6.8 in the
presence of adenosine (60 μM) for 16 h. Polyglutamates were extracted by boiling in 50
mM phosphate buffer (pH 6.0) containing 100 mM 2-mercaptoethanol and separated on a
5 μm Spherisorb C-18 ODS-2 column (4.6 mm x 250mm) with a Nova-Pak 4 μm C-18
guard column. Fractions were collected and radioactivity was measured. Percent
monoglutamate and polyglutamate drug forms were determined by chromatographic
analysis and the total intracellular radiolabeled drug calculated in units of pmol/mg
protein (Table 2).
Figure 6. In situ GARFTase inhibition by compound 1 and Pmx in R1-11-PCFT4
cells. GARFTase activity and inhibition were evaluated in situ with R1-11-PCFT4 cells.
R1-11-PCFT4 cells were treated with drug for 16 h at pH 6.8 in complete folate-free
This article has not been copyedited and formatted. The final version may differ from this version.Molecular Pharmacology Fast Forward. Published on September 22, 2011 as DOI: 10.1124/mol.111.073833
at ASPE
T Journals on A
ugust 23, 2019m
olpharm.aspetjournals.org
Dow
nloaded from

MOL #73833
37
RPMI 1640 supplemented with 10% dFBS, and 25 mM HEPES and 25 mM PIPES
before incubating in the presence of 4 μM azaserine for 30 min, followed by [14C]glycine
and L-glutamine treatment. After 8 h, radioactive metabolites were extracted and
fractionated on 1 cm columns of AG1x8(Cl-) and the fractions were collected and
radioactivity measured. Accumulation of [14C]formyl GAR was calculated as a percent of
vehicle control over a range of antifolate concentrations.
Figure 7. Compound 1 treatment depletes ATP levels and induces an S-phase cell
arrest, accompanied by a modest level of apoptosis in R1-11-PCFT4 cells. (A) For
analysis of ATP levels, cells were treated with 10 μM compound 1 or left untreated
(DMSO) for 48 h at pH 6.8. Nucleotides were extracted and ATP pools were determined
by a modification of the HPLC method of Huang et al. (Huang et al., 2003), as previously
described (Kugel Desmoulin et al., 2010b). Details are provided in the Materials and
Methods. (B) The percentages of cells in each phase of the cell cycle (G1, S, and G2),
including those in the subG1 fraction, were determined in R1-11-PCFT4 cells treated
with a range of concentrations of compound 1 for 48 h by measuring the cellular DNA
content with PI staining and flow cytometry. Representative cell cycle profiles are shown
in the Supplement (Figure 3S). (C) Pseudo-color dot plots show the flow cytometric
analysis of cells stained with annexin V-FITC and PI. The percentages of viable cells
(annexin V-/PI-), early apoptotic cells (annexin V+/PI-), and late apoptotic/necrotic cells
(annexin V+/PI+) are noted. As a positive control, cells were treated with 5 μM
etoposide for 48 hrs at pH 6.8 to induce apoptosis.
This article has not been copyedited and formatted. The final version may differ from this version.Molecular Pharmacology Fast Forward. Published on September 22, 2011 as DOI: 10.1124/mol.111.073833
at ASPE
T Journals on A
ugust 23, 2019m
olpharm.aspetjournals.org
Dow
nloaded from

MOL #73833
38
Figure 8. in vivo efficacy trial of compound 1 in HepG2 xenografts. Female ICR
SCID mice were maintained on a folate-deficient diet ad libitum. Human HepG2 tumors
were implanted bilaterally and mice were non-selectively randomized into 5 mice/group.
Compound 1 [dissolved in 5% ethanol (v/v), 1% Tween-80 (v/v), 0.5% NaHCO3] was
administered on a Q4dx3 schedule intravenously on days 4, 8, and 12 (indicated with
arrows) at 180 mg/kg/injection. Taxol (dissolved in water) was administered on a Q2dx6
schedule (7.5 mg/kg/injection) beginning on day 4. Mice were observed and weighed
daily; tumors were measured twice per week. For the mice maintained on the folate-
deficient diet and treated with compound 1, appreciable antitumor activity was recorded
(T/C=0%; T-C=13 days; 1.4 gross log kill). Data are shown for the median tumor
burdens and are summarized in Table 3S in the Supplement.
This article has not been copyedited and formatted. The final version may differ from this version.Molecular Pharmacology Fast Forward. Published on September 22, 2011 as DOI: 10.1124/mol.111.073833
at ASPE
T Journals on A
ugust 23, 2019m
olpharm.aspetjournals.org
Dow
nloaded from
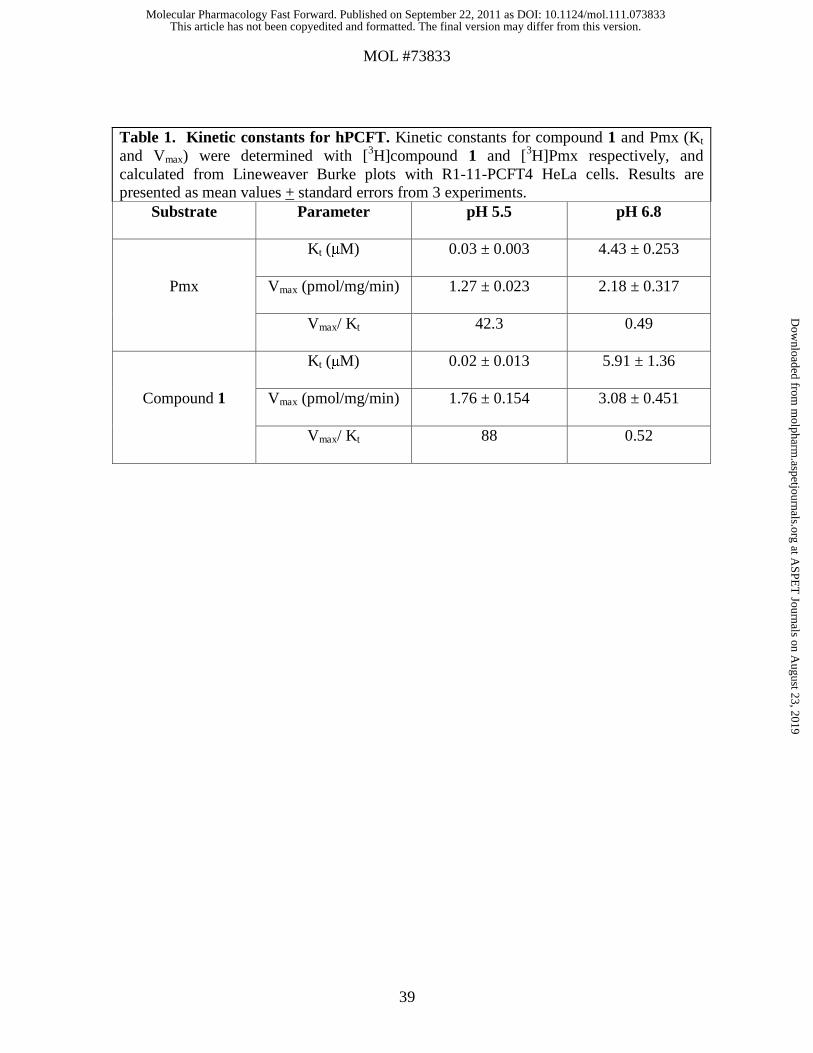
MOL #73833
39
Table 1. Kinetic constants for hPCFT. Kinetic constants for compound 1 and Pmx (Kt and Vmax) were determined with [3H]compound 1 and [3H]Pmx respectively, and calculated from Lineweaver Burke plots with R1-11-PCFT4 HeLa cells. Results are presented as mean values + standard errors from 3 experiments.
Substrate Parameter pH 5.5 pH 6.8
Pmx
Kt (μM) 0.03 ± 0.003 4.43 ± 0.253
Vmax (pmol/mg/min) 1.27 ± 0.023 2.18 ± 0.317
Vmax/ Kt 42.3 0.49
Compound 1
Kt (μM) 0.02 ± 0.013 5.91 ± 1.36
Vmax (pmol/mg/min) 1.76 ± 0.154 3.08 ± 0.451
Vmax/ Kt 88 0.52
This article has not been copyedited and formatted. The final version may differ from this version.Molecular Pharmacology Fast Forward. Published on September 22, 2011 as DOI: 10.1124/mol.111.073833
at ASPE
T Journals on A
ugust 23, 2019m
olpharm.aspetjournals.org
Dow
nloaded from
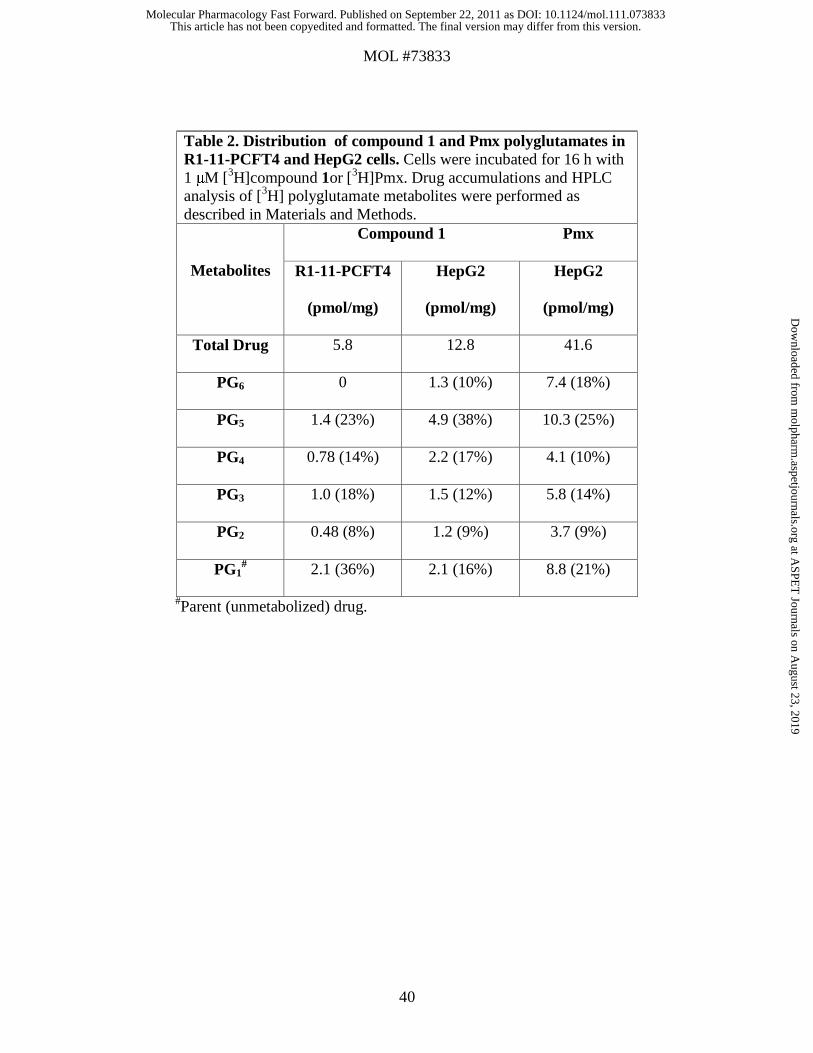
MOL #73833
40
Table 2. Distribution of compound 1 and Pmx polyglutamates in R1-11-PCFT4 and HepG2 cells. Cells were incubated for 16 h with 1 μM [3H]compound 1or [3H]Pmx. Drug accumulations and HPLC analysis of [3H] polyglutamate metabolites were performed as described in Materials and Methods.
Metabolites
Compound 1 Pmx
R1-11-PCFT4
(pmol/mg)
HepG2
(pmol/mg)
HepG2
(pmol/mg)
Total Drug 5.8 12.8 41.6
PG6 0 1.3 (10%) 7.4 (18%)
PG5 1.4 (23%) 4.9 (38%) 10.3 (25%)
PG4 0.78 (14%) 2.2 (17%) 4.1 (10%)
PG3 1.0 (18%) 1.5 (12%) 5.8 (14%)
PG2 0.48 (8%) 1.2 (9%) 3.7 (9%)
PG1# 2.1 (36%) 2.1 (16%) 8.8 (21%)
#Parent (unmetabolized) drug.
This article has not been copyedited and formatted. The final version may differ from this version.Molecular Pharmacology Fast Forward. Published on September 22, 2011 as DOI: 10.1124/mol.111.073833
at ASPE
T Journals on A
ugust 23, 2019m
olpharm.aspetjournals.org
Dow
nloaded from
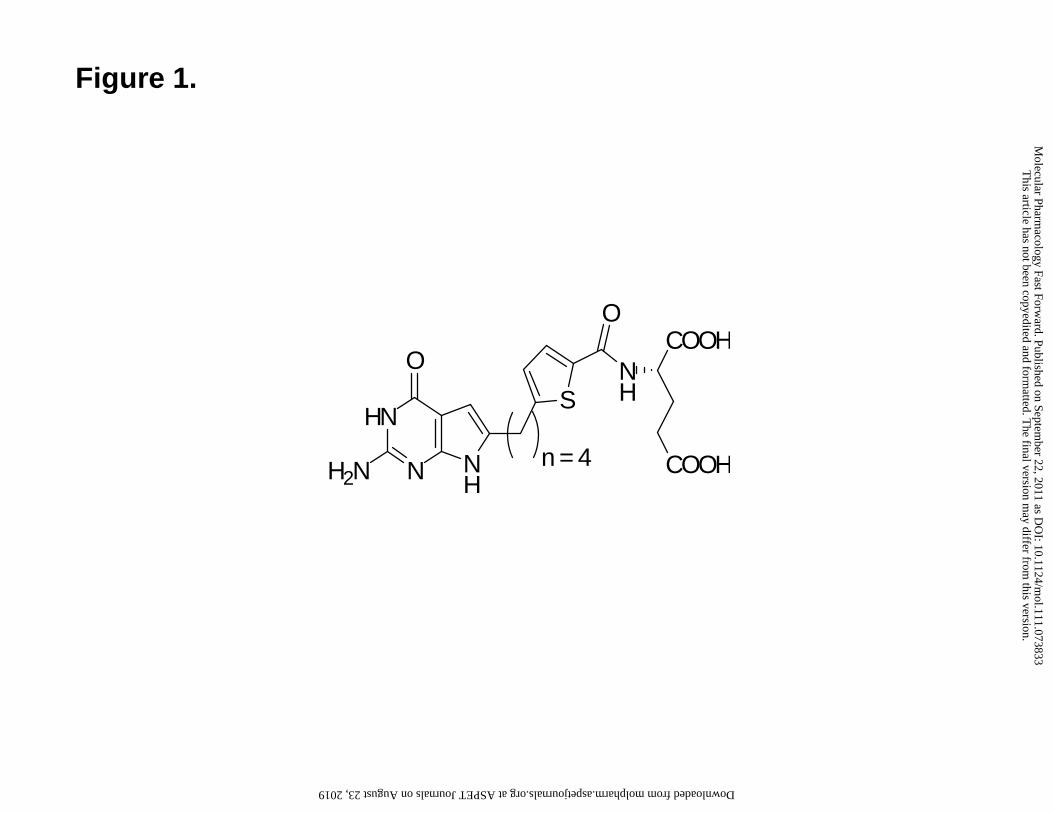
Figure 1.
HN
N NH
O
H2Nn = 4
SNH
OCOOH
COOH
This article has not been copyedited and form
atted. The final version m
ay differ from this version.
Molecular Pharm
acology Fast Forward. Published on Septem
ber 22, 2011 as DO
I: 10.1124/mol.111.073833
at ASPET Journals on August 23, 2019 molpharm.aspetjournals.org Downloaded from

TE
-85
HT
B16
6M
CF
-7M
DA
-MB
231
MD
A-M
B43
5T
-47D KB
HeL
aH
CT
-116
SW
-620
HC
T15
Cac
o-2
BC
PC
-3U
CV
A-1
786-
OA
CH
NIG
RO
V-1
OV
CA
R-3
SK
OV
-3H
epG
2H
ep3B Y79
SK
-ME
L5
SK
-ME
L28
HT
B13
9S
K-N
-SH
SK
-N-B
ES
K-N
-MC
HT
1080
PC
-3D
U-1
45H
1650
H21
22H
2030
H15
73H
1781
H32
55A
549
CR
L58
07C
RL
5872
CR
L58
10C
RL
5800
H59
6N
CI4
60H
69H
446
H22
6H
2373
H24
52H
2461
H25
91H
2595
H27
14
0.000
0.001
0.002
0.003
0.004
0.005
TE
-85
HT
B16
6M
CF
-7M
DA
-MB
231
MD
A-M
B43
5T
-47D K
BH
eLa
HC
T-1
16S
W-6
20H
CT
15C
aco
-2B
CP
C-3
UC
VA
-178
6-O
AC
HN
IGR
OV
-1O
VC
AR
-3S
KO
V-3
Hep
G2
Hep
3B Y79
SK
-ME
L5
SK
-ME
L28
HT
B13
9S
K-N
-SH
SK
-N-B
ES
K-N
-MC
HT
1080
PC
-3D
U-1
45H
1650
H21
22H
2030
H15
73H
1781
H32
55A
549
CR
L58
07C
RL
5872
CR
L58
10C
RL
5800
H59
6N
CI4
60H
69H
446
H22
6H
2373
H24
52H
2461
H25
91H
2595
H27
14
0.000
0.001
0.002
0.003
0.004
0.005
0.010.02 hPCFT
hRFC
Rel
ativ
e tr
ansc
rip
tsA
B
Rel
ativ
e tr
ansc
rip
tsFigure 2A and B.
This article has not been copyedited and form
atted. The final version m
ay differ from this version.
Molecular Pharm
acology Fast Forward. Published on Septem
ber 22, 2011 as DO
I: 10.1124/mol.111.073833
at ASPET Journals on August 23, 2019 molpharm.aspetjournals.org Downloaded from

R1-11
-RFC6
R1-11
-PCFT4
R1-11
-mock
HepG2
0.00
0.01
0.02
0.03
0.04
0.05
0.06FRαPCFTRFC
Rel
ativ
e tr
ansc
rip
ts
Compound 1
0.1 1 10 100 1000 100000
25
50
75
100
125R1-11-RFC6R1-11-PCFT4
Concentration (nM)
% C
ell
gro
wth
Figure 3A, B, and C. Pemetrexed
0.1 1 10 100 1000 100000
25
50
75
100
125R1-11-RFC6R1-11-PCFT4
Concentration (nM)
% C
ell
gro
wth
A
B
C
This article has not been copyedited and form
atted. The final version m
ay differ from this version.
Molecular Pharm
acology Fast Forward. Published on Septem
ber 22, 2011 as DO
I: 10.1124/mol.111.073833
at ASPET Journals on August 23, 2019 molpharm.aspetjournals.org Downloaded from
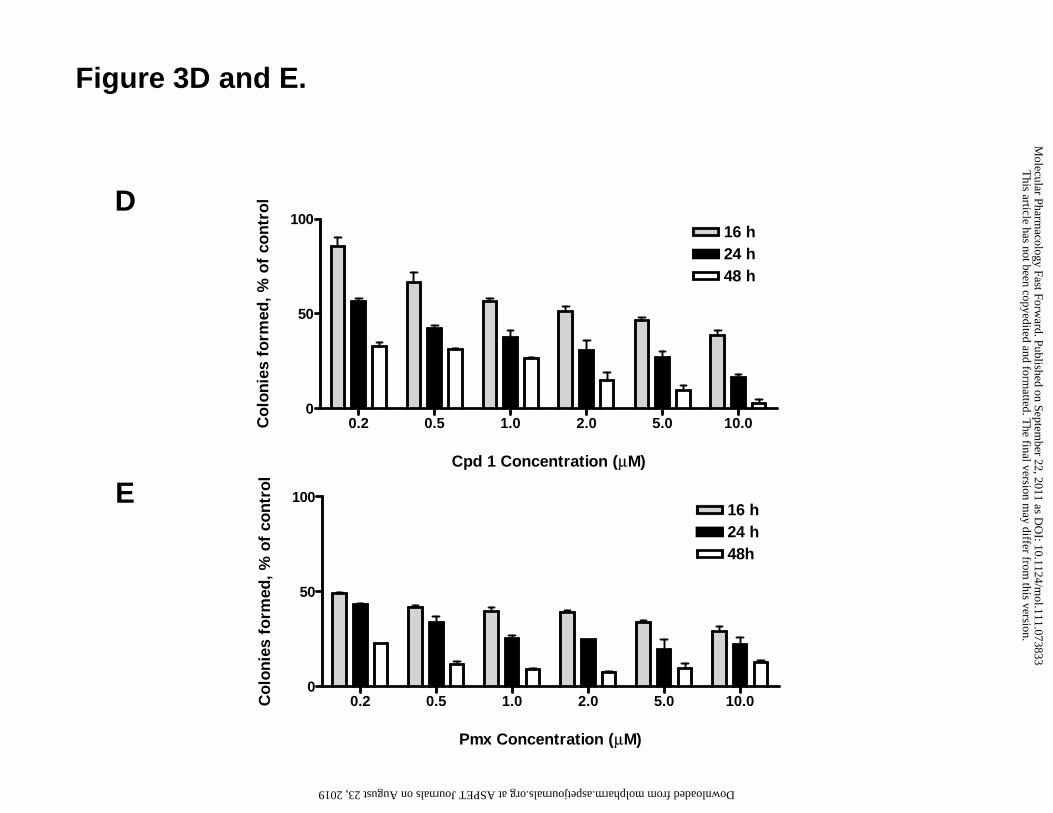
0.2 0.5 1.0 2.0 5.0 10.00
50
10016 h24 h48 h
Cpd 1 Concentration (μM)
Co
lon
ies
form
ed,
% o
f co
ntr
olD
E
Figure 3D and E.
0.2 0.5 1.0 2.0 5.0 10.00
50
10016 h24 h48h
Pmx Concentration (μM)
Co
lon
ies
form
ed,
% o
f co
ntr
ol
This article has not been copyedited and form
atted. The final version m
ay differ from this version.
Molecular Pharm
acology Fast Forward. Published on Septem
ber 22, 2011 as DO
I: 10.1124/mol.111.073833
at ASPET Journals on August 23, 2019 molpharm.aspetjournals.org Downloaded from

pH 7.2 - [3H]Compound 1
2 5 10 300.0
0.5
1.0R1-11-PCFT4R1-11-mock
Time (min)
pm
ol/
mg
pro
tein
pH 6.8 - [3H]Compound 1
2 5 10 300.0
0.5
1.0R1-11-PCFT4R1-11-mock
Time (min)
pm
ol/
mg
pro
tein
pH 5.5 - [3H]Compound 1
2 5 10 300.0
0.5
1.0
R1-11-mockR1-11-PCFT4
Time (min)
pm
ol/m
g p
rote
in
Figure 4 A,B, and C.
A B
C
This article has not been copyedited and form
atted. The final version m
ay differ from this version.
Molecular Pharm
acology Fast Forward. Published on Septem
ber 22, 2011 as DO
I: 10.1124/mol.111.073833
at ASPET Journals on August 23, 2019 molpharm.aspetjournals.org Downloaded from
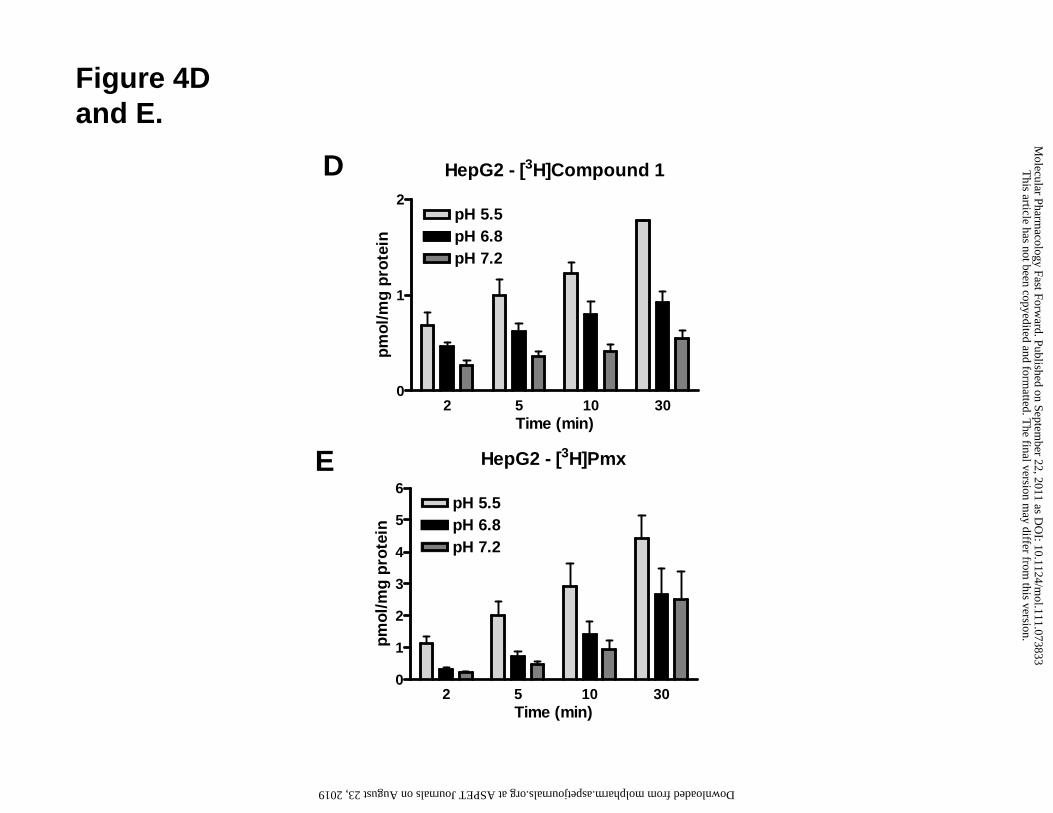
Figure 4D and E.
HepG2 - [3H]Compound 1
2 5 10 300
1
2pH 5.5pH 6.8pH 7.2
Time (min)
pm
ol/m
g p
rote
in
HepG2 - [3H]Pmx
2 5 10 300
1
2
3
4
5
6pH 5.5pH 6.8pH 7.2
Time (min)
pm
ol/m
g p
rote
in
D
E
This article has not been copyedited and form
atted. The final version m
ay differ from this version.
Molecular Pharm
acology Fast Forward. Published on Septem
ber 22, 2011 as DO
I: 10.1124/mol.111.073833
at ASPET Journals on August 23, 2019 molpharm.aspetjournals.org Downloaded from
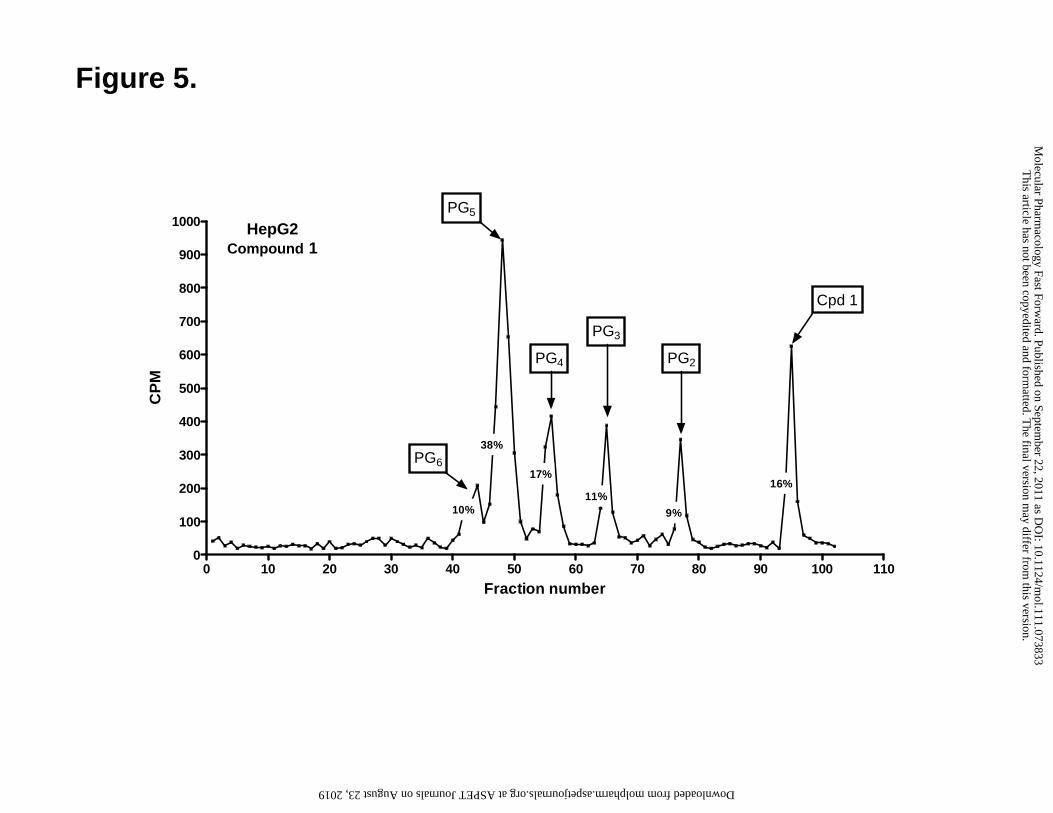
Figure 5.
0 10 20 30 40 50 60 70 80 90 100 1100
100
200
300
400
500
600
700
800
900
1000
38%
17%
11%16%
PG5
PG4
PG3
PG2
Cpd 1
PG6
10% 9%
Fraction number
CP
M
HepG2Compound 1
This article has not been copyedited and form
atted. The final version m
ay differ from this version.
Molecular Pharm
acology Fast Forward. Published on Septem
ber 22, 2011 as DO
I: 10.1124/mol.111.073833
at ASPET Journals on August 23, 2019 molpharm.aspetjournals.org Downloaded from

Figure 6.
R1-11-PCFT4 - pH 6.8
0.00 0.05 0.10 0.50 1.00 5.000
25
50
75
100Cpd 1Pmx
Drug concentration (μM)
% o
f C
on
tro
l
This article has not been copyedited and form
atted. The final version m
ay differ from this version.
Molecular Pharm
acology Fast Forward. Published on Septem
ber 22, 2011 as DO
I: 10.1124/mol.111.073833
at ASPET Journals on August 23, 2019 molpharm.aspetjournals.org Downloaded from
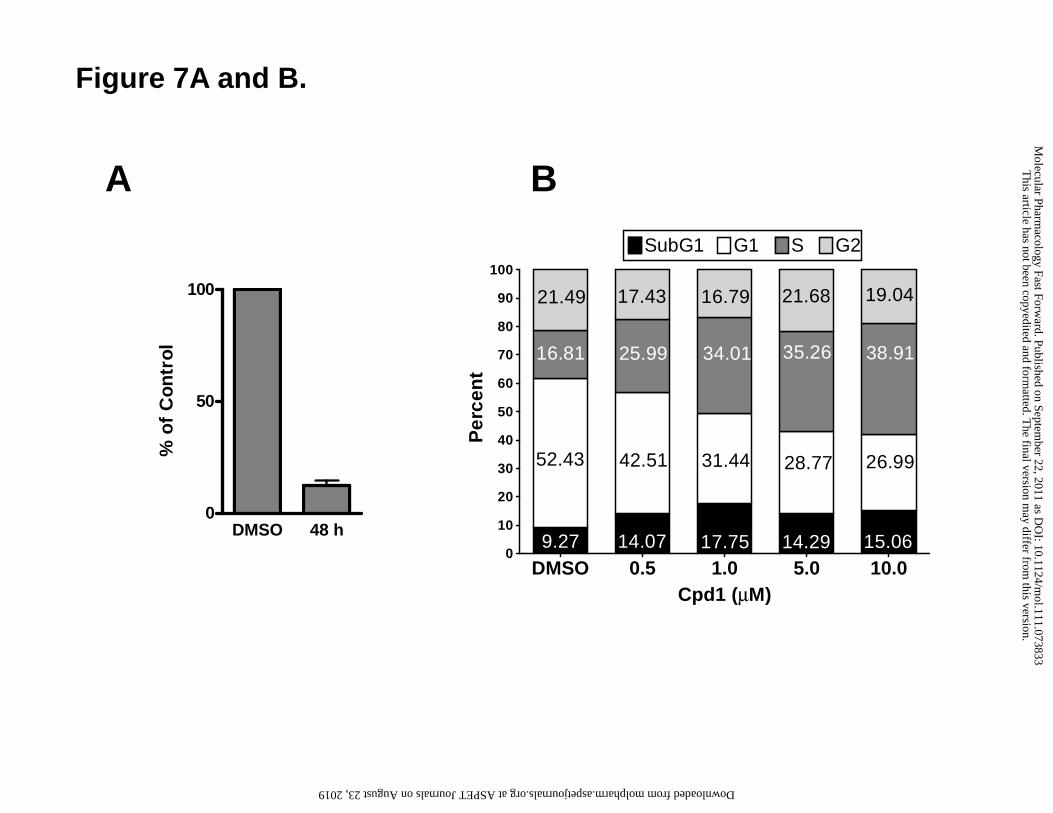
B
Figure 7A and B.
DMSO 48 h0
50
100
% o
f C
ontr
olA
DMSO 0.5 1.0 5.0 10.00
10
20
30
40
50
60
70
80
90
100
SubG1 G1 S G2
9.27 14.07 17.75 14.29 15.06
52.43 42.51 31.44 28.77 26.99
21.49
16.81 25.99 34.01 35.26 38.91
17.43 16.79 21.68 19.04
Cpd1 (μM)
Per
cen
t
This article has not been copyedited and form
atted. The final version m
ay differ from this version.
Molecular Pharm
acology Fast Forward. Published on Septem
ber 22, 2011 as DO
I: 10.1124/mol.111.073833
at ASPET Journals on August 23, 2019 molpharm.aspetjournals.org Downloaded from

Pro
pid
ium
Iod
ide
Annexin V-FITC
DMSO
Compound 1 (10 µM)
Etoposide (5 µM)
Figure 7CC
This article has not been copyedited and formatted. The final version may differ from this version.Molecular Pharmacology Fast Forward. Published on September 22, 2011 as DOI: 10.1124/mol.111.073833
at ASPE
T Journals on A
ugust 23, 2019m
olpharm.aspetjournals.org
Dow
nloaded from
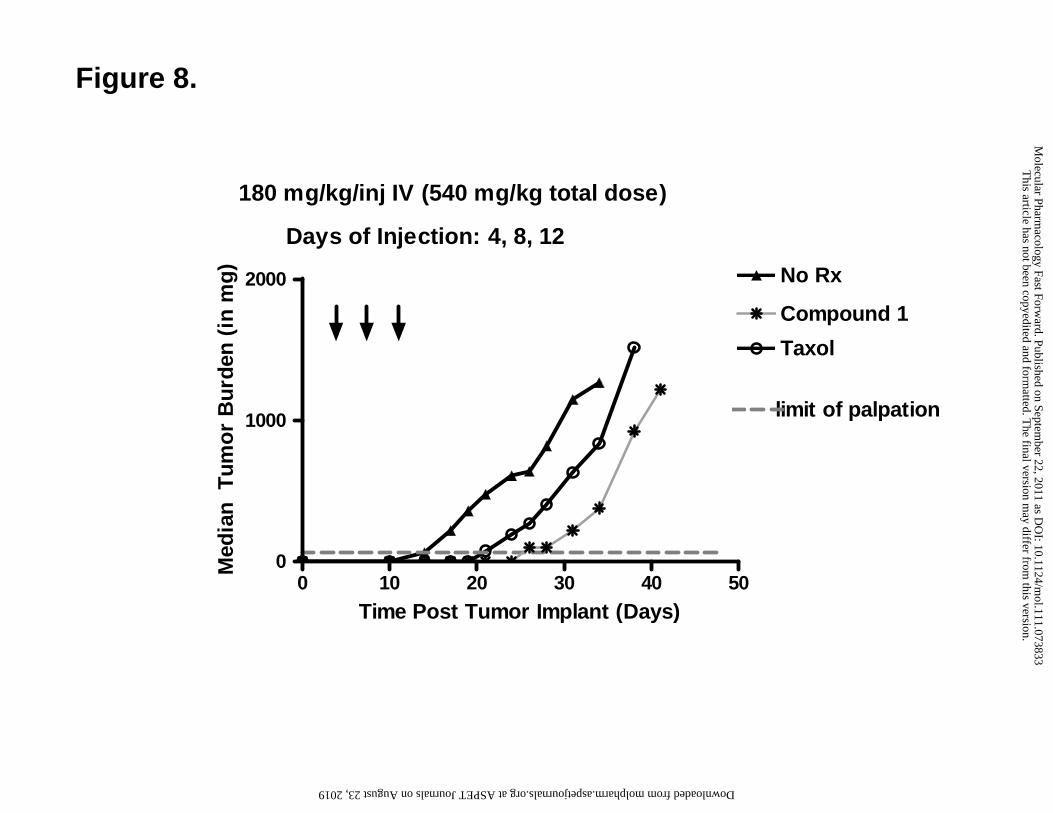
Figure 8.
0 10 20 30 40 500
1000
2000 No Rx
Taxol
limit of palpation
180 mg/kg/inj IV (540 mg/kg total dose)
Days of Injection: 4, 8, 12
Compound 1
Time Post Tumor Implant (Days)
Med
ian
T
um
or
Bu
rden
(in
mg
)
This article has not been copyedited and form
atted. The final version m
ay differ from this version.
Molecular Pharm
acology Fast Forward. Published on Septem
ber 22, 2011 as DO
I: 10.1124/mol.111.073833
at ASPET Journals on August 23, 2019 molpharm.aspetjournals.org Downloaded from

![Research Paper Pyrrolo [3,4-b]-quinolin-9-amine compound ...€¦ · Research Paper Pyrrolo [3,4-b]-quinolin-9-amine compound FZU-0038-056 suppresses triple-negative breast cancer](https://img.pdfslide.us/doc/110x75/5fc2d8601f6cb613e008d0e2/research-paper-pyrrolo-34-b-quinolin-9-amine-compound-research-paper-pyrrolo.jpg)
![Indolizines and pyrrolo[1,2-c]pyrimidines decorated with a … · 2015. 6. 26. · 1079 Indolizines and pyrrolo[1,2-c]pyrimidines decorated with apyrimidine and a pyridine unit respectively](https://img.pdfslide.us/doc/110x75/60c7b92de912614396040102/indolizines-and-pyrrolo12-cpyrimidines-decorated-with-a-2015-6-26-1079-indolizines.jpg)


![Article Novel Bis and Mono Pyrrolo[2,3 d]pyrimidine and](https://img.pdfslide.us/doc/110x75/626d801c85c12b2a3e533554/article-novel-bis-and-mono-pyrrolo23-dpyrimidine-and-.jpg)


![Pyrrolo[1,2-a]quinazolines. Synthesis and biological activity.pdf](https://img.pdfslide.us/doc/110x75/55cf9502550346f57ba5eb28/pyrrolo12-aquinazolines-synthesis-and-biological-activitypdf.jpg)