Embed Size (px)
Citation preview

Vol. 4, 1705-1710, July /998 Clinical Cancer Research 1705
Therapeutic Drug Monitoring of 21-Day Oral Etoposide in Patients
with Advanced Non-Small Cell Lung Cancer’
Antonius A. Miller,2 Elizabeth A. Tolley, and
Harvey B. Niell
Department of Veteran Affairs Medical Center [A. A. M., H. B. N.]and University of Tennessee [A. A. M., E. A. I., H. B. N.], Memphis,
Tennessee 38163
ABSTRACTThe purpose of this study was to prospectively test a
pharmacodynamic model for therapeutic drug monitoring
of 21-day oral etoposide. In our previous studies, etoposide
trough concentrations on this schedule were related to thehematological toxicity, expressed as WBC and neutrophil
counts at the nadir. The following pharmacodynamic modelestimated the absolute neutrophil count at the nadir (ANC�)
based on the etoposide concentration (Er) and the pretreat-ment count (ANC�):
ANC� = 0.32(1 + ANC� x e 2.47 X Ec)
Patients were treated with 40 mg/m2/day etoposide p.o. x 21
days and 100 mg/m2 cisplatin i.v. on day 1. All patients had
non-small cell lung cancer stage 11111 or IV, had a perfor-
mance status of 0-2, and had a median age of 66 (range,
42-80). Etoposide was measured in the plasma on day 8 by
high-performance liquid chromatography, and dosage ad-
justments were made for the remainder of the course. Wetargeted for grade 3 neutropenia (ANC�, 500 to 999/pI) and
attempted to avoid grade 4 neutropenia (ANC0, <500/pA).
of 25 patients entered, 22 were evaluable for therapeutic
drug monitoring in the first course. Three patients devel-
oped grade 3 neutropenia, and seven patients developed
grade 4 neutropenia. Etoposide concentrations were signif-
icantly correlated with ANC� in the first course (r -0.50,
P < 0.02). For those patients whose dosages were notchanged, the estimated correlation between predicted andactual ANC� was 0.77 (P < 0.01). No evidence of significant
bias of the pharmacodynamic model was detected. The eto-
poside dosages were increased in 12 patients and were not
changed in the remaining patients. The precision of themodel was good in patients whose dosages were not changed
Received 1/16/98; revised 4/3/98; accepted 4/10/98.
The costs of publication of this article were defrayed in part by the
payment of page charges. This article must therefore be hereby marked
advertisement in accordance with 18 U.S.C. Section 1734 solely to
indicate this fact.
� Supported by a Merit Review Grant from the Office of Research andDevelopment, Medical Research Service, Department of Veteran Af-
fairs.
2 To whom requests for reprints should be addressed, at University of
Tennessee, 3 North Dunlap, Memphis, IN 38163. Phone: (901) 448-
5157; Fax: (901) 448-5033; E-mail: [email protected].
but poor in patients whose dosages were increased. The
actual observed ANC� was compared with the predicted
ANC� based on the pharmacodynamic model. The predic-
tion was considered accurate if the predicted and actual
ANC� values were within 500/pt of each other. Using this
margin, the ANC� was accurately predicted in 10 of 22
patients. Etoposide concentrations >0.3 pig/ml on thisschedule were significantly correlated with combined grades
3 and 4 neutropenia (P < 0.0001). In conclusion, the phar-
macodynamic model is statistically sound when applied to a
population of patients. However, when applied to individualpatients for therapeutic drug monitoring, the model lacks
precision and accuracy.
INTRODUCTIONMeasurements of drugs like aminoglycosides, digoxin,
phenytoin, or theophylline for making decisions during treat-
ment are accepted practice in internal medicine. Useful strate-
gies exist for these drugs such that concentrations can be deter-
mined at steady-state (i.e., theophylline) or at specified times
(i.e., peak and trough for arninoglycosides) and doses adjusted,
depending on how far off the measured concentration is from
the target (1). In cancer therapy, however, therapeutic drug
monitoring has not found a standard role except for methotrex-
ate measurements to guide leucovorin rescue after high-dose
therapy (2). Clinical oncologists are well aware of the narrow
therapeutic index of antineoplastic drugs and make dose adjust-
ments after toxicity is encountered. The problem of making
correct dosing decisions is at least in part attributed to our
incomplete clinical assessment of the pharmacokinetic variabil-
ity between patients, which in turn determines the pharmacody-
name variability (3). Pharmacodynamics is defined as the rela-
tionship between drug concentrations and therapeutic or toxic
responses. The problem of interpatient variability and the in-
ability to predict the severity of toxicity cannot be overcome
unless the relationships between pharmacological measurements
and clinical effects are explored. The toxicity of anticancer
chemotherapy is mainly due to growth inhibition of rapidly
dividing normal tissues exemplified by bone marrow suppres-
sion. Troublesome consequences of myelosuppression are neu-
tropemic fever and sepsis. These adverse consequences of chem-
otherapy are not immediately apparent, and the time interval and
degree of toxicity are poorly predictable.
Lung cancer is the leading cause of death from cancer in
the United States (4). The majority of patients have non-small
cell lung cancer. Patients with advanced non-small cell lung
cancer commonly receive chemotherapy for palliation of their
disease. Our previous Phase II study demonstrated that a 2 1 -day
schedule of oral etoposide in combination with iv. cisplatin was
active in patients with advanced non-small cell lung cancer (5,
6). Etoposide was administered at a dosage of 50 mg/rn2 for 21
days, and 100 mg/rn2 cisplatin were given on day 1 of a 28-day
Research. on July 13, 2018. © 1998 American Association for Cancerclincancerres.aacrjournals.org Downloaded from

1706 Therapeutic Drug Monitoring of Etoposide
3 The abbreviation used is: CALGB, Cancer and Leukemia Group B.
cycle. Etoposide plasma concentrations were measured weekly
just before the daily dose (trough levels). The etoposide con-
centrations on this schedule were related to the hematological
toxicity, expressed as WBC and neutrophil counts at the nadir
(5). The following pharmacodynamic model was developed to
estimate the absolute neutrophil count at the nadir (ANC�) based
on the etoposide concentration (Er) and the pretreatment count
(ANC�):
ANC� = 0.32(1 + ANC� X e247 X EC)
Subsequently, this model was tested prospectively and per-
formed reliably (7).
A similar regimen consisting of 21-day oral etoposide (50
mg/m2/day) with cisplatin given at a dosage of 33 mg/rn2 i.v. on
days 1, 2, and 3 was used by the CALGB3 for extensive stage
small-cell lung cancer (8). Multiple linear regression analysis of
this CALGB trial led to the following pharrnacodynamic model
(9):
log10(ANC�) = - 0.153 - 0.017 X age - 0.363
x E� + 0.530 x log10 (alkaline phosphatase)
However, this latter pharmacodynamic equation was not avail-
able at the beginning of the trial that is described here. It is
important to note that the above equations were derived from
groups of patients (population pharmacology), and that their
performance when applied to individual patients (therapeutic
drug monitoring) remained unknown.
In previous studies of 50 mg/m2/day X 21 days, we ob-
served grades 3 and 4 neutropenia in 73- 83% of all patients
(5-9). Therefore, the starting dose was reduced from 50 to 40
mg/m2/day X 21 days for this trial. Etoposide is marketed in the
United States only as a 50-mg capsule. This capsule size was
used in the previous studies (5-9). For therapeutic drug moni-
toting, the 50-mg capsules were not useful because dose adjust-
ments were not feasible. For the sake of prospective therapeutic
dose adjustments, 10-mg capsules were obtained from Bristol-
Myers Oncology. Otherwise, the treatment was the same as in
the previous trials that led to the development of the pharrna-
codynamic model in patients with mom-small cell lung cancer
(5-7).
Our hypothesis was that therapeutic drug monitoring was
useful in predicting hematological toxicity and thereby in-
creased the safety of treatment with etoposide. To test this
hypothesis, we treated patients with advanced non-small cell
lung cancer with the regimen of 21-day oral etoposide and iv.
cisplatin on day 1 and measured etoposide trough concentrations
on day 8 of cycle 1 . The etoposide dosage was adjusted pro-
spectively, depending upon the drug concentration. The purpose
was to determine whether this drug monitoring of etoposide was
clinically useful in treating individual patients.
PATIENTS AND METHODS
Patients had biopsy-proven non-small cell lung cancer
stage IIIB or IV, measurable or evaluable disease, and a per-
formance status of 0-2 (Eastern Cooperative Oncology Group).
Staging procedures were the same as in our previous studies
(5-7). Prior chemotherapy and bone marrow or brain metastases
were reasons for exclusion. Required laboratory values for entry
on study were: ANC �l500/�i.l; hemoglobin �10 g/dl, platelets
�l00,000/iil; serum creatinine �1.5 mg/dl; and bilirubin
� 1 .5 X normal. Patients had to be able to swallow capsules so
they could comply with the oral etoposide regimen. Patients
with another malignancy and other serious medical or psychi-
atric disease were excluded. All patients gave written informed
consent.
The treatment consisted of 40 rng/m2/day etoposide p.o. X
21 days and ]00 mg/rn2 cisplatin iv. on day 1. Treatment cycles
were repeated every 28 days. Up to three cycles of therapy were
given with therapeutic drug monitoring. After that, patients were
off protocol but could receive a maximum of six cycles. Therapy
was given in the outpatient clinic. Bristol-Myers Oncology
(Princeton, NJ) provided 10-mg capsules of etoposide, which
were similar in formulation to the marketed 50-mg capsules
(VePesid). The trial was conducted under Investigational New
Drug 43,71 1 from the Food and Drug Administration (Rock-
ville, MD). The commercially available formulation of cisplatin
was used.
All patients had laboratory studies performed before study
entry and before each treatment cycle: complete blood cell count
with differential; electrolytes (including calcium and magnesi-
urn); liver and renal function chemistries; lactate dehydrogem-
ase; total protein; and albumin. While on treatment, patients
returned weekly to clinic for monitoring of compliance with oral
etoposide, complete blood cell counts, and etoposide plasma
concentrations. For therapeutic drug monitoring, weekly etopo-
side samples were obtained just before the daily dose (trough
concentrations). The etoposide concentration on day 8 of cycle
1 was used to predict the neutrophil count at the nadir based on
the following equation: ANC,� 0.32 (1 + ANC� X e247 X Ec)
Based on this prediction, the dose of etoposide was adjusted for
the remainder of the cycle. The goal was to avoid grade 4
neutropenia (ANC� <500/pA; Common Toxicity Criteria by the
National Cancer Institute) by means of dose reduction. Grade 3
neutropenia (ANC� 500-999/pA) was deemed acceptable, and
no dose change was made. For grades 0, 1 , and 2 projected
neutropema (ANC� � 1000/pA), dose increases were planned.
Patients were seen in the clinic in the morning, the blood sample
was taken to the laboratory immediately for analysis of the
etoposide concentration the same day, and patients were called
in the afternoon with dosage instructions. Dose adjustments
were made in 20-mg increments. Predicted and actual nadir
counts were recorded. Etoposide plasma concentrations were
measured by high-performance liquid chromatography accord-
ing to a method published previously (5). The lower limit of
detection was 0.05 �.tg/ml. The day-to-day coefficients of van-
ation for etoposide measurements were less than 10%, as in the
previous studies (5-9).
Statistical Methods. Pearson correlation coefficients
were estimated for evaluating the relationships between etopo-
Research. on July 13, 2018. © 1998 American Association for Cancerclincancerres.aacrjournals.org Downloaded from
Clinical Cancer Research 1707
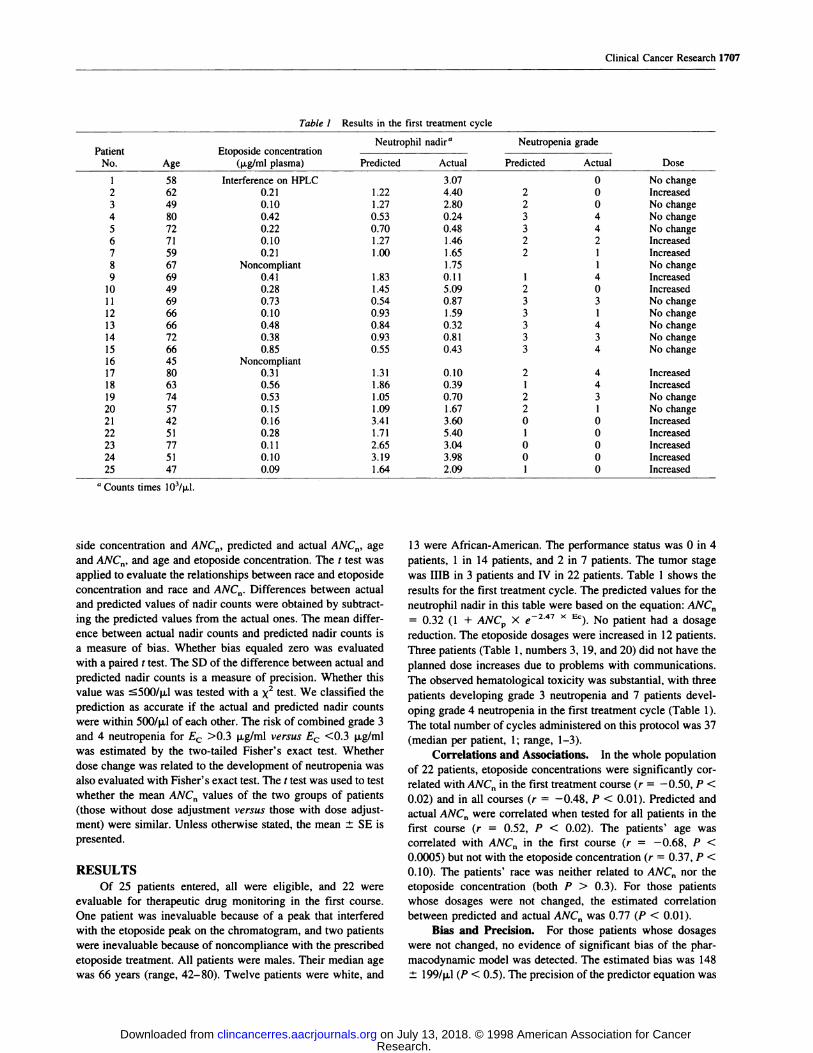
Table 1 Results in the first treatment cycle
PatientNo. Age
Etoposide concentration(p.g/ml plasma)
Neutrophil nadir” Neutropen ia grade
DosePredicted Actual Predicted Actual
1 58 Interference on HPLC 3.07 0 No change
2 62 0.21 1.22 4.40 2 0 Increased3 49 0.10 1.27 2.80 2 0 No change
4 80 0.42 0.53 0.24 3 4 No change
S 72 0.22 0.70 0.48 3 4 No change
6 71 0.10 1.27 1.46 2 2 Increased7 59 0.21 1 .00 1 .65 2 1 Increased
8 67 Noncompliant 1.75 1 No change
9 69 0.41 1.83 0.11 1 4 Increased10 49 0.28 1.45 5.09 2 0 IncreasedI 1 69 0.73 0.54 0.87 3 3 No change12 66 0.10 0.93 1.59 3 1 No change13 66 0.48 0.84 0.32 3 4 No change14 72 0.38 0.93 0.81 3 3 No change15 66 0.85 0.55 0.43 3 4 No change
16 45 Noncompliant17 80 0.31 1.31 0.10 2 4 Increased18 63 0.56 1.86 0.39 1 4 Increased19 74 0.53 1.05 0.70 2 3 No change20 57 0.15 1.09 1.67 2 1 No change
21 42 0.16 3.41 3.60 0 0 Increased22 51 0.28 1.71 5.40 1 0 Increased
23 77 0.11 2.65 3.04 0 0 Increased24 51 0.10 3.19 3.98 0 0 Increased25 47 0.09 1.64 2.09 1 0 Increased
a Counts times 103/j.a.l.
side concentration and ANC�, predicted and actual ANC,1, age
and ANC�, and age and etoposide concentration. The t test was
applied to evaluate the relationships between race and etoposide
concentration and race and ANC�. Differences between actual
and predicted values of nadir counts were obtained by subtract-
ing the predicted values from the actual ones. The mean differ-
ence between actual nadir counts and predicted nadir counts is
a measure of bias. Whether bias equaled zero was evaluated
with a paired t test. The SD of the difference between actual and
predicted nadir counts is a measure of precision. Whether this
value was �500/�jJ was tested with a x2 test. We classified the
prediction as accurate if the actual and predicted nadir counts
were within 500/pA of each other. The risk of combined grade 3
and 4 neutropenia for E� >0.3 p�g/m1 versus E� <0.3 p.g/ml
was estimated by the two-tailed Fisher’s exact test. Whether
dose change was related to the development of neutropenia was
also evaluated with Fisher’ s exact test. The t test was used to test
whether the mean ANC,, values of the two groups of patients
(those without dose adjustment versus those with dose adjust-
ment) were similar. Unless otherwise stated, the mean ± SE is
presented.
RESULTSOf 25 patients entered, all were eligible, and 22 were
evaluable for therapeutic drug monitoring in the first course.
One patient was inevaluable because of a peak that interfered
with the etoposide peak on the chromatogram, and two patients
were inevaluable because of noncompliance with the prescribed
etoposide treatment. All patients were males. Their median age
was 66 years (range, 42-80). Twelve patients were white, and
13 were African-American. The performance status was 0 in 4
patients, 1 in 14 patients, and 2 in 7 patients. The tumor stage
was IIIB in 3 patients and IV in 22 patients. Table 1 shows the
results for the first treatment cycle. The predicted values for the
neutrophil nadir in this table were based on the equation: ANC,,
= 0.32 (1 + ANC� x C247 � Ec) No patient had a dosage
reduction. The etoposide dosages were increased in 12 patients.
Three patients (Table 1, numbers 3, 19, and 20) did not have the
planned dose increases due to problems with communications.
The observed hematological toxicity was substantial, with three
patients developing grade 3 neutropenia and 7 patients devel-
oping grade 4 meutropemia in the first treatment cycle (Table 1).
The total number of cycles administered on this protocol was 37
(median per patient, 1; range, 1-3).
Correlations and Associations. In the whole populationof 22 patients, etoposide concentrations were significantly cor-
related with ANC� in the first treatment course (r = -0.50, P <
0.02) and in all courses (r = -0.48, P < 0.01). Predicted and
actual ANC� were correlated when tested for all patients in the
first course (r = 0.52, P < 0.02). The patients’ age was
correlated with ANC� in the first course (r = -0.68, P <
0.0005) but not with the etoposide concentration (r = 0.37, P <
0. 10). The patients’ race was neither related to ANC� nor the
etoposide concentration (both P > 0.3). For those patients
whose dosages were not changed, the estimated correlation
between predicted and actual ANC� was 0.77 (P < 0.01).
Bias and Precision. For those patients whose dosages
were not changed, no evidence of significant bias of the phar-
macodynamic model was detected. The estimated bias was 148
± 199/pA (P < 0.5). The precision of the predictor equation was
Research. on July 13, 2018. © 1998 American Association for Cancerclincancerres.aacrjournals.org Downloaded from

1 2 3 4 5
Actual ANC x 1O�I�d
1708 Therapeutic Drug Monitoring of Etoposide
U
I
Fig. 1 Relationship between the actual and predicted ANC� (ANC,
cells X l03/p.l) from cycle I of treatment based on the prediction
equation ANC� = 0.32 (1 + ANC� X e247 X Ec) where ---- are±5004a.l from the solid line of identity. #{149},patients whose dosages were
not changed: 0, patients whose dosages were increased.
6294a.I, a value that was not significantly different from 500/pi
(P < 0.11).
The actual ANC� of three patients (Table 1, numbers 9, 17,
and 1 8) whose doses were increased were lower than predicted,
which was an expected effect of dose adjustment. However, the
ANC� of three other patients (numbers 2, 10, and 22) whose
doses were increased were higher than predicted, which was
unexpected. Because these results tended to offset each other, no
evidence of significant bias was detected for patients whose
doses were increased. The estimated bias was 731 ± 5414U
(P < 0.4). However, precision was 1 874/pA, a value much
higher than 500/pA (P < 0.0001).
Accuracy. The actual observed ANC� was compared
with the ANC� that was predicted based on the pharmacody-
namic model (Fig. I ). The prediction was considered accurate if
the predicted and actual ANC� values were within 500/ji.l of
each other. Using this criterion, the ANC� was accurately pre-
dicted in 10 of 22 patients (Table 1 , numbers 4-6, 1 1 , 14, 15,
19, 21, 23, and 25). For patients whose dosages were not
changed, the accuracy of the predictor equation: ANC� = 0.32
(I + ANC� X e247 � Ec) was 0.60, with actual ANC� being
within 5004tl of predicted values for 6 of 10 patients; actual
ANC� were within 660/pi of the predicted values for three other
patients. For those patients whose dosages were increased, the
accuracy of the predictor equation was 0.33, with 4 of 12
patients having accurately predicted ANC�. Inspection of Fig. 1
shows that three patients each were either far above or far below
the line of identity. These patients can be identified in Table 1
as follows. Patients numbered 2, 10, and 22 were predicted to
have ANC� < 2000/pJ but actually had ANC� > 4000/�i.l (far
below the line of identity). Patients numbered 9, 17, and 18 were
predicted to have ANC� above l000/p.l, but their actual ANC�
were below 500/p.l (far above the line in Fig. I). These three
patients, in whom the pharmacodynamic model failed to predict
ANC� < 500/pJ, illustrate how a statistically significant model
can have limited clinical utility.
Another way tojudge the clinical utility of therapeutic drug
monitoring is to evaluate how often grade 3 or 4 toxicity was
accurately predicted. Ten patients developed grade 3 or 4 meu-
tropenia; grade 3 was accurately predicted in 2 of 3 patients, and
grade 4 was predicted in 0 of 7 patients. However, Table 1
shows that E� > 0.3 p.g/ml was associated with grades 3 and 4
neutropenia (i.e., ANC� < 1000 �i.1). Nine of nine patients
(numbers 4, 9, 11, 13-15, and 17-19) with E� > 0.3 �i.g/ml
developed grade 3/4 neutropenia, whereas 1 of 13 patients (number
5) with E� < 0.3 p.g/ml had grade 3/4 neutropenia. The risk of
grade 3/4 neutropenia was 13 times (confidence interval, 2-85;
P < 0.0001) higher for E� > 0.3 rig/mi than for E� < 0.3 ig/mI.
The pharmacodynamic model was developed for a 21-day
course of unaltered etoposide dosage. Because of study design,
the predicted ANC� values of those patients whose dosages were
increased were greater than the predicted ANC� of those patients
whose doses were kept the same. When the dosage on day 8 of
cycle I was increased based on the prediction of ANC� >
1000/il, this decision rendered the predicted ANC� value po-
tentially invalid. Therefore, as expected, the proportion of pa-
tients with incorrectly predicted ANC� was larger in the group
who had the dose increase compared with the group without
dose change, but this was not statistically significant (P < 0.21).
Inspection of the types of incorrectly predicted ANC� revealed
that increasing the dose did not significantly increase the pro-
portion of patients with actual ANC� that were lower than
predicted (P < 0.6). Of those patients whose doses were in-
creased, 5 of 12 had actual ANC� values that were more than
500/il greater than predicted. The actual ANC� values for the
two groups of patients were significantly different: 991 ±
254/il for those whose doses were not changed versus 2609 ±
552/il for those whose doses were increased (P < 0.02). These
results suggest that on average the pharmacodynamic model
correctly identified patients with less hematological toxicity
from etoposide. However, to be clinically useful the model must
not only predict who will not develop neutropenia, but more
importantly who will develop severe neutropenia. Of those
patients whose dosages were kept the same, 4 of I 0 (40%)
developed grade 4 neutropenia compared with 3 of 12 (25%)
patients in whom the dosages were increased (P < 0.7).
All of the above work was performed prospectively based
on the previously validated equation ANC� = 0.32 (1 + ANC�
x e247 � Ec) As stated in the introduction, another pharma-
codynamic equation was developed while this trial was in pro-
gress: log10 (ANC�) = -0.153 - 0.017 X age - 0.363 X E� +
0.530 X log10 (alkaline phosphatase). This model was devel-
oped by multiple linear regression of pharmacodynamic data
from 83 patients treated on a CALGB study. Applying this
CALGB model retrospectively to the data available from the 22
patients in this trial did not result in any statistical improvement
in prediction (Fig. 2). The CALGB model also failed to identify
the three patients whose doses were increased and who devel-
oped grade 4 neutropenia (Table 1, patients 9, 17, and 18).
DISCUSSION
Both pharmacodynamic models appear to contain influen-
tial predictor variables such as E�, ANC�, age, and alkaline
phosphatase. The relationship among these predictors is corn-
Research. on July 13, 2018. © 1998 American Association for Cancerclincancerres.aacrjournals.org Downloaded from

Actual ANC z 1O�I�d
Clinical Cancer Research 1709
I
Fig. 2 Relationship between the actual and predicted ANC� (ANC,
cells X l0�/�l) from cycle 1 of treatment based on the prediction
equation log10(ANC�) -0.153 - 0.017 X age - 0.363 X E� +
0.530 X log10 (alkaline phosphatase), where are ± 500/p.l from the
solid line of identity. #{149},patients whose dosages were not changed; 0,
patients whose dosages were increased.
plex. When applied to the whole group of patients, the models
yielded statistically significant results; thus, the present study
confirmed the concept of population pharmacology. However,
to be clinically useful the pharmacodymamic model must make
the transition to therapeutic drug monitoring. Here, a clinician is
dealing with an individual patient rather than with a population
of patients. Applying the phamacodynamic models to imdivid-
ual patients for therapeutic drug monitoring lacked accuracy and
precision. Specifically, the etoposide trough concentration om day 8
of cycle 1 did not reliably predict the ANC� for patients whose
doses were increased. However, E� > 0.3 �g/m1 was significantly
correlated with grades 3 and 4 neutropenia in spite of dose in-
creases on day 8. This is consistent with work by Clark et a!. (10),
who reported a significantly increased risk ofANC� < 1000/il for
exposure to E� > 3 p.g/ml on a 5- or 8-day regimen of etoposide.
Grochow (1 1) has pointed out that the logic underlying the
monitoring of plasma concentrations is based on six premises:
(a) primary clinical end points (equivalent to measuring blood
sugar or blood pressure) are mot easily assessed as a basis for
altering drug doses; (b) an accurate, precise, specific, and sen-
sitive assay for drug measurements is available; (c) individual
variations in drug elimination are the source of different drug
concentrations; (d) reducing variations in drug disposition
(pharmacokimetics) cam reduce variations in drug effect (phar-
macodynamics); (e) the relationship between drug concentration
and effect is closer than the relationship between drug dose and
effect; and even when a drug satisfies all these logical criteria,
(t) the utility of measuring drug concentrations in patients and
individualizing doses must be demonstrated to maximize useful
effects and manage toxicity within acceptable limits. Our study
fails to meet the sixth criterion. There may be a variety of
reasons for variable toxicity that can generally be categorized as
either pharmacokinetic or pharmacodymamic. Ratain (12) has
emphasized that it is important to understand the distinction.
Pharmacokinetics is classically considered to consist of four
aspects: absorption, distribution, metabolism, and excretion.
Pharmacokinetic variability may be captured by measuring
plasma concentrations. For instance, a patient with impaired
clearance should have increased plasma concentrations. Dose
reduction in a patient like this should result in average plasma
concentrations and reduced toxicity. On the other hand, a patient
may have an enhanced sensitivity to the drug. This pharmaco-
dynamic variability may be related to prior therapy, bone ma-
row abnormalities, age, performance status, genetics, other mcd-
ications, comorbid conditions, and other poorly understood
reasons (3, 11, 12). In a patient with enhanced sensitivity,
average plasma concentrations may result in severe toxicity.
Lowering the dose in such a patient may result in lower plasma
concentrations and average toxicity (12).
The difference in the two pharmacodynamic models points
out that ANC� is not a reliable predictor. In ANC� = 0.32
(1 + ANC� X e247 � Ec) ANC� contributed significantly to he
model. In the CALGB study (9), no significant association
between ANC� and the nadir count was demonstrated, and ANC�
was left out of the model: log10(ANC�) -0.153 - 0.017 X
age - 0.363 x E� + 0.530 X log10 (alkaline phosphatase).
Two potential confounding problems should be acknowl-
edged: (a) the pharmacodynamic models were developed for
50-mg etoposide capsules given at a dosage of 50 mg/m2/day. This
trial used 10-mg etoposide capsules of the same formulation given
at a starting dosage of 40 mg/m2/day; and (b) cisplatin was given
iv. on day 1 in combination with the 21-day course of p.o. etopo-
side, but cisplatin was not measured. Therefore, the contribution of
cisplatin to the neutropenia was not assessed. The previous studies
ofSO rng/m2/day etoposide X 21 showed an incidence of combined
grades 3 and 4 neutropenia between 73 and 83% (5-9). The current
study had an incidence of grades 3 and 4 neutropenia of 45%
(Table 1). Thus, the dose reduction to 40 mg/m2/day etoposide X
21 had the desired effect.
Fig. 1 illustrates the limitations of using our pharmacody-
namic model in this prospective trial. Fig. 2 shows the retro-
spective application of the CALGB model, which performed
worse. Overall, it appears doubtful that applying the models will
result in a marked improvement in clinical care. On the other
hand, dose adjustments based on the first model did not increase
the incidence of severe neutropemia; thus, patients were not
harmed by applying the model.
Our current understanding of the pharmacodynamics of eto-
poside was recently reviewed by McLeod and Evans (13). The
influence of etoposide systemic exposure on the hematological
toxicity has been clearly demonstrated. The equations that best
describe the relationship vary with each study and have included
AUC, concentrations at steady-state (C�), and trough concentra-
tions (Er) as in our study. As reviewed by McLeod and Evans (13),
two studies have attempted therapeutic drug monitoring of etopo-
side, one by Ratain et a!. (14) and one by Madden et a!. (15).
In the prospective study of pharmacologically based dosing
by Rataim et al. (14), 45 patients with a variety of solid tumors
were randomly assigned to receive a fixed dose of etoposide 125
rng/m2/day by 72 h continuous infusion or to receive individu-
alized dosing to a target WBC nadir of 1700/il (grade 3 leu-
kopenia corresponding to our grade 3 neutropenia). Dosage
modification was determined using an exponential model that
included total etoposide dose, starting dose, 24-h etoposidc
Research. on July 13, 2018. © 1998 American Association for Cancerclincancerres.aacrjournals.org Downloaded from

1710 Therapeutic Drug Monitoring of Etoposide
concentration (C,, corresponding to our Er), patient perform-
ance status, albumin, and bone marrow function (based on prior
transfusion requirements). Our patients were newly diagnosed
with non-small cell lung cancer without prior transfusion re-
quirements, and albumin and performance status did not con-
tribute significantly to the model. In the study by Ratain et al.
(14), the total dose was increased in patients with individualized
dosing, and this was associated with a decrease in the mean
WBC at the nadir (15 10 ± 950 versus 2500 ± 1420/il). Both
the study by Ratain et a!. (14) and our study resulted in an
increase in the dose intensity without increasing the incidence of
life-threatening toxicity. Although the pharmacodynamic model
in the study by Rataim et al. (14) did appear to accurately predict
the WBC nadir, the degree of variability around the target value
indicated that a more specific model was needed before large-
scale implementation of this dosing approach (14). This limita-
tion also applies to our study [in fact, Fig. 4A in the publication
by Rataim et a!. (14) and our Fig. 1 are similar].
In the trial of individualized etoposide therapy by Madden et
aL (15), 17 children with acute nonlymphocytic leukemia received
a 70 mg/rn2 loading dose, followed by 500 mg/m2/day for 96 h. A
blood sample was obtained 6 h after the start of infusion, and
dosage rates were adjusted to achieve a target plasma concentration
within 12 h. Ten of the 17 patients required a dosage increase. This
study did not provide further details of the predictive performance
of the model used for dosage adjustment (15).
In conclusion, the pharmacodynamic model is statistically
sound when applied to a population of patients. However, when
applied in individual patients for therapeutic drug monitoring, our
present model lacks precision and accuracy. Increasing the sample
size of the trial is not expected to be helpful. This will improve the
PS for the population; however, a review of the large CALGB trial
indicates that great variability existed and that predictions for
individual patients will remain poor (9). Although disappointing,
this dilemma is not unique in medical oncology. For instance, we
know for a common malignancy and a certain stage what the
median survival time is in the population. However, when faced
with an individual patient, the statistically valid figure of a given
survival time is clinically meaningless. Because of the variability
around the median, which is usually large, even an experienced
clinician cannot tell the individual patient what his/her survival
time will be. We will need to refine the current predictor variables
and search for other variables that improve the pharmacodynamic
model. A study of pharmacodynamic modeling of 21-day, single-
agent etoposide in patients with relapsed non-Hodgkin’s lym-
phoma is presently in progress in CALGB.
ACKNOWLEDGMENTS
We gratefully acknowledge helpful comments by the senior editor,
Dr. Bruce A. Chabner.
REFERENCES
1. Bauer, L. A. Individualization of drug therapy: clinical pharmacoki-netics and pharmacodynamics. In: J. T. DiPiro, R. L. Talbert, G. C. Yee,G. R. Matzke, B. G. Wells, and L. M. Posey (eds.), Pharmacotherapy-APathophysiologic Approach, Ed. 3, pp. 29-48. Stamford, CT: Appleton& Lange, 1997.
2. Ratain, M. J., Schilsky, R. L., Conley, B. A., and Egorin, M. J.Pharmacodynamics in cancer therapy. J. Clin. Oncol., 8: 1739-1753,
1990.
3. Miller, A. A., Ratain, M. J., and Schilsky, R. L. Principles ofpharmacology. In: M. C. Perry (ed), The Chemotherapy Sourcebook,Ed. 2, pp. 27-41. Baltimore, MD: Williams and Wilkins, 1997.
4. Landis, S. H., Murray, T., Bolden, S., and Wingo, P. A. Cancerstatistics, 1998. CA Cancer J. Clin., 48: 6-29, 1998.
5. Miller, A. A., Tolley, E. A., Niell, H. B., Griffin, J. P., and Mauer,A. M. Pharmacodynamics of prolonged oral etoposide in patients withadvanced non-small-cell lung cancer. J. Clin. Oncol., 11: 1179-1188,1993.
6. Miller, A. A., Niell, H. B., and Griffin, J. P. Phase II study ofprolonged oral etoposide in combination with intravenous cisplatinin advanced non-small cell lung cancer. Lung Cancer, 12: 59-65,1995.
7. Miller, A. A., and Tolley, E. A. Predictive performance of a phar-macodynamic model for oral etoposide. Cancer Res., 54: 2080-2083,
1994.
8. Miller, A. A., Herndon, J. E., H, Hollis, D. R., Ellerton, J., Langle-ben, A., Richards, F., and Green, M. R. Schedule dependency of 21-dayoral versus 3-day intravenous etoposide in combination with intravenouscisplatin in extensive-stage small-cell lung cancer: a randomized phase
ifi study of the Cancer and Leukemia Group B. J. Clin. Oncol., 13:
1871-1879, 1995.
9. Miller, A. A., Rosner, G. L., Ratain, M. J., Hollis, D. R., Green,M. R., and Schilsky, R. L. Pharmacology of 21-day oral etoposide givenin combination with iv. cisplatin in patients with extensive-stage smallcell lung cancer: a Cancer and Leukemia Group B study (CALGB9062). Clin. Cancer Res., 3: 719-725, 1997.
10. Clark, P. I., Slevin, M. L., Joel, S. P., Osborne, R. J., Talbot, D. I.,Johnson, P. W. M., Reznek, R., Masud, T., Gregory, W., and Wrigley,P. F. M. A randomized trial of two etoposide schedules in small-cell
lung cancer: the influence of pharmacokinetics on efficacy and toxicity.
J. Clin. Oncol., 12: 1427-1435, 1994.
11. Grochow, L. B. Individualized dosing of anti-cancer drugs and therole of therapeutic monitoring. in: L. B. Grochow and M. M. Ames(eds.), A Clinician’s Guide to Chemotherapy Pharmacokinetics and Phar-macodymamics, pp. 3-16. Baltimore, MD: Williams and Wilkins, 1998.
12. Rataim, M. J. Pharmacokinetics and pharmacodynamics. in: V. T.DeVita, Jr., S. Hellman, S. A. Rosenberg (eds.), Cancer: Principles &Practice of Oncology, Ed. 5, pp. 375-385. Philadelphia: Lippincott-Raven, 1997.
13. McLeod, H. L., and Evans, W. E. Epipodophyllotoxins. in: L. B.Grochow and M. M. Ames (eds.), A Clinician’s Guide to ChemotherapyPharmacokinetics and Pharmacodynamics, pp. 259-287. Baltimore,MD: Williams and Wilkins, 1998.
14. Ratain, M. J., Mick, R., Schilsky, R. L., Vogelzang, N. J., andBerezin, F. Pharmacologically based dosing of etoposide: a means of
safely increasing dose intensity. J. Clin. Oncol., 9: 1480-1486, 1991.
15. Madden, T., Crom, W. R., and Mirro, J. Disposition of etoposide(VP-16) in children with acute nonlymphocytic leukemia (ANLL). Clin.Pharmacol. Ther., 47: 206-210, 1990.
Research. on July 13, 2018. © 1998 American Association for Cancerclincancerres.aacrjournals.org Downloaded from
1998;4:1705-1710. Clin Cancer Res A A Miller, E A Tolley and H B Niell patients with advanced non-small cell lung cancer.Therapeutic drug monitoring of 21-day oral etoposide in
Updated version
http://clincancerres.aacrjournals.org/content/4/7/1705
Access the most recent version of this article at:
E-mail alerts related to this article or journal.Sign up to receive free email-alerts
Subscriptions
Reprints and
To order reprints of this article or to subscribe to the journal, contact the AACR Publications
Permissions
Rightslink site. Click on "Request Permissions" which will take you to the Copyright Clearance Center's (CCC)
.http://clincancerres.aacrjournals.org/content/4/7/1705To request permission to re-use all or part of this article, use this link
Research. on July 13, 2018. © 1998 American Association for Cancerclincancerres.aacrjournals.org Downloaded from