Embed Size (px)
Citation preview
Transportation Research Record 1106
898, TRB, National Research Council, Washington, D.C. , 1983, pp. 7-10.
13. T . Watanatada et al. The High way Design and Maintenance Standards Model HDM-111: Model Description and User's Manual. The World Bank, Washington, D.C., 1975.
14. J . W. Hodges'et al. The Kenya Road Transport Cost Study: Research on Road Deterioration. Transport and Road Research Laboralory Report 673. TRRL, Crowthorne, England, 1975.
15 . P . W. D. H. Roberts. The Performance of Unsealed Roads in Ghana. Transport and Road Research Laboratory Report 1093. TRRL, Crowthorne, England , 1983.
115
16. W. D. 0. Paterson . Prediction of Road Deterioration and Maintenance Effects: Theory and Quantification. In Highway Design and Maintenance Standards Sludy, Vol. !ll, World Bank, Washington, D.C., 1985.
Crown copyright. Any views expressed in this paper are not necessarily those of the Deparlmenl of Transport or the Overseas Development Administration. Extracts from the text may be reproduced, except for commercial purposes, provided the source is acknowledged.
Theory of the Use of Low-Strength Granulated Materials in the Construction of Low-Volume Roads in the USSR VALERY A. SEMENOV
An original theoretical model for packing particles that are not uniform in either size or shape is presented in this paper. A solution was obtained for the packing density and contact strength in multi-component mediums, and nomograms were constructed from the theoretical solutions. A method was developed for theoretically determining the density of soils and granulated materials. A practical method for determining the type of roller to be used for packing is also proposed. The use of the theoretical soluJions that were obtained has allowed local low-strength materials to be widely used in the construction of local roads in the USSR, which substantially reduces the cost of road construction.
Local low-strength materials and industrial byproducts are used for highway construction in many countries. The strength of these materials averages 30 to 40 MPa, Consequently, they fragment during the packing process, which creates a large number of fine particles (up to 22 percent). The process of particle fragmentation continues over the lifetime of the road, which lowers the usable lifetime of the pavement to 5 to 7 years. Stronger materials, with a strength of80 to 140 M Pa, undergo a similar, but slower, fragmentation process. The particles frag-
School of Highway and Agricultural Construction, Highway Department of The Polytechnical Institute of Vladimir, Gorky, 87, Vladimir, 600 005, USSR.
ment because of the high contact stresses that arise in the material. The reduction of these stresses during the packing process and under exposure to traffic will allow low-strength materials to be used and their usable lifespan in road coverings to be increased. However, no methods for calculating the contact stresses in complex stochastic media (any real granulated material, such as crushed stone, gravel, sand, and soil) currently exist. The purpose of this paper is to develop a theoretical model and engineering methods for calculating stresses in granulated materials. A stochastic model and theoretical nomograms for calculating the contact stresses have been developed. The proposed model includes the packing of particles of various sizes and shapes. The results presented here are based on 5 years of research performed at the Vladimir Polytechnical Institute in the USSR.
THEORETICAL MODEL FOR DETERMINING THE PACKING DENSITY OF A STOCHASTIC MEDIUM
The packing density of a stochastic medium can be determined from geometric considerations by averaging the results of a large number of iterations in regard to random packings that are composed of individual particles. The number of iterations is determined by the required calculation accuracy and ranges from 100 to 300.
The particle sizes in each iteration are selected randomly (using the Monte Carlo method, the Korobov algorithm, or a
116
table of random numbers). The continuous-sorting method can also be used. The volume packing density p is defined as
p =
where
v =
v = f(r) = n = ,_,
f v(r)f(r)dr D
J V(r)fir)dr D
(l)
the volume occupied by the particles of the material in an arbitrary tetrahedron, the volume of the tetrahedron, the particle size distribution function, and the region in space (r min~ r :::=:; r max'r > 0).
The variables r min and r max are the minimum and maximum sizes of the particles of material in the packing.
This formula can be used as long as the following condition is satisfied:
'1 '1 r 1'1 + + __ _ (2) r3 ''2'3
where r 1, r 2, r3, and r 4 are the radii of the particles in the packing in a given iteration and r 4 is the minimum radius.
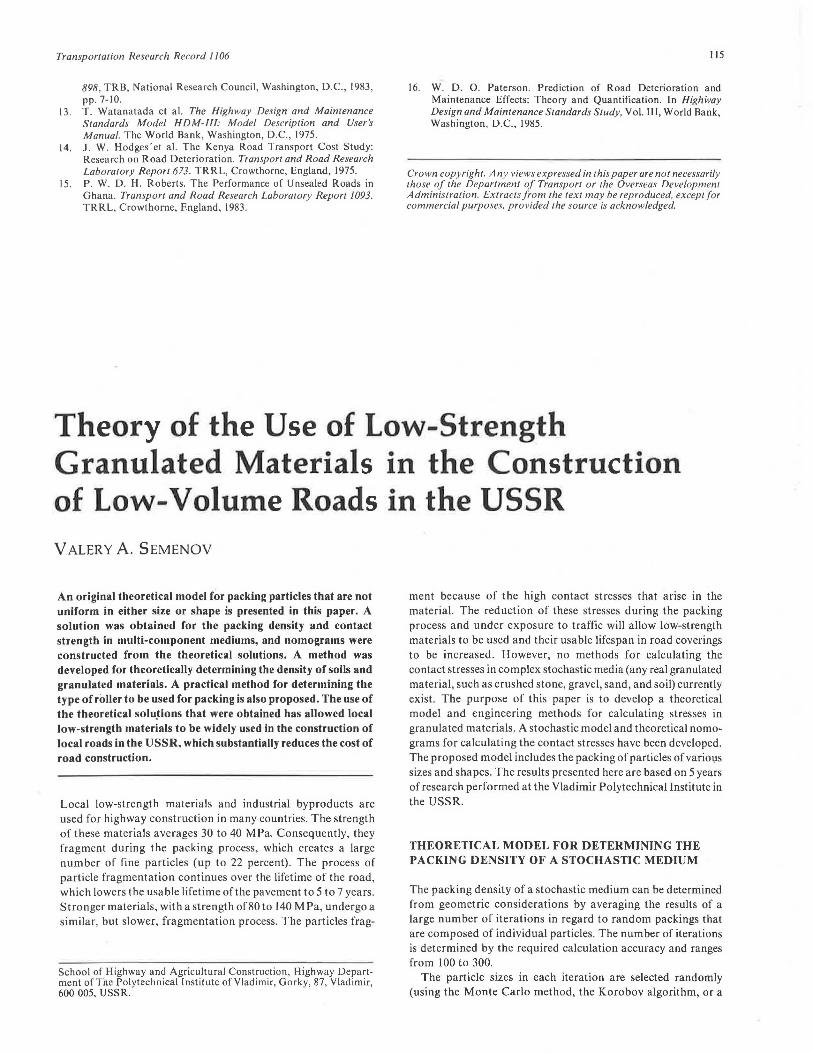
An analysis of Equation 2 showed that the proposed model can be used for any highway construction material or soil. The volume density pis determined by using Equation l to average the results of determining the density of a packing consisting of four random radii at each iteration. The calculation procedure presented later is used to determine the packing density at each iteration. A diagram that illustrates the determination of p is presented in Figure 1 (in which 0 1, 0 2, 0 3, and 0 4 are the centers o_f the particles that are in contact).
01
FIGURE 1 Theoretical diagram for stochastic packing.
Transportation Research Record I 106
The expressions for the density of packing of the material from geometrical considerations are determined as follows. A detailed derivation of the equations is presented in a report by Semenov (1).
V= _!__ "'' 2 3 'f 4CTp4 - 0"3;
where
C11 =r1+r2+r3+r4, C12 = '1'2 ... '1'3 + '1'4 + 'i"3 + 't"4 + r3r4. CT3 = 'i':f3 + '1''2'4 + 'i'3'4 + 'i"3'4• and 0"4 = '1'i"3'4
2 cos y ij = ----;:========----
y iJ is the dihedral angle with edge 0 10 2•
(3)
(4)
The stochastic model that was developed for the dense packing of particles of soil and other materials can be used extensively in highway construction and maintenance. It is thus possible to calculate the theoretical density of asphalt concrete, cement concrete, crushed stone, gravel, and soil. This allows density norms to be substantially improved and an optimal production technology to be developed. It is also possible to use this model to calculate the contact stresses in particles of material, for which it i~ necessary to determine the individual contact area between the particles in the material and the total number of contacts in a random cross-section.
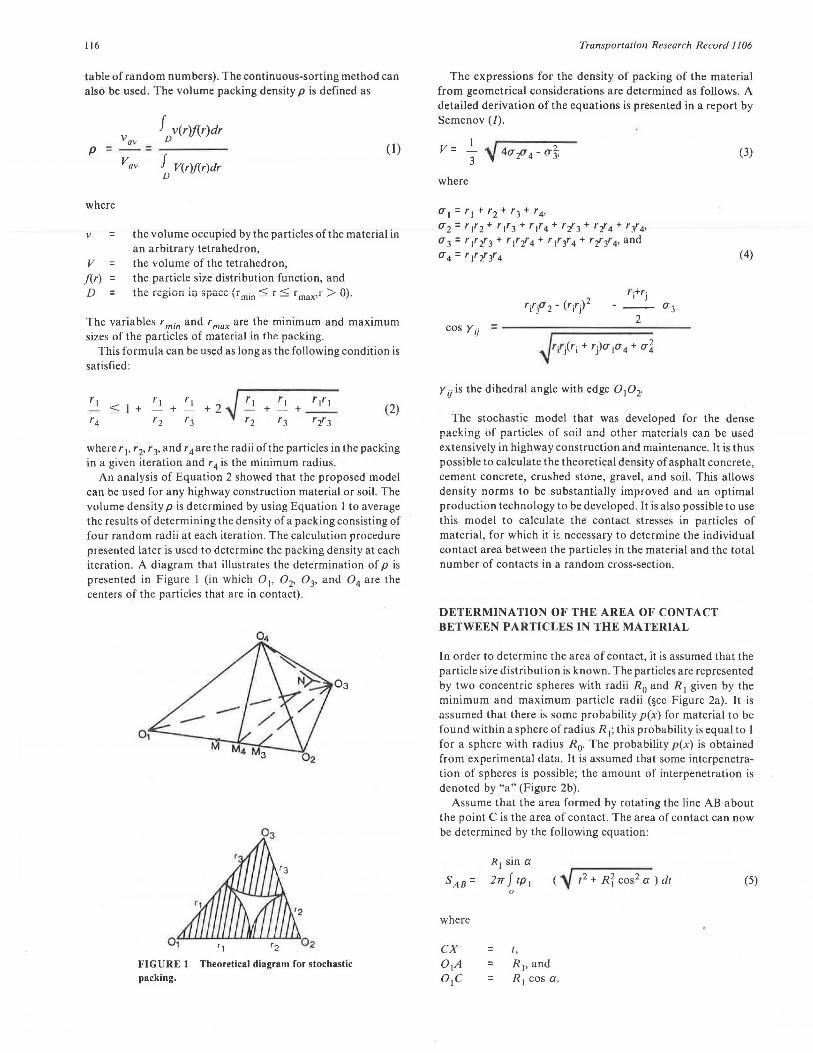
DETERMINATION OF THE AREA OF CONTACT BETWEEN PARTICLES IN THE MATERIAL
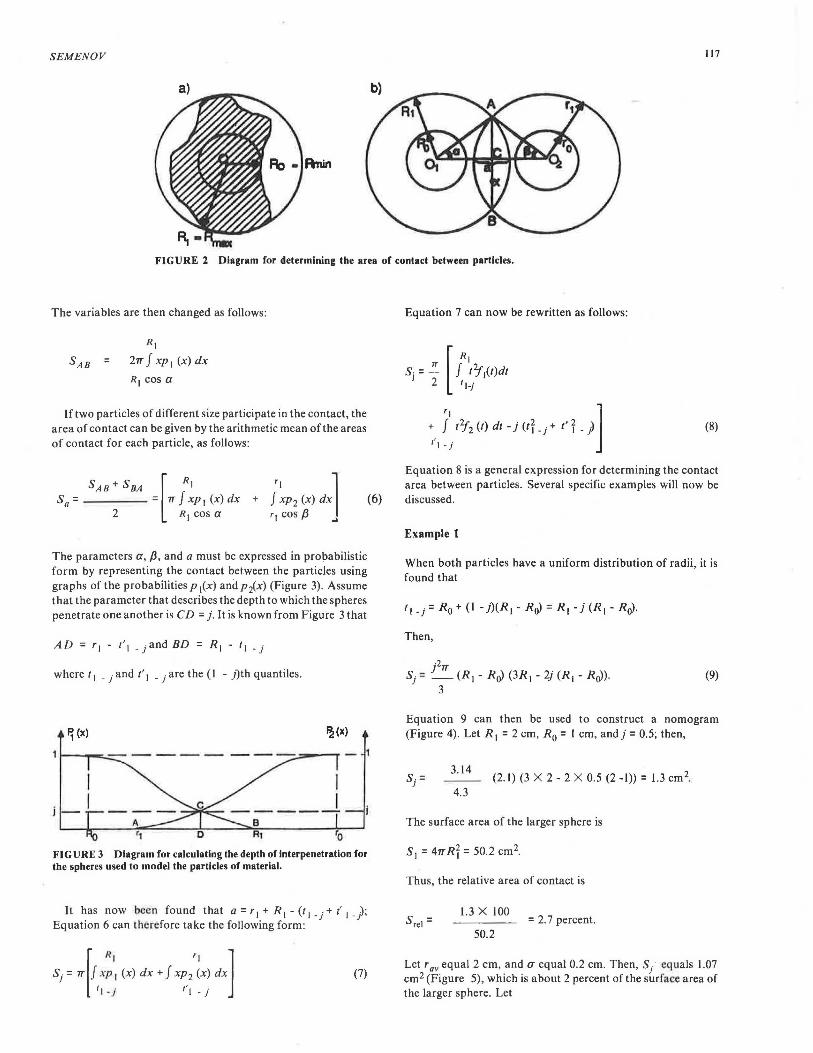
In order to determine the area of contact, it is assumed that the particle size distribution is known. The particles are represented by two concentric spheres with radii R 0 and R 1 given by the minimum and maximum particle radii (~ee Figure 2a) . It is assumed that there is some probability p(x) for material to be found within a sphere of radius R 1; this probability is equal to 1 for a sphere with radius R0. The probability p(x) is obtained from experimental data. It is assumed that some interpenetration of spheres is possible; the amount of interpenetration is denoted by "a" (Figure 2b).
Assume that the area formed by rotating the line AB about the point C is the area of contact. The area of contact can now be determined by the following equation:
R 1 sin a
( '1 SAB = 21T ftp I t 2 + RT cos 2 a ) dt (5) 0
where
ex = I,
0 1A = R 1, and 0 1C = R 1 cos a.
SEMENOV 117
FIGURE 2 Diagram for determining the area of contact between particles.
The variables are then changed as follows :
SAB = R1
2rr J xp 1 (x) dx
R1 cos a
If two particles of different size participate in the contact, the area of contact can be given by the arithmetic mean of the areas of contact for each particle, as follows:
The parameters a, /J, and a must be expressed in probabilistic form by representing the contact between the particles using graphs of the probabilities p 1(x) and p 2(x) (Figure 3). Assume that the parameter that describes the depth to which the spheres penetrate one another is CD = j. It is known from Figure 3 that
AD = r 1 - t' 1 _ 1and BD = R 1 - 11 _ J
where I 1 _ J and I' 1 _ J are the ( 1 - j)th quantiles.
~ (x) ~(X)
1---..:-- -- -- - - -- -- -- --::.=--"""T
ro FIG URE 3 Diagram for calculating the depth of interpenetration for the spheres used to model the particles of material.
It has now bee n found that a= r 1 + R 1 -(1 1 -J+ ( 1 _);
Equation 6 can therefore take the following form :
(7)
(6)
Equation 7 can now be rewritten as follows:
'1 ] +. J t 2Ji (1) dt - j (IT - j + t' T - ) I I -j
(8)
Equation 8 is a general expression for determining the contact area between particles. Several specific examples will now be discussed.
Example 1
When both particles have a uniform distribution of radii, it is found that
I 1 _ i = R 0 + (I - J)(R 1 - Ro) = R 1 - j (R 1 - Ro).
Then,
(9)
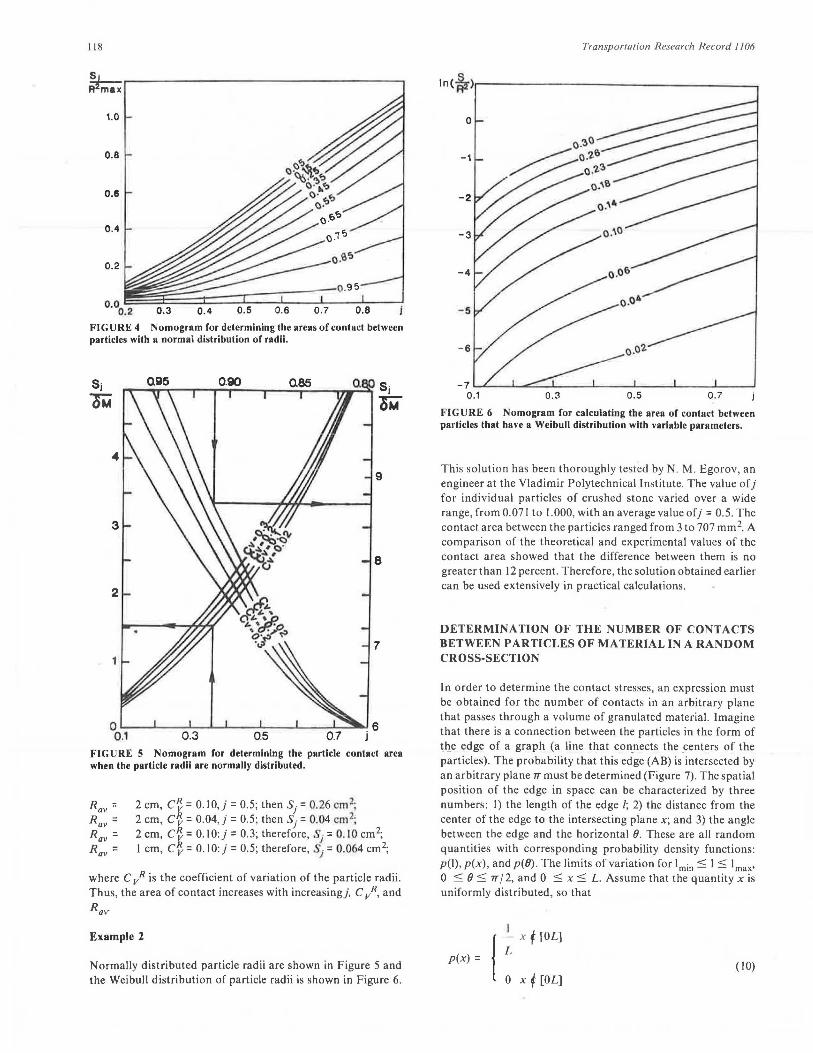
Equation 9 can then be used to construct a nomogram (Figure 4). Let R 1 = 2 cm, R0 = I cm, andj = 0.5; then,
3.14
4.3 (2.1) (3 X 2 - 2 X 0.5 (2 -1)) = 1.3 cm 2.
The surface area of the larger sphere is
S 1 = 4rrRf = 50.2 cm2.
Thus, the relative area of contact is
s,eJ = 1.3 X JOO
50.2 = 2. 7 percent.
Let r av equal 2 cm, and a equal 0.2 cm. Then, s1 equals 1.07 cm2 (Figure 5), which is about 2 percent of the surface area of the larger sphere. Let
118
Fl G URE 4 Nomogram for determining the areas of contact between particles with a normal distribution of radii.
FIGURE 5 Nomogram for determining the particle contact area when the particle radii are normally distributed.
2 cm, ci: 0.10,!: 0.5'. then SJ: 0.26 cmi 2 cm, Ck= 0.04'.1. = 0.5'. then SJ - 0.0~ cm ,
2.
2 cm, C v- 0. 10.J - 0.3, therefore, s1 - 0. 10 cm , I cm, ct= 0.10:) = 0.5; therefore, s1 = 0.064 cm2;
where C vR is the coefficient of variation of the particle radii . Thus, the area of contact increases with increasing). C vR• and
Rav·
Example 2
Normally distributed particle radii are shown in Figure 5 and the Weibull distribution of particle radii is shown in Figure 6.
Transportation Research Record 1106
0
-1
-2
-3
-4
-5
-6
-1'-''--~i.......oc:::...__J'--~~'--~~'--~~'--~~'--~--' 0.1 0.3 0.5 0 .7
FIGURE 6 Nomogram for calculating the area of contact between puticles that have a Weibull distribution with variable parameters.
This solution has been thoroughly tested by N. M. Egorov, an engineer at the Vladimir Polytechnical Institute . The value of) for individual particles of crushed stone varied over a wide range, from 0.071 to 1.000, with an average value of) = 0.5. The contact area between the particles ranged from 3 to 707 mm 2. A comparison of the theoretical and experimental values of the contact area showed that the difference between them is no greater than 12 percent. Therefore, the solution obtained earlier can be used extensively in practical calculations.
DETERMINATION OF THE NUMBER OF CONTACTS BETWEEN PARTICLES OF MATERIAL IN A RANDOM CROSS-SECTION
In order to determine the contact stresses, an expression must be obtained for the number of contacts in an arbitrary plane that passes through a volume of granulated material. Imagine that there is a connection between the particles in the form of tl)_e edge of a graph (a line. that con_nects the _centers of the particles). The probability that this edge (AB) is intersected by an arbitrary plane rr must be determined (Figure 7). The spatial position of the edge in space can be characterized by three numbers: 1) the length of the edge I; 2) the distance from the center of the edge to the intersecting plane x; and 3) the angle between the edge and the horizontal e. These are all random quantities with corresponding probability density functions: p(l), p(x), and p(fJ). The limits of variation for I min :::; I :::; 1 max•
0 :::; (J :::; rr / 2, and 0 :::; x :::; L. Assume that the quantity x is uniformly distributed, so that
1
/
--;, x f [OL]
p(x) =
0 x f [OL] (10)

SEMENOV
B
FIGURE 7 Theoretical diagram for determining the number of contacts between particles in a plane passing through the packing.
The edge is intersected by the plane rr if and only if x < (I/ 2) cos 8. The probability that the edges intersect the plane is designated by "p." Then,
p = JJJ) p (£ ) p (8) p (x) d R d8 dx (v
I rr / 2 av
f cos 8 p (8) dB 2L o
where Vis the volume of the material.
( 11)
The number of particles within the volume V can be obtained from the following equations:
4rr LSp
3 N = p
3LSp
41Tr~v (12)
where Land Sare the dimensions of the volume being studied (see Figure 7), p is the volume packing density of the material, and r av is the mean particle radius in the packing of the material.
The number of contacts between particles in a volume Vis
Q, = 3KLSp
8rrr~v (13)
where K is the coordination number. The number of the right hand contacts intersected by the plane 1T is
Suppose 8 is distributed uniformly on [0,rr/2] as follows:
p (8) =
Pr =
; i 1T I 0 [O, 1T I 2]
0 I 8 [Orr / 2]
2 x
2L Tr
3Sp'K Q, =----- (15)
81T2r~v
(14)
( 15)
119
If it is assumed that on the average, /av= 2r av' and that the total number of intersected-contacts = Q, + Q, ~ 2Q,, then the
following can be obtained:
Q = 3pSK
(16)
Other distribution laws for 8 lead to the theoretical formulas given by Semenov (1). The solution obtained is in good agreement with the formula obtained by Rumpf; the difference is no greater than 5 percent (2) . A comparison of Equation 16 against the test data of Zimin and Timchenko and Andriyanov and Zimon showed that the difference was no greater than 12 percent, which is sufficiently accurate (3, 4).
The areas of contact between particles have been determined. The calculation of the total area of contact between the particles in a random intersecting plane and the actual contact stresses is now relatively straightforward. The practical use of the theoretical solutions obtained in this paper will now be discussed.
EXAMPLES OF THE PRACTICAL USE OF THE THEORETICAL SOLUTIONS
Example 1
The contact stresses that arise upon compression of a sample of asphalt concrete when the particles of the material have a uniform distribution will now be calculated. The maximum and minimum radii of the spheres (which is determined by the maximum and minimum size of an individual particle) can be written in the following way with a 95 percent confidence coefficient.
(17)
Assume that the degree of interpenetration of the spheres is y = 0.5, and that the number of contacts between particles is 8.
The ratio of the increase in the contact stresses to the mean strength of the sample can be calculated as follows :
where
p s
= =
-=-p _S_ =
FcorP
s
the pressure on the sample, the area of the sample, and
(18)
the area of the contacts between particles in a random cross section.
The value of Fcon can be obtained from Equation 9 using Equation 16 as follows :
(19)
120
where a; is the fractional content of the i th fraction (i = 1, 2, 3, ... , n). By substituting Equations 12 and 17 into Equation 18 and rearranging, the following equation is obtained.
1T
4pCv (3 + 2 .,) (20)
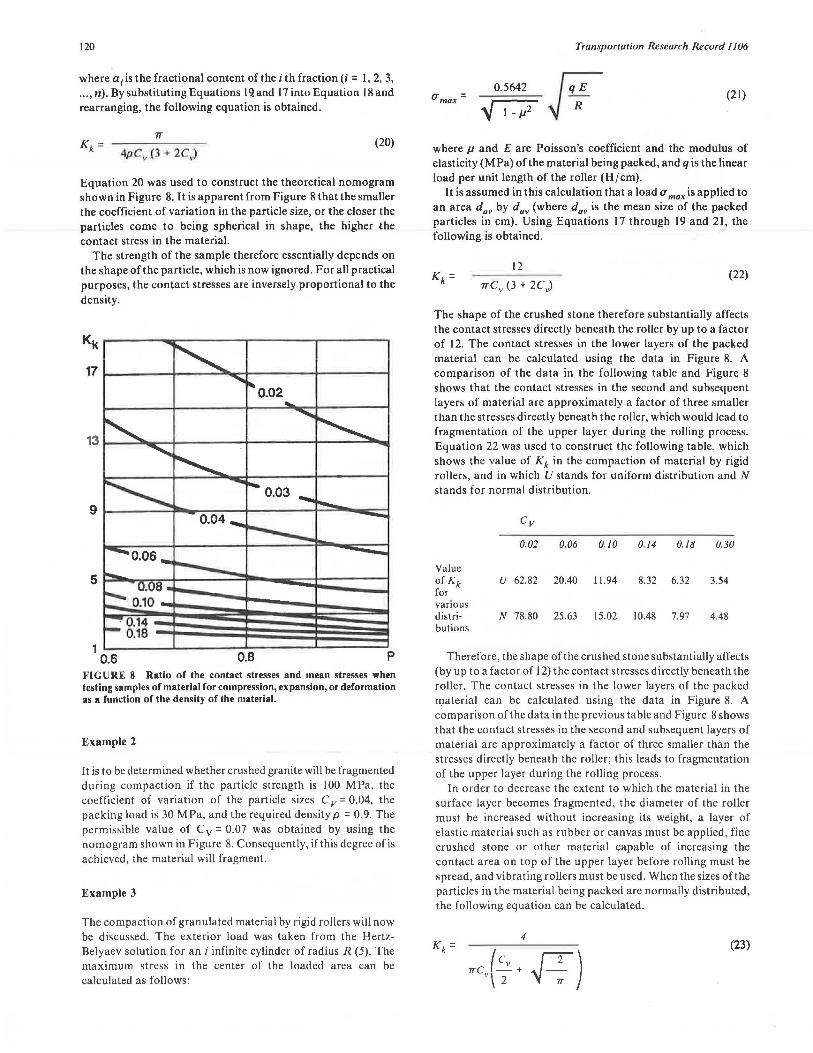
Equation 20 was used to construct the theoretical nomogram shown in Figure 8. It is apparent from Figure 8 that the smaller the coefficient of variation in the particle size, or the closer the particles come to being spherical in shape, the higher .the contact stress in the material.
The strength of the sample therefore essentially depends on the shape of the particle, which is now ignored. For all practical purposes, the contact stresses are inversely proportional to the density.
9
1 0.6 0.8 p
FIGURE 8 Ratio of the contact stresses and mean stresses when testing samples of material for compression, expansion, or deformation as a function of the density of the material.
Example 2
It is to be determined whether crushed granite will be fragmented during compaction if the particle strength is 100 MPa, the coefficient of variation of the particle sizes C v = 0.04, the packing load is 30 MPa, and the required density p = 0.9. The permissible value of Cv = 0.07 was obtained by using the nomogram shown in Figure 8. Consequently, if this degree of is achieved, the material will fragment.
Example 3
The compaction of granulated material by rigid rollers will now be discussed. The exterior load was taken from the HertzBelyaev solution for an i infinite cylinder of radius R (5). The maximum stress in the center of the loaded area can be calculated as follows:
Transportation Research Record 1106
U max= -;:o=.5=6=42=- ~ V i-µ2 ~ R
(21)
where µ and E are Poisson's coefficient and the modulus of elasticity (MPa) of the material being packed, and q is the linear load per unit length of the roller (H /cm).
It is assumed in this calculation that a load u max is applied to an area d
0v by dav (where dav is the mean size of the packed
particles in cm). Using Equations 17 through 19 and 21, the following is obtained.
12 (22)
The shape of the crushed stone therefore substantially affects the contact stresses directly beneath the roller by up to a factor of 12. The contact stresses in the lower layers of the packed material can be calculated using the data in Figure 8. A comparison of the data in the following table and Figure 8 shows that the contact stresses in the second and subsequent layers of material are approximately a factor of three smaller than the stresses directly beneath the roller, which would lead to fragmentation of the upper layer during the rolling process. Equation 22 was used to construct the following table, which shows the value of Kk in the compaction of material by rigid rollers, and in which U stands for uniform distribution and N stands for normal distribution.
0.02 0.06 0.10 0.14 0.18 0.30
Value of Kk u 62.82 20.40 11.94 8.32 6.32 3.54 for various distri- N 78.80 25.63 15.02 10.48 7.97 4.48 butions
Therefore, the shape of the crushed stone substantially affects (by up to a factor of 12) the contact stresses directly beneath the roller. The contact stresses in the lower layers of the packed material can be calculated using the data in Figure 8. A comparison of the data in the previous table and Figure 8 shows that the contact stresses in the second and subsequent layers of material are approximately a factor of three smaller than the stresses directly beneath the roller; this leads to fragmentation of the upper layer during the rolling process.
In order to decrease the extent to which the material in the surface layer becomes fragmented, the diameter of the roller must be increased without increasing its weight, a layer of elastic material such as rubber or canvas must be applied, fine crushed stone or other material capable of increasing the contact area on top of the upper layer before rolling must be spread, and vibrating rollers must be used. When the sizes of the particles in the material being packed are normally distributed, the following equation can be calculated.
4 (23)
Trr (2 + rr-) v \ 2 \j----;
SEMENOV
The theoretical results of this equation are given in the previous table. The value of kk for the normal distribution is an average of a factor of 1.255 times greater than that for the uniform distribution.
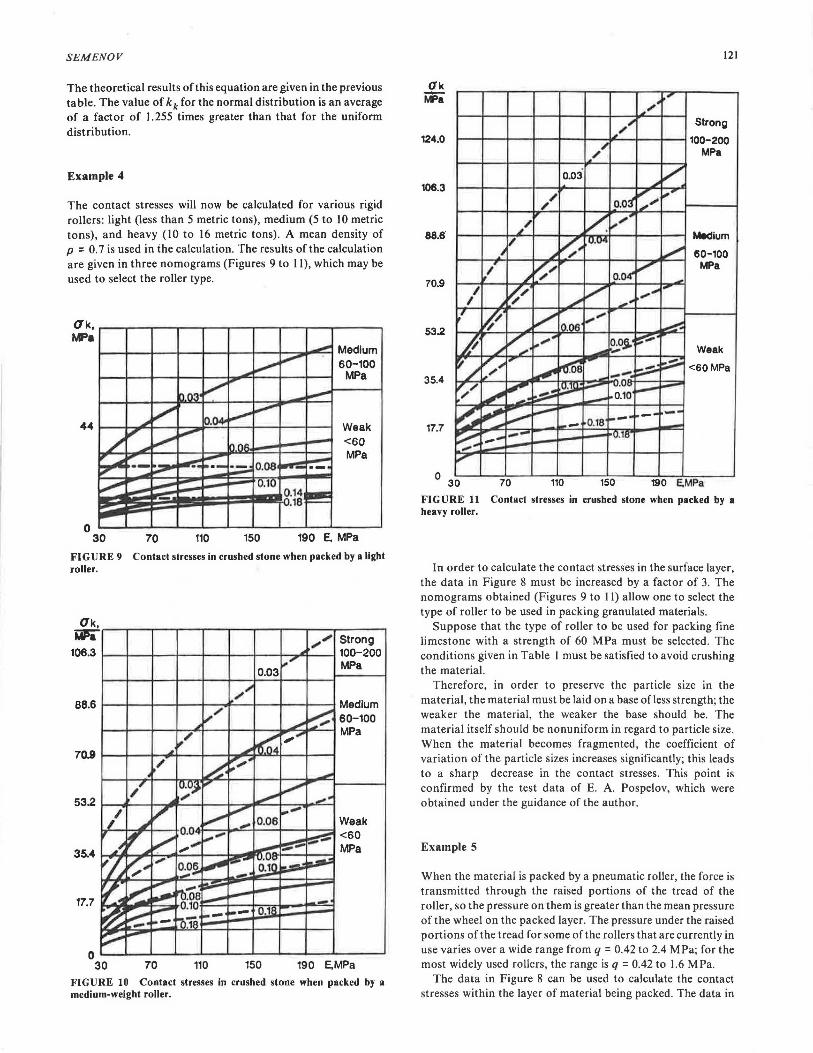
Example 4
The contact stresses will now be calculated for various rigid rollers: light (less than 5 metric tons), medium (5 to 10 metric tons), and heavy (10 to 16 metric tons). A mean density of p = 0. 7 is used in the calculation. The results of the calculation are given in three nomograms (Figures 9 to 11), which may be used to select the roller type.
O'k,,_.~..-----..-----...----.---.----r--.---.---.---~ MP a
1---11--t--t---t--+--t---l--:::3'fo~:--t Medium
FIGURE 9 roller.
O'k, MJ5&
106.3
88.6
7D.9
53.2
35.4
17.7
/ /
~
.. ~ 'Z ~-~ ~
0 30
70 110 150
60-100 MP a
Weak <60 MP a
190 E. MPa
Contact stresses in crushed stone when packed by a light
.,,,.,,, Strong .. 100-200
0.03 ~, MP a
,,-"
,," Medium
~ ~ 60-100 .. ~/ ~ .,,,-
MP a
~ ~ . ·/ A 'fl".,, • ...
~ , IU.~j .- / / ... 111"
___.. --:,,- V' ~ ""' ....
,J -0.06 Weak , o.o~ i.- ..... ~ <60 ... ~ .,,,,,,. ~ .:::::- MP a
~, ... ~ po- .,.O ...
~ .~§. 0.10 -----
~ -- rt> .... ~ ~ ..- .08 ._.---0.10 -.....-- 0.1R ,.....
~ -- .. --- or -70 110 150 190 E,MPa
FIGURE 10 Contact stresses in crushed stone when packed by a medium-weight roller.
121
~
,.· ·'
124.0
,.~ Strong ~-
100-200 ,.~ MP a .
o.o3 ...v / 0.0~
,,, ~-
/ .i,,,. 106.3
., '/. ,,,. ..
~/ ,, / ~~-
U.U't Medium
.I / 60-100
88.6
/r ~,. v MP a ~ 0.04' -
I ~/ / .,,,. ... ~ I / --
70.9
/ ~ ... v ..-""" 0.06 ~
R / ..,, .. ~o~· -:-..-,/ .;'
... ..... Weak
53.2
~/ v _, - hr.OB r- c:.==- <60MPa ,_,,,,. l....it' ---::. ~ ,,. ,- ~ .- •. o ...
i---·"" """ -· ~ - i-0.10
35.4
~ ~ v ....- -· --~0.18 ~-· -- -~ ... --- ~:...tis· ..... 17.7
, 0
30 70 110 150 190 E.MPa
FIGURE 11 Contact stresses in crushed stone when packed by a heavy roller.
In order to calculate the contact stresses in the surface layer, the data in Figure 8 must be increased by a factor of 3. The nomograms obtained (Figures 9 to I I) allow one to select the type of roller to be used in packing granulated materials.
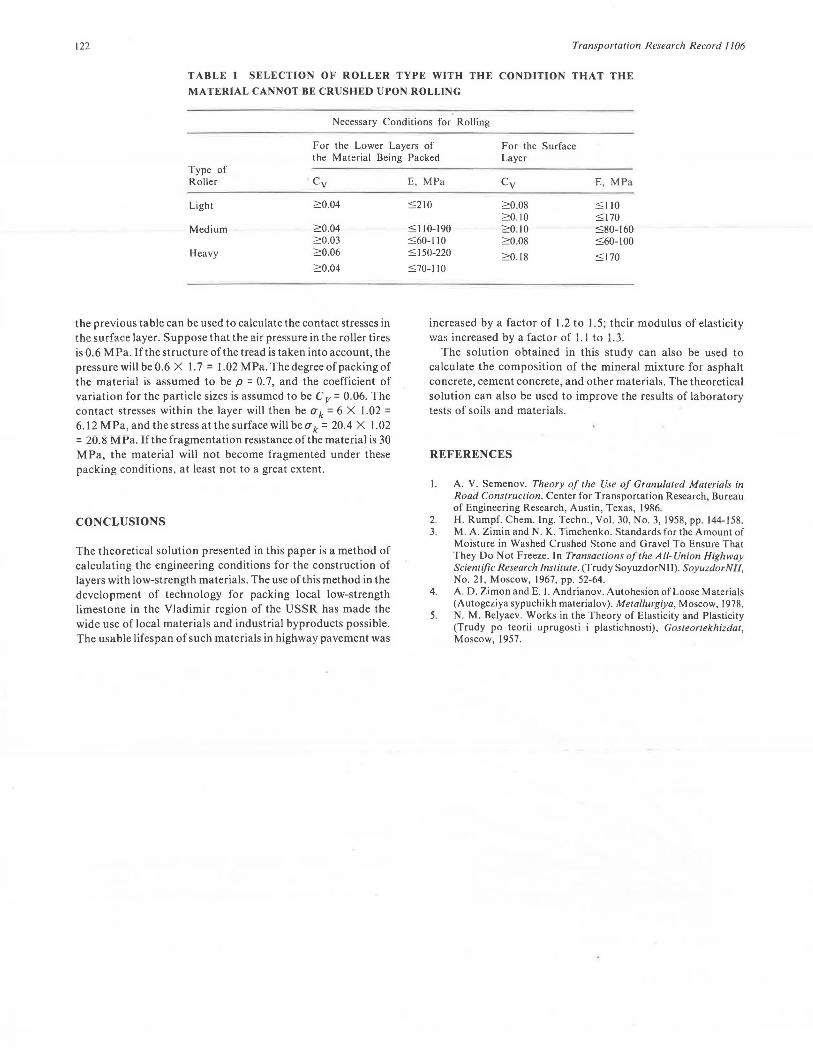
Suppose that the type of roller to be used for packing fine limestone with a strength of 60 MPa must be selected. The conditions given in Table 1 must be satisfied to avoid crushing the material.
Therefore, in order to preserve the particle size in the material, the material must be laid on a base ofless strength; the weaker the material, the weaker the base should be. The material itself should be nonuniform in regard to particle size. When the material becomes fragmented, the coefficient of variation of the particle sizes increases significantly; this leads to a sharp decrease in the contact stresses. This point is confirmed by the test data of E. A. Pospelov, which were obtained under the guidance of the author.
Example 5
When the material is packed by a pneumatic roller, the force is transmitted through the raised portions of the tread of the roller, so the pressure on them is greater than the mean pressure of the wheel on the packed layer. The pressure under the raised portions of the tread for some of the rollers that are currently in use varies over a wide range from q = 0.42 to 2.4 MPa; for the most widely used rollers, the range is q = 0.42 to 1.6 MPa.
The data in Figure 8 can be used to calculate the contact stresses within the layer of material being packed. The data in
122 Transportation Research Record JJ06
TABLE I SELECTION OF ROLLER TYPE WITH THE CONDITION THAT THE
MATERIAL CANNOT BE CRUSHED UPON ROLLING
Necessary Conditions for Rolling
For the Lower Layers of the Material Being Packed
For the Surface Layer
Type of Roller Cy
Light 20.04
Medium 20.04 20.03
Heavy 20.06
20.04
the previous table can be used to calculate the contact stresses in the surface layer. Suppose that the air pressure in the roller tires is 0.6 MPa. If the structure of the tread is taken into account, the pressure will be 0.6 X I. 7 = 1.02 MPa. The degree of packing of the material is assumed to be p = 0. 7, and the coefficient of variation for the particle sizes is assumed to be C v = 0.06. The contact stresses within the layer will then be CT k = 6 X 1.02 = 6.12 M Pa, and the stress at the surface will be CT k = 20.4 X 1.02 = 20. 8 M Pa. If the fragmentation resistance of the material is 30 MPa, the material will not become fragmented under these packing conditions, at least not to a great extent.
CONCLUSIONS
The theoretical solution presented in this paper is a method of calculating the engineering conditions for the construction of layers with low-strength materials. The use of this method in the development of technology for packing local low-strength limestone in the Vladimir region of the USSR has made the wide use of local materials and industrial byproducts possible. The usable lifespan of such materials in highway pavement was
E, MPa Cy E, MPa
::::210 2 0.08 ::::: 110 2 0.10 :S::l70
:S::l 10-190 20.10 :S::80-160 :S::60-l l 0 2 0.08 :S::60-100 :S:: l 50-220 2 0.18 ::::: 170 :S::70-1 IO
increased by a factor of 1.2 to I. 5; their modulus of elasticity was increased by a factor of I. I to 1.3.
The solution obtained in this study can also be used to calculate the composition of the mineral mixture for asphalt concrete, cement concrete, and other materials. The theoretical solution can also be used to improve the results of laboratory tests of soils and materials .
REFERENCES
I. A. V. Semenov. Theory of the Use of Granulated Materials in Road Construction. Center for Transportation Research, Bureau of Engineering Research, Austin, Texas, 1986.
2. H. Rumpf. Chem. Ing. Techn., Vol. 30, No. 3, 1958, pp. 144-158. 3. M. A. Zimin and N. K. Timchenko. Standards for the Amount of
Moisture in Washed Crushed Stone and Gravel To Ensure That They Do Not Freeze. In Transactions of the All-Union Highway Scientific Research Institute. (Trudy SoyuzdorNll). SoyuzdorNll, No. 21, Moscow, 1967, pp. 52-64.
4. A. D. Ziman and E.1. Andrianov. Autohesion of Loose Materials (Autogeziya sypuchikh materialov). Metallurgiya, Moscow, 1978.
5. N. M. Belyaev . Works in the Theory of Elasticity and Plasticity (Trudy po teorii uprugosti i plastichnosti), Gosteortekhizdat, Moscow, 1957.