Embed Size (px)
Citation preview
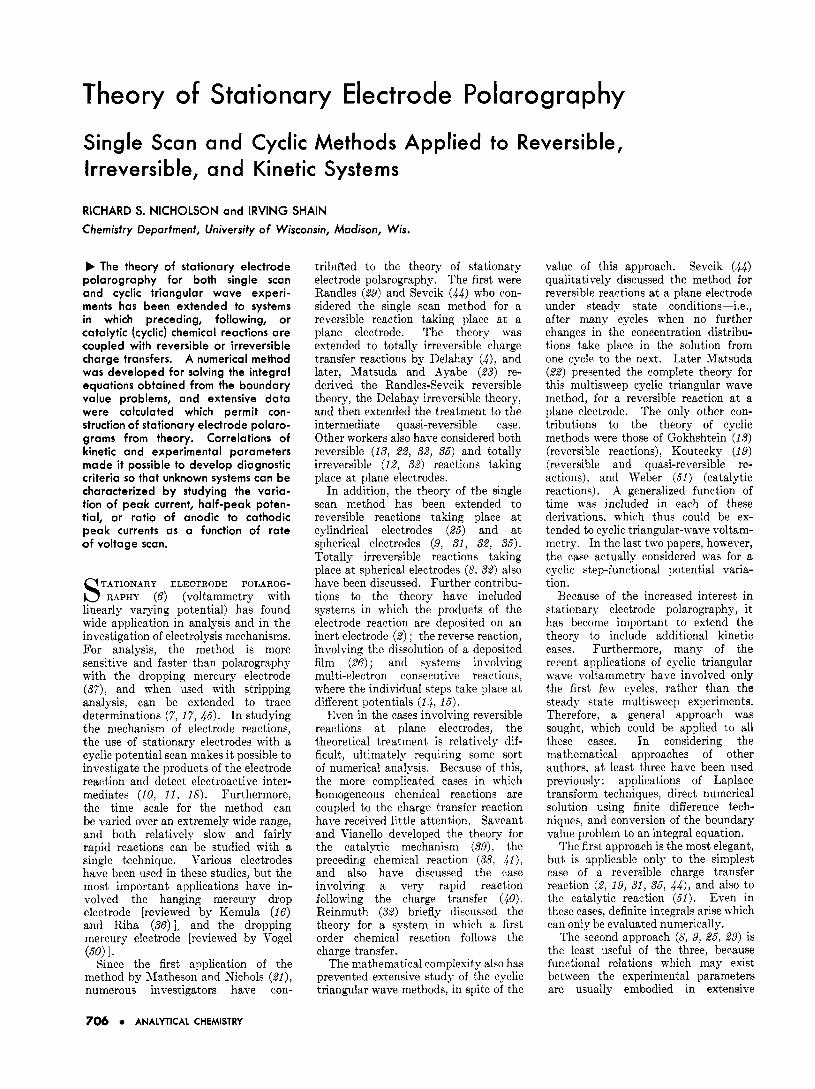
Theory of Stationary Electrode Polarography
Single Scan and Cyclic Methods Applied to Reversible, Irreversible, and Kinetic Systems
RICHARD S. NICHOLSON and IRVING SHAIN Chemistry Department, University of Wisconsin, Madison, Wis.
b The theory of stationary electrode polarography for both single scan and cyclic triangular wave experi- ments has been extended to systems in which preceding, following, or catalytic (cyclic) chemical reactions are coupled with reversible or irreversible charge transfers. A numerical method was developed for solving the integral equations obtained from the boundary value problems, and extensive data were calculated which permit con- struction of stationary electrode polaro- grams from theory. Correlations of kinetic and experimental parameters made it possible to develop diagnostic criteria so that unknown systems can be characterized by studying the varia- tion of peak current, half-peak poten- tial, or ratio of anodic to cathodic peak currents as a function of rate of voltage scan.
TATlONARY ELECTRODE POLAROG- S RAPHY (6) (voltammetry with linearly varying potential) has found wide application in analysis and in the investigation of electrolysis mechanisms. For analysis, the method is more sensitive and faster than polarography with the dropping mercury electrode (37), and when used with stripping analysis, can be extended to trace determinations (7, 17, 46). In studying the mechanism of electrode reactions, the use of stationary electrodes with a cyclic potential scan makes i t possible to investigate the products of the electrode reaction and detect electroactive inter- mediates (10, 11, 18). Furthermore, the time scale for the method can be varied over an extremely wide range, and both relatively slow and fairly rapid reactions can be studied with a single technique. Various electrodes have been used in these studies, but the most important applications have in- volved the hanging mercury drop electrode [reviewed by Kemula (16) and Riha (SS) ] , and the dropping mercury electrode [reviewed by Vogel (50) I .
Since the first application of the method by hfatheson and Kichols (H), numerous investigators have con-
tribu'ted to the theory of stationary electrode polarography. The first were Randles (29) and Revcik (44) who con- sidered the single scan method for a reversible reaction taking place a t a plane electrode. The theory was extended to totally irreversible charge transfer reactions by Delahay (4 ) , and later, Matsuda and Ayabe (23) re- derived the Randles-Sevcik reversible theory, the Delahay irreversible theory, and then extended the treatment to the intermediate quasi-reversible case. Other workers also have considrred both reversible (13, 22, 32, 36) and totally irreversible (12, 32) reactions taking place a t plane electrodes.
In addition, the theory of the single scan method has been extended to reversible reactions taking place a t cylindrical electrodes (25) and a t spherical electrodes (9, 31, 32, 36). Totally irreversible reactions taking place a t spherical electrodes (8, 32) also have been discussed. Further contribu- tions to the theory have included systems in which the products of the electrode reaction are deposited on an inert electrode (2) ; the reverse reaction, involving the dissolution of a deposited film ($6) ; and systems involving multi-electron consecutive reactions, where the individual steps take place a t different potentials (14, 16).
Even in the case3 involving reversible reactions a t plane electrodes, the theoretical treatment is relatively dif- ficult, ultimately requiring some sort of numerical analysis. Because of this, the more complicated cases in which homogeneous chemical reactions are coupled to the charge transfer reaction have received little attention. Saveant and Vianello developed the theory for the catalytic mechanism (39), the preceding chemical reaction (38, @), and also have discussed the case involving a very rapid reaction following the charge transfer (40). Reinmuth (32) briefly discussed the theory for a systeni in which a first order chemical reaction follows the charge transfer.
The mathematical complexity also has prevented extensive study of the cyclic triangular wave methods, in spite of the
value of this approach. Sevcik (44) qualitatively discussed the method for reversible reactions a t a plane electrode under steady state conditions-Le., after many cycles when no further changes in the concentration distribu- tions take place in the solution from one cycle to the next. Later Matsuda (22) presented the complete theory for this multisweep cyclic triangular wave method, for a reversible reaction a t a plane electrode. The only other con- tributions to the theory of cyclic methods were those of Gokhshtein (13) (reversible reactions), Koutecky (19) (reversible and quasi-reversible re- actions), and Weber (51) (catalytic reactions). A generalized function of time was included in each of these derivations. which thus could be ex- tended to cyclic triangular-wave voltam- metry. In the last two papers, however, the case actually considered was for a cyclic step-functional potential varia- tion.
Because of the increased interest in stationary electrode polarography, it has become important to extend the theory to include additional kinetic cases. Furthermore, many of the recent applications of cyclic triangular wave voltammetry have involved only the first few cycles, rather than the steady state multisweep experiments. Therefore, a general approach was sought, which could be applied to all these cases. In considering the mathematical approaches of other authors, a t least three have been used previously : applications of Laplace transform techniques, direct numerical solution using finite difference tech- niques, and conversion of the boundary value prohlem to an integral equation.
The first approach is the most elegant, but is applicable only to the simplest case of a reversible charge transfer reaction (2, 19, 31, 35, 44, and also to the catalytic reaction (51) . Even in these cases, definite integrals arise which can only be evaluated numerically.
The second approach (8, 9, 25, 29) is the least useful of the three, because functional relations which may exist between the experimental parameters are usually embodied in extensive
706 ANALYTICAL CHEMISTRY
numerical tabulations and are often missed. Thus, the rcsults may depend on an extremely large number of variahles. This is particularly so in the more complicated cases involving coupled chemical reactions, which may require the direct simultaneous solution of three partial diffwential equations together \iith thrpe initial and six boundary conditions.
The third method possesses the advantages of the first, and yet is more generally applicable Several methods can he used to convert the boundary va!ue problem to an integral equation (%), and a t least two methods of solving the resulting integral equations havc been used. The series solution proposed by Reinmuth (32) is very straightforward. but only in cases involving totally irceversible charge transfer does it provide a series which is properly convergent over the entire potential range. [This approarh to obtaining series solutions is essentially the same as used by Smutek (47) for irreversible polarographic waves. Series solutions of the same form can also be obtained directly from the differential equations, as was shown recently by Buck ( S ) ] . Reinniuth has outlined a method for evaluating these series in regions where they are divergent (SS), but attempts to use that approach in this laboratory (with a Bendix Model G-15 digital computw) produced er- ratic results.
The methods most frequently used for solving the integral equations have been numerical 14, I i? , 13, L2, 23, 26, 39) and an adaptation of the approach suggested by Gokhshtein (13) was used in this work. The r e t h o d which was developed is generally applicable to all of the cases nientioned above, all additional first order kinetic cases of interest, and both single scan and cyclic triangular wave experiments. Except for reversible. irreversible, and catalytic reactions, the treatmmt is limited to plane electrodes because of the marked increase in compleuity of the theory for most of the kinetic cas=s if an attempt is made to account for spherical diffusion rigorously. Conditions under which derivations for plane alectrodes can be used for other geomitries have been discussed by Berzins ,tnd Delahay (2) . An empirical approach to making ap- proximate corrections for the spherical contribution to the current will be described elsewhere. The cases con- sidered here all invol Je reductions for the first charge transfer step, but extension to oxidationtr is obvious.
To present a logica discussion, each of the kinetic cases wa'; compared to the corresponding reversikde or irreversible reaction which rvould tzke place without the kinetic compliration. Thus, it was necessary to inc!ude in this work a substantial discussior of these two
Figure 1 . Wave form for cyclic tri- an gular wave vo I t a mme t ry
cases, in spite of the extensive previous work. However, this makes it possible to discuss the numerical method pro- posed here in terms of the simplest possihle case for clarity, and a t the same time summarizes the widely scattered previous work in a form which is most convenient for comparison of experimental results with theory.
I. REVERSIBLE CHARGE TRANSFER
Boundary Value Problem. For a reversible reduction of an oxidized species 0 to a reduced species R,
O + n e G R (1) taking place a t a plane electrode, the boundary value problem for stationary electrode polarography is
dC0 d2CO dt d X - = D o - ,
DO (z) = -DE (2) (5a)
CO/CR = exp[(nF/RT)(E - E")] (5b)
where Co and CR are the concentrations of substances 0 and R, z is the distance from the electrode, t is the time, Co* and CR* are the bulk concentrations of substances 0 and R, DO and DR are the diffusion coefficients, n is the number of electrons, E is the potential of the electrode, E' is the formal electrode potential, and R, T, and F have their usual significance. The applicability of the Fick diffusion equations and the initial aiid boundary conditions has been discussed by Rein- muth (33).
For the case of stationary electrode polarography* the potential in Equation 5b is a function of time, given by the relations
O < t < A E = E , - v t ( 6 4 X 6 t : E = E, - 2vX + z;t (6b)
where Ei is the initial potential, o is the rate of potential scan, and A is the time a t which the scan is reversed (Figure 1).
Equations 6a and 6b can be sub- stituted into Equation 5b to obtain the boundary condition in an abridged form:
cO/CR = esxw (7) where
0 = exp[(nF/RT)(E, - E')] (8)
and
a = nFv/h!T (10) If t is always less than A, then Equation 7 reduces to
Co/CR = (11 ) which is the same boundary condition that has been used previously for theoretical studies of the single scan method for a reversible charge transfer.
The direct use of the Laplace trans- form to solve this boundary value problem is precluded by the form of Equation 7 . However, the differential equations can be converted into integral equations by taking the Laplace trans- form of Equations 1 to 4, solving for the transform of the surface concentra- tions in terms of the transform of the surface fluxes, and then applying the convolution theorem (33) :
where
The boundary condition of Equation 7 now can be combined with Equations 12 and 13, to eliminate the concentra- tion terms and obtain a single integral equation, which has as its solution the flux of substance 0 a t the electrode surface :
where
Referring to Equation 10, i t can be noted that the term at is dimensionless
at = nFut/RT = (nF/RT)(E; - E ) (17)
and is proportional to the potential. Since the ultimate goal is to calculate current-potential curves rather than
VOL. 36, NO. 4, APRIL 1964 707
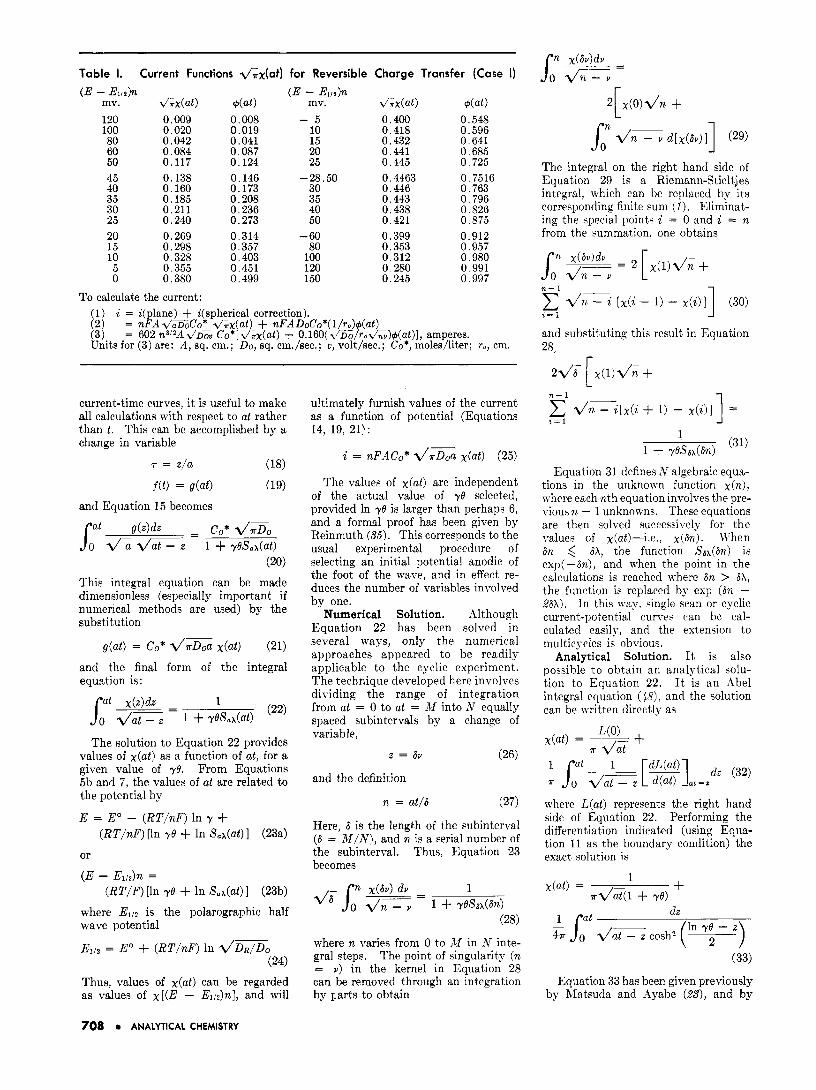
Table 1. Current Functions &x(at) for Reversible Charge Transfer (Case I) ( E - E ~ d n
mv. 120 100 80 60 50 45 40 35 30 25
V%x(at) 0.009 0.020 0.042 0.084 0.117 0.138 0.160 0.185 0.211 0.240
( E - E d n +(at) mv. 0.008 - 5 0.019 10 0.041 15 0.087 20 0.124 25 0.146 -28.50 0.173 30 0.208 35 0.236 40 0.273 50
20 0.269 0.314 - 60 15 0.298 0.357 80 10 0.328 0.403 100
& x ( 4 +(at) 0.400 0.548 0.418 0.596 0.432 0.641 0.441 0.685 0.445 0.725 0.4463 0.7516 0.446 0.763 0.443 0.796 0.438 0.826 0.421 0.875 0.399 0.912 0.353 0.957 0.312 0 ,980
5 0.355 0.451 120 0.280 0.991 0 0.380 0.499 150 0.245 0.997
To calculate the current: (1) i = i(p1ane) + i(spherica1 correction).
1321 = n F A d X o C o * d & ( a t ) + nFADoCo*(l/r,)+(at) = 602 n3 '2A. \ /~X C o * [ d / , d a t ) + 0.160(.\/Do/ro.\//nv)d(at)l. amueres. . . I -. I . - , . . ,.,
Units for (3) are: A ; s q cm.; Do, sq. cm./sec.; v , volt/sec.; Co*, molei/liter; ro, cm.
current-time curves, it is useful to make all calculations with respect to at rather than t . This can be accomplished by a change in variable
i- = z/a (18)
and Equation 15 becomes
This integral equation can be made dimensionless (especially important if numerical methods are used) by the substitution
g(at) = c o * d*Doa x(at) (21) and the final form of the integral equation is:
The solution to Equation 22 provides values of at) as a function of at, for a given value of ye. From Equations 5b and 7, the values of at are related to the potential by
E = E" - (RT/nF) In y + (RT/nF) [In ye + In S,h(at)] (234
or
(E - Eidn = (RT/F) [In ye + In S,x(at) 1 (23b)
where Ell2 is the polarographic half wave potential
Ell2 = E" + (RT/nF) In ~ / D R / D o (24)
Thus, values of at) can be regarded as values of x[ (E - E l / ~ ) n ] , and will
ultimately furnish values of the current as a function of potential (Equations 14, 19, 21):
i = nF.4Co* Z / a z a x(at) (25)
The value8 of at) are independent of the actual value of ye selected, provided In ye is larger than perhaps 6, and a formal proof has been given by Reinmuth (56). This corresponds to the usual experimental procedure of selecting an initial potential anodic of the foot of the wave, and in effect re- duces the number of variables involved by one.
Numerical Solution. Although Equation 22 has been solved in several ways, only the numerical approaches appeared to be readily applicable to the cyclic experiment. The technique developed here involves dividing the range of integration from at = 0 to at = ill into N equally spaced subintervals by a change of variable,
z = 6v (26)
and the definition
n = at/6 (27)
Here, E is the length of the subinterval (6 = M/N\, and n is a serial number of the subinterval. Thus, Equation 23 becomes
dT s" x(6v) dv 1 - 0 dnyv 1 + yeSax(8n)
(28)
where n varies from 0 to M in N inte- gral steps. The point of singularity (n = Y) in the kernel in Equation 28 can be removed through an integration by Farts to obtain
The integra! on the right hand side of Equation 29 is a Riemann-Stieltjes integral, which can be replaced by its corresponding finite sum ( I ) . Eliminat- ing the special points i = 0 and i = n from the summation, one obtains
and substituting this result in Equation 28,
r
L
d n T [ x ( i + 1) - x(i)] = 1 n- 1
i = l
(31) 1
1 + v&&n) Equation 31 defines N algebraic equa-
tions in the unknown function x(n), where each nth equation involves the pre- vious n - 1 unknown.. . These equations are then solved wccessively for the values of x(atk-i.e., ~ ( 8 % ) . When 6n 6 6x, the function Sax(8n) is exp(-8n), and when the point in the calculations is reached where 8% > 6X, the function is replaced by exp (6% - 26x). In this way, single scan or cyclic current-potential curves can be cal- culated easily, and the extension to multicycles is obvious.
Analytical Solution. It is also pmsible to obtain an analytical solu- tion to Equation 2 2 . It is an Abel integral equation ( $ 8 ) , and the solution can be written directly a?
where L(at) represents the right hand side of Equation 22. Performing the differentiation indicated (using Equa- tion 11 as the boundary condition) the exact solution is
x(at) = + dz
1
a d a t ( 1 + ye)
(In - z , k d u G cosh2
(33)
Equation 33 has been given previously by Matsuda and Ayabe (25), and by
708 ANALYTICAL CHEMISTRY

Gokhshtein (13) . If it is assumed that ye is large, Equation 33 reduces to the reqult obtained by Sevcik (44) and by Reinmuth (35 ) , but such an assumption is not required in thif case. ,Ilthough the definite integral in Equation 33 cannot be evaluated in closed form, several numerical metiods (such as the Euler-RIaclaurin sumriation formula or Simpson'5 rule) can t e used, provided the singularity a t at = z is first removed by a change of variable (23) or an integration by parts (35).
If only the single scan method is considered, Equation 22 can be solved in series form, and although the resulting series does not properly convergr for all potentials, the form of the results obtained is very uqeful for comparison of the limiting cases obtained in the kinetic systems.
One possible appromh is to expand the right hand side of ]?quation 22 as an exponential power series in at, as done by Sevcik (44 ) . but this cannot be done for most cases involving coupled chemi- cal reactions. T h ~ s , Reinmuth's ap- proach (32, 33) is mori1 general, and the final result is
Series Solution.
Single Scan Meihod. I n every case, the solution of Equation 22 ultimately requires numerical evalua- tion which in the past has been carried out with varying accuracy. This hss led t o some unrertainty in the litcrature regarding the location of t h e peak potential with respect t o
the height of the peak, the significance of the ha f-peak potential, etc. For this reason, the calculations were carried out (using the numerical solution, Equation 31) 011 an THM 704 digital coniputer to obtain accurate values of at) as a function of potential (Table I). Since the hanging mercury drop electrode is fre(quent1y used in analytical work, there is also listed a function based oil Reirtmuth's equation (36), from which curreits at a spherical electrode can be calcuhted. The calcu- lations were made using a value of 6 = 0.01. with In ye = 6.5, and are accurate to =kO.OOl. 'The temperature was ascjumed to be 25" C., and values for some other tenq)erature can be obtained by multiplying the potential by the factor (273.16 -I- T)/298.16 (see Equation 23). The factor 4, was iiicluded in the tabulation for con- venience in making c3mparisons with prcvious n ork.
The reversible stationary electrode polarogram for a plaie electrode ex- hibits a maximum value of i,l(nFA 4% CO*) = 0.4463 at a potential
-0.4 I I I I I
120 0 420 -240 -360
Figure 2. Cyclic stationary electrode polarogram (Case I) Switching potentials correspond to ( €112 - EA)^ of 64, 105, and 141 mv. for anodic scans
28.50/n millivolts cathodic of Ell2,- Le., (Ep - E")% + (RT/F) In y =
or -28.50 h 0.05 mv. (35)
E, = E112 - (1.109 =k 0.002)(RT/nF) (36)
Actually, the peak of a reversible stationary electrode polarogram is fairly broad, extending over a range of several millivolts if va!ues of x(a t ) are determined to about 1%. Thus, i t is sometimes convenient to use the half-peak potential as a reference point (@), although this has no direct thermodynamic sigiiificance. The half- peak potential precedes Ell2 by 28.0/n mv., or
Ep/Z = E1/2 + 1.09(RT/nF) (37) The El,* value can be estimated from
a reversible stationary electrode polaro- gram from the fact that it occurs at a point 85.17% of the way up the wave.
Calculations based on Equation 33 and also Equation 34 (at least for potentials anodic of Ell2) agree exactly with those in Table I, and these data can be used to construct accurate theoretical stationary electrode polaro- grams.
Cyclic Triangular Wave Method. For the first cycle, the cathodic por- tion of t he polarogram is, of course, the same as described above for the single scan method. However, the height and position of t he anodic portion of the polarogram will depend on the switching potential, EA, being used.
Polarogrnms for various values of (EA - E l / J n were calculated from Equation 31, and, provided that the switching potential is not less than about 35/n my. past the cathodic peak, the curves all have the same relative shape. (For switching potentials close to the peak, the shape of the anodic curve is very dependent on the switching potential, but this is not a usual experi-
mental condition, and will not be con- sidercd further.) Typical cyclic polaro- grams are shown in Figure 2. By using for the base line the cathodic curve which would have been obtained if there had been no change in direction of potential scan, all of thc anodic curves are the same, independent of switching potential, and identical in height and shape to the cathodic wave. Thus, when the anodic peak height is measured to the extension of the cathodic curve, the ratio of anodic to cathodic peak currentq is unity, independent of the snitching potential. This behavior can be used as an important diagnoqtic criterion to demonstrate the absence (or unimportance) of the various coupled chemical reactions. Of those considered in this paper, only the catalytic case (which can easily be distinguished from the reversible case by other behavior) gives a constant value of unity for the ratio of anodic to cathodic peak height on varying the switching potential. Experimentally, the cathodic base line can be obtained by extending n single scan cathodic sweep beyond the selected switching potential, or if another reaction inter- feres, by stopping the wan a t some convenient potential past the peak, and recording the constant potential cur- rent-time curve (using appropriate cor- rections for charging current) The latter method of obtaining the base line has been propos4 for analytical purposes by Keinmuth (34) .
The pos;tion of the anodic a a v e on thc potential axis is a function of the switching pntential. especia!ly for qmall values of (Ex -Elj2)n. This results from the fact that on the cathodic scan, the surface concentration of substance R does not quite equal Co* a t potentials close to the peak, and if the anodic scan is started under these conditions, CR (0, t ) is slightly less than Co(O, t ) was at the corresponding potentials for the cathodic scan. This cawrs an anodic shift in the Jtavc. which decreases as the snitching potential iq made more c,zthodic. The behavior is summarized in Table 11.
The transition from the single cycle to the multicycle triangular wave method involves a gradual realignment of con- centration gradients at the same rela- tive potentials on successive cyclcs, which, in turn, causes a gradual change in the shape of both the anodic and cathodic curves. &Ifter about 50 cycles (44), further changes in shape are very slow, and essentially a steady state cyclic curve is obtained. Thc relations between the cathodic and anodic peak potentials, peak heights, and switching potentia!? for the steady state rase are given by Matsudn (22). Generally, unlesq R reacting system iq being studied, thew is little point in in- vestigating the intermediate cyclic scans
VOL. 36, NO. 4, APRIL 1 9 6 4 709

beyond the first and before the steady state is reached. Thus, although the individual curve3 for any number of cycles can be calculated from Equation 31, only the first few have been tabu- lated for an arbitrarily selected value of Ex (27) and copies of these da ta are available on request.
II. IRREVERSIBLE CHARGE TRANSFER
Boundary Value Problem. For the case of a totally irreversible reduction taking place at a plane electrode
(11)
the boundary value problem for stationary electrode polarography is similar to the reversible case arid Equa- tions l, 3, 4, and 5a are applicable, except the terms involving substance R are not used. However, Equation 5b is replaced I J ~
k O + n e + R
t > 0, x = 0 ; Do (%) = k CO (38)
Table II. Anodic Peak Potential as a Function of Switching Potential for
Reversible Charge Transfer (Case I ) (E1,* - Ei)n [E,(anodic) -
mv. E ~ l n mv. - 65 34.4 70 33.7 75 33.3 80 32.9
- 100 32.0 150 30.7 200 29.8 300 29.3
where
k = k, exp[(-aala,b'/RT)(E - E " ) ] (39)
and the other terms have their usual significance (6). In addition, only Equat,ion 6a is required to describe the potential variation, since there is no anodic current on the reverse scan. Thus, the last boundary condition can be written
bCo j f t ) = D o (z) = Cokiebt (40)
where k , = k, exp[(-an,F/RT)(E, - E " ) ]
(41)
b = an,Fv/RT (42)
Here k , is the rate constant a t the initial potential, and b is analogous to its counterpart a for the reversible case. Using exactly the same methods 5s above, this boundary value problem can be converted to a single integral equation, first given by Delahay (4)
= (eudt))x(bt) bt x(z)dz 1 - J - O d b t - z
(43)
where
e u = d/aL)ob/k, = (d /?rDob/k , ) x -
exp[(an,FIRT)(E, - E " ) ] (44)
For a particular value of u, the solu- tion to Equation 43 provides values of x(b t ) as a function of bt, which in turn are related to the potential bv
bt = (an,F/RT)(E, - E ) (45)
Table Ill. Current Functions &x(bf) for Irreversible Charge Transfer (Case II)
160 0.003 0 15 0.437 0.323 140 0.008 10 0,462 0.396 120 0.016 5 0.480 0.482 110 0.024 0 0.492 0.600 100 0.035 - 5 0.496 0.685 90 0.050 0 - 5.34 0.4958 0.694 80 0.073 0.004 10 0.493 0.755 70 0.104 0,010 15 0.488 0.823 60 0.145 0.021 20 0.472 0.895 50 0.199 0.042 25 0.457 0.952 40 0.264 0.083 - 30 0.441 0.992 _. 35 0.300 o.ii5 35 0.423 1.00 30 0.337 0.154 40 0.406 25 0.372 0.199 50 0 374 20 0.406 0.253 70 0.323
a The potential scale is (E - Eo)an. + (RTIF) In . \ / G / k s . The initial potential for any value of u can be obtained from ( E - Ei)ana = ( E - Eo)an. - (RT /F) (u - In
To calculate the current: (1) (2)
d G / k . ) . i = i(p1ane) + i(spherics1 correction)
= nFA .\/a CO* .\//?rx(bt) + nFADoCo* (l/ro) @(bt ) (3) = 602 n(an=)"'A.\/ /~~uCo*[.\ /rx(bt) +
0.160( .\/E~'ro.\/GZ)+(bt)] Units for (3) are same as Table I.
Provided u is greater than about 7 (which corresponds to selecting an initial potential anodic of the foot of the wave) the values of x(b t ) are independent of u ( 4 ) . With respect to the initia! potential, however, the entire wave shifts along the potential axis as a functioii of u. Experimentally, the initial potential is a convenient reference point, since E" is seldom known for a totally irreversible system, and data calculated for a particular value of u can be used for any initial potential by arbitrarily shifting the potential axis. For tabulation of data, however, it is mnre convenient, to define a potential axis which will be independent of an arbitrary function such as u, and this can he done by utilizing the relation
( E - Eo)an, + (RTIF) ln(d\/RDob/kJ =
(RT /F) (u - bt) (46)
Thus values of x(b t ) can be used to calculate the current
- i = 1~F-lCo* d/?rDob x(bt) (47)
as a funrtioii of the potential, which in turn iq defined by the left-hand qide of Equation 46. F:qiintion 43 is a Volterra integral equation of the second kind and was evaluated numerically by Delahay ( 4 ) and also by Matsuda and Ayabe (23). The numerical ap- proach described in this paper also is applicable. In addition, a series solution has been reported (32)
The series in Equatioii 48 is strictly applicable only for values of bt 3 4-i.e., potentials about 100 'an, iiiillivolts cathodic of the initial potential. This is not a qerious restriction, and the series is properly convergent m e r the entire range of interest. Although the series convergw very slon 1y near the peak of the wave, Equation 48 is probably the best nay to calculate the current. Since precise values of x(bt) have not been published previously, Equation 43 was evaluated using the numerical niethod, and in addition, values of x(bt1 were calculated from Equation 48. The results (Table 111) were identical and agreed ne11 with the less accurate data previously prescnted by Delahay ( 4 ) and Matsuda and Ayabe (23) . These values of ~ ( b t ) were cal- culated usinq 6 = 0.01, with u = 7.0, and are accurate to +0.001.
710 ANALYTICAL CHEMISTRY

Table IV. Boundary Value Problems for Stationary Electrode Polarography with Coupled Chemical Reactions
I Reaction
5 Tbo
III O + n e t R
Z 9 0 IX kb
k O + ne -R
Y R 2 Z
kb
R 9 Z
O + n s = R
i,cR alcR DR dx' --=
at
I~c,, a%, Equation 3 Equation 4 Equations Sa and 7 --=DRF at - kf Cn -
Same as Same as S a m as
(a) Equation 4 (a) Equation 3
S a m as
Equation 40
Q Sincme the charge transfer is totally irreversible, those equations involving substance R are not used. * Since the chemical reaction is irreversible, the equations involving substance Z are not used.
Experimental Correlations. The relation between tEe peak potential and the other expwimental param- eters can be derived "rom Table I11
(E, - E")an, + -- (RTIF) In 2 / r D o b l k , = -5.34 mv.
(49) which can be rearranged to obtain
E, = E" - (RT/an, ,F)(0.780 4- In 2 / z b - Ink,) (50)
This u as first derived by Delahay (4, 6) (but note typographi1:al error) and later by Matsuda and Ayabe (23). The half-peak potential also can be used as a reference point, and from Table 111
(Ep/* - €?")an, + ( I t T / F ) In l/?rDob/k, == 42.36 mv. (51)
Thus,
E, - E,iz = -l .85'7(RT/anaF) (52) From Equations 50 and 52, both the
peak potential arid the half-peak
potential are functions of the rate of potential scan
(Ep,2)2 - (Ep,2)1 = (E,)Z - (Ed1 =
( R T / ~ ~ , F ) In 2/v& (53)
and thus, for a totally irreversible wave, there is a cathodic shift in peak potential or half-peak potential of about 30/an, niillivolts for each ten-fold increase in the rate of potential scan.
An alternate form of Equation 50 also can be derived by combining Equations 40, 44, and 45 with the value of x(bt) a t the peak, to obtain
(Co),/Co* = x ( b t ) p X
(-an,F/RT)(E, - E" + RT an,F In 2 / x b / k , ) ] = 0.227 (54)
This result does not depend on the other experimental parameters (such as u ) and Equation 54 can be solved for the surface concentration of substance 0 at, the peak. This can be substituted
into the Egring equation for ft totally irreversible reaction (6) to obtain a result first derived by Gokhshtein (12) (with a slightly higher ccnstant) :
i, = 0.227 nFACo* k , X exp [(-an,F/RT)(E, - E " ) ] (55) Thuq. a plot of ln(i,) 21s. E, - E"
(or E,,? - E") for different scan rates would be a straight line with a slope proportiona! to ana, and an intercept proportional to k,. This appears to be an extremely convenient method of determining the kinetic parameters for thiq case, although the scan rate would have to be varied over several orilers of magnitude.
Still another approach to obtaining kinetic information from Gtationary electrode polarograms &as drscribed by Keinmuth (SO) who showed that for an irreversible reaction, the current floaing at the foot of the wave is independent of the rate of voltage scan. This same conclusion can be drawn by combining Equations 46 to 48, and considering the first few terms of the series
VOL. 36, NO. 4, APRIL 1964 71 1

i = nFACo* d r z b [ebt-" - Z/,ez(*'-'') + . . . ] (56)
The current will be independent of v [note definition of exp (u ) , Equation 441 when the second term is small com- pared to the first, or to the 501, error level, when & exp (6t - u ) < 0.05. This condition holds for values of -&x(bt) less than about 0.05, or about 10% of the peak value. Thus, the range of applicability of this useful criterion of irreversibility does not extend as high along the wave as implied by Reinmuth (SO). For those cases where the second term can be dropped, however, Equation 56 reduces to
i = nFACo*k, x exp [(-cm,F/RT)(E - EL)] (57)
and offers a simple way of obtaining kinetic data.
Spherical Electrodes. For an ir- reversible reaction taking place a t a spherical electrode, Reinniuth was able to derive a series solution which is convergent over the entire potential range of interest ($2). Unfortunately, it is not possible to separate the spherical correction term from the expression for the plane electrode as for the reversible systeni (Case I). Since the series converges very slowly a t potentials near the peak, making the use of a computer almost mandatory, an alternate means of expressing the spherical contribution to the current was sought. A large number of curves were calculated, and the spherical correction-Le., the dif-
ference between the current obtained at spherical and plane electrodes of the same area under identical conditions- was plotted as a function of the di- mensionless parameter l / D O / ( T O d b ) where ro is the radius of the electrode. The plot was linear (to better than 1%) for values of d&'(ro2/b-j less than 0.1. Since this includes all values which are of practical use, an irreversible spherical correction term, +(bt) was evaluated which can be used just as the analogous term for the reversible case. Thew values of $(6 t j are listed in Table 111, and values of the current calculated in thi3 way agree well with the considerably less conyenient data presented previously (8) .
COUPLED CHEMICAL REACTIONS
If a homogeneous chemical reaction is coupled to the charge transfer reaction, stationary electrode polarography pro- vides an extremely powerful method of investigating the kinetic parameters. Several of the important kinetic systems are discuqsed in this work, in- cluding those which involve first order (or pseudo first order) preceding, fol- lowing, or catalytic chemical reactions. Several other cases, including the chemical reaction coupled between two charge tranqfer reactions, have also been considered, and will be presented elsewhere.
For each of the kinetic cases, the boundary value problem was formulated in a manner similar to Case I or Case
I1 (depending on the nature of the charge transfer reaction) but modified to reflect the kinetic coniplication. These boundary value problems are presented in Tahle IV. In each case the rate constant is first order or pseudo first order-e.g., in Cases VI1 and VI11 i t was assumed that Cz >> Co, and the rate constant which was used In the cal- culations nas k , (= kf'Cz). Using the same procedure as outlined in Equations 12 through 22, each of these boundary value problems was converted to a rzinple integral equstion. Hot? ever, in all the kinetic cases except Case VI, at least one of the differential equations involved tJ+o concentration variables. Thuq, in order to simplify the problem, the usual changes in variable nere made (90) '
The integral equation obtained for each caqe is presented in Table T'. -411 terms in thme equations have been de- fined previously, except K , irhich is the equilibrium constant for the chemical reaction, and 1 which is the Bum of the rate constants ( k , + kb). Each of these integral equations nas then solved nunierically using the approach de- scribed in Equations 26 to 31. Only two different kernels are involved in all the integral equations, and once the procedures nere worked out for one rase, they could be extended readily to the other cases.
These numerical results (presented in the various tables) provided values of the current functions ut) or ~ ( b t ) which could be related to potential by Equations 23 and 24 for reversible
712 ANALYTICAL CHEMISTRY

charge transfers, and Equations 45 and 46 for irreversible charge transfers.
In each case, the inlegral equation was made dimensionless by the same sub- stitution (Equation 21), and as a result, the current a h ays can be calculated from the current fun( tion at) or ~ ( b t ) merely by inultiplication by the term nFACo* l/&a for reversible charge transfers, or by nPACo*l/=b for irreversible charge transfers, as in Equations 25 and 47. [Note that for the preceding zheniical reaction (Cases IT1 and IV), the stoichiometric concentration C* 2,ppears in these equations rather than the equilibrium concentration Co*.]
For the case? invollring an irreversible chemical reaction, no additional re- strictions-other than that of selecting an initial potential anodic of the foot of the wave-were introduced in the derivation. For the three cases in- volving revwsible cliemical reactions, however, (Cases 111, IV, and V) a simplifying assumption was made in order t o reduce the number of variables. In these cases, the integrals which arise corresponding to that in Equation 28 are of the form
for preceding chemical reactions, and
for succeeding chemicsl reactions. Here $ is l / a for reversible charge transfer and l / b for irreversible charge transfer.
With these integrals, the integration by parts (used to remove the point of singularity) produces terms of the form
( l / ; / ~ l / i 4 erf v ' ~ n - v )
( K V ' T / ~ F ) erf d m for a preceding cheinical reaction, and
for a succeeding chemical reaction. Although the numerical evaluation could have been carried out retaining all these terms, considerable simplifica- tion resulted in assuming that S$(n - v) 3 4 This assumption makes i t possible to consider the erf terms as unity, but exclude5 the cases involving small $ from the numrrical data-Le., cases where the chemical reaction has no effect on the charge transfer.
These restrictions, once noted, are rrlatively unimportant and will be dis- cussed in connection with the individual cases. The simplification which results, however, is extremely important. I n some previous treatments (41) involv- ing reversible chemical reactions, it has been necessary to select a specific value of the equilibrium constant in order to calculate a set of data for a range of rate constants. In this case. for example, a table comparable to Table VI1 nould be required for each value of K likely to be of interest. Honever, the simplifica- tion discussed abore makes it possible for the effect of the equilibrium con- stant on the shape of the polarograms to be separated from its effect on the location of the curve on the potential axis This can be seen in Equations 58 and GO where the effect 011 the potential can be handled by defining a new
potential axis in terms of ( E - Eli2)n - (RT/F) In K / ( l + K ) for Case I11 and ( E - El& - ( R T / F ) In (1 + K ) for Case V. For Case IV (Eauation 59) the new potential axis is heined in
- E") (Y na + (RT /F) In - ( I i T / F ) In K l ( 1 + K ) .
The effect of K on the shape of the polarograms is included in the numerical data. This approach places no re- strictions on the value of the equilihrium constant, and the only exception to the applicability of the numericai data is that stated above: the sum of the rate constants cannot be sniail compared to a.
ThP valurs of at) and x(bQ were calculated using 6 = 0.02. and are ac- curate to fO.000, -0.002-i.c., if any error is present, the values tend to be slightly low. The use of a larger value of 6 also introducrs a small error in the potential, and for each case where the kinetic cabe reduces to Case I , the waves are shifted cathodic by a few tenths of a millivolt in coniparison to Table I.
X series solution also ma. obtained for each kinetic case (Table VI). As noted previously> only in those cases involving irreversible charge transfer was i t pos,sible to obtain series solutions which converged properly over the entire potentia! range of interest. However, even when iinsuitable for calculation of theoretical current voltage curves, the series solutions were extremcly useful in correlation of the experimental and kinetic parameters. This was par- ticu!arly true in those cases in which the serics was of the same type as obtained for Cases I or TI, since then thc form of the solution w.as known. and correlations
m
IY
v
Y l
m
m
VOL. 36, NO. 4, APRIL 1964 713

Reversible Charge Tronsfer (Case 111) Poten- . \ / i /Kl /d
tiala 0 .2 0 . 5 1 .o 1 . 5 3.0 6.0 10.0
Table VII. Current Functions d?rx(at) for a Chemical Reaction Preceding a
-
120 0,009 100 0,019 80 0.041 60 0.081 50 0.113 45 0.132 40 0.152 35 0.174 30 0.199 25 0.224 20 0.249 15 0.275 10 0.301 5 0.324 0 0.345
-5 0.364 10 0.379 15 0.391 20 0.399 25 0.404
- 30 0.406 35 0,405 40 0,402 45 0.397 50 0.390
- 60 0.373 80 0.337
100 0.301 120 0,273 140 0.250
0.009 0,019 0.040 0.080 0.108 0.125 0.144 0.164 0.184 0,206 0.228 0.249 0.270 0.289 0.307 0.321 0,334 0.344 0.351 0.355 0.358 0.358 0.357 0.353 0.349 0.338 0.310 0.284 0.260 0.240
0,009 0.019 0,039 0.075 0.100 0.116 0.131 0.149 0.164 0.183 0.199 0.216 0.232 0.246 0.259 0.271 0.280 0 238 0,293 0,297 0.299 0.300 0.300 0.298 0.296 0.289 0.272 0.253 0.236 0.222
0,009 0,019 0.038 0.072 0.094 0.108 0.121 0.135 0.150 0.164 0.178 0.191 0.204 0.215 0.225 0,234 0.241 0,247 0.252 0.255 0.257 0.258 0.258 0.258 0.256 0.252 0.240 0.227 0.214 0.203
Ep,2, mv. $29.3 31.3 34.4 37.5
0,009 0,018 0.035 0.063 0.080 0.089 0.099 0.109 0.118 0.127 0.136 0.144 0.151 0.158 0.163 0.168 0.173 0.176 0.179 0.181 0.182 0.183 0.183 0.183 0.183 0.181 0.176 0.170 0.164 0.158
44.2 a Potential scale is (E - Elin)n - ( R T / F ) In K/(1 + K ) .
0,009 0,017 0.031 0.051 0.062 0.068 0,074 0.079 0.084 0.089 0.093 0.098 0.101 0.104 0.107 0.109 0.111 0.113 0.114 0.115 0.116 0.116 0.117 0.117 0.117 0.116 0.115 0.113 0.110 0.108
53.4
0.008 0.015 0.027 0,041 0.049 0.052 0.055 0.059 0.062 0.064 0.067 0,069 0.071 0,072 0,074 0.075 0,076 0.077 0,077 0.078 0.078 0.079 0,079 0.079 0.079 0,079 0.078 0.077 0,076 0,075
62.2
between the potential and kinetic parameters could be obtained from the exponential terms.
111. CHEMICAL REACTION PRECEDING A REVERSIBLE CHARGE TRANSFER
A large group of coupled chemical re- actions iiivolves cases in which the electroactive species is produced by a homogeneous first-order chemical re- action preceding a reversible charge transfer
Only the case in which the chemical reaction is reversible is relevant; how- ever, there are no restrictions on possible values of the equilibrium constant.
This case has been discussed (for the single scan method only) by Saveant and Vianello (58 41), and in addition, a series solution has been presented (46).
Qualitatively, the effect of a preceding chemical reaction on the cathodic scan depends on several factors, and three distinct limiting cases can be recognized. First, if l /a is very small. the experi- ment is over before significant con- version of 2 to 0 can take place. Under such circumstances, the curve obtained is the same shape as Case I, appears at the normal potential for the uncompli- cated reduction of 0 to R, but the
magnitude of the current is proportional to the equilibrium concentration of substance 0 in the bulk of the solution, rather than it.: stoichiometric con- centration C*. This result can be obtained from Equation 64, which, if l / a is small, reduces to x(at) =
This series is the same as Equation 34 for the reversible case, except for the factor K / ( K + 1). If K is large (equilibrium favoring 0) a normal stationary electrode polarogram is ob- tained. On the other hand, if K is small, the current is determined by the equilibrium concentration Co* = [ K / ( K + I ) ] C*. This is the one correlation which was not obtained from the numerical solution, hecause of the simplifying assumption (that l /a is not very small) which was made in the derivation. This rcstriction is not particularly serious, however, because the option of varying the rate of potential scan lends great versatility to the mpthod. For example, if low values of l / a are encountered experimentally, and reasonable values of 1 are involved, one could merely reduce the rate of voltage scan to a region where the numerical data are applicable. On the
0.4
- 0.2 c Y 0 x 5 0.0
-0.2
120 60 0 -60
POTENTIAL, mv Figure 3. Cyclic stationary electrode poiarograms (Case 111) Potential scale i s ( E - El& - (RT/F)ln K/(1 + K )
other hand, if 1 is low and a has already been reduced to the lower practical limit, Equation 70 could be used directly to calcu!ate the theoretical current potential curve. The converse ap- proach, of using large enough rates of voltage scan to ensure that this condi- tion holds, has been used by Papoff t o determine equilibrium constants (28).
The two other limiting cases can be obtained from Equation 64 by as- suming first that l /a is large, so that l l a + i = 1 / a , and then con- sidering either large or small values of V’~/KV’~ rf <a/Kdf is small, Equation 64 reduces to
1)’+1 x 1 ” x(a0 = 7; (-
j=1
d F e x p [ (- jnF/RT)
gin nF l + K L)] (71)
which is the same as Equation 34 for the reversible case, except that the wave appears a t a potential determined by the equilibrium constant. At the other limit, for large values of ~~QK-V’K Equation 64 reduces to x(at) =
This series does not correspond to one bf the previously encountered cases, and i t cannot be characterized merely by inspection. Nevertheless the appear- ance of the term 1 / d a in each
714 0 ANALYTICAL CHEMISTRY
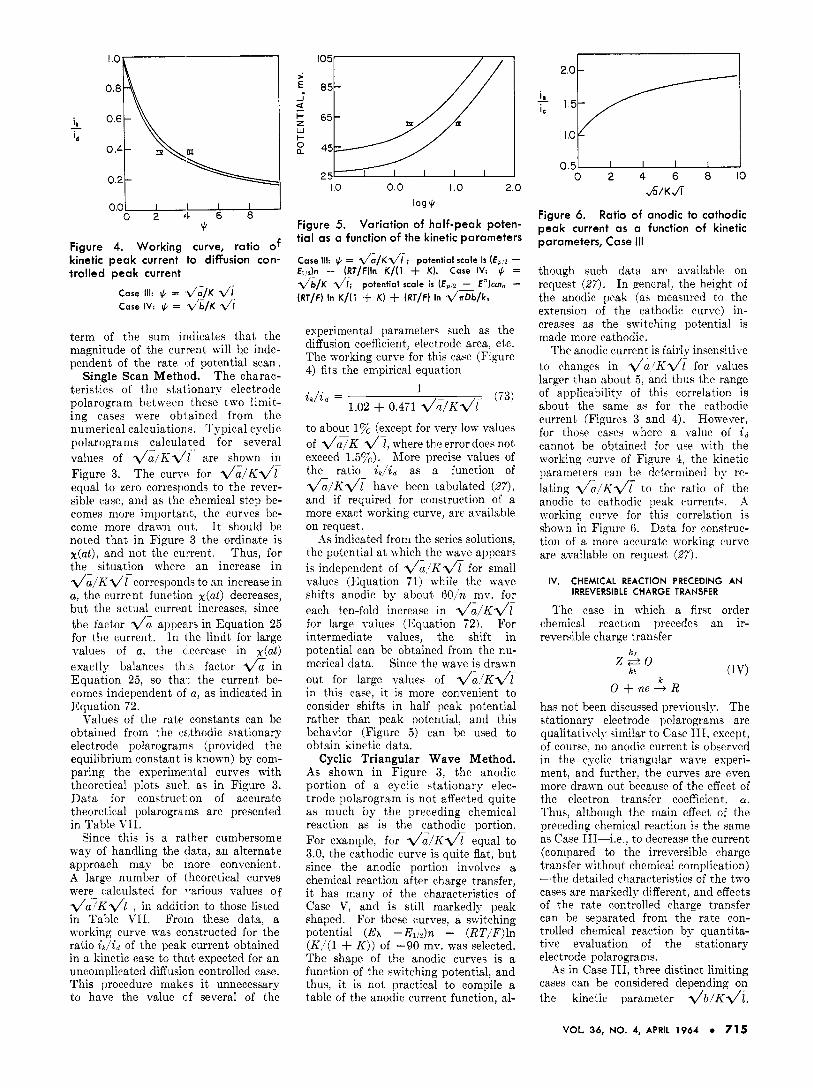
Figure 4. Working curve, ratio of kinetic peak current to diffusion con- trolled peak current
Case 111: $ = .d/a/~ di Case IV: + = d/b/~ v‘I
term of the sun: indicates that the magnitude of the current will be inde- pendent of the rate of potential scan.
Single Scan Method. The charac- teristics of the stationary electrode polarogram between these two liniit- ing cases were obtained from the numerical calculations. Typical cyclic polarograms calculated for several values of & / K d i are shown in Figure 3. The curve for d i / K d i equal to zero corresponds to the rever- sible case, and as the chemical step be- comes more importark, the curves be- come more drawn out. I t should be noted that in Figure 3 the ordinate is at), and not the cuprent. Thus, for the situation where an increase in l / a / K d i c o r r c s p o n d s to an increase in a, the current function ut) decreases, but the actual current increases, since the factor l/a appears in Equation 25 for the current. I n the limit for large valueh of a, the decrease in at) exactly balances th s factor 6 in Equation 25, so that the current be- comes independent of a, as indicated in Equation 72.
Values of the rate constants can be obtained from the cathodic stationary electrode polarogramq (provided the equilibrium constant is known) by com- paring the experimental curves with theoretical plots such as in Figure 3. Data for construct ion of accurate theoretical polarograms are presented in Table YII ,
Since this is a rather cumbersome way of handling the data, an alternate approach may be more convenient. A large number of theoretical curves were calculated for mrious values of d a T K d t , in addition to those listed in Table VII. From these data, a working curve was constructed for the ratio &/id of the peak current obtained in a kinetic case to that expected for an uncomplicated diffusion controlled case. This procedure makes it unnecessary to have the value cf several of the
> E i 5 + Z w i- 0 a
1.0 0.0 I .o 2.0 log VJ
Figure 5. Variation of half-peak poten- tial as a function of the kinetic parameters
Case 111: $ = do/Kd/j; potential scale is ( E p / * - El,$)n - (RT/F)ln K / ( 1 + K). Case IV: $ = ~ L / K di; potential scale is ED)an, - (RT/F) In K / ( 1 4- K) f (RT/F) In d / r D b / k ,
experimental parameters such as the diffusion coefficient, electrode area. etc. The working curve for this case (Figure 4) fits the empirical equation
&/id = (73) 1
1.02 + 0.471 d a / K l / t - to about I % (except for very low values of d J K dj, where the error does not exceed 1.5Yc). More precise values of the ratio &,/id as a function of & l K d ? have been tabulated (27) , and if required for construction of a more exact working curve, arc available on request.
As indicated from the series solutions, the potential a t L5hich the wave appears is indepmdent of l / a I K f l for sinall values (Equation 71) while the wave shifts anodic by about 6Q/n niv. for each ten-fold increase in - & / K d f for large values (Equation 72). For intermediate values, the shift in potential can be obtained from the nu- merical data. Since the wave is drawn out for large values of < a / ~ . \ / t in this case, i t is more convenient to consider shifts in half peak potential rather than peak potential, and this behavior (Figure 5) can he used to obtain kinetic data.
Cyclic Triangular Wave Method. As shown in Figure 3, the anodic portion of a cyclic stationary elec- trode polarogram is not affected quite as much by the preceding chemical reaction as is the cathodic portion. For example, for d a / K l / t equal to 3.0, the cathodic curve is quite flat, but since the anodic portion involves a chemical reactioyi after charge transfer, i t has many of the characteristics of Case V, and is still markedly peak shaped. For these curves, a snitching potential (Ex -Elil)n - (RT,’F)ln (K!(1 + K ) ) of -90 mv. was selected. The shape of the anodic curves is a function of the switching potential, and thus, i t is not practical to compile a table of the anodic current function, al-
0 2 4 6 8 IO &KJi
Figure 6. Ratio of anodic to cathodic peak current as a function of kinetic parameters, Case 111
though such data are availnhle on request (27) . In general, the height of the anodic peak (as measured to the extension of the cathodic curve) in- creases as the switchinq potential is made more cathodic.
The anodic current is fairly insensitive to chanqes in d a f K d i for values larger than about d , and thus the range of applicability of this correlation is about the same as for the cathodic current (Figures 3 and 4). However, for those cases where a value of id cannot be obtained for use with the workinq curve of Figure 4, the kinetic parameters can be determined by re- lating d ; , / K d r to the ratio of the anodic to cathodic peak currents. A workinq curve for this correlation is shomn in Figure 6. Data for construc- tion of a more accurate working curve are available on request (27) .
IV. CHEMICAL REACTION PRECEDING AN IRREVERSIBLE CHARGE TRANSFER
The case in which a fir<t order chemical reaction precedes an ir- reversible charge transfer
has not been discussed previoiisly. The stationary electrode polarograms are qualitatively similar to Case 111, except, of course, no anodic current is oberved in the cyclic triangu!ar Tvavp experi- ment, and further, the curves are w e n more drawn out because of the effect of the electron transfer coefficient. CY.
Thus, although the main effect of the preceding chemical reaction is the same as Case 111-i.e , to decrease the current (conipared to the irreversible charge transfer without chemical complication) -the detailed characteristics of the two cases are markedly different, and effects of the rate controlled charge transfer can be separated from the rate con- trolled chemical reaction by quantita- tive evaluation of the stationary electrode polarogram>.
As in Case 111, three distinct limiting cases can be considered depending on the kinetic parameter d b / K d i .
VOL. 36, NO. 4, APRIL 1964 715
First, if l / b is small, the curve is the same shape as Case 11, its potential is unaffected by the kinetic complication, and the magnitude of the current is a function of the equilibrium concentration of substance 0. Thus, for small values of l!b, Equation 65 reduces to x(b t ) =
which is the same as Equation 48 for the uncomplicated irreversible case except for the factor K/(1 + K ) . As in Case 111, this is the correlation which is not included in the numerical data because of the simplifying assumptions made.
The two other limiting cases are ob- tained by assuming first that l l b is large, and then considering the series for both small and large values of db/~Z/i If db/~ d i i s small, Equation 65 reduces to
x(bt) =
e x p [ - J & ( E - E o + cm,F
RT -\/ai In - - an,F ks
__ In ">1 (75) an,F 1 + K RT
which is the same as Equation 48 for the irreversible case, except that the potential at which the wave appears has been shifted by the equilibrium con- stant.
At the other limit, for large values of f i / K Z / I , Equation 65 reduces to
i m
exp [- 1%: ( E - EO t
+ RT d x b RT K -In - - ~ l n - an,F k s an,F 1 + K
Z F RT I n Kd,b)] 7 (76)
.4t this limit, a peak is no longer ob- served, and both the potential of the wave and niaqnitude of the current are independent of b. In addition, Equation 76 can be written in a closed form valid for large values of -\/ilk' 1/1
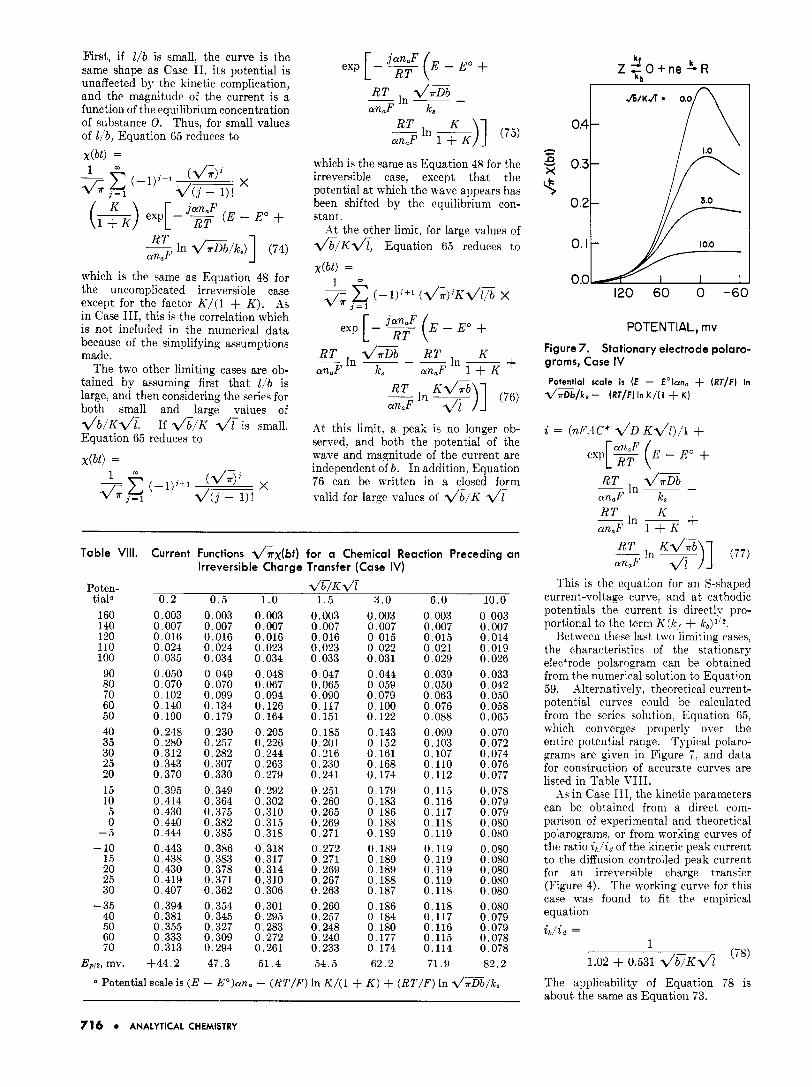
Table VIII. Current Functions d?rx (b t ) for a Chemical Reaction Preceding an Irreversible Charge Transfer (Case IV)
Poten- d / b l K d i tiale 0 . 2 0 . 5 1 .o 1 .5 3.0 6 .0 10.0 160 0.003 140 0.007 120 0.016 110 0.024 100 0.035 90 0.050 80 0.070 70 0.102 60 0.140 50 0.190 40 0.248 35 0.280 30 0.312 25 0.343 20 0.370 15 0.395 10 0.414 5 0.430 0 0.440
-5 0.444 - 10 0.443 ~. . . ~~-
15 0.438 20 0.430 25 0.419 30 0.407
- 35 0.394 40 0.381 50 0.355 60 0.333 70 0.313 mv. +44.2
0.003 0.007 0.016 0.024 0.034 0.049 0.070 0,099 0.134 0.179 0.230 0.257 0.282 0.307 0.330 0.349 0.364 0.375 0.382 0.385 0.386 0.383 0.378 0,371 0.362 0,354 0.345 0.327 0.309 0.294 47.3
0.003 0.007 0.016 0.023 0.034 0.048 0.067 0,094 0.126 0.164 0.205 0.226 0.244 0.263 0.279 0.292 0.302 0.310 0.315 0.318 0.318 0.317 0.314 0.310 0.306 0.301 0.295 0.283 0.272 0.261 51.4
0.003 0.007 0.016 0.023 0.033 0.047 0.065 0.090 0.117 0.151 0.185 0.201 0,216 0.230 0.241 0.251 0.260 0.265 0.269 0.271 0.272 0.271 0.269 0.267 0.263 0.260 0,257 0.248 0.240 0.233 54.5
0.003 0.007 0.015 0.022 0.031 0.044 0.059 0.079 0.100 0.122 0.143 0.152 0.161 0.168 0.174 0.179 0.183 0.186 0.188 0.189 0.189 0.189 0.189 0.188 0.187 0.186 0.184 0.180 0.177 0.174 62.2
0.003 0.007 0.015 0.021 0,029 0.039 0,050 0.063 0,076 0.088 0,099 0.103 0.107 0.110 0.112 0.115 0.116 0.117 0.118 0.119 0.119 0.119 0.119 0.119 0.118 0.118 0.117 0.116 0.115 0.114 71.9
0.003 0.007 0.014 0.019 0.026 0.033 0.042 0.050 0.058 0.065 0.070 0.072 0.074 0.076 0.077 0.078 0.079 0.079 0.080 0.080 0.080 0.080 0.080 0.080 0.080 0.080 0,079 0.079 0.078 0.078 82.2
5 Potential scale is (E - Eo)ana - (RT /F) In K/(1 + K ) + (RTIF) In d * D b / k ,
A
Yj Y
X
S
120 60 0 -60
POTENTIAL, rnv Figure 7. Stationary electrode polaro- grams, Case IV
d / a D b / k 8 - ( R T / F ) In K/(1 + K ) Potential scale is (E - E o ) a n , + ( R T / F ) In
+ ~ In ~
RT an$ 1 + K
K
This is the equation for an S-shaped current-voltage curve, and a t cathodic potentials the current is directly pro- portional to the term K ( k , + kb)l /* .
Between these last two limiting cases, the characteristics of the stationary electrode polarogram can be obtained from the numerical solution to Equation 59. Alternatively, theoretical current- potential curves could be calculated from the series solution, Equation 65, which converges properly over the entire potential range. Typical polaro- grams are given in Figure 7 , and data for construction of accurate curves are listed in Table VLII.
; is in Case 111, the kinetic parameters can be obtained from a direct com- parison of experimental and theoretical polarograms, or from working curves of the ratio &/id of the kinetic peak current to the diffusion controlled peak current for an irreversible charge tranqfer (Figure 4). The working curve for this case was found to fit the empirical equation i k / i d =
1 1.02 + 0.531 d b / K d (78)
The applicability of Equation 78 is about the same as Equation 73.
716 ANALYTICAL CHEMISTRY
POTENTIAL,mv
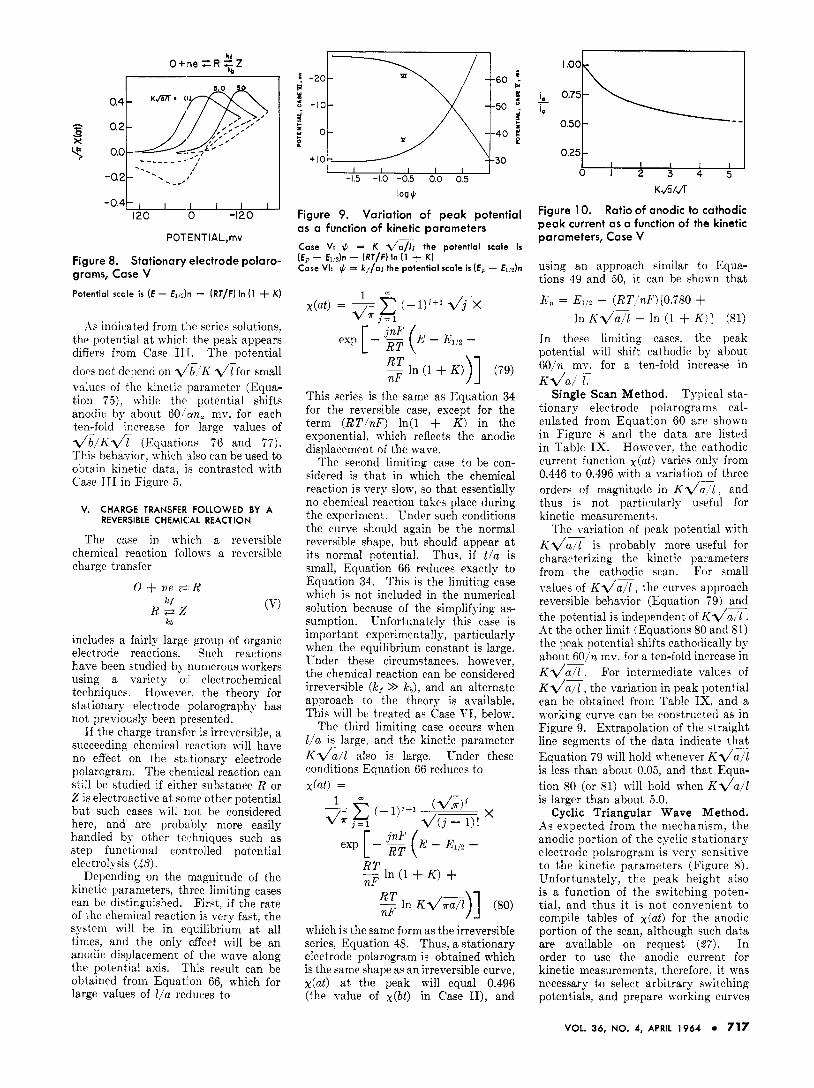
Figure 8. Stationary electrode polaro- grams, Case V Potential scale is [ E - €1,2)n - (RT/F) In (1 + K )
As indicated from t i e series solutions, the potential a t whicl- the peak appears differs from Case II[. The potential does not depend on v'b-'K l / t for small value4 of the kinetic parameter (Equa- tion 7 5 ) , while the potential shifts anodic hy about 60/an, mv. for each ten-fold increase foi. large values of Z / b l K l / i (Equations 76 and 7 7 ) . This behavior, which also can be used to obtain kinetic data, is contrasted with Cabe IT1 in Figure 5 .
V. CHARGE TRANSFER FOLLOWED BY A REVERSIBLE CHEMICAL REACTION
The caw in which a reversible chemical reaction follo~vs a reversible chargc transfer
O + n e i = R k f
R * Z (V)
includes a fairly large group of organic electrode reactions. Such reactions have been studied by numerous workers using a variety 01' electrochemical techniques. Hov ever, the theory for stationary electrode polarography has not previously bem presented.
If the charge transfi>r is irreversible, a succeeding chemical reaction will have no effect on the stationary electrode polarogram. The chemical reaction can still be studied if either substance R or 2 is electroactive at ,some other potential but such cases nil1 riot he considered here, and are prob:Lbly more easily handled by other tezhniqucs such as step functional controlled potential
Depending on the magnitude of the kinetic parameters, three limiting cases can be distinguished. First, if the rate of the chemical reacticln iLc very fast, the system will be in clquilibrium at all tinies, and the only effect will be an anodic displacement clf the wave along the potential axis. This result can be obtained from Equat on 66, which for large values of l /u reduces to
kb
-60 i I Y
- --50 3 : 0 - --40 E P
+ I O - -30
2
c < c -
I \ / I I 5 -10 2
c c
: o -40 E P
+ IO 30
Y
I I I I I I I -1.5 -1.0 -0.5 0.0 0.5
log 9
Figure 9. Variation of peak potential as a function of kinetic parameters Case V: IC. = K da; the potential scale is ( E p - E l i h - (RT/F) In ( 1 -I- K) Case VI: $ = k//a; the potential scale i s ( E p - E1,z)n
This series is the same as Equation 34 for the reversible case, except for the term (RTlnF) ln(1 + K ) in the exponential, which reflects the anodic displacement of the wave.
The second limiting case to be con- sidered is that in which the chemical reaction is very slow, so that essentially no chemical reaction takes place during the experiment. Under such conditions the curve should again be the normal reversible shape, but should appear at its normal potential. Thuq. if Zln is small, Equation 66 reduces exactly to Equation 31. This is the limiting case which is not included in the numerical solution because of the simplifying as- sumption. 'Cnfortunately this case is important experimentally, particularly when the equilibrium constant is large. Under these circumstances. however, the chenical reaction can be considered irreverqible ( k , >> k6), and an alternate approach to the theory is available. This \\-ill bc treated as Case VI, below.
The third limiting case occurs when Zla is large, and the kinetic parameter K d a also is large. Under these conditions Equation 66 reduces to x(nt) =
nP In K. / - /1 ) ] (80)
which is the same form as the irreversible series, Equation 48. Thus, a stationary electrode polarogram is obtained which is the same shape as an irreversible curve, x(at) a t the peak will equal 0.496 (thp value of ~ ( b t ) in Case 11), and
0.25L 0 1 2 3 4 5
K.h/Ji
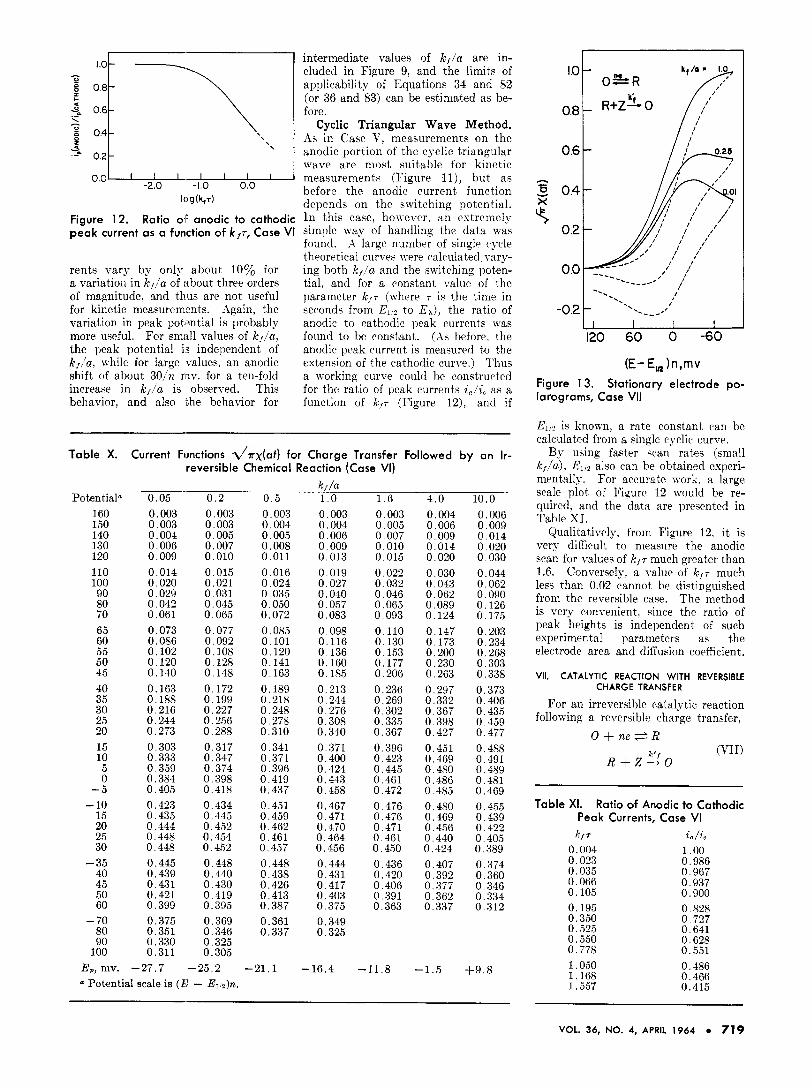
Figure 10. Ratio of anodic to cathodic peak current as a function of the kinetic parameters, Case V
usinq an approach similar to Equa- tions 49 and 50, it can be shown that
E,, = EllL - (RT/nF)[O.'i80 + In K Z / P l - In (1 + K ) ] (81)
In these limiting cases, the peak potential v ill shift cathodic by about 6O/n mv. for a ten-fold increase in K d a l r
Single Scan Method. Typical sta- tionary electrode polarograms cal- culated from Equation 60 arc shown in Figure 8 and the da t a arc listed in Table IX. Honever, thc cathodic current function at) varies only from 0.446 to 0.496 with a variation of three orders of magnitude in K l / P l , and thus iq not particularly useful for kinetic nieasuremeriti.
ith K l / a T is probably more useful for characterizing the kinetic pal ameters from the cathodic scan. For small d u e s of K l / Z , the curves approach reversible behavior (Equation i9) and the potential is independent of K d a T . At the other limit (Equations 80 and 81) the peak potential shifts cathotlically by about AOjn mv. for a ten-fold increase in K d a x . For intermediate values of K l / n / l , the variation in peak potential can be obtained from Table IX. and a morking curve can be constructed as in Figure 9. Extrapolation of the ctraight line segments of the data indicate that Equation 79 will hold n henever KZ/a/2 is less than about 0.05, and that Equa- tion SO (or 81) will hold when Kda is larger than about 5.0,
Cyclic Triangular Wave Method. As expected from the nmhanisn i , the anodic portion of the cyclic stationary electrode polarogram is very sensitive to the kinetic parameters (Figure 8). Unfortunately, the peak height also is a function of the switching poten- tial, and thus i t is not convenient to compile tables of x(at) for the anodic portion of the scan, although such data are available on request (27 ) . I n order to use the anodic current for kinetic measurements, therefor?. it was necessary to select arbitrary switching potentials, and prepare working curves
The variation of peak potential
VOL. 36, NO. 4, APRIL 1 9 6 4 717
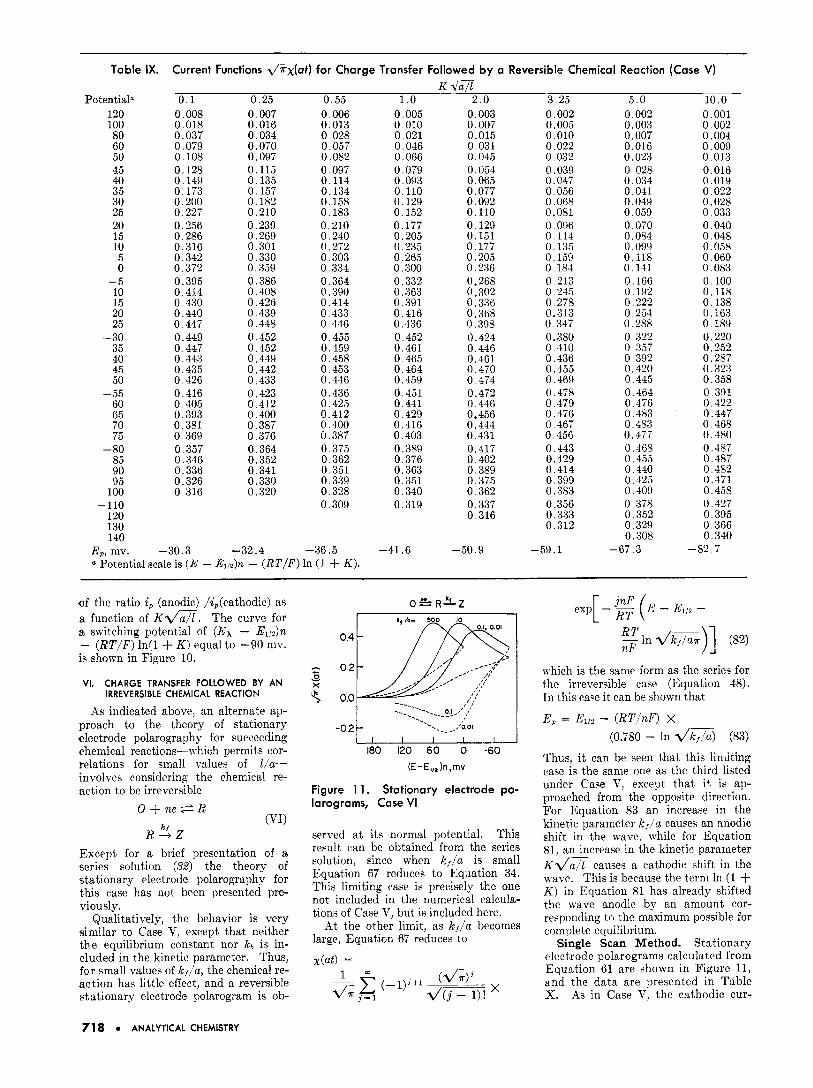
Table IX. Current Functions d/rrx(at) for Charge Transfer Followed by a Reversible Chemical Reaction (Case V) K d a 7
Potentiala 0 . 1 0.25 0.55 1 . o 2 .0 3.25 5 .0 10.0 120 100 80 60 50 45 40 35 30 25 20 15 10 5 0
-5 10 15 20 25
- 30 35 40 45 50
- 55 60 65 i o 75
- 80 85 90 95
100 -110
120 130 140
E,, mv.
0.008 0.018 0.037 0,079 0.108 0.128 0.149 0.173 0.200 0.227 0.256 0.286 0.316 0.342 0.372 0.395 0.414 0.430 0.440 0.447 0.449 0.447 0.443 0.435 0.426 0.416 0.405 0.393 0.381 0.369 0.357 0.346 0.336 0.326 0.316
,30.3
0.007 0.016 0.034 0,070 0.097 0.115 0.135 0,157 0.182 0.210 0.239 0.269 0.301 0.330 0.359 0.386 0.408 0.426 0.439 0.448 0.452 0.452 0.449 0.442 0,433 0.423 0.412 0.400 0,387 0,376 0.364 0.352 0.341 0.330 0.320
0.006 0.013 0,028 0.057 0.082 0.097 0.114 0.134 0.158 0.183 0.210 0.240 0,272 0.303 0.334 0,364 0.390 0.414 0.433 0.446 0.455 0.459 0.458 0.453 0.446 0.436 0.425 0.412 0.400 0.387 0,375 0.362 0.351 0.339 0.328 0.309
-32.4 -36.5 Potential scale is ( E - ~ , , ~ ) n - ( R T / F ) In (1 + K ) .
0.005 0 010 0 021 0.046 0.066 0.079 0.093 0,110 0.129 0.152 0 177 0,205 0.235 0.265 0,300 0.332 0 363 0.391 0.416 0.436 0.452 0.461 0.465 0.464 0.459 0.451 0.441 0.429 0.416 0.403 0.389 0.376 0.363 0.351 0.340 0.319
.41.6
0.003 0,007 0.015 0.031 0,045 0,054 0.065 0,077 0.092 0.110 0.129 0.151 0,177 0.205 0.236 0.268 0.302 0.336 0.368 0.398 0.424 0,446 0.461 0,470 0.474 0.472 0.446 0.456 0.444 0.431 0,417 0.402 0.389 0.375 0.362 0.337 0.316
-50.9
0.002 0.005 0,010 0,022 0.032 0.039 0.047 0.056 0.068 0.081 0.096 0.114 0.135 0,159 0.184 0.213 0,245 0 ,278 0.313 0.347 0.380 0.410 0.436 0.455 0.469 0.478 0.479 0,476 0,467 0.456 0,443 0.429 0.414 0,399 0.383 0.356 0.333 0.312
-59.1 -
0.002 0.003 0.007 0.016 0.023 0,028 0.034 0.041 0.049 0.059 0,070 0.084 0.099 0.118 0.141 0.166 0.192 0,222 0.254 0.288 0.322 0,357 0.392 0,420 0,445 0.464 0.476 0.483 0.483 0.477 0,468 0.455 0.440 0.425 0,409 0,378 0.352 0.329 0.308
-67.3 -
0.001 0 002 0.004 0.009 0.013 0.016 0.019 0.022 0.028 0.033 0,040 0.048 0.058 0.069 0.083 0.100 0.118 0.138 0.163 0.189 0.220 0.252 0,287 0.323 0.358 0,391 0.422 0.447 0.468 0.480 0.487 0.487 0.482 0.471 0.458 0.427 0.395 0,366 0.340
.82.7
of the ratio i, (anodic) /i,(cathodic) a3 a function of K d Z . The curve for a switching potential of (Ex - El& - (RT/F) In(l + K ) equal to -90 mv. is shown in Figure 10.
VI. CHARGE TRANSFER FOLLOWED BY AN IRREVERSIBLE CHEMICAL REACTION
As indicated above, an alternate ap- proach to the theory of stationary electrode polarography for succeeding chemical reactions-which permits cor- relations for small values of l/a- involves considering the chemical re- action to be irreversible
Except for a brief presentation of a series solution (Sd) the theory of stationary electrode polarography for this casc has not bren presented pre- viously.
Qualitatively, the behavior is very similar to Case V. except that neither t he equilibrium constant nor kb is in- cluded in the kinetic parameter. Thus, for small values of k,/a, the chemical re- action has little effect, and a reversible stationary electrode polarogram is ob-
-0.2 . .\___,, '0.01
1 I I I I 180 120 60 0 -60
(E- E,,, h ,mv
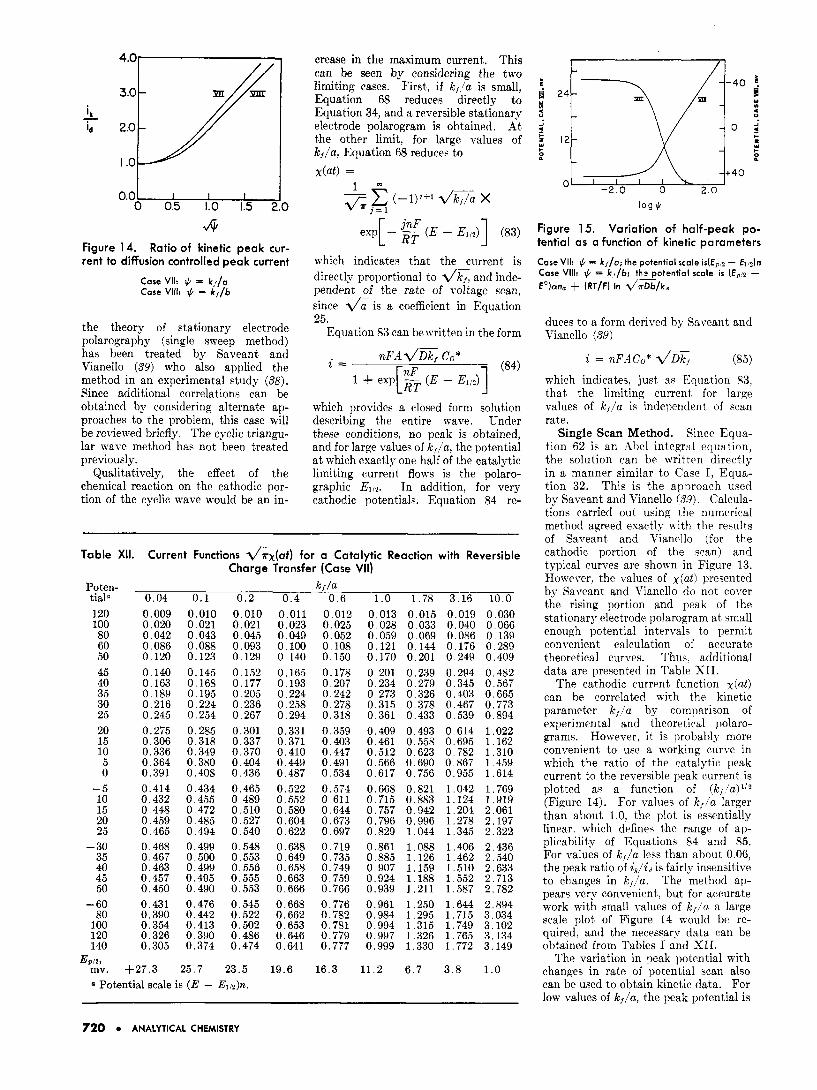
Figure 1 1 . Stationary electrode po- larogram, Case VI
served a t its normal potential. This result can be obtained from the series solution, since when k,/a is small Equation 67 reduces to Equation 34. This limiting case is precisely the one not included in the numerical calcula- tions of Case V, but is included here.
At the other limit, as k,/a becomes large, Equation 67 reduces to
x ( 4 =
c l n nF dm)] (82)
which is the same form as the series for the irreversible case (Equation 38). In this case it can be shown that
E, = Ell2 - (RT/nF) X (0.780 - In dm) (83)
Thus, i t can be seen that this limiting case is the same one as the third listed under Case V, except that i t is .ap- proached from the opposite direction. For Equation 83 an increase in the kinetic parameter k f / a causes an anodic shift in the wavc. while for Equation 81, an increase in the kinetic parameter K d a Z causes a cathodic shift in the wave. This is because the tern1 In (I -I- K ) in Equation 81 has already shifted the wave anodic by an amount cor- responding to the maximum possible for complete equilibrium.
Single Scan Method. Stationary electrode polarograms calculated from Equation 61 are shown in Figure 11, and the data are presented in Table X. 4 s in Case V. the cathodic cur-
718 * ANALYTICAL CHEMISTRY
intermediate values of k,/a are in- cluded in Figure 9, and the limits of applicability of Equations 34 and 82 (or 36 and 83) can be estimated as be-
fore. Cyclic Triangular Wave Method. As in Case V, measurements on the anodic portion of the cyclic triangular wave are most suitable for kinetic measurements (Figure I I ) , but as before the anodic current function depends on the mi tch ing potential.
Figure 12. Ratio of anodic to cathodic I n this case, ho\\eever, a n extremely peak current as a function of klr, Case VI simde of handling the data n a s
found. .I large number of single rycle theoretical curves 77 we calculated vary-
rents vary by only about 10% for ing both k J / a and the switching poten- a variation in ki/a of :tbout three orders tial, and for a constant value of the of magnitude, and thus are not useful parameter k / i (where T is the time in for kinetic measurements. .$gain, the seconds from E, to E x ) , the ratio of variation in peak pot:ntial is probably anodic to cathodic peak currents v a s more useful. For smdl values of k j la , found to be constant. (Ah before. the the peak potmtia! is independent of anodic peak current is measured to the kl /a , uhile for large values, an anodic extenqion of the cathodic curve.) l h u s shift of about 30,n niv. for a ten-fold a working curve could he constructed increase in k f / a is observed. This for thcl ratio of peak currents ia/ic as a behavior, and also ;he behavior for function of k , ~ (Figure 12), and i f
p 9 - \ - rryi 06
P 04 B s -- 0 2
0 0
\
-20 -I 0 0 0 log(k,r)
Table X. Current Functions &x(at) for Charge Transfer Followed by an Ir- reversible Chemical Reaction (Case VI)
Potentiala 160 150 140 130 120 110 100 90 80 i o 65 60 55 50 45 40 35 30 25 20 15 10 5 0
-5 - 10
15 20 25 30
- 35 40 45 50 60
- i o 80 90
100 E,, mv.
0.05 0.003 0.003 0.004 0.006 0.009 0,014 0.020 0.029 0.042 0.061 0,073 0.086 0.102 0.120 0.140 0.163 0.188 0.216 0.244 0.273 0.303 0.333 0 339 0.384 0.405 0.423 0.435 0,444 0.448 0.448 0.445 0,439 0.4:31 0,421 0.399 0.375 0,351 0.3:30 0.311
-27.7
k / / a 0 . 2 0 . 5 1 . 0 1 . 6 4 . 0 10.0 0.003 0.003 0.005 0,007 0,010 0.015 0,021 0.031 0.045 0.065 0.077 0.092 0.108 0.128 0.148 0.172 0.199 0.227 0.256 0.288 0.317 0.347 0.374 0.398 0.418 0.434 0.445 0.452 0.454 0.452 0.448 0.440 0.430 0.419 0.395 0.369 0.346 0,325 0.305
-25.2 0 Potential scale is ( E - Elis)n.
0.003 0.004 0,005 0.008 0.011 0.016 0,024 0,035 0,050 0.072 0.085 0.101 0.120 0.141 0.163 0.189 0.218 0.248 0,278 0.310 0.341 0,371 0.396 0.419 0.437 0.451 0.459 0.462 0.461 0.457 0.448 0.438 0.426 0.413 0,387 0.361 0.337
-21.1
0.003 0.004 0.006 0.009 0.013 0,019 0.027 0,040 0.057 0.083 0.098 0.116 0.136 0.160 0.185 0.213 0.244 0.276 0.308 0.340 0,371 0.400 0.424 0.443 0.458 0,467 0.471 0,470 0.464 0.456 0,444 0.431 0.417 0.403 0.375 0.349 0.325
-16.4
0.003 0.005 0,007 0,010 0.015 0.022 0.032 0.046 0.065 0.093 0.110 0.130 0.153 0.177 0.206 0.236 0.269 0.302 0.335 0.367 0.396 0.423 0.445 0.461 0.472 0.476 0,476 0,471 0.461 0.4.50 0.436 0.420 0.406 0.391 0.363
-11.8
0.004 0.006 0.009 0.014 0.020 0.030 0.043 0.062 0.089 0.124 0.147 0.173 0.200 0,230 0.263 0,297 0.332 0.367 0.398 0,427 0.451 0.469 0.480 0.486 0.485 0.480 0,469 0.456 0.440 0.424 0,407 0.392 0.377 0.362 0.337
-1.5
0.006 0,009 0.014 0,020 0,030 0.044 0.062 0,090 0.126 0.175 0.203 0.234 0.268 0.303 0.338 0.373 0.406 0.435 0.459 0.477 0.488 0.491 0.489 0.481 0.469 0.455 0.439 0.422 0.405 0.389 0.374 0.360 0.346 0.334 0.312
+9.8
I .o
0.8
0.6
9 0.4
0.2
- i
0 .o
-0.2
120 60 0 -60
(E- E,, 1 n ,rnv Figure 13. Stationary electrode po- larograms, Case VI1
E1/2 is known, a rate constant can be calculat~d from a single cyclic curve.
By using faster scan rates (small k l / a ) , Eli2 also can be obtained experi- mentally. For accurate work. a large scale plot of F i rwe 12 n-~~uld be re- quired; and the ‘data are presented in Table XI.
Qualitatively, from Figure 12. it is very difficult to measire the anodic scan for values of k f r much greater than 1.6. Conversely, a value of k f r much less than 0.02 cannot be distinguished from the reversible case. The method is very convenient, since the ratio of peak heights is independent of such experimental parameters as the electrode area and diffusion coefficient.
VII. CATALYTIC REACTION WITH REVERSIBLE CHARGE TRANSFER
For an irreversible ratalytic reaction following a reversible charge transfer,
O + n e * R
Table XI. Ratio of Anodic to Cathodic Peak Currents, Case VI
k / 7 i a / i c
0.004 1 .oo 0.023 0.986 0.035 0.967 0.066 0.937 0.105 0.900 0.195 0.828 0.380 0.727 0.52B 0.641 0,550 0.628 0.778 0.551 1 . O j O 0.486 1.168 0.466 1.557 0.415
VOL. 36, NO. 4, APRIL 1964 719
4.0-
- id ik 2.0 I .o
0.0.
the theory of stationary electrode polarography (single sweep method) has been treated by Saveant and Vianello (39) who also applied the method in an experimental study (38). Since additional correlations can be obtained by considering alternate ap- proaches to the problem, this case will be reviewed briefly. The cyclic triangu- lar wave method has not been treated previously.
Qualitatively, the effect of the cheniical reaction on the cathodic por- tion of the cyclic wave would be an in-
3.0:/
I I I
crease in the maximum current. This ran be seen by considering the two lirniting cases. First, if k l la is small, Equation 68 reduces directly to Equation 34, and a reversible stationary electrode polarogram is obtained. At the other limit, for large values of k l /a , Equation 68 reduces to x(@ =
which indicates that the current is directly proportional to d& and inde- pendent of the rate of voltage scan, since .\/a is a coefficient in Equation 25.
Equation 83 can bewritten in the form
which provides a closed form solution describing the entire wave. Under these conditions, no peak is obtained, and for large values of k f / a , the potential at which exactly one half of the catalytic limiting current flows is the polaro- graphic In addition, for very rathodic potentials. Equation 84 re-
Table XII. Current Functions .\/&(at) for a Catalytic Reaction with Reversible Charge Transfer (Case VII)
Poten- tiala 120 100 80 60 50 45 40 35 30 25 20 15 10 5 0
-5 10 15 20 25
- 30 35 40 45 50
- 60 80
100 120 140
mv. EPIP,
0.04 0,009 0.020 0.042 0.086 0.120 0.140 0.163 0.189 0.216 0.245 0.275 0.306 0.336 0.364 0.391 0.414 0.432 0.448 0.459 0.465 0.468 0.467 0.463 0.457 0.450 0.431 0.390 0.354 0.326 0.305
+27.3
0 .1 0.010 0.021 0.043 0.088 0.123 0.145 0.168 0.195 0.224 0.254 0.285 0.318 0.349 0.380 0.408 0.434 0.455 0.472 0.485 0.494 0.499 0.500 0.499 0.495 0.490 0.476 0.442 0.413 0.390 0.374
25.7
k / / a 0.2 0 .4 0 . 6 1 .0 1.78 3.16 10.0
0.010 0.011 0.012 0.013 0.015 0.019 0.030 0.021 0.023 0.025 0.028 0.033 0.040 0.066 0.045 0.049 0.052 0.059 0.069 0.086 0.139 0.093 0.100 0.108 0.121 0.144 0,176 0.289 0.129 0.140 0.150 0.170 0.201 0.249 0.409 0.152 0 . m 0.178 0.201 0.239 0.294 0.482 0.177 0:iG 0.207 0 : i G 0:279 0.345 0151% 0.205 0.224 0.242 0.273 0.326 0.403 0.665 0.236 0.258 0.278 0.315 0.378 0.467 0.773 0.267 0.294 0.318 0.361 0.433 0.539 0.894 0.301 0.331 0.359 0.409 0.493 0.614 1.022 0.337 0.371 0.403 0.461 0.558 0.695 1.162 0.370 0.410 0.447 0.512 0.623 0.782 1.310 0.404 0.449 0.491 0.566 0.690 0.867 1.459 0.436 0.487 0.534 0.617 0.756 0.955 1.614 0.465 0.522 0.574 0.668 0.821 1.042 1.769 0.489 0.552 0.611 0.715 0.883 1.124 1.919 0.510 0.580 0.644 0.757 0.942 1.204 2.061 0.527 0.604 0.673 0.796 0.996 1.278 2.197 0.540 0.622 0.697 0.829 1,044 1.345 2.322 0.548 0.638 0.719 0.861 1.088 1.406 2.436 0.553 0.649 0.735 0.885 1.126 1.462 2.540 0.556 0.658 0.749 0.907 1.159 1.510 2.633 0.555 0.663 0.759 0.924 1.188 1.552 2.713 0.553 0.666 0.766 0.939 1.211 1.587 2.782 0.545 0.668 0.776 0.961 1,250 1.644 2.894 0.522 0.662 0.782 0.984 1.295 1.715 3.034 0.502 0.653 0.781 0.994 1.315 1.749 3.102 0.486 0.646 0.779 0.997 1.326 1.765 3.134 0.474 0.641 0.777 0.999 1.330 1.772 3.149
23.5 19.6 16.3 11.2 6.7 3 .8 1.0 a Potential scale is ( E - Eli&.
I / I
l o g 9
Figure 15. Variation of half-peak po- tential as a function of kinetic parameters
Case VII: = k//a; the potential scale i s ( E p i p - €1 ’2)n Case VIII: $ = k,/b; the potential scale is ( E p t 2 - Eo)run. + ( R T / F ) In d / r D b / k .
duces to a form derived by Saveant and Vianello (as)
i = ? L F A C ~ * a (85) which indicates, just as Equation 83, that the limiting current for large values of kJ/U is independent of scan rate. Single Scan Method. Since Equa-
tion 62 is an Abel integral equation, the solution can be written directly in a manner similar to Caw I, Equa- tion 32. This is the approach used by Saveant and Vianello (39). Calcula- tions carried out using the numerical method agreed evactlv with the results of Saveant and Viancllo (for the cathodic portion of the v a n ) and typical curves are shown in Figure 13. However, the values of at) presented by Saveant and Vanello do not cover the rising portion and peak of the stationary electrode polarogram at small enough potential intervals to permit convenient calculation of accurate theoretical curves. Thus. additional data are prescnted in Table XII.
The cathodic current function at) can be correlated with the kinetic parameter k f / a by comparison of experimental and theoretical polaro- grams. However, it is probably more convenient to use a working curve in which the ratio of the catalytic peak current to the reversible peak current is plotted a$ a function of ( k f ’u ) l i2 (Figure 14). For valnes of k,lu larger than about 1.0, the plot is essentially linear which defines the range of ap- plicability of Equations 84 and 85. For values of k J / u l e s than about 0 06, the peak ratio of &lid is fairly insensitive to changes in k f / a . The method ap- pears very convenient, but for accurate work with small values of k l l u a large scale plot of Figure 14 mould be re- quired, and the necessary data can be obtained from Table.; I snd XII.
The variation in peak potential with changes in rate of potential scan also can be used to obtain kinetic data. For low values of kl /a , the peak potential is
720 ANALYTICAL CHEMISTRY

h s Y
X
S
POTENTIAL, rnv
Figure 16. Stationary electrod'e po- larograms, Case Vlll Potential scale i s ( E - E o ) a n , + (RT/F) I n d ? r D b / k *
independent of k f / a , and is constant a t 28.5/n mv. cathodic of Eliz as in the reversible case. -4s k f / a increases, the peak potential shifts cathodically by about 60/n mv. for a ten-fold increase in k,/a but simultaneoiisly, the peak be- comes quite broad, and for values of
k,/a larger than about 1.0, no peak is observed. Thus, i t is more useful to correlate half-peak potentials with k f / a [as suggested by Saveant (SS)] since this correlation can be extended to the region where no peak is observed. As predicted from Equation 84, when k f / a is larger than about 10, the potential a t which the current is equal to half of the limiting current is inde- pendent of variations of k f / a , and is equal to the polarographic half-wave potential. The behavior for inter- mediate values of k f / a is shown in Figure 15, and the data for an accurate plot can be obtained from Table XII.
Spherical Electrodes. For the catalytic case, Weber (6'1) was able to derive a spherical correction term in closed form, which is the same as the one deiived by Reinmuth for the reversible case (56). Thus, the value of +(at) listed in Table I can be wed directly with the values of x (a t ) in Table XI1 to calculate the current a t a spherical electrode.
Cyclic Triangular Wave Method. Provided a switching potential is selected a t leaqt 35/72 mv. cathodic of the peak potential, the anodic curve (as measured to the extension of the cathodic curve) is the qamc shape as the cathodic curve, independent of both the switching potential and k,/a.
The ratio of the cathodic peak current to the anodic peak current is unity, exactly as in the reversible rase. At large values of kfla-e.g., larger than about 1.0-where no cathodic peak is observed, anodic peaks are not ob- served either, and on the anodic scan, the current simply returns to zero a t potentials corresponding to the foot of the cathodic wave.
Since the anodic portion of the scan has exactly the same properties as the cathodic, no additional quantitative kinetic information r m be obtained.
VIII. CATALYTIC REACTION WITH IRREVERSIBLE CHARGE TRANSFER
For catalytic system.. in which both the charge transfer reaction and the rhemical reaction are irreversible,
k
(VIII) k'f
the theory of stationary electrode polarography ha. not been considered previously. Qualitatively, one would expect that the polaroqrams would be similar to the catalytic case ui th reversible charge transfer, except that the curves would be lower and more spread out on the potential axis. In addition, no anodic current would be
O + n e - + R
R + Z + O
Table XIII. Current Functions d/?rx(bt) for a Catalytic Reaction with Irreversible Charge Transfer (Case VIII) k?/b .__ Potential0 0.04 0 . 1 0.2 0 . 4 0 . 6 1 .o 1.78 3.16 10.0
160 140 120 110 100 90 80 70 60 50 40 35 30 25 20 15 10 5 0
-5 - 10
15 20 25 30
- 35 40 50 60 70
- 80 100 120 140 160
EPiz, mv.
0,004 0.008 O,O:i6 0,0:!4 0,035 0.050 0,0;'2 0.104 0.14-5 0,198 0.2ti4 0.301 0.334 0.37'6 0.410 0.443 0.4f19 0.4E'O 0.5c14 0.511 0.511
0.497 0 ,485 0.470
0.506
0.4E16 0.440 0.411 0.3516 0.3f16
0.3:!0 0.300
0 . 3 4
+41.1
0.m4 0.0013 O . O l ( i 0.024 0,035 0.050 0,073 0,105 0.14;' 0.200 0.26;' 0.305 0.344 0.383 0.418 0.454L 0.483 0,506 0,524 0.534: 0.53Sl 0.538 0.532 0.523 0.512 0.500 0.487 0.46:; 0,44i! 0.42:; 0.409 0.386 0.371
39.6
0.004 0.008 0.016 0.024 0.035 0,051 0.073 0.105 0.147 0.201 0.271 0.311 0.349 0.392 0.431 0,470 0.503 0.532 0.555 0.571 0.581 0.586 0.585 0.581 0.575 0.568 0.559 0.541 0.525 0.512 0.501 0.484 0.473 0.466 0.461
37.0
0.004 0,008 0.016 0.024 0.035 0.051 0,073 0.106 0,148 0.205 0.278 0.320 0.362 0.408 0.453 0.500 0.538 0,575 0.608 0.633 0.653 0.667 0.676 0.681 0.683 0.683 0.681 0.674 0 667 0.661 0.655 0.646 0.641 0.638 0.636
32.4
0.004 0.008 0.016 0.024 0.035 0.051 0,074 0.107 0.150 0.208 0.283 0.327 0,372 0.422 0.470 0.521 0.567 0.610 0.651 0,685 0.713 0.735 0.753 0.765 0.774 0.780 0.783 0.786 0.786 0.785 0 . 783 0.780 0,778 0,776 0.776
27.7
0.004 0.008 0.016 0.024 0.035 0.051 0.074 0.108 0.152 0.213 0.291 0.339 0.388 0.444 0.498 0.556 0.612 0.666 0,719 0.766 0.809 0.844 0.875 0,900 0.921 0.937 0.951 0.969 0.980 0.988 0.992 0.997 0.999 0,999 1.000
19.8
0.004 0.008 0.016 0 024 0.035 0.051 0.075 0.109 0.155 0.218 0.302 0.354 0.409 0,473 0.534 0.600 0.673 0,742 0.813 0.878 0.941 0.998 1.049 1.094 1.133 1.166 1.195 1.238 1.269 1.289 1.303 1.320 1.328 1.331 1.332
10.3
0,004 0.004 0,008 0,008 0.016 0,016 0.024 0.024 0.036 0.036 0.052 0.052 0.075 0,076 0.110 0.113 0.157 0.162 0.224 0.234 0.313 0.334 0.370 0.399 0.430 0.471 0.500 0.558 0.574 0.650 0.656 0.761 0,740 0.876 0,827 1.002 0.920 1.145 1.007 1.288 1.097 1.443 1.178 1.595 1.258 1.755 1.328 1.903 1.394 2,053 1.450 2 186 1.502 2.317 1,583 2.538 1.643 2.710 1,684 2.840 1.714 2.936 1.748 3.056 1.764 3.112 1.772 3.139 1,776 3,152 1.3 -14.4
a Potential scale is ( E - E") ana + ( R T / F ) In d a b / k a .
VOL. 36, NO. 4, APRIL 1964 721

The variation of the half-peak z potential with changes in k / / b also can 0 be used to characterize the system. A
working curve for this method is shown in Figure 15, and the data can be ob- tained from Table XIII.
DIAGNOSTIC CRITERIA
03 0 446Kl(I+K1 I I I I
In each of the kinetic cases, the effect of the chemical reaction nil1
V time required to perform the experi- Figure 17. Variation of peak current functions with rate of voltage scan
observed in a cyclic triangular wave experiment.
-\gain, two limiting cases can be con- sidered. For small values of k,/b, Equation 69 reduces to Equation 48 and a n irreversible statiouary clectrode polarogram is obtained. For large values of k,lb, Equation 69 reduces to
ment. Taking Case V (irreversible succeeding chemical reaction) as an example, if a very rapid reaction is involved in experiments with very slow scan rates, the stationary electrode polarogram will reflect the char- acterktics of the chemical step almost entirely. On the other hand. if the rate of vollage scan is rapid compared to the rate of the reaction, the curves are identical to those for the corresponding uncomplicated charge transfer.
Similar observations can be extended to the other kinetic cases, and are borne out quantitatively in the theory presented hrre-Le., in every kinetic case, the ratio of the rate constant to the rate of voltage scan appears in the kinetic parameter. This, in turn, makes it possible to use these relations
k, cYn,F In v$)] to define diagnostic criteria for the
2 (-1)7+1 (4;)' m b X
RT X
j = 1
d?rDb + RT
b. Similarly, a closed form solution
describing the entire wave can be obtained by rearranging Equation 86
In @)] (87) an,F .Ira
Typical curves for several values of k / / b are shown in Figure 16 and the data are listed in Table XIII. These curves qualitatively are similar to those of Figure 14 except that x(bt) , ki /b and the potential axis all depend on an,.
For quantitative characterization of the kinetics, the data can be treated in a manner similar to the catalytic re- action coupled to a rcversible charge transfer. I n this case, however, the ratio of the catalytic current to the irreversible current for the system is the parameter used. The working curve for this case is included in Figure 14. As in the previous case, the ratio &/id is fairly insensitive to changes in k f / b less than about 0.06, and the points required for a large scale plot of the working curve can be obtained from Tables I11 and XIII.
mentally are the variation-with changes in rate of voltage scan-of the cathodic peak current, the cathodic peak (or half-peak) potential, and the ratio of the anodic to cathodic peak currents. These diagnostic relations are most useful for qualitative char- acterization of unknown systems, since only trends in the experimental be- havior are required. Therefore, the correlations in Figures 17, 18 and 19, have all been calculated for an arbitrary value of rate constant (and equilibrium constant, i f necessary) so that the behavior could be compared readily on the same diagram.
,\mong the rrlations to be noted in Figure 17 is that by plotting the quantity i,lnF.4 l/G Co* as a function of the rate of voltage scan, the effect of
- 0.01 0.1 1.0 IO 100
V Figure 18. as a function of scan rate
Rate of shift of potential
t 1.41 /
0.8 1 , O R i
0.01 0.1 1.0 10 100 V
Figure 19. Ratio of anodic to cathodic peak currents as a function of rate of voltage scan
u on the diffusion process can be separated from it. effect 011 the kinetics. Thus, for the uncomplicated charge transfer reactions (Cases I and 11) horizontal straight lines are obtained. The behavior for each kinetic case ap- proaches one of these straight lines A hen the rate of voltage wan is such that the chemical reaction cannot proceed signifi- cantly before the experiment is over. Experimentally, this correlation is ex- tremely easy to obtain, since it is only necessary to plot ip~til'z DS. u .
The rate a t which the wave shifts along the potential axis as the rate of voltage scan is varied (Figure 18) is also useful for investigation of unknown systems. Because several of the cases do not exhibit peak:, under some con- ditions, the half-peak potential wa? used in this correlation. Honever, these curves apply as well to the peak potential for Cases I, TI, T', and VI.
In Figure 19, which is relevant only for reversible charge transfers, the ratio of anodic peak current to the cathodic peak clirrent is unity for the reversible (Case I) and catalytic (Case VI]) systems on!y, and this serves as a quick test for the presencc of kinetic complica- tion..
In sonie of the individual cases, additional experimental correlation. are particularly useful. For example, if an irreversible charge transfer reaction is involved, it is always possible to obtain en, from the shift in peak potential, provided the rate of voltage scan is in the proper range. For reversible charge tranqfer, other correlations are possible involving variation in anodic peak cur- rent or peak potential with switching potential. However, these correlations can be defined more easily in connection with experimental results on a particular kinetic case. Several studits involving applications of the theory presented here are now in progress, and these, with the additional correlations, will be presented in the future.
Although various electrochemical methods have been dereloped recently uhich can be used for similar measure- ments on kinetic systems, stationary electrode polarography appears to be
722 ANALYTICAL CHEMISTRY

particularly convenient to use. From the experimental pomt of view, the time scale of the elperiment can be varied from conventiclnal polarographic rates of voltage scan of a few millivolts per second (where convection ultimately sets the lower limit of scan rate) to perhaps several thousand volts per second (where charging current and adsorption phenomena become im- portant). Furthermore, this extremely wide range of scan rates can be ob- tained with ease if insmmenbs based on operational amplifiers are available (42, 69). Thus, the use of the diagnostic criteria is particularly simple, and stationary electrode 3olarograptiy is a very powerful method for studying electrochemical kinetics.
ACKNOWLEDGMENT
The numerical calculations were car- ried out a t the RZiclnest T’niversities Research Association and the help of AI. R. Storm in making available the IRA1 704 computer is g,ratrfully acknowl- edged. During thc academic year 1962-63, R. S. Nicholson held the Dow Chemical Fellon ship a t the I’niversity of Wisconsin.
LITERATURE CITED
(1) Apostol, T. M., “Mathematical Analysis,” p. 200, Addison Wesley, Reading, Mass., 1957.
(2) Berzins, T., Delahay, P., J . Am. Chem. SOC. 75, 555 (1953).
(3 ) Buck, R. P., ANAL. CHEM. 36, 947 (lF)A4).
( 4 j Delahay, P., J . A m . Chem. SOC. 75, 1190 (1953).
(5 ) Delahay, P., “Xew Instrumental Methods in Electrochemistry,” Ch. 3, Intersrience. New kork. 1954.
(6) Zbid., Chap. 6. ( 7 ) DeRIais, R. D., Shain, I., ANAL.
CHEM. 29, 1825 (1957).
(8) DeMars, R. D., Shain, I., J. Am.
(9) Frankenthal, R. P., Shain, I., Zbid., Chem. SOC. 81, 2654 (1959).
78,2969 (1956). (10) Galus, Z., Adams, R. N., J . Phys.
Chem. 67,862 (1963). (11) Galus, Z., Lee, H. Y., Adams, R. N., J .
Electroanal. Chem. 5,17 (1963). (12) Gokhshtein, A. Y., Gokhshtein,
Y. P., Doklady A k a d . N a u k S S S R 131,601 (1960).
(13) Gokhshtein, Y. P., Zbid., 126, 598 (1959).
(14) Gokhshtein, Y. P., Gokhshtei;: A. Y., in “Advances in Polarography, I. S. Longmuir, ed., Vol. 11, p. 465, Pergamon Press, Xew York, 1960.
(15) Gokhshtein, Y. P., Gokhshtein, A. Y., Doklady A k a d N a u k S S S R 128, 985 (1959).
(16) Kemula, W., in “Advances in Polarography, I. S. Longmuir, ed., Vol. I, p. 105, Pergamon Press, New York, 1960.
(17) Kemula, W., Kublik, Z., Anal . Chim. Acta 18, 104 (1958).
(18) Kemula, W., Kublik, Z., Bull. Acad. Polon. Sci., Ser. Sci. Chim., Geol. et Geograph. 6, 661 (1958).
(19) Koutecky, J., Collection Czechoslov. Chem. Communs. 21,433 (1956).
(20) Koutecky, J., Brdicka, R., Zbid., 12,337 (1947).
(21) Matheson, L. A., Nichols, N., Trans. Electrochem. Soc. 73, 193 (1938).
(22) Matsuda, H., Z. Elektrochem. 61, 489 (1957).
(23) Matsuda, H., Ayabe, Y., Zbid., 59, 494 (1955).
(24) Mueller, T. R., Adams, R. N., Anal . Chim. Acta 25, 482 (1961).
(25) Nicholson, M. M., J . Am. Chem. SOC. 76,2539 (1954).
(26) Ticholson, M. hl., Zbid., 79, 7 (1957).
(27) Nicholson, R. S., Ph.D. Thesis, Iiniversity of Wisconsin, 1964.
(28) Papoff, P., J . Am. Chem. SOC. 81, 3254 (1959).
(29) Randles, J. E. B., Trans. Faraday Soc. 44,327 (1948).
(30) Reinmuth, W. H., ANAL. CHEM. 32, 1891 (1960).
(31 ) Reinmuth, W. H., Zbid., 33, 185 (1961).
(32) Zbid., p. 1793.
(33) Reinmuth, W. H., Zbid., 34, 1446 (1962).
(34) Reinmuth, W. H., Columbia Univer- sity, New York, 5. Y., unpublished data, 1964.
(35) Reinmuth, W. H., J . Am. Chem. SOC. 79, 6358 (1957).
(36) Riha, J. in “Progress in Polarog- raphy,” P. Zuman, ed., Vol. 11, Chap. 17, Interscience, New York, 1962.
(37) Ross, J. W., DeMars, R. D., Shain, I., ANAL. CHEM. 28, 1768 (1956).
(38) Saveant, J. M., Ecole Sormale Superieure, Paris, private conimunica- tion, 1963.
(39) Saveant, J. M., Vianello, E., in “Advances in Polarography,” I. S. Longmuir, ed., Vol. I, p. 367, Pergamon Press, New York, 1960.
(40) Saveant, J. M., Vianello, E., Compt. Rend. 256, 2597 (1963).
(41) Saveant, J. M., Vianello, E., Electro- chim. Acta 8, 905 (1963).
(42) Schwarz, W. hl., Shain, I., ANAL. CHEM. 35, 1770 (1963).
(43) Schwarz, W. M., Shain, I., Division of Physical Chemistry, 142nd Sational Meeting, ACS Atlantic City, N. J., Sept>ember 1962.
(44) Sevcik, A,, Collection Ctechoslov. Chem. Communs. 13,349 (1948).
(45) Shain, I., in “Treatise on Analytical Chemistry,” Kolthoff and Elving, eds., Part I, Sec. 0 - 2 , Chap. 50, Interscience, ICew York, 1963.
(46) Shain, I. , Southeast Regional Meet- ing, ACS, New Orleans, December 1961.
(47) Smutek, M., Collerfion Ctechoslov. Chem. Communs. 20, 247 (1955).
(48) Tricomi, F. G., “Integral Equations,” p. 39, Interscience, Sew York, 1957.
(49) Underkofler, W. L., Shain, I., AXAL. CHEM. 35, 1778 (1963).
(50) S‘ogel, J., in “Progress in Polarog- raphy,” P. Zuman, ed., Vol. 11, Chap. 20, Interscience, New York, 1962.
(51) Weber, J., Collection Czechoslott. Chem. Communs. 24,1770 (1959).
RECEIVED for review November 5, 1963. Accepted December 30, 1963. This work was supported in part by funds received from the U. S. Atomic Energy Com- mission under Contract No. AT( 11-1)- 1083. Other support was received from the National Science Foundation under Grant N o . Gl5741.
New Elec: t rodes for C h ro n o po ten tio me try in Thin Layers of Solution A. T. HUBBARD and FRED C. ANSON California Institute o f Technology, Pasadena, Calif.
b Two new electrodes for chrono- potentiometry in thin layers of solution are introduced and the details of their construction and manipulation are presented. In addition to giving more reproducible results, these electrodes are more convenient to use than previ- ous designs. A typical set of data i s presented, demonstrating the re- producibility of the experimental tran- sition times and their agreement with transition times calclJlated with Fara- day’s law from the r’imple geometrical volume of the electrclde crevices.
N PREVIOUS STUDIES (2 , 3) the theory I of thin layer chronopotentiometry was presented and tested with a specially constructed electrode for which the dimensions of the solution reservoir were somewhat smaller than those of the diffusion layer. This electrode suffered from the fact that i t had to be filled under reduced pressure and several hours were needed to wash out the electrode cavity after each use.
I n the present work two new electrodes have been devised that are simple to construct and may be rapidly
filled and cleaned. The first electrode imprisons the thin layer of solution between the inner wall of a short section of precision-bore glass capillary tubing and a close-fitting platinum wire inserted into the tubing (Figure 1). The second electrode is constructed from a micrometer t o which platinum faces have been attached; a thin layer of solution is confined between the faces of the micrometer which are equipotential (Figure 2).
These electrodes are quite convenient to use, and yield more reproducible re-
VOL. 36, NO. 4, APRIL 1 9 6 4 o 723


![COMPUTERIZED KALOUSEK POLAROGRAPHY · Kalousek polarography has rcLeived little attention in recent years [ 11, although Kinard et al. [ 2] outlined important analytical applications](https://img.pdfslide.us/doc/110x75/60637f97d67bc0172f72a40f/computerized-kalousek-polarography-kalousek-polarography-has-rcleived-little-attention.jpg)