Embed Size (px)
Citation preview

8/6/2019 Theory for WT 1
http://slidepdf.com/reader/full/theory-for-wt-1 1/15
- 1 -
INTERNATIONAL ENGLISH LANGUAGE TESTING SYSTEM
ACADEMIC WRITING
Teacher in charge: Mr. Pham Van Phi
WRITING TASK 1
Useful language: Making comparisonsA and B represent elements in a diagram such as leaded and unleaded petrol, China and
Australia, or nuclear and wind power.
X and Y represent amounts such as $ 120 million, 67%, or 200 units.
Introducing differences
a significant difference between A and BGenerally, there is
a wide disparity in + (noun)
Comparative structures
In contrast (to B),
In comparison (with B), A is larger / smaller
By a narrow
margin.
by x.
A is just / well
A is approximately under/ over x
(larger / smaller)
than B
(over)
A is (under)
twice
two/ three/ four
times
as large / great /
high as B.
more/ less + (noun U)A uses / produces
more/ fewer + (noun C)than B
A is considerablymarginally
greater / higher / smaller than B
A is almost As (large / high) as
that inB
Superlative structures
is the (second /third) largest /
smallest
+ (noun C)A
has the great / widest / most
significant
+ (noun U & C)
A
uses
produces
consumes
the larges / highest /
smallest / lowest
proportion of + (noun U).number of + (noun C).
amount of + (noun U).
quantity of + (noun U&C)
8/6/2019 Theory for WT 1
http://slidepdf.com/reader/full/theory-for-wt-1 2/15
- 2 -
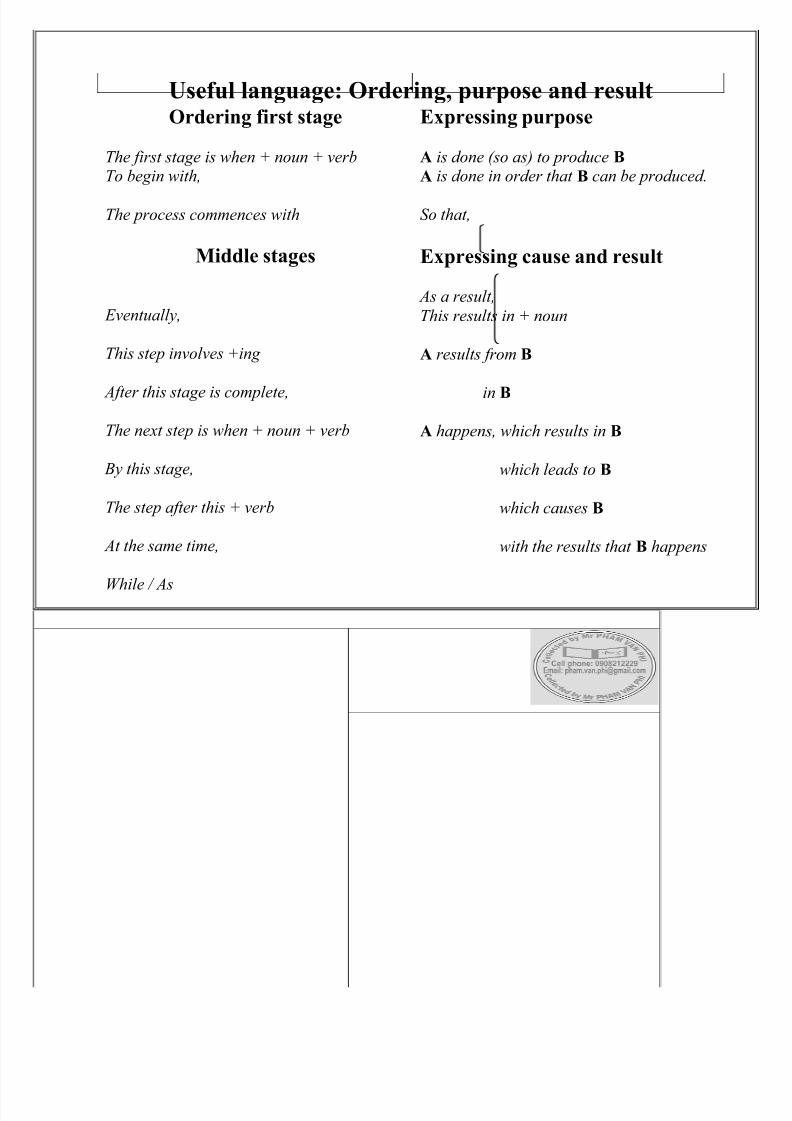
Useful language: Ordering, purpose and resultExpressing purpose
A is done (so as) to produce B
A is done in order that B can be produced.
So that,
Ordering first stage
The first stage is when + noun + verbTo begin with,
The process commences with
Middle stages
Eventually,
This step involves +ing
After this stage is complete,
The next step is when + noun + verb
By this stage,
The step after this + verb
At the same time,
While / As
Once A has finished, B is able to start.
Last stage
Once the final stage has been completed,
Expressing cause and result
As a result,
This results in + noun
A results from B
in B
A happens, which results in B
which leads to B
which causes B
with the results that B happens

8/6/2019 Theory for WT 1
http://slidepdf.com/reader/full/theory-for-wt-1 3/15
- 3 -
Writing tips for IELTSExam summary
The academic writing module takes approximately 60 minutes.
There are two tasks.
Task 1
This takes about 20 minutes. You write a report about a graph, table, bar chart or diagram,using a minimum of 150 words.
You are marked on task completion and use of a range of vocabulary and grammar,
organization and development.
1. Problem: have difficulty in understanding graphic information; you spend too long on Task l.Maybe it's better to start on Task 2, but remember to stick to the time allotted to each task.
2. collect graphs from books, magazines, newspapers
3. success depends on:
- understanding graphic information
- using the correct language- using the right method
- practice
4. Steps to analyse a graph: 4.1. Divide the graph into sections, each section presents a sentence
4.2. Circle the lowest and highest point on the graph, use phrases such as* reached the highest peak of
* rose to an all time high of
* dropped to the lowest level of
* fell to an all time low of Refer to Writing notes attached4.3. Write the introduction
Ex. This line graph clearly highlights the sale of trucks in Petrie over one decade. Time, on
the horizontal axis, is plotted against the number of trucks sold on the vertical axis. 4.4. Write the body of the graph which is presented by the line. Each sentence should contain 4
elements: * information on the horizontal axis* information on the vertical axis
* information presented by the line itself
* connectives to join sentencesEx. As can be seen, from 1987 to the end of 1988 the sale of trucks remained constant at
200,000 per year. Refer to the. Writing notes "Useful phrases for Graph interpretation"
4.5. Write the conclusion
The concluding statement should be an overall observation about the overall trend.Ex. It is interesting to note that sales peaked around the end of 1991. This may be due to a
down-turn in the economy of this country from the beginning of 1992.

8/6/2019 Theory for WT 1
http://slidepdf.com/reader/full/theory-for-wt-1 4/15
- 4 -
5. Steps to analyse a table:
5.1. Information across the top is always analysed in relation to the information down the size
of the table.Introduction sentence should be written about this relation.
Ex. The table clearly presents and compares favourable pastimes in eight different countries. The pastimes, across the table, are analysed in relation to each country,
5.2. Analyse the information on the table and try to group together sections that are the same or
similar.
5.3. Not every part of the table needs to be mentioned. Just bring out points of interest.
5.4. Compare different features or components, using comparing words or phrases
5.5 Conclusion
Make a general comment, mention about one or two items that stand out.Ex: It seems that pastimes of people of different nationalities may be influenced by a number of
factors such as socio-economic situation or the climate. These factors influence culturedifferences between different nationalities and make cross-cultural experience more interesting.
5.6 When giving your opinions, use the words like "may" (Refer to Writing notes attached).

8/6/2019 Theory for WT 1
http://slidepdf.com/reader/full/theory-for-wt-1 5/15
- 5 -
Golden rules
Do Task 1 first. There is a reason why it is Task 1! From the psychological point of view,
it gives you a sense of accomplishment when you have finished it.
A common feature of the writing process is the concept of getting oneself going. With
the shorter Task you can get yourself into your stride in writing. By the time you start
Task 2, you will then be much more alert and perform Task 2 much more efficiently.
Spend 20 minutes on this task. A common mistake which candidates make is to spend
longer on Task 2 and leave themselves 15 minutes or less to complete Task 1.
Take Task 1 seriously, even though Task 2 carries double the marks.
Skim the instructions and study the diagram. Use the general statement about the data to
help you interpret the graph.
Spend the recommended 20 minutes as follows:
- 2-3 minutes analysing and planning
- 14-15 minutes writing
- 2-3 minutes checking
Check the values and numbers on the vertical and horizontal axes.
Work out how many lines 150 words are in your handwriting, e.g. if you write about 10
words per line, then you will need to produce at least 15 lines. Aim to write no more than
170/180 words
Check that you have written at least 150 words. If you write less, it will affect your score.
Compare general trends, differences, etc and support this with information from the
diagram. Avoid focusing too closely on the details.
If you have more than one graph or chart or mixture, link the information.
Make sure you write in paragraphs: an introduction, one or two paragraphs for the body
of the text. Then write a brief conclusion.

8/6/2019 Theory for WT 1
http://slidepdf.com/reader/full/theory-for-wt-1 6/15
- 6 -
Graphsto write the introduction
One sentence is enough for the introduction.
Replace words in the general statement with synonyms or paraphrases where you can.
If you cannot quickly write your introduction in your own words, do not waste time. Write
out the words in the rubric, but remember to change them later.
Do not write the word below from the rubric in your introduction.
Use one of the following four prompts to help you write an introduction:
- The graph shows/illustrates the trends in ... between ... and...
- The graph gives/provides/reveals/presents information about (the differences/ changes ...)
- The graph shows that (there is a number of differences between ...)- The graph shows/illustrates how the sales have differed/changed...
Vary noun phrases, e.g. sales/purchases of different cars; sales/purchases of private vehicles;
the number of various types of cars sold/purchased; the number of various types of cars
sold/purchased; car sales/purchases.
Use general words for the introduction: information, data, difference's), similarities,
changes, trends, results, numbers, percentages, figures, statistics, breakdown.
How to write the main part of the text
Divide your text into 3-4 paragraphs, including the introduction.
Divide the information into broad/general groups/categories or trends.
Describe the main or most striking/significant/noticeable/outstanding/remarkable
feature(s)/characteristics differences/trends/changes. Avoid writing lists of detail. Write
about general trends and support what you say with specific data.
Describe the three general trends: is/was upwards/downwards/flat or say what happened: ...
(sales) rose/fell/remained flat/fluctuated ...

8/6/2019 Theory for WT 1
http://slidepdf.com/reader/full/theory-for-wt-1 7/15
- 7 -
Use appropriate synonyms:
- rise (v); climb, go up, increase, improve, jump, leap, move upward, rocket, skyrocket, soar,
shoot up, pick up, surge, recover
- rise (n); increase, climb, jump, leap, pick up, surge (in)
- fall (v); collapse, decline, decrease, deteriorate, dip, dive, drop, fall (back), go down, go into
free-fall, plummet, plunge, reduce (only in the passive) slide, slip (back), slump, take anosedive
- fall (n); decline, decrease, deterioration, dip, drop, plunge, free-fall, slide, slip, dive, reduction,
slump
- fluctuate: (noun: fluctuations) be erratic, be fitful, vary, rise and fall erratically
- flat: no change, constant
Add suitable adverbs: dramatically, erratically, gradually, markedly, significantly, slightly,
slowly, steadily
Add specific information or examples:
- (increasing etc.) from ... to...
- between... and ...
- with an increase from ... to ... /to ... from ...
Use: ... followed by ... to add more information.
Add time phrases:
- between... and ...
- from... to ... (inclusive)
- at .../by .../in ...
- in the year (1994)... - during/over the period... to...
- over the latter half of the year/century/decade/period
- over the next past/previous five days/weeks/months/years/decades

8/6/2019 Theory for WT 1
http://slidepdf.com/reader/full/theory-for-wt-1 8/15
- 8 -
How to compare and contrast
o Repeat the process for each general point, but vary the sentence structure, grammar and
vocabulary.
o Use the comparing and contrasting language given: ... increased more than; there was a
greater increase in ... than...
o Use conjunctions like: while/whilst/whereas/but
o Use linkers: however/in contrast/by comparison/meanwhile/on the other hand
o Focus on an item in the graph:
- As regards (sales), they...
- With regard to/Regarding/In the case of/As for/ Turning to (sales), they...- Where ____ is/are concerned/it/they...
- When it comes to ______, it/they...
o Use these words and phrases to describe predictions:
- It is predicted/forecast(ed)/estimated/expected/projected anticipated that... will...
- ... will...
- ... will have ... by...- The projection is for... to...
- ... is/are predicted/forecast(ed)/estimated/expected/projected/ anticipated to
- ... is/are set to
o Use the present perfect to describe the recent past to the present: ...has risen, etc.
o Write a conclusion. One sentence is enough. You can use the following phrases:
o Generally ...; Generally speaking...; All in all, ...; On average, ...; Overall, ...; It is
clear/evident/obvious that, ...

8/6/2019 Theory for WT 1
http://slidepdf.com/reader/full/theory-for-wt-1 9/15
- 9 -
Other verb sequences stages you can use:
- ... rose from ... to...
- ... rose ... and increased ... from ... to...
- ... rose ...., increasing from ... to ...
- ... rose ..., overtaking ... in ....and outstripping ... in...
- Rising from ... to... (sales) overtook ... and outstripped ...
- ... rose ... overtaking ... in ... and reaching a peak ... in...
- ... rose ..., before leveling off...
- ... fell..., before rising...
- ... fell.... after rising... /after rising..., ... fell...
- ... rose/fell... from ... to ..., while/whilst/whereas/... rose/fell...
Note how versatile the use of the gerund is. You can use it to explain; as part of series of
events and as a result.

8/6/2019 Theory for WT 1
http://slidepdf.com/reader/full/theory-for-wt-1 10/15
- 10 -
Bar charts
For bar charts that present data like graphs over a period of time
The survey took place in the past not the present, but you can use either the past simple or
the present simple to describe the data.
Try to classify the items and divide them into groups rather than writing about each one in
turn: the (factors) can be divided into two main groups...
- Name the groups: ... namely those related to ... and those (connected) with...
- Compare the two groups: ... of the two, the former is the larger.
- State an important feature in this group: with ... being the most popular with 40 per cent.
Compare and contrast the other items. Use some of the following:
- more/less than ...
- (bigger) than...
- (not) as big as...
- twice as big/much as ...
- rather than ...
- as against/as opposed to/compared with/in comparison with ...
- in (sharp) contrast to the biggest/smallest (change)...
- more (women) cited/achieved/participated/took part in/were involved in ... than ...
- there were more (men) than (women) who ...
To quote from the results of the survey, you can use:- ... percent quoted/cited/mentioned/considered ...as important...
- ... was quoted/cited/mentioned/considered as the most/least important factor by...
- ... came top/bottom/second/next, followed (closely) by ... at... and ... respectively

8/6/2019 Theory for WT 1
http://slidepdf.com/reader/full/theory-for-wt-1 11/15
- 11 -
Pie charts
• Pie charts can be like bar charts except that various sections add up to 100%. There can also
be a series of charts where the data show trends.
• There is often both a graph and a pie chart and the two are related.
• Make sure you show the connection between the pie and the graph or bar chart rather than
just listing the data from the pie chart.
• Use the information regarding graphs to describe trends.
• If you have a graph and a pie chart, describe the graph, if it is the most important. Then link
the information in the pie chart to the graph.
• Show that you are looking at the pie chart: From the pie chart, it is clear/obvious/ evident
that...
• Relate a particular item in the pie chart to an aspect of the graph/chart; ... is related/
connected to/has an effect on/affects ..., because...
• You can compare/contrast items: ... while ...; in contrast,…
• You can use the pie chart to help you draw conclusions about the graph: The pie chart
suggests that... and show the relationship between the two.
• Always link data from different sources to each other.
Tables
A table can contain data like pie charts, graphs and bar charts that are not related to aspecific item in the past. Follow the steps described for these charts.
The presentation of information in tables can seem overwhelming. Don't panic! There isa simple way round this. If the table gives a tot of data over a number of years, at the
end of the line draw a rough graph line to indicate the trend. Do this quickly for each
item in the table. This means that you won't have to look at each number every time youwant to analyse a line.
Because the numbers are given for each year, don't be tempted to include eachindividual piece of information.
Use general trends/statements, backed up by data as in the graphs. Sometimes highlightspecial changes/developments.

8/6/2019 Theory for WT 1
http://slidepdf.com/reader/full/theory-for-wt-1 12/15
- 12 -
Processes
Follow the same initial steps for writing about a graph.
In the introduction you can use: The diagram/picture/chart shows/illustrates/describes/
depicts the process of/how...
Find a starting point and write the process as a series of steps:
Useful connecting words you can use are:- Adverbs: first/firstly/first of all, secondly, thirdly, then/next/after that/following that/
following on from this/subsequently/subsequent to that, finally
- Prepositions: At the beginning of ...; At the end of...
Use the following conjunctions to make more complex sentences;
- when/once/as soon as/immediately
- before + clause or gerund
- after + clause or gerund
- where/from where/after which
Other connecting devices you can use are:
- The first/next/final step/phase/stage is/involves... - After this step...
- Once this stage is completed...
- Following this...
In sequences, you can also use the gerund to show development.

8/6/2019 Theory for WT 1
http://slidepdf.com/reader/full/theory-for-wt-1 13/15
- 13 -
Tenses and voice
Use the present simple to describe processes.
The agent is not usually mentioned unless a task is performed by a particular person.
Use the passive voice if the process is describing something being made, like a book, e.g.
the book is printed and then collated, after which it is bound.
Use the active voice when you describe something which is happening: The moisture
evaporates and condenses on the ...
Be very careful with singular and plural agreement in writing processes especially if you are
using the active voice.
When describing a cycle, you can conclude: The cycle then repeats itself/is then repeated.
Maps
• Follow the initial steps for analysing graphs and processes.
• If you are describing changes over a number of years, check the key carefully.
• Familiarize yourself with words showing location on the points of the compass: ... was
constructed in the north/northwest; constructed north/northwest of the city/to the
north/northwest of the city, etc.
• Be careful with time phrases and tenses. With in, use the past simple passive: The stadium
was constructed in the year 2000.
• With by, use the past perfect passive: The stadium had been constructed by the year 2000.
• Try to vary the structure of your sentences by putting the time phrase at the beginning and
the end of the sentence. The same apples to the locations.
Some useful words and expressions:
- in the centre of/next to/adjacent to
- built/erected/replaced
- situated/located
- changed into/added/gave way to/became/made way for/converted
- saw/witnessed considerable changes/developments
Use adverbs like moreover/in addition etc.
The use of while is common: while in 1995 ..., by the year 2005...

8/6/2019 Theory for WT 1
http://slidepdf.com/reader/full/theory-for-wt-1 14/15
- 14 -
Maps where you have to choose between proposed locations
o You are asked to choose which is the best location for a sports complex, etc.
o Describe where: It is proposed that the new ... will be built...
o Explain why this site is more suitable than one or the other.
o Describe the amenities which are nearby: ...because it will be next to/convenient for/ within
easy reach of/not far from... and ...
o Use comparison and contrast words.
Checking your writing efficiently
Check that you use formal words, e.g. approximately not roughly; improved not got better.
Check your spelling.
Check the tenses are correct.
Check singular/plural agreement, especially in processes.
Make sure you haven't written the word below in your introduction.
Make sure you answer all parts of the question and link the different charts to each other.
Avoid repetition. If you use the correct reference words and synonyms, this won't happen.
Check the beginnings of sentences and clauses in model answers. Practise using these.
Use a wide range of structures. It is easy to slip into writing sentences that just follow the
basic pattern of Subject/Verb/Object.
Use connecting words and form complex sentences, i.e. sentences with two or more clauses.
Describe general trends and support what you say with specific data from the chart.
Plan the steps you are going to take before you go in to the exam: analyse data; draw general
conclusions; order; state and then quote specific data.

8/6/2019 Theory for WT 1
http://slidepdf.com/reader/full/theory-for-wt-1 15/15
- 15 -
Useful Phrases for Graph Interpretation
Indicating Indicating Indicating No Change Indicating Degree
arise a fall to remain at the same level rapid
an improvement a drop to stay the same sudden
an increase a deterioration to remain stable substantialto rise a slide to remain constant significant
to improve a decrease slight
to reach a peak to fall gradually
to increase to drop considerably
to shoot a to decrease sharply
to recover to plunge rapidly
steadily
suddenly
Useful words and phrases when making comparisonsThis section has been included in the notes to help you with interpreting tables. It may also behelpful for task 2 writing. Look at these examples:
1 Although/whereas 60% of the population watch television in Canada, only 15% do in China.
2 Sixty percent of the population watch television in Canada, however/but only 15% do in
China.
3 Approximately 60% of the population watches television in Canada, Australia and the USA.
This is quite different in China where only 15% do.
4
Interestingly, only 30% of the population in countries like France and England enjoyreading. By contrast, in both Korea and China 60% enjoy this pastime.
5 On the one hand, France and England have similar pastimes whereas Korea and China do
on the other.
6 Similarities also exist between America and Australia where about 30% of the population
enjoy going to the beach.
7 There is a marked difference between England, on the one hand, where 20% of the population enjoy sleeping, and the other countries, where a mere 2-5% do.
8 As regards music, the USA is by far the highest at 23%.
9 With respect to sport, in the countries represented here, about 20 to 30% of the populationenjoys it.
The end The end The end The end