Embed Size (px)
Citation preview

Theoretical work on thewater monomer and dimer
Matt BarberJonathan TennysonUniversity College London
September 2009

Monomer line list
Extended to cover 800-20000 cm-1
Now uses HITRAN 2008 The HITRAN 2008 molecular spectroscopic database
Rothman, LS; Gordon, IE; Barbe, A, et al.JQSRT 110/9-10 pp533-572, 2009
Includes calculated line profile data
IUPAC group: Recommends not using Voigt profiles – introduce speed-dependent widths

Band intensities
Look at purely vibrational structure, ignoring rotation.
Can be calculated from line lists HITRAN, BT2, etc.
Model using dipole and potential surface. Calculate by allowing “forbidden” J=0 to 0
transition. Effects of dimer structure for changes in
intensities and shifts of band origins.

Experimental Band intensities
Need to go back to HITRAN 92 Not a particularly useful model Superceded by rovibrational modelling
However, can be calculated from newer databases
Makes a useful benchmark for ab initio models

Ab initio calculations
DVR software suite Go back to 1992 version for DIPJ0 program Requires transformation to Eckart co-ordinates
Start with monomer
Potential energy surface Spectroscopically determined potential energy surfaces of the (H2O)-O-16, (H2O)-O-
17, and (H2O)-O-18 isotopologues of water Shirin, SV; Polyansky, OL; Zobov, NF, et al.JOURNAL OF MOLECULAR SPECTROSCOPY 236/2, 2006
CVR Dipole surface A new ab initio ground-state dipole moment surface for the water molecule, Lodi, L;
Tolchenov, RN; Tennyson, J, et al.JOURNAL OF CHEMICAL PHYSICS 128/4, 2008

Integrated and calculated bands compared
1E-25
1E-24
1E-23
1E-22
1E-21
1E-20
1E-19
1E-18
1E-17
1E-16
0 1000 2000 3000 4000 5000 6000 7000 8000 9000 10000
Frequency / cm-1
Inte
nsi
ty /
HIT
RA
N u
nit
s
DVR HITRAN

Moving to the Dimer
New dimer dipole surface
One molecule in ground state, the other in excited state
Large r (100 a.u.) to compare with monomer
Apply correction from monomer
Move to equilibrium configuration (and others in due course)

Uncorrected band intensities
1E-26
1E-25
1E-24
1E-23
1E-22
1E-21
1E-20
1E-19
1E-18
1E-17
1E-16
0 1000 2000 3000 4000 5000 6000 7000 8000 9000 10000
Frequency / cm-1
Inte
nsi
ty /
HIT
RA
N u
nit
s (c
m m
ol-1
)
Monomer Acceptor(large-r) Donor (large-r)

Corrected Band Intensities at large r
1E-26
1E-25
1E-24
1E-23
1E-22
1E-21
1E-20
1E-19
1E-18
1E-17
1E-16
0 1000 2000 3000 4000 5000 6000 7000 8000 9000 10000
Frequency / cm-1
Inte
nsi
ty /
HIT
RA
N u
nit
s (c
m m
ol-1
)
Monomer Acceptor(large-r, corrected) Donor(large-r,corrected)
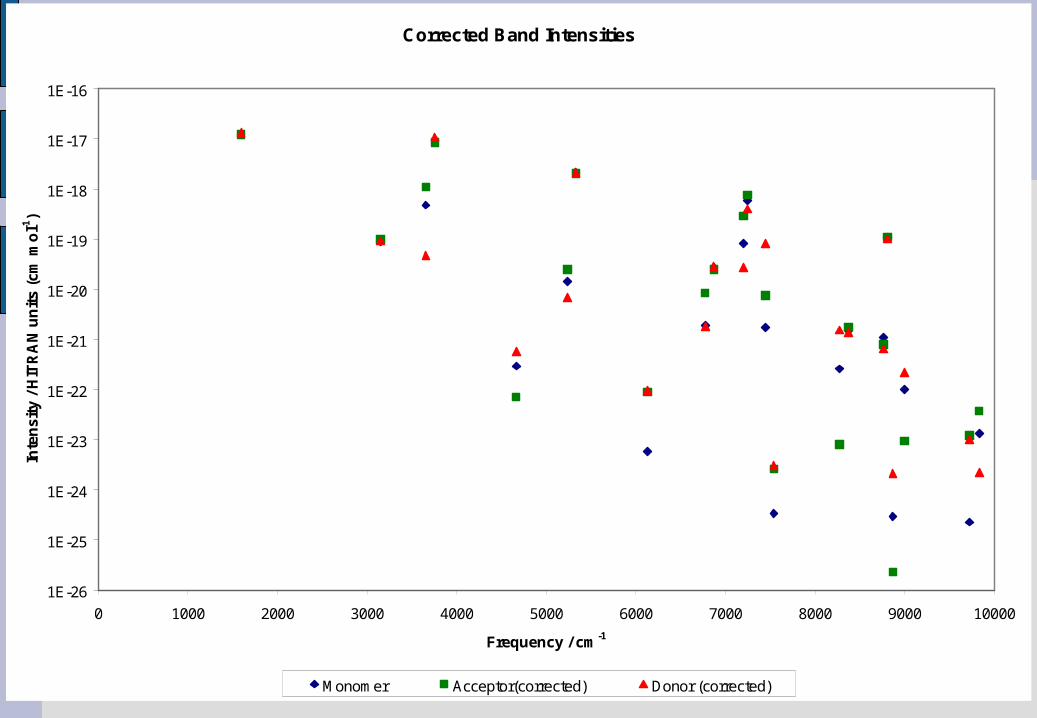
Corrected Band Intensities
1E-26
1E-25
1E-24
1E-23
1E-22
1E-21
1E-20
1E-19
1E-18
1E-17
1E-16
0 1000 2000 3000 4000 5000 6000 7000 8000 9000 10000
Frequency / cm-1
Inte
nsi
ty /
HIT
RA
N u
nit
s (c
m m
ol-1
)
Monomer Acceptor(corrected) Donor (corrected)

Band intensities to spectra
Band origins From Ross’s work
Band profiles Good approximation at low T More work needed at room temperature
What resolution is required?
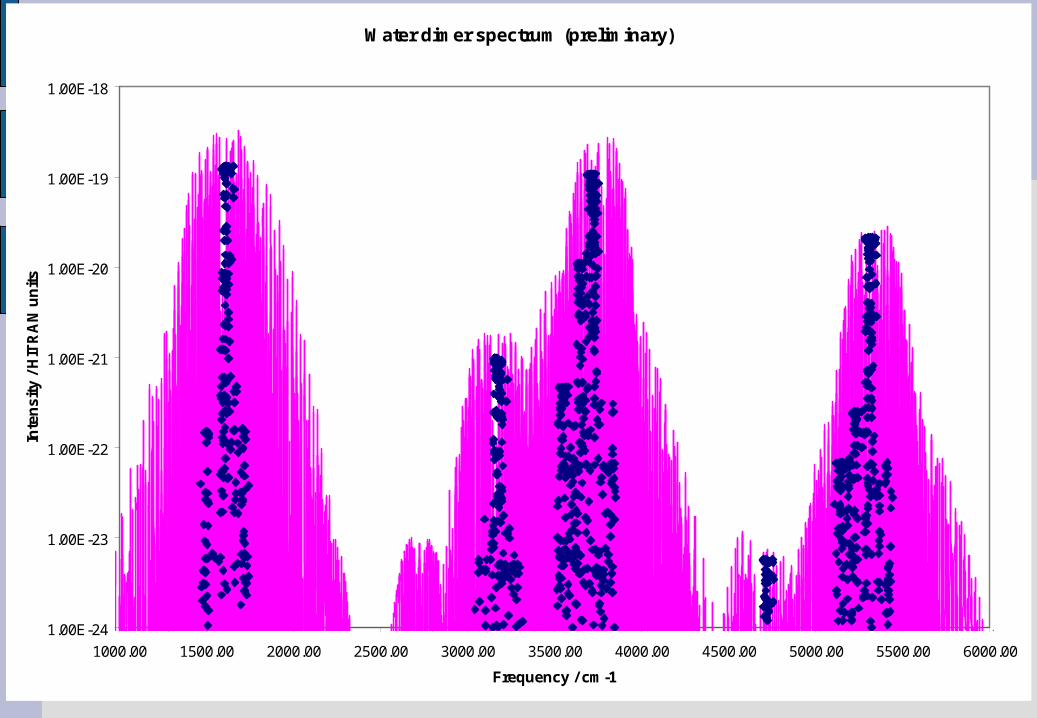
Water dimer spectrum (preliminary)
1.00E-24
1.00E-23
1.00E-22
1.00E-21
1.00E-20
1.00E-19
1.00E-18
1000.00 1500.00 2000.00 2500.00 3000.00 3500.00 4000.00 4500.00 5000.00 5500.00 6000.00
Frequency / cm-1
Inte
nsi
ty /
HIT
RA
N u
nit
s

Future plans
Adapt wavefunctions by adjusting the potential surface
Extend spectral region Greater than 10000 cm-1 requires more
computation, but possible
Regions for more careful analysis?