Embed Size (px)
Citation preview
Journal of Computations & Modelling, vol.3, no.1, 2013, 1-31 ISSN: 1792-7625 (print), 1792-8850 (online) Scienpress Ltd, 2013
Theoretical study on the behaviour of rectangular
concrete beams reinforced internally with GFRP
reinforcements under pure torsion
A. Prabaghar1 and G. Kumaran2
Abstract
Theoretical Modelling of rectangular concrete beams reinforced internally with
Glass Fibre Reinforced Polymer (GFRP) reinforcements under pure torsion is
carried out in this study. Different parameters like grade of concrete, beam
longitudinal reinforcement ratio and transverse stirrups spacing are considered.
The basic strength properties of concrete, steel and GFRP reinforcements are
determined experimentally. Theoretical torque verses twist relationship is
established for various values of torque and twist using elastic, plastic theories of
torsion. Finally the ultimate torque is determined using space truss analogy and
softening truss model for different parameters and based on this study, a good
agreement is made between the theoretical behaviour GFRP reinforced and
conventionally reinforced beams.
Keywords: pure torsion, beam, GFRP reinforcements, steel, theoretical model
1 Annamalai University, India, e-mail: [email protected] 2 Annamalai University, India, e-mail: [email protected] Article Info: Received : December 22, 2012. Revised : January 29, 2013 Published online : March 31, 2013
2 Study on the behaviour of rectangular concrete beams reinforced…
1 Introduction Fibre Reinforced Polymer (FRP) materials are becoming a new age
material for concrete structures. Its use has been recommended in ACI codes. But
in India its applicability is rare in view of the few manufacturers and lacking in
commercial viability. The advantages of the FRP materials lie in their better
structural performance especially in aggressive environmental conditions in terms
of strength and durability (Machida 1993; ACI 440R-96 1996; Nanni 1993). FRP
materials are commercially available in the form of cables, sheets, plates etc. But
in the recent times FRPs are available in the form of bars which are manufactured
by pultrusion process which are used as internal reinforcements as an alternate to
the conventional steel reinforcements. These FRP bars are manufactured with
different surface imperfections to develop good bond between the bar and the
surrounding concrete. Fibre reinforcements are well recognised as a vital
constituent of the modern concrete structures. FRP reinforcements are now being
used in increasing numbers all over the world, including India. FRP
reinforcements are preferred by structural designers for the construction of
seawalls, industrial roof decks, base pads for electrical and reactor equipment and
concrete floor slabs in aggressive chemical environments owing to their durable
properties.
Due to the advantages of FRP reinforcements in mind, many research
works have been carried out throughout the world on the use of FRP reinforcing
bars in the structural concrete flexural elements like slabs, beams, etc. (Nawy et al
1997; Faza and GangaRao 1992; Benmokrane 1995; Sivagamasundari 2008;
Deiveegan et al 2011; Saravanan et al 2011). Therefore the present study
discusses mainly on the behaviour of beams reinforced internally with GFRP
reinforcements under pure torsion. The scope of the present study is restricted to
with the GFRP reinforcements because of their availability in India. First part of
this study covers the theoretical analysis based on the existing using space truss
formulation for conventionally reinforced and GFRP reinforced beams. Second
A. Prabaghar and G. Kumaran 3
part of this study is related to the theoretical formulation using softened truss
model for steel and GFRP reinforced beams. Finally, the results are summarised
based on the theoretical analysis and with the existing theories.
2 Materials
2.1 Concrete
Normal Strength Concrete (NSC) of grades M20 and M30 are used in this
study. Ordinary Portland Cement is used to prepare the concrete. The maximum
size of aggregate used is 20 mm and the size of fine aggregate ranges between 0
and 4.75 mm. After casting, the specimens are allowed to cure in real
environmental conditions for about 28 days so as to attain strength. The test
specimens are generally tested after a curing period of 28 days.
Table 1: Properties of Concrete
Description M 20 grade
(m1) M 30 grade
(m2)
Ratio 1:1.75:3.75 1:1.45:2.85
W/C Ratio 0.53 0.45
Average Compressive Strength of cubes 32.25 MPa 44.14 MPa
The strength of concrete under uni-axial compression is determined by loading
‘standard test cubes’ (150 mm size) to failure in a compression testing machine, as
per IS 516 - 1959. The modulus of elasticity of concrete is determined by loading
‘standard cylinders’ (150 mm diameter and 200 mm long) to failure in a
compression testing machine, as per IS 516: 1959. The mix proportions of the
4 Study on the behaviour of rectangular concrete beams reinforced…
NSC are carried out as per Indian Standards (IS) 10262-1982 and the average
compressive strengths are obtained from laboratory tests (Sivagamasundari 2008;
Deiveegan et al 2011; Saravanan et al 2011) and are depicted in Table 1.
2.2 Reinforcements
The mechanical properties of all the types of GFRP reinforcements as per
ASTM-D 3916-84 Standards and steel specimens as per Indian standards are
obtained from laboratory tests and the results are tabulated in Table 2. The tensile
strength of steel reinforcements (S) used in this study, conforming to Indian
standards and having an average value of the yield strength of steel is considered
for this study. GFRP reinforcements used in this study are manufactured by
pultrusion process with the E-glass fibre volume approximately 60% and these
fibres are reinforced with epoxy resins. Previous studies were carried out with
three different types of GFRP reinforcements (grooved, sand sprinkled &
threaded) (ACI 440R-96; Sivagamasundari 2008; Deiveegan et al 2011;
Saravanan et al 2011) with different surface indentations and are designated as Fg,
Fs and Ft. In this study threaded type GFRP reinforcement is used in place of
conventional steel. The diameters of the longitudinal and transverse
reinforcements are 12 mm and 8 mm respectively. The standard minimum
diameters of the reinforcements as per Indian standards are adopted in this study.
The tensile strength properties are ascertained as per ACI standards shown in
Table 1(b) and are validated by conducting the tensile tests at SERC, Chennai.
The GFRP reinforcements are provided with end grips to avoid the crushing of
ends. The typical failure pattern of the GFRP reinforcement is shown in Figure 1.
The stress-strain curve of the reinforcements used in the study are obtained from
the experimental study is shown clearly in Figure 2. The compressive modulus of
elasticity of GFRP reinforcing bars is smaller than its tensile modulus of elasticity
(ACI 440R-96; Lawrence C. Bank 2006; Sivagamasundari 2008). It varies
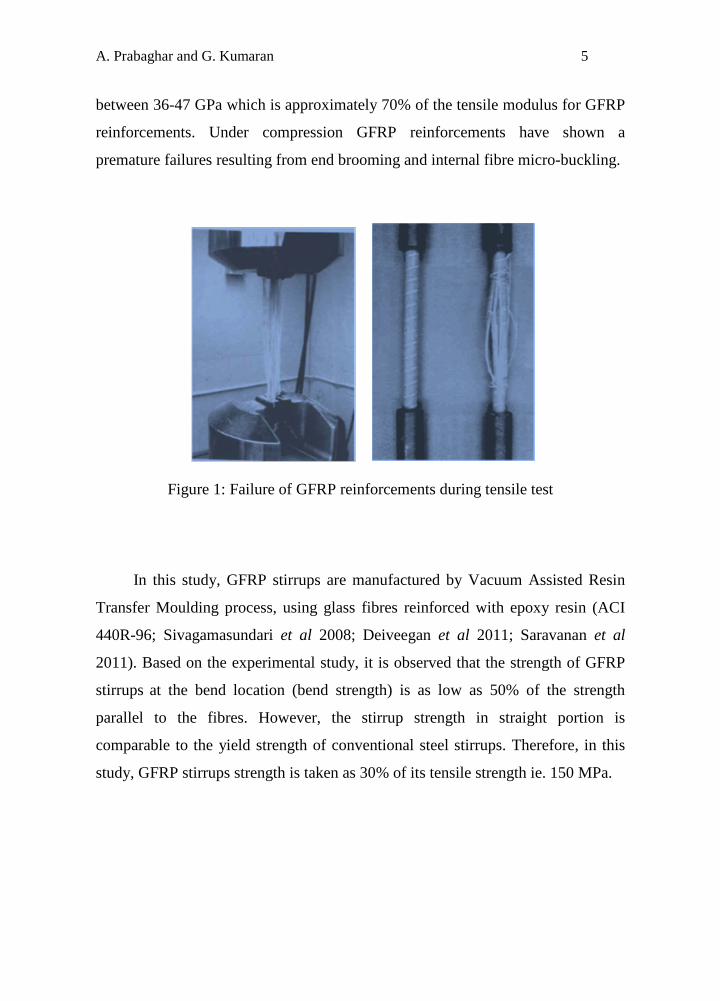
A. Prabaghar and G. Kumaran 5
between 36-47 GPa which is approximately 70% of the tensile modulus for GFRP
reinforcements. Under compression GFRP reinforcements have shown a
premature failures resulting from end brooming and internal fibre micro-buckling.
Figure 1: Failure of GFRP reinforcements during tensile test
In this study, GFRP stirrups are manufactured by Vacuum Assisted Resin
Transfer Moulding process, using glass fibres reinforced with epoxy resin (ACI
440R-96; Sivagamasundari et al 2008; Deiveegan et al 2011; Saravanan et al
2011). Based on the experimental study, it is observed that the strength of GFRP
stirrups at the bend location (bend strength) is as low as 50% of the strength
parallel to the fibres. However, the stirrup strength in straight portion is
comparable to the yield strength of conventional steel stirrups. Therefore, in this
study, GFRP stirrups strength is taken as 30% of its tensile strength ie. 150 MPa.
6 Study on the behaviour of rectangular concrete beams reinforced…
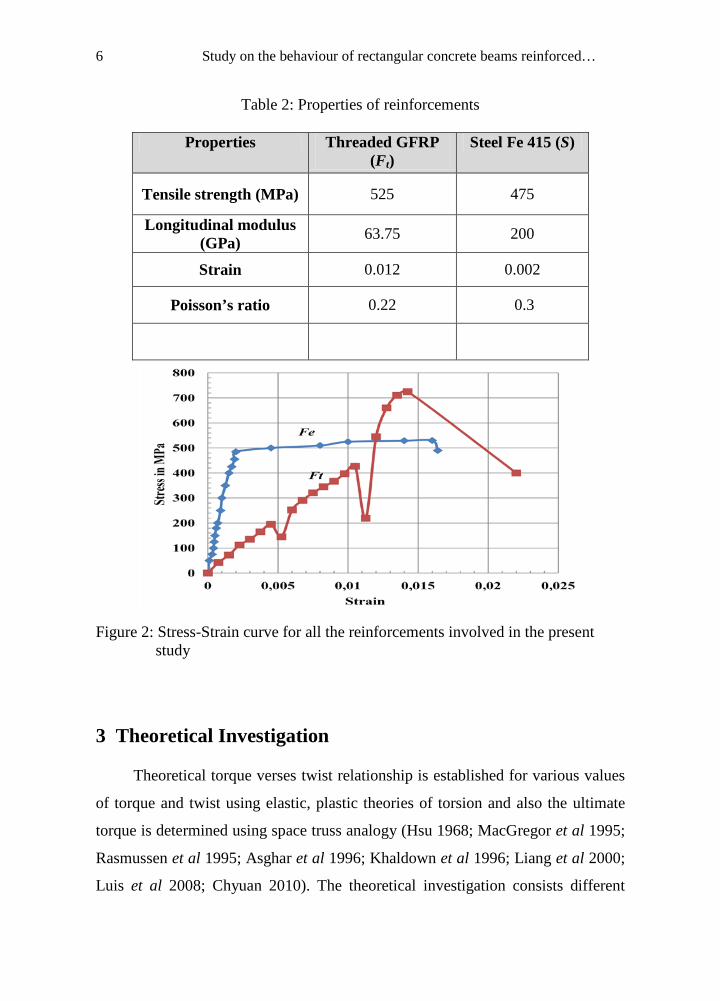
Table 2: Properties of reinforcements
Properties Threaded GFRP (Ft)
Steel Fe 415 (S)
Tensile strength (MPa) 525 475
Longitudinal modulus (GPa) 63.75 200
Strain 0.012 0.002
Poisson’s ratio 0.22 0.3
Figure 2: Stress-Strain curve for all the reinforcements involved in the present study 3 Theoretical Investigation
Theoretical torque verses twist relationship is established for various values
of torque and twist using elastic, plastic theories of torsion and also the ultimate
torque is determined using space truss analogy (Hsu 1968; MacGregor et al 1995;
Rasmussen et al 1995; Asghar et al 1996; Khaldown et al 1996; Liang et al 2000;
Luis et al 2008; Chyuan 2010). The theoretical investigation consists different
A. Prabaghar and G. Kumaran 7
rectangular beams and are designated are as follows; Bp1m1Fe s1 ; Bp1m1Ft s1;
Bp1m2Fe s1; Bp1m2Ft s1; Bp2m1Fe s1; Bp2m1Ft s1; Bp2m2Fe s1 ; Bp2m2Ft s1, Bp1m1Fe
s1 ; Bp1m1Ft s1; Bp1m2Fe s1; Bp1m2Ft s1; Bp2m1Fe s1; Bp2m1Ft s1; Bp2m2Fe s1 ;
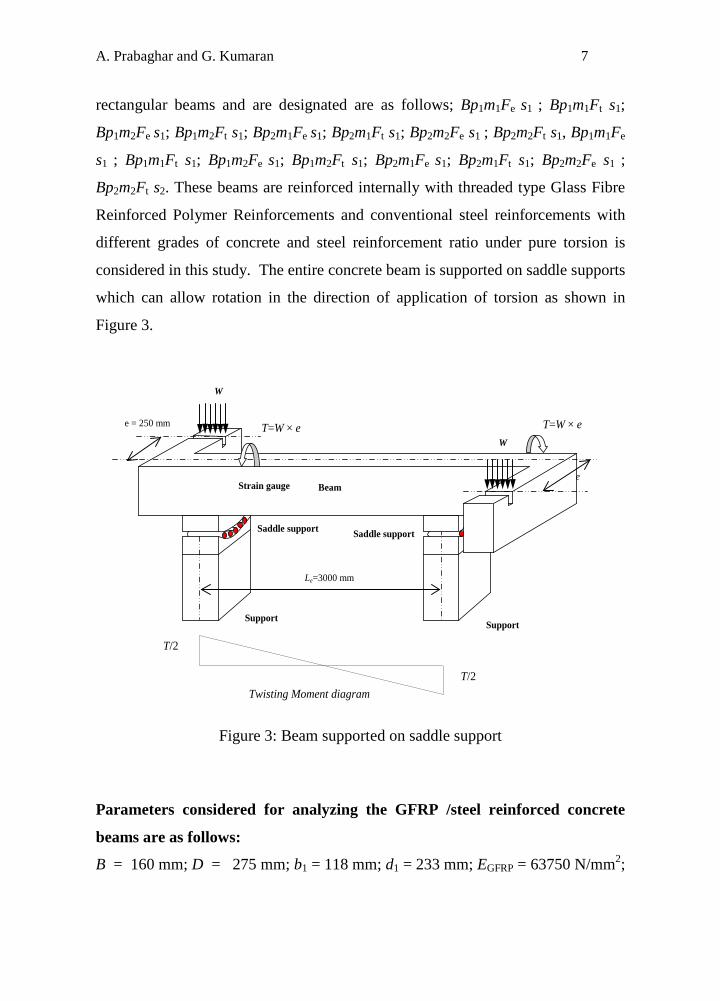
Bp2m2Ft s2. These beams are reinforced internally with threaded type Glass Fibre
Reinforced Polymer Reinforcements and conventional steel reinforcements with
different grades of concrete and steel reinforcement ratio under pure torsion is
considered in this study. The entire concrete beam is supported on saddle supports
which can allow rotation in the direction of application of torsion as shown in
Figure 3.
Le=3000 mm
e
W
W
e = 250 mm
Support
Saddle support
Beam
Support
Saddle support
Strain gauge
T/2
T=W × e
T=W × e
T/2
Twisting Moment diagram
Figure 3: Beam supported on saddle support
Parameters considered for analyzing the GFRP /steel reinforced concrete
beams are as follows:
B = 160 mm; D = 275 mm; b1 = 118 mm; d1 = 233 mm; EGFRP = 63750 N/mm2;
8 Study on the behaviour of rectangular concrete beams reinforced…
m1 = 32.25 MPa; m2 = 44.14 MPa; Ec1= ckf5000 = 25.325000 = 29395
N/mm2; Ec1= ckf5000 = 14.445000 = 33219 N/mm2; Al = 113×6= 678.24
mm2; At = 2× 50.3 = 100.6 mm2; fGFRP =525 MPa; fGFRP-S =150 MPa; S1 = 75 mm;
S2 = 50 mm. In the figures the curves to be read as,Exp - Experimental curve; Th-
space = Theoretical- space truss analogy and Th-soft = Theoretical- softened truss
model. Table 3 shows the various parameters involved in the present study.
Table 3: Various Parameters involved
Parameters Description Designation
Types of reinforcements
Threaded GFRP Ft Conventional Fe
Concrete grade Two grades of concrete m1 & m2 Beam size 160 x 275 mm B
Reinforcement ratios
1. 0.56% (2-12 mm bars top & Bottom) 2. 0.85% (3-12 mm bars top & Bottom)
p1 & p2
Spacing of stirrups 75 mm & 50 mm S1 & S2
3.1 Space Truss Analogy
The general theoretical torque twist curve T–θ curves are plotted for three
stages and are defined by their (θ ;T) coordinates (Hsu 1968; Collins 1973). These
coordinates are shown in Figure 4.
Stage 1 represents the beam’s behaviour before cracking. The slope of the
curve represents the elastic St. Venant stiffness (GC)I). In this stage the curve can
be assumed as a straight line with origin in the point (0;0) and end in ( elθ ;Tel). The
theoretical model considered in this study for this stage is based on Theory of
Elasticity.
A. Prabaghar and G. Kumaran 9
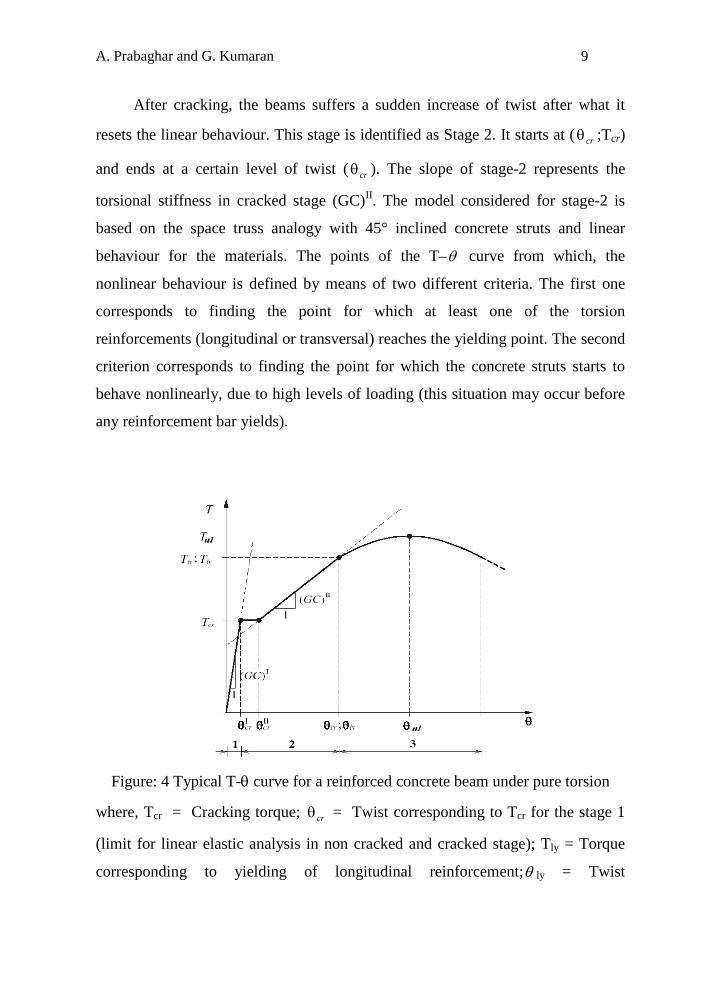
After cracking, the beams suffers a sudden increase of twist after what it
resets the linear behaviour. This stage is identified as Stage 2. It starts at ( crθ ;Tcr)
and ends at a certain level of twist ( crθ ). The slope of stage-2 represents the
torsional stiffness in cracked stage (GC)II. The model considered for stage-2 is
based on the space truss analogy with 45° inclined concrete struts and linear
behaviour for the materials. The points of the T–θ curve from which, the
nonlinear behaviour is defined by means of two different criteria. The first one
corresponds to finding the point for which at least one of the torsion
reinforcements (longitudinal or transversal) reaches the yielding point. The second
criterion corresponds to finding the point for which the concrete struts starts to
behave nonlinearly, due to high levels of loading (this situation may occur before
any reinforcement bar yields).
Figure: 4 Typical T-θ curve for a reinforced concrete beam under pure torsion
where, Tcr = Cracking torque; crθ = Twist corresponding to Tcr for the stage 1
(limit for linear elastic analysis in non cracked and cracked stage); Tly = Torque
corresponding to yielding of longitudinal reinforcement;θ ly = Twist
10 Study on the behaviour of rectangular concrete beams reinforced…
corresponding to Tly; Tty = Torque corresponding to yielding of transversal
reinforcement;θ ty = Twist corresponding to Tty; Tul = Ultimate (maximum)
torque;θ ul = Maximum twist at beam’s failure. (GC)I = Torsional stiffness of
Zone 1 (for linear elastic analysis in non cracked stage); (GC)II = Torsional
stiffness of Zone 2 (for linear elastic analysis in cracked stage). The linear elastic
torque is clearly depicted in Figure 5.
Stage 3 of the curve was plotted with non linear behaviour of the materials
and considering the Softening Effect. In this study, space truss analogy is used to
the locate the following coordinates ( tyθ ;Tty) & ( ulθ ;Tul). The space truss model
with softening effect is not considered since it involves iterative procedure. The
three stages are identified in the T–θ curve of Figure 4 are characterized
separately.
Stage: 1 Linear Elastic Torque (Tel, elθ ):
For rectangular sections using St. Venant theory, the maximum torsional shear
stress occurs at the middle of the wider face (Hsu 1968), and has a value given by
DbT
t 2max, α=τ (1)
where T is the twisting moment (torque), b (160 mm) and D (275 mm) are the
cross-sectional dimensions (b being smaller), and α is a St. Venant coefficient
whose value depends on the D/b ratio; α lies in the range 0.21 to 0.29 for D/b
varying from 1.0 to 5.0 respectively. Therefore α=0.2243; max,tτ (MPa units) of
about ckf2.0
Elastic torque is given by
max,2 tel DbT τ×α= (2)
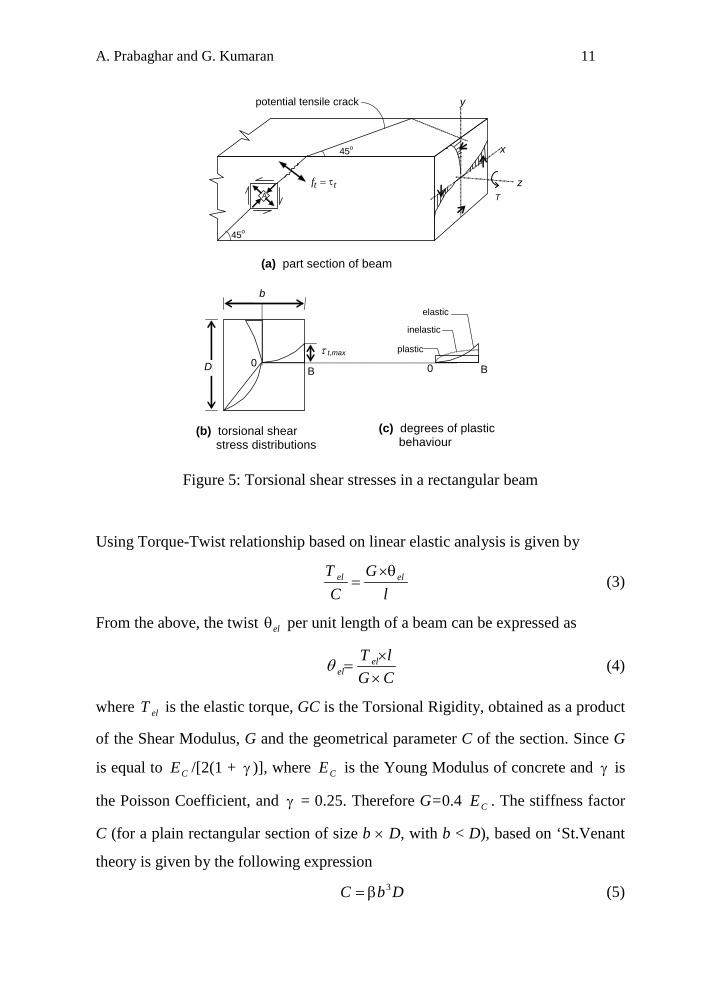
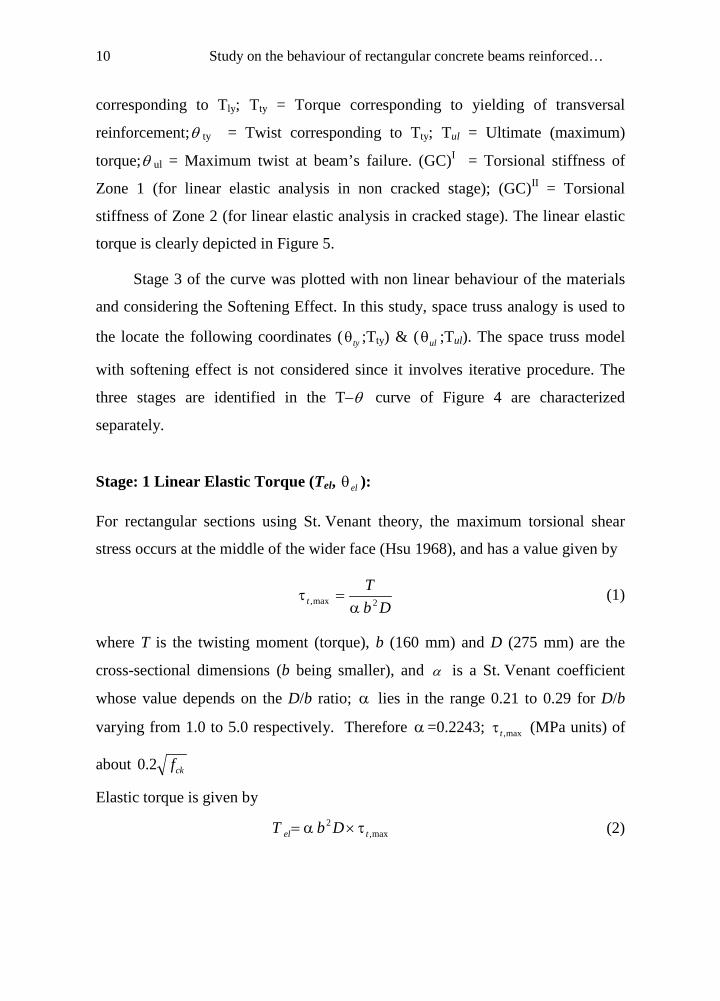
A. Prabaghar and G. Kumaran 11
(a) part section of beam
(b) torsional shear stress distributions
(c) degrees of plastic behaviour
potential tensile crack
45o
45o
ft t= τ
b
D 0 B B 0
elastic
inelastic plastic
y
z
x
T A
τ t,max
Figure 5: Torsional shear stresses in a rectangular beam
Using Torque-Twist relationship based on linear elastic analysis is given by
l
GC
T elel θ×= (3)
From the above, the twist elθ per unit length of a beam can be expressed as
CGlT el
el ××
=θ (4)
where elT is the elastic torque, GC is the Torsional Rigidity, obtained as a product
of the Shear Modulus, G and the geometrical parameter C of the section. Since G
is equal to CE /[2(1 + γ )], where CE is the Young Modulus of concrete and γ is
the Poisson Coefficient, and γ = 0.25. Therefore G=0.4 CE . The stiffness factor
C (for a plain rectangular section of size b × D, with b < D), based on ‘St.Venant
theory is given by the following expression
DbC 3β= (5)
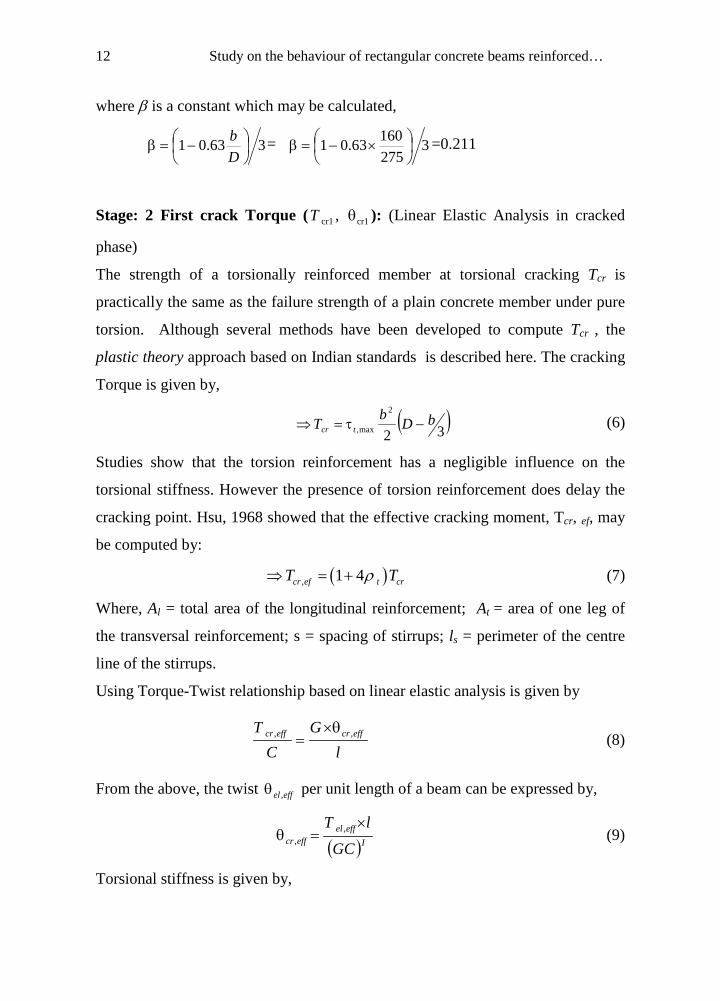
12 Study on the behaviour of rectangular concrete beams reinforced…
where β is a constant which may be calculated,
363.01
−=β
Db = 3
27516063.01
×−=β =0.211
Stage: 2 First crack Torque ( cr1T , cr1θ ): (Linear Elastic Analysis in cracked
phase)
The strength of a torsionally reinforced member at torsional cracking Tcr is
practically the same as the failure strength of a plain concrete member under pure
torsion. Although several methods have been developed to compute Tcr , the
plastic theory approach based on Indian standards is described here. The cracking
Torque is given by,
( )32
2
max,bDbT tcr −τ=⇒ (6)
Studies show that the torsion reinforcement has a negligible influence on the
torsional stiffness. However the presence of torsion reinforcement does delay the
cracking point. Hsu, 1968 showed that the effective cracking moment, Tcr, ef, may
be computed by:
( ), 1 4cr ef t crT Tρ⇒ = + (7)
Where, Al = total area of the longitudinal reinforcement; At = area of one leg of
the transversal reinforcement; s = spacing of stirrups; ls = perimeter of the centre
line of the stirrups.
Using Torque-Twist relationship based on linear elastic analysis is given by
l
GC
T effcreffcr ,, θ×= (8)
From the above, the twist effel ,θ per unit length of a beam can be expressed by,
( )I
effeleffcr GC
lT ×=θ ,
, (9)
Torsional stiffness is given by,
A. Prabaghar and G. Kumaran 13
IGC)( = ItK = C50004.0 ×× cuf (10)
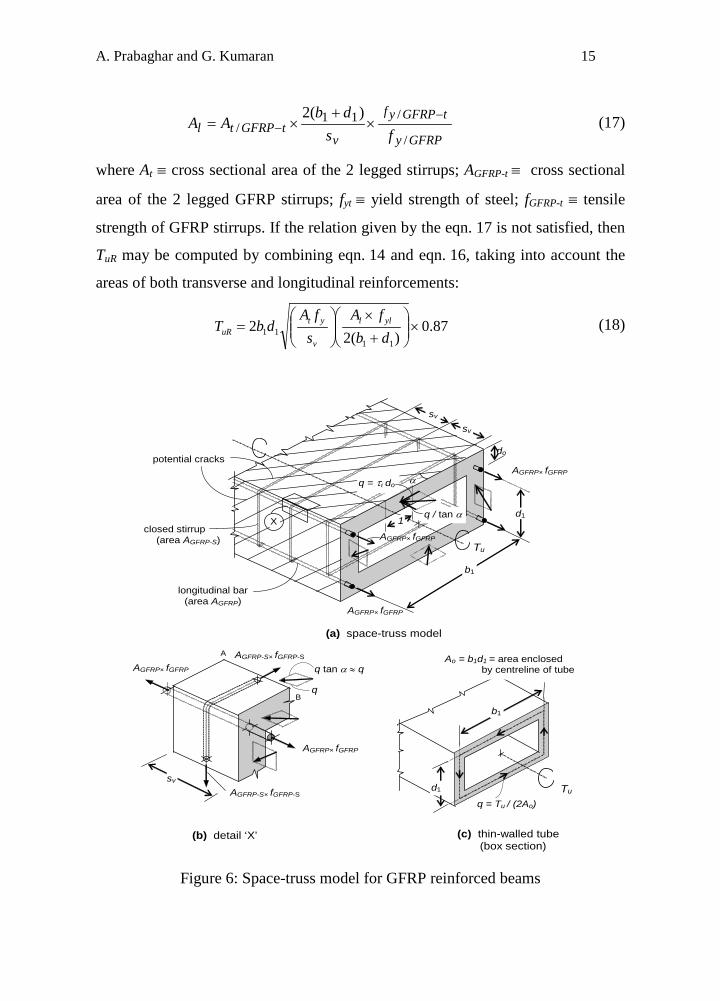
Stage: 3 Ultimate Torque (Tul, ulθ ):
The use of the thin-walled tube analogy (or) space truss analogy the shear stresses
are treated as constant over a finite thickness t around the periphery of the
member, allowing the beam to be represented by an equivalent hollow beam of
uniform thickness. Within the walls of the tube, torque is resisted by the shear
flow q, which has units of force per unit length. In the analogy, q is treated as a
constant around the perimeter of the tube. To predict the cracking behaviour, the
concrete tube may be idealized through the special truss analogy proposed by
Rausch. The space truss analogy is essentially an extension of the plane truss
analogy used to explain flexural shear resistance. The ‘space-truss model’ is an
idealisation of the effective portion of the beam, comprising the longitudinal and
transverse torsional reinforcement and the surrounding layer of concrete. It is this
‘thin-walled tube’ which becomes fully effective at the post-torsional cracking
phase. The truss is made up of the corner longitudinal bars as stringers, the closed
stirrup legs as transverse ties, and the concrete between diagonal cracks as
compression diagonals. Assuming torsional cracks (under pure torsion) at 45o to
the longitudinal axis of the beam and considering equilibrium of forces normal to
section AB. It is this ‘thin-walled tube’ which becomes fully effective at the post-
torsional cracking phase. The truss is made up of the corner longitudinal bars as
stringers, the closed stirrup legs as transverse ties, and the concrete between
diagonal cracks as compression diagonals (Unnikrishna pillai and Devdoss Menon
2003).
110 22 dbT
AT
q uu == (11)
11dbAo = (12)
where Ao is the area enclosed by the centre line of the thickness; b1 and d1 denote
the centre-to-centre distances between the corner bars in the directions of the
14 Study on the behaviour of rectangular concrete beams reinforced…
width and the depth respectively Assuming torsional cracks (under pure torsion) at
45o to the longitudinal axis of the beam, and considering equilibrium of forces
normal to section, the total force in each stirrup is given by qsv tan 45o = qsv
where sv is the spacing of the (vertical) stirrups. Further, assuming that the stirrup
has yielded in tension at the ultimate limit state or (Design stress = φ fy ; φ =
partial safety factor for steel=0.87; fy = yield strength of steel; Design stress for
GFRP reinforcements = φ fGFRP ; φ = strength reduction factor for GFRP
reinforcements = 0.80; fGFRP tensile strength of GFRP reinforcements); it follows
from force equilibrium that
vGFRPyt qsfA =) ( /φ (13)
where At is the cross-sectional area of the stirrup (equal to Asv /2 for two legged
stirrups). Substituting eqn. 12 & 13 in eqn. 11, the following expression is
obtained for the ultimate strength Tu = TuR in torsion:
vGFRPytuR sfdbAT ) (2 /11 φ= (14)
Further, assuming that the longitudinal steel (symmetrically placed with respect to
the beam axis) has also yielded at the ultimate limit state, it follows from
longitudinal force equilibrium that (Figure 6):
)(245tan
) ( 11/ dbqfAoGFRPyl +×=φ (15)
where Al ≡ the total area of the longitudinal steel/GFRP reinforcements and fyl
yield strength of steel; fGFRP tensile strength of GFRP reinforcements. Substituting
eqn. 11 in 15, the following expression is obtained for the ultimate strength Tu =
TuR in torsion:
)() ( 11/11 dbfdbAT GFRPyluR += φ (16)
The two alternative expressions for TuR viz. eqn. 14 and eqn. 16, will give
identical results only if the following relation between the areas of longitudinal
steel and transverse steel (as torsional reinforcement) is satisfied:
A. Prabaghar and G. Kumaran 15
GFRPy
tGFRPyf
vtGFRPtl fs
dbAA
/
/11/
)(2 −− ×
+×= (17)
where At ≡ cross sectional area of the 2 legged stirrups; AGFRP-t ≡ cross sectional
area of the 2 legged GFRP stirrups; fyt ≡ yield strength of steel; fGFRP-t ≡ tensile
strength of GFRP stirrups. If the relation given by the eqn. 17 is not satisfied, then
TuR may be computed by combining eqn. 14 and eqn. 16, taking into account the
areas of both transverse and longitudinal reinforcements:
87.0)(2
211
11 ×
+×
=
dbfA
sfA
dbT yll
v
ytuR (18)
sv
d1
AGFRP× fGFRP
do
b1
Tu
A
B
(a) space-truss model
(b) detail ‘X’ (c) thin-walled tube (box section)
potential cracks
X
q = τt do
1
α
q / tan α
sv
longitudinal bar (area AGFRP)
closed stirrup (area AGFRP-S)
sv
q
q tan α ≈ q
Tu
b1
d1 q = Tu / (2Ao)
Ao = b1d1 = area enclosed by centreline of tube
AGFRP× fGFRP
AGFRP-S× fGFRP-S
AGFRP-S× fGFRP-S AGFRP× fGFRP
AGFRP× fGFRP
AGFRP× fGFRP
Figure 6: Space-truss model for GFRP reinforced beams
16 Study on the behaviour of rectangular concrete beams reinforced…
To ensure that the member does not fail suddenly in a brittle manner after the
development of torsional cracks, the torsional strength of the cracked reinforced
section must be at least equal to the cracking torque Tcr (computed without
considering any safety factor). The ultimate torque Tul may be computed by
considering the contributions of both transverse and longitudinal reinforcements:
φ×
+×
=
)(22
11
////11 db
fAs
fAdbT GFRPGFRP
v
GFRPyGFRPtul (19)
To predict the cracking behaviour, the concrete tube may be idealized through the
spaces truss analogy proposed by Rausch in 1929. Based on Hsu, the following
equation for the torsional stiffness (GC)II of rectangular sections:
ρ
+ρ
++
+=
tl
sII
DdbmBDdb
BDdbEGC11
)(2)(
)(
11
211
21
21 (20)
Transverse GFRP reinforcement alone:
Considering shear –torsion interaction with Vu=0, which corresponds to space
truss formulation, considering the contribution of the transverse reinforcement
alone,
vtGFRPtty sfdbAT )(11 −= (21)
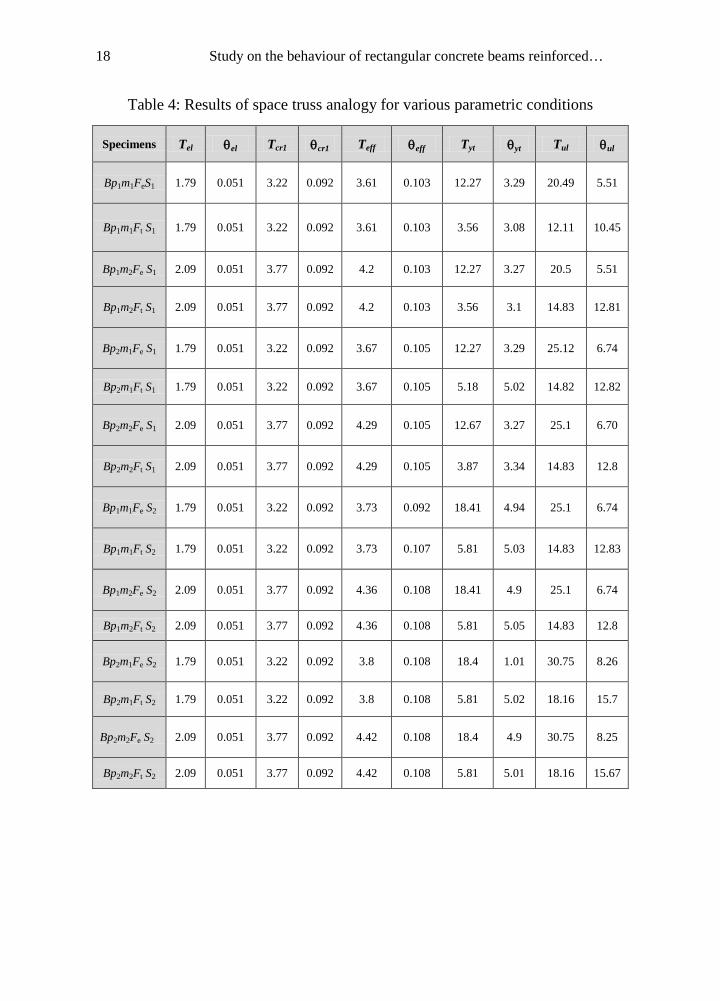
The values obtained from the space truss analogy for various parameters for the
conventionally reinforced and GFRP reinforced specimens are shown in Table 4.
3.2 Softened Truss Model
The softening truss model, developed by Hsu & Mo (1985), is similar to the
space truss model described above, except that it utilizes the full concrete cross
section and takes the softening of the concrete into consideration. The softening of
A. Prabaghar and G. Kumaran 17
concrete is based on an assumed effective transverse compressive stress
component, which is used to predict the torsional behaviour of reinforced
concrete. The model was developed according to the fundamental principles of the
mechanics of materials, stress equilibrium, strain compatibility, and the
constitutive law of materials. In this model, the constitutive law of materials is
given in terms of the stress-strain curve of the softened concrete shown in Figure
7.
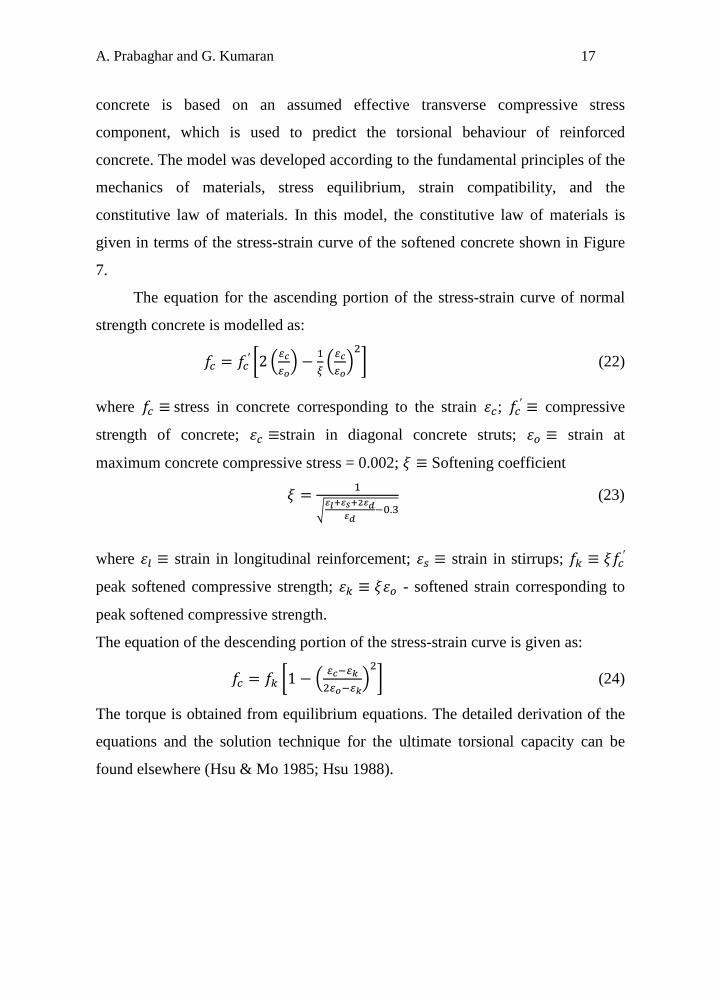
The equation for the ascending portion of the stress-strain curve of normal
strength concrete is modelled as:
𝑓𝑐 = 𝑓𝑐′ �2 �𝜀𝑐𝜀𝑜� − 1
𝜉�𝜀𝑐𝜀𝑜�2� (22)
where 𝑓𝑐 ≡ stress in concrete corresponding to the strain 𝜀𝑐; 𝑓𝑐′ ≡ compressive
strength of concrete; 𝜀𝑐 ≡strain in diagonal concrete struts; 𝜀𝑜 ≡ strain at
maximum concrete compressive stress = 0.002; 𝜉 ≡ Softening coefficient
𝜉 = 1
�𝜀𝑙+𝜀𝑠+2𝜀𝑑
𝜀𝑑−0.3
(23)
where 𝜀𝑙 ≡ strain in longitudinal reinforcement; 𝜀𝑠 ≡ strain in stirrups; 𝑓𝑘 ≡ 𝜉𝑓𝑐′
peak softened compressive strength; 𝜀𝑘 ≡ 𝜉𝜀𝑜 - softened strain corresponding to
peak softened compressive strength.
The equation of the descending portion of the stress-strain curve is given as:
𝑓𝑐 = 𝑓𝑘 �1 − � 𝜀𝑐−𝜀𝑘2𝜀𝑜−𝜀𝑘
�2� (24)
The torque is obtained from equilibrium equations. The detailed derivation of the
equations and the solution technique for the ultimate torsional capacity can be
found elsewhere (Hsu & Mo 1985; Hsu 1988).
18 Study on the behaviour of rectangular concrete beams reinforced…
Table 4: Results of space truss analogy for various parametric conditions
Specimens Tel θel Tcr1 θcr1 Teff θeff Tyt θyt Tul θul
Bp1m1FeS1 1.79 0.051 3.22 0.092 3.61 0.103 12.27 3.29 20.49 5.51
Bp1m1Ft S1 1.79 0.051 3.22 0.092 3.61 0.103 3.56 3.08 12.11 10.45
Bp1m2Fe S1 2.09 0.051 3.77 0.092 4.2 0.103 12.27 3.27 20.5 5.51
Bp1m2Ft S1 2.09 0.051 3.77 0.092 4.2 0.103 3.56 3.1 14.83 12.81
Bp2m1Fe S1 1.79 0.051 3.22 0.092 3.67 0.105 12.27 3.29 25.12 6.74
Bp2m1Ft S1 1.79 0.051 3.22 0.092 3.67 0.105 5.18 5.02 14.82 12.82
Bp2m2Fe S1 2.09 0.051 3.77 0.092 4.29 0.105 12.67 3.27 25.1 6.70
Bp2m2Ft S1 2.09 0.051 3.77 0.092 4.29 0.105 3.87 3.34 14.83 12.8
Bp1m1Fe S2 1.79 0.051 3.22 0.092 3.73 0.092 18.41 4.94 25.1 6.74
Bp1m1Ft S2 1.79 0.051 3.22 0.092 3.73 0.107 5.81 5.03 14.83 12.83
Bp1m2Fe S2 2.09 0.051 3.77 0.092 4.36 0.108 18.41 4.9 25.1 6.74
Bp1m2Ft S2 2.09 0.051 3.77 0.092 4.36 0.108 5.81 5.05 14.83 12.8
Bp2m1Fe S2 1.79 0.051 3.22 0.092 3.8 0.108 18.4 1.01 30.75 8.26
Bp2m1Ft S2 1.79 0.051 3.22 0.092 3.8 0.108 5.81 5.02 18.16 15.7
Bp2m2Fe S2 2.09 0.051 3.77 0.092 4.42 0.108 18.4 4.9 30.75 8.25
Bp2m2Ft S2 2.09 0.051 3.77 0.092 4.42 0.108 5.81 5.01 18.16 15.67
A. Prabaghar and G. Kumaran 19
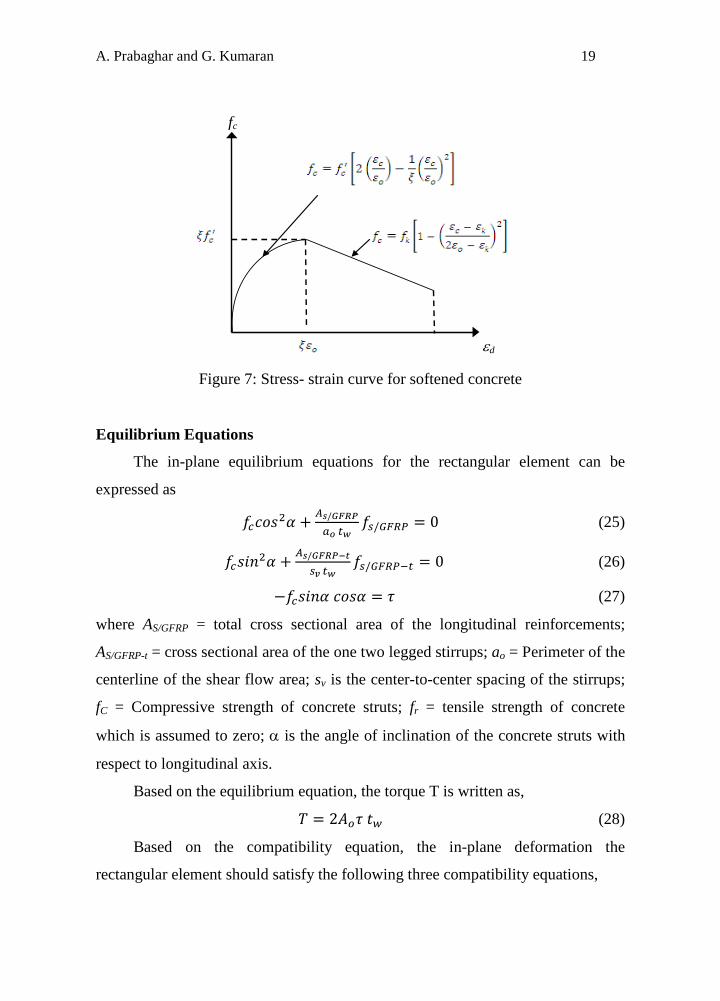
fc
εd
Figure 7: Stress- strain curve for softened concrete Equilibrium Equations
The in-plane equilibrium equations for the rectangular element can be
expressed as
𝑓𝑐𝑐𝑜𝑠2𝛼 + 𝐴𝑠/𝐺𝐹𝑅𝑃
𝑎𝑜 𝑡𝑤𝑓𝑠/𝐺𝐹𝑅𝑃 = 0 (25)
𝑓𝑐𝑠𝑖𝑛2𝛼 + 𝐴𝑠/𝐺𝐹𝑅𝑃−𝑡
𝑠𝑣 𝑡𝑤𝑓𝑠/𝐺𝐹𝑅𝑃−𝑡 = 0 (26)
−𝑓𝑐𝑠𝑖𝑛𝛼 𝑐𝑜𝑠𝛼 = 𝜏 (27)
where AS/GFRP = total cross sectional area of the longitudinal reinforcements;
AS/GFRP-t = cross sectional area of the one two legged stirrups; ao = Perimeter of the
centerline of the shear flow area; sv is the center-to-center spacing of the stirrups;
fC = Compressive strength of concrete struts; fr = tensile strength of concrete
which is assumed to zero; α is the angle of inclination of the concrete struts with
respect to longitudinal axis.
Based on the equilibrium equation, the torque T is written as,
𝑇 = 2𝐴𝑜𝜏 𝑡𝑤 (28)
Based on the compatibility equation, the in-plane deformation the
rectangular element should satisfy the following three compatibility equations,
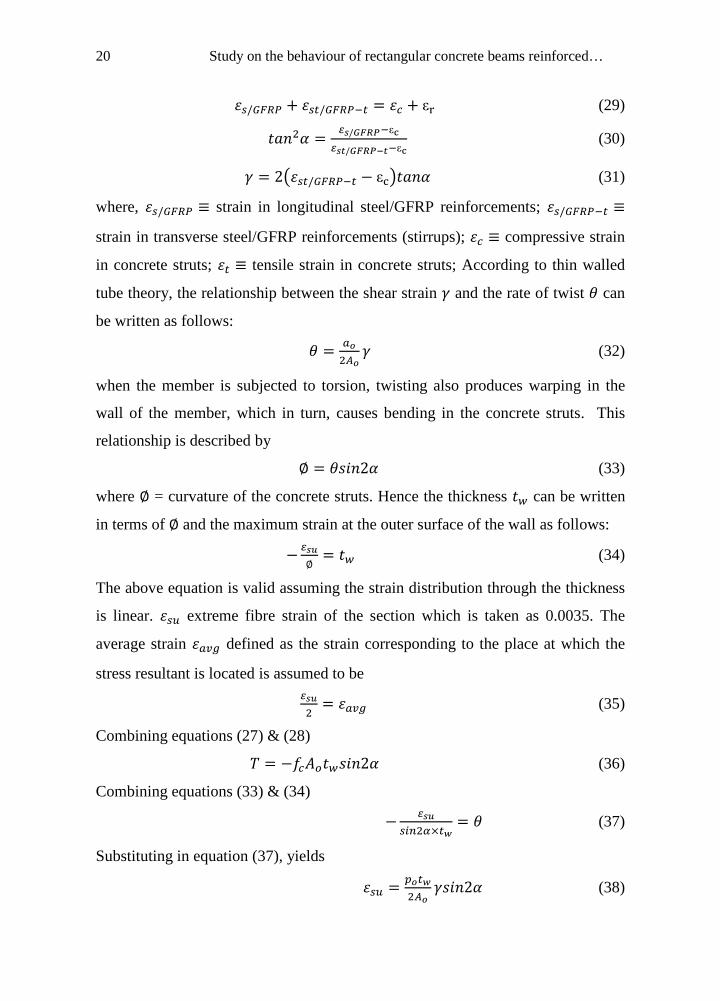
20 Study on the behaviour of rectangular concrete beams reinforced…
𝜀𝑠/𝐺𝐹𝑅𝑃 + 𝜀𝑠𝑡/𝐺𝐹𝑅𝑃−𝑡 = 𝜀𝑐 + εr (29)
𝑡𝑎𝑛2𝛼 = 𝜀𝑠/𝐺𝐹𝑅𝑃−εc𝜀𝑠𝑡/𝐺𝐹𝑅𝑃−𝑡−εc
(30)
𝛾 = 2�𝜀𝑠𝑡/𝐺𝐹𝑅𝑃−𝑡 − εc�𝑡𝑎𝑛𝛼 (31)
where, 𝜀𝑠/𝐺𝐹𝑅𝑃 ≡ strain in longitudinal steel/GFRP reinforcements; 𝜀𝑠/𝐺𝐹𝑅𝑃−𝑡 ≡
strain in transverse steel/GFRP reinforcements (stirrups); 𝜀𝑐 ≡ compressive strain
in concrete struts; 𝜀𝑡 ≡ tensile strain in concrete struts; According to thin walled
tube theory, the relationship between the shear strain 𝛾 and the rate of twist 𝜃 can
be written as follows:
𝜃 = 𝑎𝑜2𝐴𝑜
𝛾 (32)
when the member is subjected to torsion, twisting also produces warping in the
wall of the member, which in turn, causes bending in the concrete struts. This
relationship is described by
∅ = 𝜃𝑠𝑖𝑛2𝛼 (33)
where ∅ = curvature of the concrete struts. Hence the thickness 𝑡𝑤 can be written
in terms of ∅ and the maximum strain at the outer surface of the wall as follows:
−𝜀𝑠𝑢∅
= 𝑡𝑤 (34)
The above equation is valid assuming the strain distribution through the thickness
is linear. 𝜀𝑠𝑢 extreme fibre strain of the section which is taken as 0.0035. The
average strain 𝜀𝑎𝑣𝑔 defined as the strain corresponding to the place at which the
stress resultant is located is assumed to be 𝜀𝑠𝑢2
= 𝜀𝑎𝑣𝑔 (35)
Combining equations (27) & (28)
𝑇 = −𝑓𝑐𝐴𝑜𝑡𝑤𝑠𝑖𝑛2𝛼 (36)
Combining equations (33) & (34)
− 𝜀𝑠𝑢𝑠𝑖𝑛2𝛼×𝑡𝑤
= 𝜃 (37)
Substituting in equation (37), yields
𝜀𝑠𝑢 = 𝑝𝑜𝑡𝑤2𝐴𝑜
𝛾𝑠𝑖𝑛2𝛼 (38)
A. Prabaghar and G. Kumaran 21
Using equations (30) and (31)
𝛾 = 2(𝜀𝑠/𝐺𝐹𝑅𝑃 − 𝜀𝑐)𝑐𝑜𝑡𝛼 (39)
Substituting (39) in (38)
𝜀𝑠𝑢 = 2𝑡𝑤𝑝𝑜𝐴𝑜
(𝜀𝑠/𝐺𝐹𝑅𝑃 − 𝜀𝑎𝑣𝑔)𝑐𝑜𝑠𝛼2 (40)
Using Equation (25) and (35)
𝜀𝑠/𝐺𝐹𝑅𝑃 = 𝜀𝑎𝑣𝑔 + 𝐴𝑜𝑓𝑎𝑣𝑔𝐴𝑠/𝐺𝐹𝑅𝑃×𝑓𝑠/𝐺𝐹𝑅𝑃
𝜀𝑎𝑣𝑔 (41)
Using Equation (31) and (38) yields,
𝜀𝑠𝑢 = −2𝑡𝑤𝑝𝑜𝐴𝑜
(𝜀𝑠/𝐺𝐹𝑅𝑃−𝑡 − 𝜀𝑐)𝑠𝑖𝑛𝛼2 (42)
Using Equation (26) and (35) yields
𝜀𝑠𝑢 = 𝜀𝑐 + 𝐴𝑜𝑓𝑎𝑣𝑔𝑆𝑝𝑜𝐴𝑠/𝐺𝐹𝑅𝑃−𝑡×𝑓𝑠/𝐺𝐹𝑅𝑃−𝑡
𝜀𝑐 (43)
Constitutive Laws of Concrete Struts and Steel
Let the uni-axial stress-strain curve of the concrete struts be expressed by a
parabolic curve
𝑓 = −𝛽𝑓𝑐𝑦 �2𝜀𝜀𝑐− � 𝜀
𝜀𝑐�2� (44)
where 𝜀𝑐= -0.002; 𝑓𝑐𝑦= cylindrical strength of concrete; 𝛽 factor representing the
softening parameter proposed by Vecchico and Collins (1986) is used in this
study, which takes the form as
𝛽 = 10.8+170𝜀𝑡
≤ 1 (45)
where 𝜀𝑡= principal tensile strain of the concrete struts. Notice the above equation
may not be accurate when 𝑓𝑐𝑦 > 35 𝑀𝑃𝑎. The concept of stress block still applies
for the concrete struts. Therefore the average stress of the concrete struts is given
by
𝑓𝑎𝑣𝑔 = −𝑘1𝛽𝑓𝑐𝑦 (46)
where the nondimensional coefficient k1 is defined as the ratio of the average
22 Study on the behaviour of rectangular concrete beams reinforced…
stress to the peak stress −𝛽𝑓𝑐𝑦.
𝑘1 = 𝜀𝑠𝑢𝜀𝑐�1 − 𝜀𝑠𝑢
3𝜀𝑐� (47)
Finally the resultant per unit width C of the softened compression stress
block has magnitude = 𝑘1𝛽𝑓𝑐𝑦𝑡𝑤 , and its position is theoretically located at a
distance of 𝑘2𝑡𝑤 from the extreme fibre. The value of k2 is in the range of 0.4 to
0.5 but based on Hsu, the assumption of k2 = 0.5 will simplify the model and have
slight effect on the accuracy. The constitute law of steel is assumed to be elastic-
perfectly plastic. Elastic modulus for both the longitudinal and transverse steel is
denoted by Es, yield strength by fL, ft respectively, and yield strain by 𝜀𝐿, 𝜀𝑡
respectively.
Geometry Equations
𝐴𝑜 = 𝐴𝑐𝑝𝑐2𝑡𝑤 + 𝜉 (48)
𝑝𝑜 = 𝑝𝑐 − 4𝜉𝑡𝑤 (49)
where 𝐴𝑐 and 𝑝𝑐are the area and perimeter of the cross section respectively. The
value of 𝜉=1 for rectangular sections it is basically geometry dependent.
Assuming𝜀𝑠𝑢 = −0.0035; 𝜀𝑠𝑢2
= 𝜀𝑎𝑣𝑔; Also assuming the initial wall thickness
𝑡𝑤 = 0.75 𝐴𝑐𝑝𝑐
and initial softening coefficient 𝛽 = 0.5. The average stress of the
concrete struts is given by 𝑓𝑠𝑡 = −𝑘1𝛽𝑓𝑐𝑦; where k1= 35/48.
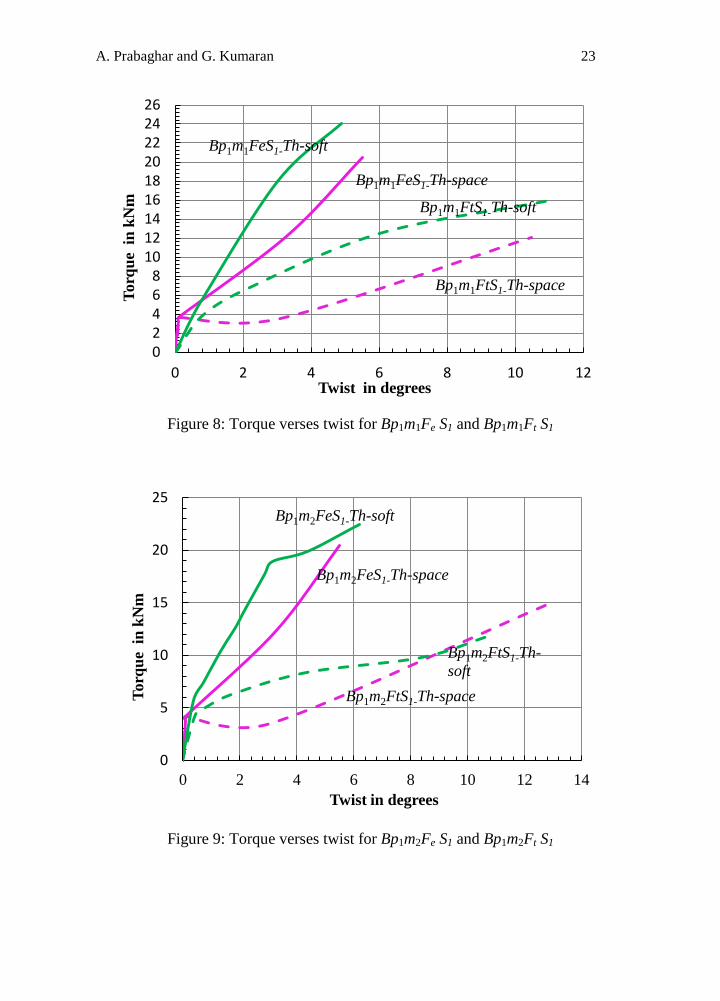
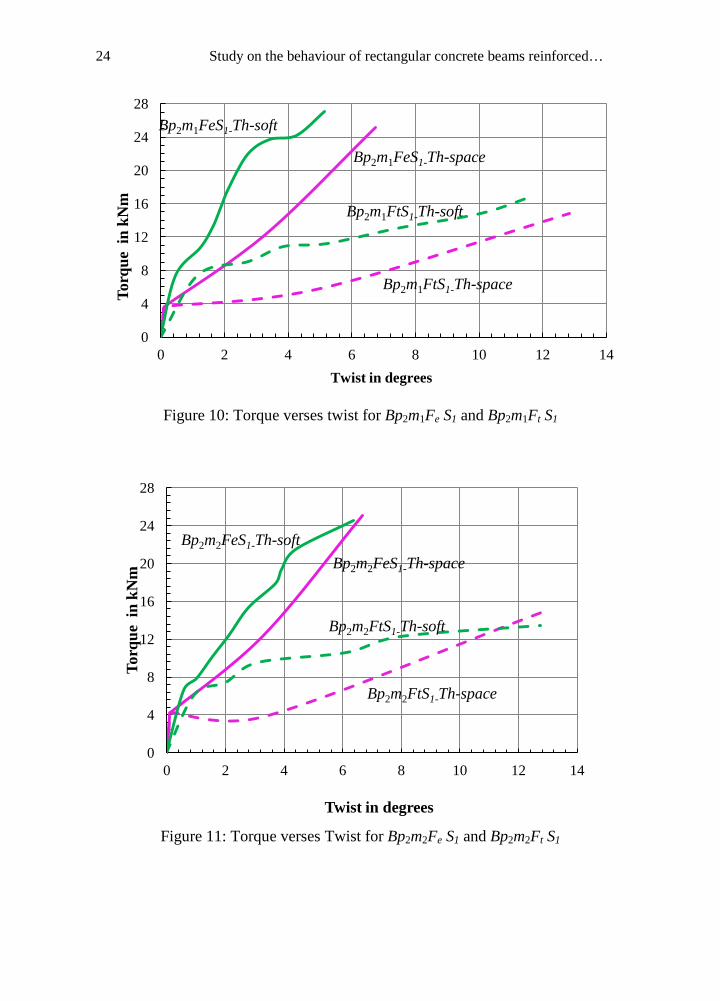
4 Results and Discussion
The results of the theoretical analysis based on the space truss analogy and
softened truss model are presented in the form of T-θ curves (Figures 8 – 15) as
follows:
A. Prabaghar and G. Kumaran 23
Figure 8: Torque verses twist for Bp1m1Fe S1 and Bp1m1Ft S1
Figure 9: Torque verses twist for Bp1m2Fe S1 and Bp1m2Ft S1
0 2 4 6 8
10 12 14 16 18 20 22 24 26
0 2 4 6 8 10 12
Torq
ue i
n kN
m
Twist in degrees
Bp1m1FeS1-Th-space
Bp1m1FtS1-Th-space
Bp1m1FtS1-Th-soft
Bp1m1FeS1-Th-soft
0
5
10
15
20
25
0 2 4 6 8 10 12 14
Torq
ue i
n kN
m
Twist in degrees
Bp1m2FeS1-Th-space
Bp1m2FtS1-Th-space
Bp1m2FtS1-Th-soft
Bp1m2FeS1-Th-soft
24 Study on the behaviour of rectangular concrete beams reinforced…
Figure 10: Torque verses twist for Bp2m1Fe S1 and Bp2m1Ft S1
Figure 11: Torque verses Twist for Bp2m2Fe S1 and Bp2m2Ft S1
0
4
8
12
16
20
24
28
0 2 4 6 8 10 12 14
Torq
ue i
n kN
m
Twist in degrees
Bp2m1FeS1-Th-space
Bp2m1FtS1-Th-space
Bp2m1FtS1-Th-soft
Bp2m1FeS1-Th-soft
0
4
8
12
16
20
24
28
0 2 4 6 8 10 12 14
Torq
ue i
n kN
m
Twist in degrees
Bp2m2FeS1-Th-space
Bp2m2FtS1-Th-space
Bp2m2FtS1-Th-soft
Bp2m2FeS1-Th-soft
A. Prabaghar and G. Kumaran 25
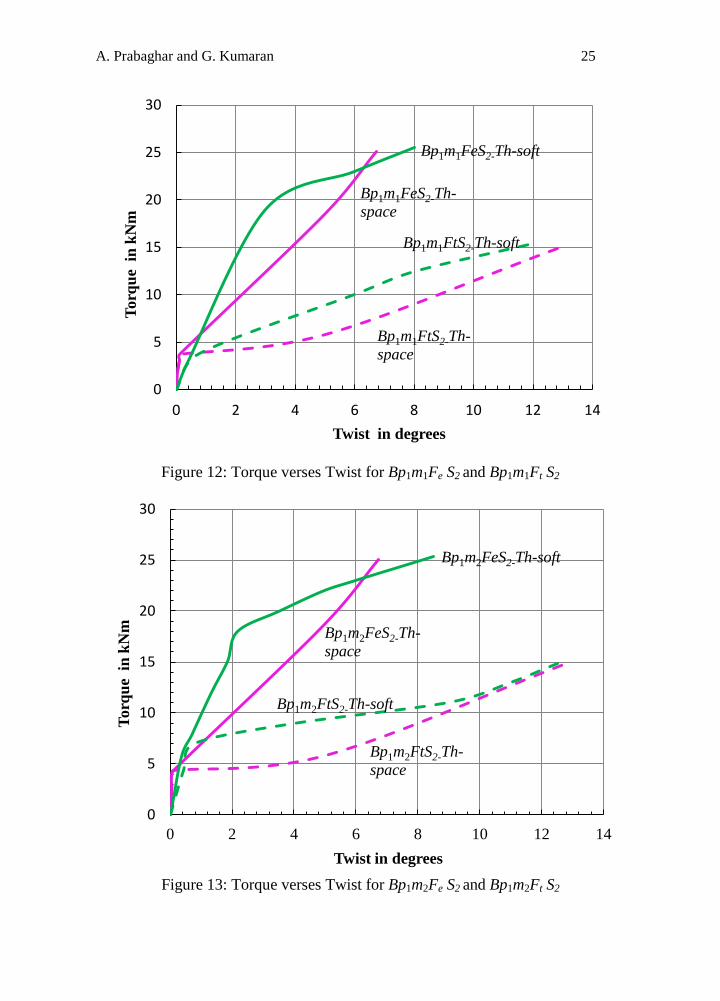
Figure 12: Torque verses Twist for Bp1m1Fe S2 and Bp1m1Ft S2
Figure 13: Torque verses Twist for Bp1m2Fe S2 and Bp1m2Ft S2
0
5
10
15
20
25
30
0 2 4 6 8 10 12 14
Torq
ue i
n kN
m
Twist in degrees
Bp1m1FeS2-Th-space
Bp1m1FtS2-Th-space
Bp1m1FtS2-Th-soft
Bp1m1FeS2-Th-soft
0
5
10
15
20
25
30
0 2 4 6 8 10 12 14
Torq
ue i
n kN
m
Twist in degrees
Bp1m2FeS2-Th-space
Bp1m2FtS2-Th-space
Bp1m2FtS2-Th-soft
Bp1m2FeS2-Th-soft
26 Study on the behaviour of rectangular concrete beams reinforced…
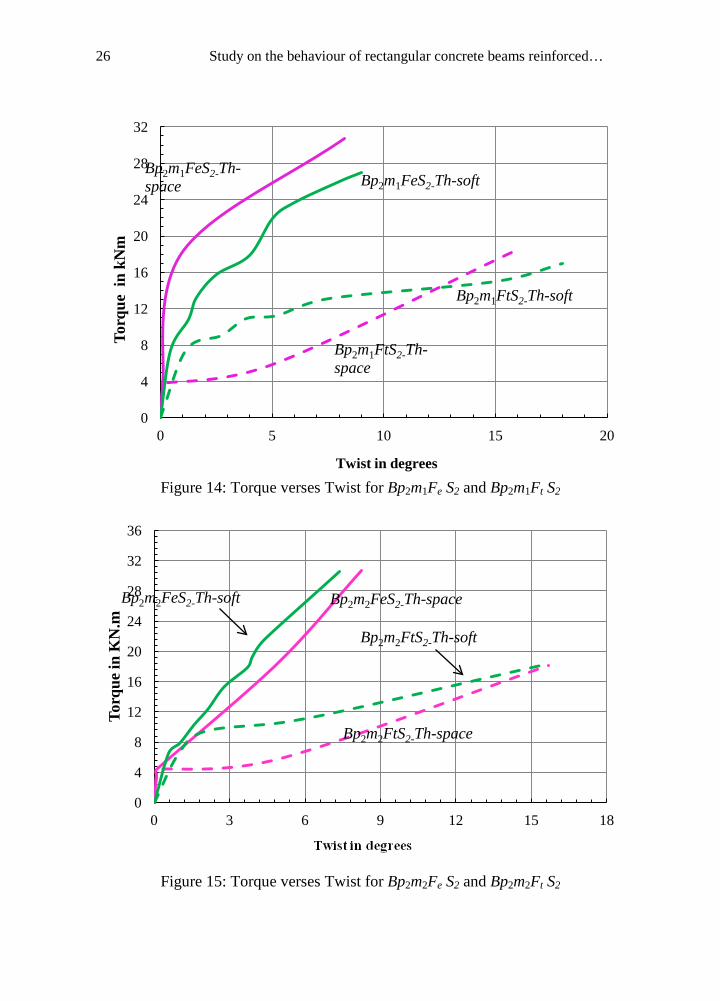
Figure 14: Torque verses Twist for Bp2m1Fe S2 and Bp2m1Ft S2
Figure 15: Torque verses Twist for Bp2m2Fe S2 and Bp2m2Ft S2
0
4
8
12
16
20
24
28
32
0 5 10 15 20
Torq
ue i
n kN
m
Twist in degrees
Bp2m1FeS2-Th-space
Bp2m1FtS2-Th-space
Bp2m1FtS2-Th-soft
Bp2m1FeS2-Th-soft
0
4
8
12
16
20
24
28
32
36
0 3 6 9 12 15 18
Torq
ue in
KN
.m Bp2m2FeS2-Th-space
Bp2m2FtS2-Th-space
Bp2m2FtS2-Th-soft
Bp2m2FeS2-Th-soft
A. Prabaghar and G. Kumaran 27
The results of this study are summarized as follows.
• The existing theoretical torque-twist relationship based on space truss analogy
and softening truss model for various parametric beams under pure torque
condition is utilized for GFRP reinforced concrete beams. The results in the
form of torque verses twist diagrams are shown in figures 8 - 15 and the
results are compared with the steel reinforced beams.
• The predicted variations of angle of twist with the applied torque for all steel
reinforced beams show that ductility of the beams in the post cracking stages
is significantly increased for lower percentage of steel (0.56%). But theses
variations much higher for GFRP reinforced beams due to higher tensile
strains despite the brittle nature of reinforcements.
• The ultimate values of angle of twist and applied torque for parametric
conditions are derived and compared with the experimental values. Softening
truss model predicts more accurately for GFRP reinforced beams and the
variations are less than 10%.
• Torsional strength and angle of twist increases with the increase in increase of
grade of concrete and percentage of longitudinal and transverse
reinforcements. But GFRP reinforced concrete beams show higher angle of
twist than the conventional reinforcements (Figures 8 - 15). This fact is
primarily due to higher tensile strain values for GFRP reinforcements than the
steel reinforcements.
5 Conclusions
The predicted variations of angle of twist with the applied torque for
steel/GFRP reinforced beams show that a closer and almost similar trend when
compared to the experimental trend. Therefore the existing theories using space
truss analogy and softening truss model are more reliable to predict the torsional
behaviour. It is also noted that the replacing main and transverse steel
28 Study on the behaviour of rectangular concrete beams reinforced…
reinforcements by an equal percentage of GFRP reinforcements, reduced their
torsional capacities. The ultimate values of torsional strength of beams have
greater influence on the spacing of stirrups. The minimum spacing of stirrups are
arrived based on the Indian Standards. An examination of the curves reveals that
the slope of the curves at the initial stages of loading is mild for GFRP reinforced
beams whereas for conventional beams it is steeper. This is primarily due lower
elastic modulus than conventional steel reinforcements.
References
[1] ACI 440R-96, State of the Art Report on Fiber Reinforced Plastic
Reinforcement for Concrete Structures, ACI Committee 440, American
Concrete Institute (ACI), Detroit, 1996.
[2] ACI 400-3R-04, Guide Test Methods for Fiber Reinforced Polymers (FRP)
for Reinforcing or Strengthening Concrete Structures, ACI Committee 440,
American Concrete Institute (ACI), 2004.
[3] ACI Committee 440.XR, Report on Fiber Reinforced Polymer (FRP)
Reinforcement for Concrete Structures, American Concrete Institute (ACI),
2007.
[4] ASTM-D 3916-84, Standard Test Methods for Tensile properties of Pultruded
Glass-Fibre Reinforced Plastic Rod.
[5] Asghar Bhatti, M. and Anan Almughrabi, Refined Model to Estimate
Torsional Strength of Reinforced Concrete Beams, ACI Journal of Structural
Engineering, 93, (1996), 614-622.
[6] Bank C. Lawrence, Moshe Puterman and Ammon Katz, The Effect of
Material Degradation on Bond properties of Fiber Reinforced Plastic
Reinforcing Bars in Concrete, ACI Materials Journal, 95(3), (1998), 232-243.
A. Prabaghar and G. Kumaran 29
[7] B. Benmokrane, O. Chaallal and R. Masmoudi, Flexural Response of
Concrete Beams Reinforced with FRP Reinforcing Bars, ACI Materials
Journal, 91(2), (1995), 46–55.
[8] CAN/CSA-S806, Design and Construction of Building Components with
Fibre Reinforced Polymers, Canadian Standards Association, Mississauga,
Ontario, Canada, 2002.
[9] CEB-FIP, FRP Reinforcement in RC Structures, Committee Euro-
International du Beton, Thomas Telford Services Ltd, London, 2007.
[10] Chyan-Hwan Jeng, Simple Rational Formulas for Cracking Torque and Twist
of Reinforced Concrete Members, ACI Structural Journal, 107(2), (2010),
180-197.
[11] M.P. Collins, Torque-Twist Characteristics of Reinforced Concrete Beams
Inelasticity and Non-linearity in Structural Concrete Study, No.8, University
of Waterloo press, Waterloo, Canada, 211-232, (1973).
[12] H.J. Cowan, Elastic Theory for Torsional Strength of Rectangular Reinforced
Concrete Beams, Magazine of Concrete Research London, 2(4), (1950), 3-8.
[13] Craig R. Michaluk, Sami H. Rizkalla, Gamil Tadros and Brahim
Benmokrane, Flexural Behavior of One-way Concrete Slabs Reinforced by
Fibre Reinforced Plastic Reinforcements, ACI Structural Journal, 95(3),
(1998), 353-364.
[14] A. Deiveegan and G. Kumaran, A Study of Combined Bending and Axial
Load on Concrete Columns Reinforced with Non-Metallic Reinforcements,
Central European Journal of Engineering, Warsaw, Poland, 56(4), (2011),
562-572.
[15] S.S. Faza and H.V.S. GangaRao, Bending and Bond Behaviour of Concrete
Beams Reinforced with Fibre Reinforced Plastic Rebars, WVDOH-RP-83
Phase 1 Report, West Virginia University, Morgantown, (1992), 128-173.
30 Study on the behaviour of rectangular concrete beams reinforced…
[16] H.G. Filippou Kwak and C. Filip, Finite Elements Analysis of Reinforced
Structures under Monotonic Loads, A report on research conducted in
Department of Civil Engineering, University of California, Berkeley, 1990.
[17] T.T.C. Hsu, Ultimate Torque of Reinforced Rectangular Beams, ASCE
Journal Structural Division, 94, (Feb., 1968), 485–510.
[18] T.T.C. Hsu and YL Mo, Softening of Concrete in Torsional Members-Design
Recommendations, Journal of the American Concrete Proceedings, 82(4),
(1985), 443–452.
[19] T.T.C. Hsu, Softened Truss Model Theory for Shear and Torsion, ACI
Structural Journal, 85(6), (1988), 624-635.
[20] IS: 516, Code of Practice-Methods of Test for Strength of Concrete, Bureau
of Indian standards, New Delhi, India, 1959.
[21] IS: 10262, Guide Lines for Concrete Mix Design, Bureau of Indian
Standards, New Delhi, India, 1982.
[22] IS: 456, Code of Practice for Plain & Reinforced Concrete, Bureau of Indian
Standards, Indian Standards Institution, New Delhi, India, 2000.
[23] Khaldoun N. Rahal and M.P. Collins, Simple Model for Predicting Torsional
Strength of Reinforced and Prestressed Concrete Sections, Journal of
American Concrete Inst Proceedings, 93(6), (1996), 658–666.
[24] Liang-Jenq Leu and Yu Shu Lee, Torsion Design Charts for Reinforced
Concrete Rectangular Members, Journal of Structural Engineering, 126(2),
(2000), 210-218.
[25] F.A. Bernardo Luis and Sergio M.R. Lopes, Behaviour of Concrete Beams
under Torsion: NSC Plain and Hollow Beams, Journal of Material and
Structures, 41, (2008), 1143-1167.
[26] A. Machida, State-of-the-Art Report on Continuous Fiber Reinforcing
Materials, Society of Civil Engineers (JSCE), Tokyo, Japan, 1993.
[27] J.G. MacGregor and M.G. Ghoneim, Design for Torsion, Journal of the
American Concrete, 92(2), (1995), 211–218.
A. Prabaghar and G. Kumaran 31
[28] A. Nanni, Flexural Behaviour and Design of RC Members using FRP
Reinforcement, Journal of the Structural Engineering (ASCE), 119(11),
(1993), 3344–3359.
[29] E. Rausch, Design of Reinforced Concrete in Torsion, PhD Thesis,
Technische Hochshule, Berlin, 1929.
[30] J. Saravanan and G. Kumaran, Joint Shear Strength of FRP Reinforced
Concrete Beam-Column Joints, Central European Journal of Engineering,
Warsaw, Poland, 1(1), (March, 2011), 89-102.
[31] R. Sivagamasundari, Experimental and Analytical Investigations on the
Behaviour of Concrete Slabs Reinforced with Fibre Based Rods as Flexural
reinforcements, Ph.D Thesis, Department of Civil & Structural Engineering,
Annamalai University, Annamalai Nagar, India, 2008.
[32] S. Unnikrishna Pillai and Devdas Menon, Reinforced Concrete Design, Tata
Mc Graw-Hill Publishing Company Limited, New Delhi, India, 2003.