Embed Size (px)
Citation preview

IEEE Transactions on Nuclear Science, Vol. NS-29, No. 6, December 1982
THEORETICAL PREDICTION OF X-RAY CT IMAGE QUALITYUSING CONTRAST-DETAIL DIAGRAMS
Kensuke Sekihara, Hideki Kohno, Shinji Yamamoto
Central Research Laboratory, Hitachi Ltd.
Kokubunji 185,
ABSTRACT
A theoretical model is developed to calculatecontrast-detail diagrams(CDD) that can be used toexpress the image quality of an X-ray computerizedtomography (CT) system. Using the model, CDDs arecalculated for third and fourth generation scanners.The quantitative relations between the CT systemcharacteristics and the consequent image quality arepresented by means of calculated results.
1. Introduction
In order to design an X-ray computerizedtomography (CT) system, it is important to derive thequantitative relations between image quality andsystem characteristics. Various criteria areconsidered as measures of image quality. Amongthese, measures of spatial and contrast resolutionare the most important. We define contrastresolution as the ability of an imaging system toresolve small differences in X-ray attenuationcoefficients. Accordingly, contrast resolution isdefined by the minimum detectable X-ray attenuationcoefficient difference. Spatial resolution, on theother hand, is usually defined as the minimumresolvable distance between two objects.
The modulation transfer function (MTF) and thepoint spread function (PSF) are both frequentlyemployed to evaluate spatial resolution. Glover andEisner(1) discussed the relationships between PSFsand certain system characteristics, such as detectoraperture width, X-ray focal spot size, and samplinginterval.
In spite of their usefulness in describing thespatial resolution of high contrast objects, MTF andPSF cannot describe the spatial resolution of lowcontrast objects. It is because the spatialresolution of such objects depends not only on thePSF of the imaging system but also on the image noiseproperties.
On the other hand, Hanson and Boyd(2),(3),(4)discussed the contrast resolution of X-ray CTsystems. They pointed out that the detectability forlow contrast objects depends on both the propertiesof image noise and the sizes of the objects. Theirwork, however, was devoted to the detectability oflarge and low-contrast objects. By large-sizedobjects, we mean objects whose detectability is notinfluenced by PSF because their dimensions exceed thefull width at half maximum (FWHM) of the PSF.
Since an X-ray CT system must actually operate inthe region of small objects of low contrast, anevaluation of a system's ability to image small-sizedand low-contrast objects is desirable. For suchobjects, there is a close relationship betweenspatial and contrast resolutions, and consequentlythese resolutions cannot be discussed separately.
Recently, Cohen, et al.(5) proposed acontrast-detail-dose evaluation method. Theyreported the experimental derivation of acontrast-detail diagram (CCD) of commerciallyavailable CT systems. Based on a review of Cohen's
Manuscript received October 26, 1981
Tokyo, Japan
work, we conclude that the CDD is a most powerfultool for measuring image quality because it cansimultaneously express the spatial resolution for anyarbitrary object-contrast and the contrast resolutionfor any arbitrary object-size. We consider that CDDsare especially effective to evaluate the spatial andcontrast resolutions of small-sized and low-contrastobjects.
In this paper, we develop a theoretical model fromwhich CDDs as well as the relations between CDDs andspecified system characteristics can be calculated.Using our model, one can predict the spatialresolution associated with any arbitraryobject-contrast, or the contrast resolution for anyarbitrary object size, from a given set of systemcharacteristics.
In Sections 2 and 3, we review both PSF and imagenoise in X-ray CT systems. Section 4 presents thetheoretical model for calculating CDDs, and Section 5relates CDDs and system characteristics by presentingcalculations for two typical whole-body scanners, fora third generation scanner (rotating detector design)and for a fourth generation scanner (stationarydetector design). In section 6 (a), we compare thetwo typical designs. Section 6 (b) discusses thedependence of image quality on the cut-off frequencyof a filter function.
Throughout the paper, we apply the filteredbackprojection method and the Shepp and Logan(6)convolution filter for tomographic imagereconstruction.
2. Point Spread Function of X-ray CT system
In this section, we make a brief review about thePoint Spread Function (PSF) of X-ray CT system. Thereader who is interested in more precise discussionabout PSFs should refer to Ref.(l). We assume (as inRef.(1)) the parallel beam geometry and the infinitnumber of projections. According to theseassumptions, the PSF for a point absorber located atthe center of a CT system is given by(1)
1/2P
Q(r)= t Jo(27rfr)A(fp(f) J(f)df , (1)
wheref is the spatial frequency,
A(f) is an aperture transfer function expressingthe influence of detector aperture width and X-rayfocal spot size on the reconstructed image,t(f) is the convolution kernel(the Fourier
transform of the filter function),I(f) is the Fourier transform of the interpolation
function.JO is the first-order Bessel function, and p is
the sampling interval in each projection.When the detector aperture and X-ray focus are
assumed to be square, A(f) is expressed by(7)
A (f =s inc SM-) s inc ( faM-) (2)
0018-9499/82/1200-2115$00.75©1982 IEEE2115
where d is the detector aperture width, a is theX-ray focal spot size, and M is the geometricmagnification factor, L1/L2, where L1 is the focal-spot-to-detector distance and L2 is the focal-spot-to-center distance of the system.
In addition, we assume that the interpolation isideal, that is, no information is lost through theinterpolation process. This being so,
1(f)=1 (f<1/2p)
I (f)=0 (f>1/2p)
The Shepp and Logan filter is expressed by(6)
¢(f)=sin(fffp)/(ffp)
where T is the integration time of the dataaquisition system, (T usually equals the X-ray pulsewidth in third generation scanners). The X-ray beamslice-thickness at the center of the system is w, anddwM equals the area of the detector's aperture. InEq.(9), D is the mean attenuation of X-rays passingthrough the center of the object. This attenuationis defined by the ratio of the mean transmittedphoton radial-flux to the mean incident photonradial-flux. Then, substituting Eq.(9) into Eq.(8),the standard deviation of the noise at the center ofthe image can be expressed as
( = 1/ (2p KN0TdWMD) 9
(4)
Substituting Eqs.(2),(3) and (4) into Eq.(1), wefind that
1 f2P iT fdQ(r)=- | Jo(2Rfr)sinc(- -)
sinc(7fa(M1))sin (Trfp)df (5)
We will use Eq.(5) for making the calculations inSection 5.
3. Standard deviation of image noise
(10)
in which KNOT represents the X-ray exposure duringthe scan and is directly proportional to themilliamper-second (mAs) operating point of the X-raytube in third generation scanners. Since we employedcorrectly normalized integration to derive Eq.(10),a is the standard deviation in the absolute value ofthe X-ray attenuation coefficient. Equation (10)expresses the relationship between several systemcharacteristics (KNOT, d, w, M) and noise standarddeviation of the reconstructed image. We will usethis equation for the calculation in Section 5.
4. Derivation of Contrast-Detail Diagrams
In this section, we study the relation betweenseveral system characteristics and the standarddeviation of the image noise. Given a radiallysymmetrical object, the variance at the center of thereconstructed image, q2 , is given by(8)
l
a =I(2P j2 (f)I(f) g (6)
where cg92 iS the variance of the projections, and Kis the number of projections. The derivation ofEq.(6) is seen in Ref.(8). It is assumed that thedetectors and data aquisition system are ideal, sothat the noise in each projection arises only fromX-ray quantum noise. This being so,
a2 = 1/N , (7)
where N is the mean number of photons that aredetected after they emerge from the center of theobject. Again, we assume an ideal interpolation. Asalready stated, we use the Shepp and Logan filter.Substituting Eqs.(3),(4), and (7) into Eq.(6), thenoise standard deviation is
G = ll(V7pAK)
Once the PSF and image noise have been calculated,the contrast-detail diagrams for the center of theimage can be constructed:
1) Let us consider the phantom shown in Fig.1. Ithas two identical rods with an X-ray attenuationcoefficient that differs from other parts of thephantom by A}p . The rods have diameter r , and thedistance between their centers is 2T .
Figure 2 (a) shows the X-ray attenuationcoefficient distribution along the line B shown inFig.l. The distribution is obviously two rectanglesof widths t and heights Au . The distance betweenthe rectangle centers is 2T . This distribution isdenoted by F(x). Thus, F(x) can be expressed by
F(X)=ApIR X +H(11)
where
I (x)=1I (X)=0
IXI<1/2
IXI>l/2
(8)
At this point, let us introduce the term, No. Nois the mean number of X-ray photons that would reachthe unit area of a detector's aperture during one
second, if no object were present. We also assume
that all photon reaching a detector's aperture are
detected, a condition which cannot be true for Xenondetectors ( used in third generation scanners )because the window contaning the high-pressure gaswithin the detector attenuates the X-rays and,therefore, the detector efficiency falls below 100%.
Using No, we can express N, the mean number ofactually detected photons, as
Fig.1 A phantom pattern for calculating CDDs.
(9) 2) To depict the effect of the imaging system PSFN = NoTdwMD 2
2116

on the phantom pattern, we convolve the phantomdistribution, F(x), with the PSF. The convolutionresult, Fc(x), represents the density distribution inthe image. The result is
FC(X)=Al l {ll(. -+ +TI(-- }Q(X-XJ)dXo . (12)C
The difference between the maximun and minimumvalues of FC(x), AO , is
AfI = max{F0(x)}-min{Fc(x)} . (13)
Af implies a density difference in thereconstructed image corresponding to the attenuationcoefficient difference, Ap . Figure 2 (b) shows atypical PSF and Figure 2 (c) depicts the convolutionof this PSF with the phantom distribution shown inFigure 2 (a). FC(x), of couse, represents imagedeterioration brought about by imaging systemresolution. However, the statistical nature of theimage also limits the quantitative and qualitativeusefulness of the image.
FRX)
4l.
-r 01
(a)
-C
image quality, we now introduce a detectabilitycoefficient, k, to express the detection limitationof an object whose density difference from a noisybackground is small. The threshold densitydifference that can be discerned by a human observeris denoted by APT and the noise standard deviation ofthe background is denoted by a . Thus, we candefine k as
k = AiT/j * (14)
Namely, a density difference is discernible when itexceeds ka and not discernible when it is less thanka .
The coefficient, k, includes human visualcharacteristics. Several authors(2),(3),(4),(5),(9)have discussed this coefficient theoretically orexperimentally. Rose(9) pointed out the relation,k ccFl , in white noise, where T is the diameter ofan object that has a density different from thebackground. Hanson(4) and Cohen et al.(5) found fromtheir own detection experiment with human observersthat the relation k mfl , is valid even in typicalcomputed tomographic image noise. Thus, we canexpect the quantity, kT , to be constant.
Let us introduce the value G as G=k( T/p). Here,we measure T in pixels and assume that the pixelwidth in the image reconstruction is identical to thesampling interval, p, in the projections. Cohen etal.(5) called G a perception factor and determinedfrom their detection experiment on commerciallyavailable CT systems that the value of G isapproximately 10. Hanson(4) also discussed G in hisown detection experiments on computer generateddetectability test patterns and found that G has thevalue of approximately 7. (He derived valuescorresponding to AFG/2 in Figure 7 of Ref.(4).) Theresults of our own experiments, similar to those ofHanson, show that G equals 8 for CT image noiseapplied by Shepp and Logan filter. This value is ingood agreement with the measurements of Hanson andCohen. Accordingly, we use the relationship:
k = 8(T/p)1 (15)
(b)
F. (X)Fc)
_1
-I O
(c)
4) The threshold values of detectable densitydifference can now be calculated from Eqs.(14) and(15). Thus, we can obtain the threshold values ofthe detectable X-ray attenuation coefficientdifference, AlT I for a given two-rod phantomdimension, T , from Eqs.(5),(10),(12),(13),(14) and(15). A plot of the relationship between AVTand Tis the CDD for a given set of system characteristics,p, a,d,M,K,w,T and No.
5. Relation between system characteristicsand CDDst4aA
rC-1.5mm)
Fig.2 (a) X-ray absorption coefficientdistribution along line B in Fig.1.(b) Example of PSF. (c) Results ofconvoluting rectangles shown in Fig.2 (a)for r =0.15 cm with PSF shown in Fig.2 (b).
3) To include the effects of noise on the resulting
To show the power of the CDD in representing theresolution of a given CT scanner, we present twoexamples: a fan-beam rotating detector scanner and afan-beam stationary detector scanner. Since thesescanners both employ fan-beam geometry, the samplinginterval p is not invariant in the field of view. Inthe following calculations, we assign values to pthat are measured at the center of the system, and Dis assumed to be 0.02, a typical attenuation at thecenter of the human head. The X-ray focal spot size,a, is 0.1 cm , unless otherwise noted. The slicethickness of the X-ray beam, w, at the center of thesystem is assumed to be 1 cm . The calculated CDDsare presented in Figs.4,6,9 and 10. In thesefigures, we express the threshold X-ray attenuation
2117
v- r I . -.
II
coefficient difference, APT , in percentage withrespect to the attenuation coefficient of water, PwIn the calculation, PW equals 0.19 cir1, a typicalvalue in water for 60 kev X-rays.
spatial resolution is very small even for the 1024detector scanner.
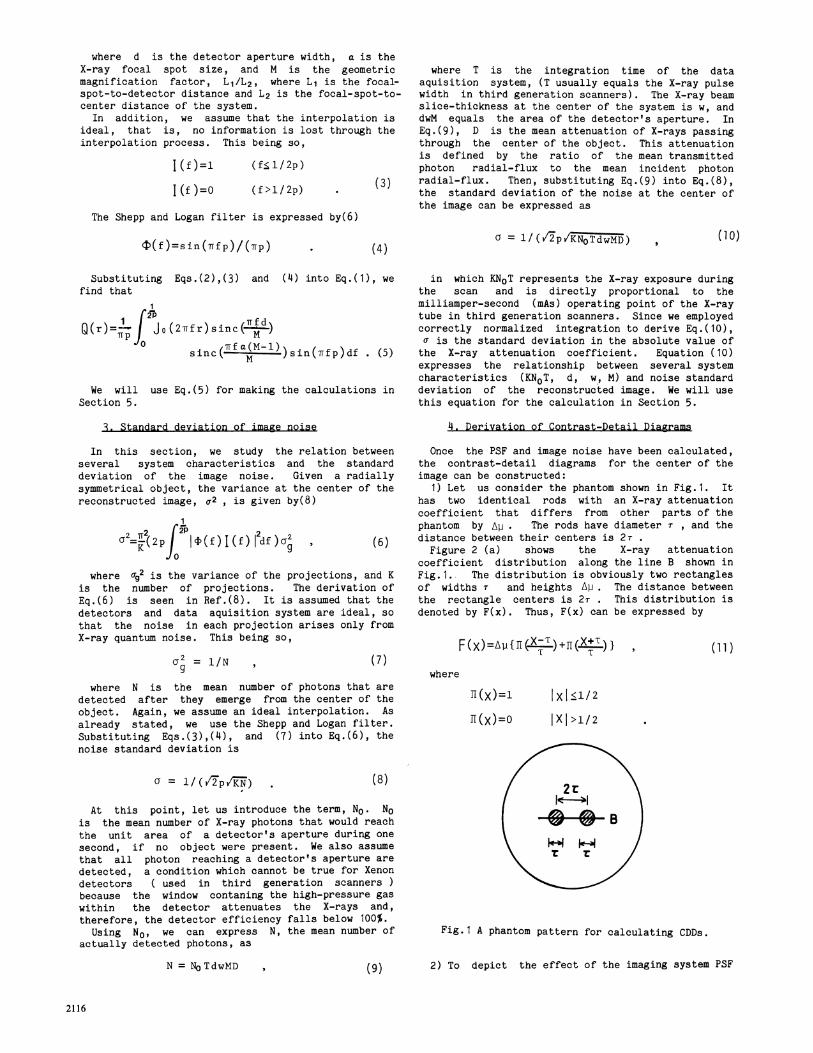
X-RAY SOURCE1=110 cmL? 70 cmRo= 21 cm
FIELDOF VIEW
DETECTOR ARRAY
Fig.3 Third generation scanner geometry used tocalculate CDDs.
a) Third generation scanner: rotating detectordesign
First a typical rotating detector fan beam scannergeometry shown in Fig.3 will be considered. Weassume that the width of the non-responsive deadspace between adjacent detectors is zero. Therefore,we can use the following relation for the calculationof CDDs:
10
I-LO
I-
z0° 1
I00
0.1
1024 DETECTORS
512 DETECTORS
256 DETECTORS
Q1 Q5 1OBJECT DIAMETER (Tr)
5 imm.
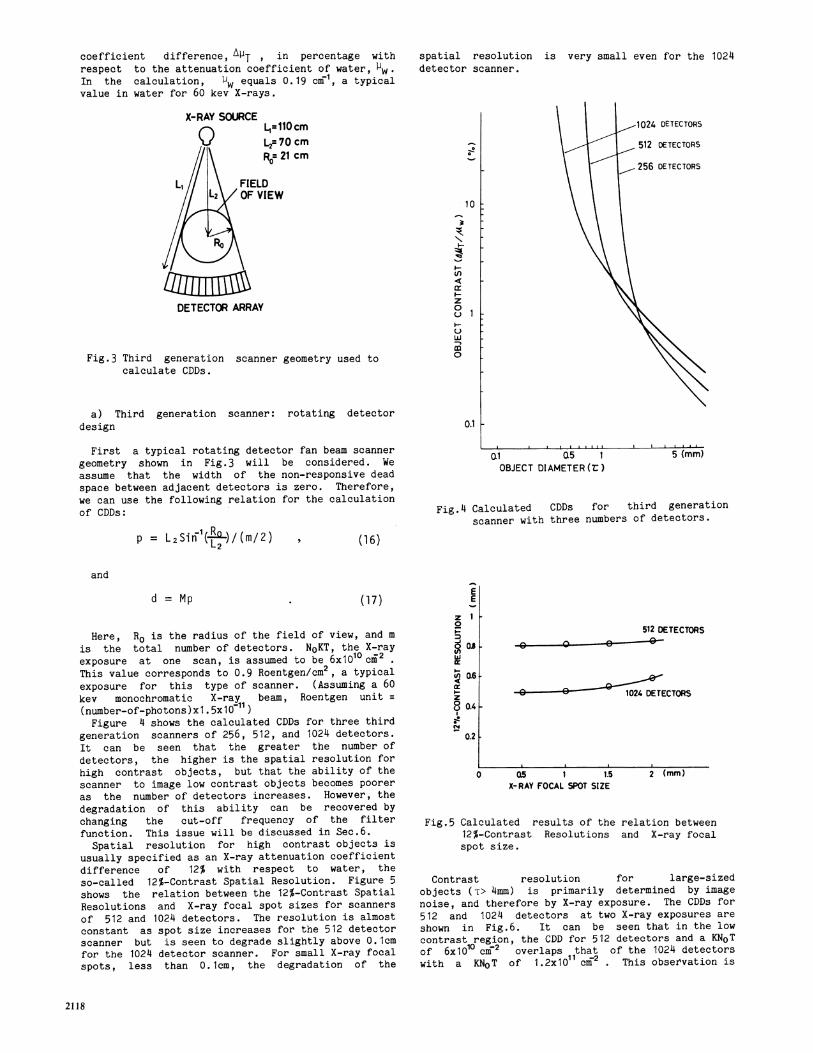
Fig.4 Calculated CDDs for third generationscanner with three numbers of detectors.
p = L2Sir 1(R)/(m/2)
d = MpE
E(17)
Here, Ro is the radius of the field of view, and m
is the total number of detectors. NoKT, the X-rayexposure at one scan, is assumed to be 6x10¹⁰c .
This value corresponds to 0.9 Roentgen/cm2, a typicalexposure for this type of scanner. (Assuming a 60
kev monochromatic X-ray beam, Roentgen unit(number-of-photons)x1.5x11011)Figure 4 shows the calculated CDDs for three third
generation scanners of 256, 512, and 1024 detectors.It can be seen that the greater the number ofdetectors, the higher is the spatial resolution forhigh contrast objects, but that the ability of thescanner to image low contrast objects becomes pooreras the number of detectors increases. However, the
degradation of this ability can be recovered bychanging the cut-off frequency of the filterfunction. This issue will be discussed in Sec.6.Spatial resolution for high contrast objects is
usually specified as an X-ray attenuation coefficientdifference of 12% with respect to water, the
so-called 12%-Contrast Spatial Resolution. Figure 5shows the relation between the 12%-Contrast SpatialResolutions and X-ray focal spot sizes for scanners
of 512 and 1024 detectors. The resolution is almostconstant as spot size increases for the 512 detectorscanner but is seen to degrade slightly above O.1cmfor the 1024 detector scanner. For small X-ray focalspots, less than 0.1cm, the degradation of the
z I
0
(Xos
i.6
I°-z
80.1A
0.2 [
512 DETECTORS
O--1 E-ECT-
.9 I- l2DETECTORS
0.5 1 1.5
X-RAY FOCAL SPOT SIZE
Fig.5 Calculated results of the12%-Contrast Resolutionsspot size.
2 (mm)
relation betweenand X-ray focal
Contrast resolution for large-sizedobjects (T> 4mm) is primarily determined by imagenoise, and therefore by X-ray exposure. The CDDs for
512 and 1024 detectors at two X-ray exposures are
shown in Fig.6. It can be seen that in the low
contrast region, the CDD for 512 detectors and a KNoTof 6x10 cmi2 overlaps that of the 1024 detectorswith a KNoT of 1.2x10 c62 . This observation is
2118
and
(16)
I
-~~~~~~~~~~~~~~~~~~~~~
5 (mm)
plausible because the number of X-ray photonsdetected by each cell in a 1024 detector scanner ishalf that for the one having 512 detectors, assumingall other dimensions are equal. X-RAY SOURCE RING
10
I-1-
za
I~-
wco0
0.1
1024 DETECTORS
512 DETECTORS
;tKT=6xld&c 2
FIELD OFVIEW
0.1 0.5 1OBJECT DIAMETER(E)
5 (mm)
Fig.6 CDDs for a third generation scanner with512 and 1024 detectors for two X-rayexposures.
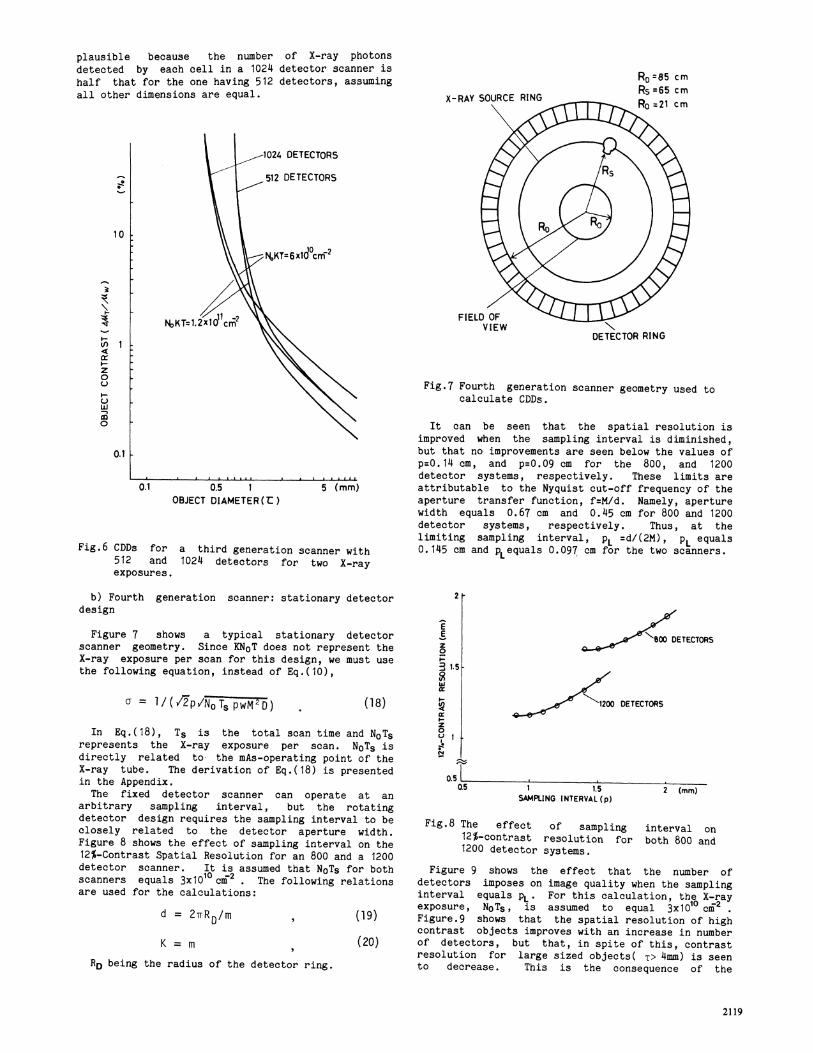
b) Fourth generation scanner: stationary detectordesign
Figure 7 shows a typical stationary detectorscanner geometry. Since KNoT does not represent theX-ray exposure per scan for this design, we must usethe following equation, instead of Eq.(10),
C = 1/ ( /2p/No Ts pwM2oD ) (18)
In Eq.(18), Ts is the total scan time and NoTSrepresents the X-ray exposure per scan. NoTS isdirectly related to the mAs-operating point of theX-ray tube. The derivation of Eq.(18) is presentedin the Appendix.
The fixed detector scanner can operate at anarbitrary sampling interval, but the rotatingdetector design requires the sampling interval to beclosely related to the detector aperture width.Figure 8 shows the effect of sampling interval on the12%-Contrast Spatial Resolution for an 800 and a 1200detector scanner. It is assumed that NoTs for bothscanners equals 3x1010 cm2 . The following relationsare used for the calculations:
d = 2RD/m , (19)
K = m (20)
RD being the radius of the detector ring.
DETECTOR RING
Fig.7 Fourth generation scanner geometry used tocalculate CDDs.
It can be seen that the spatial resolution isimproved when the sampling interval is diminished,but that no improvements are seen below the values ofp=0.14 cm, and p=0.09 cm for the 800, and 1200detector systems, respectively. These limits areattributable to the Nyquist cut-off frequency of theaperture transfer function, f=M/d. Namely, aperturewidth equals 0.67 cm and 0.45 cm for 800 and 1200detector systems, respectively. Thus, at thelimiting sampling interval, PL =d/(2M), PL equals0.145 cm and pLequals 0.097 cm for the two scanners.
2
E
z0i-
3 1.5
!Q
z0° 1;
" 0O DETECTORS
"\1200 DETECTORS
0.51Q.5 1 1.5 2 (mm)
SAMPLING INTERVAL (p)
Fig.8 The effect of sampling interval on12%-contrast resolution for both 800 and1200 detector systems.
Figure 9 shows the effect that the number ofdetectors imposes on image quality when the samplinginterval equals pL. For this calculation, the X-ray
10 -l2exposure, NoTs, is assumed to equal 3x10 cmFigure.9 shows that the spatial resolution of highcontrast objects improves with an increase in numberof detectors, but that, in spite of this, contrastresolution for large sized objects( T> 4mm) is seento decrease. This is the consequence of the
RD=85 cm
Rs=65 cmRo=21 cm
2119
f-- I i . l . l l l l l
0.-I
1-

assumption that p is proportional to d (i.e. Tccd),while NOTS remains constant.
10 [
I-3t
Ln
crz0
0.1w
0
0.1,
1600 DETECTORSIOETECTORS
(b) Effect of filter function cut-off frequency onimage quality
As shown in Fig.4 and Fig.9, an increasing thenumber of detectors results in a poorer contrastresolution for large-sized objects. Thisdeterioration is caused by the assumption that thecut-off frequency of the filter function is alwaysequal to 1/(2p). As Chesler, et al.(10) pointed out,one can improve the standard deviation of the imagenoise at the expense of the spatial resolution ofhigh contrast objects by changing the filter cut-offfrequency. By changing the cut-off frequency, onecan make as the same effect on the reconstructedimage as by smoothing or data averaging with theout-puts from adjacent detectors. We investigate thedependence of CDDs on the filter cut-off frequency.Instead of Eqs.(5) and (10), we use the followingequations for this investigation.
1f2a
Q(r)=7CxJ Jo(27rfr)sinc(-)
sinc rTfa(M- )3sin(Trfot)df (21)
a = -I/p2t/(/KNoTdwMD) (22)
0.1 0.5 1 5 (mm)OBJECT DIAMETER (C)
Fig.9 CDDs for fourth generation scanners, having800, 1200, 1600 and 2400 detectors, when
P.PL.
6. Discuso
(a) Comparison of third and fourth generationscanners
These numerical results now being available, we cancompare the image quality attainable by third andfourth generation scanners. X-ray focal- spot-to
-detector distance is denoted by L1 . Since X-rayradial-flux emitted from the X-ray tube isproportional to the electron current striking thetube anode. X-ray exposure of a unit-area of thedetector aperture per scan is proportional to the
2mAs-values/L.The L1 of fourth generation scanners is usually 1.4
to 1.5 times that of third generation scanners.Accordingly, the X-ray exposure for a thirdgeneration scanner is almost twice that of a fourthgeneration scanner if the X-ray tube mAs-values areequal. Comparing the CDDs in Fig.4 with the CDDs inFig.9, one can see that the image quality of a thirdgeneration scanner with 256 detectors isapproximately the same as for a fourth generationscanner having 800 detectors. Also, the 512 detectorthird generation scanner image quality is about equalto that of the 1600 detector fourth generationscanner. It should be noted that the X-ray exposurerequired for the CDDs in Fig.4 is twice that requiredfor the CDDs in Fig.9. From this comparison we
conclude that fourth generation scanners requireapproximately three times more detectors than dothird generation scanners, if one is to obtain imagesof identical quality.
where 1/(2a) is the cut-off frequency of the filterfunction and a is the equivalent sampling interval.
The calculated results for a third generationscanner having 1024 detectors are shown in Fig.10.The CDDs expressed by dotted lines in that Figure areidentical to CDDs for the 1024 and 512 detectors inFig.4. The CDDs expressed by the solid linescorrespond to CDDs for 1024 detectors whose a equal21/3p1 and 2p1, where p1 is the sampling interval of1024 detectors. Compared with the CDD for 512detectors, the CDD of a =2p1 has almost the samespatial resolution of high contrast objects but ithas far superior contrast resolution for large sizedobjects. On the other hand, the CDD of a=21/3p1 hasalmost the same contrast resolution for large sizedobjects but it has far superior spatial resolutionfor high contrast objects. It is, of cause, possiblethat a GDD at an intermediate position between CDDsof a =21/3p, and a=2p1 can be obtained. Thus, theimage quality of 1024 detectors can be superior tothat of 512 detectors for entire object contrast bychoosing an appropriate cut-off frequency.
7. Summary
We have developed a model by which one can derive aCDD. Using the resulting model, and a set of givensystem characteristics, one can predict the imagequality of an X-ray CT system. Having calculated therepresentative CDDs, one can determine the rolesplayed in image quality by the individual systemcharacteristics such as the total number ofdetectors, X-ray focal spot size, sampling interval,and X-ray exposure.
APPENDIX
In this appendix, we show the derivation of Eq.18.For fourth generation scanners, the relation betweenintegration time for the data acquisition,T, and thetotal scanning time, Ts, is given by
2120

T = Tsps/(2TrRS)
where ps is the sampling interval at the X-raysource ring, and Rs is the radius of that ring. p8iscalculated from p, the sampling interval at thecenter of the system, as
Ps= Mp/(M-l) .(A-2)
Substituting Eqs.(A-1), (A-2),Eq. (10),
(19) and (20) into
a = 1/(/2p/NOTspwM2D)
is obtained.
01-I IIl
10-
-
nC,)4:
zi107
I-
m0
0.1
DETECTORS
1024 DETEC(ik=Pf )
1024 DETEi(ii=2p1 )
0.1 05 1OBJECT DIAMETER (x)
5 (mm)
Fig.10 The effect of filter function cut-offfrequency on calculated CDDs for a thirdgeneration scanner having 1024 detectors.
Kensuke Sekihara was born in Tokyo, Japan,February 16, 1950. He received the B.S. degree inphysics and M.E. degree in applied physics fromTokyo Institute of Technology, in 1974 and 1976.
Since 1976, Mr. Sekihara has been employed atCentral Research Laboratory of Hitachi Ltd,where he has engaged in development of medicalimaging systems. He has been especially devotedto the analysis of the effect of X-ray physical pro-perties and detector characteristics on X-ray CT ^image quality. His current work is concerned with the development of NMRimaging systems.Mr. Sekihara is a member of the Japan Society of Applied Physics.
REFERENCE
1) G.H.Glover and R.L.Eisner, "TheoreticalResolution of Computed Tomography Systems", J.Comput. Assist. Tomogr.3, PP85-91, (1979).
2) K.M.Hanson, "Detectability in ComputedTomographic Images", Med. Phys.6(5), PP441-451,(1979).
3) K.M.Hanson and D.P.Boyd, "The Characteristicsof Computed Tomographic Reconstruction Noise andThier Effect on Detectability", IEEE Tr. on NuclearScience, NS-25, PP160-163, (1978)
4) K.M.Hanson, "Detectability in the Presence ofComputed Tomographic Reconstruction Noise", SPIEVol.127 Optical Instrumentation in Medicine VI,(1977).
5) G.Cohen and F.A.DiBianca, "The Use ofContrast-Detail-Dose Evaluation of Image Quality in aComputed Tomographic Scanner", J. Comput. Assist.Tomogr.3, PP189-195,(1979).
6) L.A.Shepp and B.F.Logan, "The FourierReconstruction of a Head Section", IEEETr. on Nuclear Science, NS-21, PP21-42,(1974).
7) M.V.Yester and G.T.Barnes, "GeometricalLimitations of Computed Tomography ScannerResolution", SPIE Vol.127 Optical Instrumentation inMedicine VI, (1977).
8) J.C.Gore and P.S.Tofts, "StatisticalLimitations in Computed Tomography", Phys. Med.Biol. Vol.23, PP1176-1182, (1978).
9) A.Rose, "The Sensitivity Performance of theHuman Eye on an Absolute Scale", J. Opt. Soc. Am.,Vol.38, PP196-208, (1948).
10) D.A.Chesler, S.J.Rieder and N.J.Pelc, "NoiseDue to Photon Counting Statistics in Computed X-rayTomography", J. Comput. Assist. Tomogr.1, PP64-79,(1977).
Shinji Yamamoto was born on January 18, 1940.
He graduated from Nagoya University in 1962
with a B.S. degree in Electronics. Upon gradua-tion, he joined Hitachi Ltd. as a researcher in thepattern recognition field. In 1974, he received a
Ph.D. degree in Electronics from Nagoya Univer-sity.
At present, he is the manager of medical engi-neering department at the Central ResearchLaboratory, Hitachi Ltd. His major accomplish-
ments include automatic recognition systems for hand-written numeral andprinted Chinese characters, development of systems capable of automaticallyclassifying blood cell images and detecting uterine cancer cell images and a
reconstruction algorithm for CT scanners.
Dr. Yamamoto is a member of the Medical & Biological Engineering Societyof Japan, and of the International Academy of Cytology.
Hideki Kohno was born in Tokyo, Japan in 1944.He received the B.S. degree from the University ofTohoku in 1968.
Since then he has been employed at CentralResearch Laboratory, Hitachi Ltd., where he hasengaged in the research of medical image process-ing.
He is presently senior researcher of medicalengineering department, and is involved in dif-ferent research fields as medical image processing,
tomographic image reconstruction algorithms and X-rays detectors.
2121
(A-1I)