Embed Size (px)
Citation preview

Theoretical and Statistical Approaches to Understand Human Mitochondrial DNA Heteroplasmy Inheritance
Passorn Wonnapinij
Dissertation submitted to the faculty of the Virginia Polytechnic Institute and State University in partial fulfillment of the requirements for the degree of
Doctor of Philosophy
In Genetics, Bioinformatics, and Computational Biology
David C. Samuels (Committee Chair) Edward J. Smith Ina Hoeschele
Ronald M. Lewis Allan W. Dickerman
April 9, 2010 Blacksburg, VA
Keywords: mitochondrial genetic bottleneck, Kimura distribution, sampling error,
mutation level variance, offspring gender bias
Copyright © 2010 Passorn Wonnapinij unless otherwise stated

Theoretical and Statistical Approaches to Understand Human Mitochondrial DNA Heteroplasmy Inheritance
Passorn Wonnapinij
ABSTRACT
Mitochondrial DNA (mtDNA) mutations have been widely observed to cause a variety of human diseases, especially late-onset neurodegenerative disorders. The prevalence of mitochondrial diseases caused by mtDNA mutation is approximately 1 in 5,000 of the population. There is no effective way to treat patients carrying pathogenic mtDNA mutation; therefore preventing transmission of mutant mtDNA became an important strategy. However, transmission of human mtDNA mutation is complicated by a large intergenerational random shift in heteroplasmy level causing uncertainty for genetic counseling. The aim of this dissertation is to gain insight into how human mtDNA heteroplasmy is inherited.
By working closely with our experimental collaborators, the computational simulation of mouse embryogenesis has been developed in our lab using their measurements of mouse mtDNA copy number. This experimental-computational interplay shows that the variation of offspring heteroplasmy level has been largely generated by random partition of mtDNA molecules during pre- and early post-implantation development.
By adapting a set of probability functions developed to describe the segregation of allele frequencies under a pure random drift process, we now can model mtDNA heteroplasmy distribution using parameters estimated from experimental data.
The absence of an estimate of sampling error of mtDNA heteroplasmy variance may largely affect the biological interpretation drawn from this high-order statistic, thereby we have developed three different methods to estimate sampling error values for mtDNA heteroplasmy variance. Applying this error estimation to the comparison of mouse to human mtDNA heteroplasmy variance reveals the difference of the mitochondrial genetic bottleneck between these organisms.
In humans, the mothers who carry a high proportion of m.3243A>G mutation tend to have fewer daughters than sons. This offspring gender bias has been revealed by applying basic statistical tests on the human clinical pedigrees carrying this mtDNA mutation. This gender bias may partially determine the mtDNA mutation level among female family members.
In conclusion, the application of population genetic theory, statistical analysis, and computational simulation help us gain understanding of human mtDNA heteroplasmy inheritance. The results of these studies would be of benefit to both scientific research and clinical application.

Dedication
To my parents,
Pan-Apinya Wonnapinij,
and brother
Prapass Wonnapinij
iii

Acknowledgements All studies presented in this dissertation would not be possible without help and support from many people. First, I would like to thanks my adviser, Dr. Davild C. Samuels, for his invaluable advice, and scientific temperament. Being his student is not only a wonderful experience but also giving me a nice opportunity to meet and work with other scientists and clinicians in the field of mitochondrial genetics. Working with him is a wonderful experience at possibly the best ever.
I would like to thank my experimental and clinical collaborator, Dr. Patrick F. Chinnery whose biological and clinical point of views always drives the study to the better one. I also would like to thank all other experimental collaborators as well as the scientists who came across continent to visit our research group. Having a chance to work and discuss with them help me gain scientific knowledge about mitochondrial biology and genetics.
I would like to show my gratitude to all of my committee members for their suggestions and supports both for my academic study and scientific research.
I am thankful to all of my colleagues in Dr. Samuels’ research group: Zhuo Song, Vishal Gandhi and Mark Lee, for their kindness and warm support, especially Song. I also thank all my former lab members: Dr. Jonghoon Kang, Dr. Hasha Karur Rajasimha, and Katherine Wendelsdorf, for their helps and suggestions. Special thanks to Dr. Harsha, his advice was not only useful for my research project but also for my academic life.
I thank all faculty, staff and student at Virginia Tech, especially GBCB students. I thank Dr. Surot Thangjitham for all his help. Special thanks to Dr. David Bevan, his attitude helps me moving to Nashville with a peaceful mind. Many thanks to Ms. Dennie Munson, she has been very helpful in every senses from the beginning. Her helps for all administrative and graduate school paperwork only make my life easier as a foreign PhD student.
I thank all of faculty, staff, and student both of Virginia Bioinformatics Institute (VBI) at Virginia Tech and of Center of Human Genetic Genetics Research (CHGR) at Vanderbilt University for their warm welcome and assistance whenever I needed.
I am gratified by an opportunity to study abroad at Virginia Tech which would not be possible without funding from the Commission on Higher Education, Royal Thai Government. It would not be too much to say that my financial support comes from all Thais; thereby I would like to thank them all.
I thank all Thai friends, brothers and sisters at Virginia Tech, special thank to Ms. Kanokwan Nontapot, Ms. Boonta Chutvirasakul, and Ms. Monrudee Liangruksa, for their support both for my academic and personal life. I also thank my roommates and friends in Nashville, Mr. Lertop Supadhiloke, Mr. Steven Chen, Ms. Younhee Rye, and Ms. Pimkwan Jaru-ampornpan, for their warm welcome and help, while I live in Nashville.
iv

Last but not least, I would like to show my deeply gratitude to all of my family members in Thailand. I thank my elder brother, Mr. Prapass Wonnapinij, for his practical advice and support. Many thanks to my parents, Pan and Apinya Wonnapinij, I am gratified by being born from these incredible persons. I cannot achieve any goal of my life without their unconditional love, invaluable advice, and warm support. My gratitude to them is ways beyond my words.
v

Table of Contents 1. Chapter1: Introduction……………………………………………………… 1
Section 1.1: Mitochondrial biology……………………………………... 1
Section 1.2: Mitochondrial genetics…………………………………….. 2
Section 1.3: Mitochondrial diseases caused by mtDNA mutations…….. 4
Section 1.4: Pathogenic mtDNA mutations in human population……… 6
Section 1.5: Transmission of human mtDNA ………………………….. 7
1.5.1 Maternal transmission of human mtDNA………………… 7
1.5.2 Transmission of pathogenic mtDNA mutations in human
family…………………………………………………………… 7
1.5.3 MtDNA heteroplasmy inheritance and mitochondrial genetic bottleneck ……………………………………………………… 9
1.5.4 Does selection play a role………………………………… 11
Section 1.6: Application of population genetic theory…………………. 11
Section 1.7: Application of statistical and computational approaches…. 13
Section 1.8: Research motivations…………………………………….... 14
2. Chapter2: A Reduction of Mitochondrial DNA Molecules During Embryogenesis Explains the Rapid Segregation of Genotype………………….. 17
Preface…………………………………………………………………... 18
Abstract…………………………………………………………………. 19
Introduction and discussion…………………………………………….. 19
Methods………………………………………………………………… 22
References……………………………………………………………… 24
Supplementary information……………………………………………. 25
References for the supplementary material……………………. 31
3. Chapter3: The Distribution of Mitochondrial DNA Heteroplasmy Due to Random Genetic Drift……………………………………………………………. 32
Abstract………………………………………………………………… 33
vi

Introduction…………………………………………………………….. 33
Material and methods…………………………………………………... 34
Results………………………………………………………………….. 36
Discussion………………………………………………………………. 38
References………………………………………………………………. 43
4. Chapter 4: Previous Estimation of Mitochondrial DNA Mutation Level Variance Did not Account for Sampling Error: Comparing the MtDNA Genetics Bottleneck in Mice and Humans………………………………………………….. 45
Abstract…………………………………………………………………. 46
Introduction…………………………………………………………….. 46
Material and methods………………………………………………….. 47
Results…………………………………………………………………. 47
Discussion……………………………………………………………... 54
References…………………………………………………………….. 55
5. Chapter 5: The Mother Carrying a High Pathogenic A3243G Mutation Tends to Have Fewer Daughters than Sons……………………………………………. 57
Abstract……………………………………………………………….. 58
Introduction and discussion…………………………………………… 59
Method summary……………………………………………………… 63
References……………………………………………………………. 65
Figures legends……………………………………………………….. 66
Online method………………………………………………………... 67
References……………………………………………………. 69
Figures………………………………………………………………... 72
Supplementary information….……………………………………….. 74
6. Chapter 6: Conclusion and Future Directions………………………….. 79
Section 6.1 Mitochondrial genetic bottleneck……………………….. 79
Section 6.2: Distribution pattern of mtDNA heteroplasmy level……. 79
vii

Section 6.3: Sampling error of heteteroplasmy variance…………….. 79
Section 6.4: The mother carrying a high proportion of A3243G mutation
tend to have fewer daughters than sons……………………………… 80
Section 6.5: Research overview and future directions……………….. 80
References…………………………………………………………………. 83
Appendices……………………………………………………………….... 91
A. Copyright permission letter from Nature Genetics………………. 92
B. Copyright statement for Elsevier’s Journal authors………………. 95
viii

List of Figures 1 Chapter1: Introduction……………………………………………………… 1
Figure 1: The simple structure of mitochondrion……………………………... 1
Figure 2: Schematic diagram of human mitochondrial DNA showing all 37 genes encoded in this organelle genome including some common pathogenic mtDNA mutations……………………………………………………………………… 3
Figure 3: Transmission of mtDNA heteroplasmy level during prenatal development of female germ line. After fertilization, zygote undergoes multiple cell divisions without mtDNA replication to generate blastocyt causing a small copy numbers of mtDNA molecules per blastomere. At implantation, some blastomeres are recruited to be primordial germ cells (PGCs). These PGCs experience serial cell divisions to generate a population of primary oocytes. The mtDNA replication is resumed at an early post-implantation development. The random partition of mtDNA molecules during this prenatal development of female germ lines and stochastic replication of mtDNA molecules during post-implantation development generate variation of heteroplasmy level in the population of primary oocytes.……………………. 10
2 Chapter 2: A Reduction of Mitochondrial DNA Molecules During Embryogen-nesis Explains the Rapid Segregation of Genotype……………………………… 17
Figure 1: The amount of mtDNA in mature mouse oocytes and pre-implantation mouse embryos.(a) Mature oocytes and whole embryos. Box and whisker diagram showing the median, ± 1 s.d.,and the range from maximum to minimum values. (b) Single blastocyst cells (blastomeres) from pre-implantation embryos. Each data point corresponds to a single blastomere. (c) Primordial germ cells (PGCs) from postimplantation mouse embryos on a logarithmic plot. Each data point corresponds to a single PGC. Horizontal line indicates median value. Data from male and female embryos is shown separately for 14.5 d.p.c. Blue circles,males; red triangles, females………………………………………………………………………… 20
Figure 2: Models of the mitochondrial genetic bottleneck. Schematic diagram showing a heteroplasmic fertilized oocyte (top), a model of the mitochondrial genetic bottleneck (middle) and subsequent primary oocytes (bottom). Blue circles, wild-type mtDNA; red circles, mutated mtDNA. Time scale shown on the left in d.p.c. (a) Single-sampling model. A single random sample of mtDNA molecules is assumed to repopulate each primary oocyte. (b) Multiple sampling model. Using an adaptation of the population genetic model of Sewall Wright16, this approach assumes that an identical moderate genetic bottleneck is present over multiple cell divisions, G. In mice, G = 15, which is the number of divisions required to produce the 25,791 primary oocytes present by 13.5 d.p.c.21 from a single blastomere. (c) Complex biological model based upon the number of cell divisions leading up to the formation of 40 primordial germ cells (PGCs) at 7.25 d.p.c., followed by 9–10 cell divisions required to generate the 25,791 PGCs required to form a full complement of primary oocytes (for details see Supplementary Fig (1)…….. 21
ix

Figure 3: Modeling the inheritance of mtDNA heteroplasmy in mice. (a) Comparison between the simulated amount of mtDNA in each cell (solid circles) and the actual amount measured in pre-implantation embryos and primordial germ cells (open circles indicate median, with the range for the laboratory data). (b) Comparison of the heteroplasmy values predicted by the biological model with the actual heteroplasmy values in 246 heteroplasmic mice (open circles). The y axis shows the percentage of NZB mtDNA in the offspring and the x axis the estimated percentage of NZB mtDNA in the founding primordial germ cells (PGCs) of the mother. The solid symbols and lines indicate the 95% confidence interval (CI) for the predicted heteroplasmy level using the biological model (Fig. 2c). (c) Generation of the heteroplasmy variance in the blastomeres and primordial germ cells in a mother with 50% mutated mtDNA………………………………… 22
Supplementary information
Supplementary Figure 1: Comparison between the number of cells simulated and the actual number of cells observed experimentally. The rate of cell division in pre-implantation embryos was derived from Ref1, and for post-implantation embryos from Ref2,3, base upon published values for alkaline pahosphatase stained primordial germ cells (PGCs). PGCs are first discernable at 7.25 days post coitus (dpc) during the mid primitive streak stage, just posterior to the primitive streak in the extra-embryonic mesoderm. Note the logarithmic Y-axis indicating exponential growth to a final figure of 25,791 primary oocytes at day 13.53 …………….. 27
Supplementary Figure 2: The total amount of mtDNA in the simulated mouse embryos to 7 dpc, followed by the total amount of mtDNA in the entire PGC population. Dpc = days post coitus………………………………………….. 28
Supplementary Figure 3: Comparison of three real-time PCR assays targeting different regions of the mitochondrial genome: ND5 (nt12789 to nt12876), ND4 (nt1031 to nt11174), and ND1 (nt2751 to nt3709). Total genomic DNA was extracted from the tail of a C57Bl6 mouse and serially diluted. Each dilution was assayed in quadruplicate using the same methods employed in the manuscript to determine the absolute amount of mtDNA in each sample. The graphs shows two independent serial dilutions of a genomic DNA template serially diluted and measured by two different assays: (a) comparison of ND4 with ND5, (b) comparison of ND1 with ND5, (c) comparison of ND4 with ND1. Pearson’s correlation co-efficient showed a tight correlation in the measured copy number values using each assay (R2 > 0.99). The ND5 assay was used in the experiments described in the manuscript…………………………………………………… 29
3 Chapter 3: The Distribution of Mitochondrial DNA Heteroplasmy Due to Random Genetic Drift……………………………………………………….......... 32
Figure 1: The heteroplasmy distribution of the A3243G mtDNA mutation in a sample of human primary oocytes is compared to the Kimura distribution (A) Frequency histogram of the heteroplasmy in both the data and the Kimura distribution fit to the data. Parameter values for the Kimura distribution are given in
x

Table 1 for all figures. (B) Cumulative probability distribution functions for the data and the Kimura distribution fit to the data. A KS test indicates that there is no significant difference between the measured and the theoretical probability distributions…………………………………………………………………… 34
Figure 2: The measured heteroplasmy distribution from offspring and mature oocytes in the heteroplasmic mouse line 515 is compared to the Kimura distribution (A) The heteroplasmy frequency histogram from the offspring. (B) KS test comparing the offspring heteroplasmy data to the Kimura distribution fit to the data. (C) The heteroplasmy frequency histogram of the mature oocytes in the 515 line. (D) KS test for the line 515 mature oocyte data. There is a significant difference between the two distributions in the mature oocyte data……………………… 36
Figure 3: The measured heteroplasmy distribution from offspring and mature oocytes in the heteroplasmic mouse line 517 is compared to the Kimura distribution (A) The heteroplasmy frequency histogram from the offspring. (B) KS test comparing the offspring heteroplasmy data to the Kimura distribution fit to the data. (C) The heteroplasmy frequency histogram of the mature oocytes in the 517 line. (D) KS test for the data from line 517 mature………………………………... 37
Figure 4: The measured heteroplasmy distribution from mature oocytes and primary oocytes in the heteroplasmic mouse line 603A is compared to the Kimura distribution (A) The heteroplasmy frequency histogram of the mature oocytes in the 603A line. (B) KS test for the data from line 603A mature oocytes.(C) The heteroplasmy frequency histogram of the primary oocytes in the 603A line. (D) KS test for the data from line 603A primary oocytes. There is a significant difference between the two distributions for the primary oocyte data…………………… 38
Figure 5: The measured heteroplasmy distribution from mature oocytes and primary oocytes in the heteroplasmic mouse line 603B is compared to the Kimura distribution (A) The heteroplasmy frequency histogram of the mature oocytes in the 603B line. (B) KS test for the data from line 603B mature oocytes. (C) The heteroplasmy frequency histogram of the primary oocytes in the 603B line. (D) KS test for the data from line 603B primary oocytes…………………………….. 39
Figure 6: The measured heteroplasmy distribution from unfertilized eggs in the heteroplasmic Drosophila mauritiana lines H1, G20-5, and G71-12 is compared to the Kimura distribution (A) The heteroplasmy frequency histogram of the Drosophila line H1 and the Kimura distribution fit to the mean and variance values from these data. (B) The KS test comparing the data with the Kimura distribution. There is a significant difference between the two distributions for line H1. (C) The heteroplasmy frequency histogram for the Drosophila line G20-5 is compared to the Kimura distribution. (D) KS test comparing the data for Drosophila line G20-5 to the Kimura distribution. (E) The heteroplasmy frequency histogram from the Drosophila line G71-12 is compared to the Kimura distribution. (F) KS test comparing the data for Drosophila line G71-12 to the Kimura distribution….. 40
xi
Figure 7: The measured heteroplasmy distribution from unfertilized eggs in the heteroplasmic Drosophila mauritiana lines H1-31M, H1-18D, and H1-12B is compared to the Kimura distribution (A) The heteroplasmy frequency histogram from the Drosophila line H1-31M and the Kimura distribution. (B) The KS test comparing the heteroplasmy data for Drosophila line H1-31M to the Kimura distribution. (C) The heteroplasmy frequency histogram from the Drosophila line H1-18D is compared to the Kimura distribution. (D) KS test comparing the Drosophila line H1-18D to the Kimura distribution. (E) The heteroplasmy frequency histogram from Drosophila line H1-12B is compared to the Kimura distribution. (F) KS test comparing data for Drosophila line H1-12B and the Kimura distribution……………………………………………………………………. 41
Figure 8: Comparison of measured heteroplasmy distribution from Drosophila simulans unfertilized eggs with the Kimura distribution (A) Heteroplasmy frequency histogram and the Kimura distribution fit to these data.(B) KS test comparing the data to the Kimura distribution……………………………….. 42
Figure 9: Comparison of a Kimura distribution, Normal distribution, and Binomial distribution with Mean = 0.1 and Variance = 0.01 (A) Kimura distribution. The probability density (x) is plotted. (B) Normal distribution. (C) Binomial distribution. The mean and variance values require a range of discrete states from zero to nine, giving discrete probability values of 0, 1/9, 2/9, etc……………. 42
4 Chapter 4: Previous Estimates of Mitochondrial DNA Mutation Level Variance Did Not Account for Sampling Error: Comparing the MtDNA Genetic Bottleneck in Mice and Humans………………………………………………….. 45
Figure 1: Measurements of the mean and variance from samples drawn from a Normal distribution. (A) The Normal distribution used with mean = 0.5 and variance = 0.01. (B) Mean values as a function of the sample size N ranging from 3 to 100. The error bars were set to twice the Standard Error of the Mean as calculated from Equation 1. (C) Values of variance as a function of the sample size N. The error bars were set to twice the Standard Error of the Variance for a Normal distribution as calculated from Equation 6. The 95% confidence intervals were determined from the mean and variance values from 10,000 samples of size N………………………………………………………………………………. 48
Figure 2: Measurements of the mean and variance from samples drawn from a Kimura distribution with moderate mean value. (A) The Kimura distribution (p) used with mean p0 = 0.5 and b = 0.9. (B) Mean values as a function of the sample size N ranging from 3 to 100. The error bars were set to twice the Standard Error of the Mean as calculated from Equation 1. (C) Values of variance as a function of the sample size N. The error bars were set to twice the Standard Error of the Variance for a Kimura distribution as calculated from Equations 11 and 2. The 95% confidence intervals were determined from the mean and variance values from 10,000 independent samples of size N.……………………………………… 50
xii

Figure 3: Measurements of the mean and variance from samples drawn from a Kimura distribution with an extreme mean value. (A) The Kimura distribution (p) used with mean p0 = 0.1 and b = 0.9. (B) Mean values as a function of the sample size N ranging from 3 to 100. The error bars were set to twice the Standard Error of the mean as calculated from Equation 1. (C) Values of variance as a function of the sample size N. The error bars were set to twice the Standard Error of the Variance for a Kimura distribution as calculated from Equations 11 and 2. The 95% confidence intervals were determined from the mean and variance values from 10,000 samples of size N.……………………………………………………. 50
Figure 4: Application of the Standard Error of Variance to data from human and mouse models. (A) Heteroplasmic mouse model data from Jenuth et al.12 (circles) at four stages of mtDNA inheritance; primordial germ cells (PGC), primary oocytes, mature oocytes and offspring. Human data (stars) from Brown et al. 13 for primary oocytes and from numerous sources14-36 for offspring data are compared to the mouse data. (B) mtDNA mutation level variance with error bars measured in 21 mouse lineages. All error bars are twice the Standard Error calculated from a Kimura distribution. Variance values are normalized by dividing by p0(1-p0)……………………………………………………………………………... 51
Figure 5: mtDNA mutation level variance with error bars in a mouse model of the post-natal development of oocytes. The data are taken from Wai et al.10 and all error bars are twice the Standard Error of Variance calculated from a Kimura model. Variance values are normalized by dividing by p0(1-p0)…………….. 52
Figure 6: Levene test p-values for comparisons of two data sets with different variances but equal mean mutation levels of 0.5. Both data sets were drawn randomly from a Kimura distribution. The distribution for the first data set was set to have b=0.9 while the value of b for the second distribution was lowered according to Eq. 10 to give the stated variance difference. P-values were calculated using the standard Levene test. The horizontal line indicates a p-value of 0.05……………………………………………………………………………. 53
Figure 7: Levene test p-values for comparisons of two data sets with different variances but equal mean mutation levels of 0.1. Other details are the same as in Figure …………................................................................................................ 53
Figure 8: Dependence of the Standard Error of variance divided by the variance on the mean mtDNA mutation level, p0 and on the sample size, N. (A) Dependence on the sample size N for three values of the mean mutation level. (B) Dependence on the mean mutation level for a range of sample sizes. All Standard Error values are calculated for a Kimura distribution from Equations 11 and 2. All curves were calculated from Equations 11 and 2 with a value of b = 0.9. That b value was chosen as a simple value that was close to the b value calculated from the one human oocyte data set13;38……………………….............................................. 54
5 Chapter 5: The Mother Carrying a High Pathogenic A3243G Mutation Tends to Have Fewer Daughters than Sons........................................................................ 57
xiii
Figure 1 The intergenerational transmission of A3243G mutation level (a) The average mutation level per generation among females was compared across generations from the grandmother’s to the most recent generation. The average mutation level was calculated either from blood or age-corrected blood mutation level (b) The average mutation level per generation among males was compared across generations from the grandmother’s to the most recent generation. The average mutation level was calculated either from blood or age-corrected blood mutation level (c) The average age-corrected blood O-M analysis................... 72
Figure 2: The comparison of the average number of daughters to the average number of sons within the group of mothers carrying low mutation level (maternal age-corrected blood mutation level 50%) and the group pf mothers carrying high mutation level (maternal age-corrected blood mutation level > 50%) ............. 73
xiv

List of Tables 1 Chapter 2: A Reduction of Mitochondrial DNA Molecules During Embryo-genesis Explains the Rapid Segregation of Genotypes………………………….. 17
Table 1: Amount of mtDNA in mature oocytes and pre-implantation mouse embryos………………………………………………………………………. 20
Table 2: Amount of mtDNA in primordial germ cells at different embryonic stages in mice………………………………………………………………………... 21
Supplementary information
Supplementary Table 1: Variation in the level of heteroplasmy between the offspring of heteroplasmic female mice………………………………………. 25
Supplementary Table 2: Oligonucleotide primer sequences used to quantify NZB/C57BL.6J mtDNA heteroplasmy……………………………………….. 26
3 Chapter 3: The Distribution of Mitochondrial DNA Heteroplasmy Due to Random Genetic Drift……………………………………………………………. 32
Table 1: The parameters estimated from experimental data: The mean heteroplasmy, p0, and the b parameter calculated from the variance and the p value calculated from the KS test………………………………………………….. 35
5 Chapter 5: The Mother Carrying a High Pathogenic A3243G Mutation Tends to Have Fewer Daughters than Sons....................................................................... 57
Supplementary information
Supplementary Table 1: The human pedigree data used in the analysis of A3243G heteroplasmy transmission and the effect on female reproduction…………… 74
xv

xvi
PrefaceThe main purpose of this dissertation is to gain insight into how human mtDNA heteroplasmy level is maternally transmitted. Several approaches have been applied to achieve this goal in which each project has been done in a collaborative manner, especially for the project presented in Chapter 2. My chairman, Dr. David C. Samuels, has played an important role in every single project presented in this dissertation. His invaluable suggestions have directed each study to its goal. Each manuscript would not gain recognition without timely discussion with Dr. Patrick F. Chinnery. He has played a role as my experimental and clinical collaborator. He provided the human primary oocyte mtDNA heteroplasmy measurements used in the study presented in Chapter 3
The thorough study of mouse mtDNA heteroplasmy transmission during its embryogenesis presented in Chapter 2 would not be successfully done without a broad collaboration with several research groups. Dr. Patrick F. Chinnery and Dr. Lynsey M. Cree from Newcastle University helped with the designing of the overall experimental study. Dr. Lynsey M. Cree measured mtDNA copy number during mouse embryogenesis from the GFP-Stella mice. The GFP-Stella mouse model was developed by Dr. Susana Chuva de Sousa Lopes from University of Cambridge. The mouse embryogenesis simulation model was designed by Dr. David C. Samuels and programmed by Dr. Hasha Karur Rajasimha from our research group. Dr. David C. Samuels and I carried out this computational simulation model to study how the germ line heteroplasmy variation has been generated during mouse embryogenesis process. We calculated the mtDNA heteroplasmy variance of each stage of mouse embryogenesis simulation and plot the value against the developmental stages (dpc) as shown in Figure 3C in Chapter 2. We also calculated the 95% confident interval of the offspring heteroplasmy level from the simulation. This 95% confident interval was compared to the actual heteroplasmic mouse measurements. These heteroplasmic mice were developed by Dr. Hans-Henrik M. Dahl and Dr. Jeffrey R. Mann from the University of Melbourne.

1 Chapter 1: Introduction Chapter 1 aims to give a brief introduction related to human mitochondrial DNA (mtDNA) heteroplasmy inheritance. In particular, this chapter introduces a general knowledge about mitochondrial biology and genetics, mitochondrial diseases caused by pathogenic mtDNA mutation, the prevalence of mitochondrial diseases and pathogenic mtDNA mutation in the human population, and the transmission of human mtDNA heteroplasmy level. It also introduces a basic concept in population genetic theory and how to apply it to understand the segregation pattern of human mtDNA heteroplasmy level. The application of statistical analysis and computational simulation to understand the transmission of human mtDNA heteroplasmy level is also briefly mentioned in this chapter. The last section of this chapter, research motivations, discusses why we do all the studies presented in this dissertation.
Section 1.1: Mitochondrial biology
A mitochondrion is a small-dynamic organelle localized in the cytoplasm of a eukaryotic cell. This organelle is composed of two compartments, intermembrane space and matrix. The two main compartments are separated by two membranes, an outer and an inner membrane. The intermembrane space surrounds by the outer and the inner membrane. The matrix surrounds by the inner membrane. The inner membrane convolutes into the matrix to form the structure called cristae [1]. Mitochondrial DNA (mtDNA) is localized in the matrix. Figure 1 presents a diagram of the simple structure of the mitochondrion.
Figure1: The simple structure of the mitochondrion
Each compartment and membrane of mitochondrion contains a unique set of proteins functioning in different cellular mechanisms; for example all enzymes functioning in the citric acid cycle are localized in the matrix, and the transport proteins functioning in the oxidative phosphorylation process (OXPHOS) are embedded in the inner membrane. Although the schematic picture of the mitochondrion is generally presented as a static bean shape structure resembling bacteria as shown in Figure 1, this organelle is actually highly dynamic in that it moves in the cytoplasm using actin and myosin motors, changes its shape, and undergoes
1

frequent fission-fusion processes [2-6]. The dynamics of mitochondrial morphology are associated with its function [7-8].
Mitochondria play a key role in many cellular mechanisms such as amino acid metabolism, citric acid cycle, fatty acid catabolism, programmed cell death (apoptosis) and aging [9-12]. Mitochondrial dysfunction has also been observed in association with human diseases such as Parkinson’s disease [13-16], Alzheimer’s disease [17] and cancer [18-21]. The largest category of human diseases caused by mitochondrial gene mutations, located both in nuclear and mitochondrial genomes, is metabolic disease. There are also a large number of human diseases caused by mitochondrial gene mutations that affect multiple-tissue functions and cannot be classified [22]. Perhaps the most important function of mitochondria is as the center of Fe/S protein synthesis because this protein is essential for functional protein synthesis machinery [23].
The two critical roles of mitochondria involve OXPHOS, to produce cellular energy, and to regulate the apoptosis process, programmed cell death. The OXPHOS mechanism produces energy by transferring electrons generated from dietary calories through complex proteins located in the mitochondrial inner membrane. There are four complexes functioning in the electron transport chain: complex I (NADH dehydrogenase; EC 1.6.5.3), complex II (succinate dehydrogenase; EC 1.3.5.1) complex III (cytochrome bc1 complex; EC 1.10.2.2), and complex IV (cytochrome c oxidase; EC 1.9.3.1) [1, 9]. An electron is transported from complex I to complex IV creating a proton gradient across the mitochondrial inner membrane. This proton motive force drives complex V (ATP synthase) to produce cellular energy or adenosine triphosphate (ATP) from adenosine diphosphate (ADP), coupled with proton flow into the mitochondrial matrix [1, 9]. The OXPHOS process also produces toxic by-products called reactive oxygen species (ROS) which are harmful to both nuclear DNA (nDNA) and mitochondrial DNA (mtDNA) in the sense that they can mutate the DNA molecule. ROS is also hypothesized to be a major factor inducing apoptosis, causing progression of age-related diseases, and generating cancer [24].
Section 1.2: Mitochondrial genetics
Mitochondria have their own genetic material separated from the nuclear DNA (nDNA), called mitochondrial DNA (mtDNA). The size and the number of genes encoded in the mitochondrial genome are highly varied among different eukaryotes [25]. Eukaryotic mtDNA is mostly observed as a circular molecule; however a linear form has been observed as well [1]. In most organisms, mtDNA is maternally inherited; however the paternal leakage of mtDNA also exists in a variety of organisms [26-29].
Based on a serial endosymbiosis theory, the mitochondrion was a free-living bacterium that was engulfed by a nucleus containing eukaryote and developed an endosymbiotic relationship with the host cell. This serial theory has been challenged by the studies of some unicellular organisms. The results indicated the possibility that the mitochondrion may originate in a contemporary eukaryotic ancestor at approximately the same time as the nucleus [30]. The DNA sequence comparison had been applied to specify the bacterial ancestor of the mitochondrion. The protein sequence analysis result indicated that the mitochondrion is evolved from a purple photosynthetic bacterium in which its ability of photosynthesis had been previously lost [1]. During the course of evolution, many proto-mitochondrial genes were transferred to the nucleus of the eukaryotic cell. Different organisms have maintained different
2

genes in their mitochondrial genome; however the principle set of genes are maintained: some ribosomal RNA (rRNA) genes, some transfer RNA (tRNA) genes, some polypeptide-encoding genes, and a non-coding control region containing an origin of replication and promoters [31-32]. Therefore complex proteins functioning in a mitochondrion, especially the complex proteins associated with the OXPHOS, are encoded both in nuclear and mitochondrial genomes.
Human mtDNA is a 16,569 bp double-stranded circular molecule, almost exclusively transmitted through the maternal lineage with only a single case of paternal leakage reported [29]. The heavy strand (H strand) mtDNA is a guanine rich stand, while the light strand (L strand) is a cytosine rich strand. The human mitochondrial genome has a higher gene density than the nuclear genome because it codes for 37 genes with no introns in the coding region and only approximate 1 kb for non-coding region called D-loop. The D-loop contains essential components for mtDNA replication and transcription: H-strand origin of replication (OH) and two promoters for both H and L strand mtDNA transcription. The 37 genes in the mitochondrial genome code for 13 polypeptides, 22 tRNAs and 2 rRNAs. All protein-coding genes are evenly distributed through the mitochondrial genome, interspersed by 22 tRNAs coding genes with 2 rRNAs coding genes that are sequentially located next to the D-loop as shown in Figure 2 [33]. All 13 polypeptides are essential subunits of transport proteins in OXPHOS process: 7 subunits for complex I, 1 subunit for complex III, 3 subunits for complex IV, and 2 subunits for complex V or ATP synthase [24]. All other OXPHOS protein subunits and other mitochondrial proteins are encoded in nuclear DNA (nDNA). Based on recent estimation, there are approximately 1,500 genes products contributing to the mitochondrial proteome, indicating that most of mitochondrial proteins are encoded in the nuclear genome [34]. The 22 tRNAs and 2 rRNAs are essential for intra-mitochondrial protein translation mechanism.
Figure 2: Schematic diagram of human mitochondrial DNA showing all 37 genes encoded in this organelle genome including some common pathogenic mtDNA mutations
3

Generally, different cell types contain different numbers of mitochondria. This number ranges from several hundred to several thousand mitochondria per cell, basically determined by energy requirement of the cell. Each mitochondrion contains multiple copies of mtDNAs ranging from 2 to 10 molecules [9]. The multiple copies of mtDNAs are not randomly distributed. They are rather distributed to several clusters in the matrix of each mitochondrion. Several mitochondrial DNAs in each cluster are packed together in a nucleoprotein complex structure called a nucleoid [35-37]. Each nucleoid is attached to the inner membrane of each mitochondrion [1]. Taking into account both the multiple number of mitochondria per cell and the multiple copies of mtDNAs per mitochondrion, a single eukaryotic cell contains a large copy number of mtDNAs. The variation of mtDNA copy numbers ranges from several hundred to several hundred thousand mtDNA molecules per cell; for example the mtDNA copy number in a human primary oocyte is approximately 100,000 molecules.
The state of a single cell containing multiple copies of mtDNAs is called polyploidy. In the sense of the content of mtDNAs in a single cell or a single tissue, if it contains only one type of mtDNA, this mitochondrial genetic condition is called homoplasmy. On the contrary, if a single cell or tissue contains a mixture of two or more types of mtDNA, this mitochondrial genetic condition is called heteroplasmy. Typically, the tissue sample of the patient diagnosed as carrying mitochondrial disease causing by the pathogenic mtDNA mutation contains both mutant and wild type mtDNAs, the heteroplasmic condition.. The quantity of heteroplasmy is measured as the proportion of the mutant mtDNAs to the total mtDNAs, thereby the heteroplasmy level ranges from 0% (wild type homoplasmy) to 100% (mutant homoplasmy).
Section 1.3: Mitochondrial diseases caused by mtDNA mutations
Clinical features of mitochondrial disease caused by a pathogenic mtDNA mutation are generally presented as adult-onset with a progressive course similar to an age-related disease phenotype. Pathogenic mtDNA mutations causing disease presents both as a multi-systemic and a tissue-specific disease [38]. Typically, disease-related tissues are among the ones requiring high energy levels to maintain their normal function such as brain, heart, skeletal muscle and kidney. Specific symptoms include blindness, deafness, movement disorder, cardiovascular disease and renal dysfunction [24]. The accumulation of mutated mtDNA in specific cell or tissue with age is proposed as an explanation of the adult-onset with progressive course of disease associated with mtDNA mutations [24]. Some pathogenic mtDNA mutations have been observed to cause a reduction of human reproductive fitness; for example the m.3243A>G mutation can cause male infertility by slowing sperm motility [39]. This mutation has been suspected to increase a risk of spontaneous abortion among females carrying this mutation [40-45], although one study indicated that there is non-significant difference of female reproductive fitness between carriers and the general population [46].
Pathogenic mtDNA mutation can be classified into three categories based on the type of mtDNA mutation and its position in the mitochondrial genome: mtDNA rearrangement, mtDNA point mutation in protein coding region, and mtDNA point mutation in RNA coding region [24, 47].
In general, pathogenic mtDNA rearrangement mostly refers to a large-scale deletion of mtDNA, which has a low recurrence risk leading to the general point of view that it is not transmitted through maternal lineage. A single large deletion of mtDNA, approximately 5 kb in
4

size, has been observed in patients with Kearns-Sayre syndrome (KSS; OMIM#530000) and Pearson marrow pancreas syndrome (OMIM#557000). An affected individual with KSS or Pearson syndrome usually has healthy parents and siblings indicating that this mutation has not been maternally transmitted [48]. However rare cases of pathogenic mtDNA deletion being transmitted from the mother to her offspring have been reported [49-50]. The actual transmitted molecule that leads to mtDNA deletion in the offspring was thought to be mtDNA duplication rather than the mtDNA deletion itself [51]. Although the observation of a mother and her son both carrying an identical single large deletion associated with KSS leads to a possibility that a single large mtDNA deletion may be maternally inherited as well [49-50].
On the other hand, pathogenic mtDNA point mutations, either in protein-coding region or RNA coding region, is usually maternally inherited, such as m.11778G>A (OMIM*516003.0001), m.3243A>G (OMIM*590050.0001), and m.8344A>G (OMIM* 590060.0001). However, there are some pathogenic mtDNA point mutations that were not transmitted to the next generation. The occurrence of a sporadic pathogenic mtDNA mutation may be caused either by de novo mutation occurring only in an affected somatic tissue or by selection against a severe mutated mtDNA in germ line generating an extremely large shift in heteroplasmy level between a mother and her offspring [47, 52-54].
Typically, an affected individual carries a pathogenic mtDNA mutation in a heteroplasmic condition, although affected individuals who carry mutant homoplasmy of a particular pathogenic mtDNA mutation have been observed as well. The pathogenic mtDNA mutations observed in mutant homoplasmic individuals usually cause tissue-specific disease phenotypes, for example m.11778G>A and m. 3460G>A, the pathogenic mtDNA mutations observed in LHON patients affect retinal ganglion cells causing blindness [55].
Mitochondrial diseases caused by pathogenic mtDNA mutations generally have incomplete penetrance indicating the requirement of other factors to determine an expression of the disease associated with the mutation. Primarily, the expression of the disease phenotype is determined by the mtDNA heteroplasmy level in which the proportion of mutant mtDNA needs to exceed the threshold level. The threshold level varies between different pathogenic mtDNA mutations and different tissues. For example the threshold level for m.3460G>A mtDNA mutation is approximately 60% [56], while the threshold level for m.3243A>G mtDNA mutation is approximately 95% [57]. Whether the mitochondrial dysfunction is simply caused by inadequate number of wild type mtDNA depends on the type of pathogenic mtDNA mutation [58].
Even though exceeding the threshold level is necessary, in most cases, it may not be sufficient to determine an expression of disease phenotype primarily caused by the pathogenic mtDNA mutation. The modifying factors include co-segregation of secondary mtDNA mutation, nDNA modifiers, or mtDNA haplotype. These modifiers can either determine whether the disease phenotype is expressed or modulate the severity of disease phenotype. For example, coexistence of m.14693A>G with the primary LHON mutation, m.3460G>A, observed in a Han Chinese family may increase a risk of being blind among kindred of this family because the m.14693A>G can alter the tertiary structure tRNAGlu causing tRNAGlu function to change [59]. Identification of X-chromosomal haplotype interacting with specific MTND mtDNA mutation causing visual failure in LHON patients supports the notion that the expression of mitochondrial disease can be modified by a nDNA modifier [60]. The observation of an increased risk of
5

visual failure associated with m.11778G>A or m.14494T>C among haplogroup J2 and J1, respectively, supports that the expression of disease phenotype may partly be determined by a genetic background of mtDNA [60].
Therefore, although an understanding of human mtDNA heteroplasmy transmission may help predict offspring heteroplasmy level, identifying other factors, both genetic and environmental factors, is perhaps more important. There are some fundamental questions yet to be answered: How does the secondary mtDNA mutation modify the effect of the primary mtDNA mutation? How does nDNA interact with mtDNA to modify an expression of the disease of interest? Can we identify primary-secondary mtDNA interaction and/or nuclear-mitochondrial interaction and how can we do it? Does mitochondrial haplotype influence the prevalence of a particular mtDNA mutation in the population?
Section 1.4: Pathogenic mtDNA mutations in human population
The minimum prevalence of mitochondrial disease both in adult and childhood populations estimated from several published literatures is approximately 1 in 5000 individuals [61]. This estimate includes both nDNA and mtDNA mutations causing mitochondrial disease in human population; the prevalence of mitochondrial disease caused by pathogenic mtDNA mutation, therefore should be less than this estimate. However, the prevalence of the pathogenic mtDNA mutation in human population cannot accurately be implied from this estimate because the prevalence of affected individuals with mitochondrial disease is subject to an ascertainment bias.
Perhaps, the most common pathogenic mtDNA mutation is the m.3243A>G mutation associated with a variety of human diseases, such as type II diabetes and MELAS. Therefore, there have been a number of epidemiological studies of this mutation in several human populations.
The first epidemiological study to estimate the prevalence of the m.3243A>G mutation was done in an adult population of Northern Ostrobothnia in Finland, yielding the prevalence of this mutation at approximately 16.3 in 100,000 [62]. The more recent report on the prevalence of pathogenic mtDNA mutations in human population was estimated from the working-age population of the Northeast of England. The results showed that approximately 9.2 in 100,000 affected individuals with mitochondrial disease and 16.5 in 100,000 unaffected first-degree relatives of the affected individuals carry pathogenic mtDNA mutations. Therefore, the prevalence of pathogenic mtDNA mutations in this population is approximately 25.7 in 100,000 individuals with approximately 7.69 in 100,000 individuals carrying m.3243A>G mutation [63]. The prevalence of m.3243A>G mutation in the Northeast of England seems to be half that of the Finnish population.
Another epidemiological study in the childhood population of the Northern Ostrobothnia in Finland reported the prevalence of the m.3243A>G mutation at approximately 18.4 in 100,000 individuals. This population was ascertained through their disease phenotype identified in the category of mitochondrial disease [64]. The epidemiological study in the population of the Australian cohort, considered a Caucasian-based population, yields the prevalence of this mutation in general population at approximately 236 in 100,000 individuals [65]. This epidemiological study reliably indicates the prevalence of this mutation in general Australian
6

population because it was estimated from all consenting individuals, both affected and healthy, minimizing the effect of ascertainment bias.
Another common pathogenic mtDNA mutations are the ones associated with LHON diseases. The prevalence of LHON disease in Finland estimated from the entire population is approximately 2 in 100,000 of the population with the prevalence of LHON carriers is 1 in 9000 of the population. These carriers carry one of the most common LHON mutations: m.11778G>A, m.3460G>A, and m.14484T>C [66]. The epidemiological study of LHON disease in the population of North East of England yields the prevalence of visual failure caused by LHON disease at approximately 3.22 in 100,000 of the population. The prevalence of the three most common LHON mutations in this population is approximately 11.82 in 100,000 of the population [67]. Both the prevalence of LHON disease and LHON mutations in these two populations are quite similar.
The most recent study of the prevalence of pathogenic mtDNA mutation in the general population was done prospectively in the population of North Cumbria in England by screening through the neonatal-cord-blood samples of live births. The result of this study presents the prevalence of 10 pathogenic mtDNA mutations including MELAS and LHON mutations: m.1555A>G, m.3243A>G, m.3460G>A, m.7445A>G, m.8344A>G, m.8993T>G, m.11778G>A, m.13513G>A, m.14459G>A, and m.14484T>C, in the general population at approximately 1 in 200 individuals with mutation rate at approximately 1 in 1000 individuals [68]. Overall prevalence of the pathogenic mtDNA mutation in the general population may be more common than previously thought.
The diverse prevalence of pathogenic mtDNA mutations from different studies may be the result of the individuals in each study being ascertained to different clinical features, the data being collected in different timelines with variation of individuals’ age, and different genetic backgrounds of individuals in the study. Thus the prevalence estimated from one population may not reliably predict the prevalence of the same pathogenic mtDNA mutation in other populations.
Section 1.5: Transmission of human mtDNA
1.5.1 Maternal transmission of human mtDNA
Human mtDNA is almost exclusively maternally inherited [69]. The degradation of ubiquitin-tagged mammalian sperm mtDNA at an early pre-implantation embryo supports uniparental inheritance of mtDNA [70]. Until now, only a single case of paternal leakage of human mtDNA has been observed in a muscle sample of an affected male with myopathy [29]. The systematic studies in other patients with sporadic mitochondrial myopathy indicate no transmission of paternal pathogenic mtDNA mutation implicating a very low probability of paternal leakage of human mtDNA [71-72]. Therefore in terms of clinical concern, only mothers who carry a pathogenic mtDNA mutation can pass her mtDNA defect to her offspring.
1.5.2 Transmission of pathogenic mtDNA mutation in human family
A mother carrying a pathogenic mtDNA mutation in homoplasmic condition always has offspring carrying mutant homoplasmy. This transmission pattern is frequently observed in
7

human family carrying LHON mutations [73-75] because LHON mutations generally have low penetrance requiring modifying factors, such as a secondary mtDNA mutation and nDNA mutation, to determine an expression of the disease phenotype [60, 76-77]. Phenotypic variation of LHON disease is generally observed among family members carrying the same heteroplasmy level [73, 78].
A mother carrying a heteroplasmic pathogenic mtDNA mutation transmits a varied proportion of mutant mtDNA to her offspring generating a large random shift in heteroplasmy level between herself and her offspring as well as among her offspring siblings [79-81]. Both intergenerational and intra-generational variation of heteroplasmy level complicates a prediction of recurrence risk in a family carrying a pathogenic mtDNA mutation. This complication leads to an uncertainty in genetic counseling for a family carrying a pathogenic mtDNA mutation [82-88].
Whether the large shift in heteroplasmy level between a mother and her offspring is purely random, or subject to positive selection, remained to be revealed. The transmission of single generation human mtDNA heteroplasmy level was studied from human clinical pedigrees carrying one of the six common pathogenic mtDNA mutations (m.8344A>G, m.3243A>G, m.8993T>G/C, m.11778G>A, and m.3460G>A). The results showed that the transmission of m.3243A>G, m.8993T>G and m.11778G>A is in favor of inheriting mutant mtDNA, while the transmission of m.8344A>G seemed to be in favor of inheriting wild type genome [89]. The preferential transmission of the m.3243A>G and m.8993T>G mtDNA mutations was also observed in other independent human clinical pedigree data. The result presented statistically significant differences in heteroplasmy level between mother and her offspring carrying these two pathogenic mtDNA mutations [90]. The transmission of m.8993T>C and m.11778G>A seems to be in favor of inheriting the mutant genome but the deviation of the distribution of their intergenerational difference of heteroplasmy level does not reach statistical significance [89]. There is no gender bias of human mtDNA heteroplasmy transmission observed from the study of human clinical pedigree data of m.3243A>G, m.8363G>A, m.8344A>G, and m.8993T>G/C [90].
The fact that these studies were done retrospectively via human clinical pedigree data, the interpretation drawn from these analyses can easily be deceived by an ascertainment bias [89]. Generally for the study of human mtDNA heteroplasmy transmission, the ascertainment bias is simply adjusted by excluding all probands from the analysis, although this simple procedure is not an effective way to eliminate this confounding factor. Therefore the refined process to eliminate the ascertainment bias from human clinical pedigree data used for the study of human mtDNA heteroplasmy transmission is needed to be developed since this type of human data plays a key role in the study of pathogenic mtDNA heteroplasmy transmission.
The variation of mtDNA heteroplasmy level between different tissues and its change over time would be another source of concern. The measurement of m.3243A>G heteroplasmy level from different tissues of an individual indicated a large variation of this mtDNA mutation level between different tissues [91]. As well, the exponential decrease of blood m.3243A>G heteroplasmy level with age has been reported [92-95]. This exponential decrease can be explained by selection against blood stem cells carrying a high proportion of this mutant mtDNA [93]. However, the measurement of m.8993T>G/C heteroplasmy level from several tissues does not show variation of heteroplasmy levels between different tissue types. The longitudinal study
8

of this mutation based on blood sample measurement also presents non-significant change with age [96]. Thereby different pathogenic mtDNA mutation may have different pattern of heteroplasmy segregations between tissues and its heteroplasmy level may or may not change with age.
Different pathogenic mtDNA mutations present different size of intergenerational random shift in heteroplasmy level. A rapid shift is commonly observed in the families carrying m.8993T>G mutation. The fixation of mutant mtDNA may happen within a single generation [96-97]. However, the rapid shift is less likely to be observed in the family carrying the m.8344A>G mtDNA mutation [79]. The difference of the intergenerational random shift in heteroplasmy level between different pathogenic mtDNA mutations may imply an observation of different size of pedigrees carrying different mutations. The size of m.8993T>G pedigree tends to be smaller than the size of m.8344A>G pedigree. The size difference of random shift between different pathogenic mtDNA mutations also suggests different transmission mechanisms generating offspring heteroplasmy level.
1.5.3 MtDNA heteroplasmy inheritance and mitochondrial genetic bottleneck
In principle, the differences between an organelle and a nuclear genome transmission are genotypic segregation during mitotic cell division, relaxed replication of organelle DNA, stochastic partition of organelle DNA, random intracellular selection, uniparental inheritance, and reduced recombination [98]. These characteristics of the organelle DNA transmission make it distinct from the nuclear DNA transmission, thereby the principle of Mendelian genetics cannot be applied to predict an outcome of the organelle genome transmission.
The study of maternal transmission of a neutral mtDNA polymorphism in Holstein cattle is the first study presenting a large random shift in allele frequency of mtDNA between mother and her offspring leading to a fixation of a particular allele within a few generations [99]. The hypothesis of mitochondrial genetic bottleneck is raised to explain this rapid shift of mitochondrial allele in that the restricted number of mtDNAs repopulates the next generation mtDNA population. The hypothesis of mitochondrial genetic bottleneck has gained supported by the experimental result in a mouse model carrying a neutral NZB/BALB mtDNA. The comparison of the average mtDNA heteroplasmy level of the offspring to the maternal heteroplasmy level showed that these two values are approximately equal, supporting the random segregation of mtDNA heteroplasmy level. The comparison of mtDNA heteroplasmy variance across different stages of female germ line development- primordial germ cell (PGC), primary oocyte, and mature oocyte, until the offspring- indicated that the largest variation of heteroplasmy level is generated during the proliferation of PGCs to generate primary oocytes [100]. The stochastic partition and relaxed replication of mtDNA during the proliferation of PGCs generates variation in heteroplasmy level among primary oocytes of the mother, as shown in Figure 3. However whether the restricted number of mtDNA molecules repopulates the next generation mtDNA population, remains to be explored.
9

Figure 3: Transmission of mtDNA heteroplasmy level during prenatal development of female germ line. After fertilization, zygote undergoes multiple cell divisions without mtDNA replication to generate blastocyt causing a small copy numbers of mtDNA molecules per blastomere. At implantation, some blastomeres are recruited to be primordial germ cells (PGCs). These PGCs experience serial cell divisions to generate a population of primary oocytes. The mtDNA replication is resumed at an early post-implantation development. The random partition of mtDNA molecules during this prenatal development of female germ lines and stochastic replication of mtDNA molecules during post-implantation development generate variation of heteroplasmy level in the population of primary oocytes.
Due to technological advances, the measurement of mtDNA copy number in a single cell can be done, which will allow us to directly test the mitochondrial genetic bottleneck hypothesis. In 2007, Cao L et al. measured mtDNA copy number per cell in various stages of early oogenesis starting from pre-implantation embryo to mature oocyte. They observed non-significant changes of mtDNA copy number between different stages during this early germ-line development, then they concluded that the mitochondrial genetic bottleneck is a segregation of a small number of mitochondrial segregating units, either nucleoids or actively replicating clusters of mtDNA molecules, without a drastic reduction of mtDNA copy number per cell during this prenatal germ-line development [101]. In 2009, this conclusion was supported by the experimental result in the mouse model observed by the same research group [102]. However, this conclusion is contradicted by our experimental observation in the GFP-Stella mouse model in that there is a drastic reduction of mtDNA copy number per cell during a blastocyst formation generating a small mtDNA copy number in a primordial germ cell. The detail of this study is presented in Chapter 2. Therefore, based on our observation, we concluded that mtDNA
10

molecules well serves as the mitochondrial segregating unit in which its random partition during pre- and early-post implantation development largely generates offspring heteroplasmy variation [103].
The reduction of mtDNA copy number per cell during the blastocyst formation generating a small mtDNA copy number per cell in a primordial germ cell has gained supported by an independent study done by Wai T et al. in 2009 [104]. They measured mtDNA copy number per cell and mtDNA heteroplasmy level from germ line cells generated during both prenatal and postnatal oocyte developments. Their result showed that only the mtDNA heteroplasmy level variance measured from the germ line cells before postnatal day 11 significantly differs from the value measured from the germ line cells after postnatal day 11. Therefore, they concluded that the variation of offspring heteroplasmy levels has been largely generated during postnatal development of the female germ line cells by random segregation of mitochondrial nucleoids [104].
Even though the mitochondrial genetic bottleneck theory seems to be the principle mechanism determining offspring heteroplasmy level, there are several important issues left to debate, especially about what the mitochondrial segregating unit is and when the mtDNA heteroplasmy variance is generated [105].
1.5.4 Does selection play a role?
The different rate of mtDNA heteroplasmy segregation between different pathogenic mtDNA mutations implies that different mechanisms regulate transmission of pathogenic mtDNA heteroplasmy level. The variation of the sizes of intergenerational random shift in heteroplasmy level may be caused by different degrees of selection.
An experiment in mutator mice showed that nonsynonymous mutation in mitochondrial protein coding region is subject to a purifying selection. This mutator mouse was generated by introducing mutated proofreading PolG gene into the founder female mouse, which then was mated with a normal male mouse to eliminate the mutator gene [106] allowing Stewart et al. (2008) to study the inheritance of mtDNA mutations [107]. The rate of non-synonymous mutation loss is as fast as within two generations, while the synonymous mtDNA mutation is still segregated [107]. They also observed a high mutation rate in tRNA and rRNA codiging regions in this mutator mouse indicating that mutation in these regions may be non-lethal or more compatible to life than the mutation in protein coding region; however the pattern of mutation rate of these regions in the mutator mouse is inconsistent with the pattern observed in natural mouse strains and in humans. Within the category of mitochondrial protein coding gene, some genes presented a higher rate of mutations than others such as the MTCYB, MTATP6 and MTATP8 genes. These excess mutated genes can be observed from both the mutator mouse and human. The excess of mutation in MTATP6 gene may explain why we observed a large number of de novo mutations and rapid segregation of mtDNA heteroplasmy level of the pathogenic m.8993T>G mutation [96].
Section 1.6: Application of population genetic theory
The population genetic theory of random drift can mathematically describe random segregation of mtDNA heteroplasmy level. The mathematical formula of random genetic drift theory was
11

first introduced in the field of mitochondrial genetics by Solignac et al. in 1984 [108]. They applied the Sewall-Wright variance formula, shown in equation 1, to describe the variation of mtDNA heteroplasmy level calculated from various generations descendent of Drosophila mauritiana and to predict the evolution of the variation of the descendents’ mtDNA heteroplasmy level. In population genetic theory, this variance formula mathematically explains the variation of neutral allele frequencies in a finite population that its allele frequency is cha g g ]. n ed by samplin error [109
1
The variance of neutral allele frequencies (Vt) at any time t depends on a founder population allele frequency (p0), an effective population size (Neff), and the duration time of the development of allele frequency simply counted as a number of generations (t). Practically, in the field of mtDNA heteroplasmy inheritance, we can directly measure the heteroplasmy variance at a particular generation (Vt) and the founder female heteroplasmy level (p0). The number of generations (t) can be either the number of organism generations as used in the study of D. mauritiana mtDNA heteroplasmy segregation [108] or the number of cell divisions required to generate a population of female mouse germ line cells [100].
The general use of the Sewall-Wright variance formula to understand mtDNA heteroplasmy inheritance is to estimate the size of a mitochondrial bottleneck which is the effective population size in the equation (Neff). The effective population size can be calculated from the formula, shown in equation 1, by substituting the heteroplasmy variance value (Vt), the founder female heteroplasmy level (p0) and the number of generations (t) in the equation. By assuming the number of generations to be equal to 15 corresponded to the estimated number of cell divisions required to produce a population of mouse primary oocytes, the bottleneck size of germ line mouse is approximately 185 [100]. In human, the estimated number of cell divisions required to produce a population of human primary oocytes is equal to 23. By using this estimated value for the parameter t in equation 1, the predicted human germ line bottleneck size is 173, which is close to the bottleneck size in the neutral mouse model [110].
The Sewall-Wright variance formula has a limitation. It cannot describe the distribution pattern of allele frequencies in the population of interest. However, there is an attempt to apply this variance equation to generate the distribution of mtDNA heteroplasmy levels. Poulton et al. in 1998 developed a repeat-selection model based on this variance formula. Given known mitochondrial bottleneck size and assumed number of generations, a discrete distribution of mtDNA heteroplasmy levels can be estimated [111]. Theoretically, the distribution of allele frequencies in the population subject to random drift process can be obtained from the Wright-Fisher model. This model uses binomial sampling process to describe the segregation of allele frequencies in the population given that the parameter Neff and t in the Sewall-Wright variance formula are known or can be estimated [112]. However, the issues of what the mitochondrial segregating unit is and how many generations the mtDNA heteroplasmy is segregated cause complications to estimate values for the parameters Neff and t, respectively. In addition, the discrete distribution of mtDNA heteroplasmy levels estimated from either the Poulton’s model or the theoretical Wright-Fisher model does not correspond to the continuous distribution of
12
mtDNA heteroplasmy levels. A novel approach to approximate the distribution of mtDNA heteroplasmy levels needs to be investigated.
Section 1.7: Application of statistical and computational approaches
The statistical inferences and computational simulation models based on Monte-Carlo method have been applied through all the studies presented in this dissertation. These two approaches have different advantages and were used for different purposes. Most of the times, these two approaches complement each other.
The advantage of applying statistical analysis in the study is the biological interpretation is drawn from the actual measurements either from clinical or experimental data, although the interpretation is limited to availability and quality of the actual measurements. In the field of mitochondrial genetics, the general statistical analysis was applied to a large number of human clinical pedigrees in order to understand human mtDNA heteroplasmy inheritance. For example, a relationship between a maternal heteroplasmy level and a probability of having an affected offspring was statistically estimated from a collection of human clinical pedigree data. The student’s t test and the 2 analysis were applied to examine an impact of a possible confounding factor and the relationship between the maternal heteroplasmy level and the probability of having an affected offspring, respectively [113]. Testing whether the average of the difference heteroplasmy level between a mother and her offspring significantly differs from zero and whether its distribution significantly deviates from the normal distribution help to determine the mechanism of mtDNA heteroplasmy transmission [89]. Perhaps, the most important issue of human clinical pedigree data analysis is the confounding effect of the ascertainment bias. Until recently, there still has no effective way to eliminate this confounding factor from the study of human mtDNA heteroplasmy inheritance.
The computational simulation study has an advantage of conquering the limitation of the actual measurements both in terms of quality and quantity. Its flexibility would be useful for testing some hypotheses without having to have the actual measurements. However the application of the simulation model depends on its assumptions. The pedigree simulation of an inheritance of complex trait including mitochondrial genome was designed based on a set of theoretically mathematical functions. This model would be of benefit to the study of nuclear-mitochondrial interaction in determining an expression of a human disease, although this model did not take into account the effect of mtDNA heteroplasmy level [114]. Therefore, the intergenerational segregation of mtDNA heteroplasmy levels still needs to be modeled.
Throughout the dissertation, the statistical analysis is performed using a variety of software such as Microsoft Excel (Microsoft software), Origin (OriginLab Corporation), and R (R foundation for statistical computing). The simulation code is implemented in C/C++ programming using a sequential design. The general purpose of all simulation models presented in this dissertation is to generate synthetic data of mtDNA heteroplasmy levels for hypothesis testing. The synthetic data is a set of random numbers drawn from a particular distribution function. The parameters of the distribution were either arbitrarily determined or estimated from the actual measurements of mtDNA heteroplasmy level.
13

Section 1.8: Research motivations
The previous sections present the general background that is relevant to human mtDNA heteroplasmy inheritance, the basic questions in the research field and the brief methodological approaches being applied in the study. This section aims to list the specific questions addressed in the dissertation and briefly explain how each study helps to gain understanding of human mtDNA heteroplasmy inheritance.
Human mtDNA is almost exclusively maternally inherited presenting a large random shift in proportion of mutant mtDNA between a mother and her offspring and a variation of this proportion among siblings. The mitochondrial genetic bottleneck is broadly hypothesized as the main mechanism generating this two dimensional variation [89, 99]. The experiment in a neutral mouse model shed some light on when this mechanism happened during mammalian embryogenesis and how large the bottleneck size should possibly be, although neither the direct measurements of mtDNA copy numbers nor the complete picture of how the variation being generated by the mitochondrial genetic bottleneck had been presented [100]. Thus this left us an important question which is,
How does the mitochondrial genetic bottleneck happen during mammalian embryogenesis generating mtDNA heteroplasmy variance?
By working closely with our experimental collaborators, we can address this question by building an embryogenesis simulation model based on the mtDNA copy number directly measured from the mouse model during its embryogenesis. The effectiveness of the simulation model in estimating mtDNA heteroplasmy variation is examined by the comparison of the simulated germ line heteroplasmy variation to the actual measured mouse mtDNA heteroplasmy variation. Answering this question using the experimental mouse model helps us gain insight into the cellular mechanism of mammalian mtDNA heteroplasmy transmission, which has an implication for the human mtDNA heteroplasmy transmission. The detail study is presented in Chapter 2 [103].
Another approach to understand the human mtDNA heteroplasmy transmission is through indentifying the distribution pattern of mtDNA heteroplasmy levels among siblings of a single maternal ancestor, leading to the question:
What is the distribution pattern of an offspring’s mtDNA heteroplasmy level?
We addressed this question by applying a set of probability distribution functions developed in the field of population genetics to describe the distribution pattern of mtDNA heteroplasmy levels. These probability distribution functions were developed on the basis of random drift theory. The efficacy of these probability functions to describe the distribution of mtDNA heteroplasmy levels is demonstrated by the comparison of the theoretical distribution to the actual mtDNA heteroplasmy distribution measured across several germ line developmental stages and among different organisms. The detail of adapting this set of mathematical functions from the population genetic theory and testing its potential application to mitochondrial genetic is shown in Chapter 3 [115].
14

The comparison of measured mtDNA heteroplasmy variance between different stages of germ line development plays a key role in demonstrating how offspring’s heteroplasmy variation has been generated. Generally, the mtDNA heteroplasmy variance was calculated from a limited modest sample size of mtDNA heteroplasmy measurements, which may not be sufficient to represent the mtDNA heteroplasmy variance in the population. Lack of reporting of error bars of sampled mtDNA heteroplasmy variance could, at least in an extreme case, distort the biological interpretation drawn from the mtDNA heteroplasmy variance value. This awareness leads us to ask the question:
How can we estimate the sampling error of the actual mtDNA heteroplasmy variance measurement?
To answer this question, we adapt the general basis of the standard error of variance calculation and develop it to calculate an error bar of mtDNA heteroplasmy variance. Adding the variance error bar to the experimental mouse mtDNA heteroplasmy variances measured from various stages of mouse germ line development revises the biological interpretation drawn from these measurements. We also add the variance error bar calculation to help us in answering the question:
Does the mitochondrial bottleneck size in a mouse model differ from that in humans?
To improve the experimental measurement of mtDNA heteroplasmy variance, we can use the variance error bar calculation to estimate the proper sample size for this higher-order statistic. Therefore, the variance error bar calculation plays an important role in the study of mtDNA heteroplasmy transmission by adding a necessary piece of information to the biological interpretation drawn from the heteroplasmy variance measurement and helping in an experimental design related to the heteroplasmy variance calculation. The detail of how to calculate the heteroplasmy variance error bar, how to apply it to the actual heteroplasmy variance, and how to estimate a proper sample size for the experimental design are presented in Chapter 4 [116].
The m.3243A>G mutation is a high penetrance pathogenic mtDNA mutation associated with a variety of human diseases. Intergenerational transmission analysis of this mutation implicated the preference of inheriting mutant mtDNA [89-90]. However, the reduction of blood heteroplasmy level with age could lead to the conclusion that the offspring’s heteroplasmy level tends to be higher than the mother’s heteroplasmy level without the preference of inheriting mutant mtDNA [89-90], thereby, to clarify this statement, we ask the question:
Is the intergenerational increase of heteroplasmy level of m.3243A>G caused by the preference of transmitting mutant mtDNA?
We have answered this question by testing whether the reduction of blood heteroplasmy level with age generates an increase of an average heteroplasmy level between generations and whether the size of random shift statistically deviates from zero. We also test whether this pathogenic mtDNA mutation affects reproduction of female carriers. We ask the questions:
Does the pathogenic mtDNA mutation affect female reproductive fitness?
,
15

Does the effect of this mutation on female reproduction bias against a particular offspring gender?
and
Does the effect of this mutation on female reproduction depend on maternal heteroplasmy level?
In an attempt to answer these questions, we statistically analyze the number of live births of the female carrying this pathogenic mtDNA mutation, separated by offspring gender and maternal heteroplasmy level. The detail analysis of both the intergenerational mtDNA heteroplasmy transmission and the female reproductive effect of this mutation are presented in Chapter 5.
16

2 Chapter 2: A Reduction of Mitochondrial DNA Molecules During Embryogenesis Explains the Rapid Segregation of Genotypes
Lynsey M. Cree1, David C. Samuels2, Susana Chuva de Sousa Lopes3, Harsha Karur Rajasimha2, Passorn Wonnapinij2, Jeffrey R. Mann4,7, Hans-Henrik M. Dahl5
& Patrick F. Chinnery1,6. 1Mitochondrial Research Group, Newcastle University, NE2 4HH, UK. 2Virginia Bioinformatics Institute, Virginia Polytechnic Institute and State University, Blacksburg, VA, 24061, USA 3Wellcome Trust/Cancer Research UK Gurdon Institute, University of Cambridge, Tennis Court Road, Cambridge CB2 1QN, UK. 4 Division of Biology, City of Hope, 1500 E. Duarte Rd, Duarte, California 91010, USA. Present address: Department of Zoology, The University of Melbourne, Vic. 3010, Australia. 5 The Murdoch Children’s Research Institute & Dept. of Paediatrics (Univ. of Melbourne), Royal Children’s Hospital, Parkville Melbourne, Victoria. 3052, Australia. 6Institute of Human Genetics, Newcastle University, Newcastle NE2 4HH, UK 7Present address: Department of Zoology, The University of Melbourne, Victoria 3010, Australia
Reprinted from “Nature Genetics 2008, 40 ,249-254” with permission from
Nature Publishing Group
To whom correspondence should be conducted: *[email protected]
17

18
Preface
The aim of chapter 2 is to understand how mitochondrial genetic bottleneck generates variation in offspring’s heteroplasmy levels. In particular, we first experimentally observed changes of mtDNA copy number per cell during mouse embryogenesis to examine whether there is a physical bottleneck of mtDNAs, a small number of mtDNA molecules repopulating the next generation mtDNA population. Then, we used the simulation model to investigate how these changes of mtDNA copy number per cell generates offspring’s heteroplasmy variance.
This project has been done in collaborative manner. The overall experimental study was designed by Dr. Patrick F. Chinnery and Dr. Lynsey M. Cree from University of Newcastle upon Tyne. The measurements of mtDNA copy number per cell to observe the changes of mtDNA molecules in a single cell during embryogenesis from the GFP-Stella mouse model was done by Dr. Lynsey M. Cree. These fluorescence-tagged mice were generated in Dr. Susana Chuva de Sousa Lopes’s lab from the University of Cambridge. The actual mouse offspring’s mtDNA heteroplasmy level was measured from the NZB/C57BL.6J mouse model developed by Dr. Hans-Henrik M. Dahl and Dr. Jeffrey R. Mann from the University of Melbourne.
Dr. David C. Samuels designed the mouse embryogenesis simulation model. Dr. Hasha Karur Rajasimha programmed this model in C/C++ language. Dr. Samuels and I carried out this simulation model to study how the variation in female germ line heteroplasmy levels has been generated by the changes of mtDNA copy number per cell during mouse embryogenesis. This model initiated with a single simulated embryo carrying 500,000 mtDNA molecules with 50% heteroplasmy level. We first validated the simulation model by comparing the mtDNA copy number per simulated cell to the actual mtDNA copy number pre cell observed from the experimental GFP-Stella mouse model. Then, we calculated mtDNA heteroplasmy variance from the simulated cells at each stage of mouse embryogenesis to study the generation of germ line cells’ heteroplasmy variance. We also applied this simulation model to estimate 95% confident limit of the offspring’s heteroplasmy level of the mother carrying mutant mtDNA in heteroplasmic condition with the maternal heteroplasmy level is in the range of 0% to 100 %.
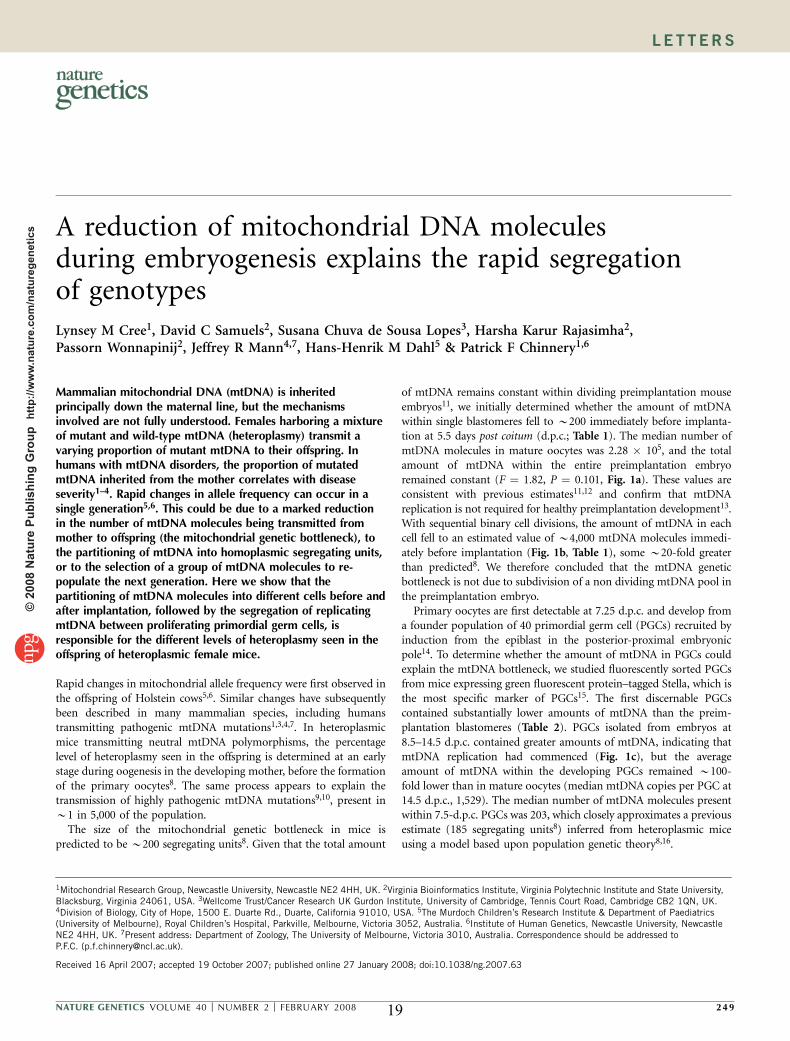
A reduction of mitochondrial DNA moleculesduring embryogenesis explains the rapid segregationof genotypesLynsey M Cree1, David C Samuels2, Susana Chuva de Sousa Lopes3, Harsha Karur Rajasimha2,Passorn Wonnapinij2, Jeffrey R Mann4,7, Hans-Henrik M Dahl5 & Patrick F Chinnery1,6
Mammalian mitochondrial DNA (mtDNA) is inheritedprincipally down the maternal line, but the mechanismsinvolved are not fully understood. Females harboring a mixtureof mutant and wild-type mtDNA (heteroplasmy) transmit avarying proportion of mutant mtDNA to their offspring. Inhumans with mtDNA disorders, the proportion of mutatedmtDNA inherited from the mother correlates with diseaseseverity1–4. Rapid changes in allele frequency can occur in asingle generation5,6. This could be due to a marked reductionin the number of mtDNA molecules being transmitted frommother to offspring (the mitochondrial genetic bottleneck), tothe partitioning of mtDNA into homoplasmic segregating units,or to the selection of a group of mtDNA molecules to re-populate the next generation. Here we show that thepartitioning of mtDNA molecules into different cells before andafter implantation, followed by the segregation of replicatingmtDNA between proliferating primordial germ cells, isresponsible for the different levels of heteroplasmy seen in theoffspring of heteroplasmic female mice.
Rapid changes in mitochondrial allele frequency were first observed inthe offspring of Holstein cows5,6. Similar changes have subsequentlybeen described in many mammalian species, including humanstransmitting pathogenic mtDNA mutations1,3,4,7. In heteroplasmicmice transmitting neutral mtDNA polymorphisms, the percentagelevel of heteroplasmy seen in the offspring is determined at an earlystage during oogenesis in the developing mother, before the formationof the primary oocytes8. The same process appears to explain thetransmission of highly pathogenic mtDNA mutations9,10, present inB1 in 5,000 of the population.The size of the mitochondrial genetic bottleneck in mice is
predicted to be B200 segregating units8. Given that the total amount
of mtDNA remains constant within dividing preimplantation mouseembryos11, we initially determined whether the amount of mtDNAwithin single blastomeres fell to B200 immediately before implanta-tion at 5.5 days post coitum (d.p.c.; Table 1). The median number ofmtDNA molecules in mature oocytes was 2.28 � 105, and the totalamount of mtDNA within the entire preimplantation embryoremained constant (F ¼ 1.82, P ¼ 0.101, Fig. 1a). These values areconsistent with previous estimates11,12 and confirm that mtDNAreplication is not required for healthy preimplantation development13.With sequential binary cell divisions, the amount of mtDNA in eachcell fell to an estimated value of B4,000 mtDNA molecules immedi-ately before implantation (Fig. 1b, Table 1), some B20-fold greaterthan predicted8. We therefore concluded that the mtDNA geneticbottleneck is not due to subdivision of a non dividing mtDNA pool inthe preimplantation embryo.Primary oocytes are first detectable at 7.25 d.p.c. and develop from
a founder population of 40 primordial germ cell (PGCs) recruited byinduction from the epiblast in the posterior-proximal embryonicpole14. To determine whether the amount of mtDNA in PGCs couldexplain the mtDNA bottleneck, we studied fluorescently sorted PGCsfrom mice expressing green fluorescent protein–tagged Stella, which isthe most specific marker of PGCs15. The first discernable PGCscontained substantially lower amounts of mtDNA than the preim-plantation blastomeres (Table 2). PGCs isolated from embryos at8.5–14.5 d.p.c. contained greater amounts of mtDNA, indicating thatmtDNA replication had commenced (Fig. 1c), but the averageamount of mtDNA within the developing PGCs remained B100-fold lower than in mature oocytes (median mtDNA copies per PGC at14.5 d.p.c., 1,529). The median number of mtDNA molecules presentwithin 7.5-d.p.c. PGCs was 203, which closely approximates a previousestimate (185 segregating units8) inferred from heteroplasmic miceusing a model based upon population genetic theory8,16.
Received 16 April 2007; accepted 19 October 2007; published online 27 January 2008; doi:10.1038/ng.2007.63
1Mitochondrial Research Group, Newcastle University, Newcastle NE2 4HH, UK. 2Virginia Bioinformatics Institute, Virginia Polytechnic Institute and State University,Blacksburg, Virginia 24061, USA. 3Wellcome Trust/Cancer Research UK Gurdon Institute, University of Cambridge, Tennis Court Road, Cambridge CB2 1QN, UK.4Division of Biology, City of Hope, 1500 E. Duarte Rd., Duarte, California 91010, USA. 5The Murdoch Children’s Research Institute & Department of Paediatrics(University of Melbourne), Royal Children’s Hospital, Parkville, Melbourne, Victoria 3052, Australia. 6Institute of Human Genetics, Newcastle University, NewcastleNE2 4HH, UK. 7Present address: Department of Zoology, The University of Melbourne, Victoria 3010, Australia. Correspondence should be addressed toP.F.C. ([email protected]).
NATURE GENETICS VOLUME 40 [ NUMBER 2 [ FEBRUARY 2008 249
LET TERS©
2008
Nat
ure
Publ
ishi
ng G
roup
http
://w
ww
.nat
ure.
com
/nat
ureg
enet
ics
19

Previous estimates of the mitochondrial genetic bottleneck arecritically dependent upon the chosen mathematical model. A single-sampling binomial model describes the whole process and has beenused to predict the chance of transmitting a particular level ofheteroplasmy17,18, but it does not reflect the underlying biology(Fig. 2a). The population genetic model8,16 assumes that the bottleneckoccurs while numerous generations of cells are being formed by binarycell division, with each cell containing the same amount of mtDNA(Fig. 2b). For example, the bottleneck of B185 segregating units wasassumed to be present for 15 germ-cell divisions8, but our observationsshow that the amount of mtDNA within PGCs increases between 7.5and 14.5 d.p.c. (Fig. 1c). We therefore adapted these models using theexperimental data to model the biological process directly (Fig. 2c).Before implantation, the model was based on binary cell division of aheteroplasmic mouse embryo with no mtDNA replication, usingexperimentally determined values for the amount of mtDNA withinsingle blastomeres (Table 1) and the rate of cell division19. Afterimplantation, the model included mtDNA replication at the minimumrate required to populate the increasing number of PGCs20,21, and itwas also based on experimentally determined values for the medianamount of mtDNA within single PGCs (Table 2, Fig. 3a) and the rateof cell division required to produce 25,791 primary oocytes at day 13.5(ref. 21) (Supplementary Figs. 1 and 2 online).To determine whether the biological model reliably predicted
the transmission of mtDNA heteroplasmy, we studied the transmis-sion in 246 offspring from 22 litters born to mothers with differentlevels of NZB/C57BL.6J heteroplasmy gener-ated by cytoplast transfer (SupplementaryTable 1 online). 91% of the offspring hadNZB heteroplasmy levels that fell within thepredicted 95% confidence interval (CI) forthe model (Fig. 3b). The simulation results inFigure 3b are based on a conservative modelusing the median value for the number ofmtDNA copies per cell at 7.5 d.p.c. However,when we simulated a 12-h delay in the onsetof mtDNA replication, consistent with theobserved variation in implantation time22,this led to a reduction in mtDNA copies atimplantation that approximated the lowerend of the measured range in Stella-GFPPGCs (Table 2) and to a greater variance inheteroplasmy values among the offspring.Together, these observations indicate
that the reduction in mtDNA copies we
observed during immediate preimplantation and postimplantationdevelopment is sufficient to generate the variation in hetero-plasmy levels seen among the offspring of heteroplasmic femalemice. Approximately 70% of the heteroplasmy variance wasdue to the physical partitioning of mtDNA molecules intodaughter cells during pre- and early postimplantation develop-ment, when the amount of mtDNA in each cell fell to lowlevels (B200). The remaining B30% developed during theintense proliferation of mtDNA in the exponentially expandingPGC population, where the average amount of mtDNA wasB1,500 molecules per PGC (Fig. 3a,c and Supplementary Fig. 2).Variation in heteroplasmy levels will occur without the com-partmentalization of mtDNA molecules into multicopy segregatingunits such as nucleoids or mitochondria, or through the selec-tion of particular group of mtDNAs chosen to repopulate thenext generation.Cao et al.23 reported 41,000 mtDNA molecules in 7.5-d.p.c. PGCs
and concluded that the mitochondrial genetic bottleneck is due not toa drastic decline in mtDNA copy number but to a small effectivenumber of effective segregating units, each containing multiplemtDNA molecules. How can we explain the discrepancy betweentheir findings and ours? Differences in our experimental approachexplain why we measured a lower number of mtDNA molecules inearly PGCs, and our interpretation of these data using a biologicallyplausible model led us to conclude that the mtDNA molecule is thesegregating unit.
Whole preimplantationembryos
Oocyte
s
Cleavage stage
750
500
mtD
NA
cop
ies
(×10
3 )
mtD
NA
cop
ies
(×10
3 )
250
0
2 ce
ll
4 ce
ll
6 ce
ll
8 ce
ll
16–3
2 ce
ll
Blasto
cyst
Single preimplantationblastomeres
2 ce
ll
4 ce
ll
Cleavage stage
6 ce
ll
500
250
0
8 ce
ll
16 ce
ll
Postimplantationsingle PGCs
7.5
Developmental stage(d.p.c.)
8.5 10.5 14.5
10,000
1,000
mtD
NA
cop
ies
100
10
a b c
Figure 1 The amount of mtDNA in mature mouse oocytes and preimplantation mouse embryos.(a) Mature oocytes and whole embryos. Box and whisker diagram showing the median, ± 1 s.d.,
and the range from maximum to minimum values. (b) Single blastocyst cells (blastomeres) from
preimplantation embryos. Each data point corresponds to a single blastomere. (c) Primordial germ cells
(PGCs) from postimplantation mouse embryos on a logarithmic plot. Each data point corresponds to a
single PGC. Horizontal line indicates median value. Data from male and female embryos is shown
separately for 14.5 d.p.c. Blue circles, males; red triangles, females.
Table 1 Amount of mtDNA in mature oocytes and preimplantation mouse embryos
Whole embryo Individual blastomeres
Stage n
Mean copy
number (�103)
Median copy
number (�103) Range (�103) CV n
Mean copy
number (�103)
Median copy
number (�103) Range (�103) CV
Oocyte – – – – – 22 249.4 228.5 26.9–645.7 0.63
2 cell 24 347.7 312.8 112.9–676.8 0.54 18 247 245.3 14.6–465.6 0.52
4 cell 13 196 174.3 85.9–483.2 0.55 9 57.7 36.3 15.1–143.6 0.9
6 cell 8 308.6 287.8 150.5–547.6 0.41 19 63.2 47.1 20.4–166.0 0.6
8 cell 23 244.5 243.0 73.8–488.2 0.41 33 47.9 32.2 11.0–281.0 1.07
16–32 cell 12 286.1 267.7 73.8–671.3 0.52 11 18.4 15.4 4.9–38.0 0.61
Blastocyst 15 280.8 212.8 56.7–667.1 0.68 – – – – –
CV, coefficient of variance; n, number of cells studied.
250 VOLUME 40 [ NUMBER 2 [ FEBRUARY 2008 NATURE GENETICS
LET TERS©
2008
Nat
ure
Publ
ishi
ng G
roup
http
://w
ww
.nat
ure.
com
/nat
ureg
enet
ics
20

Before using Stella-GFP mice, we explored the possibility ofusing alkaline phosphatase histochemistry to identify PGCs. LikeCao et al.23, we found that the stain decreased the number of copiesmeasured within individual cells. In our hands, the alkaline phospha-tase histochemistry did not affect all cells equally, leading to anincreased variability in copy number values. Light microscopy showedthat the stain diffused out of PGCs in cryostat sections both at 37 1Cand at room temperature, making it difficult to identify whichcells were PGCs and which were not. This was particularly a problemwhen the PGC population was small at 7.5 d.p.c. The correction factorof 1.96 used by Cao et al.23, to compensate for the decreased efficiencyof the real-time PCR reaction in alkaline phosphatase-stained cells,would not account for the increased variability that we observed.Moreover, as only 95% of alkaline phosphatase–positive PGCs expressStella15, it is generally accepted that Stella-GFP is the more accuratemarker of the PGC lineage15. It is therefore possible that some of thealkaline phosphatase–stained cells analyzed by Cao et al.23 were notactually PGCs. Using Stella-GFP–labeled mice, we reliably measured aB7.5-fold lower number of mtDNA molecules in early PGCs.Finally, our interpretation of the data was based on a model that
simulates the biological process directly, incorporating our laboratorydata and what is known about the replication of mtDNA and thedynamics of cell division. Comparing the population genetic model8,16
to our model during the linear phase (after 9 d.p.c.) shows that therelaxed replication of mtDNA contributes considerably to the varia-tion in heteroplasmy levels, particularly during the rapid proliferationof mtDNA molecules in the expanding germ line. Using the modelwe describe here, the segregation of replicating mtDNA moleculesgenerates sufficient variation in heteroplasmy levels to explain our
observations in heteroplasmic mice, indicatingthat the mtDNA molecule itself is the segregat-ing unit during transmission. Additional varia-tion could arise through the variation in copynumber we observed in 7.5-d.p.c. PGCs.This could, in part, arise through differencesin the time of implantation and the resumptionof mtDNA replication or through unevenpartitioning of mtDNA during cytokinesis.Although the time of implantation in thesimulation model was set to reproduce theexperimentally determined time course of
the median mtDNA copy number, other factors related to theobserved variation in copy number between cells were not includedin the model. Including these factors would only add weight toour conclusions.Why is there a mitochondrial genetic bottleneck? mtDNA lacks
protective histones and is close to the respiratory chain, a potentsource of mutagenic free radicals. Mitochondria are also relativelydeficient in DNA repair mechanisms, contributing to the mutationrate of mtDNA. The mitochondrial genetic bottleneck leads to therapid segregation of new genotypes, which either are lost duringtransmission or reach very high levels and affect fecundity. Thisfacilitates the rapid removal of deleterious mtDNA mutations fromthe population, by ‘purifying’ germline mtDNA, and thus prevents the‘mutational meltdown’ predicted by Muller’s ratchet24. This is not onlyimportant for the female germ line, but it is also relevant for the malegerm line, where mtDNA mutations can alter sperm motility25 andhence affect fertility. Notably, at 14.5 d.p.c., female PGCs (n ¼ 83,mean mtDNA copies¼ 1,376, s.d.¼ 601) contained lower amounts ofmtDNA than male PGCs (n ¼ 43, mean mtDNA copies ¼ 2,152,s.d. ¼ 951, two-sample t-test P o 0.001, Fig. 1c), possibly because astringent bottleneck is more important for the female germ line,with the potential transmission of mutations to subsequent genera-tions. It is also of interest that we observed a range of values for theminimum amount of mtDNA within PGCs (Fig. 1c). This couldreflect slight differences in the developmental stage or asymmetriccompartmentalization of mtDNA during development. Subtledifferences in the parameters governing the genetic bottleneck, suchas the timing of the initiation of mtDNA replication, provide anexplanation for the apparent difference in bottleneck size seen in
Table 2 Amount of mtDNA in primordial germ cells at different embryonic stages in mice
Stage n
Mean copy
number (�102)
Median copy
number (�102) Range (�103) CV
7.5 d.p.c. 596 4.51 2.03 0.26–34.02 1.55
8.5 d.p.c. 165 10.65 7.68 1.28–27.78 0.72
10.5 d.p.c. 96 16.01 16.30 10.26–21.93 0.18
14.5 d.p.c., male 1,087 21.52 19.98 7.56–62.41 0.44
14.5 d.p.c., female 1,528 13.76 12.88 3.42–34.13 0.44
CV, coefficient of variance; n, number of primordial germ cells studied; d.p.c., days post coitum.
Figure 2 Models of the mitochondrial genetic
bottleneck. Schematic diagram showing a
heteroplasmic fertilized oocyte (top), a model of
the mitochondrial genetic bottleneck (middle)
and subsequent primary oocytes (bottom). Blue
circles, wild-type mtDNA; red circles, mutated
mtDNA. Time scale shown on the left in d.p.c.(a) Single-sampling model. A single random
sample of mtDNA molecules is assumed to
repopulate each primary oocyte. (b) Multiple-
sampling model. Using an adaptation of the
population genetic model of Sewall Wright16, this
approach assumes that an identical moderate
genetic bottleneck is present over multiple cell
divisions, G. In mice, G ¼ 15, which is the
number of divisions required to produce the
25,791 primary oocytes present by 13.5 d.p.c.21
from a single blastomere. (c) Complex biological model based upon the number of cell divisions leading up to the formation of 40 primordial germ cells
(PGCs) at 7.25 d.p.c., followed by 9–10 cell divisions required to generate the 25,791 PGCs required to form a full complement of primary oocytes (for
details see Supplementary Fig. 1).
0
7
14.5
d.p.
c.
Bot
tlene
ck
Primaryoocytes
Single-sampling model Multiple-sampling model
15 equal cell divisionsCell divisions andmtDNA based onexperimental data
Biological model
a b c
NATURE GENETICS VOLUME 40 [ NUMBER 2 [ FEBRUARY 2008 251
LET TERS©
2008
Nat
ure
Publ
ishi
ng G
roup
http
://w
ww
.nat
ure.
com
/nat
ureg
enet
ics
21

different human pedigrees transmitting pathogenic mtDNA muta-tions26, with some women having offspring with similar levels ofheteroplasmy3 and others having offspring who are markedly differentin this regard7.
METHODSIsolation of single embryonic cells. All animal procedures were performed,
under license, in accordance with the UK Home Office Animal Act (1986).
C57BL/6J.CBA F1 female mice were superovulated by sequential intraperitoneal
injection of 5 international units (IU) of pregnant mares’ serum (PMS) (Sigma-
Aldrich) and 7.5 IU of human chorionic gonadotrophin (hCG) (Sigma-
Aldrich) 48 h apart. Unfertilized eggs were collected 12 h after hCG injection.
One-cell zygotes were collected after successful mating with CBA males 24 h
after hCG injection. Single-cell embryos were recovered by flushing the
oviducts with prewarmed M2 medium (Sigma-Aldrich) as described27. The
freshly recovered embryos were transferred to prewarmed M16 media
(Sigma-Aldrich) and maintained at 37 1C in a humidified atmosphere contain-
ing 5% CO2 until they reached the cleavage stage required. Embryos were
transferred to sterile PCR tubes and lysed for 16 h in 50 mM Tris-HCl, pH 8.5,
with 0.5% Tween 20 and 100 mg proteinase K, at 55 1C, followed by heat
inactivation at 95 1C for 10 min, a protocol shown previously to maximize the
mtDNA yield. Where individual blastomeres were required, the zona pellucida
of embryos was removed with acid Tyrode’s solution (pH 3.5). The zona-free
embryos were then incubated for 10–20 min at 37 1C in calcium- and
magnesium-free phosphate-buffered saline. Individual blastomeres were
obtained by repeatedly passing the zona-free embryos through a micropipette
and lysed as described previously.
Quantification of mtDNA copy number. Absolute quantification of mtDNA
copy number was performed by real-time PCR using iQSybr Green on the Bio-
Rad ICycler to a target template spanning nt12789–nt12876 of the MTND5
gene. Absolute quantification was performed by the standard curve method.
A PCR-generated template was created spanning the mitochondrial genome
between nt12705 and nt13834. The template was purified by gel extraction
(Qiagen), quantified by UV absorbance at 260 nm and serially diluted to
generate a standard curve for quantification of mtDNA content in samples.
All samples and standards were measured in triplicate. Before studying
mouse embryos, we compared three different real-time PCR assays directed
at different regions of the mitochondrial genome: ND5 (nt12789–nt12876),
ND4 (nt11031–11174), and ND1 (nt2751–nt3709). The results obtained from
each assay were tightly correlated (r2 4 0.99) over a wide range of mtDNA
concentrations, encompassing the values obtained in subsequent single cell
studies (Supplementary Fig. 3 online). We arbitrarily chose the ND5 assay for
subsequent experiments.
Isolation of primordial germ cells. Traditionally, primordial germ cells (PGCs)
have been identified by their characteristic tissue nonspecific alkaline phos-
phatase (TNAP) staining20. However, TNAP is also present in somatic cells that
surround the PGCs, and the TNAP staining procedure inhibits the mtDNA
quantification assay. We initially studied unfixed TNAP-stained cryostat sec-
tions, capturing PGCs by laser microdissection. However, copy number
measurements were highly variable, partly because the reaction product
inhibited the real-time PCR reaction and partly because the reaction product
diffused out of the PGCs into the adjacent tissue, making the identification of
PGCs difficult. All postimplantation studies were therefore carried out in Stella-
GFP transgenic mice to allow unambiguous detection of the PGCs.
C57BL/6J.CBA F1 females were mated with Stella-GFP BAC–homozygous
C57BL/6J.CBA males15. Noon on the day of vaginal plug detection was
designated 0.5 d.p.c. Stella-GFP heterozygous embryos were collected at
7.5 d.p.c., 8.5 d.p.c., 10.5 d.p.c. and 14.5 d.p.c. in Dulbecco’s minimal essential
medium (DMEM, Invitrogen) supplemented with 7.5% FCS and 10 mM
HEPES. The posterior parts of the 7.5-d.p.c. and 8.5-d.p.c. embryos and the
gonadal ridges of 10.5-d.p.c. and 14.5-d.p.c. embryos were dissected using
tungsten needles, pooled by age and trypsinized for 15 min at 37 1C.Morphological gender typing was possible after 12.5 d.p.c. The tissue was
resuspended under the microscope using an equal volume of FCS and
centrifuged for 3 min at 2,000g, and the final pellet was resuspended in
DMEM with 7.5% FCS and 10 mM HEPES. Samples were kept on ice until
FACS sorting.
Single PGCs and sets of 5, 10, 50 and 100 PGCs were unidirectionally sorted
into single wells of a 96-well plate using a BD FACSAria (Becton Dickinson).
GFP was detected using a 100-mW sapphire laser and GFP-positive PGCs
sorted at 20 p.s.i. using a 100-mm nozzle at a sort rate of 2,000 events per
second. Instrument sensitivity was proved stable between sorts by internal QC
procedures. Plates were stored at –80 1C until required. PGCs were lysed and
mtDNA content quantified as described above.
Generation of heteroplasmic mice. Initially mouse strains were backcrossed
to maximize reproductive performance and maintain a pure C57BL/6J or NZB
mtDNA genotype. Thus, C57BL/6J.C3H F1 females were crossed with C57BL/
6J.C3H F1 males, and the resulting F2 females backcrossed with C57BL/6J.C3H
F1 males. The F3 mice therefore had a C57BL/6J mtDNA genotype on a mixed
C57BL/6J and C3H nuclear background. These were designated ‘C57mt’ mice.
Likewise, NZB.NZW F1 females (obtained from the Jackson Laboratory)
were crossed with C57BL/6J.C3H F1 males, and the F2 females backcrossed
with C57BL/6J.C3H F1 males. The F3 mice had a NZB mtDNA genotype on
a mixed C57BL/6J, C3H and NZB nuclear background and were designated
as ‘NZBmt’ mice.
Fertilized oocytes were obtained from both C57mt and NZBmt mice using
standard techniques. Approximately 10–30% of cytoplasm was removed by
SimulationExperiment100,000
10,000
mtD
NA
cop
ies
per
cell
1,000
1000 2 4
Days post conception
6 8 10 12 14
a100
80
Offs
prin
g he
tero
plas
my
(NZ
B %
)
60
40
20
00 20 40
Mean founder PGC heteroplasmy (NZB %)
60 80 100
Upper
Lower
95%CI forprediction
b 0.014
0.012
0.010
0.008
0.006
Het
erop
lasm
y va
rianc
e
0.004
0.002
0.000
mtDNA minimum
PGC proliferation
0 2 4 6
Days post conception
8 10 12 14
c
Figure 3 Modeling the inheritance of mtDNA heteroplasmy in mice. (a) Comparison between the simulated amount of mtDNA in each cell (solid circles) and
the actual amount measured in preimplantation embryos and primordial germ cells (open circles indicate median, with the range for the laboratory data).
(b) Comparison of the heteroplasmy values predicted by the biological model with the actual heteroplasmy values in 246 heteroplasmic mice (open circles).The y axis shows the percentage of NZB mtDNA in the offspring and the x axis the estimated percentage of NZB mtDNA in the founding primordial germ
cells (PGCs) of the mother. The solid symbols and lines indicate the 95% confidence interval (CI) for the predicted heteroplasmy level using the biological
model (Fig. 2c). (c) Generation of the heteroplasmy variance in the blastomeres and primordial germ cells in a mother with 50% mutated mtDNA.
252 VOLUME 40 [ NUMBER 2 [ FEBRUARY 2008 NATURE GENETICS
LET TERS©
2008
Nat
ure
Publ
ishi
ng G
roup
http
://w
ww
.nat
ure.
com
/nat
ureg
enet
ics
22

micropipette from a C57mt oocyte, and an equivalent amount of cytoplasm
was removed from an NZBmt oocyte. The cytoplast removed from the C57mt
oocyte was microinjected under the zona pellucida of the NZBmt oocyte28,29
and vice versa. The donor and recipient cytoplasts were fused by electrofusion,
and oocytes were implanted into a pseudo-pregnant dam. Seven founder mice
(four females and three males) were obtained from the transfer of cytoplasm
from an NZBmt oocyte to a C57mt oocyte. Four founder mice (three females
and one male) were obtained from the transfer of cytoplasm from a C57mt
oocyte to an NZBmt oocyte. The C57mt founder females were mated to
C57BL/6J males to breed heteroplasmic mice with a C57mt nuclear back-
ground. The NZBmt founder females were caged with NZB males, but pups
were not obtained from any of these females.
Quantification of levels of heteroplasmy. The transmission of heteroplasmy
between a dam and her pups was investigated by measuring the percentage
levels of NZB mtDNA in tail biopsies at weaning. There was no difference in the
percentage level of NZB mtDNA at this stage between different tissues. Tail
biopsies were taken by removing approximately 1 cm of tail with a sterile
scalpel blade under anesthesia. Genomic DNA was extracted by incubating in
1.5 ml Salting Out Lysis Buffer (10 mM Tris-Cl, pH 7.5; 0.4 M NaCl; 2 mM
EDTA), 200 ml 20% SDS and 250 ml of 5 mg/ml proteinase K (Boehringer
Mannheim) for 16 h at 50 1C. Protein was extracted using 25:24:1 phenol/
chloroform/isoamyl alcohol and then 24:1 chloroform/isoamyl alcohol. An
ethanol precipitation was performed on each sample and the DNA was
redissolved in sterile distilled, deionized water. The concentration was quanti-
fied by measuring the absorbance at 260 nm. PCRs were performed in 50-mlreaction volumes containing 1� Taq Polymerase Reaction Buffer (Boehringer
Mannheim), 0.2 mM dNTPs, 0.5 mg each of primers m3558-F and m3940-R
(see Supplementary Table 2 online for primer sequences), 50 ng of genomic
DNA and 2.5 units of Taq Polymerase (Boehringer Mannheim). The reactions
were overlaid with 100 ml of paraffin oil and amplified for 25 cycles of 95 1C for
1 min, 51 1C for 1 min and 72 1C for 1 min on a Corbett Research
FTS-320 Thermal Sequencer. The PCR was paused at the start of the
25th cycle (at 95 1C), 10 mCi of [a-33P]dCTP was added to each reaction,
and the 25th cycle was then completed.
Restriction endonuclease digests were performed in 20-ml volumes contain-
ing 15 ml of PCR volume, 1� Buffer L (Boehringer Mannheim) and 1.5 units of
RsaI restriction endonuclease (Boehringer Mannheim). The digests were
incubated at 37 1C for 16 h, and 5 ml of 10% gel loading buffer was added
to stop each reaction. RsaI cuts C57BL/6J mtDNA twice to yield fragments of
218 base pairs (bp), 132 bp and 32 bp, and cuts NZB mtDNA once to yield
fragments of 350 bp and 32 bp. Undigested mtDNA can be detected by the
presence of a 382-bp fragment.
A 10-ml aliquot of each sample was electrophoresed through an 8%
nondenaturing polyacrylamide gel for 2 h at 50 V. The gel was soaked in
fixing solution (10% glacial acetic acid and 10% methanol) for 10 min, placed
on blotting paper (Schleicher & Schuell) and dried at 80 1C for 2 h. The dried
gels were placed against a phosphorimager screen (Molecular Dynamics) for
2 d, and the screen was scanned using a Storm PhosphorImager (Molecular
Dynamics). The intensities for the 350-bp (NZB mtDNA) and the 218-bp and
132-bp (C57BL/6J mtDNA) fragments were quantified using ImageQuant
software (Molecular Dynamics) and their heteroplasmy levels quantified.
Modeling. Previous studies8 used an adapted population genetic model16 to
model the random segregation of mtDNA genotypes over a number of cell
divisions, where the number of copies of mtDNA remained constant over the
cell generations. Our experimental observations of the mtDNA copy number
per cell show that the copy number is not constant. To account for the varying
mtDNA content of different germline precursors, we simulated the process of
mtDNA segregation directly, based on the population genetic principles of
random segregation. However, by directly simulating the process, we were able
to alter the number of mtDNA copies at each stage of PGC development,
reflecting our laboratory observations.
The embryogenesis simulation began with a single cell, the fertilized oocyte,
that underwent a series of rapid cell divisions, during which mtDNA replication
did not occur. Cell divisions were set to occur at constant intervals of 15 h, in
agreement with experimental values (Supplementary Fig. 1). The existing
mtDNA molecules were simply partitioned randomly between the two daugh-
ter cells at each cell division, and the mtDNA content per cell therefore dropped
exponentially during this phase, to a minimum of 314 ± 24 in accordance with
the experimental values (Table 2). To generate the 4200,000 mtDNAs we
observed in a mature oocyte (Table 1), mtDNA replication must resume at
some point during oocyte development and markedly increase the number of
copies per cell over a sustained period of exponential PGC proliferation20,21. In
our simulation, mtDNA replication was initiated at 7.5 d.p.c. This value was
chosen to simulate the median number of mtDNA molecules that we measured
in 7.5-d.p.c. PGCs. It should be noted that there was considerable variation in
the measured amount of mtDNA within single PGCs at this time point, with a
mean value that was greater than the median. The observed variation in copy
number at this point was not incorporated into the model.
At this stage, after ten cell divisions, the total number of cells was 1,024.
We modeled the development of a specialized PGC line at this stage by
randomly choosing 40 of these simulated cells, while discarding the others
from the simulation. These 40 cells continued to divide with a period of 15 h.
We followed this process over a further 10 cell divisions, to a final population
at 13.4 d.p.c.
The initial cell in the simulation had a heteroplasmic mtDNA population,
set at 50% mutant and 50% wild type. The random processes of distribution
of wild-type and mutant mtDNA to daughter cells, mtDNA degradation and
mtDNA replication all caused the heteroplasmy level in each simulated
cell to drift over time, generating a heteroplasmy variance across all of the
simulated cells. During the first phase of embryogenesis, while the mtDNA
copy number per cell was still relatively high, very little heteroplasmy variance
was generated. As the mtDNA copy number per cell fell to a few hundred
copies, heteroplasmy variance began to rise. After mtDNA replication began,
and the PGC line was formed, mtDNA copy number per cell rose again, to
approximately 1,500 per cell. The heteroplasmy variance slowed its rate of
increase, but it continued to increase at a steady rate as long as the PGC cell
divisions continue at a rapid pace.
We used the actual measurements of mtDNA content within single cells
(Tables 1 and 2) to simulate the formation of PGCs in mothers with different
heteroplasmy values ranging from 1% to 100% (Fig. 3c). Each simulation was
carried out ten times, resulting in a total of 204,800 cells, allowing us to
determine the 95% CI for the heteroplasmy value in individual PGCs for that
mother. The upper and lower 95% CI plotted on Figure 3c (solid circles) show
the likely range of heteroplasmy values across the whole range (solid lines). At
birth there was no difference in the proportion of NZB mtDNA between
different tissues, but postnatal segregation of mtDNA genotypes led to
significant differences between the tail mtDNA and other tissues in adult
mice (S.L. White, W. Hutchison, D.R. Thorburn, V.A. Collins, K. Fowler &
H.-H.M.D., unpublished data and ref. 30). Given that the transmission of NZB
heteroplasmy is determined by random genetic drift8, with an equal likelihood
of an increase or decrease in the proportion of mtDNA, we estimated the
percentage NZB in the maternal primordial germ cell founders as the mean
level of heteroplasmy from the offspring at birth.
Note: Supplementary information is available on the Nature Genetics website.
ACKNOWLEDGMENTSP.F.C. is a Wellcome Trust Senior Fellow in Clinical Science and also receivesfunding from the United Mitochondrial Diseases Foundation and from the EUFP6 program EUmitocombat and MITOCIRCLE. H.-H.M.D. is a National Healthand Medical Research Council (Australia) Principal Research Fellow, and hisaffiliations are with The Murdoch Children’s Research Institute and theDepartment of Paediatrics (University of Melbourne), Royal Children’s Hospital,Melbourne, Australia. We thank I. Dimmick for his assistance with the flowcytometry, D. Turnbull and B. Lightowlers for discussions, A. McLaren for herexpertise on the cell dynamics of mouse development, and M. Azim Surani forproviding the Stella-GFP mice. We also thank D. Thorburn for discussions andadvice while studying the heteroplasmic mice, and both W. Hutchinson andS. White for experimental work on the heteroplasmic mice.
AUTHOR CONTIRBUTIONSThis laboratory study was designed by P.F.C. and L.M.C. and carried out byL.M.C. The in silico modeling was designed by D.C.S., programmed by H.K.R.and carried out by D.C.S., H.K.R. and P.W. GFP-Stella mice were produced in the
NATURE GENETICS VOLUME 40 [ NUMBER 2 [ FEBRUARY 2008 253
LET TERS©
2008
Nat
ure
Publ
ishi
ng G
roup
http
://w
ww
.nat
ure.
com
/nat
ureg
enet
ics
23

laboratory of M. Azim Surani by S.C.d.S.L. H.-H.M.D. designed and supervisedthe heteroplasmic mouse work. J.R.M. generated the heteroplasmic mice.
Published online at http://www.nature.com/naturegenetics
Reprints and permissions information is available online at http://npg.nature.com/
reprintsandpermissions
1. Holt, I.J., Miller, D.H. & Harding, A.E. Genetic heterogeneity and mitochondrial DNAheteroplasmy in Leber’s hereditary optic neuropathy. J. Med. Genet. 26, 739–743(1989).
2. Bolhuis, P.A. et al. Rapid shift on genotype of human mitochondrial DNA in afamily with Leber’s hereditary optic neuropathy. Biochem. Biophys. Res. Commun.170, 994–997 (1990).
3. Vilkki, J., Savontaus, M.L. & Nikoskelainen, E.K. Segregation of mitochondrialgenomes in a heteroplasmic lineage with Leber hereditary optic neuroretinopathy.Am. J. Hum. Genet. 47, 95–100 (1990).
4. Larsson, N.G. et al. Segregation and manifestations of the mtDNA tRNA(Lys)A-G(8344) mutation of myoclonus epilepsy and ragged-red fibers (MERRF)syndrome. Am. J. Hum. Genet. 51, 1201–1212 (1992).
5. Upholt, W.B. & Dawid, I.B. Mapping of mitochondrial DNA of individual sheep andgoats: rapid evolution in the D loop region. Cell 11, 571–583 (1977).
6. Olivo, P.D., Van de Walle, M.J., Laipis, P.J. & Hauswirth, W.W. Nucleotide sequenceevidence for rapid genotypic shifts in the bovine mitochondrial DNA D-loop. Nature306, 400–402 (1983).
7. Blok, R.B., Gook, D.A., Thorburn, D.R. & Dahl, H.H. Skewed segregation of the mtDNAnt 8993 (T to G) mutation in human oocytes. Am. J. Hum. Genet. 60, 1495–1501(1997).
8. Jenuth, J.P., Peterson, A.C., Fu, K. & Shoubridge, E.A. Random genetic drift in thefemale germ line explains the rapid segregation of mammalian mitochondrial DNA.Nat. Genet. 14, 146–151 (1996).
9. Chinnery, P.F. et al. The inheritance of mtDNA heteroplasmy: random drift, selection orboth? Trends Genet. 16, 500–505 (2000).
10. Brown, D.T., Samuels, D.C., Michael, E.M., Turnbull, D.M. & Chinnery, P.F. Randomgenetic drift determines the level of mutant mitochondrial DNA in human primaryoocytes. Am. J. Hum. Genet. 68, 533–536 (2001).
11. Piko, L. & Taylor, K.D. Amounts of mitochondrial DNA and abundance of somemitochondrial gene transcripts in early mouse embryos. Dev. Biol. 123, 364–374(1987).
12. Steuerwald, N. et al. Quantification of mtDNA in single oocytes, polar bodies andsubcellular components by real-time rapid cycle fluorescence monitored PCR. Zygote8, 209–215 (2000).
13. Larsson, N.G. et al. Mitochondrial transcription factor A is necessary for mtDNAmaintenance and embryogenesis in mice. Nat. Genet. 18, 231–236 (1998).
14. McLaren, A. & Lawson, K.A. How is the mouse germ-cell lineage established?Differentiation 73, 435–437 (2005).
15. Payer, B. et al. Generation of stella-GFP transgenic mice: a novel tool to study germ celldevelopment. Genesis 44, 75–83 (2006).
16. Wright, S. Evolution and the Genetics of Populations (University of Chicago Press,Chicago, 1969).
17. Bendall, K.E., Macaulay, V.A., Baker, J.R. & Sykes, B.C. Heteroplasmic point muta-tions in the human mtDNA control region. Am. J. Hum. Genet. 59, 1276–1287(1996).
18. Poulton, J., Macaulay, V. & Marchington, D.R. Mitochondrial genetics ’98: Is thebottleneck cracked? Am. J. Hum. Genet. 62, 752–757 (1998).
19. Streffer, C., Van Beuningen, D., Mollis, M., Zamboglou, N. & Schultz, S. Kinetics ofcell proliferation in the pre-implanted mouse embryo in vivo and in vitro. Cell TissueKinet. 13, 135–143 (1980).
20. Ginsburg, M., Snow, M.H.L. & McLaren, A. Primordial germ cells in the mouse embryoduring gastrulation. Development 110, 521–528 (1990).
21. Tam, P.P.L. & Snow, M.H.L. Proliferation and migration of primordial germ cells duringcompensatory growth in mouse embryos. J. Embryol. Exp. Morphol. 64, 133–147(1981).
22. Downs, K.M. & Davies, T. Staging of gastrulating mouse embryos by morpho-logical landmarks in the dissecting microscope. Development 118, 1255–1266(1993).
23. Cao, L. et al. The mitochondrial bottleneck occurs without reduction of mtDNA contentin female mouse germ cells. Nat. Genet. 39, 386–390 (2007).
24. Bergstrom, C.T. & Pritchard, J. Germline bottlenecks and the evolutionary maintenanceof mitochondrial genomes. Genetics 149, 2135–2146 (1998).
25. Spiropoulos, J., Turnbull, D.M. & Chinnery, P.F. Can mitochondrial DNA mutationscause sperm dysfunction? Mol. Hum. Reprod. 8, 719–721 (2002).
26. Howell, N. et al. Mitochondrial gene segregation in mammals: is the bottleneck alwaysnarrow? Hum. Genet. 90, 117–120 (1992).
27. Hogan, B., Beddington, R., Constantini, F. & Lacy, E. Manipulating the MouseEmbryo (Cold Spring Harbor Laboratory Press, Cold Spring Harbor, New York, USA,1994).
28. McGrath, J. & Solter, D. Nuclear transplantation in the mouse embryo by microsurgeryand cell fusion. Science 220, 1300–1302 (1983).
29. Mann, J.R., Gadi, I., Harbison, M.L., Abbondanzo, S.J. & Stewart, C.L. Androgeneticmouse embryonic stem cells are pluripotent and cause skeletal defects in chimeras:implications for genetic imprinting. Cell 62, 251–260 (1990).
30. Jenuth, J.P., Peterson, A.C. & Shoubridge, E.A. Tissue-specific selection fordifferent mtDNA genotypes in heteroplasmic mice. Nat. Genet. 16, 93–95(1997).
254 VOLUME 40 [ NUMBER 2 [ FEBRUARY 2008 NATURE GENETICS
LET TERS©
2008
Nat
ure
Publ
ishi
ng G
roup
http
://w
ww
.nat
ure.
com
/nat
ureg
enet
ics
24

Supplementary information Supplementary Table 1 Variation in the level of heteroplasmy between the offspring
of heteroplasmic female mice.
Proportion of NZB genotype
in mother
Number of offspring
Variance in heteroplasmy
amongst offspring
Coefficient of variation
0.01 9 0.0001 0.9274
0.01 17 0.0000 0.6856
0.03 9 0.0086 3.0872
0.05 11 0.0420 4.0999
0.1 6 0.0135 1.1605
0.11 11 0.0068 0.7478
0.16 8 0.0266 1.0475
0.16 4 0.0281 1.0201
0.16 16 0.0227 0.9412
0.18 15 0.0065 0.3219
0.18 7 0.0034 0.4462
0.26 20 0.0199 0.5428
0.27 10 0.0066 0.3013
0.28 10 0.0244 0.4586
0.28 4 0.0165 0.5579
0.3 5 0.0215 0.4882
0.31 10 0.0233 0.4921
0.34 8 0.0115 0.3155
0.35 18 0.0208 0.4122
0.4 17 0.0093 0.2411
0.48 17 0.0125 0.2333
0.58 14 0.0118 0.1869
25

Supplementary Table 2 Oligonucleotide primer sequences used to quantify
NZB/C57BL.6J mtDNA heteroplasmy
Forward primer Reverse primer
5′-ACATTCCTATGGATCCGAGC-3′ 5′-GATGATGGCAAGGGTGATAG-3′
26

Supplementary Figure 1 Comparison between the number of cells simulated and the
actual number of cells observed experimentally. The rate of cell division in pre-
implantation embryos was derived from Ref 1, and for post-implantation embryos from
Refs2,3, based upon published values for alkaline phosphatase stained primordial germ
cells (PGCs). PGCs are first discernable at 7.25 days post coitus (dpc) during the mid
primitive streak stage, just posterior to the primitive streak in the extra-embryonic
mesoderm. Note the logarithmic Y-axis indicating exponential growth to a final figure
of 25,791 primary oocytes at day 13.5 3.
0 2 4 6 8 10 12 141
10
100
1000
10000
Simulation Experiment
Num
ber
of
Cells
Time (dpc)
27

Supplementary Figure 2 The total amount of mtDNA in the simulated mouse
embryos up to 7dpc, followed by the total amount of mtDNA in the entire PGC
population. Dpc = days post coitus.
0 2 4 6 8 10 12 14103
104
105
106
107
108
Tota
l Sim
ula
ted m
tDN
A C
on
Time (dpc)
PGCs Whole embryo
28

Supplementary Figure 3 Comparison of three real-time PCR assays targeting
different regions of the mitochondrial genome: ND5 (nt12789 to nt12876), ND4
(nt1031 to nt11174), and ND1 (nt2751 to nt3709). Total genomic DNA was extracted
from the tail of a C57Bl6 mouse and serially diluted. Each dilution was assayed in
quadruplicate using the same methods employed in the manuscript to determine the
absolute amount of mtDNA in each sample. The graphs shows two independent serial
dilutions of a genomic DNA template serially diluted and measured by two different
assays: (a) comparison of ND4 with ND5, (b) comparison of ND1 with ND5, (c)
comparison of ND4 with ND1. Pearson’s correlation co-efficient showed a tight
correlation in the measured copy number values using each assay (R2 > 0.99). The
ND5 assay was used in the experiments described in the manuscript.
29

5
100 101 102 103 104 105 106 107100
101
102
103
104
105
106
107
mND4
mND5100 101 102 103 104 105 106 107
100
101
102
103
104
105
106
107
mND4
mND5
100 101 102 103 104 105 106100
101
102
103
104
105
106
mND4
mND1100 101 102 103 104 105 106
100
101
102
103
104
105
106
mND4
mND1
R2=0.9999 R2=0.9991
R2=0.9963 R2=0.9990
a
100 101 102 103 104 105 106 107100
101
102
103
104
105
106
107
mND1
mND5100 101 102 103 104 105 106 107
100
101
102
103
104
105
106
107
mND1
mND5
R2=0.9997 R2=0.9931
b
c
30

References for the supplementary material 1. Streffer, C., Van Beuningen, D., Mollis, M., Zamboglou, N. & Schultz, S.
Kinetics of cell proliferation in the pre-implanted mouse embryo in vivo and in
vitro. Cell Tiss. Kinetics 13, 135-143 (1980).
2. Ginsburg, M., Snow, M.H.L. & McLaren, A. Primordial germ cells in the
mouse embryo during gastrulation. Development 110, 521-528 (1990).
3. Tam, P.P.L. & Snow, M.H.L. Proliferation and migration of primordial germ
cells during compensatory growth in mouse embryos. J. Embryol. Exp.
Morphol. 64, 133-147 (1981).
4. Wright, S. Evolution and the genetics of populations, (University of Chicago
Press, Chicago, 1969).
31

3 Chapter 3: The Distribution of Mitochondrial DNA Heteroplasmy due to Random Genetic Drift
Passorn Wonnapinij1, Patrick F. Chinnery2, and David C. Samuels1
1 Virginia Bioinformatics Institute, Virginia Polytechnic Institute and State University, Blacksburg, VA, 24061, USA 2 Mitochondrial Research Group and Institute of Human Genetics, Newcastle University, The Medical School, Newcastle-upon-Tyne NE2 4HH, UK
Reprinted from “The American Journal of Human Genetics 2008, 83, 582-593” with permission from Elsevier
To whom correspondence should be conducted: [email protected]
32

ARTICLE
The Distribution of Mitochondrial DNA HeteroplasmyDue to Random Genetic Drift
Passorn Wonnapinij,1 Patrick F. Chinnery,2 and David C. Samuels1,*
Cells containing pathogenic mutations inmitochondrial DNA (mtDNA) generally also contain the wild-typemtDNA, a condition called
heteroplasmy. The amount of mutant mtDNA in a cell, called the heteroplasmy level, is an important factor in determining the amount
of mitochondrial dysfunction and therefore the disease severity. mtDNA is inherited maternally, and there are large random shifts in
heteroplasmy level between mother and offspring. Understanding the distribution in heteroplasmy levels across a group of offspring
is an important step in understanding the inheritance of diseases caused by mtDNA mutations. Previously, our understanding of
the heteroplasmy distribution has been limited to just the mean and variance of the distribution. Here we give equations, adapted
from the work of Kimura on random genetic drift, for the full mtDNA heteroplasmy distribution. We describe how to use the Kimura
distribution in mitochondrial genetics, and we test the Kimura distribution against human, mouse, and Drosophila data sets.
Introduction
Mitochondrial DNA (mtDNA) encodes several subunits of
the electron transfer chain. Defects in human mtDNA
cause a wide range of disease conditions, mainly resulting
from the impairment of ATP production in the cell. Some
examples of the inheritable pathogenic point mutations
in mtDNA are the m.3243A > G (MIM #590050.0001)
mutation causing mitochondrial encephalomyopathies
lactic acidosis and stroke-like episodes (MELAS, MIM
#540000),1 the m.8344A > G (MIM #590060.0001) muta-
tion causing myoclonic epilepsy with ragged-red fiber
(MERRF, MIM #545000),2 the m.8993T > G (MIM
#516060.0001) mutation causing neuropathy, ataxia, and
retinitis pigmentosa (NARP, MIM #551500)3,4 and a num-
ber of different point mutations causing Leber’s hereditary
optic neuropathy (LHON, MIM #535000).5–7
Any individual cell contains many copies of the mito-
chondrial genome. The mtDNA copy number per cell
ranges from a few hundred to a few hundred thousand
copies. Generally, cells containing a pathogenic mtDNA
mutation also contain the wild-type genome, a condition
called heteroplasmy. Important exceptions to this rule
are the mitochondrial diseases such as LHON, which
have a low penetrance of the disease phenotype within
families carrying the mutation. Individuals may be homo-
plasmic for these particular pathogenic mutations, often
while remaining asymptomatic, and this is generally
attributed to the lack of some necessary pathogenesis
cofactor, either genetic or environmental.
MtDNA is transmitted through the maternal lineage in
humans.8 In pedigrees with an inheritable heteroplasmic
mtDNA mutation, the measured heteroplasmy level often
shifts by large and apparently random amounts between
mother and offspring.9–11 These variations cause complica-
tions in estimating the recurrence risks of these genetic dis-
eases and therefore in giving accurate genetic counseling
to a female carrying a pathogenic mtDNA mutation.12–14
The inheritance of mtDNA heteroplasmy is described by
the expected probability distribution of heteroplasmy
values in a sibling group. Until now, our ability to predict
heteroplasmy distributions has been limited to predicting
themeanvalueandthevariance, the two lowest-order statis-
tics. On the basis of neutral genetic drift and standard hap-
loid population genetics, we have been able to predict that
the mean heteroplasmy in the offspring should be equal to
the mother’s heteroplasmy and that the variance of the
offspring heteroplasmy should have the following form15:
VðtÞ ¼ p0�1� p0
��1� e�t=Neff
�zp0
�1� p0
�h1�
�1� 1
Neff
�ti (1)
The variance of heteroplasmy, V, in a group of individuals
with a single common maternal ancestor after t genera-
tions can be calculated from the initial gene frequency,
p0, and the effective population size, Neff. This variance
equation is generally referred to in this field as the Sew-
ell-Wright formula. We note again that these equations
are based on the assumption of random genetic drift.
Although the mean and variance of the heteroplasmy
distribution in a population is useful information, it is
very limited information. It does not give us the hetero-
plasmy distribution itself. In particular, this is a problem
if the heteroplasmy distribution is not symmetric, which
must be the case at high and low heteroplasmy levels,
two extremes of enormous practical importance. Ideally,
we would want to be able to predict the entire hetero-
plasmy probability distribution. Fortunately, this problem
was solved in 1955 by Motoo Kimura.16 His solution was
for gene frequency probabilities in diploid populations,
but the application of this theory to mitochondrial hetero-
plasmy is straightforward. The variance in Equation 1 can
1Virginia Bioinformatics Institute, Virginia Polytechnic Institute and State University, Blacksburg, VA 24061, USA; 2Mitochondrial Research Group and
Institute of Human Genetics, Newcastle University, The Medical School, Newcastle-upon-Tyne NE2 4HH, UK
*Correspondence: [email protected]
DOI 10.1016/j.ajhg.2008.10.007. ª2008 by The American Society of Human Genetics. All rights reserved.
582 The American Journal of Human Genetics 83, 582–593, November 7, 2008
33

be derived from Kimura’s theory, so the full Kimura theory
does not displace the previous work that has been done in
mitochondrial genetics on the basis of this variance equa-
tion. Instead, it greatly extends our capability to calculate
the full heteroplasmy distribution.
Kimura derived a set of probability distribution func-
tions to explain the gene frequency distribution of popula-
tions under pure random genetic drift. The underlying
assumptions of this derivation are nonoverlapping genera-
tions, no selection, no migration, no de novo mutation,
and a finite and steady population size.16 Kimura made
the assumption of a constant population size to simplify
the mathematics. Other work17 has shown that this as-
sumption is not necessary. If the population size is allowed
to vary, either through fluctuations18 or through events
such as population bottlenecks,17 then the definition of
the effective population size in terms of the actual popula-
tion size becomes complicated. That complication does
not concern us here because we will treat the effective pop-
ulation size, Neff, merely as a parameter of the model. The
solution of this model consists of three equations: a proba-
bility f(0,t) for losing an allele, a probability f(1,t) for fixing
on that allele, and a probability distribution function f(x,t)
that the allele is present at frequency x in the population.
f ð0,tÞ ¼ �1� p0�þXN
i¼1
ð2iþ 1Þp0�1� p0
�ð�1Þi
F�1� i,iþ 2,2,1� p0
�e�ðiðiþ1Þ=2Neff Þt ð2Þ
fðx,tÞ ¼XNi¼1
iðiþ 1Þð2iþ 1Þp0�1� p0
�Fð1� i,iþ 2,2,xÞ
F�1� i,iþ 2,2,p0
�e�ðiðiþ1Þ=2Neff Þt ð3Þ
f ð1,tÞ ¼ p0 þXNi¼1
ð2iþ 1Þp0�1� p0
�ð�1Þi
F�1� i,iþ 2,2,p0
�e�ðiðiþ1Þ=2Neff Þt ð4Þ
Themeaning of each variable in these equations is the same
as for the Sewall-Wright variance formula (Equation 1). The
interpretation in terms of mitochondrial heteroplasmy is
straightforward; p0 is the mtDNA heteroplasmy level in
the maternal lineage founder and is also the mean hetero-
plasmy in the offspring distribution, f(0,t) and f(1,t) are the
probabilities of fixing on the wild-type or mutant,
respectively, in generation t, and x is the offspring hetero-
plasmy level. The functionF(1� i, iþ2, 2, z) is thehypergeo-
metric function.For simplicity,wewill refer toEquations2–4
as the Kimura distribution. Because this is a probability dis-
tribution, the integration of all three terms is equal to unity.
f ð0,tÞ þð10
fðx,tÞdxþ f ð1,tÞ ¼ 1 (5)
Although themathematical formof theKimuradistribution
is certainly complicated, andalthoughcaremust be taken in
the numerical calculation of these equations, the distribu-
tion values can be calculated. In this paper, we apply the
Kimura distribution to measurements of the mtDNA heter-
oplasmy distributions in humans, mice, and Drosophila.
Material and Methods
Experimental DataThe observed heteroplasmy distributions used in this paper have
been collected from several sources in the published litera-
ture.19–22 For experimental data that were available only in graph-
ical form, we used the software Engauge Digitizer to determine
approximate numerical values. The experimental data sets
analyzed here covered three organisms; human,19 mouse,21 and
Drosophila.20,22 The human study protocol was approved by the
participating institutional review boards.
Setting the Parameter Values for Kimura’s
Probability DistributionThe variance formula as it is normally written is a function of three
parameters; p0, t, and Neff. However, the form of the equations
Figure 1. The Heteroplasmy Distribution of the A3243GmtDNA Mutation in a Sample of Human Primary Oocytes IsCompared to the Kimura Distribution(A) Frequency histogram of the heteroplasmy in both the data andthe Kimura distribution fit to the data. Parameter values for theKimura distribution are given in Table 1 for all figures.(B) Cumulative probability distribution functions for the data andthe Kimura distribution fit to the data. A KS test indicates thatthere is no significant difference between the measured and thetheoretical probability distributions.
The American Journal of Human Genetics 83, 582–593, November 7, 2008 583
34

allows us to combine the t and Neff parameters into a single param-
eter that we call b, as follows.
V ¼ p0�1� p0
��1� e�t=Neff
� ¼ p0�1� p0
�ð1� bÞ (6)
The new parameter b is then defined as
b ¼ e�t=Neff (7)
Substituting these parameters into the Kimura probability density
functions simplifies them to a two-parameter model, with param-
eters p0 and b, which both range from zero to one.
f ð0Þ ¼ �1� p0�þXN
i¼1
ð2iþ 1Þp0�1� p0
�ð�1Þi
F�1� i,iþ 2,2,1� p0
�biðiþ1Þ=2 ð8Þ
fðxÞ ¼XNi¼1
iðiþ 1Þð2iþ 1Þp0�1� p0
�Fð1� i,iþ 2,2,xÞ
F�1� i,iþ 2,2,p0
�biðiþ1Þ=2 ð9Þ
f ð1Þ ¼ p0 þXNi¼1
ð2iþ 1Þp0�1� p0
�ð�1ÞiF�1� i,iþ 2,2,p0�biðiþ1Þ=2
(10)
Given a data set of mtDNA heteroplasmy values for a set of indi-
viduals arising from a common founder, we can fit a Kimura
probability distribution to the heteroplasmy values by determin-
ing the values for the two parameters p0 and b. These two param-
eters can be determined from the two lowest-order statistics of
the data set; the mean and the variance. We take the parameter
p0 to be equal to the mean heteroplasmy value of the data set.
Then we can use Equation 6 to determine the parameter b from
p0 and the variance of the data. The entire data set, including het-
eroplasmy values fixed at the two extremes of 0 and 1, is used in
the calculation of the variance and p0 and then is used in the
calculation of b.
Calculating the Numerical Value
of the Hypergeometric FunctionAccurately calculating the numerical value of the hypergeometric
function F(a,b,c,z) is a difficult technical problem. Because this
is a fundamental mathematical function, this issue has been
faced in many different scientific fields. Recently, as a solution
to this problem occurring in a spectroscopy application, Hoang-
Binh23 developed an accurate and practical algorithm for the
numerical calculation of hypergeometric functions, and we
have followed this method. This method uses the following
recurrence relation:
Fð�1Þ ¼ Fð�1,b,c,zÞ ¼ 1� ðbz=cÞ (11)
Fð0Þ ¼ Fð0,b,c,zÞ ¼ 1 (12)
ða� cÞFða� 1Þ ¼ að1� zÞ½FðaÞ � Fðaþ 1Þ� þ ðaþ bz� cÞFðaÞ (13)
Table 1. The Parameters Estimated from Experimental Data: The Mean Heteroplasmy, p0, and the b Parameter Calculated fromthe Variance and the p Value Calculated from the KS Test
Organism Lineage Sample Generations Mean Heteroplasmy, p0 Variance N b KS Test p Value
Humans
N/A primary oocytes - 0.1264 0.01432 82 0.8705 0.827
Mice
515 tail biopsy 1 0.051 0.00240 41a 0.9505 0.646
515 mature oocytes - 0.047 0.00646 31 0.8558 0.049*
517 tail biopsy 1 0.076 0.00447 43 0.9363 0.75
517 mature oocytes - 0.094 0.0119 26 0.8604 0.834
603A mature oocytes - 0.009 0.000185 49 0.9793 0.681
603A primary oocytes - 0.011 0.00023 49a 0.9789 0.037*
603B mature oocytes - 0.031 0.00098 31 0.9674 0.435
603B primary oocytes - 0.025 0.000638 46a 0.9738 0.223
Drosophila mauritiana
H1 unfertilized eggs 30 0.4150 0.18670 60 0.2310 0.004**
H1-31M 3 0.1784 0.00952 59 0.9350 0.587
H1-18D 3 0.4763 0.01711 31 0.9314 0.993
H1-12B 5 0.8155 0.02791 52 0.8146 0.865
G20-5 3 0.3250 0.01257 55 0.9430 0.922
G71-12 3 0.5834 0.01804 50 0.9258 0.542
Drosophila simulans
6YF16 3 0.1270 0.0096 44 0.9131 0.79
The ‘‘generations’’ column gives the number of organism generations, and thus this value is not given for samples of mature oocytes or primary oocytes. The
p0 parameter is obtained from the average of the heteroplasmy measurements. N is the number of samples from the experiment. The p value is the level of
significance for the null hypothesis that the experimental heteroplasmy distribution matches the Kimura distribution. The asterisks indicate significance
levels: * 0.01 < p < 0.05 and ** p < 0.01.a In these three cases,we founddiscrepancies between thenumber of samples listed in the citedpaper21 and thenumber of samples actually given in the data set.
584 The American Journal of Human Genetics 83, 582–593, November 7, 2008
35
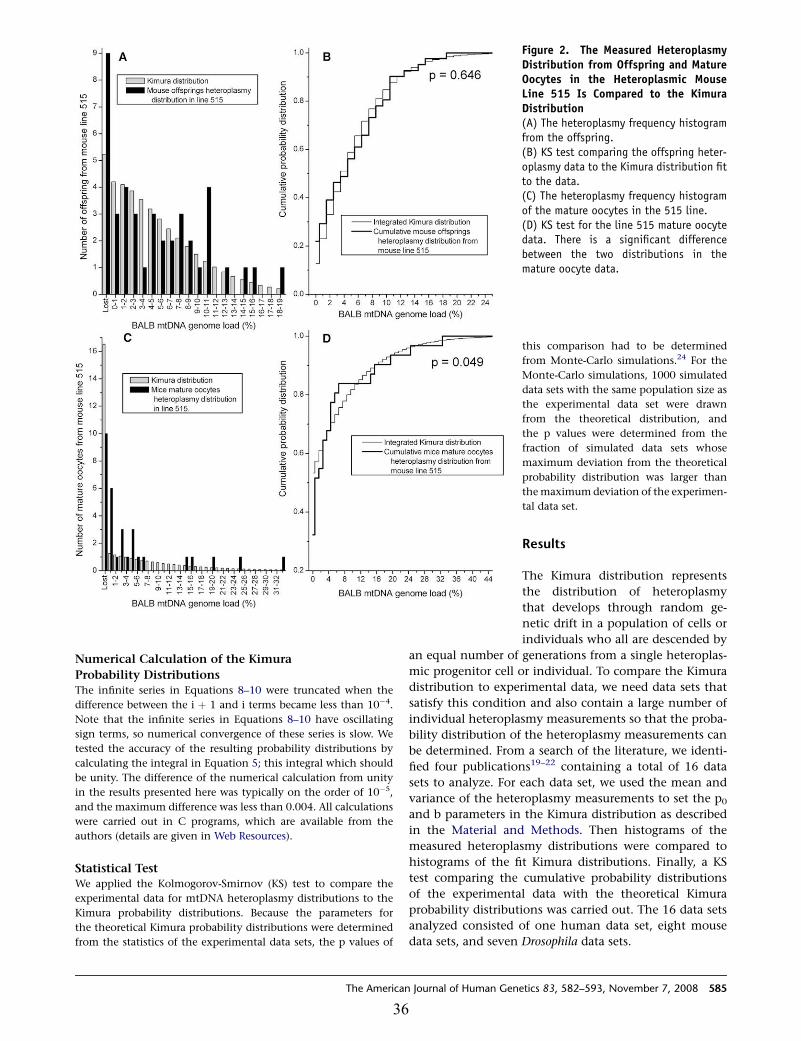
Numerical Calculation of the Kimura
Probability DistributionsThe infinite series in Equations 8–10 were truncated when the
difference between the i þ 1 and i terms became less than 10�4.
Note that the infinite series in Equations 8–10 have oscillating
sign terms, so numerical convergence of these series is slow. We
tested the accuracy of the resulting probability distributions by
calculating the integral in Equation 5; this integral which should
be unity. The difference of the numerical calculation from unity
in the results presented here was typically on the order of 10�5,
and the maximum difference was less than 0.004. All calculations
were carried out in C programs, which are available from the
authors (details are given in Web Resources).
Statistical TestWe applied the Kolmogorov-Smirnov (KS) test to compare the
experimental data for mtDNA heteroplasmy distributions to the
Kimura probability distributions. Because the parameters for
the theoretical Kimura probability distributions were determined
from the statistics of the experimental data sets, the p values of
Figure 2. The Measured HeteroplasmyDistribution from Offspring and MatureOocytes in the Heteroplasmic MouseLine 515 Is Compared to the KimuraDistribution(A) The heteroplasmy frequency histogramfrom the offspring.(B) KS test comparing the offspring heter-oplasmy data to the Kimura distribution fitto the data.(C) The heteroplasmy frequency histogramof the mature oocytes in the 515 line.(D) KS test for the line 515 mature oocytedata. There is a significant differencebetween the two distributions in themature oocyte data.
this comparison had to be determined
from Monte-Carlo simulations.24 For the
Monte-Carlo simulations, 1000 simulated
data sets with the same population size as
the experimental data set were drawn
from the theoretical distribution, and
the p values were determined from the
fraction of simulated data sets whose
maximum deviation from the theoretical
probability distribution was larger than
themaximumdeviation of the experimen-
tal data set.
Results
The Kimura distribution represents
the distribution of heteroplasmy
that develops through random ge-
netic drift in a population of cells or
individuals who all are descended by
an equal number of generations from a single heteroplas-
mic progenitor cell or individual. To compare the Kimura
distribution to experimental data, we need data sets that
satisfy this condition and also contain a large number of
individual heteroplasmy measurements so that the proba-
bility distribution of the heteroplasmy measurements can
be determined. From a search of the literature, we identi-
fied four publications19–22 containing a total of 16 data
sets to analyze. For each data set, we used the mean and
variance of the heteroplasmy measurements to set the p0
and b parameters in the Kimura distribution as described
in the Material and Methods. Then histograms of the
measured heteroplasmy distributions were compared to
histograms of the fit Kimura distributions. Finally, a KS
test comparing the cumulative probability distributions
of the experimental data with the theoretical Kimura
probability distributions was carried out. The 16 data sets
analyzed consisted of one human data set, eight mouse
data sets, and seven Drosophila data sets.
The American Journal of Human Genetics 83, 582–593, November 7, 2008 585
36

Human Data
Nohuman pedigree data set is large enough tomake a good
test of the Kimura distribution. However, there is one
human data set that is large enough. Brown et al.19 pub-
lished a study of the heteroplasmy distribution of 82 single
primary oocytes derived from an ovary of a female with the
pathogenic 3243A>GmtDNA point mutation. This tissue
sample was available because this woman underwent a
hysterectomy for reasons unrelated to any mitochondrial
disease. This woman was asymptomatic and had a muta-
tion level of 18.11% determined from a quadriceps biopsy
and of 7.24% of the mutant type in her leukocytes.19 We
note here that the mutation level of the 3243A > G muta-
tion decreases with age in blood samples.25
Figure 1 presents the comparison of the measured heter-
oplasmy distribution in the human primary oocytes and
the Kimura distribution fit to the data. The Kimura distri-
bution is a very good fit to the measured heteroplasmy
distribution, and this is confirmed by the KS test, which
Figure 3. The Measured HeteroplasmyDistribution from Offspring and MatureOocytes in the Heteroplasmic MouseLine 517 Is Compared to the KimuraDistribution(A) The heteroplasmy frequency histogramfrom the offspring.(B) KS test comparing the offspring heter-oplasmy data to the Kimura distribution fitto the data.(C) The heteroplasmy frequency histogramof the mature oocytes in the 517 line.(D) KS test for the data from line 517mature oocytes.
gives a p value of 0.827 for the null
hypothesis that the experimental
data are consistent with the Kimura
distribution (Table 1). The limited
amount of human heteroplasmy
data currently available indicates
that the theoretical Kimura probabil-
ity distribution is a good tool for cal-
culating the distribution of mtDNA
heteroplasmy in a population derived
from a single founder.
Mouse Data
Given the limited amount of human
data available, it is important to
extend this analysis to the existing
animal models for the inheritance of
mtDNA heteroplasmy. Jenuth et al.21
published a seminal paper on amouse
model ofmtDNAheteroplasmy inher-
itance. In this study, they used mice
that were heteroplasmic for two
mtDNA haplogroups, NZB and BALB. These heteroplasmic
mice were produced by an electrofusing cytoplast tech-
nique. The data in this study included heteroplasmy mea-
surements on sets of primary oocytes (as in the human
data analyzed above), mature oocytes, and tail samples
from offspring; each data set was derived from a single
founder female.
Figures 2–5 present the comparisons of the Kimura
distributions to the heteroplasmy distributions in eight
data sets from the mouse model. In six of the eight data
sets, the null hypothesis is not rejected, indicating that
the Kimura distribution is a good representation of the
distribution of the heteroplasmy values in these data sets
(Table 1). The null hypothesis was rejected in two of the
data sets: themature oocytes from line 515 (Figures 2C–2D,
p¼ 0.049) and the primary oocytes from line 603A (Figures
4C and 4D, p ¼ 0.037). For the data set consisting of line
515 mature oocytes, the difference between the observed
heteroplasmy distribution and the fit Kimura distribution
586 The American Journal of Human Genetics 83, 582–593, November 7, 2008
37

is largest for the number of cells with zero heteroplasmy for
the BALB mtDNA haplotype, and fewer of these cells were
observed in the experiment than were predicted by the
Kimura distribution. For the data set of primary oocytes
from the 603A mouse line (Figures 4C and 4D), the largest
difference between the observed heteroplasmy distribu-
tion and the Kimura distribution is the lack of observation
of any cells with NZB haplotype heteroplasmy in the range
0.1%–0.5%, despite the large number of cells with levels of
0% and 0.5%–1.0% in the neighboring bins. Jenuth et al.
remarked on this odd result of the missing heteroplasmy
values.21 For the other six mouse data sets, the Kimura
distributions do provide a good representation of the
observed mtDNA heteroplasmy distributions (Figures 2–5).
Drosophila Data
The Drosophila data sets consist of data from two species,
D.mauritianaandD.simulans. Inbothcases theheteroplasmy
measurements were made in a sample of unfertilized eggs.
Figure 4. The Measured HeteroplasmyDistribution from Mature Oocytes andPrimary Oocytes in the HeteroplasmicMouse Line 603A Is Compared to theKimura Distribution(A) The heteroplasmy frequency histogramof the mature oocytes in the 603A line.(B) KS test for the data from line 603Amature oocytes.(C) The heteroplasmy frequency histogramof the primary oocytes in the 603A line.(D) KS test for the data from line 603Aprimary oocytes. There is a significant dif-ference between the two distributions forthe primary oocyte data.
For D. mauritiana we had six data
sets for which the mtDNA hetero-
plasmy was defined by the difference
in the length of an AþT-rich region
of the mitochondrial genome.22 Fig-
ures 6 and 7 present the comparisons
of the fit Kimura distributions to the
measured Drosophila heteroplasmy
distributions. For five of the six data
sets, the null hypothesis is not re-
jected (Table 1), and the fit Kimura
heteroplasmy distributions show
a very good correspondence to the
observed heteroplasmy distributions.
For one data set (Figures 6A and 6B,
p ¼ 0.004), the differences between
the Kimura distribution and the mea-
sured heteroplasmy distribution are
quite large. This is interesting because
this data set is unique in another way:
The number of generations from the
founder in this data set is very large at 30 generations,
about ten times larger than the number of generations in
the other five data sets.
The D. simulans data consist of a single data set where
the mtDNA heteroplasmy was generated by cytoplasmic
injection forming a mixture of the siIII and siII mtDNA
genomes,20 two naturally occurring mtDNA sequences in
this species. The comparison of the data to the Kimura
distribution is given in Figure 8. Here the null hypothesis is
not rejected, and the Kimura distribution is a good represen-
tation of the observed mtDNA heteroplasmy distribution.
Discussion
In the field of mitochondrial genetics, the Sewall-Wright
variance formula has been generally used as the primary
data analysis method for determining the effect of random
genetic drift on mtDNA heteroplasmy values. Researchers
The American Journal of Human Genetics 83, 582–593, November 7, 2008 587
38

have used this simple function both to examine the ability
of random genetic drift to explain mtDNA segregation
and to predict the rate of mtDNA segregation from
assumptions about the size of the mtDNA segregating
unit.19,21,22 The advantage of the Sewall-Wright variance
formula is its simplicity and ability to estimate most
parameters from experimental data (although estimating
the effective population size Neff in Equation 1 has always
been a problem).
However, the weakness of this simple approach is that
it concentrates on just the two lowest-order statistics,
the mean and the variance, and it ignores the rest of the
information that is present in the total heteroplasmy
distribution. This is of particular importance when the
heteroplasmy distribution is not symmetric (not a normal
distribution), as it must be at the extremes of low and high
heteroplasmy. The shape of the heteroplasmy distribution
at high-mutation heteroplasmy values is important for
understanding the consequences of pathogenic effects,
which generally only appear in individuals with a high
level of the mtDNA mutation. The distribution at low
Figure 5. The Measured HeteroplasmyDistribution from Mature Oocytes andPrimary Oocytes in the HeteroplasmicMouse Line 603B Is Compared to theKimura Distribution(A) The heteroplasmy frequency histogramof the mature oocytes in the 603B line.(B) KS test for the data from line 603Bmature oocytes.(C) The heteroplasmy frequency histogramof the primary oocytes in the 603B line.(D) KS test for the data from line 603Bprimary oocytes.
heteroplasmy values is important
because this range is directly affected
by any de novo mutation rate. The
heteroplasmy distribution near zero
also is important for determining
the clearance of a pathogenic muta-
tion from a population. Because these
extremes are arguably the most im-
portant parts of the heteroplasmy
range, any approach that implicitly
assumes a normal distribution has
severe limitations. Using the Kimura
distribution as a model for the hetero-
plasmy distribution across its entire
range from 0%–100%, as well as the
fixation rate on the extremes, frees
us from those limitations and gives
us a significant new tool in our
analysis of mtDNA heteroplasmy
inheritance.
The additional information that we can get from using
theKimuradistributioncomes at a cost: the increasedmath-
ematical complexity of Equations 2–5. These equations are
difficult to use, and the numerical computation must be
done carefully if accuracy problems are to be avoided.23
Two possible alternatives to the Kimura distribution are
the normal distribution and the binomial distribution.
Examples of the Kimura distribution, the normal distribu-
tion, and the binomial distribution with equal values for
the mean and the variance in all three distributions are
given in Figure 9. As discussed above, normal distributions
(Figure 9B) do not correctly describe heteroplasmy distribu-
tions over the finite range of 0%–100% and do not address
the important question of fixation. Although binomial
distributions are nonsymmetric, cover only a finite hetero-
plasmy range, and can deal with fixation, they assume that
heteroplasmyvalues comeonly indiscrete steps (Figure9C),
which is not consistent with the available heteroplasmy
distribution data. Despite its mathematical complexity,
theKimura distribution is the best available tool for describ-
ing mtDNA heteroplasmy distributions.
588 The American Journal of Human Genetics 83, 582–593, November 7, 2008
39

An alternative computational approach to determining
heteroplasmy distributions is the use of direct simulation
models. These include simulations of mtDNA replication
in individual cells,26,27 simulations of mtDNA dynamics
in embryogenesis,28 and relatively simple multiple sam-
pling models.29 We note that Poulton29 presented one
heteroplasmy distribution from a multiple-sampling
simulation model that at least qualitatively resembles the
Kimura distribution. Direct simulation models have the
advantage of flexibility in that additional mechanisms
such as selection effects and de-novo mutations can easily
be added to the simulation, but they have the limitation of
only presenting results for specific parameter values. The
equations of the Kimura distribution have the advantage
of explicit definition (something that is often not clear
in a simulation) and the presentation of results for all
possible parameter values. These two computational ap-
proaches are complimentary. Indeed, as discussed below,
the Kimura distributions can be used as a tool in develop-
ing population-level simulation models of mitochondrial
genetics.
Figure 6. The Measured HeteroplasmyDistribution from Unfertilized Eggs inthe Heteroplasmic Drosophila mauriti-ana Lines H1, G20-5, and G71-12 IsCompared to the Kimura Distribution(A) The heteroplasmy frequency histogramof the Drosophila line H1 and the Kimuradistribution fit to the mean and variancevalues from these data.(B) The KS test comparing the data withthe Kimura distribution. There is a signifi-cant difference between the two distribu-tions for line H1.(C) The heteroplasmy frequency histogramfor the Drosophila line G20-5 is comparedto the Kimura distribution.(D) KS test comparing the data for Drosoph-ila line G20-5 to the Kimura distribution.(E) The heteroplasmy frequency histogramfrom the Drosophila line G71-12 iscompared to the Kimura distribution.(F) KS test comparing the data for Drosoph-ila line G71-12 to the Kimura distribution.
Only one human data set19 was
large enough to allow a useful com-
parison against the Kimura distribu-
tion. It would be extremely useful to
have further human data sets of this
type, covering a wide range of mean
heteroplasmy values, in order to
more thoroughly test the application
of the Kimura distribution to human
mtDNA heteroplasmy distributions.
Further human data sets would also
allow us to explore important ques-
tions such as how much the b parameter in this model
varies across the population (essentially, this corresponds
to how variable the inheritance bottleneck is in the human
population30–32). With the limited human data currently
available, and the data from the mouse and Drosophila
models, the Kimura distributions are consistent with the
experimental data in 13 of the 16 data sets analyzed.
Because the Kimura distribution only represents the
effects of random genetic drift, deviations from that distri-
bution may give us information about the other mecha-
nisms that are occurring, most importantly selection
effects and de novo mutation. Of the three data sets in
which the null hypothesis was rejected, the data in Fig-
ures 6A and 6B are of particular interest. These data are
from the 30th generation after the founder female, by far
the longest generational separation in any of these data
sets. It is reasonable to assume that this large number of
generations would accentuate effects such as selection or
de novomutations, whichmight be negligible over shorter
time spans. With the very large variance in this data set
(Table 1), the theoretical distribution is relatively flat, and
The American Journal of Human Genetics 83, 582–593, November 7, 2008 589
40

there are sharp peaks at the fixed points 0% and 100%,
which act as absorbing states in the random-drift model
(in other words, once a female individual fixes at either
extreme, all descendents remain at that fixed state). In
contrast, the observed heteroplasmy distribution has a
‘‘U’’ shape, such that the probability distribution rises
toward each end of the heteroplasmy extreme. It is difficult
to construct a mechanism whereby selection could form
such a distribution, unless one were to argue for a selection
mechanism that had maximum effect at around 50%
heteroplasmy and low effects at either heteroplasmy ex-
treme. A more plausible explanation would be that the
two fixed states in this case were not absolutely fixed and
that there was some production of heteroplasmic descen-
dents from homoplasmic females in both fixed states.
These de novo mutation mechanisms, acting over 30 gen-
erations, could form the U-shaped distribution seen in
Figure 6A. One could also speculate that the shape of the
observed heteroplasmy distribution in Figure 6A suggests
that the de novo mutation rate of the formation of the
longer genome from the shorter genome (i.e., away from
Figure 7. The Measured HeteroplasmyDistribution from Unfertilized Eggs inthe Heteroplasmic Drosophila mauriti-ana Lines H1-31M, H1-18D, andH1-12B Is Compared to the Kimura Dis-tribution(A) The heteroplasmy frequency histogramfrom the Drosophila line H1-31M and theKimura distribution.(B) The KS test comparing the hetero-plasmy data for Drosophila line H1-31M tothe Kimura distribution.(C) The heteroplasmy frequency histogramfrom the Drosophila line H1-18D is com-pared to the Kimura distribution.(D) KS test comparing the Drosophila lineH1-18D to the Kimura distribution.(E) The heteroplasmy frequency histogramfrom Drosophila line H1-12B is comparedto the Kimura distribution.(F) KS test comparing data for Drosophilaline H1-12B and the Kimura distribution.
the fixed state at heteroplasmy 0%)
is the larger of the twomutation rates.
Finally, let us discuss the roles of
the parameters p0 and b. We defined
the parameter b (Equation 7) to re-
place a combination of the parameter
t, the number of generations, and the
parameter Neff, a statistical parameter
related to the number of segregating
units of mtDNA (though not neces-
sarily directly equal to it). In this
paper we have analyzed only a single
generation at a time, and we have not
applied this analysis to follow the heteroplasmy distribu-
tion over multiple generations. One could certainly use
the Kimura distribution to follow the distribution over
multiple generations, in which case the formulation of
Equations 2–5, which are written in terms of t and Neff,
should be used. The parameter p0 can be interpreted as ei-
ther the mean heteroplasmy in the data set or the hetero-
plasmy in the founder. In the case of pure random drift, the
two are the same, but other effects may cause a shift in
mean heteroplasmy over the generations. This distinction
in the definition of p0 may be important in some cases.
One example of this is the D. Simulans data set (Figure 8),
Even though the Kimura distribution fit to this data is a
good model of the heteroplasmy distribution (p ¼ 0.79),
in that experiment the mean heteroplasmy was observed
to shift from an initial value of 38.5% in the founder to
a value of 12.7% in the third generation.20 This was reason-
ably interpreted as indicating a selection effect in this
experiment. Despite the apparently strong selection effect,
the heteroplasmy distribution in the third generation is
still well described by a Kimura distribution with the value
590 The American Journal of Human Genetics 83, 582–593, November 7, 2008
41

p0 ¼ 0.127. The lesson here is that even if a Kimura distri-
bution, derived from neutral-drift theory, fits the observed
heteroplasmy distribution, this is not enough in itself to
allow us to determine that neutral drift alone has shaped
that heteroplasmy distribution. Instead, the old standard
method of measuring the changes in the mean hetero-
plasmy over a number of generations must continue to
be used. The use of the Kimura distribution adds valuable
information to our previous analysis techniques, but it
does not invalidate them.
What the Kimura-distribution theory presented here
allows us to do that we could not do before is to predict
the complete probability distribution, including the proba-
bility of fixing on thewild-type and on themutantmtDNA,
for mtDNA heteroplasmy values in a group of offspring.
Although this predictive ability is under the assumption
of randomgenetic drift, this is anecessaryfirst step towhich
important complications such as selection effects and de-
novomutationsmay thenbe added in further development
of this theoretical model. The comparisons of the Kimura
distributions to the experimental data sets presented in
this paper are one use of these equations, but these compar-
isons are primarily made here as a validation of the applica-
tion of this theory to mitochondrial genetics. The Kimura
distribution equations give us a theoretical framework for
the field of mitochondrial heteroplasmy.
A recent study by Elliot et al.33 of the prevalence of a set
of ten pathogenic mtDNA point mutations has shown that
these pathogenic mutations are relatively common in the
general population, where it has been measured that 1 in
200 individuals carries one of these tenmtDNAmutations.
With this new appreciation of how widespread mtDNA
heteroplasmy actually is, the ability to calculate the com-
plete heteroplasmy distribution by using the Kimura distri-
bution as a model of random genetic drift is an important
tool for understanding the heteroplasmy distribution in
the general population.
One potential application of this new theoretical tool is
the calculation of simulated pedigrees. These simulated
pedigrees may be used as tools for analyzing clinical pedi-
grees, for example in a Monte-Carlo test to define a p value
for a particular clinical pedigree tested against the null
hypothesis of random genetic drift. One could also use
the theoretical heteroplasmy distribution to calculate
disease occurrence probabilities, based on a heteroplasmy
threshold for the disease phenotype, for use in genetic
counseling. Further testing of the theory, and in particular
more human data such as that in Figure 1, will be needed
before that becomes a practical application. Finally, the cal-
culation of simulated pedigrees based on this theoretical
heteroplasmy distribution could be extended to model
large-scale populations. That model could be tested against
recent33 and future measurements of the occurrence of
mtDNA heteroplasmy and will help us understand the
Figure 8. Comparison of Measured Heteroplasmy Distributionfrom Drosophila simulans Unfertilized Eggs with the KimuraDistribution(A) Heteroplasmy frequency histogram and the Kimura distributionfit to these data.(B) KS test comparing the data to the Kimura distribution.
Figure 9. Comparison of a Kimura Distribution, Normal Distri-bution, and Binomial Distribution with Mean ¼ 0.1 and Vari-ance ¼ 0.01(A) Kimura distribution. The probability density f(x) is plotted.(B) Normal distribution.(C) Binomial distribution. The mean and variance values requirea range of discrete states from zero to nine, giving discrete prob-ability values of 0, 1/9, 2/9, etc.
The American Journal of Human Genetics 83, 582–593, November 7, 2008 591
42

development and spread of pathogenic mtDNA mutations
in the human population.
Acknowledgments
P.W. is supported by Thailand’s Commission on Higher Education,
Royal Thai Government under the program ‘‘Strategic Scholarship
for Frontier Research Network.’’ P.F.C. is a Welcome Trust Senior
Clinical Research Fellow.
Received: August 21, 2008
Revised: October 8, 2008
Accepted: October 14, 2008
Published online: October 30, 2008
Web Resources
The URL for data presented herein is as follows:
Kimura Distribution software, http://staff.vbi.vt.edu/dsamuels/
2008_Kimura/software
References
1. Goto, Y., Nonaka, I., and Horai, S. (1990). A mutation in the
transfer RNALEU(UUR) gene associated with the MELAS sub-
group of mitochondrial encephalomyopathies. Nature 348,
651–653.
2. Shoffner, J.M., Lott, M.T., Lezza, A.M.S., Seibel, P., Ballinger,
S.W., and Wallace, D.C. (1990). Myoclonous epilepsy and rag-
ged-red fiber disease(MERRF) is associated with a mitochon-
drial DNA transfer RNALYS mutation. Cell 61, 931–937.
3. Holt, I.J., Harding, A.E., Petty, R.K.H., and Morganhughes, J.A.
(1990). A new mitochondrial disease associated with mito-
chondrial DNA heteroplasmy. Am. J. Hum. Genet. 46,
428–433.
4. Uziel, G., Moroni, I., Lamantea, E., Fratta, G.M., Ciceri, E.,
Carrara, F., and Zeviani, M. (1997). Mitochondrial disease
associated with the T8993G mutation of the mitochondrial
ATPase 6 gene: A clinical, biochemical, and molecular study
in six families. J. Neurol. Neurosurg. Psychiatry 63, 16–22.
5. Wallace, D.C., Singh, G., Lott, M.T., Hodge, J.A., Schurr, T.G.,
Lezza, A.M.S., Elsas, L.J., and Nikoskelainen, E.K. (1988). Mito-
chondrial DNA mutation associated with lebers hereditary
optic neuropathy. Science 242, 1427–1430.
6. Howell, N., Bindoff, L.A., McCullough, D.A., Kubacka, I., Poul-
ton, J., Mackey, D., Taylor, L., and Turnbull, D.M. (1991). Leber
hereditary optic neuropathy - Identification of the same mito-
chondrial NDI mutation in 6 pedigrees. Am. J. Hum. Genet.
49, 939–950.
7. Johns, D.R., Neufeld, M.J., and Park, R.D. (1992). An ND6
mitochondrial DNAmutation associated with leber hereditary
optic neuropathy. Biochem. Biophys. Res. Commun. 187,
1551–1557.
8. Giles, R.E., Blanc, H., Cann, H.M., and Wallace, D.C. (1980).
Maternal inheritance of human mitochondrial DNA. Proc.
Natl. Acad. Sci. U.S.A. 77, 6715–6719.
9. Larsson, N.G., Tulinius, M.H., Holme, E., Oldfors, A., Ander-
sen, O., Wahlstrom, J., and Aasly, J. (1992). Segregation and
manifesations of the mtDNA trans RNALYSA>G(8344) muta-
tion of myoclonous epilepsy and ragged-red fibers (MERRF)
syndrome. Am. J. Hum. Genet. 51, 1201–1212.
10. Chinnery, P.F., Andrews, R.M., Turnbull, D.M., and Howell, N.
(2001). Leber hereditary optic neuropathy: Does heteroplasmy
influence the inheritance and expression of the G11778A mi-
tochondrial DNA mutation? Am. J. Med. Genet. 98, 235–243.
11. Sekiguchi, K., Kasai, K., and Levin, B.C. (2003). Inter- and
intragenerational transmission of a human mitochondrial
DNA heteroplasmy among 13 maternally-related individuals
and differences between and within tissues in two family
members. Mitochondrion 2, 401–414.
12. Chinnery, P.F., Howell, N., Lightowlers, R.N., and Turnbull,
D.M. (1998). Genetic counseling and prenatal diagnosis for
mtDNA disease. Am. J. Hum. Genet. 63, 1908–1910.
13. Thorburn, D.R., and Dahl, H.H.M. (2001). Mitochondrial
disorders: Genetics, counseling, prenatal diagnosis and repro-
ductive options. Am. J. Med. Genet. 106, 102–114.
14. Brown, D.T., Herbert, M., Lamb, V.K., Chinnery, P.F., Taylor,
R.W., Lightowlers, R.N., Craven, L., Cree, L., Gardner, J.L.,
and Turnbull, D.M. (2006). Transmission of mitochondrial
DNA disorders: Possibilities for the future. Lancet 368, 87–89.
15. Wright, S. (1942). Statistical genetics and evolution. Bull. Am.
Math. Soc. 48, 223–246.
16. Kimura, M. (1955). Solution of a process of random genetic
drift with a continuous model. Proc. Natl. Acad. Sci. USA 41,
144–150.
17. Maruyama, T., and Kimura, M. (1980). Genetic-variability and
effective population-size when local extinction and recoloni-
zation of sub-populations are frequent. Proc. Natl. Acad. Sci.
U.S.A. 77, 6710–6714.
18. Iizuka,M. (2001). The effective size of fluctuating populations.
Theor. Popul. Biol. 59, 281–286.
19. Brown, D.T., Samuels, D.C., Michael, E.M., Turnbull, D.M.,
and Chinnery, P.F. (2001). Random genetic drift determines
the level of mutant mtDNA in human primary oocytes. Am.
J. Hum. Genet. 68, 533–536.
20. de Stordeur, E., Solignac, M., Monnerot, M., and Mounolou,
J.C. (1989). The generation of transplasmic Drosophila simu-
lans by cytoplasmic injection- Effects of segregation and selec-
tion in the perpetuation of mitochondrial DNA heteroplasmy.
Mol. Gen. Genet. 220, 127–132.
21. Jenuth, J.P., Peterson, A.C., Fu, K., and Shoubridge, E.A.
(1996). Random genetic drift in the female germline explains
the rapid segregation ofmammalianmitochondrial DNA. Nat.
Genet. 14, 146–151.
22. Solignac, M., Genermont, J., Monnerot, M., and Mounolou,
J.C. (1984). Genetics of mitochondria in Drosophila mtDNA
inheritance in heteroplasmic strains of Drosophila mauritiana.
Mol. Gen. Genet. 197, 183–188.
23. Hoang-Binh, D. (2005). A program to compute exact hydro-
genic radial integrals oscillator strengths, and Einstein coeffi-
cients, for principal quantum numbers up to n approximate
to 1000. Comput. Phys. Commun. 166, 191–196.
24. Press,W.H. (1992). Numerical recipes in C: The art of scientific
computing. (Cambridge, UK: Cambridge University Press).
25. Rajasimha, H.K., Chinnery, P.F., and Samuels, D.C. (2008).
Selection against pathogenic mtDNA mutations in a stem
cell population leads to the loss of the 3243A -> G mutation
in blood. Am. J. Hum. Genet. 82, 333–343.
26. Chinnery, P.F., and Samuels, D.C. (1999). Relaxed replication
of mtDNA: A model with implications for the expression of
disease. Am. J. Hum. Genet. 64, 1158–1165.
27. Coller, H.A., Khrapko, K., Herrero-Jimenez, P., Vatland, J.A.,
Li-Sucholeiki, X.C., and Thilly, W.G. (2005). Clustering of
592 The American Journal of Human Genetics 83, 582–593, November 7, 2008
43

mutant mitochondrial DNA copies suggests stem cells are
common in human bronchial epithelium. Mut. Res. 578,
256–271.
28. Cree, L.M., Samuels, D.C., Lopes, S., Rajasimha, H.K., Wonna-
pinij, P., Mann, J.R., Dahl, H.H.M., and Chinnery, P.F. (2008).
A reduction of mitochondrial DNAmolecules during embryo-
genesis explains the rapid segregation of genotypes. Nat.
Genet. 40, 249–254.
29. Poulton, J., Macaulay, V., andMarchington, D.R. (1998). Is the
bottleneck cracked? Am. J. Hum. Genet. 62, 752–757.
30. Birky, C.W. (2001). The inheritance of genes in mitochondria
and chloroplasts: Laws, mechanisms, and models. Annu. Rev.
Genet. 35, 125–148.
31. Chinnery, P.F., Thorburn, D.R., Samuels, D.C., White, S.L.,
Dahl, H.H.M., Turnbull, D.M., Lightowlers, R.N., and Howell,
N. (2000). The inheritance of mitochondrial DNA hetero-
plasmy: Random drift, selection or both? Trends Genet. 16,
500–505.
32. Poulton, J., and Marchington, D.R. (2002). Segregation of
mitochondrial DNA (mtDNA) in human oocytes and in
animal models of mtDNA disease: clinical implications.
Reproduction 123, 751–755.
33. Elliott, H.R., Samuels, D.C., Eden, J.A., Relton, C.L., and Chin-
nery, P.F. (2008). Pathogenic mitochondrial DNA mutations
are common in the general population. Am. J. Hum. Genet.
83, 254–260.
The American Journal of Human Genetics 83, 582–593, November 7, 2008 593
44

4 Chapter 4: Previous Estimates of Mitochondrial DNA Mutation Level Variance Did Not Account for Sampling Error: Comparing the MtDNA Genetic Bottleneck in Mice and Humans
Passorn Wonnapinij1,2, Patrick F. Chinnery3, and David C. Samuels1
1 Center of Human Genetics Research, Department of Molecular Physiology and Biophysics, Vanderbilt University Medical Center, Nashville, TN, 37232, USA 2 Interdisciplinary Program in Genetics, Bioinformatics, and Computational Biology, Virginia Polytechnic Institute and State University, Blacksburg, VA, 24060, USA 3 Mitochondrial Research Group and Institute of Human Genetics, Newcastle University, The Medical School, Newcastle-upon-Tyne NE2 4HH, UK
Reprinted from “The American Journal of Human Genetics 2010, 86, 540-550” with permission from Elsevier
To whom correspondence should be conducted: [email protected]
45

ARTICLE
Previous Estimates of Mitochondrial DNA Mutation LevelVariance Did Not Account for Sampling Error: Comparingthe mtDNA Genetic Bottleneck in Mice and Humans
Passorn Wonnapinij,1,2 Patrick F. Chinnery,3 and David C. Samuels1,*
In cases of inherited pathogenicmitochondrial DNA (mtDNA)mutations, amother and her offspring generally have large and seemingly
random differences in the amount of mutatedmtDNA that they carry. Comparisons of measuredmtDNAmutation level variance values
have become an important issue in determining the mechanisms that cause these large random shifts in mutation level. These variance
measurements have been made with samples of quite modest size, which should be a source of concern because higher-order statistics,
such as variance, are poorly estimated from small sample sizes. We have developed an analysis of the standard error of variance from
a sample of size n, and we have defined error bars for variance measurements based on this standard error. We calculate variance error
bars for several published sets of measurements of mtDNAmutation level variance and show how the addition of the error bars alters the
interpretation of these experimental results. We compare variancemeasurements from human clinical data and frommousemodels and
show that the mutation level variance is clearly higher in the human data than it is in the mouse models at both the primary oocyte and
offspring stages of inheritance. We discuss how the standard error of variance can be used in the design of experiments measuring
mtDNAmutation level variance. Our results show that variancemeasurements based on fewer than 20measurements are generally unre-
liable and ideally more than 50 measurements are required to reliably compare variances with less than a 2-fold difference.
Introduction
Eukaryotic cells typically contain a large number of copies
of mitochondrial DNA (mtDNA). Generally, these copies
ofmtDNA are identical; however, some individuals contain
a mixture of two versions of the mtDNAmolecule, a condi-
tion called heteroplasmy. In the case of inherited mtDNA
mutations, this mtDNA heteroplasmy is found in cells
throughout the body, but with varying levels of themutant
mtDNA in different tissues.1,2 This variation in mutation
level is often also found when comparing multiple cells
from the same tissue in the individual.3,4 mtDNAmutation
level variations are a major factor underpinning the
randommosaic distributionof affected cells that is typically
observed in diseases resulting from mtDNA mutation.3,4
Perhaps the most important issue about the mtDNA
mutation level variation among cells concerns the vari-
ability of the mtDNA mutation levels in the cells of the
female germline. Mutation levels of inherited mtDNA
mutations are known to vary significantly between the
mother and her offspring and among offspring from
the same mother.5 This variability is important because
the randomness in the inheritance of mtDNA mutations
severely limits our ability to provide genetic counseling
to affected families.6,7 The processes responsible for this
variability in mutation levels among family members and
the exact timing of these processes during reproduction
are currently a matter of some controversy.8–11 To under-
stand mtDNA mutation inheritance, we must therefore
have a reliable means of measuring and comparing the
variation generated during the transmission of a hetero-
plasmic mtDNA mutation, both in the clinical setting
and also in several recently developed animal model sys-
tems. This understanding will underpin our ability to
make predictions about the likelihood of transmitting
a particular level of mutation and also provides the analyt-
ical tools to study tissue-tissue and cell-cell variability
in mtDNA mutation levels, which is fundamental to our
understanding of the tissue specificity and clinical progres-
sion of mtDNA diseases.
The experimental approach is based upon an estimation
of the distribution of mtDNA mutation in a particular
sample, which is typically reported as the variance of the
mutation level in the sample. As for all statistical estima-
tions, our confidence in the measured variance is critically
dependent upon the number of individual measure-
ments—in this case mutation level values—that must be
randomly sampled from the population of interest.
However, determining the statistical error for a variance
measurement is mathematically complex. As a result, the
error bars for the measured mtDNA mutation level vari-
ance are rarely, if ever, reported.
The mutation level variance is typically estimated from
a relatively small sample of cells in the range of 20 cells
or even far lower. Major experimental conclusions have
been based on comparisons of these measurements of vari-
ance, but we currently do not know whether these vari-
ance measurements are reliable. In other words, it is not
1Center of Human Genetics Research, Department of Molecular Physiology and Biophysics, Vanderbilt University Medical Center, Nashville, TN 37232,
USA; 2Interdisciplinary Program in Genetics, Bioinformatics, and Computational Biology, Virginia Polytechnic Institute and State University, Blacksburg,
VA 24060, USA; 3Mitochondrial Research Group and Institute of Human Genetics, Newcastle University, The Medical School, Newcastle-upon-Tyne NE2
4HH, UK
*Correspondence: [email protected]
DOI 10.1016/j.ajhg.2010.02.023. ª2010 by The American Society of Human Genetics. All rights reserved.
540 The American Journal of Human Genetics 86, 540–550, April 9, 2010
46

known how many individual measurements are required
for a reliable estimate of variance with a given statistically
defined confidence interval. Here we address this issue
from first principles and provide evidence that a far greater
number of samples than are generally taken are required to
make reliable comparisons of variance between different
groups. Central to our approach is a method of reliably
calculating the standard error of variance, which will allow
these comparisons to be made. With this approach we can
confidently conclude that the variation in mutation levels
in human pedigrees is greater than that observed in mouse
pedigrees transmitting mtDNA heteroplasmy.
Material and Methods
Experimental DataData for mutation level variance measurements, including values
for the mutation level variance, the mean mutation level, and
the number of measurements (n), in mouse models were gathered
from the published literature.9,10,12 The same data for a data set of
human primary oocytes was taken from Brown et al.13 Data for
mutation levels in human mother and offspring pairs for various
inherited pathogenic mtDNA mutations were gathered from the
literature.14–36 Probands were excluded from that analysis to mini-
mize ascertainment bias, although it must be kept in mind that
this cannot completely remove ascertainment bias.
Definition of the Standard Error of VarianceTo provide context for the equations for the standard error of vari-
ance, we begin with the well-known standard error of the mean.
By using a traditional parametric statistical approach, the mean
value of a quantity based on n samples from a population has a
standard error defined by the well-known equation
SE�p0� ¼ ffiffiffiffiffiffiffiffiffiffi
s2=np
(1)
where p0 is the mean value (mean percentage level of mutant
mtDNA in our case) and s2 is the variance of the population
that is being sampled. Because the actual variance of the popula-
tion is not known, nor can it be easily determined, the practical
approach is to estimate the population variance s2 by measuring
the sample varianceV in a randomly selected subgroup of the pop-
ulation. To assign error bars to the measurement of the mean
value, one generally follows the practice of setting the error bars
to be 2 3 SE(p0). This practice arose from the fact that 1.96 3 SE
is equal to the 95% confidence intervals for a sample froma normal
(Gaussian) distribution. We discuss this practice, and its applica-
tion to distributions other than the normal distribution, later in
this paper.
The corresponding equation for the standard error of the vari-
ance based on n samples37 is less familiar. It is
SE�s2� ¼
ffiffiffiffiffiffiffiffiffiffiffiffiffiffiffiffiffiffiffiffiffiffiffiffiffiffiffiffiffiffiffiffiffiffiffiffiffiffiffiffiffiffiffiffiffi1
n
D4 �
n� 3
n� 1
s4
s(2)
where D4 is the fourth central moment of the population.
Monte-Carlo Simulation Tests of the StatisticsTo test the calculation of the standard error of the variance
measurement, we randomly generated a series of independent
sets of n values from a chosen probability distribution with a pre-
determinedmean and variance. This was done for different sample
sizes n, ranging from 3 to 100, in order to determine how rapidly
estimates of the mean and variance improved as the sample size
is increased. By ‘‘independent’’ we mean that a completely new
set of values was generated for each value of n. This process was
repeated 10,000 times for each sample size allowing the 95% confi-
dence intervals for the mean and variance to be measured as a
function of the sample size n. This process was carried out for
a normal probability distribution and for a Kimura probability
distribution.38
The Levene Test of Paired Simulated Mutation Level
Data Sets with Different VariancesWe carried out a Levene test on random simulated data to deter-
mine the effect of sample size on the comparison of two data
sets with different variances. Sample sizes were varied from 3 to
100 and the samples were independently generated for each
sample size from a probability distribution. Pairs of data sets
were drawn randomly from a Kimura probability distribution
with the same mean mutation level but with different variance
values, ranging from 10-fold difference down to equal variances.
Although the Levene test is itself complicated, it has the advantage
over the standard error of variance that it does not require
the calculation of a fourth-order moment or the assumption of
a specific underlying probability distribution. The Levene test
has several variations, of which the most commonly used is the
Brown-Forsyth test,39 and it is not generally clear which form of
the test is the best choice. We evaluated both the standard Levene
test and the Brown-Forsyth variation and found that the standard
Levene test had a better performance (fewer false negative results)
than did the Brown-Forsyth test on our Monte-Carlo simulated
data sets.
Results
The definition of the standard error of the variance was
given as Equation 2 in the Materials and Methods section.
This standard error can be used to calculate error bars for
a measurement of variance in the same way that the stan-
dard error of the mean is used to determine the error bar of
a measurement of the mean. The standard error of the
variance is a function of the sample size n, the population
variance s2, and the fourth central moment D4 of the pop-
ulation. In the following, we define three different
methods of estimating the standard error of variance,
based on three different methods of estimating the fourth
central moment.
Model-Free Method of Calculating the Variance Error
The fourth central moment, D4, is not a trivial calculation
and this probably accounts for the lack of use of the stan-
dard error in a variance measurement. But D4 can be calcu-
lated in several ways. Most basically, D4 can be estimated
directly from the n sample measurements. An unbiased
estimator for the fourth central moment40 of the under-
lying probability distribution is given by
D4 ¼ ðn� 1Þn3
��n2 � 3nþ 3
�m4 þ 3ð2n� 3Þm2
2
�(3)
The American Journal of Human Genetics 86, 540–550, April 9, 2010 541
47

where m2 and m4 are defined by
mj ¼1
n
Xni¼1
�pi � p0
�j: (4)
With Equations 2–4, the standard error of the variance
can be estimated from the data and, as we show in the
following sections, the general practice of defining the
error bars of the measured variance to be twice the stan-
dard error may be followed.
The Normal Distribution Model
The value given by Equation 3 for D4 is only an estimate of
the fourth-order central moment based on a sample of size
n. If we are willing to assume that the values of mutation
level in the population follow a particular probability
distribution, we can use the exact equation for the fourth-
order central moment of that distribution. For a normal
distribution, the mathematics are particularly simple. The
fourth central moment of a normal distribution is simply
D4,Normal ¼ 3s4: (5)
Substituting this formula forD4 into Equation 2 gives the
standard error of variance of a sample of n data points
taken from a normal distribution.
SE�s2�Normal
¼ s2
ffiffiffiffiffiffiffiffiffiffiffiffi2
n� 1
r(6)
Assuming a normal distribution model has the advantage
of greatly simplifying the calculations.
A Monte-Carlo test of the mean and variance values of
data sets of size n drawn from a normal distribution was
carried out as described in the Materials and Methods.
Figure 1A shows the probability distribution from which
the simulated data were chosen, with a mean value of 0.5
and a variance of 0.01. Figure 1B shows the estimates of
the mean value as a function of the sample size n, with
error bars set to twice the standard error of the mean value
(Equation 1). Note how the error bars for the mean values
correspond well with the calculated 95% confidence inter-
vals, as expected for a normal distribution. Also note how
the variability in the measured mean value corresponds
well with the error bars.
These results for the estimates of the mean value and its
sample error are well known, and we present them here
only to provide context for the corresponding calculation
of the sampling error in the estimate of the variance
(Figure 1C). As was the case with the mean, setting the
error bars of the variance to twice the calculated standard
error in the variance is in good agreement with the 95%
confidence intervals in the variance measure. The 95%
confidence intervals were wide for a variance based on
a sample of 20 measurements, especially in comparison
to the corresponding confidence interval for the mean
value. From Equation 6, when n ¼ 20 the standard error
of the variance is equal to 32% of the variance, meaning
that the variance error bars are equal to 64% of the variance
values. For a normal distribution, these calculations of the
relative size of the variance error bars do not depend on
any other parameters, such as mean and variance. In the
normal distribution model, a sample of 20 measurements
will always have a sampling error of 64% in the estimated
variance. As can be seen from Figure 1C, this sampling
error increases dramatically as the number of measure-
ments decreases below 20. This raises concerns for studies
based on variance values based on 20 individual measure-
ments or less.
Kimura Distribution Model
The results given above are general and can be applied
to the standard error of the variance of any measured
quantity with a normal distribution. Now we specialize to
results applicable specifically to mtDNA heteroplasmy.
There are two basic features of the normal distribution
that make it a poor choice to represent the distribution of
Figure 1. Measurements of the Mean and Variance fromSamples Drawn from a Normal Distribution(A) The normal distribution used with mean ¼ 0.5 andvariance ¼ 0.01.(B) Mean values as a function of the sample size n ranging from3 to 100. The error bars were set to twice the standard error ofthe mean as calculated from Equation 1.(C) Values of variance as a function of the sample size n. The errorbars were set to twice the standard error of the variance fora normal distribution as calculated from Equation 6. The 95%confidence intervals were determined from themean and variancevalues from 10,000 samples of size n.
542 The American Journal of Human Genetics 86, 540–550, April 9, 2010
48

mtDNA mutation level values. First, the normal distribu-
tion is defined over the range of minus infinity to plus
infinity, whereas mutation level values must be only in
the range of zero to one. Second, the normal distribution
is always symmetric, whereasmtDNAmutation level distri-
butions can be either symmetric or skewed. For a good
example of a skewed distribution of mtDNA mutation
level values, see Brown et al.13 Although the normal distri-
bution canbe used as an approximation for the distribution
of mtDNA mutation level values, this approximation is
good only for distributions with mean values near 0.5 and
with very few measurements near either extreme of 0 or 1.
Recently, we defined a probability distribution based on
the population genetics theory of Kimura,41 which can
be applied to mtDNA mutation level values.38 Kimura’s
theory of random genetic drift defines the following three
equations.
f ð0Þ ¼ �1� p0�þXN
i¼1
ð2iþ 1Þp0�1� p0
�ð�1Þi
� F�1� i,iþ 2,2,1� p0
�biðiþ1Þ=2
(7)
fðpÞ ¼XNi¼1
iðiþ 1Þð2iþ 1Þp0�1� p0
�Fð1� i,iþ 2,2,pÞ
� F�1� i,iþ 2,2,p0
�biðiþ1Þ=2
(8)
f ð1Þ ¼ p0 þXNi¼1
ð2iþ 1Þp0�1� p0
�ð�1Þi
� F�1� i,iþ 2,2,p0
�biðiþ1Þ=2
(9)
The probability of fixing on the wild-type mtDNA is f(0),
the probability of fixing on the mutant is f(1), and the
probability distribution for a mutation level value of p is
f(p). The function F(a,b,c,d) is the hypergeometric func-
tion. We refer to these three equations collectively as the
‘‘Kimura distribution.’’ Despite its complexity, the Kimura
distribution is only a two-parameter model, with parame-
ters p0 and b. Both parameters range from 0 to 1. The
parameter p0 is the meanmutation level and the parameter
b is related to the effective population size and can be
referred to as the bottleneck parameter. The effective
population size should not be confused with the actual
mtDNA copy number42 and should be interpreted only
as a statistical parameter that determines the variance.
For further details and comparisons of the Kimura distribu-
tion to mtDNAmutation level data, please see Wonnapinij
et al.38 The variance of the Kimura distribution is
s2 ¼ p0�1� p0
�ð1� bÞ: (10)
This variance is equal to the variance equation defined
by Sewell-Wright43,44 and was first used in mitochondrial
genetics by Solignac et al.45
The Kimura distribution has the advantages that it is
based solidly on population genetics theory and that it
does describe well the existing data on mtDNA mutation
level distributions.38 However, one pays the price for this
in its obvious mathematical complexity. For our purposes
here, to define the standard error of mtDNAmutation level
variance measurements, we need to know only the fourth-
order central moment of this distribution. After a signifi-
cant amount of algebra, this quantity can be calculated
as the following.
D4,Kimura ¼ s2
p0 � 1
2
2�3�1� b� b2
�þ b3 þ b4 þ b5�
þ 1
4
1�
�bþ b2 þ b3 þ b4 þ b5
�5
!!
(11)
Unlike the case of the normal distribution, there is no
simplification that occurs when the D4,Kimura is substituted
back into the basic definition of the standard error of
the variance, Equation 2. Equations 11 and 2 together
define the standard error of the variance in the case that
the population that is being sampled follows a Kimura
distribution.
As a test of the calculation of the standard error of vari-
ance, we carried out a Monte-Carlo test as described in
the Materials and Methods. We did this for two cases: a
Kimura distribution with p0 ¼ 0.5 (Figure 2), which is
similar to a normal distribution, and a Kimura distribution
with p0 ¼ 0.1 (Figure 3) for which a normal distribution is
a poor model. The variance error bars are set to be twice
the standard error of the variance, calculated now from
Equations 11 and 2. In both examples (Figures 2 and 3),
the size of the error bars on both the mean mutation
level and the variance corresponded well with the scatter
between the independent samples and with the 95% confi-
dence intervals. This validates the use of 2 3 SE(V) as the
variance error bars, even with the Kimura distribution.
As with the normal distribution results, it is concerning
how wide the variance measurement error bars and the
95% confidence intervals are in Figures 2 and 3 for rela-
tively common sample sizes, such as n ¼ 20. With the
complexity of the Kimura distribution mathematics, the
standard error of the variance is not a simple proportion
of the variance depending just on the sample size n, as it
was in the simpler normal distribution case. Instead, the
standard error of the variance depends also on the mean
mutation level p0 and on the bottleneck parameter b. By
comparing Figures 2C and 3C, one can see that the vari-
ance error (as a proportion of the variance) for the same
sample size is larger for extreme values of mean mutation
level (p0 ¼ 0.1 in Figure 3) than for moderate mean values
(p0 ¼ 0.5 in Figure 2). As a concrete example, consider
a sample size of n ¼ 20 with a mean mutation level of
p0 ¼ 0.5 (Figure 2C). In this case, 2 3 SE(V) is 58% of the
variance, in close agreement with the estimate of 64%
calculated above for a sample size of 20 assuming a normal
distribution. Compare this to the same sample size but
with p0 ¼ 0.1 (Figure 3C). In this case, 2 3 SE(V) is 86%
The American Journal of Human Genetics 86, 540–550, April 9, 2010 543
49

of the variance. This will be discussed in more detail later
in the paper.
The Standard Error of Variance Shows that There Is
a Difference in mtDNA Mutation Level Inheritance
between Humans and Mice
The use of the synthetic or simulated data sets in Figures
1–3 allowed us to do idealized tests of the calculation of
the standard error of the variance because of sampling
effects. However, the true usefulness of this sampling error
definition comes from its application to experimentally
acquired biological data. Before dealing with the experi-
mental data, though, we must consider an important
confounding factor in comparing mtDNA mutation level
variances from samples with different mean mutation
level values. As the classic Sewell-Wright variance equation
(Equation 10) shows, the mutation level variance is a
function of the mean mutation level, because it is propor-
tional to p0(1 � p0). This causes variance to decrease as p0approaches the extreme values of 0 and 1. In order to
correct for this p0 dependence and allow us to compare
measured variance values from samples with different
mean mutation levels, it is necessary to normalize the vari-
ance measurements by dividing them by p0(1 � p0). The
standard error of the variance is then also normalized by
dividing it by p0(1 � p0).
We applied the standard error of variance to the mtDNA
mutation level variance data from Jenuth et al.,12 who
measured mutation level values from cells sampled from
various stages of development of the female germline
in a mouse model and the subsequent offspring. Only
summary statistics were reported and the full data sets of
the mutation level measurement in each cell were not
Figure 2. Measurements of the Mean and Variance fromSamples Drawn from a Kimura Distribution with ModerateMean Value(A) The Kimura distribution f(p) used with mean p0 ¼ 0.5 andb ¼ 0.9.(B) Mean values as a function of the sample size n ranging from 3to 100. The error bars were set to twice the standard error of themean as calculated from Equation 1.(C) Values of variance as a function of the sample size n. The errorbars were set to twice the standard error of the variance for aKimura distribution as calculated from Equations 11 and 2. The95% confidence intervals were determined from the mean andvariance values from 10,000 independent samples of size n.
Figure 3. Measurements of the Mean and Variance fromSamples Drawn from a Kimura Distribution with an ExtremeMean Value(A) The Kimura distribution f(p) used with mean p0 ¼ 0.1 andb ¼ 0.9.(B) Mean values as a function of the sample size n ranging from 3to 100. The error bars were set to twice the standard error of themean as calculated from Equation 1.(C) Values of variance as a function of the sample size n. The errorbars were set to twice the standard error of the variance for aKimura distribution as calculated from Equations 11 and 2. The95% confidence intervals were determined from the mean andvariance values from 10,000 samples of size n.
544 The American Journal of Human Genetics 86, 540–550, April 9, 2010
50

given, so the ‘‘model-free’’ method of Equation 3 cannot be
used. Instead, we must choose a model for the underlying
cell population, and for the reasons given above we chose
the Kimura model for this analysis. Usefully, Jenuth et al.
reported several repeated independent measurements
from each development stage, so we can compare the
calculated error bars of the variance to the observed varia-
tion in these values across the repeated experiments. The
normalized mutation level variance values together with
our calculations of the variance error bars are plotted in
Figure 4A. The size of the normalized variance error bars
corresponds well with the scatter in the measured values
within each development stage. Of particular interest are
two high normalized variance values reported in the
mature oocytes. Based on just the reported variance values
(without the error bars), it might be reasonable to conclude
that the variance could be fundamentally different in these
two samples compared to the other three mature oocyte
samples that all had low normalized variances. However,
the addition of the variance error bars changes the inter-
pretation of the data. The calculated error bars for the vari-
ance in these two samples is very large, and they overlap
the error bars for the other three mature oocyte samples.
With the variance error bars, the most parsimonious inter-
pretation of the data is that all the normalized variances
reported in the mature oocyte data are consistent with
each other, with a mean value close to the primary oocyte
value. Similarly, though less dramatic, the large scatter in
the mutation level variance values reported for the
offspring are also shown to be consistent with each other
once the sampling error bars are added to the variance
values. Finally, the addition of the error bars allows us to
interpret the changes in variance between these four stages
of development. The increase in variance between the
primordial germ cell stage (PGC) and the primary oocyte
stage is clear, but no change in the mutation level variance
is supported by this data in the comparison of the primary
and mature oocytes. Finally, when the error bars are taken
Figure 4. Application of the Standard Error ofVariance to Data from Human and Mouse Models(A) Heteroplasmic mouse model data from Jenuthet al.12 (circles) at four stages of mtDNA inheritance:primordial germ cells (PGC), primary oocytes,mature oocytes, and offspring. Human data (stars)from Brown et al.13 for primary oocytes and fromnumerous sources14–36 for offspring data are com-pared to the mouse data.(B) mtDNA mutation level variance with error barsmeasured in 21 mouse lineages. All error bars aretwice the standard error calculated from a Kimuradistribution. Variance values are normalized bydividing by p0(1 � p0).
into account, one cannot state a firm conclu-
sion about the apparent difference in the
mutation level variance between the mature
oocyte and offspring. The large error bars in
the variance measurements in both of these
stages show that the mean variance values in the mouse
mature oocytes and the offspring are not significantly
different in this experiment.
There is currently only one human data set that is large
enough for a reasonable analysis of mtDNAmutation level
variance in the female germline cells. Brown et al.13
reported measurements of mtDNA mutation level in 82
primary oocytes from a woman carrying the m.3243A>G
mutation (MIM *590050.0001) who underwent a hysterec-
tomy. We calculated the error bars of the variance for this
human oocyte data set and compared it to the mouse
primary oocyte data in Figure 4A. The addition of the error
bars to the variance measurements supports the conclu-
sion that the mutation level variance in the human
oocytes is clearly larger than the variance in the mouse
data at the same development stage.
Given that variance is closely linked to the mean muta-
tion level (Equation 10) and that a large number of obser-
vations are needed to measure variance, a reliable estimate
of the variance can be obtained only from a mother with
many offspring or by combining the offspring from
mothers with similar mean mutation levels. Published
data on mutation levels in mothers and offspring were
gathered as described in the Materials and Methods. In
order to minimize the differences in variance expected
from the Sewell-Wright variance formula (Equation 10),
we chose to combine data from mothers with mtDNA
mutation levels in the range of 40%–60%, where the differ-
ences in the mean mutation level have the least impact on
the variance. Data from mothers carrying the A3243G
mutation were excluded from this analysis to avoid the
potential confounding effects of age on the mutation level
measured in blood in this particular mutation.46 With this
approach, we identified 72 human mother-offspring pairs
from the published literature.14–36 The normalized muta-
tion level variance calculated from these data was signifi-
cantly higher in the human offspring than it was in the
mouse model (Figure 4A), when the variance error bars
The American Journal of Human Genetics 86, 540–550, April 9, 2010 545
51

are taken into consideration. At both stages of develop-
ment, primary oocytes and offspring, the human normal-
ized variances are approximately three times larger than
the corresponding normalized variance in the mouse
model. This is an important point to consider when inter-
preting the results from any experiment with a mouse
model of mtDNA heteroplasmy.
In the recent paper by Cree et al.,9 mutation level vari-
ance values in 21 lineages of heteroplasmic mice were
reported in the Supplemental Data. Without variance error
bars and the proper normalization of the variance, it is
difficult to interpret the scatter of the data in Table S1 of
Cree et al. In Figure 4B we show our calculated error bars
for these normalized data, again based on a Kimura distri-
bution. The error bars show that the normalized variance
measurements that are large also have large errors, so
that all 21 mouse lineages actually have reasonably consis-
tent normalized variance values.
The development of mtDNA mutation level variance in
the female germline of a mouse model was also the subject
of a recent paper by Wai et al.10 In that paper, variance
measurements in samples from the female germline were
reported over 44 days after birth. Based on these variance
measurements, taken from samples with differing mean
mutation levels and without correcting for this confound-
ing factor through normalizing the variances, Wai et al.
concluded that there was a strong increase in variance
in the female germline cells during this postnatal period.
They reported statistically significant differences between
the variances measured on postnatal day 11 and later
compared to the variances measured at postnatal day 8
and earlier. However, within those two periods only the
comparison of day 11 to day 29 was statistically significant.
In Figure 5 we plot the variance data fromWai et al.10 with
the variance normalization and we calculate the standard
error of the normalized variance values via the Kimura
model. When the error bars and the variance normaliza-
tion are both taken into consideration, it is hard to defend
the conclusion that mtDNA mutation level variance
increases significantly during postnatal oocyte develop-
ment in this experiment. Such an increase could be occur-
ring, but the variance error bars are so large that any such
increase in the variance would be hidden by the random
noise in the data resulting from sampling effects. Only
the earliest data, at postnatal day 4, are clearly different
from the later normalized variance values, once the vari-
ance error bars are considered. The variance normalization
has shifted the important difference in the measured
variances back to the earliest measurements at postnatal
day 4. Considering the importance of the day 4 variance
measurements, it is striking that the extremely low
normalized mutation level variance values at postnatal
day 4 are far lower than the corresponding values from
Jenuth et al.12 (Figure 4A), an apparent inconsistency
between the two mouse reports.
In contrast to the mouse model, we currently have very
little data on the development of mtDNA mutation level
variance at different stages of the human female germline.
In Figure 4A, we plot normalized variance values for a
single human primary oocyte data set and for a group of
human offspring. There is a clear difference in the normal-
ized variance values between these two stages of develop-
ment; however, this difference should be interpreted
with caution. The human primary oocyte data were from
a single person who carried the A3243G mutation, while
that specific mutation was removed from the offspring
data set because of the observed decline in the mutation
level of the A3243G mutation with age in blood samples.
It is possible that the differences in variance in the human
data in Figure 4A may be due to the different pathogenic
mutations instead of the different stages of development.
This question about the human data can be answered
only by having more data on the variance of other patho-
genic mtDNA mutations at the primary oocyte stage.
Statistical Tests for the Comparison of Variance
Measurements
The calculation of the standard error of variance is a useful
tool for the comparison of measurements of variance
values; however, when the full data sets are available it is
possible to test for the homogeneity of the variance in
different samples via the Levene test,39 as was done by
Wai et al.10We carried out a Levene test of paired simulated
data sets drawn from Kimura distributions with the same
mean value and different variances, as described in the
Materials and Methods. The results are shown in Figure 6
for paired Kimura distributions with a mean mutation
level of 0.5. Large variance differences (Figures 6A and 6B)
are easily distinguished with significant p values even for
small sample sizes. However, moderate variance differ-
ences, on the order of 2-fold or less (Figure 6C), can be
reliably distinguished only with relatively large samples,
and even then there is a high rate of false negative results.
Figure 5. mtDNA Mutation Level Variance with Error Bars ina Mouse Model of the Postnatal Development of OocytesThe data are taken fromWai et al.10 and all error bars are twice thestandard error of variance calculated from a Kimura model. Vari-ance values are normalized by dividing by p0(1 � p0).
546 The American Journal of Human Genetics 86, 540–550, April 9, 2010
52

A variance difference of 1.5-fold (Figure 6D) could not be
reliably detected even with sample sizes of 100. The test
of equal variance samples (Figure 6E) shows approximately
5% false positives, as would be expected. As we showed
earlier (Figure 3), sample size effects on variance measure-
ments increase at both large and small mean mutation
levels. Figure 7 shows the p value calculations for compar-
isons of two samples with equal mean mutation level of
0.1. At this low level of mutation, which is not an unusual
value in the mouse model data, even 2-fold differences in
variance cannot reliably be distinguished with sample sizes
of approximately n < 50. Even in the extreme case of
a 10-fold variance difference, several false negative results
occur (Figure 7A).
Using the Standard Error of Variance
for Experiment Design
The analysis we present here can be used to design experi-
ments with sufficient power to reliably detect changes in
mtDNAmutation level. If one chooses to assume a normal
distribution model, then this process is relatively simple
and Equation 6 can be used to determine the necessary
sample size n. However, the mathematical complications
of the Kimura model mean that its use in experimental
design is more difficult than the normal distribution,
though we would argue that it is also more accurate.
From Equation 11, the standard error of the variance in
the Kimura model will depend on the distribution param-
eter values p0 and b, as well as the sample size n. In Figure 8
we plot the standard error of the variance divided by the
variance for different values of p0 and n, assuming that
the value of b is set to 0.9, approximately the value deter-
mined from the analysis of the human oocyte data set.13
Figure 8A shows how the standard error of the variance
rises rapidly for small sample sizes (n below about 20).
Figure 8B shows that at extreme values of mutation level,
below about 0.1 and above about 0.9, the standard error
in the variance measurement is much greater. In between
these extreme values of p0, the standard error of variance
is relatively insensitive to different mutation level values.
In this intermediate p0 range, the normal distribution is
often a good approximation for the Kimura distribution,
and the values in Figure 8B correspond well with those
calculated from Equation 6 for the normal distribution.
Figure 6. Levene Test p Values for Comparisons of Two DataSets with Different Variances but Equal Mean Mutation Levelsof 0.5Both data sets were drawn randomly from a Kimura distribution.The distribution for the first data set was set to have b ¼ 0.9 whilethe value of b for the second distribution was lowered according toEquation 10 to give the stated variance difference. p values werecalculated with the standard Levene test. The horizontal line indi-cates a p value of 0.05.Differences in variance are as follows: (A) 10-fold; (B) 5-fold; (C)2-fold; (D) 50% increase; (E) equal variance.
Figure 7. Levene Test p Values for Comparisons of Two DataSets with Different Variances but Equal Mean Mutation Levelsof 0.1Other details are the same as in Figure 6.
The American Journal of Human Genetics 86, 540–550, April 9, 2010 547
53

However, the width of the horizontal region in Figure 8B
depends on the bottleneck parameter b. Lower values of
b will correspond to higher variances (as shown by Equa-
tion 10), making the normal distribution a poor approxi-
mation to the Kimura distribution.
A practical approach would be to calculate the required
sample size n via a general estimate based on the normal
distribution approximation of Equation 6. One then needs
to keep inmind that this will give a good prediction for the
standard error of the variance in data sets with moderate
mean mtDNA mutation levels (near 50%), but that data
sets with high or low values of mean mutation level will
have even higher relative standard errors of the variance,
as illustrated in Figure 8B. The normal distributionmethod
underestimates the standard error of variance for samples
with high (>90%) or low (<10%) mean mutation level, so
for calculating error bars for the measured variance, either
the model-free method (Equations 2–4) or the Kimura
model method (Equations 11 and 2) should be used.
Discussion
The calculation of mtDNA mutation level variance values
from quite small sample sizes has been an accepted prac-
tice, although some have had concerns about this practice.
We have addressed these concerns by developing the
equations for calculating the standard error of variance
measured from a sample of size n. We give three options
for doing this calculation. The model-free method uses
only the measured data and does not require any assump-
tion of the form of the probability distribution fromwhich
the data are sampled. However, the model-free method
does require the calculation of the fourth central moment
of the data, and high-order moments such as this are diffi-
cult to estimate from data. The simplest option is to
assume that the population follows a normal distribution,
and in that case the standard error of the variance is quite
Figure 8. Dependence of the Standard Error ofVariance Divided by the Variance on the MeanmtDNAMutation Level p0 and on the Sample Size n(A) Dependence on the sample size n for three valuesof the mean mutation level.(B) Dependence on the mean mutation level fora range of sample sizes. All standard error valuesare calculated for a Kimura distribution fromEquations 11 and 2. All curves were calculatedfrom Equations 11 and 2 with a value of b ¼ 0.9.That b value was chosen as a simple value that wasclose to the b value calculated from the one humanoocyte data set.13,38
simple to calculate. The difficulty with the
normal distribution is that it is a poor descrip-
tion of the mutation level distribution at the
high and low extremes and these are often
the ranges of great practical interest. To deal
with the details of the mtDNAmutation level distribution,
we have developed the Kimura distribution38 based on the
theory of neutral genetic drift.41 Although the Kimura
distribution is mathematically complicated, it is a reliable
description of measured mtDNA mutation level distribu-
tions38 and in this paper we have derived the standard
error of variance for mutation level values drawn from a
Kimura distribution.
Although the standard error of variance has not been
used in this field, the standard error of the mean is, of
course, common knowledge. We would argue that in
general, assumptions about the reasonable number of
samples to take in an experiment have been shaped by
our familiarity with the standard error of the mean. How-
ever, a number of samples n that are quite sufficient for
the accurate estimation of the mean value can be inade-
quate for the estimation of higher-order statistics, such as
the variance. Comparisons of the confidence intervals for
the mean values and for the variance values for both the
normal distribution (Figure 1) and the Kimura distribution
(Figures 2 and 3) illustrate this difference starkly. Although
the confidence intervals for the mean are quite reasonably
small for sample sizes of about 20, the corresponding confi-
dence intervals for the variance measurements are disturb-
ingly large at those samples sizes, making it extremely
difficult to reliably measure small changes in variance.
Because scientific conclusions are being made based on
comparisons of these measured variances, it is critical that
error bars for these variancemeasurements be reported and
that reliable statistical tests for comparisons of variance
measurements, such as the Levene test, should be used.
Based on our Monte-Carlo results (Figures 6 and 7), a
good rule of thumb for experimental design is that at
moderate mean mutation levels (50%), a 2-fold or greater
difference in normalized variance can be reliably detected
by >30 measurements, while for low (10%) or high
(90%)meanmutation levels, the number of measurements
should be increased to 50 or more.
548 The American Journal of Human Genetics 86, 540–550, April 9, 2010
54

The standard error of variance is a critical tool for assess-
ing the reliability of a variance measurement. With this
new capability, we have reinterpreted the experimental
data on the development of mtDNA mutation level vari-
ance in the female germline. In the mouse model, this
reassessment shows that there is no support for the conclu-
sion that the mutation level variance increases greatly
during postnatal development (Figures 4A and 5), contrary
to the previous interpretation of the data.10 The addition
of the standard error of variance also shows that there
is a clear difference between the mouse model and the
human data, with humans having a far larger mtDNA
mutation level variance thanmice in both primary oocytes
and offspring.
Acknowledgments
P.W. is supported by Thailand’s Commission on Higher Education,
Royal Thai Government under the program ‘‘Strategic Scholarship
for Frontier Research Network.’’ P.F.C. is a Wellcome Trust Senior
Fellow in Clinical Science who also receives funding from the
Medical Research Council (UK), the UK Parkinson’s Disease
Society, and the UK NIHR Biomedical Research Centre for Ageing
and Age-related disease award to the Newcastle upon Tyne Foun-
dation Hospitals NHS Trust.
Received: December 21, 2009
Revised: February 16, 2010
Accepted: February 23, 2010
Published online: April 1, 2010
References
1. Chinnery, P.F., Zwijnenburg, P.J.G., Walker, M., Howell, N.,
Taylor, R.W., Lightowlers, R.N., Bindoff, L., and Turnbull,
D.M. (1999). Nonrandom tissue distribution of mutant
mtDNA. Am. J. Med. Genet. 85, 498–501.
2. Frederiksen, A.L., Andersen, P.H., Kyvik, K.O., Jeppesen, T.D.,
Vissing, J., and Schwartz, M. (2006). Tissue specific distribu-
tion of the 3243A->G mtDNA mutation. J. Med. Genet. 43,
671–677.
3. Durham, S.E., Bonilla, E., Samuels, D.C., DiMauro, S., and
Chinnery, P.F. (2005). Mitochondrial DNA copy number
threshold in mtDNA depletion myopathy. Neurology 65,
453–455.
4. Shoubridge, E.A. (1994). Mitochondrial DNA diseases:
Histological and cellular studies. J. Bioenerg. Biomembr. 26,
301–310.
5. Chinnery, P.F., Thorburn, D.R., Samuels, D.C., White, S.L.,
Dahl, H.M., Turnbull, D.M., Lightowlers, R.N., and Howell,
N. (2000). The inheritance of mitochondrial DNA hetero-
plasmy: Random drift, selection or both? Trends Genet. 16,
500–505.
6. Bredenoord, A.L., Krumeich, A., De Vries, M.C., Dondorp, W.,
and De Wert, G. (2010). Reproductive decision-making in the
context of mitochondrial DNA disorders: Views and experi-
ences of professionals. Clin. Genet. 77, 10–17.
7. Thorburn, D.R., and Dahl, H.H.M. (2001). Mitochondrial
disorders: Genetics, counseling, prenatal diagnosis and repro-
ductive options. Am. J. Med. Genet. 106, 102–114.
8. Cao, L.Q., Shitara, H., Horii, T., Nagao, Y., Imai, H., Abe, K.,
Hara, T., Hayashi, J.I., and Yonekawa, H. (2007). The mito-
chondrial bottleneck occurs without reduction of mtDNA
content in female mouse germ cells. Nat. Genet. 39, 386–390.
9. Cree, L.M., Samuels, D.C., de Sousa Lopes, S.C., Rajasimha,
H.K.,Wonnapinij, P., Mann, J.R., Dahl, H.H.M., and Chinnery,
P.F. (2008). A reduction of mitochondrial DNA molecules
during embryogenesis explains the rapid segregation of geno-
types. Nat. Genet. 40, 249–254.
10. Wai, T., Teoli, D., and Shoubridge, E.A. (2008). The mitochon-
drial DNA genetic bottleneck results from replication of
a subpopulation of genomes. Nat. Genet. 40, 1484–1488.
11. Cao, L.Q., Shitara, H., Sugimoto, M., Hayashi, J.I., Abe, K., and
Yonekawa, H. (2009). New evidence confirms that the
mitochondrial bottleneck is generated without reduction of
mitochondrial DNA content in early primordial germ cells
of mice. PLoS Genet. 5, e1000756.
12. Jenuth, J.P., Peterson, A.C., Fu, K., and Shoubridge, E.A.
(1996). Random genetic drift in the female germline explains
the rapid segregation ofmammalianmitochondrial DNA. Nat.
Genet. 14, 146–151.
13. Brown, D.T., Samuels, D.C., Michael, E.M., Turnbull, D.M.,
and Chinnery, P.F. (2001). Random genetic drift determines
the level of mutant mtDNA in human primary oocytes. Am.
J. Hum. Genet. 68, 533–536.
14. Black, G.C.M., Morten, K., Laborde, A., and Poulton, J. (1996).
Leber’s hereditary optic neuropathy: Heteroplasmy is likely to
be significant in the expression of LHON in families with the
3460 ND1 mutation. Br. J. Ophthalmol. 80, 915–917.
15. Carelli, V., Ghelli, A., Ratta, M., Bacchilega, E., Sangiorgi, S.,
Mancini, R., Leuzzi, V., Cortelli, P., Montagna, P., Lugaresi,
E., and Degli Esposti, M. (1997). Leber’s hereditary optic
neuropathy: biochemical effect of 11778/ND4 and 3460/
ND1mutations and correlation with the mitochondrial geno-
type. Neurology 48, 1623–1632.
16. Enns, G.M., Bai, R.K., Beck, A.E., and Wong, L.J. (2006).
Molecular-clinical correlations in a family with variable tissue
mitochondrial DNAT8993Gmutant load. Mol. Genet. Metab.
88, 364–371.
17. Hammans, S.R., Sweeney, M.G., Brockington, M., Lennox,
G.G., Lawton, N.F., Kennedy, C.R., Morgan-Hughes, J.A., and
Harding, A.E. (1993). The mitochondrial DNA transfer RNA
(Lys)A—>G(8344) mutation and the syndrome of myoclonic
epilepsy with ragged red fibres (MERRF). Relationship of clin-
ical phenotype to proportion of mutant mitochondrial DNA.
Brain 116, 617–632.
18. Harding,A.E., Sweeney,M.G.,Govan,G.G., andRiordan-Eva,P.
(1995). Pedigree analysis in Leber hereditary optic neuropathy
families with a pathogenic mtDNA mutation. Am. J. Hum.
Genet. 57, 77–86.
19. Houstek, J., Klement, P., Hermanska, J., Houstkova, H., Hansı-
kova, H., Van den Bogert, C., and Zeman, J. (1995). Altered
properties of mitochondrial ATP-synthase in patients with
a T—>Gmutation in the ATPase 6 (subunit a) gene at position
8993 of mtDNA. Biochim. Biophys. Acta 1271, 349–357.
20. Howell, N., Xu, M., Halvorson, S., Bodis-Wollner, I., and
Sherman, J. (1994). A heteroplasmic LHON family: Tissue
distribution and transmission of the 11778 mutation. Am.
J. Hum. Genet. 55, 203–206.
21. Hurvitz, H., Naveh, Y., Shoseyov, D., Klar, A., Shaag, A., and
Elpeleg, O. (2002). Transmission of the mitochondrial t8993c
mutation in a new family. Am. J. Med. Genet. 111, 446–447.
The American Journal of Human Genetics 86, 540–550, April 9, 2010 549
55

22. Kaplanova, V., Zeman, J., Hansıkova,H., Cerna, L., Houst’kova,
H., Misovicova, N., andHoustek, J. (2004). Segregation pattern
and biochemical effect of the G3460AmtDNAmutation in 27
members of LHON family. J. Neurol. Sci. 223, 149–155.
23. Larsson, N.G., Tulinius, M.H., Holme, E., Oldfors, A., Ander-
sen, O., Wahlstrom, J., and Aasly, J. (1992). Segregation and
manifestations of the mtDNA tRNA(Lys) A—>G(8344) muta-
tion of myoclonus epilepsy and ragged-red fibers (MERRF)
syndrome. Am. J. Hum. Genet. 51, 1201–1212.
24. Lott, M.T., Voljavec, A.S., and Wallace, D.C. (1990). Variable
genotype of Leber’s hereditary optic neuropathy patients.
Am. J. Ophthalmol. 109, 625–631.
25. Mak, S.C., Chi, C.S., Liu, C.Y., Pang, C.Y., andWei, Y.H. (1996).
Leigh syndrome associated with mitochondrial DNA 8993
T—>G mutation and ragged-red fibers. Pediatr. Neurol. 15,
72–75.
26. Makela-Bengs, P., Suomalainen, A., Majander, A., Rapola, J.,
Kalimo, H., Nuutila, A., and Pihko, H. (1995). Correlation
between the clinical symptoms and the proportion of mito-
chondrial DNA carrying the 8993 point mutation in the
NARP syndrome. Pediatr. Res. 37, 634–639.
27. Phasukkijwatana, N., Chuenkongkaew, W.L., Suphavilai, R.,
Luangtrakool, K., Kunhapan, B., and Lertrit, P. (2006). Trans-
mission of heteroplasmic G11778A in extensive pedigrees of
Thai Leber hereditary optic neuropathy. J. Hum. Genet. 51,
1110–1117.
28. Piccolo, G., Focher, F., Verri, A., Spadari, S., Banfi, P., Gerosa, E.,
and Mazzarello, P. (1993). Myoclonus epilepsy and ragged-red
fibers: Blood mitochondrial DNA heteroplasmy in affected
and asymptomatic members of a family. Acta Neurol. Scand.
88, 406–409.
29. Porto, F.B.O., Mack, G., Sterboul, M.J., Lewin, P., Flament, J.,
Sahel, J., and Dollfus, H. (2001). Isolated late-onset cone-rod
dystrophy revealing a familial neurogenic muscle weakness,
ataxia, and retinitis pigmentosa syndrome with the T8993G
mitochondrial mutation. Am. J. Ophthalmol. 132, 935–937.
30. Santorelli, F.M., Shanske, S., Jain, K.D., Tick, D., Schon, E.A.,
and DiMauro, S. (1994). A T—>Cmutation at nt 8993 ofmito-
chondrial DNA in a child with Leigh syndrome. Neurology 44,
972–974.
31. Tanaka, A., Kiyosawa, M., Mashima, Y., and Tokoro, T. (1998).
A family with Leber’s hereditary optic neuropathy with mito-
chondrial DNA heteroplasmy related to disease expression.
J. Neuroophthalmol. 18, 81–83.
32. Tatuch, Y., Christodoulou, J., Feigenbaum, A., Clarke, J.T.R.,
Wherret, J., Smith, C., Rudd, N., Petrova-Benedict, R., and
Robinson, B.H. (1992). Heteroplasmic mtDNA mutation
(T----G) at 8993 can cause Leigh disease when the percentage
of abnormal mtDNA is high. Am. J. Hum. Genet. 50, 852–858.
33. Uziel, G., Moroni, I., Lamantea, E., Fratta, G.M., Ciceri, E.,
Carrara, F., and Zeviani, M. (1997). Mitochondrial disease
associated with the T8993G mutation of the mitochondrial
ATPase 6 gene: A clinical, biochemical, and molecular study
in six families. J. Neurol. Neurosurg. Psychiatry 63, 16–22.
34. White, S.L., Shanske, S., McGill, J.J., Mountain, H., Geraghty,
M.T., DiMauro, S., Dahl, H.H.M., and Thorburn, D.R. (1999).
Mitochondrial DNA mutations at nucleotide 8993 show
a lack of tissue- or age-related variation. J. Inherit. Metab.
Dis. 22, 899–914.
35. Wong, L.J.C., Wong, H., and Liu, A.Y. (2002). Intergenera-
tional transmission of pathogenic heteroplasmic mitochon-
drial DNA. Genet. Med. 4, 78–83.
36. Zhu, D.P., Economou, E.P., Antonarakis, S.E., and Maumenee,
I.H. (1992). Mitochondrial DNA mutation and heteroplasmy
in type I Leber hereditary optic neuropathy. Am. J. Med.
Genet. 42, 173–179.
37. Wilks, S.S. (1962). Mathematical Statistics (New York: Wiley).
38. Wonnapinij, P., Chinnery, P.F., and Samuels, D.C. (2008). The
distribution of mitochondrial DNA heteroplasmy due to
random genetic drift. Am. J. Hum. Genet. 83, 582–593.
39. Sheskin, D.J. (2007). Handbook of Parametric and Nonpara-
metric Statistical Procedures (Boca Raton, FL: Chapman &
Hall / CRC).
40. Dodge, Y., and Rousson, V. (1999). The complications of the
fourth central moment. Am. Stat. 53, 267–269.
41. Kimura, M. (1955). Solution of a process of random genetic
drift with a continuous model. Proc. Natl. Acad. Sci. USA 41,
144–150.
42. Charlesworth, B. (2009). Fundamental concepts in genetics:
Effective population size and patterns of molecular evolution
and variation. Nat. Rev. Genet. 10, 195–205.
43. Wright, S. (1942). Statistical genetics and evolution. Bull. Am.
Math. Soc. 48, 223–246.
44. Wright, S. (1990). Evolution in Mendelian populations
(reprinted from Genetics, vol 16, pg 97-159, 1931). Bull.
Math. Biol. 52, 241–295.
45. Solignac, M., Genermont, J., Monnerot, M., and Mounolou,
J.C. (1984). Genetics of mitochondria in Drosophila—mtDNA
inheritance in heteroplasmic strains of Drosophila-Mauritiana.
Mol. Gen. Genet. 197, 183–188.
46. Rajasimha, H.K., Chinnery, P.F., and Samuels, D.C. (2008).
Selection against pathogenic mtDNA mutations in a stem
cell population leads to the loss of the 3243A—>G mutation
in blood. Am. J. Hum. Genet. 82, 333–343.
550 The American Journal of Human Genetics 86, 540–550, April 9, 2010
56
5 Chapter 5: The Mother Carrying a High Pathogenic A3243G Mutation Level Tends to Have Fewer Daughters than Sons
Passorn Wonnapinij1,2, Patrick F. Chinnery 3, and David C Samuels 1
1. Center of Human Genetic Research, Deparment of Molecular Physiology and Biophysics, Vanderbilt University Medical Center, Nashville, TN, 37232, USA
2. Interdisciplinary Program in Genetics, Bioinformatics, and Computational Biology, Virginia Polytechnic Institute and State University, Blacksburg, VA, 24060, USA
3. Mitochondrial Research Group and Institute of Human Genetics, Newcastle University, The Medical School, Newcastle-upon-Tyne, NE2 4HH, UK
57

The mother carrying a high pathogenic A3243G mutation level tends to have fewer daughters than sons
Passorn Wonnapinij1,2, Patrick F. Chinnery3 & David C.Samuels1
1 Center of Human Genetics Research, Department of Molecular Physiology and
Biophysics, Vanderbilt University Medical Center, Nashville, TN, 37232, USA
2 Interdisciplinary Program in Genetics, Bioinformatics, and Computational Biology,
Virginia Polytechnic Institute and State University, Blacksburg, VA, 24060, USA
3 Mitochondrial Research Group and Institute of Human Genetics, Newcastle University,
The Medical School, Newcastle-upon-Tyne NE2 4HH, UK
The pathogenic A3243G mitochondrial DNA (mtDNA) mutation has been widely
observed to cause a variety of human diseases, including neurodegenerative
disorders affecting multi-systematic tissues such as MELAS1. The prevalence of this
mutation is approximately 1 in 1000 of the population, thereby this mutation is
relatively common in the general population2. Typically, an individual, both
symptomatic and asymptomatic individuals, carries this mutation in a
heteroplasmic condition, a mixture of wild type and mutant mtDNA. In this study,
we show that the intergenerational increase of mtDNA mutation level is partially the
result of no correction for a reduction of blood mtDNA mutation level toward age.
We also observed that the transmission of mtDNA mutation level from the mother
carrying a high proportion of this mutation is subjected to purifying selection.
Importantly, we observed that the mother who carries a high mutation level tends to
have more sons than daughters, implying that there is a selection bias against female
offspring, naturally preventing transmission of this harmful mtDNA to the next
generation.
58

Until recently, no effective way to treat patients with a mtDNA mutation causing
disease has been successfully developed, therefore preventing the transmission of
mtDNA mutation has become an important strategy. In general, mothers carrying
pathogenic mtDNA mutations transmits a random proportion of mutant mtDNA to their
offspring, generating a large random shift in mutation levels between generations3. In the
case of A3243G mutation, the studies of single generation transmission of mtDNA
mutation level, based on blood measurements, showed that the transmission of this
mutation is in favour of mutant mtDNA3-4. However, an exponential reduction of blood
A3243G mutation level with age due to the selection against hematopoietic stem cells
could deceptively generate an increase of mutation level across generations5-8. The
mathematical formula for correcting the reduction of blood mutation level was provided
as shown in Equation 1.
page-corrected = pe0.02t (1)
Where p is the blood A3243G mutation level and t is the individual’s age when
his/her blood was sampled. We have studied the intergenerational transmission of this
mutation, both with and without an application of the age-correction to the individual’s
blood mutation level.
The comparison of average mutation level between generations shows that the
average blood mutation level consistently increases across generations, from the
grandparent’s (Nfemale = 13 and Nmale=5) to the most recent generation (Nfemale = 29 and
Nmale=28), although this pattern disappears after applying the age-correction formula both
in females and males, as shown in Figure 1(a) and (b), respectively. Therefore, we can
conclude that the application of the age-correction to the individual’s blood measurement
help to adjust the confounding effect of the reduction of blood mutation level with age
59

that generates the increase of the average mutation level across generations. However the
average grandmother’s age-corrected blood mtDNA mutation level remains to be
significantly different from the average mother’s age-corrected blood mtDNA mutation
level (Nmother = 58) with p-value of 0.022.
We also statistically analyzed the average value of the mutation level difference
between a mother and her offspring (the average O-M). The mother-offspring pairs in
this analysis, taken across all generations, were divided into two groups based on
maternal age-corrected blood mutation level: a group of mothers carrying a low mutation
level (maternal age-corrected mutation level 50%) and a group of mothers carrying a
high mutation level (maternal age-corrected mutation level > 50%). The average age-
corrected O-M in each mothers’ group has been statistically compared to zero to examine
whether the offspring’s mutation level is significantly different from the mother’s
mutation level. The result, as shown in Figure 1(c), shows that the average O-M of the
mothers carrying a low mutation level, both taken across all offspring and only from
either sons (Nmother-son pair = 26) or daughters (Nmother-daughter pair=35), presents a non-
significant difference from zero, suggesting that random drift is the mechanism regulating
transmission of this mutation in this mothers’ group. Conversely, the average O-M of the
mothers carrying a high mtDNA mutation level, both taken across all offspring and in
regard to offspring’s gender(Nmother-daughter pair= Nmother-son pair= 10), is a negative value with
significant difference from zero (p-value < 0.05), except for the barely missing p-value of
the average O-M taken from the daughters (p-value = 0.057). Hence the transmission of
the A3243G mutation of the mothers carrying a high proportion of this mutation is
subject to a negative selection, which could be expected for the transmission of the
harmful mtDNA mutation. The average O-M of the daughters does not significantly
differ from the average O-M of the sons, both in the group of mothers carrying a low
60

mutation level and the mothers carrying a high mutation level, indicating no gender bias
of the transmission of the A3243G mutation level.
The main analysis of this study is to examine the effect of this mutation on female
reproduction which would have an impact on the transmission of this common
pathogenic mtDNA mutation. To achieve this particular purpose, we analyze an average
number of daughters and sons of the female family members carrying this mutation. As
for the analysis of the average O-M, the females were separated into two groups based on
their age-corrected blood mutation level. The analysis has been applied only to the
females of the parent’s generation who are carriers in order to reduce the effect of
maternal lineage extinction, a reduction of the proportion of female family members
across generations. In our analyzed pedigrees, the proportion of females decreases from
approximately 75% in the grandparent’s (Nfemale= 13, Nmale= 5) and the parent’s
generation (Nfemale = 58, Nmale= 19) to approximately 51% in the most recent generation
(Nfemale= 29, Nmale= 28).
There is no significant difference of the average number of daughters as well as
the average number of sons between the females carrying a low mutation level (Nfemale
carrier = 43) and the females carrying a high mutation level (Nfemale carrier=26), though the
average number of daughters of the females carrying a high proportion of this mutation
(0.42±0.27) is approximately half of that of the females carrying a low proportion of this
mutation (0.79±0.29), as shown in Figure 2(a).
In the females carrying a low mutation level, the average number of daughters
(0.79±0.29) does not significantly differ from the average number of sons (0.81±0.26),
supported by p-value of 0.90. On the other hand, the average number of daughters of the
females carrying a high mutation level (0.42±0.27) significantly differs from the average
number of sons (0.85±0.33) with the p-value of 0.031, as shown in Figure 2(a). This
61

result indicates that the females carrying a high proportion of this mutation tends to have
fewer daughters than sons which may be an alternative form of selection preventing
further transmission of this pathogenic mtDNA mutation.
We realized that the number of daughters and sons are not normally distributed
which violated an assumption of the two-sample paired t-test that was applied to test the
hypothesis of offspring gender bias. Therefore, we reanalyzed the comparison of the
number of daughters to the number of sons, both in the group of females carrying a low
and a high mutation level, using the two-sample paired sign test, a nonparametric
alternative approach of the two-sample paired t-test. The result supports our previous
conclusion in the sense that, in the group of females carrying a low mutation level, we are
more likely to observe an equal number of the females who have more sons to the
females who have more daughters supported by the p-value of 0.70, as shown in Figure
2(b). And, in the group of females carrying a high mutation level, we are less likely to
observe an equal number of the females who have more sons to the females who have
more daughters supported by the p-value of 0.021, as shown in Figure 2(c).
Even though, the small number of females in the parent’s generation carrying a
high proportion of this mutation is a source of concern, the significant p-value of the
comparison between the statistical value of the number of daughters and that of the
number of sons of the mothers carrying high mutation level indicates a strong effect of
this mutation on female reproduction.
One would think that the significant offspring gender bias of the females carrying
a high mutation level is possibly subjected to an ascertainment bias in which gender
preference of index cases drives the collection of analyzed pedigrees toward the family
carrying females who tend to have more offspring with the same gender as the index
case’s gender preference. We address this concern by comparing a number of male index
62

cases to a number of female index cases of the most recent generation. The comparison
result shows that the number of female index cases (Nfemale index case=11) is relatively equal
to the number of male index cases (Nmale index case=12), therefore, it is less likely that this
significant offspring gender bias is misleadingly generated by the index case’s gender
preference. In addition, the relative equal average number of daughters to the average
number of sons of the females carrying a low mutation level argues for the existence of
an offspring’s gender preference in the analyzed pedigrees.
The significant offspring gender bias in the females carrying a high mutation level
has an implication for the significant lower average grandmother’s mutation level. The
presence of the offspring gender bias reduces a probability of having a daughter in a
female carrying a high proportion of this mutation, thus the grandmother needs to carry a
low proportion of this mutation to avoid this effect. It is also possible that this effect
implies the frequent observation of small pedigrees carrying this mutation.
The offspring gender bias observed in females carrying a high mutation level may
suggest a higher frequency of miscarried female foetus than the miscarried male foetus.
This would be a clinical concern, although the clinical cause of this offspring gender bias
needs to be drawn from more clinical observations, especially the ones that related to
gender preference of a miscarried foetus. Therefore, even though we do not completely
understand what causes the female carrying high proportion of the A3243G mutation to
have more sons than daughters, our result would be of benefit to both genetic counseling
and epidemiological study of this common pathogenic mtDNA mutation.
Method Summary
Human clinical pedigrees of the family carrying a pathogenic A3243G mtDNA
mutation were collected from published literatures as described in an online method
63

section. The reference list of the resource data is also included in this section. The
individual’s mtDNA mutation level was measured from blood sample.
Only the mothers carrying mutant mtDNA and her offspring were included in the
analysis. Any individual whose age-corrected blood mtDNA mutation level exceeds
110% was excluded from the analysis. All index cases were excluded from the
transmission study, shown in Figure 1, to reduce the effect of ascertainment bias. The
study of the effect of this mutation on female reproduction, shown in Figure 2, was
restricted only to the mothers of the most recent generation in the pedigree and no female
index cases were excluded from this study. The data set used in this paper is presented in
Supplementary information.
The two-sample t test for unequal variance (heteroscedastic) was applied to
analyze significance of differences of the average mutation level between generations and
the comparison of the number of daughters and son between mothers carrying different
categories of mutation level. The two-sample paired t test was used for the average O-M
analysis and the comparison of the average number of daughters to the average number of
sons; the two-sample paired sign test was also applied as an alternative approach. The
Fisher’s exact test was used to examine index case’s gender preference. The detail of the
statistical analysis is presented in the online method. The significant result is stated when
the p-value is less that the critical p-value of 0.05.
64

References
1 Finsterer, J. Genetic, pathogenetic, and phenotypic implications of the mitochondrial A3243G tRNALeu(UUR) mutation. Acta Neurologica Scandinavica 116, 1-14, doi:10.1111/j1600-0404.2007.00836.x (2007).
2 Elliott, H. R., Samuels, D. C., Eden, J. A., Relton, C. L. & Chinnery, P. F. Pathogenic mitochondrial DNA mutations are common in the general population. American Journal of Human Genetics 83, 254-260, doi:10.1016/j.ajhg.2008.07.004 (2008).
3 Chinnery, P. F. et al. The inheritance of mitochondrial DNA heteroplasmy: random drift, selection or both? Trends in Genetics 16, 500-505 (2000).
4 Wong, L. J. C., Wong, H. & Liu, A. Y. Intergenerational transmission of pathogenic heteroplasmic mitochondrial DNA. Genetics in Medicine 4, 78-83 (2002).
5 tHart, L. M., Jansen, J. J., Lemkes, H., deKnijff, P. & Maassen, J. A. Heteroplasmy levels of a mitochondrial gene mutation associated with diabetes mellitus decrease in leucocyte DNA upon aging. Human Mutation 7, 193-197 (1996).
6 Rahman, S., Poulton, J., Marchington, D. & Suomalainen, A. Decrease of 3243 A -> G mtDNA mutation from blood in MELAS syndrome: A longitudinal study. American Journal of Human Genetics 68, 238-240 (2001).
7 Rajasimha, H. K., Chinnery, P. F. & Samuels, D. C. Selection against pathogenic mtDNA mutations in a stem cell population leads to the loss of the 3243A -> G mutation in blood. American Journal of Human Genetics 82, 333-343, doi:10.1016/j.ajhg.2007.10.007 (2008).
8 Pyle, A. et al. Depletion of mitochondrial DNA in leucocytes harbouring the 3243A -> G mtDNA mutation. Journal of Medical Genetics 44, 69-74, doi:10.1136/jmg.2006.043109 (2007).
Supplementary Information accompanies the paper on www.nature.com/nature.
ACKNOWLEDGEMENTS
P.W. is supported under the program “Strategic Scholarship for Frontier Research Network” by the
Thailand’s Commission of Higher Education, Royal Thai Government. P.F.C is a Welcome Trust Senior
Fellow in Clinical Research
AUTHOR CONTRIBUTIONS
This statistical study was designed by D.C.S., P.F.C. and P.W and carried out by P.W.
65

Correspondence and requests for materials should be addressed to D.C.S.
Figure 1 The intergenerational transmission of A3243G mutation level (a) The
average female mutation level per generation was compared across generations
from the grandparent’s to the most recent generation. The average mutation
level was calculated from both blood and age-corrected blood mutation level.
The p-value was calculated from the two-sample t test for unequal variance. (b)
The average male mutation level per generation was compared across
generations from the grandparent’s to the most recent generation. The average
mutation level was calculated from both blood and age-corrected blood mutation
level. The p-value was calculated from the two-sample t test for unequal
variance. (c) The average age-corrected blood O-M was compared to zero to
examine whether the offspring’s, daughter’s, and son’s age-corrected blood
mutation level is significantly different from the mother’s age-corrected blood
mutation level. The p-value was calculated from the two-sample paired t test.
Figure 2 The effect of A3243G mutation on female reproduction (a) The
comparison of the average number of daughters to the average number of sons
within the group of females carrying low mutation level (maternal age-corrected
mutation level 50%) and the group of females carrying high mutation level
(maternal age-corrected mutation level > 50%). The p-value was calculated from
the two-sample paired t test. (b) The distribution of the difference between the
number of sons and the number of daughters of the females carrying low
mutation level. The p-value was calculated from the two-sample paired sign test.
(c) The distribution of the difference between the number of sons and the number
66

of daughters of the females carrying high mutation level. The p-value was
calculated from the two-sample paired sign test.
Online Method
Data collection
Human pedigrees of the family carrying A3243G mtDNA mutation were
collected from published literatures 9-35. Each individual’s pedigree position, mtDNA
mutation level, age, and relationship with the index case were recorded. Only the number
of daughters and sons of the female family members were recorded. Only the
information of index cases and their maternal relatives are in the analyzed data. Each
individual’s mtDNA mutation level is the blood sample measurement. The age of each
individual is the age of the individual when his/her blood was sampled for measureing
mtDNA mutation level. Beside the first-degree relatives of the index case, the
relationship with the index case of other maternal relatives was recorded as relative. The
number of daughter live births and son live births were recorded. The number of
daughters and sons of a female family member who bears no child, except the most
recent generation females, were recorded as zero. The analyzed data is presented in the
Supplementary information with the reference number of the resource literature follows
the reference list in this section.
Data management
There are two main analyses in this study: the analysis of A3243G mutation level
inheritance and the analysis of the effect of this mutation on female reproduction.
Only the mothers carrying a fraction of mutant mtDNA and her offspring were
included in the study. The individual whose age-corrected blood mtDNA mutation level
exceeds 110% was excluded from the study. All index cases were excluded from the data
67

set that used for the analysis of the transmission of mtDNA mutation level shown in
Figure 1. This process was done to reduce the effect of an ascertainment bias in human
clinical data.
The reverse number of generation used in the comparison of the average mtDNA
mutation level between generations is the number of generation normalized by the
generation number of the most recent generation in the pedigree. Only mother and her
offspring whose age and blood mtDNA mutation level were recorded in the resource
literatures were included in the analysis of the average different mutation level between a
mother and her offspring (average O-M).
No female index case was excluded from the analysis of offspring gender bias of
this mutation. This analysis was restricted only to the mothers of the most recent
generation to eliminate the effect of maternal lineage extinction. Including other
generation mothers would only increase the statistical significance.
Statistical analysis
The statistically significant different of an average mutation level between
generations, the comparison of an average O-M of the daughters to an average O-M of
the sons, and the comparison of the average number of daughters and the average number
of sons of the females carrying high mutation level (female’s age-corrected mutation
level > 50%) to those of the females carrying low mutation level (female’s age-corrected
mutation level 50%) were examined by the two-sample student’s t test for unequal
variance (heteroscedastic).
The two-sample paired t test was applied to test whether the average O-M is
significantly different from zero for all offspring, only daughters and only sons. This
statistical test was also applied to examine the offspring gender bias of female
68

reproduction both in the group of females carrying low and high mtDNA mutation level.
Both types of the student’s t test were performed using a statistical function “ttest” in
Microsoft Excel (Microsoft software).
The two-sample paired sign test was applied to the comparison of the median of
the number of daughters to the median number of sons, both in the groups of females
carrying low and high mutation level. This statistical test is a nonparametric alternative
approach of the two-sample paired t test. This statistical test was performed in
OriginPro8 (OriginLab).
The comparison of the number of female index cases to the number of male index
cases was statistically tested by the Fisher’s exact test using a function “fisher.test” in R
(R foundation for statistical computing). The result is stated as “significant difference” if
and only if the p-value is less than the significance level at 0.05.
References
9 Campos, Y. et al. Clinical heterogeneity in 2 pedigrees with the 3243 bp tRNA(Leu(UUR)) mutation in mitochondrial DNA. Acta Neurologica Scandinavica 91, 62-65 (1995).
10 Cervin, C. et al. Cosegregation of MIDD and MODY in a pedigree - Functional and clinical consequences. Diabetes 53, 1894-1899 (2004).
11 Chinnery, P. F. et al. Nonrandom tissue distribution of mutant mtDNA. AmericanJournal of Medical Genetics 85, 498-501 (1999).
12 Chou, Y. J. et al. Prenatal diagnosis of a fetus harboring an intermediate load of the A3243G mtDNA mutation in a maternal carrier diagnosed with MELAS syndrome. Prenatal Diagnosis 24, 367-370, doi:10.1002/pd.876 (2004).
13 Ciafaloni, E. et al. MELAS - clinical features, biochemistry, and molecular genetics. Annals of Neurology 31, 391-398 (1992).
14 Dubeau, F., De Stefano, N., Zifkin, B. G., Arnold, D. L. & Shoubridge, E. A. Oxidative phosphorylation defect in the brains of carriers of the tRNA(leu(UUR)) A3243G mutation in a MELAS pedigree. Annals of Neurology 47, 179-185 (2000).
15 Fabrizi, G. M. et al. The A to G transition at nt 3243 of the mitochondrial tRNA(Leu)(UUR) may cause an MERRF syndrome. Journal of Neurology Neurosurgery and Psychiatry 61, 47-51 (1996).
69

16 Garcia-Velasco, A. et al. Intestinal pseudo-obstruction and urinary retention: cardinal features of a mitochondrial DNA-related disease. Journal of Internal Medicine 253, 381-385 (2003).
17 Hammans, S. R. et al. The mitochondrial DNA transfer RNA(Leu(UUR)) A>G(3243) mutation- A clinical and genetic study. Brain 118, 721-734 (1995).
18 Hotta, O. et al. Clinical and pathologic features of focal segmental glomerulosclerosis with mitochondrial tRNA(Leu(UUR)) gene mutation. KidneyInternational 59, 1236-1243 (2001).
19 Huang, C. C. et al. MELAS syndrome with mitochondrial tRNA(Leu(UUR)) gene mutation in Chinese family. Journal of Neurology Neurosurgery and Psychiatry 57, 586-589 (1994).
20 Huang, C. C., Chen, R. S., Chu, N. S., Pang, C. Y. & Wei, Y. H. Random mitotic segregation of mitochondrial DNA in MELAS syndrome. Acta Neurologica Scandinavica 93, 198-202 (1996).
21 Iwanishi, M. et al. Clinical and laboratory characteristics in the families with diabetes and mitochondrial tRNA(Leu(UUR)) gene mutation. Diabetes Research and Clinical Practice 29, 75-82 (1995).
22 Jansen, J. J. et al. Mutation in mitochondrial tRNA(Leu(UUR)) gene associated with progressive kidney disease. Journal of the American Society of Nephrology 8, 1118-1124 (1997).
23 Ko, C. H. et al. De novo mutation in the mitochondrial tRNA(Leu(UUR)) gene (A3243G) with rapid segregation resulting in MELAS in the offspring. Journal of Paediatrics and Child Health 37, 87-90 (2001).
24 Lien, L. M. et al. Involvement of nervous system in maternally inherited diabetes and deafness (MIDD) with the A3243G mutation of mitochondrial DNA. ActaNeurologica Scandinavica 103, 159-165 (2001).
25 Liou, C. W. et al. MELAS syndorme-Correlation between clinical features and molecular genetic analysis. Acta Neurologica Scandinavica 90, 354-359 (1994).
26 Lu, J. X. et al. Maternally transmitted diabetes mellitus associated with the mitochondrial tRNA(Leu(UUR)) A3243G mutation in a four-generation Han Chinese family. Biochemical and Biophysical Research Communications 348, 115-119, doi:10.1016/j.bbrc.2006.07.010 (2006).
27 Martinuzzi, A. et al. Correlation between clinical and molecular features in 2 MELAS families. Journal of the Neurological Sciences 113, 222-229 (1992).
28 Morovvati, S. et al. Phenotypes and mitochondrial DNA substitutions in families with A3243G mutation. Acta Neurologica Scandinavica 106, 104-108 (2002).
29 Ng, M. C. Y. et al. Mitochondrial DNA A3243G mutation in patients with early- or late-onset type 2 diabetes mellitus in Hong Kong Chinese. Clinical Endocrinology 52, 557-564 (2000).
30 Olsson, C. et al. Level of heteroplasmy for the mitochondrial mutation A3243G correlates with age at onset of diabetes and deafness. Human Mutation 12, 52-58 (1998).
31 Onishi, H. et al. Pancreatic exocrine dysfunction associated with mitochondrial tRNA(Leu(UUR)) mutation. Journal of Medical Genetics 35, 255-257 (1998).
32 Rusanen, H. et al. in 46th Annual Meeting of the American-Academy-of-Neurology. 1188-1192 (Little Brown Co).
70

33 Vilarinho, L. et al. The mitochondrial DNA A3243G mutation in Portugal: clinical and molecular studies in 5 families. Journal of the Neurological Sciences 163, 168-174 (1999).
34 Vilarinho, L. et al. The mitochondrial A3243G mutation presenting as severe cardiomyopathy. Journal of Medical Genetics 34, 607-609 (1997).
35 Wilichowski, E. et al. Pyruvate dehydrogenase complex deficiency and altered respiratory chain function in a patient with Kearns-Sayre/MELAS overlap syndrome and A3243G mtDNA mutation. Journal of the Neurological Sciences 157, 206-213 (1998).
71

Figure 1
72

Figure 2
73

Supp
lem
enta
ry In
form
atio
n
Ref
eren
ce
Gen
der
Rev
erse
R
elat
ions
hip
with
the
Inde
x N
umbe
r of
b
Num
ber
of
b
Blo
odM
utat
ion
Age
Age
-Cor
rect
ed B
lood
M
ater
nal B
lood
M
ater
nal
Mat
erna
l Age
-C
orre
cted
Mut
atio
n
Supp
lem
enta
ry T
able
1 T
he h
uman
ped
igre
e da
ta u
sed
in th
e an
alys
is o
f A32
43G
het
erop
lasm
y tra
nsm
issi
on a
nd it
s eff
ect o
n fe
mal
e re
prod
uctio
n
Gen
erat
ion
No.
Cas
eaD
augh
ters
bSo
nsb
Lev
elM
utat
ion
Lev
elM
utat
ion
Lev
elA
geL
evel
9M
0S
7021
106.54
6058
191.40
10F
2UI
21
565
18.35
10M
2UI
1661
54.20
10F
2UI
11
1956
58.23
10M
2UI
1955
57.08
10M
2UI
1751
47.14
10M
2UI
1352
36.78
10M
1UI
2846
70.26
10M
1UI
2846
70.26
10M
1UI
3441
77.20
10F
1UI
11
548
13.06
510
F1
UI
01
544
12.05
510
M1
UI
4526
75.69
1956
58.23
10F
1UI
00
4230
76.53
1956
58.23
10M
0UI
817
11.24
548
13.06
11F
1UI
01
17.6
5653
.94
11M
1UI
2244
53.04
11F
1UI
00
2939
6326
11F
1UI
00
2939
63.26
11F
1UI
00
1637
33.53
11M
0UI
2526
42.05
17.6
5653
.94
12F
1I
02
62.7
2610
5.46
12M
0O
71.3
477
.24
62.7
2610
5.46
13F
1M
32
2827
48.05
13F
1S
31
1455
42.06
13F
1M
12
1469
55.65
13F
1S
11
2454
70.67
13F
0I
816
91.33
2827
48.05
13F
1R
12
2859
91.12
13F
0I
853
90.26
2827
48.05
13F
0R
1426
23.55
1455
42.06
13F
0I
4346
107.90
1469
55.65
13F
0R
4220
62.66
1455
42.06
13M
0I
7518
107.50
4039
87.26
13M
0HS
038
0.00
1469
55.65
Nti
Rl
ihi
ihh
id
Not
ice
a: R
elat
ions
hip
with
the
inde
x ca
se
I : I
ndex
cas
e
M :
Mot
her o
f the
inde
x ca
se
O :
Off
sprin
g of
the
inde
x ca
se
S :
Sibl
ing
of th
e in
dex
case
H
S: H
alf s
ib o
f the
inde
x ca
s
R :
Mat
erna
l rel
ativ
e of
the
inde
x ca
se
UI :
Uni
dent
ified
rela
tions
hip
with
the
inde
x ca
se
b:Num
berof
daughtersor
sons
b:Num
berof
daughtersor
sons
UIN:u
nide
ntified
numbe
rof
offspring
74

Ref
eren
ce
Gen
der
Rev
erse
Gen
erat
ion
No.
Rel
atio
nshi
pw
ith th
e In
dex
Cas
ea
Num
ber
of
Dau
ghte
rs
Num
ber
of
Sons
Blo
odM
utat
ion
Lev
elA
geA
ge-C
orre
cted
Blo
od
Mut
atio
n L
evel
Mat
erna
l Blo
od
Mut
atio
n L
evel
Mat
erna
l
Age
Mat
erna
l Age
-C
orre
cted
Mut
atio
n L
evel
13M
0R
2238
47.04
2859
91.12
13M
0R
1731
31.60
2859
91.12
13F
0R
2832
53.10
2859
91.12
14F
2M
82
672
25.32
14F
1S
02
732
13.28
672
25.32
14F
1S
00
3034
59.22
672
25.32
14F
1S
01
1436
28.76
672
25.32
14M
1S
039
0.00
672
25.32
14M
1S
043
0.00
672
25.32
14F
1S
00
1247
30.72
672
25.32
14F
1S
11
048
0.00
672
25.32
15F
1M
11
2043
47.26
515
M0
I30
1843
.00
2043
47.26
16F
2S
02
267
7.64
16F
2S
02
267
7.64
16F
1O
00
4419
64.34
5216
F0
R48
2376
.04
417
M1
S28
4163
.57
17F
2R
21
1749
45.30
17M
1S
3753
106.80
17M
2R
1758
54.23
17F
1S
11
1948
49.62
17F
1S
01
2332
43.62
17F
2M
11
2540
5564
067
000
17F
2M
11
2540
55.64
067
0.00
17M
0R
5915
79.64
1948
49.62
17F
1S
UIN
UIN
1042
23.16
17F
1S
00
1825
29.68
17F
1S
20
2828
49.02
17F
1R
00
3621
54.79
1749
45.30
17F
1S
01
3621
54.79
2540
55.64
17F
0R
468
53.98
2828
49.02
17F
0O
4321
65.44
149
88
20
617
M1
I59
1884
.57
2540
55.64
17F
0R
506
56.37
2828
49.02
17F
1S
30
1154
32.39
17F
1S
11
1549
39.97
17F
1R
02
1252
33.95
17M
1R
458
12.76
17F
0R
1533
29.02
1154
32.39
17F
0R
1130
20.04
1154
32.39
Not
ice
a:R
elat
ions
hip
ithth
ein
deca
seN
otic
ea:
Rel
atio
nshi
p w
ith th
ein
dex
case
I
: Ind
ex c
ase
M
: M
othe
r of t
he in
dex
case
O
: O
ffsp
ring
of th
e in
dex
case
S
: Si
blin
g of
the
inde
x ca
se
HS:
Hal
f sib
of t
he in
dex
cas
R
: M
ater
nal r
elat
ive
of th
e in
dex
case
U
I : U
nide
ntifi
ed re
latio
nshi
p w
ith th
e in
dex
case
b:
Num
berof
daughtersor
sons
b:Num
berof
daughtersor
sons
UIN:u
nide
ntified
numbe
rof
offspring
75
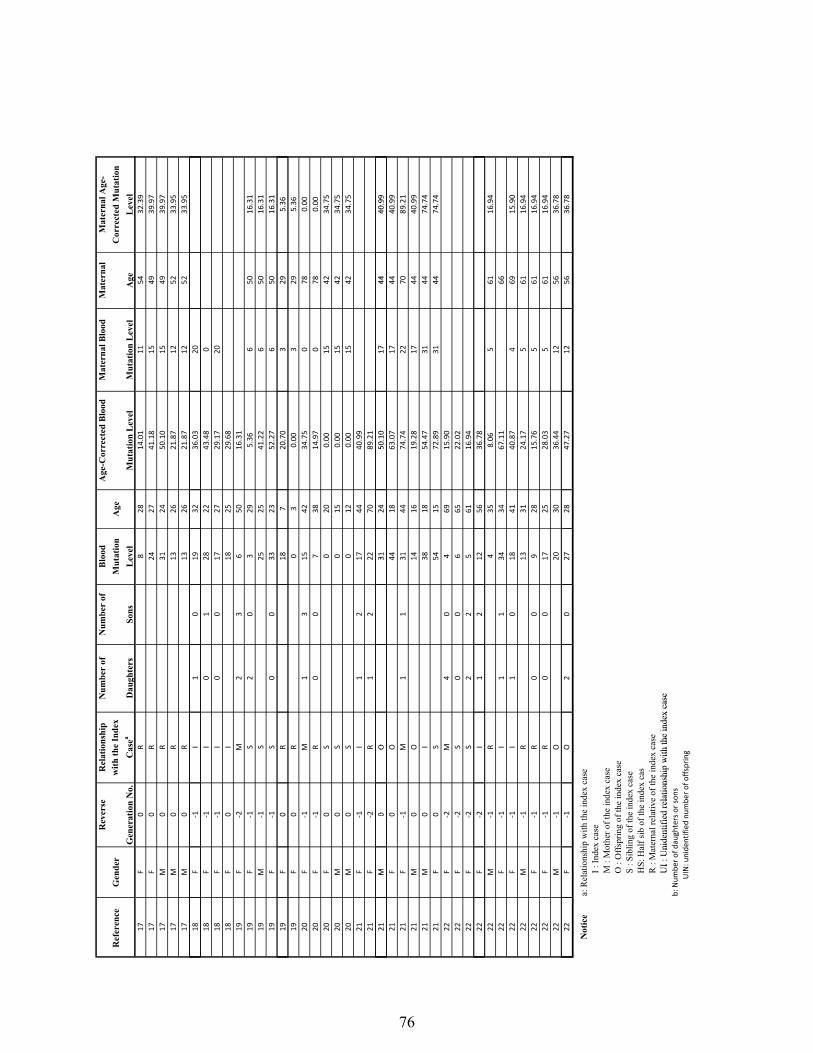
Ref
eren
ce
Gen
der
Rev
erse
Gen
erat
ion
No.
Rel
atio
nshi
pw
ith th
e In
dex
Cas
ea
Num
ber
of
Dau
ghte
rs
Num
ber
of
Sons
Blo
odM
utat
ion
Lev
elA
geA
ge-C
orre
cted
Blo
od
Mut
atio
n L
evel
Mat
erna
l Blo
od
Mut
atio
n L
evel
Mat
erna
l
Age
Mat
erna
l Age
-C
orre
cted
Mut
atio
n L
evel
17F
0R
828
14.01
1154
32.39
17F
0R
2427
41.18
1549
39.97
17M
0R
3124
50.10
1549
39.97
17M
0R
1326
21.87
1252
33.95
17M
0R
1326
21.87
1252
33.95
18F
1I
10
1932
36.03
2018
F1
I0
128
2243
.48
018
F1
I0
017
2729
.17
2018
F0
I18
2529
.68
19F
2M
23
650
16.31
19F
1S
20
329
5.36
650
16.31
19M
1S
2525
41.22
650
16.31
19F
1S
00
3323
52.27
650
16.31
19F
0R
187
20.70
329
5.36
19F
0R
187
20.70
329
5.36
19F
0R
03
0.00
329
5.36
20F
1M
13
1542
34.75
078
0.00
20F
1R
00
738
14.97
078
0.00
20F
0S
020
0.00
1542
34.75
20M
0S
015
0.00
1542
34.75
20M
0S
012
0.00
1542
34.75
21F
1I
12
1744
40.99
21F
2R
12
2270
89.21
21M
0O
3124
5010
1744
4099
21M
0O
3124
50.10
1744
40.99
21F
0O
4418
63.07
1744
40.99
21F
1M
11
3144
74.74
2270
89.21
21M
0O
1416
19.28
1744
40.99
21M
0I
3818
54.47
3144
74.74
21F
0S
5415
72.89
3144
74.74
22F
2M
40
469
15.90
22F
2S
00
665
22.02
22F
2S
22
561
16.94
222
22
636
822
F2
I1
212
5636
.78
22M
1R
435
8.06
561
16.94
22F
1I
11
3434
67.11
6622
F1
I1
018
4140
.87
469
15.90
22M
1R
1331
24.17
561
16.94
22F
1R
00
928
15.76
561
16.94
22F
1R
00
1725
28.03
561
16.94
22M
1O
2030
36.44
1256
36.78
22F
1O
20
2728
47.27
1256
36.78
Not
ice
a: R
elat
ions
hip
with
the
inde
x ca
se
I : I
ndex
cas
e
M :
Mot
her o
f the
inde
x ca
se
O :
Off
sprin
g of
the
inde
x ca
se
S :
Sibl
ing
of th
e in
dex
case
H
S: H
alf s
ib o
f the
inde
x ca
s
R :
Mat
erna
l rel
ativ
e of
the
inde
x ca
seU
I:U
nide
ntifi
ed re
latio
nshi
pw
ith th
e in
dex
case
UI:
Uni
dent
ified
rela
tions
hip
with
the
inde
xca
seb:
Num
berof
daughtersor
sons
UIN:u
nide
ntified
numbe
rof
offspring
76
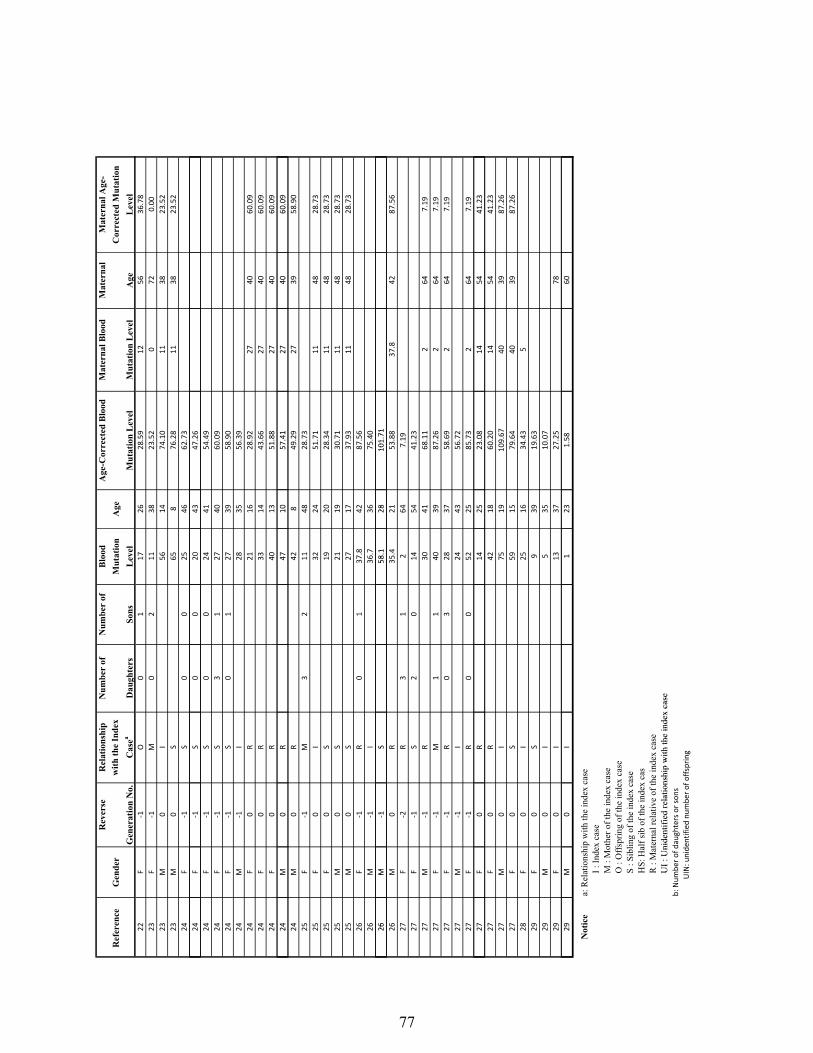
Ref
eren
ce
Gen
der
Rev
erse
Gen
erat
ion
No.
Rel
atio
nshi
pw
ith th
e In
dex
Cas
ea
Num
ber
of
Dau
ghte
rs
Num
ber
of
Sons
Blo
odM
utat
ion
Lev
elA
geA
ge-C
orre
cted
Blo
od
Mut
atio
n L
evel
Mat
erna
l Blo
od
Mut
atio
n L
evel
Mat
erna
l
Age
Mat
erna
l Age
-C
orre
cted
Mut
atio
n L
evel
22F
1O
01
1726
28.59
1256
36.78
23F
1M
02
1138
23.52
072
0.00
23M
0I
5614
74.10
1138
23.52
23M
0S
658
76.28
1138
23.52
24F
1S
00
2546
62.73
24F
1S
00
2043
47.26
24F
1S
00
2441
54.49
24F
1S
31
2740
60.09
24F
1S
01
2739
58.90
24M
1I
2835
56.39
24F
0R
2116
28.92
2740
60.09
24F
0R
3314
43.66
2740
60.09
24F
0R
4013
51.88
2740
60.09
24M
0R
4710
57.41
2740
60.09
24M
0R
4710
57.41
2740
60.09
24M
0R
428
49.29
2739
58.90
25F
1M
32
1148
28.73
25F
0I
3224
51.71
1148
28.73
25F
0S
1920
28.34
1148
28.73
25M
0S
2119
30.71
1148
28.73
25M
0S
2717
37.93
1148
28.73
26F
1R
01
37.8
4287
.56
26M
1I
36.7
3675
.40
26M
1S
581
2810
171
26M
1S
58.1
2810
1.71
26M
0R
35.4
2153
.88
37.8
4287
.56
27F
2R
31
264
7.19
27F
1S
20
1454
41.23
27M
1R
3041
68.11
264
7.19
27F
1M
11
4039
87.26
264
7.19
27F
1R
03
2837
58.69
264
7.19
27M
1I
2443
56.72
27F
1R
00
5225
85.73
264
7.19
20
223
0823
27F
0R
1425
23.08
1454
41.23
27F
0R
4218
60.20
1454
41.23
27M
0I
7519
109.67
4039
87.26
27F
0S
5915
79.64
4039
87.26
28F
0I
2516
34.43
529
F0
S9
3919
.63
29M
0I
535
10.07
29F
0I
1337
27.25
7829
M0
I1
231.58
60
Not
ice
a: R
elat
ions
hip
with
the
inde
x ca
se
I : I
ndex
cas
e
M :
Mot
her o
f the
inde
x ca
se
O :
Off
sprin
g of
the
inde
x ca
se
S :
Sibl
ing
of th
e in
dex
case
H
S: H
alf s
ib o
f the
inde
x ca
s
R :
Mat
erna
l rel
ativ
e of
the
inde
x ca
seU
I:U
nide
ntifi
edre
latio
nshi
pw
ithth
ein
dex
case
UI:
Uni
dent
ified
rela
tions
hip
with
the
inde
xca
seb:
Num
berof
daughtersor
sons
UIN:u
nide
ntified
numbe
rof
offspring
77

Ref
eren
ce
Gen
der
Rev
erse
Gen
erat
ion
No.
Rel
atio
nshi
pw
ith th
e In
dex
Cas
ea
Num
ber
of
Dau
ghte
rs
Num
ber
of
Sons
Blo
odM
utat
ion
Lev
elA
geA
ge-C
orre
cted
Blo
od
Mut
atio
n L
evel
Mat
erna
l Blo
od
Mut
atio
n L
evel
Mat
erna
l
Age
Mat
erna
l Age
-C
orre
cted
Mut
atio
n L
evel
29F
0I
179
4.85
29F
0S
432
7.59
29F
0I
1438
29.94
30F
1M
11
569
19.87
30M
1R
265
7.34
30F
2R
10
376
13.72
30F
2R
11
774
30.75
30F
1S
00
2849
74.60
30M
0S
2336
47.25
569
19.87
30F
1S
02
1846
45.17
30F
0I
3834
75.01
569
19.87
30F
1S
11
3144
74.74
30F
1M
11
1855
54.07
376
13.72
30F
1I
10
1739
37.09
30F
1I
10
1739
37.09
30F
1R
11
454
11.78
774
30.75
30M
1R
455
12.02
774
30.75
30M
1R
1547
38.40
30M
1R
1645
39.35
30F
1R
10
1043
23.63
30M
0R
2526
42.05
1846
45.17
30M
0I
4530
82.00
1855
54.07
30M
0R
3022
46.58
1846
45.17
30F
0S
2628
4552
1855
5407
30F
0S
2628
45.52
1855
54.07
30F
0R
735
14.10
454
11.78
30M
0R
433
7.74
454
11.78
30F
0R
1319
19.01
1043
23.63
31F
1I
01
1652
45.27
31F
1I
01
655
18.02
31M
0O
3724
59.79
1652
45.27
31M
0O
4425
72.54
655
18.02
32F
1M
12
1560
49.80
32F
1R
00
1552
42.44
32F
1R
00
1545
36.89
32M
0I
038
0.00
1560
49.80
32F
0S
2833
54.17
1560
49.80
33F
1M
02
4336
88.34
33M
0S
4910
59.85
4336
88.34
33M
0I
686
76.67
4336
88.34
34F
0I
2031
37.18
34M
0I
5410
65.96
35F
1M
12
545
12.30
35M
0I
3721
56.31
545
12.30
Not
ice
a: R
elat
ions
hip
with
the
inde
x ca
se
I : I
ndex
cas
e
M :
Mot
her o
f the
inde
x ca
se
O :
Off
sprin
g of
the
inde
x ca
se
S :
Sibl
ing
of th
e in
dex
case
HS:
Hal
fsib
ofth
ein
dex
cas
HS:
Hal
fsib
ofth
ein
dex
cas
R
: M
ater
nal r
elat
ive
of th
e in
dex
case
U
I : U
nide
ntifi
ed re
latio
nshi
p w
ith th
e in
dex
case
b:
Num
berof
daughtersor
sons
UIN:u
nide
ntified
numbe
rof
offspring
78

6 Chapter 6: Conclusion and Future Directions This chapter aims to review original contributions of this dissertation and highlight future research directions. Each section presents a brief conclusion of each research project. The last section is devoted to discussing the possible future research directions
6.1 Section 6.1: Mitochondrial genetic bottleneck
In Chapter 2, we presented an experimental study using a neutral mouse model complemented by a computational simulation of mouse embryogenesis to investigate how the mitochondrial genetic bottleneck generates a large random shift in heteroplasmy level between a mother and her offspring. The experimental mouse model, designed and carried out by our collaborators, showed a drastic reduction of mtDNA copy numbers per cell during blastocyst formation, generating a small number of mtDNA molecules per cell among progenitor germ cells. This small mtDNA copy number in a germ line precursor is a physical bottleneck of mtDNA population. The embryogenesis simulation, developed in our lab, showed that the offspring heteroplasmy variation is largely generated by a random partition of mtDNA molecules during pre- and early post-implantation development. Our result indicated that an individual mtDNA molecule can well be a mitochondrial segregating unit.
6.2 Section 6.2: Distribution pattern of mtDNA heteroplasmy level
In Chapter 3, we modified a set of probability functions developed by Motoo Kimura in 1955 [117] to describe the distribution of mtDNA heteroplasmy level of a subsequent generation of a single maternal ancestor. The theoretical Kimura distribution was tested against 16 actual mtDNA heteroplasmy distributions measured from several organisms, including human, mouse and Drosophila. The consistency between the theoretical Kimura distribution and the actual mtDNA heteroplasmy distribution presents the potential application of population genetic theory to mitochondrial genetics.
6.3 Section 6.3: Sampling error of heteroplasmy variance
Generally, the heteroplasmy variance has been calculated from a modest number of mtDNA heteroplasmy measurements, which may be sufficient to get a reliable estimate population parameter for this higher-order statistics. In Chapter 4, we addressed this concern by developing several models, varied by the underlying distribution, to calculate a standard error of variance. We also proposed how to normalize heteroplasmy variance. This normalization is necessary for the comparison of the heteroplasmy variance values across different data sets with different heteroplasmy mean values.
The application of both the standard error of variance calculation and the normalization to the variance of the actual heteroplasmy measurements can alter the biological interpretation and reveal the difference in mitochondrial bottleneck between humans and mice. The result clearly shows that, with limited human data, humans have a tighter bottleneck than mice. The bottleneck size difference is present both in primary oocytes and offspring. In addition, the standard error of variance calculation can be applied to estimate a proper sample size for an experimental design related to heteroplasmy variance calculation.
79

6.4 Section 6.4: The mothers carrying a high proportion of A3243G mutation tends to have fewer daughters than sons
In Chapter 5, we aim to study the effect of the A3243G mutation on female reproduction. We started the analysis by studying the transmission pattern of this mutant heteroplasmy level. The application of an age-correction to blood heteroplasmy measurements revealed that the transmission of this mutant heteroplasmy level of the mothers carrying a low proportion of this mutation follows a neutral random drift architecture, while the transmission of this mutation from the mother carrying a high proportion of this mutation is subject to a purifying selection mechanism.
The effect of this mutation on female reproduction has been shown by the comparison of the average number of daughters to the average number of sons from the mother carrying low and from the mother carrying high mutation level. The average number of daughters is statistically significant lower than the average number of sons of the mother carrying a high proportion of this common pathogenic mtDNA mutation. This offspring gender bias has an implication for why we tend to observe a small pedigree carrying this mutation.
6.5 Section 6.5: Research overview and future directions
The main purpose of this dissertation is to gain an understanding of how human mtDNA heteroplasmy is inherited. This has an implication for an estimation of recurrence risk of having an affected individual with mitochondrial disease in the family carrying a pathogenic mtDNA mutation. In Chapter 2, we have a clearer picture of how mitochondrial genetic bottleneck generates a random shift in heteroplasmy level between a mother and her offspring and variation of this measurement among offspring siblings. Then in Chapter 3, the application of probability functions that were developed to describe the segregation of allele frequencies subject to random genetic drift helps us to describe the intra-generational distribution of mtDNA heteroplasmy level. In Chapter 4, the applications of the normalization method and the standard error of variance calculation to the actual mtDNA heteroplasmy level variance reveal the difference in mitochondrial genetic bottleneck between humans and mice. Finally in Chapter 5, we observed the tendency of bearing sons in the mother carrying a high proportion of m.3243A>G mutation via the statistical analyses of the published human clinical pedigrees.
The purpose of this section is to discuss future research directions, which aims both to answer some fundamental questions in the field of mitochondrial genetics and to develop tools for clinical practice. Some fundamental questions that need to be answered are for example:
How large is the variation of b parameter in humans?
The b parameter value can be deduced from the heteroplasmy mean and variance, as shown in Chapter 3. This parameter is necessary for estimating the probability value of an individual carrying mutant mtDNA at a particular level, having an implication for an estimation of a recurrence risk in the family carrying a pathogenic mtDNA mutation. Knowing the range of this parameter value would gain confidence in the probability estimation.
The variation of this parameter value could be presented both at the level of the type of pathogenic mtDNA mutation and at an individual level, thus its numerical value should be
80

calculated from a set of heteroplasmy measurements of the descendents or germ line cells of a single maternal ancestor. We can calculate this parameter value from published human clinical pedigrees, although each individual mother in the pedigree typically has a very small number of offspring, leading to a requirement to estimate this parameter value from a group of mothers. This is complicated by the fact that the dependency of heteroplasmy variance on the heteroplasmy mean affects the estimation of this parameter. To solve this problem, either the normalization or the transformation method needs to be developed in order to calculate the b parameter across a range of heteroplasmy levels.
Does selection play a major role in the transmission of pathogenic mtDNA mutation?
There are observations from two different experimental mouse models indicating that negative selection plays a role in regulating mtDNA heteroplasmy transmission [107, 118]. In fact, to some extent, the transmission of pathogenic mtDNA mutation may be subjected to selection in which its effect would be different from one type of pathogenic mtDNA mutation to another mutation, both in quality and quantity. In particular, this question has been driven by the observation of a significant increase of offspring heteroplasmy level from the mother carrying m.8993T>G (OMIM+516060.0001) mtDNA mutation with no evidence of a reduction of heteroplasmy level toward age.
We can study the effect of selection on the transmission of the pathogenic mtDNA mutation by testing whether the offspring heteroplasmy level significantly differs from the mother’s heteroplasmy level, which the mother and offspring heteroplasmy level can be obtained from a set of published human clinical pedigrees. We can use the same procedure as presented in Chapter 4 to exercise this question. The direction of the heteroplasmy level difference between a mother and offspring can indicate whether the transmission mechanism is a random drift or selection. We can further examine whether the significant difference is the result of the change of heteroplasmy level toward age by comparing the intergenerational heteroplasmy variation to the intra-generational heteroplasmy variation.
How can we properly adjust for the effect of ascertainment bias in human clinical pedigree data?
The human clinical pedigree data is typically subjected to an ascertainment bias. The ascertainment bias could distort the segregation pattern of the allele of interest [119]. For the study of nDNA transmission, there is a refined method to adjust for this confounding factor, knowing whether the mutation is dominant or recessive [119]. However, there is no such method to adjust for this confounding factor in the case of mtDNA heteroplasmy transmission. The general accepted procedure is excluding all index cases from the analysis [89-90], although this simple process may not be effective enough to eliminate the ascertainment bias.
We can apply Kimura distribution and defined pedigree structure to build the multigenerational transmission model of mtDNA heteroplasmy level or the pedigree model. In this model, the theoretical Kimura distribution is applied to determine an individual’s heteroplasmy level with b parameter estimated either from human primary oocyte heteroplasmy measurements [110] or from human clinical pedigree data of the mother carrying the intermediate heteroplasmy level as used in Chapter 4. We can simply assume the distribution of the number of offspring per mother to follow the Poisson distribution [120] with the offspring
81

82
gender ratio of one to one or to apply the structure extracted from human clinical pedigree data, as presented in Chapter 5.
For this particular question, we can design the pedigree simulation model to make a statistical comparison between the total pedigree families carrying mutant mtDNA and their fraction being brought to clinical attention. The statistical comparison result should help us to develop the method to correct the ascertainment bias for the study of the segregation pattern of mtDNA heteroplasmy level.
How does the particular pathogenic mtDNA mutation affect human population?
We can adapt the pedigree model to build the population model of mtDNA heteroplasmy transmission by simultaneously generating multiple pedigrees. This model would help us gain insight into how the pathogenic mtDNA mutation segregates in a human population. At a particular time point, we can observe the proportion of carriers and affected individuals in the system. The validity of the population model can be judged by comparing the simulated population prevalence to the actual population prevalence presented in published literatures.
In clinical practice, we need to improve an accuracy of genetic counseling for the family carrying the pathogenic mtDNA mutation. At this point, knowing the b parameter value and the maternal heteroplasmy level, we can apply Kimura distribution to estimate the probability of her offspring carrying mutant mtDNA higher than the threshold level. This probability value would, to some extent, determine the probability of her offspring being affected. In medical practice, the b parameter can be estimated from a set of heteroplasmy measurements of a maternal tissue sample, which the sampling effect can be addressed by applying standard error of variance calculation, developed in Chapter 4. If the maternal tissue sample is the female germ line cell, this strategy can be used to predict a recurrence risk prior to conception. If the maternal tissue sample is collected after conception, either through pre-implantation genetic diagnosis (PGD) [121] or prenatal diagnosis (PND) process [122-125], application of this idea complemented by the knowledge of the mtDNA heteroplasmy segregation between different cells and different tissues would help to estimate the likelihood of the offspring being affected. If there are other known factors determining the severity of the disease phenotype, those modifying factors need to be taken into account to the likelihood estimation of the offspring being affected. Thereby the future research project would be to test the validity of this whole idea of preventive transmission strategy. In particular, we build the computational simulation model by taking all known factors determining an expression of disease phenotype into account- then statistically compare the simulated data against the clinical observation. If the simulation model can well describe the clinical observation, this computational model would be a useful tool for mitochondrial genetic counseling. The simulation can be extended to predict the recurrence risk among other relatives, such as the cousin, by incorporating all factors determining the severity of the disease phenotype into the pedigree model.

References1. Molecular biology of the cell. 4th ed. ed, ed. B. Alberts. Vol. xxxiv, 1463, [86] p.
:. 2002, New York :: Garland Science. 2. Yaffe, M.P., Dynamic mitochondria. Nature Cell Biology, 1999. 1(6): p. E149-
E150. 3. Bereiterhahn, J. and M. Voth, Dynamics of mitochondria in living cells- shape
changes, dislocations, fusion, and fission of mitochondria. Microscopy Research and Technique, 1994. 27(3): p. 198-219.
4. Griparic, L. and A.M. van der Bliek, The many shapes of mitochondrial membranes. Traffic, 2001. 2(4): p. 235-244.
5. Yaffe, M.P., The machinery of mitochondrial inheritance and behavior. Science, 1999. 283(5407): p. 1493-1497.
6. Anesti, V. and L. Scorrano, The relationship between mitochondrial shape and function and the cytoskeleton. Biochimica Et Biophysica Acta-Bioenergetics, 2006. 1757(5-6): p. 692-699.
7. Jensen, R.E., et al., Yeast mitochondrial dynamics: Fusion, division, segregation, and shape. Microscopy Research and Technique, 2000. 51(6): p. 573-583.
8. Brocard, J.B., G.L. Rintoul, and I.J. Reynolds, New perspectives on mitochondrial morphology in cell function. Biology of the Cell, 2003. 95(5): p. 239-242.
9. Dykens, J.A., R.E. Davis, and W.H. Moos, Introduction to mitochondrial function and genomics. Drug Development Research, 1999. 46(1): p. 2-13.
10. DiMauro, S. and M. Hirano, Mitochondrial encephalomyopathies: an update. Neuromuscular Disorders, 2005. 15(4): p. 276-286.
11. Nicholls, D.G., Mitochondrial function and dysfunction in the cell: its relevance to aging and aging-related disease. International Journal of Biochemistry & Cell Biology, 2002. 34(11): p. 1372-1381.
12. Howell, N., et al., mtDNA mutations and common neurodegenerative disorders. Trends in Genetics, 2005. 21(11): p. 583-586.
13. Levy, O.A., C. Malagelada, and L.A. Greene, Cell death pathways in Parkinson's disease: proximal triggers, distal effectors, and final steps. Apoptosis, 2009. 14(4): p. 478-500.
14. Malkus, K.A., E. Tsika, and H. Ischiropoulos, Oxidative modifications, mitochondrial dysfunction, and impaired protein degradation in Parkinson's disease: how neurons are lost in the Bermuda triangle. Molecular Neurodegeneration, 2009. 4.
15. Park, J., Y. Kim, and J. Chung, Mitochondrial dysfunction and Parkinson's disease genes: insights from Drosophila. Disease Models & Mechanisms, 2009. 2(7-8): p. 336-340.
16. Yao, Z. and N.W. Wood, Cell Death Pathways in Parkinson's Disease: Role of Mitochondria. Antioxidants & Redox Signaling, 2009. 11(9): p. 2135-2149.
17. Alikhani, N., M. Ankarcrona, and E. Glaser, Mitochondria and Alzheimer's disease: amyloid-beta peptide uptake and degradation by the presequence protease, hPreP. Journal of Bioenergetics and Biomembranes, 2009. 41(5): p. 447-451.
83

18. Arnold, R.S., et al., Mitochondrial DNA Mutation Stimulates Prostate Cancer Growth in Bone Stromal Environment. Prostate, 2009. 69(1): p. 1-11.
19. Chatterjee, A., E. Mambo, and D. Sidransky, Mitochondrial DNA mutations in human cancer. Oncogene, 2006. 25(34): p. 4663-4674.
20. Gochhait, S., et al., Concomitant presence of mutations in mitochondrial genome and p53 in cancer development-A study in north Indian sporadic breast and esophageal cancer patients. International Journal of Cancer, 2008. 123(11): p. 2580-2586.
21. Lu, J.X., L.K. Sharma, and Y.D. Bai, Implications of mitochondrial DNA mutations and mitochondrial dysfunction in tumorigenesis. Cell Research, 2009. 19(7): p. 802-815.
22. Huynen, M.A., M. de Hollander, and R. Szklarczyk, Mitochondrial proteome evolution and genetic disease. Biochimica Et Biophysica Acta-Molecular Basis of Disease, 2009. 1792(12): p. 1122-1129.
23. Lill, R., et al., Why are mitochondria essential for life? Iubmb Life, 2005. 57(10): p. 701-703.
24. Wallace, D.C., A mitochondrial paradigm of metabolic and degenerative diseases, aging, and cancer: A dawn for evolutionary medicine. Annual Review of Genetics, 2005. 39: p. 359-407.
25. Burger, G., M.W. Gray, and B.F. Lang, Mitochondrial genomes: anything goes. Trends in Genetics, 2003. 19(12): p. 709-716.
26. Gyllensten, U., et al., Paternal inheritance of mitochondrial DNA in mice. Nature, 1991. 352(6332): p. 255-257.
27. Sherengul, W., R. Kondo, and E.T. Matsuura, Analysis of paternal transmission of mitochondrial DNA in Drosophila. Genes & Genetic Systems, 2006. 81(6): p. 399-404.
28. Wolff, J.N. and N.J. Gemmell, Lost in the zygote: the dilution of paternal mtDNA upon fertilization. Heredity, 2008. 101(5): p. 429-434.
29. Schwartz, M. and J. Vissing, Paternal inheritance of mitochondrial DNA. New England Journal of Medicine, 2002. 347(8): p. 576-580.
30. Gray, M.W., G. Burger, and B.F. Lang, Mitochondrial evolution. Science, 1999. 283(5407): p. 1476-1481.
31. Kocher, T.D., et al., Dynamics of mitochondrial DNA- Evolution in animals amplification and sequencing with conserved primers. Proceedings of the National Academy of Sciences of the United States of America, 1989. 86(16): p. 6196-6200.
32. Shadel, G.S. and D.A. Clayton, Mitochondrial DNA maintenance in vertebrates. Annual Review of Biochemistry, 1997. 66: p. 409-435.
33. Anderson, S., et al., Sequence and organization of the human mitochondrial genome Nature, 1981. 290(5806): p. 457-465.
34. Calvo, S., et al., Systematic identification of human mitochondrial disease genes through integrative genomics. Nature Genetics, 2006. 38(5): p. 576-582.
35. Malka, F., A. Lombes, and M. Rojo, Organization, dynamics and transmission of mitochondrial DNA: Focus on vertebrate nucleoids. Biochimica Et Biophysica Acta-Molecular Cell Research, 2006. 1763(5-6): p. 463-472.
84

36. Gilkerson, R.W., Mitochondrial DNA nucleoids determine mitochondrial genetics and dysfunction. International Journal of Biochemistry & Cell Biology, 2009. 41(10): p. 1899-1906.
37. Gilkerson, R.W., et al., Mitochondrial nucleoids maintain genetic autonomy but allow for functional complementation. Journal of Cell Biology, 2008. 181(7): p. 1117-1128.
38. Dimauro, S. and G. Davidzon, Mitochondrial DNA and disease. Annals of Medicine, 2005. 37(3): p. 222-232.
39. Spiropoulos, J., D.M. Turnbull, and P.F. Chinnery, Can mitochondrial DNA mutations cause sperm dysfunction? Molecular Human Reproduction, 2002. 8(8): p. 719-721.
40. Lien, L.M., et al., Involvement of nervous system in maternally inherited diabetes and deafness (MIDD) with the A3243G mutation of mitochondrial DNA. Acta Neurologica Scandinavica, 2001. 103(3): p. 159-165.
41. Nan, D.N., et al., Progressive cardiomyopathy as manifestation of mitochondrial disease. Postgraduate Medical Journal, 2002. 78(919): p. 298-299.
42. Callaghan, B.C., S. Prasad, and S.L. Galetta, Clinical Reasoning: A 62-year-old woman with deafness, unilateral visual loss, and episodes of numbness. Neurology, 2009. 72(16): p. E72-E78.
43. Murphy, R., et al., Clinical features, diagnosis and management of maternally inherited diabetes and deafness (MIDD) associated with the 3243A > G mitochondrial point mutation. Diabetic Medicine, 2008. 25(4): p. 383-399.
44. Ohkubo, K., et al., Mitochondrial gene mutations in the tRNA(Leu(UUR)) region and diabetes: Prevalence and clinical phenotypes in Japan. Clinical Chemistry, 2001. 47(9): p. 1641-1648.
45. Yanagisawa, K., et al., Mutation in the mitochondrial tRNA(Leu) at position 3243 and spontaneus abortions in Japanese women attending a clinic for diabetis pregnancies. Diabetologia, 1995. 38(7): p. 809-815.
46. Moilanen, J.S. and K. Majamaa, Relative fitness of carriers of the mitochondrial DNA mutation 3243A > G. European Journal of Human Genetics, 2001. 9(1): p. 59-62.
47. Holt, I.J., A.E. Harding, and J.A. Morganhughes, Deletions of muscle mitochondrial DNA in patients with mitochondrial myopathies. Nature, 1988. 331(6158): p. 717-719.
48. Larsson, N.G., et al., Progressive increase of the mutated mitochondrial DNA fraction in Kearns-Sayre syndrome. Pediatric Research, 1990. 28(2): p. 131-136.
49. Puoti, G., et al., Identical large scale rearrangement of mitochondrial DNA causes Kearns-Sayre syndrome in a mother and her son. Journal of Medical Genetics, 2003. 40(11): p. 858-863.
50. Shanske, S., et al., Identical mitochondrial DNA deletion in a woman with ocular myopathy and in her son with Pearson syndrome. American Journal of Human Genetics, 2002. 71(3): p. 679-683.
51. Poulton, J., et al., Families of mtDNA rearrrangements can be detected in patients with mtDNA deletions- Duplications may be a transient intermediate form. Human Molecular Genetics, 1993. 2(1): p. 23-30.
85

52. Fu, K., et al., A novel heteroplasmic tRNA(leu(CUN)) mtDNA point mutation in a sporadic patient with mitochondrial encephalomyopathy segregates rapidly in skeletal muscle and suggests an approach to therapy. Human Molecular Genetics, 1996. 5(11): p. 1835-1840.
53. Moraes, C.T., et al., 2 novel pathogenic mitochondrial DNA mutations affecting organelle number and protein synthesis- Is the transfer RNA (Leu(UUR)) gene an etiologic hot spot. Journal of Clinical Investigation, 1993. 92(6): p. 2906-2915.
54. Weber, K., et al., A new mtDNA mutation showing accumulation with time and restriction to skeletal muscle. American Journal of Human Genetics, 1997. 60(2): p. 373-380.
55. Man, P.Y.W., D.M. Turnbull, and P.F. Chinnery, Leber hereditary optic neuropathy. Journal of Medical Genetics, 2002. 39(3): p. 162-169.
56. Cock, H.R., J.M. Cooper, and A.H.V. Schapira, Functional consequences of the 3460-bp mitochondrial DNA mutation associated with Leber's hereditary optic neuropathy. Journal of the Neurological Sciences, 1999. 165(1): p. 10-17.
57. Dunbar, D.R., et al., Complex I deficiency is associated with 3243G:C mitochondrial DNA in osteosarcoma cell cybrids. Human Molecular Genetics, 1996. 5(1): p. 123-129.
58. Durham, S.E., et al., Normal levels of wild-type mitochondrial DNA maintain cytochrome c oxidase activity for two pathogenic mitochondrial DNA mutations but not for m.3243A -> G. American Journal of Human Genetics, 2007. 81(1): p. 189-195.
59. Tong, Y., et al., The mitochondrial tRNA(Glu) A14693G mutation may influence the phenotypic manifestation of ND1 G3460A mutation in a Chinese family with Leber's hereditary optic neuropathy. Biochemical and Biophysical Research Communications, 2007. 357(2): p. 524-530.
60. Hudson, G., et al., Identification of an X-chromosomal locus and haplotype modulating the phenotype of a mitochondrial DNA disorder. American Journal of Human Genetics, 2005. 77(6): p. 1086-1091.
61. Schaefer, A.M., et al., The epidemiology of mitochondrial disorders - past, present and future. Biochimica Et Biophysica Acta-Bioenergetics, 2004. 1659(2-3): p. 115-120.
62. Majamaa, K., et al., Epidemiology of A3243G, the mutation for mitochondrial encephalomyopathy, lactic acidosis, and strokelike episodes: Prevalence of the mutation in an adult population. American Journal of Human Genetics, 1998. 63(2): p. 447-454.
63. Schaefer, A.M., et al., Prevalence of mitochondrial DNA disease in adults. Annals of Neurology, 2008. 63(1): p. 35-39.
64. Uusimaa, J., et al., Prevalence, segregation, and phenotype of the mitochondrial DNA 3243A > G mutation in children. Annals of Neurology, 2007. 62(3): p. 278-287.
65. Manwaring, N., et al., Population prevalence of the MELAS A3243G mutation. Mitochondrion, 2007. 7(3): p. 230-233.
66. Puomila, A., et al., Epidemiology and penetrance of Leber hereditary optic neuropathy in Finland. European Journal of Human Genetics, 2007. 15(10): p. 1079-1089.
86

67. Man, P.Y.W., et al., The epidemiology of Leber hereditary optic neuropathy in the North East of England. American Journal of Human Genetics, 2003. 72(2): p. 333-339.
68. Elliott, H.R., et al., Pathogenic mitochondrial DNA mutations are common in the general population. American Journal of Human Genetics, 2008. 83(2): p. 254-260.
69. Giles, R.E., et al., Maternal inheritance of human mitochondrial DNA. Proceedings of the National Academy of Sciences of the United States of America-Biological Sciences, 1980. 77(11): p. 6715-6719.
70. Sutovsky, P., et al., Development - Ubiquitin tag for sperm mitochondria. Nature, 1999. 402(6760): p. 371-372.
71. Taylor, R.W., et al., Genotypes from patients indicate no paternal mitochondrial DNA contribution. Annals of Neurology, 2003. 54(4): p. 521-524.
72. Filosto, M., et al., Lack of paternal inheritance of muscle mitochondrial DNA in sporadic mitochondrial myopathies. Annals of Neurology, 2003. 54(4): p. 524-526.
73. Sadun, A.A., et al., Extensive investigation of a large Brazilian pedigree of 11778/haplogroup J Leber hereditary optic neuropathy. American Journal of Ophthalmology, 2003. 136(2): p. 231-238.
74. Phasukkijwatana, N., et al., Transmission of heteroplasmic G11778A in extensive pedigrees of Thai Leber hereditary optic neuropathy. Journal of Human Genetics, 2006. 51(12): p. 1110-1117.
75. Qu, J., et al., Cosegregation of the ND4 G11696A mutation with the LHON-associated ND4 G11778A mutation in a four generation Chinese family. Mitochondrion, 2007. 7(1-2): p. 140-146.
76. Bu, X.D. and J.I. Rotter, X-chromosome-linked and mitochondrial gene control of leber hereditary optic neuropathy- evidence from segregation ananlysis for dependence on x chromosome inactivation. Proceedings of the National Academy of Sciences of the United States of America, 1991. 88(18): p. 8198-8202.
77. Guan, M.X., et al., Mutation in TRMU related to transfer RNA modification modulates the phenotypic expression of the deafness-associated mitochondrial 12S ribosomal RNA mutations. American Journal of Human Genetics, 2006. 79(2): p. 291-302.
78. Kaplanova, V., et al., Segregation pattern and biochemical effect of the G3460A mtDNA mutation in 27 members of LHON family. Journal of the Neurological Sciences, 2004. 223(2): p. 149-155.
79. Larsson, N.G., et al., Segregation and manifestations of the mtDNA trans RNALys A>G (8344) mutation of myoclonus epilepsy and ragged-red fibers (MERRF) syndrome. American Journal of Human Genetics, 1992. 51(6): p. 1201-1212.
80. Sekiguchi, K., K. Kasai, and B.C. Levin, Inter- and intragenerational transmission of a human mitochondrial DNA heteroplasmy among 13 maternally-related individuals and differences between and within tissues in two family members. Mitochondrion, 2003. 2(6): p. 401-414.
81. Chinnery, P.F., et al., Leber hereditary optic neuropathy: Does heteroplasmy influence the inheritance and expression of the G11778A mitochondrial DNA mutation? American Journal of Medical Genetics, 2001. 98(3): p. 235-243.
87

82. Huoponen, K., et al., Genetic counseling in Leber hereditary optic neuropathy (LHON). Acta Ophthalmologica Scandinavica, 2002. 80(1): p. 38-43.
83. Thorburn, D.R. and H.H.M. Dahl, Mitochondrial disorders: Genetics, counseling, prenatal diagnosis and reproductive options. American Journal of Medical Genetics, 2001. 106(1): p. 102-114.
84. Klopstock, T. and T. Gasser, Genetic counseling and prenatal diagnosis in mitochondrial diseases. Nervenarzt, 1999. 70(6): p. 504-508.
85. Chinnery, P.F., et al., Genetic counseling and prenatal diagnosis for mtDNA disease. American Journal of Human Genetics, 1998. 63(6): p. 1908-1910.
86. Warner, T.T. and A.H.V. Schapira, Genetic counselling in mitochondrial diseases. Current Opinion in Neurology, 1997. 10(5): p. 408-412.
87. Brown, D.T., et al., Transmission of mitochondrial DNA disorders: possibilities for the future. Lancet, 2006. 368(9529): p. 87-89.
88. Bredenoord, A.L., et al., Dealing with uncertainties: ethics of prenatal diagnosis and preimplantation genetic diagnosis to prevent mitochondrial disorders. Human Reproduction Update, 2008. 14(1): p. 83-94.
89. Chinnery, P.F., et al., The inheritance of mitochondrial DNA heteroplasmy: random drift, selection or both? Trends in Genetics, 2000. 16(11): p. 500-505.
90. Wong, L.J.C., H. Wong, and A.Y. Liu, Intergenerational transmission of pathogenic heteroplasmic mitochondrial DNA. Genetics in Medicine, 2002. 4(2): p. 78-83.
91. Chinnery, P.F., et al., Nonrandom tissue distribution of mutant mtDNA. American Journal of Medical Genetics, 1999. 85(5): p. 498-501.
92. Rahman, S., et al., Decrease of 3243 A -> G mtDNA mutation from blood in MELAS syndrome: A longitudinal study. American Journal of Human Genetics, 2001. 68(1): p. 238-240.
93. Rajasimha, H.K., P.F. Chinnery, and D.C. Samuels, Selection against pathogenic mtDNA mutations in a stem cell population leads to the loss of the 3243A -> G mutation in blood. American Journal of Human Genetics, 2008. 82(2): p. 333-343.
94. Pyle, A., et al., Depletion of mitochondrial DNA in leucocytes harbouring the 3243A -> G mtDNA mutation. Journal of Medical Genetics, 2007. 44(1): p. 69-74.
95. tHart, L.M., et al., Heteroplasmy levels of a mitochondrial gene mutation associated with diabetes mellitus decrease in leucocyte DNA upon aging. Human Mutation, 1996. 7(3): p. 193-197.
96. White, S.L., et al., Mitochondrial DNA mutations at nucleotide 8993 show a lack of tissue- or age-related variation. Journal of Inherited Metabolic Disease, 1999. 22(8): p. 899-914.
97. White, S.L., et al., Genetic counseling and prenatal diagnosis for the mitochondrial DNA mutations at nucleotide 8993. American Journal of Human Genetics, 1999. 65(2): p. 474-482.
98. Birky, C.W., The inheritance of genes in mitochondria and chloroplasts: Laws, mechanisms, and models. Annual Review of Genetics, 2001. 35: p. 125-148.
99. Hauswirth, W.W. and P.J. Laipis, Mitochondrial DNA polymorphism in a maternal lineage of Holstein cows. Proceedings of the National Academy of
88

Sciences of the United States of America-Biological Sciences, 1982. 79(15): p. 4686-4690.
100. Jenuth, J.P., et al., Random genetic drift in the female germline explains the rapid segregation of mammalian mitochondrial DNA. Nature Genetics, 1996. 14(2): p. 146-151.
101. Cao, L.Q., et al., The mitochondrial bottleneck occurs without reduction of mtDNA content in female mouse germ cells. Nature Genetics, 2007. 39(3): p. 386-390.
102. Cao, L.Q., et al., New Evidence Confirms That the Mitochondrial Bottleneck Is Generated without Reduction of Mitochondrial DNA Content in Early Primordial Germ Cells of Mice. Plos Genetics, 2009. 5(12).
103. Cree, L.M., et al., A reduction of mitochondrial DNA molecules during embryogenesis explains the rapid segregation of genotypes. Nature Genetics, 2008. 40(2): p. 249-254.
104. Wai, T., D. Teoli, and E.A. Shoubridge, The mitochondrial DNA genetic bottleneck results from replication of a subpopulation of genomes. Nature Genetics, 2008. 40(12): p. 1484-1488.
105. Khrapko, K., Two ways to make an mtDNA bottleneck. Nature Genetics, 2008. 40(2): p. 134-135.
106. Trifunovic, A., et al., Premature ageing in mice expressing defective mitochondrial DNA polymerase. Nature, 2004. 429(6990): p. 417-423.
107. Stewart, J.B., et al., Strong purifying selection in transmission of mammalian mitochondrial DNA. Plos Biology, 2008. 6(1): p. 63-71.
108. Solignac, M., et al., Genetics of mitchondria in Drosophila- mtDNA inheritance in hetreroplasmic strains of Drosophila mauritiana. Molecular & General Genetics, 1984. 197(2): p. 183-188.
109. Wright, S., Statistical genetics and evolution. Bulletin of the American Mathematical Society, 1942. 48: p. 223-246.
110. Brown, D.T., et al., Random genetic drift determines the level of mutant mtDNA in human primary oocytes. American Journal of Human Genetics, 2001. 68(2): p. 533-536.
111. Poulton, J., V. Macaulay, and D.R. Marchington, Is the bottleneck cracked? American Journal of Human Genetics, 1998. 62(4): p. 752-757.
112. Hartl, D.L., Principles of population genetics. 4th ed. ed, ed. A.G. Clark. Vol. xv, 652 p. :. 2007, Sunderland, Mass. :: Sinauer Associates.
113. Chinnery, P.E., et al., MELAS and MERRF - The relationship between maternal mutation load and the frequency of clinically affected offspring. Brain, 1998. 121: p. 1889-1894.
114. Schork, N.J. and S.W. Guo, Pedigree models for complex human traits involving the mitochondrial genome. American Journal of Human Genetics, 1993. 53(6): p. 1320-1337.
115. Wonnapinij, P., P.F. Chinnery, and D.C. Samuels, The Distribution of Mitochondrial DNA Heteroplasmy Due to Random Genetic Drift. American Journal of Human Genetics, 2008. 83(5): p. 582-593.
116. Wonnapinij, P., P.F. Chinnery, and D.C. Samuels, Previous estimates of mitochondrial DNA mutation level variance did not account for sampling error:
89
90
Comparing the mtDNA genetic bottleneck in mice and humans. American Journal of Human Genetics, 2010. 86(4): p. 540-550.
117. Kimura, M., Solution of a process of random genetic drift with a continuous model. Proceedings of the National Academy of Sciences (USA), 1955. 41: p. 6.
118. Fan, W.W., et al., A mouse model of mitochondrial disease reveals germline selection against severe mtDNA mutations. Science, 2008. 319(5865): p. 958-962.
119. Strachan, T., Human molecular genetics 3. 3rd ed. ed, ed. A.P. Read. Vol. xxv, 674 p. :. 2004, London ; New York : Independence, KY :: Garland Science ; Distributed in the USA by Taylor & Francis.
120. Halliburton, R., -, Introduction to population genetics. Vol. xxi, 650 p. :. 2004, Upper Saddle River, NJ :: Pearson/Prentice Hall.
121. Steffann, J., et al., Analysis of mtDNA variant segregation during early human embryonic development: a tool for successful NARP preimplantation diagnosis. Journal of Medical Genetics, 2006. 43(3): p. 244-247.
122. Bouchet, C., et al., Prenatal diagnosis of myopathy, encephalopathy, lactic acidosis, and stroke-like syndrome: contribution to understanding mitochondrial DNA segregation during human embryofetal development. Journal of Medical Genetics, 2006. 43(10): p. 788-792.
123. Steffann, J., et al., Stability of the m.8993T -> G mtDNA mutation load during human embryofetal development has implications for the feasibility of prenatal diagnosis in NARP syndrome. Journal of Medical Genetics, 2007. 44(10): p. 664-669.
124. Ferlin, T., et al., Segregation of the GB993 mutant mitochondrial DNA through generations and embryonic tissues in a family at risk of Leigh syndrome. Journal of Pediatrics, 1997. 131(3): p. 447-449.
125. Chou, Y.J., et al., Prenatal diagnosis of a fetus harboring an intermediate load of the A3243G mtDNA mutation in a maternal carrier diagnosed with MELAS syndrome. Prenatal Diagnosis, 2004. 24(5): p. 367-370.

AppendixThis section contains information about copyright permission. In particular, the copyright permission letter from Nature Genetics journal and online statement for Elsevier’s journal authors are included in this section.
91
NATURE PUBLISHING GROUP LICENSETERMS AND CONDITIONS
Dec 08, 2009
This is a License Agreement between Passorn Wonnapinij ("You") and Nature PublishingGroup ("Nature Publishing Group") provided by Copyright Clearance Center ("CCC"). Thelicense consists of your order details, the terms and conditions provided by Nature PublishingGroup, and the payment terms and conditions.
All payments must be made in full to CCC. For payment instructions, please seeinformation listed at the bottom of this form.
License Number 2324260745970
License date Dec 08, 2009
Licensed content publisher Nature Publishing Group
Licensed content publication Nature Genetics
Licensed content title A reduction of mitochondrial DNA molecules during embryogenesisexplains the rapid segregation of genotypes
Licensed content author Lynsey M Cree, David C Samuels, Susana Chuva de Sousa Lopes,Harsha Karur Rajasimha, Passorn Wonnapinij, Jeffrey R Mann,Hans-Henrik M Dahl, Patrick F Chinnery
Volume number
Issue number
Pages
Year of publication 2008
Portion used Full paper
Requestor type Student
Type of Use Thesis / Dissertation
Billing Type Invoice
Company Passorn Wonnapinij
Billing Address 808 Glenavon Ct.
Nashville, TN 37220
United States
Customer reference info
Total 0.00 USD
Terms and Conditions
Terms and Conditions for Permissions
Nature Publishing Group hereby grants you a non-exclusive license to reproduce thismaterial for this purpose, and for no other use, subject to the conditions below:
NPG warrants that it has, to the best of its knowledge, the rights to license reuse of this1.
Rightslink Printable License https://s100.copyright.com/App/PrintableLicenseFrame.jsp?publisherID...
1 of 3 12/8/2009 10:09 AM
92

material. However, you should ensure that the material you are requesting is original toNature Publishing Group and does not carry the copyright of another entity (ascredited in the published version). If the credit line on any part of the material youhave requested indicates that it was reprinted or adapted by NPG with permissionfrom another source, then you should also seek permission from that source to reusethe material.
Permission granted free of charge for material in print is also usually granted for anyelectronic version of that work, provided that the material is incidental to the work asa whole and that the electronic version is essentially equivalent to, or substitutes for,the print version. Where print permission has been granted for a fee, separatepermission must be obtained for any additional, electronic re-use (unless, as in the caseof a full paper, this has already been accounted for during your initial request in thecalculation of a print run). NB: In all cases, web-based use of full-text articles must beauthorized separately through the 'Use on a Web Site' option when requestingpermission.
2.
Permission granted for a first edition does not apply to second and subsequent editionsand for editions in other languages (except for signatories to the STM PermissionsGuidelines, or where the first edition permission was granted for free).
3.
Nature Publishing Group's permission must be acknowledged next to the figure, tableor abstract in print. In electronic form, this acknowledgement must be visible at thesame time as the figure/table/abstract, and must be hyperlinked to the journal'shomepage.
4.
The credit line should read:
Reprinted by permission from Macmillan Publishers Ltd: [JOURNAL NAME](reference citation), copyright (year of publication)
For AOP papers, the credit line should read:
Reprinted by permission from Macmillan Publishers Ltd: [JOURNAL NAME],advance online publication, day month year (doi: 10.1038/sj.[JOURNALACRONYM].XXXXX)
5.
Adaptations of single figures do not require NPG approval. However, the adaptationshould be credited as follows:
Adapted by permission from Macmillan Publishers Ltd: [JOURNAL NAME](reference citation), copyright (year of publication)
6.
Translations of 401 words up to a whole article require NPG approval. Please visithttp://www.macmillanmedicalcommunications.com for more information. Translationsof up to a 400 words do not require NPG approval. The translation should be creditedas follows:
Translated by permission from Macmillan Publishers Ltd: [JOURNAL NAME](reference citation), copyright (year of publication).
7.
We are certain that all parties will benefit from this agreement and wish you the best in the
Rightslink Printable License https://s100.copyright.com/App/PrintableLicenseFrame.jsp?publisherID...
2 of 3 12/8/2009 10:09 AM
93

use of this material. Thank you.
v1.1
Gratis licenses (referencing $0 in the Total field) are free. Please retain this printablelicense for your reference. No payment is required.
If you would like to pay for this license now, please remit this license along with yourpayment made payable to "COPYRIGHT CLEARANCE CENTER" otherwise you will beinvoiced within 30 days of the license date. Payment should be in the form of a checkor money order referencing your account number and this license number2324260745970.If you would prefer to pay for this license by credit card, please go tohttp://www.copyright.com/creditcard to download our credit card paymentauthorization form.
Make Payment To:Copyright Clearance CenterDept 001P.O. Box 843006Boston, MA 02284-3006
If you find copyrighted material related to this license will not be used and wish tocancel, please contact us referencing this license number 2324260745970 and notingthe reason for cancellation.
Questions? [email protected] or +1-877-622-5543 (toll free in the US) or+1-978-646-2777.
Rightslink Printable License https://s100.copyright.com/App/PrintableLicenseFrame.jsp?publisherID...
3 of 3 12/8/2009 10:09 AM
94

http://www.elsevier.com
AUTHORS HOMELocate a journal now: Search on :
Title All information
Editor ISSN
orBrowse Journals A-Z or by Subject area
COPYRIGHT
What rights do I retain as a journal author*?When Elsevier changes its journal usage policies, are thosechanges also retroactive?How do I obtain a Journal Publishing Agreement?Can I post my article on the Internet?Why does Elsevier request transfer of copyright?Why does Elsevier believe it needs exclusive rights?Can you provide me with a PDF file of my article?What is Elsevier's policy on plagiarism and conflicts ofinterest?
What rights do I retain as a journal author*?
As a journal author, you retain rights for large number of authoruses, including use by your employing institute or company. Theserights are retained and permitted without the need to obtainspecific permission from Elsevier. These include:
the right to make copies (print or electric) of the journalarticle for their own personal use, including for their ownclassroom teaching use;the right to make copies and distribute copies (including viae-mail) of the journal article to research colleagues,for personal use by such colleagues (but not for CommercialPurposes**, as listed below);the right to post a pre-print version of the journal article onInternet web sites including electronic pre-print servers, andto retain indefinitely such version on such servers or sites(see also our information on electronic preprints for a moredetailed discussion on these points);the right to post a revised personal version of the text of thefinal journal article (to reflect changes made in the peerreview process) on the author's personal or institutional website or server, incorporating the complete citation and with alink to the Digital Object Identifier (DOI) of the article;the right to present the journal article at a meeting orconference and to distribute copies of such paper or article tothe delegates attending the meeting;for the author’s employer, if the journal article is a ‘work forhire’, made within the scope of the author’s employment,the right to use all or part of the information in (any versionof) the journal article for other intra-company use (e.g.
Obtain permissionto use Elseviermaterial
Your question not foundhere?
Submit questionSpecific contacts
Printer-friendly version - Elsevier http://www.elsevier.com/wps/find/authorshome.print/copyright#top?avo...
1 of 3 3/6/2010 1:43 AM
95

training), including by posting the article on secure, internalcorporate intranets;patent and trademark rights and rights to any process orprocedure described in the journal article;the right to include the journal article, in full or in part, in athesis or dissertation;the right to use the journal article or any part thereof in aprinted compilation of works of the author, such as collectedwritings or lecture notes (subsequent to publication of thearticle in the journal); andthe right to prepare other derivative works, to extend thejournal article into book-length form, or to otherwise re-useportions or excerpts in other works, with fullacknowledgement of its original publication in the journal.
*Please Note: The rights listed above apply to journal authorsonly. For information regarding book author rights, please contactthe Global Rights Department.
Elsevier Global Rights Departmentphone (+44) 1865 843 830fax (+44) 1865 853 333email: [email protected]
Other uses by authors should be authorized by Elsevier through theGlobal Rights Department, and journal authors are encouraged tolet Elsevier know of any particular needs or requirements.
**Commercial Purposes includes the use or posting of articles forcommercial gain including the posting by companies or theiremployee-authored works for use by customers of such companies(e.g. pharmaceutical companies and physician-prescribers);commercial exploitation such as directly associating advertisingwith such postings; the charging of fees for document delivery oraccess; or the systematic distribution to others via e-mail lists orlist servers (to parties other than known colleagues), whether for afee or for free.
When Elsevier changes its journal usage policies, are thosechanges also retroactive?
When Elsevier changes its policies to enable greater academic useof journal materials (such as the changes several years ago in ourweb-posting policies) or to clarify the rights retained by journalauthors, Elsevier is prepared to extend those rights retroactivelywith respect to articles published in journal issues produced prior tothe policy change.
Elsevier is pleased to confirm that, unless explicitly noted to thecontrary, all policies apply retrospectively to previously publishedjournal content. If, after reviewing the material noted above, youhave any questions about such rights, please contact Global Rights.
How do I obtain a Journal Publishing Agreement?
You will receive a form automatically by post or email once yourarticle is received by Elsevier's Editorial-Production Department.View a generic example of the agreement here. Some journals willuse another variation of this form.
Can I post my article on the Internet?
You can post your version of your journal article on your personalweb page or the web site of your institution, provided that youinclude a link to the journal's home page or the article’s DOI andinclude a complete citation for the article. This means that you canupdate your version (e.g. the Word or Tex form) to reflect changes
Printer-friendly version - Elsevier http://www.elsevier.com/wps/find/authorshome.print/copyright#top?avo...
2 of 3 3/6/2010 1:43 AM
96

made during the peer review process.
Complete information about proper usage and citation of journalarticles can be found in this pamphlet, published by the GlobalRights Department.
Why does Elsevier request transfer of copyright?
Elsevier wants to ensure that it has the exclusive distribution rightsfor all media. Copyright transfer eliminates any ambiguity oruncertainty about Elsevier's ability to distribute, sub-license andprotect the article from unauthorized copying or alteration.
Why does Elsevier believe it needs exclusive rights?
The research community needs certainty with respect to the validityof scientific papers, which is normally obtained through the editingand peer review processes. The scientific record must be clear andunambiguous. Elsevier believes that, by obtaining exclusivedistribution rights, it will always be clear to researchers that whenthey access an Elsevier site to review a paper, they are reading afinal version of the paper which has been edited, peer-reviewed andaccepted for publication in an appropriate journal. See also ourinformation on electronic preprints for more detailed discussion onthese points.
Can you provide me with a PDF file of my article?
Many Elsevier journals are now offering authors e-offprints – freeelectronic versions of published articles. E-offprints arewatermarked PDF versions, and are usually delivered within 24hours, much quicker than print copies. These PDFs may not beposted to public websites.
For more information, please see your Journal's Guide to Authors orcontact [email protected]
What is Elsevier's policy on plagiarism and conflicts ofinterest?
While it may not be possible to draft a “code” that appliesadequately to all instances and circumstances, Elsevier and thejournal editors believe it useful to outline our expectations ofauthors and procedures that the journal will employ in the event ofquestions concerning author conduct. Procedures and guidelineswith respect to such queries and investigations are outlined in theElsevier Position on Journal Publishing Ethics and Responsibilitiesand Conflicts of Interest are incorporated herein by reference, andshould be reviewed by authors. The policies of individual journalsmay differ, please review the relevant journal's instructions toauthors.
© Copyright 2010 Elsevier | http://www.elsevier.com
Printer-friendly version - Elsevier http://www.elsevier.com/wps/find/authorshome.print/copyright#top?avo...
3 of 3 3/6/2010 1:43 AM
97