Embed Size (px)
Citation preview

Theoretical and Experimental Study of Effective Shear Stiffnessof Reinforced ECC Columns
Chang Wu1), Zuanfeng Pan2),* , Kang-Su Kim3), and Shaoping Meng4)
(Received December 15, 2016, Accepted October 23, 2017, Published online December 7, 2017)
Abstract: Engineered cementitious composites (ECC) possesses characteristics that make it suitable in the zones of high shear
and ductility demand of structural elements; however, there is a lack of an adequate model to predict its shear stiffness. A
theoretical model for the effective shear stiffness of reinforced ECC (RECC) columns is proposed on the basis of the truss-arch
model, with the consideration of the unique property of ECC material. A total of six column specimens subjected to cyclic reverse
loading are conducted, and the main test variables include the shear span-to-depth ratio, the transverse reinforcement ratio and the
axial load ratio. Results show that the shear contribution to the total deflection in the diagonally cracked RECC beam is significant,
and the proposed theoretical model can predict the shear deformation with reasonable accuracy.
Keywords: engineered cementitious composites (ECC), columns, experimentation, shear stiffness, truss, arch.
1. Introduction
Engineered cementitious composites (ECC) invented by Liet al. (Li 2012; Li and Leung 1992; Li et al. 1993) based on thebasic principle of micromechanics and fracture mechanics isone of a family of high performance fiber reinforced cementcomposite (HPFRCC) (Naaman 1987), which exhibits pseudostrain hardening and multiple cracking properties under uni-axial tensile stress. This type of material consists of cement,mineral admixture, fine aggregates (maximum grain sizeusually 0.15 mm), water, admixtures to enhance strength andworkability, and less than 2.0% volume of short fibers. Uni-axial tensile tests on ECC indicate that multiple fine cracks inECC are formed uniformly over the length of the specimen,and the opening of each crack is usually less than 100 lm,subsequently, the ultimate tensile strain can exceed 2.0%,which is several hundred times that of normal concrete.ECC has attracted the attentions of many researchers
during the past two decades (Yoo and Yoon 2016), due to theadvantages of unique macroscopic pseudo strain hardening,
high energy dissipation capacity and good durability. Therandomly distributed fibers in ECC help to transfer loads atthe internal micro cracks, which leads to the fact that RECCmember can have a relatively higher load carrying capacityand deformation capacity compared to normal RC member.Generally, both ultimate strength limit state and service-ability limit state requirements should be considered in thestructural design. As there is no coarse aggregate in ECC,the elastic modulus of ECC is usually lower than that ofconcrete. Consequently, greater deformation of RECCmember tends to be caused. The design of RECC membersmay be controlled by the serviceability limit rather thanstrength. In addition, for seismic design, the stiffness ofRECC members of a structure strongly influences the cal-culated response under seismic action. Therefore, it isimportant to accurately predict the effective stiffness up toyielding of each structural component. Generally, the totaldeformation of a structural member can be regarded as thesummation of flexural and shear deformations. However,even for RC members, the shear mechanisms is not asclearly elucidated compared to the sound understanding offlexural behavior, and the shear deformation is usuallyunderestimated or just neglected. For the newly developedmaterial, ECC, few researches so far have been reported onthe estimation of shear deformation of ECC members. Toaddress this issue, an approach to predict the effective shearstiffness of RECC columns is proposed in the present study,based on the truss-arch model.Since the truss concept was first introduced a century ago,
the truss models have wildly used for predicting the ultimateshear strength of RCmembers, such as the traditional 45� trussmodel, constant angle truss model (CATM), variable angletruss model (VATM), compression field theory (CFT), modi-fied compression field theory (MCFT), rotating-angle
1)Department of Civil and Environmental Engineering,
Hong Kong University of Science and Technology, Hong
Kong, China.
2)College of Civil Engineering, Tongji University, 200092
Shanghai, China.
*Corresponding Author; E-mail: [email protected])Department of Architectural Engineering, University of
Seoul, Seoul, Korea.4)School of Civil Engineering, Southeast University,
210096 Nanjing, China.
Copyright � The Author(s) 2017. This article is an open
access publication
International Journal of Concrete Structures and MaterialsVol.11, No.4, pp.585–597, December 2017DOI 10.1007/s40069-017-0219-2ISSN 1976-0485 / eISSN 2234-1315
585
softened truss model (RA-STM) and fixed-angle softenedtruss model (FA-STM), etc. (ASCE-ACI Committee 4451998). In terms of the study on shear stiffness or deformation,Kim and Mander (1999) systematically researched the trussmodel and analyzed the shear stiffness of RC columnswith theVATMwhichwas derived using various numerical integrationschemes. The Programs, VecTor2 (Won and Vecchio 2002)and Response 2000 (Bentz 2000), were developed based onMCFT, which can be used to analyze the load–displacementcurves of RC members subjected to the combination of axialload, shear and flexure. Based on Softened Membrane Model(SMM) (Hsu and Mo 2010), Mo et al. (2008) developed theSimulation of Concrete Structures (SCS) program on theOpenSEES platform to simulate the load–displacementresponses of shear-critical RC elements. Pan et al. (2014)derived the explicit expression of effective shear stiffness onthe basis of CATM and VATM, which was verified by theexperiment of RC T-section beams.In the truss-arch model, the shear resistant mechanism is
explicitly considered as the truss action superimposing anarch action. Arch action in RC members subjected to shearforce has been recognized by many researchers (Ichinose1992; Kim et al. 1998). Especially, for members with lowshear span-to-depth ratio, if the arch action is not taken intoaccount, the shear stiffness tends to be underestimated.Ichinose (1992) presented a truss-arch model and proposed adesign equation to prevent shear failure after the inelasticflexural deformation, which has been adopted in the Archi-tectural Institute of Japan Design Guidelines (AIJ 1994). Onthe basis of the experimentally measured steel stresses overthe shear span in the RC beams, Kim et al. (1998) proposedan empirical coefficient, which represents arch action con-tribution to the total shear capacity. Pan et al. (Pan and Li2013; Jin and Pan 2015) proposed a new type of truss-archmodel with the consideration of the deformation compati-bility for both truss model and arch action, and the proposedmodel was verified by the shear-critical RC column tests.The unique tensile strain-hardening property allows
cracked ECC members to carry tensile stresses, and thetensile stress of cracked ECC can not be directly neglectedlike brittle materials such as normal concrete. In the presentstudy, a theoretical model is proposed on the basis of thetruss-arch model, incorporating the unique properties ofECC, to predict the effective shear stiffness of RECC col-umns. Then, six RECC columns subjected to cyclic reverseloading with various shear span-to-depth ratios, transversereinforcement ratios and axial load ratios were studiedexperimentally to verify the proposed model.
2. Shear Stiffness for RECC Columns
2.1 Pre-cracking Shear StiffnessAs the applied shear force is less than the cracking shear
force, Vcr, the member keeps diagonally uncracked and itsshear behavior can be considered to be elastic. The shearstiffness before diagonally cracking, Kv1, can be calculatedthrough elasticity method, as follows,
Kv1 ¼ GAv ¼EcAv
2 1þ lð Þ � 0:435EcAv ð1Þ
in which l is the Poisson’s ratio of ECC, and l is equal to0.15 (Han et al. 2003).
2.2 Truss-arch Model for Fully DiagonallyCracked Shear StiffnessThe truss-arch model method is employed to calculate the
fully diagonally cracked shear stiffness of a RECC columnin this study. Based on the truss-arch model, the fullydiagonally cracked shear stiffness, Kv2, can be decoupledinto two base components: the truss component, Kt, and thearch component, Ka. It can be calculated with the followingequation:
Kv2 ¼ Kt þ Ka ð2Þ
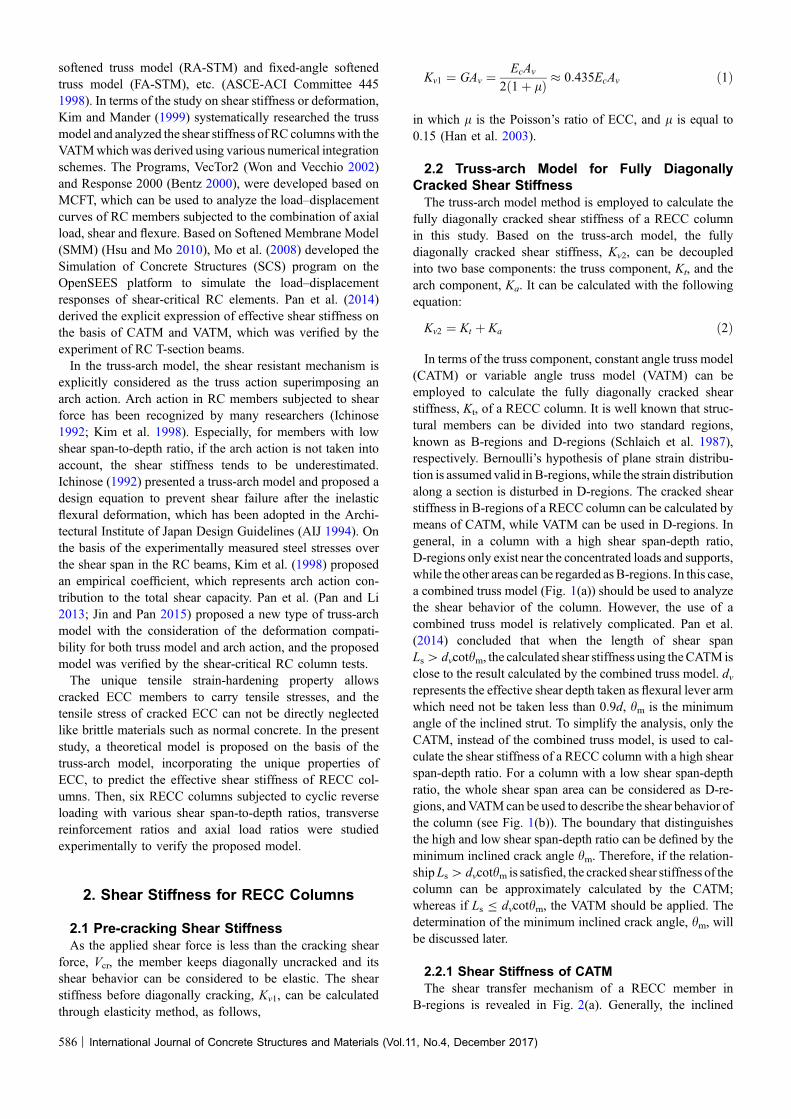
In terms of the truss component, constant angle truss model(CATM) or variable angle truss model (VATM) can beemployed to calculate the fully diagonally cracked shearstiffness, Kt, of a RECC column. It is well known that struc-tural members can be divided into two standard regions,known as B-regions and D-regions (Schlaich et al. 1987),respectively. Bernoulli’s hypothesis of plane strain distribu-tion is assumed valid in B-regions, while the strain distributionalong a section is disturbed in D-regions. The cracked shearstiffness in B-regions of a RECC column can be calculated bymeans of CATM, while VATM can be used in D-regions. Ingeneral, in a column with a high shear span-depth ratio,D-regions only exist near the concentrated loads and supports,while the other areas can be regarded asB-regions. In this case,a combined truss model (Fig. 1(a)) should be used to analyzethe shear behavior of the column. However, the use of acombined truss model is relatively complicated. Pan et al.(2014) concluded that when the length of shear spanLs[ dvcothm, the calculated shear stiffness using theCATM isclose to the result calculated by the combined truss model. dvrepresents the effective shear depth taken as flexural lever armwhich need not be taken less than 0.9d, hm is the minimumangle of the inclined strut. To simplify the analysis, only theCATM, instead of the combined truss model, is used to cal-culate the shear stiffness of a RECC column with a high shearspan-depth ratio. For a column with a low shear span-depthratio, the whole shear span area can be considered as D-re-gions, andVATMcan be used to describe the shear behavior ofthe column (see Fig. 1(b)). The boundary that distinguishesthe high and low shear span-depth ratio can be defined by theminimum inclined crack angle hm. Therefore, if the relation-shipLs[ dvcothm is satisfied, the cracked shear stiffness of thecolumn can be approximately calculated by the CATM;whereas if Ls B dvcothm, the VATM should be applied. Thedetermination of the minimum inclined crack angle, hm, willbe discussed later.
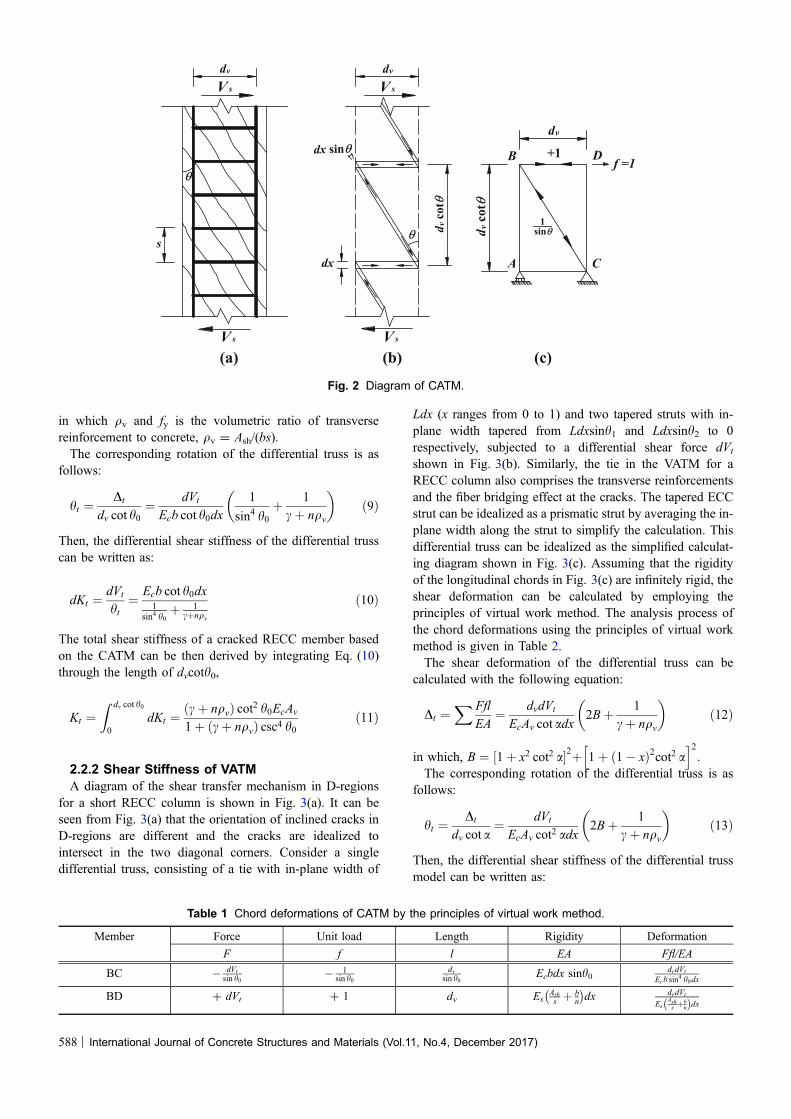
2.2.1 Shear Stiffness of CATMThe shear transfer mechanism of a RECC member in
B-regions is revealed in Fig. 2(a). Generally, the inclined
586 | International Journal of Concrete Structures and Materials (Vol.11, No.4, December 2017)
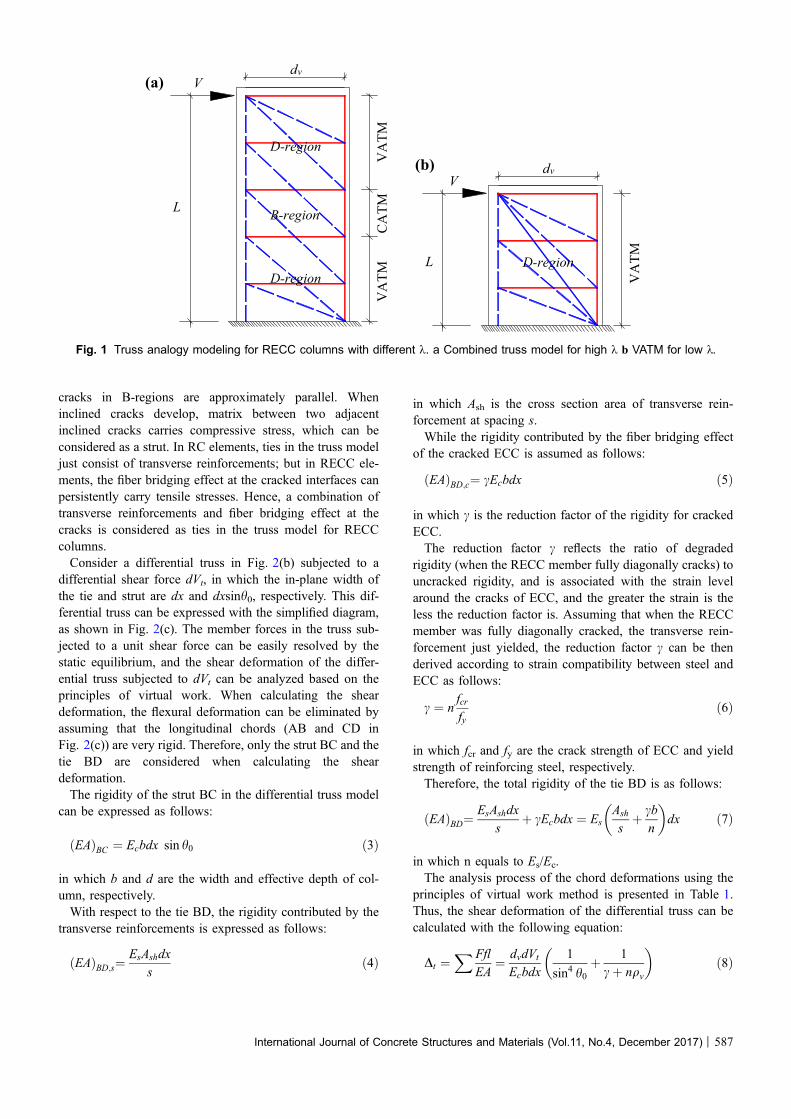
cracks in B-regions are approximately parallel. Wheninclined cracks develop, matrix between two adjacentinclined cracks carries compressive stress, which can beconsidered as a strut. In RC elements, ties in the truss modeljust consist of transverse reinforcements; but in RECC ele-ments, the fiber bridging effect at the cracked interfaces canpersistently carry tensile stresses. Hence, a combination oftransverse reinforcements and fiber bridging effect at thecracks is considered as ties in the truss model for RECCcolumns.Consider a differential truss in Fig. 2(b) subjected to a
differential shear force dVt, in which the in-plane width ofthe tie and strut are dx and dxsinh0, respectively. This dif-ferential truss can be expressed with the simplified diagram,as shown in Fig. 2(c). The member forces in the truss sub-jected to a unit shear force can be easily resolved by thestatic equilibrium, and the shear deformation of the differ-ential truss subjected to dVt can be analyzed based on theprinciples of virtual work. When calculating the sheardeformation, the flexural deformation can be eliminated byassuming that the longitudinal chords (AB and CD inFig. 2(c)) are very rigid. Therefore, only the strut BC and thetie BD are considered when calculating the sheardeformation.The rigidity of the strut BC in the differential truss model
can be expressed as follows:
ðEAÞBC ¼ Ecbdx sin h0 ð3Þ
in which b and d are the width and effective depth of col-umn, respectively.With respect to the tie BD, the rigidity contributed by the
transverse reinforcements is expressed as follows:
EAð ÞBD;s¼EsAshdx
sð4Þ
in which Ash is the cross section area of transverse rein-forcement at spacing s.While the rigidity contributed by the fiber bridging effect
of the cracked ECC is assumed as follows:
EAð ÞBD;c¼ cEcbdx ð5Þ
in which c is the reduction factor of the rigidity for crackedECC.The reduction factor c reflects the ratio of degraded
rigidity (when the RECC member fully diagonally cracks) touncracked rigidity, and is associated with the strain levelaround the cracks of ECC, and the greater the strain is theless the reduction factor is. Assuming that when the RECCmember was fully diagonally cracked, the transverse rein-forcement just yielded, the reduction factor c can be thenderived according to strain compatibility between steel andECC as follows:
c ¼ nfcrfy
ð6Þ
in which fcr and fy are the crack strength of ECC and yieldstrength of reinforcing steel, respectively.Therefore, the total rigidity of the tie BD is as follows:
EAð ÞBD¼EsAshdx
sþ cEcbdx ¼ Es
Ash
sþ cb
n
� �dx ð7Þ
in which n equals to Es/Ec.The analysis process of the chord deformations using the
principles of virtual work method is presented in Table 1.Thus, the shear deformation of the differential truss can becalculated with the following equation:
Dt ¼XFfl
EA¼ dvdVt
Ecbdx
1
sin4 h0þ 1
cþ nqv
� �ð8Þ
L
V
D-region
dv
VA
TMC
ATM
VA
TM
B-region
D-region
L
V
D-region
dv
VA
TM
(a)
(b)
Fig. 1 Truss analogy modeling for RECC columns with different k. a Combined truss model for high k b VATM for low k.
International Journal of Concrete Structures and Materials (Vol.11, No.4, December 2017) | 587
in which qv and fy is the volumetric ratio of transversereinforcement to concrete, qv = Ash/(bs).The corresponding rotation of the differential truss is as
follows:
ht ¼Dt
dv cot h0¼ dVt
Ecb cot h0dx1
sin4 h0þ 1
cþ nqv
� �ð9Þ
Then, the differential shear stiffness of the differential trusscan be written as:
dKt ¼dVt
ht¼ Ecb cot h0dx
1sin4 h0
þ 1cþnqv
ð10Þ
The total shear stiffness of a cracked RECC member basedon the CATM can be then derived by integrating Eq. (10)through the length of dvcoth0,
Kt ¼Z dv cot h0
0dKt ¼
cþ nqvð Þ cot2 h0EcAv
1þ cþ nqvð Þ csc4 h0ð11Þ
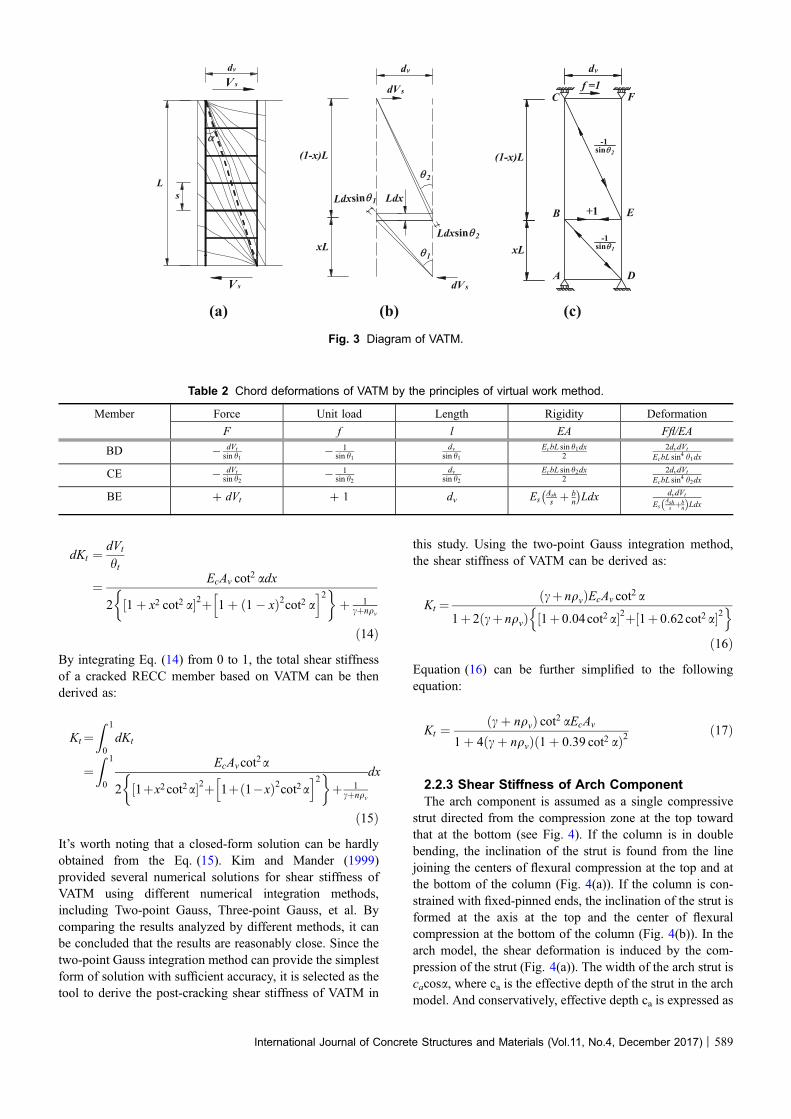
2.2.2 Shear Stiffness of VATMA diagram of the shear transfer mechanism in D-regions
for a short RECC column is shown in Fig. 3(a). It can beseen from Fig. 3(a) that the orientation of inclined cracks inD-regions are different and the cracks are idealized tointersect in the two diagonal corners. Consider a singledifferential truss, consisting of a tie with in-plane width of
Ldx (x ranges from 0 to 1) and two tapered struts with in-plane width tapered from Ldxsinh1 and Ldxsinh2 to 0respectively, subjected to a differential shear force dVt
shown in Fig. 3(b). Similarly, the tie in the VATM for aRECC column also comprises the transverse reinforcementsand the fiber bridging effect at the cracks. The tapered ECCstrut can be idealized as a prismatic strut by averaging the in-plane width along the strut to simplify the calculation. Thisdifferential truss can be idealized as the simplified calculat-ing diagram shown in Fig. 3(c). Assuming that the rigidityof the longitudinal chords in Fig. 3(c) are infinitely rigid, theshear deformation can be calculated by employing theprinciples of virtual work method. The analysis process ofthe chord deformations using the principles of virtual workmethod is given in Table 2.The shear deformation of the differential truss can be
calculated with the following equation:
Dt ¼XFfl
EA¼ dvdVt
EcAv cot adx2Bþ 1
cþ nqv
� �ð12Þ
in which, B ¼ 1þ x2 cot2 a½ �2þ 1þ 1� xð Þ2cot2 ah i2
:
The corresponding rotation of the differential truss is asfollows:
ht ¼Dt
dv cot a¼ dVt
EcAv cot2 adx2Bþ 1
cþ nqv
� �ð13Þ
Then, the differential shear stiffness of the differential trussmodel can be written as:
θ
V s
V s
s
dv
θ
V s
V s
dv
dx
d vco
tθ
dx sinθf =1
dv
+1
d vco
t θ
1sinθ
A C
B D
(a) (b) (c)
Fig. 2 Diagram of CATM.
Table 1 Chord deformations of CATM by the principles of virtual work method.
Member Force Unit load Length Rigidity Deformation
F f l EA Ffl/EA
BC � dVt
sin h0� 1
sin h0dv
sin h0Ecbdx sinh0
dvdVt
Ecb sin4 h0dx
BD ? dVt ? 1 dv EsAsh
s þ bn
� �dx dvdVt
EsAshs þb
nð Þdx
588 | International Journal of Concrete Structures and Materials (Vol.11, No.4, December 2017)
dKt ¼dVt
ht
¼ EcAv cot2 adx
2 1þ x2 cot2 a½ �2þ 1þ 1� xð Þ2cot2 ah i2� �
þ 1cþnqv
ð14Þ
By integrating Eq. (14) from 0 to 1, the total shear stiffnessof a cracked RECC member based on VATM can be thenderived as:
Kt¼Z 1
0dKt
¼Z 1
0
EcAvcot2a
2 1þx2cot2a½ �2þ 1þ 1�xð Þ2cot2ah i2� �
þ 1cþnqv
dx
ð15Þ
It’s worth noting that a closed-form solution can be hardlyobtained from the Eq. (15). Kim and Mander (1999)provided several numerical solutions for shear stiffness ofVATM using different numerical integration methods,including Two-point Gauss, Three-point Gauss, et al. Bycomparing the results analyzed by different methods, it canbe concluded that the results are reasonably close. Since thetwo-point Gauss integration method can provide the simplestform of solution with sufficient accuracy, it is selected as thetool to derive the post-cracking shear stiffness of VATM in
this study. Using the two-point Gauss integration method,the shear stiffness of VATM can be derived as:
Kt ¼cþ nqvð ÞEcAv cot2 a
1þ 2 cþ nqvð Þ 1þ 0:04cot2 a½ �2þ 1þ 0:62cot2 a½ �2n o
ð16Þ
Equation (16) can be further simplified to the followingequation:
Kt ¼cþ nqvð Þ cot2 aEcAv
1þ 4 cþ nqvð Þ 1þ 0:39 cot2 að Þ2ð17Þ
2.2.3 Shear Stiffness of Arch ComponentThe arch component is assumed as a single compressive
strut directed from the compression zone at the top towardthat at the bottom (see Fig. 4). If the column is in doublebending, the inclination of the strut is found from the linejoining the centers of flexural compression at the top and atthe bottom of the column (Fig. 4(a)). If the column is con-strained with fixed-pinned ends, the inclination of the strut isformed at the axis at the top and the center of flexuralcompression at the bottom of the column (Fig. 4(b)). In thearch model, the shear deformation is induced by the com-pression of the strut (Fig. 4(a)). The width of the arch strut iscacosa, where ca is the effective depth of the strut in the archmodel. And conservatively, effective depth ca is expressed as
α
V s
V s
s
dv
L
dv
dV s
dV s
xL
(1-x)L
Ldx
θ 1
θ 2
Ldxsinθ 1
Ldxsinθ 2
dv
f =1
xL
(1-x)L
+1
-1sinθ 1
-1sinθ 2
D
B E
C
A
F
(b)(a) (c)
Fig. 3 Diagram of VATM.
Table 2 Chord deformations of VATM by the principles of virtual work method.
Member Force Unit load Length Rigidity Deformation
F f l EA Ffl/EA
BD � dVt
sin h1� 1
sin h1dv
sin h1EcbL sin h1dx
22dvdVt
EcbL sin4 h1dx
CE � dVt
sin h2� 1
sin h2dv
sin h2EcbL sin h2dx
22dvdVt
EcbL sin4 h2dx
BE ? dVt ? 1 dv EsAsh
s þ bn
� �Ldx dvdVt
EsAshs þb
nð ÞLdx
International Journal of Concrete Structures and Materials (Vol.11, No.4, December 2017) | 589

ca = x-c, where x is the depth of compressive zone and c isthe thickness of ECC cover. The shear stiffness of the archmodel (Pan and Li 2013) can be calculated with the fol-lowing equation:
Ka ¼ Ecbca sin2 ha cos
2 ha ð18Þ
in which ha is the inclination of the strut for a column withfixed–fixed ends (Fig. 4(a), ha = atan((h-x)/L)) and for acolumn with fixed-pinned ends (Fig. 4(b), ha = atan((h–x)/(2L))). The depth of compressive zone, x, can be estimatedby the following equation proposed by Paulay and Priestley(1992) for RC members,
x ¼ 0:25þ 0:85N
f 0c Ag
� �h ð19Þ
It is worth noting that the ECC material can carry tensilestress in the tension zone, which may cause greater depth ofcompressive zone, compared with the normal concrete. Themethod for predicting the depth of compressive zone of ECCmembers has not been well studied in resent researches.Here, the existing equation for RC members is used forsimplicity and conservation. Theoretically, to balance thesectional tensile force, and therefore, the stiffness due to archaction will increase, while the predicted shear deformationwill decrease.
2.2.4 Determination of the Minimum InclinedCrack AngleAs discussed above, the employment of CATM or VATM
for analyzing the shear stiffness should be determined basedon the minimum inclined angle hm. The cotangent of mini-mum inclined angle, cothm, represents the critical aspectratio to utilize CATM; when the aspect ratio is less thancothm, the VATM should be applied. To determine theminimum inclined angle, a simplified truss model with two-point Gauss quadrature can be used, shown as Fig. 5. It is
believed that the minimum inclined crack angle depends onboth flexure and shear components, and will occur at aninclination that requires the minimum potential energy.Assuming the truss shown in Fig. 5 is subjected to a unit
shear force, the external work done, EWD, can be written asthe total drift angle of flexure and shear components,
EWD ¼ hf þ hs ð20Þ
As mentioned above, the shear rotation can be obtained asfollows,
hs ¼1
Kt¼ 1þ 4 cþ nqvð Þ 1þ 0:39 cot2 að Þ2
cþ nqvð Þ cot2 aEcAvð21Þ
The flexural rotation can be induced by the deformations ofthe longitudinal chords in Fig. 5. Assuming that thesectional depth ratio of compression zone of ECCmembers is n, and the sectional depth ratio of tension zoneequals to (1-n). The rigidity of the chords in tension (AB,
Va
Va
hca=x-cδa
Δa
f a
α c
Va
Va
h/2ca=x-c
f a
c
x
α
(a) (b)
Fig. 4 Diagram of arch action. a column with fixed–fixed ends b column with fixed pinned ends.
V s
V s
α
θ 2
θ 1
A
B
C
D
E
F
G
H
Fig. 5 Variable angle truss model by two-point Gaussquadrature.
590 | International Journal of Concrete Structures and Materials (Vol.11, No.4, December 2017)
BC, and CD in Fig. 5) consists of axial stiffness contributedby reinforcements and fiber bridging effects of the crackedECC, which can be written as,
ðEAÞtens ¼EsAst
2þ cEs 1� nð Þbh
nð22Þ
Generally, the longitudinal reinforcements in columns aresymmetric about the centroidal axis; therefore, Ast/2 isapplied in Eq. (22), in which Ast is the total area of thelongitudinal reinforcement.While, the rigidity of the chords in compression (EF, FG,
and GH in Fig. 5) can be expressed as,
ðEAÞcomp ¼EsAst
2þ Esnbh
nð23Þ
Since no test has been conducted to determine the sectionaldepth of compression zone for RECC members, the sectionaldepth ratio of compression zone, n, can be estimated by thefollowing equation (Paulay and Priestley 1992),
n ¼ x
h¼ 0:25þ 0:85
N
f 0c Agð24Þ
If the VATM with two-point Gauss quadrature shown inFig. 5 is subjected to a unit shear force, the deformations ofeach chord are listed in Table 3. Then, the flexural drift anglecan be calculated as follows,
hf ¼Df
L¼ cot2 a
EcAg
1:46
nqs þ 2c 1� nð Þ þ0:12
nqs þ 2n
� �ð25Þ
Therefore, the external work done, EWD, can be written asthe total drift angle of Eq. (21) and (25),
EWD ¼ 1þ 4 cþ nqvð Þ 1þ 0:39 cot2 að Þ2
cþ nqvð Þ cot2 aEcAv
þ cot2 aEcAg
1:46
nqs þ 2c 1� nð Þ þ0:12
nqs þ 2n
� �ð26Þ
Letting a = hm, and dEWD/dhm = 0, the minimum inclinedangle hm can be then derived as,
hm ¼ arctan0:61þ Av
Ag
1:46nqsþ2c 1�nð Þ þ 0:12
nqsþ2n
� 4þ 1
nqvþc
0@
1A
14
264
375
ð27Þ
2.2.5 Determination of Constant Crack AngleIt can be seen from Eq. (11) that the constant crack angle
h0 is the only unknown variable to obtain the shear stiffnessof the CATM. In this study, the constant crack angle h0 isalso derived based on the principle of minimum energy. Byreplacing the shear drift angle, hs, in Eq. (26) with Eq. (9)deduced by the CATM, and letting a = h0, the external workdone, EWD, can be expressed as,
EWD ¼ 1þ cþ nqvð Þ csc4 h0cþ nqvð Þ cot2 h0EcAv
þ cot2 h0EcAg
1:46
nqs þ 2c 1� nð Þ þ0:12
nqs þ 2n
� � ð28Þ
By differentiating Eq. (28) with respect to h0, and letting theresult equals to zero to minimize the external work done, theconstant crack angle h0 can be derived as,
h0 ¼ arctan1þ Av
Ag
1:46nqsþ2c 1�nð Þ þ 0:12
nqsþ2n
� 1þ 1
nqvþc
0@
1A
14
264
375 ð29Þ
2.3 Post-cracking Effective Shear StiffnessA typical shear force—deformation response of a RECC
column before yielding is shown in Fig. 6. The RECC col-umn first cracks diagonally when the shear force reaches Vcr,at which the principal tensile stress in a RECC elementreaches the tensile strength of ECC. Then, the shear stiffnessdrops suddenly due to the occurrence of first inclined crack;and as shear force increases, more inclined cracks form,which leads to the decease of shear stiffness of the RECCcolumn. The actual response after cracking is shown as thecurved line AB in Fig. 6. To simplify the calculation for theeffective shear stiffness, the actual shear force–deformation
Table 3 Chord deformations of VATM by two-point Gauss quadrature.
Member Force Unit load Length Rigidity Deformation
F f l EA Ffl/EA
AB cota cota x1L EsAst
2 þ c 1�nð Þbhn
h ix1L cot2 a
EsAst2 þ
c 1�nð Þbhn½ �
BC (2 - x1)cota/2 (2 - x1)cota/2 (1 - 2 x1) L EsAst
2 þ c 1�nð Þbhn
h iL cot2 a 1�x1ð Þ2 1�2x1ð Þ
4EsAst2 þ
c 1�nð Þbhn½ �
CD cota/2 cota/2 x1L EsAst
2 þ c 1�nð Þbhn
h ix1L cot2 a
4EsAst2 þ
c 1�nð Þbhn½ �
EF - cota/2 - cota/2 x1L EsAst
2 þ nbhn
� �x1L cot2 a
4EsAst2 þ
nbhnð Þ
FG - x1cota/2 - x1cota/2 (1 - 2 x1) L EsAst
2 þ nbhn
� �x21 1�2x1ð ÞL cot2 a4Es
Ast2 þ
nbhnð Þ
GH 0 0 x1L EsAst
2 þ nbhn
� �0
Note x1 = 0.21.
International Journal of Concrete Structures and Materials (Vol.11, No.4, December 2017) | 591

curve (line AB) can be idealized as the straight solid line AC(Fig. 6). Assuming the shear stiffness is Kv2 when the col-umn is fully cracked diagonally, thus, the slope of line ACcan be written as follows:
KAC ¼ Vy � VcrVy
Kv2� Vcr
Kv1
ð30Þ
The effective shear stiffness between Kv1 and Kv2 (the slopeof the line OP in Fig. 6, and P is an arbitrary point along lineAC) can be further obtained by using the linear interpolationas follows:
Kveff ¼V
Vcr
Kv1þ V�Vcr
KAC
¼ VVcr
Kv1þ V�Vcr
Vy�Vcrð Vy
Kv2� Vcr
Kv1Þ
ð31Þ
The calculation procedure can be expressed as the flowchart as shown in Fig. 7.
3. Experimental Program
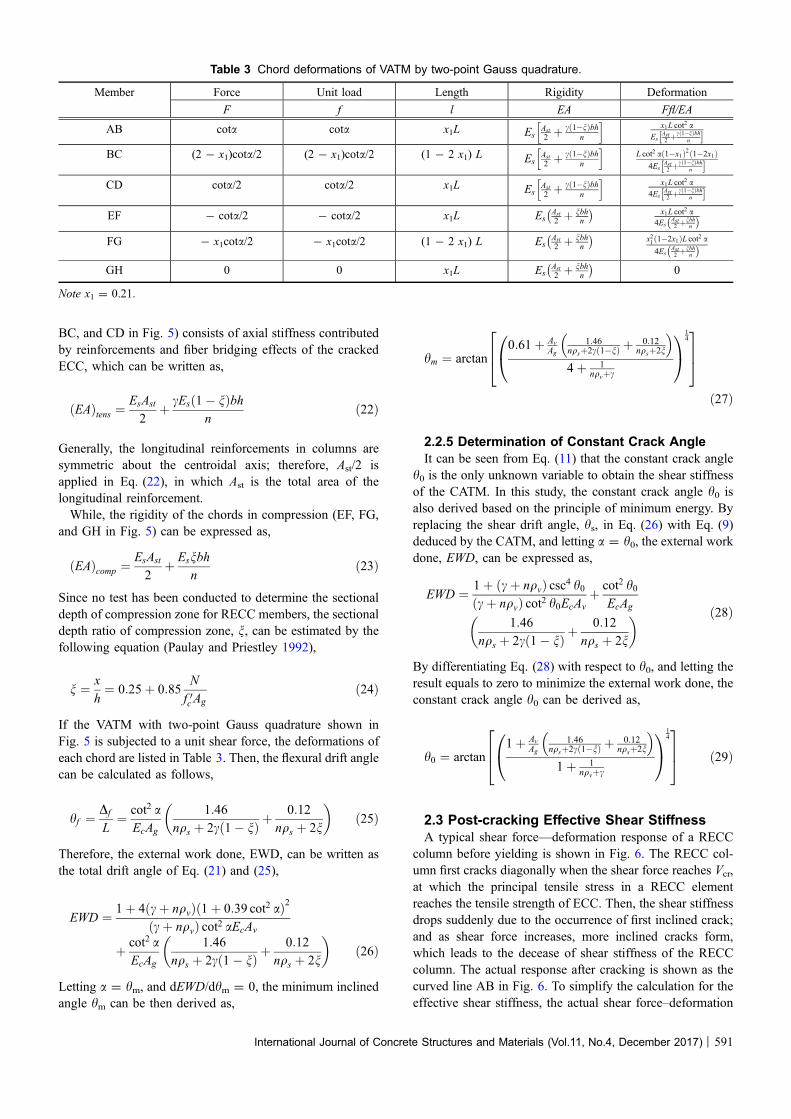
3.1 Specimens and Material PropertiesSix RECC columns, referred to as Specimens E1 * E6,
were tested in this experimental program. All columns hadthe same cross section of 300 9 300 mm. The heights ofprepared columns were 500, 600 and 900 mm, and thecorresponding shear span-to-depth ratios were 1.42, 1.75 and2.75, respectively. The longitudinal reinforcement ratio wasa constant of 1.4% for all specimens. The transverse rein-forcement ratio qsv was equal to 0.22% for E5 and E6 didnot contain stirrups, while qsv was 0.45% for the others. Theapplied axial compression for Specimen E4 was 700 kN,while it was 350 kN for the others. The detailed informationof specimens is shown in Fig. 8 and Table 4.The mix proportion of ECCmaterial employed in this study
was based on a high volume of fly ash (the weight ratio of flyash to cement is 3.2) and 2.0% PVA fiber in volume fraction.Based on the tensile uniaxial test results (Pan et al. 2015), thePVA-ECC materials employed in this study had the tensilestrength ranging from 4 MPa to 4.5 MPa, and the ultimatetensile strain was ranging from 4.0 to 5.0% at 28 days. Anumber of ECC cubes (100 9 100 9 100 mm) and prisms
(100 9 100 9 300 mm) were also prepared and tested incompression. The tested average cubic compressive strengthof prepared ECC was about 50 MPa, and the correspondingprismatic compressive strength was approximately 45 MPa.The elastic modulus of prepared ECC was about 22GPa. Thedetailed material properties are listed in Table 5.The longitudinal steel bars employed in each specimen
were four 20 mm-diameter deformed bars with a yield stressof 498 MPa. The stirrups used with the specimens were8 mm-diameter deformed bars with a yield stress of408 MPa.
3.2 Test Setup and Loading ConfigurationThe base mat of each specimen was fully fixed, while the
top of the specimen was free to move horizontally. Thetransverse load was applied at the top of the column througha double-action actuator (with force and displacement con-trol system) with a load capacity of 1000 kN fixed on areaction wall. The axial load was applied on the centroid ofthe free end section of the specimen through a 1000 kNhydraulic jack keeping constant throughout the test. Duringthe test, displacements were measured by means of linearvariable differential transducers (LVDTs), while strains ofreinforcement were measured by means of strain gauges.The location of strain gauges can be found in Fig. 8. Theaxial load was first applied to the target value and maintainedconstant by adjusting the readings of instrument panel in thehydraulic jack during the experiment. In the tests, a force-control loading program was applied before the longitudinalreinforcement yielded. The increment of load was initially
δ v1 δ v δ vy Shear deformation
Vcr
V
V y
Shear force
A
P
CB
Kv1
Kveff
Kv2
Uncracked response
Yielding
Fully cracked response
Acturalresponse Idealized
response
O
Fig. 6 Diagram of effective shear stiffness of RECC columns.
Calculate Kv1 with Eq.(1)
Calculate θm with Eq.(27)
L dvcotθm
Calculate θ0 with Eq.(29)
Calculate Kt, using CATM (Eq.(11))
Calculate Kt, using VATM (Eq.(17))
Calculate Ka, using arch model (Eq.(18))
Obtain total shear stiffness: Kv2=K t+Ka
Obtain the Kveff with Eq.(31)
NY
Fig. 7 Flowchart showing solution algorithm for effectiveshear stiffness.
592 | International Journal of Concrete Structures and Materials (Vol.11, No.4, December 2017)
50 kN for each step until arriving at 80% of the predictedyielding load, and then changed the increment of 50 kN into25 kN. The force-control loading procedure was not chan-ged until the longitudinal reinforcement yielded. Then, thespecimens were subjected to the cyclic shear force by thedisplacement-control loading method with the increment ofeach load step equals to the measured yield displacement upuntil the shear-resisting capacity drops by more than 20% ofthe maximum shear force. In the force-control loading pro-cedure, all cycles were carried out once, while each dis-placement level was repeated three times in thedisplacement-control loading procedure. The detailedexperiment setup and loading configuration can be found inthe experimental study of ECC columns by Wu et al. (2017).
4. Discussion of Test and Predicted Results
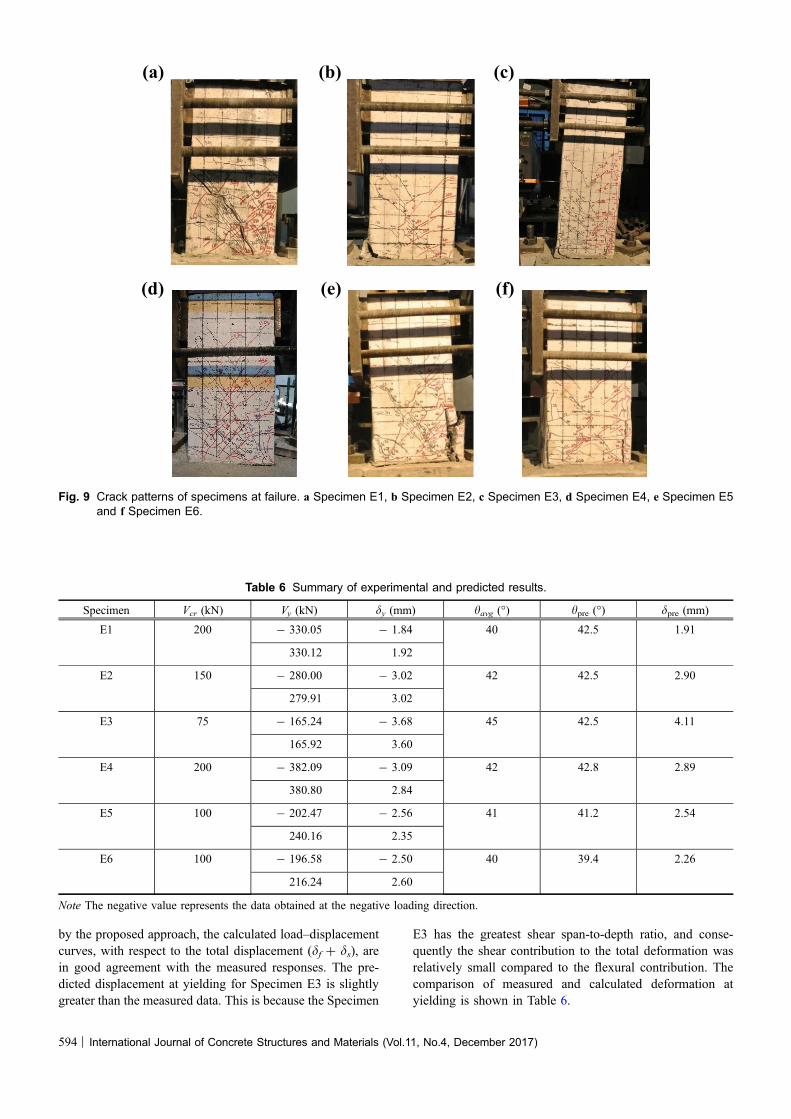
4.1 Crack Patterns and Failure ModesWhen the columns failed, main inclined cracks can be
only observed in Specimen E1 which failed by flexure-shearmode, while others failed by flexure. The crack patterns atfailure are shown in Fig. 9. From Eq. (27), the CATM wasselected to analyze the shear behavior of all the tested col-umns. It is in accord with the observation, since most of theinclined cracks were almost parallel to each other in all the
columns as shown in Fig. 9. The measured Vcr, Vy, andaveraged crack angle havg for the tested columns are shown inTable 6, along with the predicted crack angle hpre by Eq. (29).After testing, the averaged crack angle havg is obtained byaveraging the measured inclined angles of main diagonalcracks corresponding to the loading direction in which thespecimen failed at loading moment. The failure point in thebackbone curve is defined as the point at which the lateralforce falls by more than 20% of the maximum shear force,and then the experiment ends. It is evident that the predictedcrack angles using Eq. (29) are in agreement with the aver-aged experimentally observed crack angles. Moreover,Eq. (29) reveals that the inclined crack angle of a RECCcolumn is dependent on the amount of longitudinal andtransverse reinforcement, as well as the fiber bridging effect.
4.2 Deformation ComparisonTo validate the proposed model for calculating the effec-
tive shear stiffness, the total displacements before yielding ofsix tested columns, consisting of flexural and shear defor-mation, were calculated and compared with the measureddata as shown in Fig. 10. In Fig. 10, the test data ‘‘left’’ and‘‘right’’ mean the data obtained in the negative and positiveloading direction, respectively. The flexural displacement, df,was obtained by translating the nonlinear moment–curvaturerelationship calculated by the strip method into the load–displacement curve. The shear deformation, ds, was obtainedby ds = V/Kveff, in which the effective shear stiffness Kveff iscalculated by Eq. (3). It’s worth noting that the measured Vcr
and Vy were used directly in calculating Kveff. It can be seenfrom Fig. 10 that the calculated flexural deformations areobviously less than the measured deformations, except forSpecimen E3, which has the highest shear span-to-depthratios (k = 2.75). After the columns were cracked diago-nally, the difference increases significantly between thecalculated flexural deformations and the measured totaldeformations of the columns with lower shear span-to-depthratios, which indicates that the continuously developedcracks cause the increase of shear deformation in thosecolumns. By combining the shear deformation ds calculated
4 D20
Strain gauge
D6 @ 80
500
or 6
00 o
r 90
055
0300
300
4 D20
250 300 250
800
D8 @75 or 150
A A
Section A-A
D8 @75 or 150
Fig. 8 Geometry and reinforcement details (unit: mm).
Table 4 Summary of specimen information.
Specimen k P (kN) qsv (%)
E1 1.42 350 0.45
E2 1.75 350 0.45
E3 2.75 350 0.45
E4 1.75 700 0.45
E5 1.75 350 0.22
E6 1.75 350 0
Table 5 Properties of ECC.
Material fcu (MPa) fc (MPa) ft (MPa) et (%) E (GPa)
ECC 49.7 45.0 4.39 4.46 22.2
International Journal of Concrete Structures and Materials (Vol.11, No.4, December 2017) | 593
by the proposed approach, the calculated load–displacementcurves, with respect to the total displacement (df ? ds), arein good agreement with the measured responses. The pre-dicted displacement at yielding for Specimen E3 is slightlygreater than the measured data. This is because the Specimen
E3 has the greatest shear span-to-depth ratio, and conse-quently the shear contribution to the total deformation wasrelatively small compared to the flexural contribution. Thecomparison of measured and calculated deformation atyielding is shown in Table 6.
(b)(a) (c)
(d) (e) (f)
Fig. 9 Crack patterns of specimens at failure. a Specimen E1, b Specimen E2, c Specimen E3, d Specimen E4, e Specimen E5and f Specimen E6.
Table 6 Summary of experimental and predicted results.
Specimen Vcr (kN) Vy (kN) dy (mm) havg (�) hpre (�) dpre (mm)
E1 200 - 330.05 - 1.84 40 42.5 1.91
330.12 1.92
E2 150 - 280.00 - 3.02 42 42.5 2.90
279.91 3.02
E3 75 - 165.24 - 3.68 45 42.5 4.11
165.92 3.60
E4 200 - 382.09 - 3.09 42 42.8 2.89
380.80 2.84
E5 100 - 202.47 - 2.56 41 41.2 2.54
240.16 2.35
E6 100 - 196.58 - 2.50 40 39.4 2.26
216.24 2.60
Note The negative value represents the data obtained at the negative loading direction.
594 | International Journal of Concrete Structures and Materials (Vol.11, No.4, December 2017)

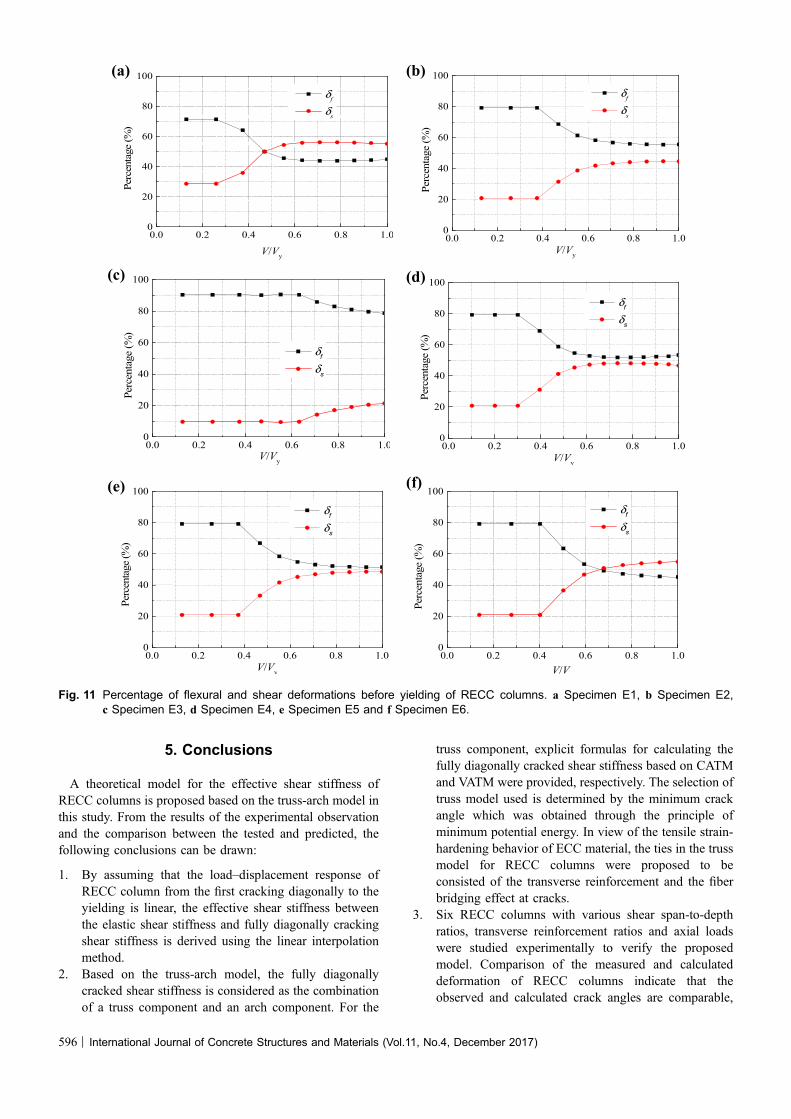
4.3 Proportion of Flexural and ShearDeformationThe percentages of flexural and shear deformations of
each RECC column varied with the ratio V/Vy are shown inFig. 11. It can be seen from Fig. 11 that the flexural defor-mations are greater than the related shear deformations forall specimens before diagonally cracking. With the devel-opment of inclined cracks, the proportion of shear defor-mation increases, and gradually becomes stable. Theproportions of flexural and shear deformations vary with thedifferent shear span-to-depth ratios. The proportion of sheardeformation decreases with the increase of shear span-to-depth ratio, and on the contrary, the proportion of flexuraldeformation increases. For instance, Specimen E3 with thehighest shear span-to-depth ratio (k = 2.75), the proportionof flexural deformation exceeds 90% before diagonallycracking; even if the inclined cracks have fully developed,
the increase rate of shear deformation is much lower than theother specimens and the percentage of flexural deformationreduces to around 80%. Compared to Specimen E3, theincrease of shear deformation of Specimen E1 is more sig-nificant, and when the load level reaches over 0.5Vy, thepercentage of shear deformation goes beyond 50%. Com-paring the specimens with different transverse reinforcementratios, E2 (qsv = 0.45%), E5 (qsv = 0.22%) and E6(qsv = 0), it can be concluded that the percentage of sheardeformation reduces with the increasing transverse rein-forcement ratio. For Specimen E6, the percentage of sheardeformation even surpasses that of flexural deformationwhen the shear force reaches a certain level after diagonallycracking. It is evident that shear contribution to the totaldeformation for the diagonally cracked RECC columns issignificant, especially for the RECC columns with low shearspan-to-depth ratios.
0.0 0.5 1.0 1.5 2.00
100
200
300
400
Load
(kN
)
Displacement (mm)
Tested data (left) Tested data (right)δf
δf+δs
0.0 0.5 1.0 1.5 2.0 2.5 3.00
100
200
300
Load
(kN
)
Displacement (mm)
Tested data (left)Tested data (right)δf
δf+δs
0 1 2 3 4 50
50
100
150
200
Load
(kN
)
Displacement (mm)
Tested data (left)Tested data (right)δf
δf+δs
0.0 0.5 1.0 1.5 2.0 2.5 3.00
100
200
300
400
Load
(kN
)
Displacement (mm)
Tested data (left)Tested data (right)δf
δf+δs
0.0 0.5 1.0 1.5 2.0 2.5 3.00
100
200
300
Load
(kN
)
Displacement (mm)
Tested data (left)Tested data (right)δf
δf+δs
0.0 0.5 1.0 1.5 2.0 2.5 3.00
100
200
300
Load
(kN
)
Displacement (mm)
Tested data (left)Tested data (right)δf
δf+δs
(b)(a)
(c) (d)
(e) (f)
Fig. 10 Measured and predicted load–displacement curves of RECC columns. a Specimen E1, b Specimen E2, c Specimen E3,d Specimen E4, e Specimen E5 and f Specimen E6.
International Journal of Concrete Structures and Materials (Vol.11, No.4, December 2017) | 595
5. Conclusions
A theoretical model for the effective shear stiffness ofRECC columns is proposed based on the truss-arch model inthis study. From the results of the experimental observationand the comparison between the tested and predicted, thefollowing conclusions can be drawn:
1. By assuming that the load–displacement response ofRECC column from the first cracking diagonally to theyielding is linear, the effective shear stiffness betweenthe elastic shear stiffness and fully diagonally crackingshear stiffness is derived using the linear interpolationmethod.
2. Based on the truss-arch model, the fully diagonallycracked shear stiffness is considered as the combinationof a truss component and an arch component. For the
truss component, explicit formulas for calculating thefully diagonally cracked shear stiffness based on CATMand VATM were provided, respectively. The selection oftruss model used is determined by the minimum crackangle which was obtained through the principle ofminimum potential energy. In view of the tensile strain-hardening behavior of ECC material, the ties in the trussmodel for RECC columns were proposed to beconsisted of the transverse reinforcement and the fiberbridging effect at cracks.
3. Six RECC columns with various shear span-to-depthratios, transverse reinforcement ratios and axial loadswere studied experimentally to verify the proposedmodel. Comparison of the measured and calculateddeformation of RECC columns indicate that theobserved and calculated crack angles are comparable,
0.0 0.2 0.4 0.6 0.8 1.00
20
40
60
80
100
Perc
enta
ge (%
)
V/Vy
δfδs
0.0 0.2 0.4 0.6 0.8 1.00
20
40
60
80
100
Perc
enta
ge (%
)
V/Vy
δfδs
0.0 0.2 0.4 0.6 0.8 1.00
20
40
60
80
100
Perc
enta
ge (%
)
V/Vy
δf
δs
0.0 0.2 0.4 0.6 0.8 1.00
20
40
60
80
100
Perc
enta
ge (%
)
V/Vy
δf
δs
0.0 0.2 0.4 0.6 0.8 1.00
20
40
60
80
100
Perc
enta
ge (%
)
V/Vy
δf
δs
0.0 0.2 0.4 0.6 0.8 1.00
20
40
60
80
100
Perc
enta
ge (%
)
V/V
δf
δs
(a) (b)
(c) (d)
(e) (f)
Fig. 11 Percentage of flexural and shear deformations before yielding of RECC columns. a Specimen E1, b Specimen E2,c Specimen E3, d Specimen E4, e Specimen E5 and f Specimen E6.
596 | International Journal of Concrete Structures and Materials (Vol.11, No.4, December 2017)
and the theoretical results using the proposed model ofeffective shear stiffness are shown to be consistent withthe shear behavior observed experimentally. By analyz-ing the proportion of shear and flexural deformation, itcan be concluded that the shear contribution to the totaldeformation for the diagonally cracked RECC column issignificant, especially for the RECC columns with lowshear span-to-depth ratios.
Acknowledgements
The authors acknowledge the funding supports of NationalNatural Science Foundation of China (Grant No. 51778462and 5141101015), and national key research and develop-ment plan, China (Grant No. 2016YFC0701400).
Open Access
This article is distributed under the terms of the CreativeCommons Attribution 4.0 International License (http://creativecommons.org/licenses/by/4.0/), which permits unrestricted use, distribution, and reproduction in any medium,provided you give appropriate credit to the original author(s)and the source, provide a link to the Creative Commonslicense, and indicate if changes were made.
References
Architectural Institute of Japan (AIJ). (1994). AIJ structural
design guidelines for reinforced concrete buildings, Tokyo.
ASCE-ACI Committee 445. (1998). Recent approaches on
shear design of structural concrete. Journal of Structural
Engineering, 124(12), 1375–1417.
Bentz, E. C. (2000). Sectional analysis of RC members. Ph.D.
thesis, Canada: University of Toronto.
Han, T. S., Feenstra, P. H., & Billington, S. L. (2003). Simu-
lation of highly ductile fiber-reinforced cement-based
composite components under cyclic loading. ACI Struc-
tural Journal, 100(6), 749–757.
Hsu, T. T. C., & Mo, Y. L. (2010). Unified theory of reinforced
concrete. Hoboken, New Jersey: John Wiley & Sons Ltd.
Ichinose, T. (1992). A shear design equation for ductile RC
members. Earthquake Engineering and Structural
Dynamics, 21(3), 197–214.
Jin, C., Pan, Z., Meng, S., & Qiao, Z. (2015). Seismic behavior
of shear-critical reinforced high-strength concrete columns.
Journal of Structural Engineering, 141(8), 04014198.
Kim, D. J., Kim, W., & White, R. N. (1998). Prediction of
reinforcement tension produced by arch action in RC beams.
Journal of Structural Engineering, 124(6), 611–622.
Kim, J. H. & Mander, J. B. (1999). Truss modeling of rein-
forced concrete shear-flexure behavior. Technical report
MCEER-99-0005. New York: Multidisciplinary center for
earthquake engineering research, State University of New
York at Buffalo, New York.
Li, V. C. (2012). Tailoring ECC for special attributes: a review.
International Journal of Concrete Structures and Materi-
als, 6(3), 135–144.
Li, V. C., & Leung, C. K. Y. (1992). Steady state and multiple
cracking of short random fiber composites. Journal of
Engineering Mechanics, 188(11), 2246–2264.
Li, V. C., Stang, H., & Krenchel, H. (1993). Micromechanics of
crack bridging in fiber reinforced concrete. Materials and
Structure, 26(162), 486–494.
Mo, Y. L., Zhong, J., & Hsu, T. T. C. (2008). Seismic simulation
of RC wall-type structures. Engineering Structures, 30(11),
3167–3175.
Naaman, A. E. (1987). High performance fiber reinforced
cement composites. In Proceedings of the IABSE sympo-
sium on concrete structures for the future, Paris, France
(pp. 371–376).
Pan, Z., & Li, B. (2013). Truss-arch model for shear strength of
shear-critical reinforced concrete columns. Journal of
Structural Engineering, 139(4), 548–560.
Pan, Z., Li, B., & Lu, Z. (2014). Effective shear stiffness of
diagonally cracked reinforced concrete beams. Engineering
Structures, 59(2), 95–103.
Pan, Z., Wu, C., Liu, J. W., et al. (2015). Study on mechanical
properties of cost-effective polyvinyl alcohol engineered
cementitious composites (PVA-ECC). Construction and
Building Materials, 78(3), 397–404.
Paulay, T., & Priestley, M. J. N. (1992). Seismic design of
reinforced concrete masonry buildings. New York: Wiley.
Schlaich, J., Schafer, K., & Jennewein, M. (1987). Toward a
consistent design of structural concrete. PCI Journal, 32(3),
74–150.
Won, P. S., & Vecchio, F. J. (2002). VecTor2 & formworks user’s
manual [EB/OL].\http://www.civ.utoronto.ca/vector/[.
Wu, C., Pan, Z., Su, R. K. L., Leung, C. K. Y., & Meng, S.
(2017). Seismic behavior of steel reinforced ECC columns
under constant axial loading and reversed cyclic lateral
loading. Materials and Structures, 50(1), 78.
Yoo, D. Y., & Yoon, Y. S. (2016). A review on structural
behavior, design, and application of ultra-high-performance
fiber-reinforced concrete. International Journal of Concrete
Structures and Materials, 10(2), 125–142.
International Journal of Concrete Structures and Materials (Vol.11, No.4, December 2017) | 597