Embed Size (px)
Citation preview
November/December 2015 ■ Volume 35, Number 6 ■ Published by the IEEE Computer Society
Theme ArticlesHuman-Centered Data Visualization
18 Guest Editors’ Introduction Xiaoru Yuan, Baoquan Chen, Koji Koyamada,
and Issei Fujishiro
In the big data era, we are witnessing an unprec-edented amount of information emerging from every aspect of society and daily life. Effectively handling and comprehending such data is key to gaining value and insight from them, and designing proper visualization and analysis tools is then critical for data interaction.
20 WordlePlus: Expanding Wordle’s Use through Natural Interaction and Animation
Jaemin Jo, Bongshin Lee, and Jinwook Seo
The interactive authoring tool WordlePlus is an extension of Wordle, a popular visualization technique that correlates word frequency with display size. Via pen and touch interaction, WordlePlus gives users more control over wordles by allowing them to manipulate word placement and groupings and incorporate visuals and animation.
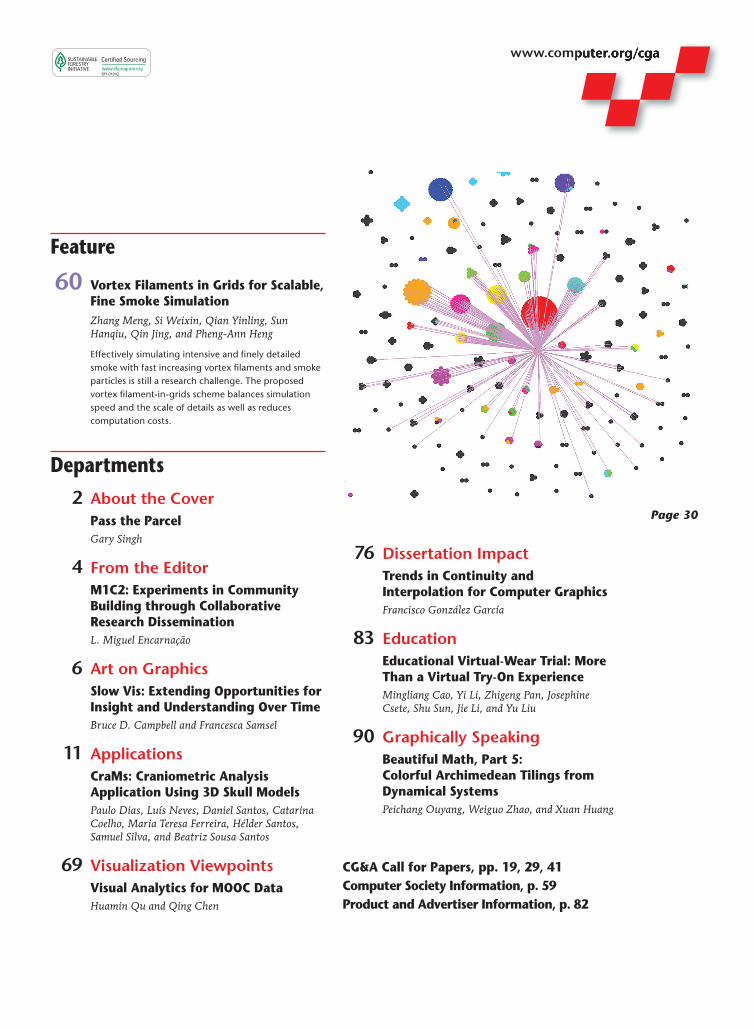
30 Key-Node-Separated Graph Clustering and Layouts for Human Relationship Graph Visualization
Takayuki Itoh and Karsten Klein
Many graph-drawing methods apply node-clustering techniques based on edge density to � nd tightly connected subgraphs and then hierarchically visualize the clustered graphs. The proposed graph visualization technique for attribute-embedded graphs separately visualizes the key nodes by accounting for a combination of connections and attributes.
42 ENTVis: A Visual Analytic Tool for Entropy-Based Network Traf� c Anomaly Detection
Fangfang Zhou, Wei Huang, Ying Zhao, Yang Shi, Xing Liang, and Xiaoping Fan
Entropy-based traf� c metrics have received much attention in network traf� c anomaly detection, but practical issues still hinder widespread adoption. The visual analytic tool ENTVis provides coherent visual analysis that makes entropy-based traf� c features more intuitive and helps users interpret network data and more quickly identify traf� c anomalies.
51 Angle-Preserving Quadrilateral Mesh Parameterization
Wenyong Gong, Xiaohua Xie, Rui Ma, and Tieru Wu
In response to the growing use of quadrilateral meshes in real-world applications, a method for the direct parameterization of quadrilateral meshes is now necessary. The two proposed algorithms map a topological disk surface onto a Euclidean plane and map a topological sphere surface onto a unit sphere.
Cover Art: Living in Harmony, © 2012 Avani Aggarwal. ISSN 0272-1716
c2.indd 2 10/22/15 1:19 PM
www.computer.org/cgawww.computer.org/cga
Feature
60 Vortex Filaments in Grids for Scalable, Fine Smoke Simulation
Zhang Meng, Si Weixin, Qian Yinling, Sun Hanqiu, Qin Jing, and Pheng-Ann Heng
Effectively simulating intensive and � nely detailed smoke with fast increasing vortex � laments and smoke particles is still a research challenge. The proposed vortex � lament-in-grids scheme balances simulation speed and the scale of details as well as reduces computation costs.
Dep artments
2 About the Cover Pass the Parcel Gary Singh
4 From the Editor M1C2: Experiments in Community
Building through Collaborative Research Dissemination
L. Miguel Encarnação
6 Art on Graphics Slow Vis: Extending Opportunities for
Insight and Understanding Over Time Bruce D. Campbell and Francesca Samsel
11 Applications CraMs: Craniometric Analysis
Application Using 3D Skull Models Paulo Dias, Luís Neves, Daniel Santos, Catarina
Coelho, Maria Teresa Ferreira, Hélder Santos, Samuel Silva, and Beatriz Sousa Santos
69 Visualization Viewpoints Visual Analytics for MOOC Data Huamin Qu and Qing Chen
76 Dissertation Impact Trends in Continuity and
Interpolation for Computer Graphics Francisco González García
83 Education Educational Virtual-Wear Trial: More
Than a Virtual Try-On Experience Mingliang Cao, Yi Li, Zhigeng Pan, Josephine
Csete, Shu Sun, Jie Li, and Yu Liu
90 Graphically Speaking Beautiful Math, Part 5:
Colorful Archimedean Tilings from Dynamical Systems
Peichang Ouyang, Weiguo Zhao, and Xuan Huang
CG&A Call for Papers, pp. 19, 29, 41Computer Society Information, p. 59Product and Advertiser Information, p. 82
Page 30
g6toc.indd 1 10/22/15 1:25 PM
![Newdle: Interactive Visual Exploration of Large Online News … · 2012-03-09 · Newdle, which stands for News Wordles, since wordles [11] are its major visual metaphor. Because](https://img.pdfslide.us/doc/110x75/5f3c1150e41a52794b5fd6cb/newdle-interactive-visual-exploration-of-large-online-news-2012-03-09-newdle.jpg)