Embed Size (px)
Citation preview

\A LABORATORY EVALUATION OF THE DPD AND LEUCO
CRYSTAL VIOLET METHODS FOR THE ANALYSIS OF
RESIDUAL CHLORINE DIOXIDE IN WATER/
by
Norma Jane\, Hood!;
Thesis submitted to the Graduate Faculty of the
Virginia Polytechnic Institute and State University
in partial fulfillment of the requirements for the degree of
MASTER OF SCIENCE
in
Environmental Sciences and Engineering
APPROVED:
f Grigory D. Boardman
Robert C. Hoehn, Chairman
October, 1977
Blacksburg, Virginia
Robert E. Benoit
For my Mom and Dad
Their understanding and support
made it all possible.
ii

ACKNOWLEDGMENTS
The author would like to thank Dr. Robert Hoehn for his inspi-
ration and guidance throughout the course of this research, and for
his review of this manuscript. Sincere appreciation is also expressed
to Dr. Robert Benoit and Dr. Gregory Boardman for their help and
service as members of the graduate committee.
The value of the friendship and help given by Mr. Glen Willard
can never be underestimated or forgotten.
The assistance and understanding offered by fellow inmates of
325 Norris will be long remembered, and their friendships treasured.
The author would like to express special gratitude to John Riding,
Bill Elliott, Steve Clark, Ryland Brown, Bill and Jean Lorenz, Perry
Gayle, Pete Shelley, Don Barnes, and Barbara Thompson for their help
in maintaining a proper attitude towards research in particular, and
1 if e in genera 1 •
; ii

TABLE OF CONTENTS
DEDICATION . . .
ACKNOWLEDGMENTS
LIST OF TABLES .
LIST OF FIGURES
Chapter
I.
II.
III.
INTRODUCTION . . .
LITERATURE REVIEW
General Properties of Chlorine Dioxide . Reaction with Phenols ..... Reactions with Organic Compounds .. Taste and Order Control .... Manganese and Iron Remova 1 . . . . . Synthesis of Chlorine Dioxide .. Chlorine Dioxide as a Disinfectant . Alternative Disinfectants Considerations of Water Reuse Residual Analysis
MATERIALS AND METHODS . . . . . .
Basic Laboratory Procedures . Generation of Chlorine Dioxide Stock Chlorine Solutions Working Standards pH Studies . . • • . . . . . . . . . . . DPD Color Development . . . ... Leuco Crystal Violet . . . . .....•.... Statistical Method ...... . Cl02 in the Presence of Chlorine ....•.
iv
Page
ii
iii
vi
ix
1
3
3 6 8
10 11 12 14 20 23 24
35
35 35 37 39 39" 40 41 44 44
Chapter
IV.
v. VI.
APPENDIX
A
B
c VITA ••
ABSTRACT
Page
RESULTS AND DISCUSSION ...•. 47
pH Studies . . . • . • • . . • . . . • . . . . . . . 47 Spontaneous Color Development 54 Statistical Analyses . . . • . . . . . . . . . 64 Determination of c102 in the Presence
of Cl2 . . . . . . . . . . . . . . . 72
SUMMARY AND CONCLUSIONS
LITERATURE CITED . . . . .
REAGENTS
BUFFERS
RAW DATA TABLES
v
76
78
85
89
92
113

Table
l
2
3
4
5
6
7
8
9
LIST OF TABLES
Selected Properties of Chlorine Dioxide
Inactivation of Poliomyelitis Virus by Chlorine and Chlorine Dioxide ....
Relative Sporacidal Effectiveness of Chlorine and Chlorine Dioxide on the Basis of OTA Residual, mg/l, Required for 99 Percent Kill ...•.....
Calculating Formulae for Chlorine Species Determined by the DPD Titration Procedure
Chlorine Recovery in Demand-Free Water by Amperometric Titration ...
pH of DPD Reagents in Solution
Changes in Absorbance of DPD Reagent in Demand-Free, Unbuffered Water Resulting from Incremental Changes in pH ....
Timed DPD Titration of Cl02 and Cl2 in Demand-Free Water, as Volume (mls) of Standard FAS Required to Discharge Color in the Sample ......•...•..•
Timed DPD Titration of Cl02 and Cl2 in Secondary Effluent, as Volume (mls) of Standard FAS Required to Discharge Color in the Sample . . . . . . . . . . • . . .
10 Results of the T-Test on the Mean Recoveries of Free Chlorine and Total Chlorine by
11
LCV and DPD . . . . . . . . . . . . . . . . .
Results of the F-Test on the Sample Variances of the Free Chlorine and Total Chlorine Analyses by DPD and LCV . . . • . . . . . . .
vi
Page
4
19
21
30
36
48
50
62
63
69
71
Table Page
12 Results of the DPD Titration of Chlorine--Chlorine Dioxide Mixtures in Demand-Free
13
APPENDIX
Al
A2
Bl
B2
Cl
C2
C3
C4
C5
C6
Water . . . . . • . . . . . . . . . . . . .
The Determination of Chlorine Dioxide in the Presence of Chlorine in Demand-Free Water by Leuco Crystal Violet ..... .
Reagents for the DPD Method . . . . .
Reagents for the Leuco Crystal Violet Procedure • . . . • . . . .
S~rensen Phosphate Buffers
Mcilvaine Citrate-Phosphate Buffers
Increase in Absorbance with Time at Controlled pH ...•.•.....
DPD Timed Color Development in Demand-Free Water--Spectrophotometric Method ...
DPD Timed Color Development in Filtered Secondary Effluent--Spectrophotometric Method . . . . . . . . . . . . . .
Chlorine Dioxide as Total Available Chlorine by the DPD Method ....
Chlorine Dioxide as Free Available Chlorine by the DPD Method ....
Chlorine Dioxide as Total Available Chlorine by the Leuco Crystal Violet ~1ethod . . . . . . . . . . . . . . .
Cl Chlorine Dioxide as Free Available Chlorine by the Leuco Crystal Violet ~1ethod . . . . . . . . . . . . . . .
vii
73
74
86
87
90
91
93
94
96
98
99
100
101
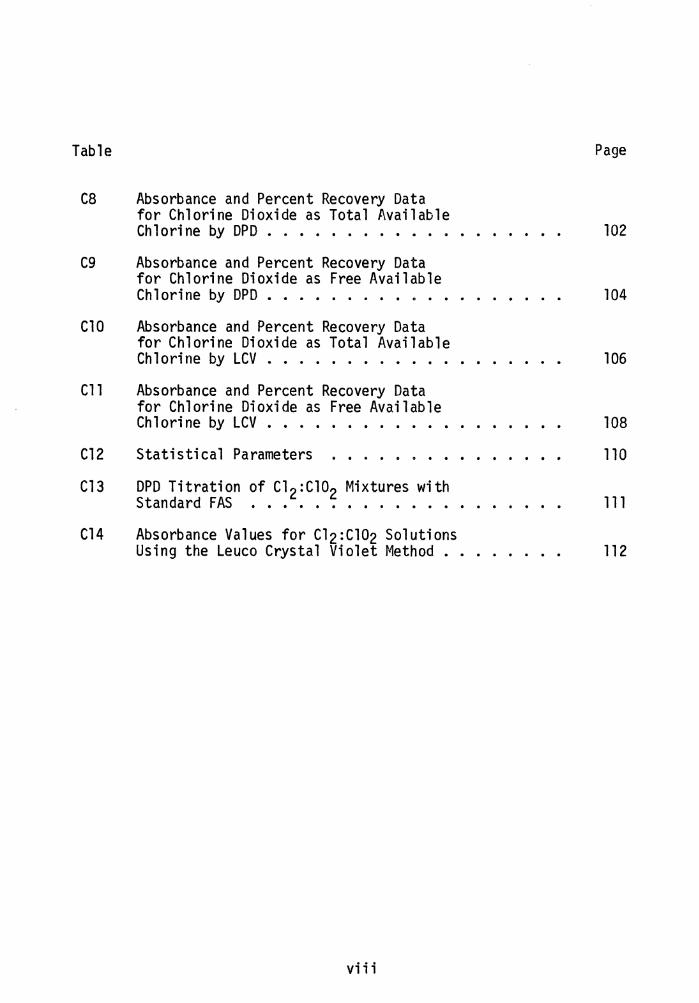
Table Page
ca Absorbance and Percent Recovery Data for Chlorine Dioxide as Total Available Chlorine by DPD . . . . . . . . . . . . . . . . . . . 102
C9 Absorbance and Percent Recovery Data for Chlorine Dioxide as Free Available Chlorine by DPD • . . . . . . . . . . . . . . . . . . 104
ClO Absorbance and Percent Recovery Data for Chlorine Dioxide as Total Available Chlorine by LCV . . . . . . . . . . . . . . . . . . . 106
Cll Absorbance and Percent Recovery Data for Chlorine Dioxide as Free Available Chlorine by LCV . . . . . . . . . 108
Cl2 Statistical Parameters 110
Cl3 DPD Titration of c1 2:c102 Mixtures with Standard FAS . . . . . . . . . . . . . . . . . . . . 111
Cl4 Absorbance Values for Cl2:Cl02 Solutions Using the Leuco Crystal Violet Method .. . . . . . . 112
viii

LIST OF FIGURES
Figure
1. Sequential chlorination of phenol ...
2.
3.
Comparison of the bactericidal effects of Cl2 and Cl02 or E. coli at different temperatures and-pH-wrth five minutes contact time .......... .
Effect of contact time on survival of E. coli suspended in sterile sewage effluent at 24oc .......... .
4. Effect of contact time on disinfectant
Page
7
15
17
utilization. . . . . . . . . . . . . . . . . . . . . 18
5.
6.
7.
8.
9.
10.
11.
12.
Typical absorbance spectra of c10-2 and HOCl . . . . . . . . . . . . . .
Absorption secptrum of DPD-Cl02 color complex .......... .
Schematic diagram of the chlorine dioxide generator ....... .
Stability with time of the leuco crystal violet color complex ..
Change in absorbance with time of DPD reagent, without DPD buffer, in demand-free water at a controlled pH .....
Change in absorbance with time of DPD reagent, with DPD buffer, in demand-free water at a controlled pH .....
Change in absorbance with time of DPD reagent, with DPD buffer, in demand-free water at a controlled pH .....
Time color development of DPD in demand-free water containing Cl2 or r102. Sample left in instrument light path between readings ................ .
ix
31
32
38
43
51
52
53
55

Figure Page
13. Time color development of DPD in demand-free water containing Cl2 or Cl02. Sample placed in room light between readings. . . . . . . . 56
14. Time color development of DPD in demand-free water containing Cl2 or Cl02. Sample removed to darkness between readings . . . . . . . . 57
15. Timed color development of DPD in secondary effluent containing Cl2 or Cl02. Sample left in instrument light path between readings . . . . . . . . . . . . . . . . . . 58
16. Timed color development of DPD in secondary effluent containing Cl2 or Cl02. Sample placed in room light between readings. . . . . . . . 59
17. Timed color development of DPD in secondary effluent containing Cl2 or c102. Sample placed in darkness between readings. . . . . . . . . 60
18. Standard curve for Cl02 as total available chlorine by DPD, mean absorbance vs mean concentration . . . . . . . . . . . . . . . . . 65
19. Standard curve for Cl02 as free available chlorine by DPD, mean absorbance vs mean concentration . . . . . . . . . . . . . . . . . 66
20. Standard curve for Cl02 as total available chlorine by LCV, mean absorbance vs mean concentration . . . . . . . . . . . . . . . . . 67
21. Standard curve for Cl02 as total available chlorine by LCV, mean absorbance vs mean concentration . . . . . . . . . . . . . . . . . 68
x

I. INTRODUCTION
The disinfection of water and wastewater has been practiced
in the United States since the beginning of this century. The most
commonly employed disinfecting agents are chlorine and chlorine com-
pounds. Until recently, the only major problems thought to be
generated by the use of chlorine have been those of (1) tastes and
odors in community water supplies attributable to chlorophenolic
compounds generated by reactions between chlorine and phenolic
compounds and (2) the large quantities of chlorine required in sewage
treatment to produce a specific residual in the presence of high
concentrations of ammonia.
Recent investigations have indicated that potentially
carcinogenic compounds are formed when waters containing 11 precursor 11
organics are chlorinated (1, 2). These compounds include chloroform,
bromodichloromethane, dibromochloromethane, and bromoform.
A second problem that has been demonstrated is the failure
of chlorine to inactivate virus particles (3, 4). The escape of
viruses into a public water supply could be of immediate concern due
to the significance of water as a vector in certain viral diseases (5).
Many substitutes for chlorine have been investigated as
disinfectants. Among them are ozone, bromine, bromine chloride,
iodine, ultraviolet radiation and chlorine dioxide (6, 7, 8, 9, 10,
11). Of these, there has been a great deal of interest in chlorine
l
2
dioxide. This compound has found wide spread use as a bleaching
agent, especially in the pulp industry (12), and for prechlorination
in areas where high concentrations of phenols and ammonia from
industrial wastes makes the use of chlorine impractical (13). It
has been shown that chlorine dioxide does not react with ammonia
(14) or trihalomethane 11 precursor 11 compounds (1). Chlorine dioxide
as a water and sewage disinfectant has been investigated and was
found to be superior to chlorine (15, 16).
In the waste water industry chlorine dioxide is most fre-
quently generated from solutions of chlorine and sodium chlorite.
This process is not 100 percent efficient and some chlorine may
leave the generator (19). The increasing use of c102 for water
disinfection and taste and odor control makes it imperative that a
rapid and accurate method be available to determine the various
chlorine species present. DPD and leuco crystal violet are both
currently accepted for the analysis of chlorine (32), and DPD has
been proposed for chlorine dioxide (62). These methods have been
compared individually to starch-iodide (67) for the determination of
chlorine residuals, but they have not been directly compared to each
other. There is no published data on the analysis of chlorine
dioxide by leuco crystal violet. The purpose of this study, there-
fore, was to investigate the DPD and leuco crystal violet methods of
analysis to determine if chlorine dioxide in the presence of chlorine
could be accurately analyzed by either, or both, of these methods.
II. LITERATURE REVIEW
General Properties of Chlorine Dioxide
Chlorine dioxide, in its elemental form, is a greenish yellow
gas with a distinctive odor similar to that of chlorine. It was first
prepared by Davy (18) in the nineteenth century by the addition of
strong acid to sodium chlorate. This reaction:
[l]
is still the basis of commercial production (14). Selected properties
of this compound are given in Table 1.
Chlorine dioxide is five (14) to ten (17) times more soluble
in water than chlorine. Solubility may be increased by using chilled
water as the solvent (16). Chlorine dioxide, unlike Cl2, does not
react with water and forms a true gas-dissolved-in-water system.
This explains the extreme volatility of Cl02 solutions stored in open
vessels. Loss of titer of from seven to thirty percent may occur
(15).
Exposure to visible and ultraviolet radiation results in slow
photodecomposition (14). In the gaseous phase, decomposition begins
with the formation of a red liquid that eventually becomes colorless.
The products of decomposition are: chlorine heptoxide (Cl207),
chlorine monoxide (ClO), thlorine (Cl2) and possibly oxygen (14).
Chlorate (Clo-3) and chloride (c1-) are the products of decomposition
of Cl02 solutions.
3
4
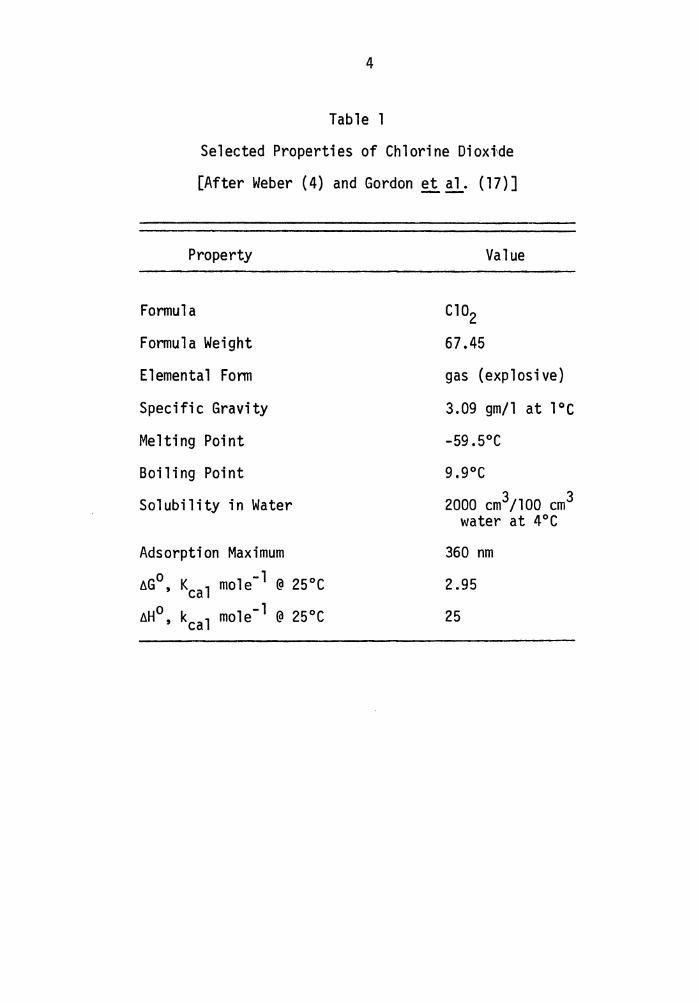
Table 1
Selected Properties of Chlorine Diox~de
[After Weber (4) and Gordon et~- (17)]
Property
Formula
Formula Weight
Elemental Fann
Specific Gravity
Melting Point
Boiling Point
Solubility in Water
Adsorption Maximum
6G0 , Kcal mole-1 @ 25°C
6H 0 , kcal mole- 1 @ 25°C
Cl02
67.45
Value
gas (explosive)
3.09 gm/l at 1°C
-59.5°C
9.9°C
2000 cm3/100 cm3 water at 4°C
360 nm
2.95
25

5
The instability of liquid and gaseous chlorine dioxide are
well known (18). Explosions on the magnitude of hydrogen-oxygen
explosions have been known to occur when the temperature is raised,
with exposure to light, during transfer from one container to another,
or when contact is made with organic materials (14). Instability to
this degree makes the production and shipment of bulk quantities of
pure chlorine dioxide impractical and undesirable.
Chlorine dioxide may be stabilized by keeping it in concentra-
tions of less than ten percent in air or nitrogen. Cl02 is not
thermodynamically stable in water solutions, but reaction rates with
chlorine in other oxidation states are slow (17), making aqueous
solutions relatively safe to handle.
Chlorine dioxide's explosiveness is directly related to its
powerful oxidizing capacity. In aqueous solution, Cl02 does not
hydrolyze to HOCl (19), and so its oxidizing capacity cannot tech-
nically be termed as "free-available chlorine. 11 It can be considered
to have an "available chlorine" content equal to 263 percent of
chlorine. This follows from the fact that chlorine dioxide under-
goes five valence changes during reduction from Cl02 to Cl-. Chlorine
dioxide is 52.6 percent chlorine by weight, and, by undergoing the
five valence changes yields an equivalent available chlorine content
of 52.6 x 5 = 263 percent.
In water systems, Cl02 seldom undergoes complete reduction,
the common reaction being reduction to chlorite, c10-2. Complete

6
reduction to chloride, c1-, requires low pH (20). Chlorine, however,
is routinely reduced to c1- (14):
The redox potentials of the couples involved are shown by
the following (14):
Cl02 + e- = Cl02- E0 = l.15V [3]
[4] HOCl + H+ + 2e- = c1- + H20 Eo = l.49V
Consideration of the E0 values leads one to the conclusion that,
except under special conditions, chlorine is generally the better
oxidant when they are compared in aqueous solutions. The literature
often gives the impression that the reverse is true because of the
five possible valence changes associated with Cl02.
Reactions with Phenols
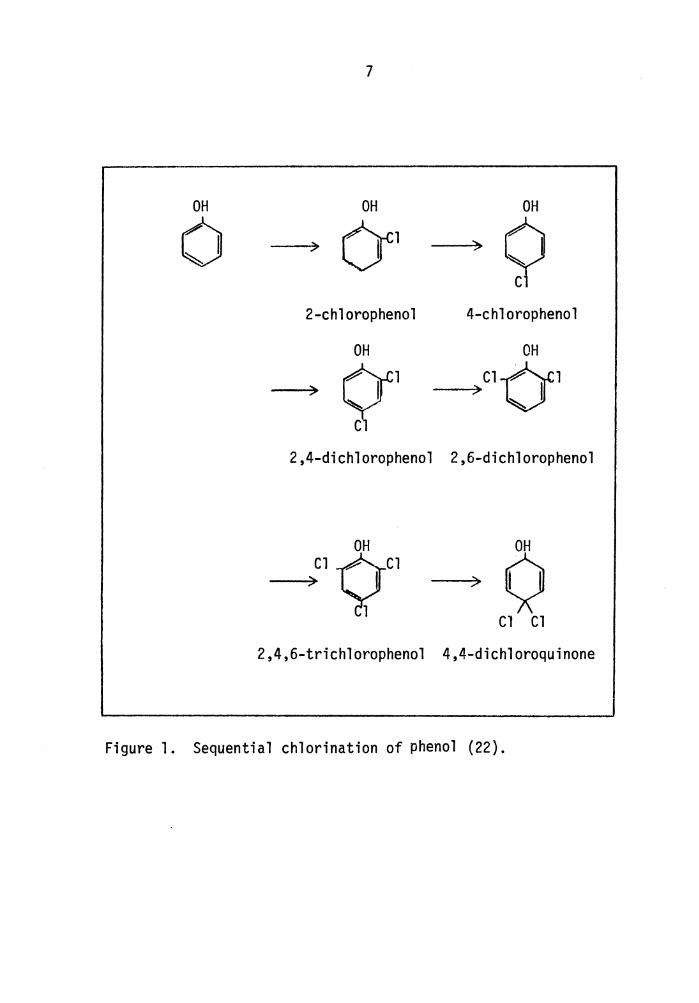
One of the major problems in the water works industry involves
chlorophenols. These compounds are formed when a raw water containing
phenolic industrial wastes is chlorinated (21). The chlorination of
phenol is believed to proceed in a stepwise fashion (22). This
sequence is illustrated in Fig. 1. All of these compounds contribute
to the taste and odor problem, with the main contributor being 2, 6-
dichlorophenol.
OH
0
7
OH OH
> Cr > 9 2-chlorophenol 4-chlorophenol
OH OH
) (tl > Cl-c:ri Cl
2,4-dichlorophenol 2,6-dichlorophenol
OH Cl YCl ) --> ¢
Cl Cl
2,4,6-trichlorophenol 4,4-dichloroquinone
Figure 1. Sequential chlorination of phenol (22).

8
The presence of ammonia inhibits the formation of chloro-
phenols, most likely by consuming the available chlorine. The rates
of reaction and the isomers formed are dependent to a large extent
on pH (23).
The reaction of phenols and chlorine dioxide is one of the
exceptions to the generality that C102 is normally reduced only to
c10-2. In these reactions, Cl02 can undergo six valence changes,
acting with the oxidizing capacity of 315.6 percent available
chlorine (16). Mixtures of phenols or chlorophenols are oxidized
directly to the innocuous trichlorophenol (24).
In these reactions, chlorine dioxide is not reacting by
direct substitution. The reduction to c10-2 occurs through one
electron transfer, and it is the c10-2 ion that reacts as a nucleophile
itself, or yields reactive intermediates which cause the observed
chlorinations (14).
Reactions with Organic Compounds
The reaction of chlorine dioxide with organic compounds is
dependent to a large extent on the structure of the compounds in-
volved. In some instances, chlorine dioxide oxidation causes carbon-
carbon cleavage, giving rise to a variety of oxygen containing com-
pounds (17, 25). The reactions of chlorine dioxide with amines (17)
and those reactions involved in the delignification of cellulose (26)
have been extensively investigated. The mechanism of reaction depends
to a large extent on the structure of the amine.
9
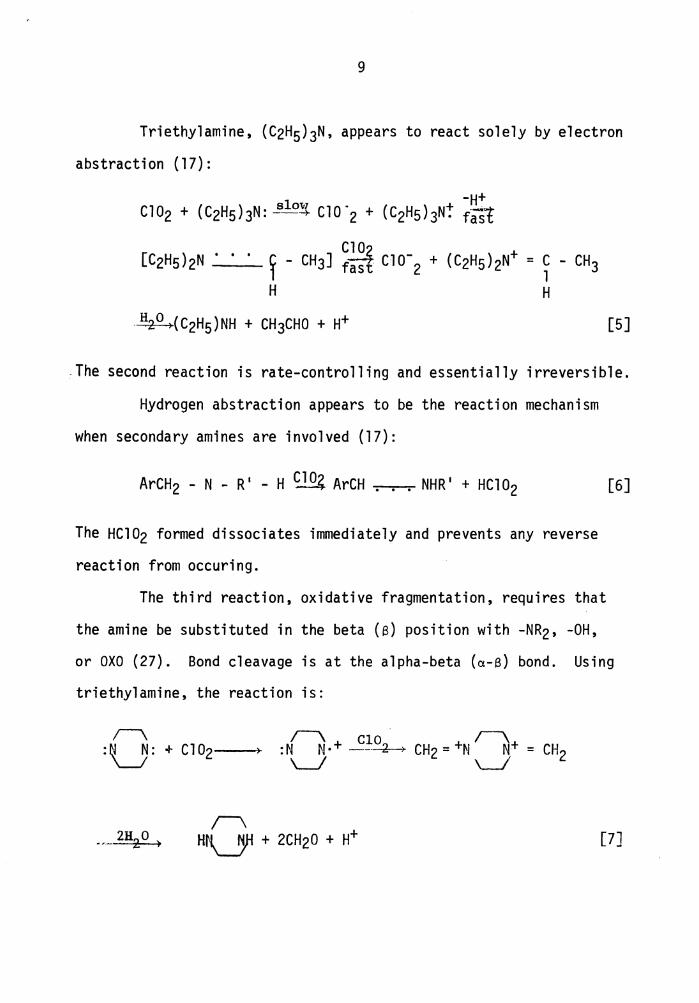
Triethylamine, (C2H5)3N, appears to react solely by electron
abstraction (17):
C!_<J_f [C2H5)2N . . . ~ - CH3] ~ Clo-2 + (C2H5)2N+ = ~ - CH3
H H
-~(C2H5)NH + CH3CHO + H+ [5]
.The second reaction is rate-controlling and essentially irreversible.
Hydrogen abstraction appears to be the reaction mechanism
when secondary amines are involved (17):
ArCH2 - N - R1 - H Clo~ ArCH ... NHR 1 + HCl02
The HC102 formed dissociates immediately and prevents any reverse
reaction from occuring.
[6]
The third reaction, oxidative fragmentation, requires that
the amine be substituted in the beta (s) position with -NR2, -OH,
or OXO (27). Bond cleavage is at the alpha-beta (a-S) bond. Using
triethylamine, the reaction is:
/\ ClO I\ :N N·+ --~ CH2 = +N N+ = CH2 \_/ \_/
[7]
10
As with electron abstraction, two moles of chlorine dioxide are
required for each mole of amine involved.
In general, amines are reactive in the order tertiary>
secondary > primary > t-butylamine, which is unreactive.
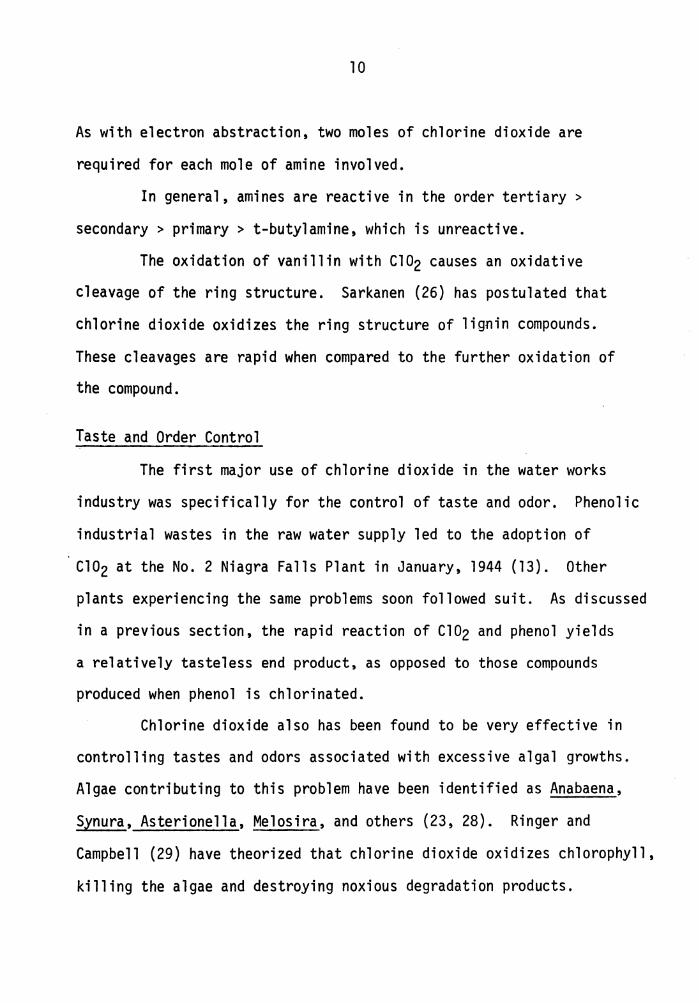
The oxidation of vanillin with c102 causes an oxidative
cleavage of the ring structure. Sarkanen {26) has postulated that
chlorine dioxide oxidizes the ring structure of lignin compounds.
These cleavages are rapid when compared to the further oxidation of
the compound.
Taste and Order Control
The first major use of chlorine dioxide in the water works
industry was specifically for the control of taste and odor. Phenolic
industrial wastes in the raw water supply led to the adoption of
Cl02 at the No. 2 Niagra Falls Plant in January, 1944 {13). Other
plants experiencing the same problems soon followed suit. As discussed
in a previous section, the rapid reaction of Cl02 and phenol yields
a relatively tasteless end product, as opposed to those compounds
produced when phenol is chlorinated.
Chlorine dioxide also has been found to be very effective in
controlling tastes and odors associated with excessive algal growths.
Algae contributing to this problem have been identified as Anabaena,
Synura, Asterionella, Melosira, and others {23, 28). Ringer and
Campbell {29) have theorized that chlorine dioxide oxidizes chlorophyll,
killing the algae and destroying noxious degradation products.

11
Manganese and Iron Removal
In addition to controlling taste and odor, chlorine dioxide
has been used successfully for the removal of manganese and iron
(14). Free chlorine oxidation of manganese (30):
Mn++ fre~ __ chlor_~ MnO residual 2 [8]
proceeds very slowly, frequently resulting in the precipitation of
black manganese dioxide, Mno2, in the distribution mains. Chlorine
dioxide, with its greater oxidizing capacity, reacts much faster,
and manganese is effectively removed prior to the treated water
entering the distribution system (23).
The overall reaction:
2Cl02 + MnS04 + 4NaOH + Mn02 + + 2NaC102 + Na2S04 + 2H20 [9]
is most efficient under alkaline conditions, and the process is
generally preceded by prechl orination to satisfy the chlorine de-
mand of other compounds in the water.
The decision of whether or not to use chlorine dioxide rather
than chlorine for the removal of iron is based largely on economic
considerations.
Chlorine dioxide does not react with ammonia, and may be the
chemical of choice in waters with a high chlorine demand due to
ammonia. The reaction:
[10]
12
requires an alkaline pH, the exact value being determined by jar
tests.
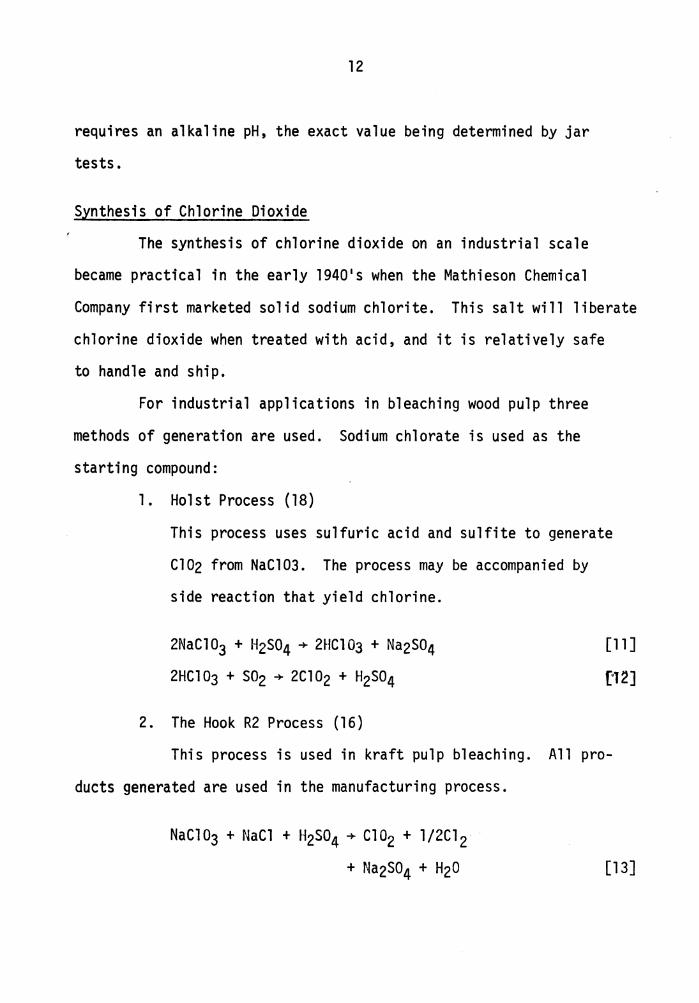
Synthesis of Chlorine Dioxide
The synthesis of chlorine dioxide on an industrial scale
became practical in the early 1940 1 s when the Mathieson Chemical
Company first marketed solid sodium chlorite. This salt will liberate
chlorine dioxide when treated with acid, and it is relatively safe
to handle and ship.
For industrial applications in bleaching wood pulp three
methods of generation are used. Sodium chlorate is used as the
starting compound:
1. Holst Process {18)
This process uses sulfuric acid and sulfite to generate
Cl02 from NaC103. The process may be accompanied by
side reaction that yield chlorine.
2NaCl03 + H2S04 + 2HC103 + Na2S04 2HC103 + S02 + 2Cl02 + H2S04
2. The Hook R2 Process {16)
[11]
['12]
This process is used in kraft pulp bleaching. All pro-
ducts generated are used in the manufacturing process.
NaCl03 + NaCl + H2S04 + Cl02 + l/2Cl 2
+ Na2S04 + H20 [13]
13
3. The Kesting Process (18}
This is a continuous process using the chlorine produced
to regenerate sodium chlorate from NaCl in chlorate cells.
2NaC103 + 4HC1 + 2Cl02 + Cl2 + 2NaCl + 2H20
In all of these processes, chilled water is used to collect the
chlorine dioxide as it is swept from the generators.
Sodium chlorite, NaCl02, is used to generate the Cl02 used
in bleaching textiles, oils, fats, and flour, and in the purifica-
tion of water. The process is simple, and the Cl02 produced is
purer ( 17}.
[14]
In the water works industry chlorine dioxide is generated
from sodium chlorite by reaction with chlorine in a two-step reaction
( 30};
Cl2 + H20 + HOCl + HCl
HOCl + HCl + NaCl02 + 2Cl02 + 2NaCl + H20
[15]
[16]
The pH in the reactor is approximately 3.5, and a chlorine~
to-chlorite ratio of 1 :2 (31) is maintained to ensure that no po-
tentially toxic chlorite enters the system (20).
Chlorine dioxide generation on a laboratory scale is generally
by the acidification of a sodium chlorite solution. The gas evolved
is passed through a sodium chlorite scrubber to produce a product of
high purity, and free from chorine (31, 32).

14
Chlorine Dioxide as a Disinfectant
The bactericidal properties of chlorine dioxide were of
secondary importance when this compound first came into use. In
1944, McCarty (9) reported Cl02 to be an effective germicide in
waters having a low organic content. In 1948, Aston and Synan (33)
suggested that it be used to satisfy the chlorine demand of a water
prior to disinfecting with chlorine.
Ridenour and Armbruster (34) investigated the bactericidal
properties of chlorine dioxide over a wide range of conditions. Their
data indicated that Cl02:
1. is bactericidal to corrmon water pathogens, including
~·coli, Shigella dysenteriae, Salmonella paratyphi B,
Pseudomonas aeruginosa, and Staphylococcus aureus.
2. exhibits increasing disinfection efficiency with in-
creasing pH.
3. disinfection is effective at the same or lower residuals
as chlorine.
4. water pathogens are destroyed at the same or lower
residuals than~- coli, providing the rationale for con-
sidering the presence or absence of E. coli as a valid
indication of disinfection efficiency.
Ridenour and Armbruster did find that the efficiency of
chlorine dioxide as a disinfectant was reduced at low temperatures,
but this decreased efficiency may be offset by increasing the pH.
This phenomenon is illustrated in Figure 2.

100 r, . . • ' • I I I 100 ' ' 90 !.\. ' ' -t 20°c ... 5°C 90 ' ' ' ' ' ' ' 80 U.\ \ ' , C1 2 pH 9.5 -I 80
' \ ' ' .µ ..... 70 ~ s:: 70 ..... QJ ' ...... QJ u
' ...... u ~ ....... ~ QJ 60 '~1 2 pH 9.5 ...... QJ a.. 0.... ....... 60 .. .. C"> ' C"> s:: ' \ s:: .,.... .,.... s:: ' s:: .,....
50 ....... \ 50 -~ n:s -E ...,. - \ E QJ QJ c:: \ c:: Vl 40 40 Vl
__, E ' E U'I Vl \ Vl .,.... .,.... c:
\ s:: n:s n:s C"> 30 30 ti ~ \ 0 0
\ C1 2 pH 7 20 I- \ \ "' +. \ ' "' -t 20
\ \
lo L \ '\102 pH 9.5 ~ ..i.. \ \ -I 10 C1 2pH7 I -
I \. 'i I o I ~ ~ I I I I 0 0.0 0.02 0.04 0.06 0.0 0.02 0.04 0.06
Cl 2 or c102 added, mg/1 by weight
Figure 2. Comparison of the bactericidal effects of Cl~ and c102 on I_. coli at different temperatures and pH with five minu es contact time ""(321T.

16
Bernarde et ~· (35, 36) have conducted extensive investiga-
tions with chlorine dioxide. They concluded, as did Ridenour and
Armbruster (34), that c102 disinfection was adversely affected by
decreased temperature. In studies conducted using £_. coli in sterile,
secondary-treated sewage effluent, their findings differed from those
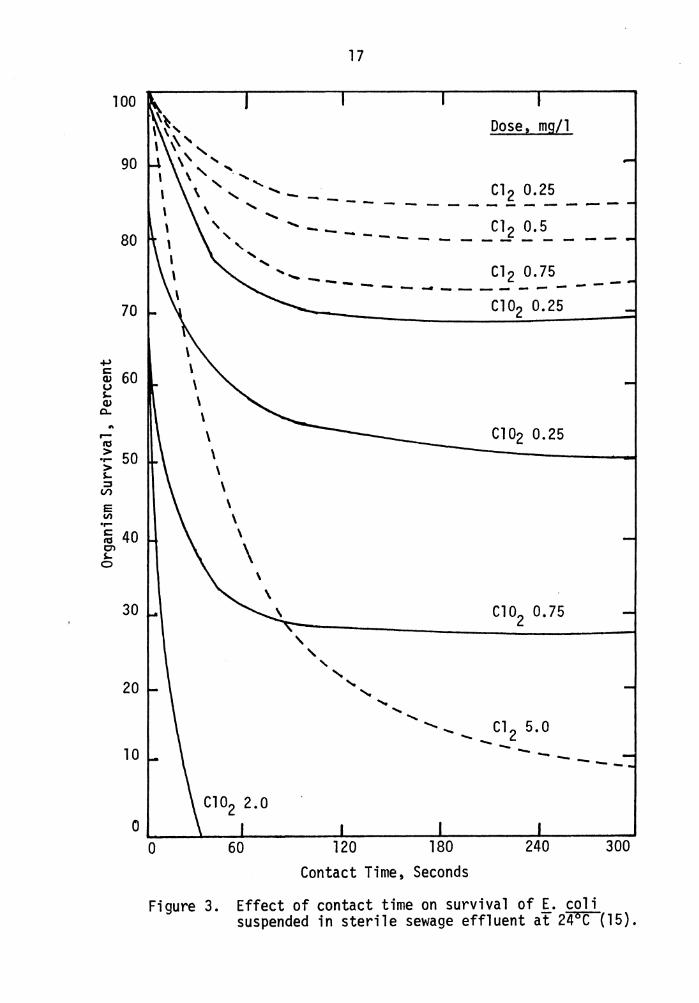
of McCarty (9). Figures 3 and 4 show the effect of contact time on
organism survival and disinfectant utilization. From these studies,
it can be seen that chlorine dioxide achieved complete removal in 30
seconds at a dosage of 20 mg/l. Chlorine required a five-minute
contact time and a dosage of 5.0 mg/l to effect a 90 percent removal.
Studies conducted by Ridenour and Ingels (37) in 1946 on the
virucidal nature of chlorine dioxide showed that an orthotolidine-
arsenite (OTA) residual of 0.2 ppm c102 caused inactivation of
poliovirus. The data presented in Table 2 shows a slightly lower
Cl02 residual required for virus inactivation than that required by
chlorine, but the investigators considered this difference to be
within the range of experimental error.
The effectiveness of chlorine dioxide as a sporicide was in-
vestigated by Ridenour et ~· (38) in 1949. Spore suspensions of
various Bacillus species were inoculated into both a demand-free
medium and a medium having a chlorine demand. Compared on an equal
OTA residual basis, chlorine dioxide was a more effective sporicide
than chlorine and also appeared to be more effective against spores
than vegetative cells. In a medium exerting a chlorine demand,
100
90
80
70
.µ c: 60 QJ u "" QJ
0...
,.... n:s > 50 •r-> "" ::s
V>
E II)
•r-c: 40 n:s en "" 0
30
20
10
0
17
,"~, ' ~ ', ,, '
Dose, mg/l
\' '· ..... \ ', .......... __ _ - - Cl 2 0.25
\
' '
\ \ \
' '
\ \
\
.....
\
\
----------...... --- ------ - _c~ ~-~ -
'--- Cl2 0.75 ... -- - -- .... ---- -- - -- - - --Cl02 0.25
Cl02 0.25
Cl02 0.75
' ' ' ' " ' .... ..... ' " Cl 2 5.0 ----- --- --
Cl02 2.0
0 60 120 180 240 300 Contact Time, Seconds
Figure 3. Effect of contact time on survival of E. coli suspended in sterile sewage effluent at 24'°C""(l5).

l.O
0.9
0.8
0.7
.... ....... C'l s 0.6 .. ....., c: CtS ....., u cu If- 0.5 c:
\
' \ \ \ \
18
Sterile Sewage Effluent
1.5 x 10⁴ cells/ml £_. coli
pH 8.5
Temperature 24°C
.,.. Cll \ Dose mg/l .,.. c .... CtS
.g 0. 4 \ ·:;; \ cu
0::: \
0.3 '
' 0.2
0.1
\ \
\ , ________ 31~_o.15 ____ _
Cl 2 0.75
, Cl02 0.5 .... _ ------- - - - -- - - - - - - -
Cl02 0.25
Cl 2 0.25
180 240 Contact Time, Seconds
300
Figure 4. Effect of contact time on disinfectant utilization ( 15).

19
Table 2
Inactivation of Poliomyelitis Virus by Chlorine and Chlorine Dioxide
[After Ridenour and Ingols (37)]
Disinfectant ppm Applied
Cl 2 10
Cl02 5
5
3
c.102 + Cl 2 6
5
5
3
aorthotolidine-arsenite b not reported
Residual, mg/l (measured by OTAa), required for inactivation after
contact time shown
10 minutes 30 minutes
0.30 0. 10
0 .10 0 .10
0.20 b
b 0.50
0.07 b
0.20 b
b 0.10 b 0.05
20
chlorine must be applied beyond the breakpoint before sporicidal
efficiency is reached. Chlorine dioxide requires much lower
residuals to effect spore kill. Results of this study are summarized
in Table 3.
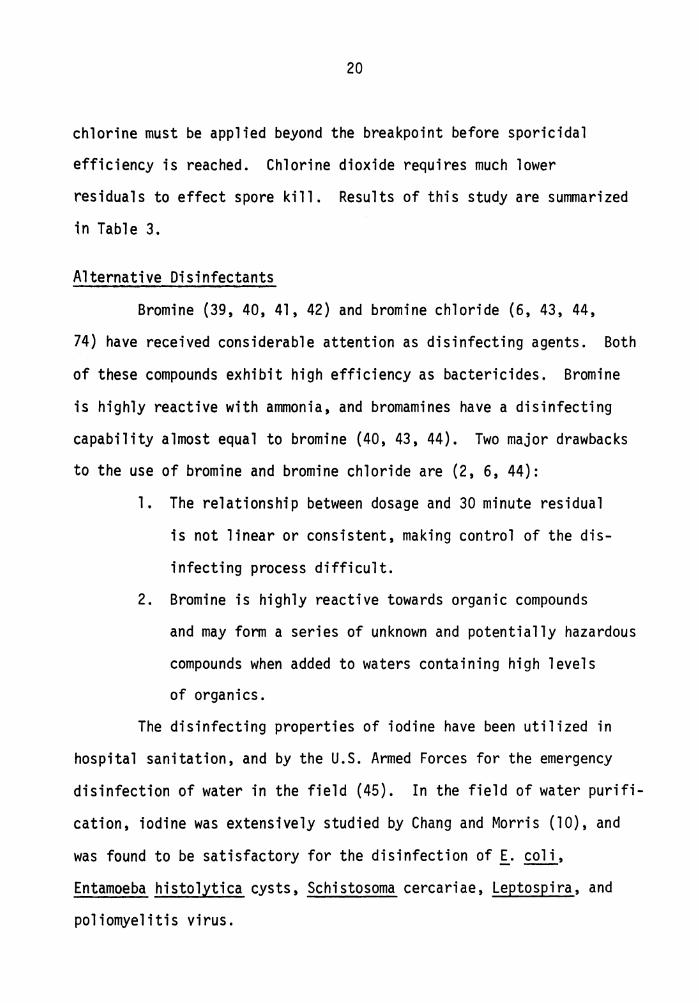
Alternative Disinfectants
Bromine (39, 40, 41, 42) and bromine chloride (6, 43, 44,
74) have received considerable attention as disinfecting agents. Both
of these compounds exhibit high efficiency as bactericides. Bromine
is highly reactive with ammonia, and bromamines have a disinfecting
capability almost equal to bromine (40, 43, 44). Two major drawbacks
to the use of bromine and bromine chloride are (2, 6, 44):
1. The relationship between dosage and 30 minute residual
is not linear or consistent, making control of the dis-
infecting process difficult.
2. Bromine is highly reactive towards organic compounds
and may form a series of unknown and potentially hazardous
compounds when added to waters containing high leve.ls
of organics.
The disinfecting properties of iodine have been utilized in
hospital sanitation, and by the U.S. Armed Forces for the emergency
disinfection of water in the field (45). In the field of water purifi-
cation, iodine was extensively studied by Chang and Morris (10), and
was found to be satisfactory for the disinfection of,;_. coli,
Entamoeba histolytica cysts, Schistosoma cercariae, Leptospira, and
poliomyelitis virus.

21
Table 3
Relative Sporicidal Effectiveness of Chlorine and Chlorine Dioxide
on the Basis of OTA Residual, mg/l, Required for 99 Percent Kill
[After Ridenour et~· (38)]
Organisms Contact time Cl 2 Cl02
Bacillus subtilis 30 mina 2.2 0. 1
10 minb 2.5 0.6
Bacillus megantericus 30 mina >10 1.6
10 min. b 8 1.0
Bacillus megatherium 30 min.a 3.5 0.3
ain the presence of 10 ppm ammonia
bdemand-free medium
22
Iodine has been used more frequently in the disinfection of
swirrming pool waters (45, 46). It is non-reactive with organics and
arrmonia, and waters containing these compounds exhibit very low
iodine demands. Elemental 11 free 11 iodine may persist up to 17 hours
in water, and iodide in the presence of monochloramine exhibits
an effective residual in excess of 68 hours (47).
Ozone has been used in Europe for more than 70 years as a
disinfectant for municipal water supplies (8). It exhibits an all-
or-nothing effect, with a threshold level that must be reached before
disinfection occurs. Various researchers have found ozone to be
highly bactericidal, virucidal and cysticidal (8, 14). Ozone not
only kills pathogens, it also effectively removes tastes and odors.
Two major drawbacks to the use of ozone are the cost of
generation, and a lack of a persistent residual after application.
It is most efficiently generated electrically from dry air or oxygen,
and the cost of ozone disinfection, therefore, will be influenced by
power costs. The lack of any residual requires that ozonation be
followed by some form of chlorination in order for the required
residuals to be maintained in community water supply systems.
Ultraviolet radiation, UV, has been utilized for the steriliza-
tion of seawater used in depuration of shellfish (48). A 99 percent
kill has been achieved by UV against~· coli, Salmonella typhosa,
Staphylococcus aureus, Poliovirus Type I, Coxackie A2, and Adenovirus
Type 3 (11).
23
The disinfecting efficiency of UV is a function of wavelength,
turbidity, and depth of flow. The germicidal action is believed to
involve damage to the DNA of the cell. The major disadvantages are
the lack of a field test which establishes the efficiency of the
process and the lack of any residual disinfecting capacity (14).
Considerations of Water Reuse
When considering the problems involved in water reuse and
reclamation, the term 11 reuse 11 must be carefully considered. Common
usage implies that reclaimed, or 11 renovated 11 wastewater is used
directly for some purpose other than direct human consumption. These
uses include irrigation, cooling and boiler feed water, industrial
process water, recreational lakes, and fish propagation. In only
one instance--at Windhoek, South West Africa--does wastewater from
an advanced waste treatment plant serve as the source for a municipal
supply (49).
Unintentional, and to a large extent, uncontrolled partial
reuse of wastewater for domestic purposes is widespread. At low flow,
the Rhine and Ohio Rivers may be as much as 40 and 15 percent,
respectively, treated municipal and industrial wastes. Some of the
compounds that have been identified in polluted river waters are DDT,
aldrin, orthochloronitrobenzene, naphthalene, diphenyl and chloroethyl
ethers, pyridine, phenols, nitriles, substituted benzenes, aldehydes,
ketones, trihalomethanes, and chlorinated pesticides (2, 50, 51).
As water is withdrawn, used, and discharged by communities sequentially
24
down a watercourse, the concentration of contaminants increases.
Many of these refractory chemicals will pass unchanged through
conventional waste and water treatment processes.
Outbreaks of disease attributable to water during the period
1961-1971 numbered some 46,374 cases (5). Ascaris, trichuris, and
even hookworm, may be transmitted through the practice of watering
lawns and gardens with wastewater (50). Bacterial growths on dialysis
and reverse osmosis membranes, ion exchangers, and carbon columns
may occur in water reclamation plants. The growths may include the
chlorine-resistent flavobacteria that have been implicated in
septicemia (50).
Therefore, before any partial or direct reuse of reclaimed
or renovated water can be considered, its chemical characteristics
must be determined and constantly monitored. The toxic nature of
organics recovered by carbon filtration should be studied, and methods
should be developed to recover organics not removed by carbon adsorp-
tion (50). ·
Residual Analysis
Starch-iodide titration is the accepted standard method for
determining the concentration of stock halogen solutions (32). This
method, however, does not permit differentiation between 11 free 11 and 11 combined 11 chlorine residuals. In analyzing chlorine dioxide in the
presence of chlorine, there is no way to determine the separate
species by this method.

25
Electrometric titration of iodide solutions with sodium
thiosulfate or sodium arsenite was first introduced by Foulk and
Bowden (52). They indicated that the electrometric endpoint was
more sensitive than starch indicator.
Amperometric titration for the determination of chlorine
residuals was developed by Marks and Glass (53), and later expanded
by Marks (54), Marks et~· (55, 56) and Mahan (57). The principle
of amperometric titration involves the creation of an electrical
potential across an electrode, either silver or platinum, which is
detected by a microammeter. A suitable titrant is added to the solu-
tion, neutralizing the chlorine, and decreasing the current flow.
The endpoint of the titration is reached when the addition of a small
increment of titrant causes no movement of the meter. The earlier
titrants were sodium thiosulfate and sodium arsenite. Marks (59),
in 1952, stated that use of sodium thiosulfate did not permit
sufficient discrimination between chlorine and chloramines and
suggested the use of phenylarsene oxide (PAO) as the reducing agent
titrant.
The various chlorine fractions are determined by pH adjust-
ment and potassium iodide addition, followed by titration with standard
PAO, 1 ml = 200 µg Cl. The determinations are as follows:
1. Free Available Chlorine (FAC): Adjust pH to 6.5-7.5.
Titrate to the amperometric endpoint.

26
2. Total Available Chlorine (TAC): Add potassium iodide
(KI) immediately adjust pH to 4. O and titrate.
3. Combined Available Chlorine (CAC): TAC - FAC.
4. Monochloramine: Add a small amount of KI to sample 1)
and titrate.
5. Dichloramines: Add acetate buffer (pH 4) and KI to sample 4) titrate.
Determination of chlorine dioxide by amperometric titration
was first proposed by Haller and Listek (58). The procedure involves
four titrations to differentiate between chlorine and chlorine
dioxide (32):
1. Reading A (Free Available Chlorine): The pH of the
sample is raised to 12 to convert the c102 to non-
reactive chlorate and chlorite. After 10 minutes, the
pH is lowered to 7 and the sample titrated.
2. Reading B (Free Available Chlorine and Chloramine): The
pH is raised to 12, and then reduced to 7 after 10
minutes. KI is added and the sample titrated.
3. Reading C (Free Available Chlorine and one-fifth Chlorine
Dioxide): Adjust sample pH to 7, add KI and titrate.
4. Reading D (Total Available Chlorine): Add KI to the
sample and reduce the pH to 2. After 10 minutes raise
the pH to 7 and titrate.

27
The chlorine and chlorine dioxide fractions are calculated
as follows:
1. mg/l Cl02 as chlorine= 5 (C-B)
2. mg/l Free Available Chlorine - A
3. mg/l chloramine as chlorine = B-A
4. mg/l chlorite as chlorine = 4B-5e+o
A major criticism of the amperometric technique concerns the
possibility of volatilization of c102 during stirring, and the second
possibility that there might be incomplete conversion of Cl02 to
Cl0-3 and c10-2 during pH adjustments.
Certain aromatic amines will react with chlorine to form
colored oxidation products. Measurement of the color produced, or
discharge of color by a suitable titrant forms the basis of a number
of analytical techniques (59). Among these compounds are two
aniline dye derivatives: 1. 4,4' ,4 11 -methylidynetris-(N,N-dimethylaniline)
(Leuco Crystal Violet)
H3c _ ~ _ /H3
H C ::N -0¢c -0-N "-<:H 3 ~ 3
~I M
CH3 I \ CH3

28
. 2. Diethyl-p-phenylene diamine (DPD)
An analog of DPD, p-aminodimethylaniline, was suggested as
a semi-quantitative indicator of free chlorine under field conditions
(60). In a comparative study of many chlorine indicators (59), this
compound was found to be unstable in aqueous solution, and its use
was not recorrmended.
DPD has been extensively investigated by Palin (61, 62, 63,
64, 65, 66). The procedure has been adapted to both titration and
colorimetric determinations and allows the determination of chlorine
dioxide, or other halogens, in the presence of chlorine. This is
accomplished by adding glycine which reacts instantaneously to convert
all free chlorine in the sample to chloroaminoacetic acid (66) but
does not react with any chlorine dioxide present. The currently
accepted method of analysis involves a series of titrations per-
formed on two sample solutions (65):
1. Reading G (Chlorine Dioxide): Add glycine to 100 ml
sample and mix. Add buffer and DPD reagent, mix, and
titrate immediately with standard ferrous ammonium
sulfate (FAS), l ml = 1.0 mg/l Cl.
29
2. Reading A {Free Available Chlorine): To a second 100 ml
sample, add buffer and DPD reagent. Titrate immediately.
3. Reading B {Monochloramine): To ~above, add a small
crystal of KI, and continue titration.
4. Reading C {Dichloramine): To 3) above, add 0.5-1.0 gm
KI, let stand 2 minutes and continue titration.
5. Reading D (Total Available Chlorine): To 4) above, add
sulfuric acid, let stand one minute, neutralize with
sodium bicarbonate, and continue titration.
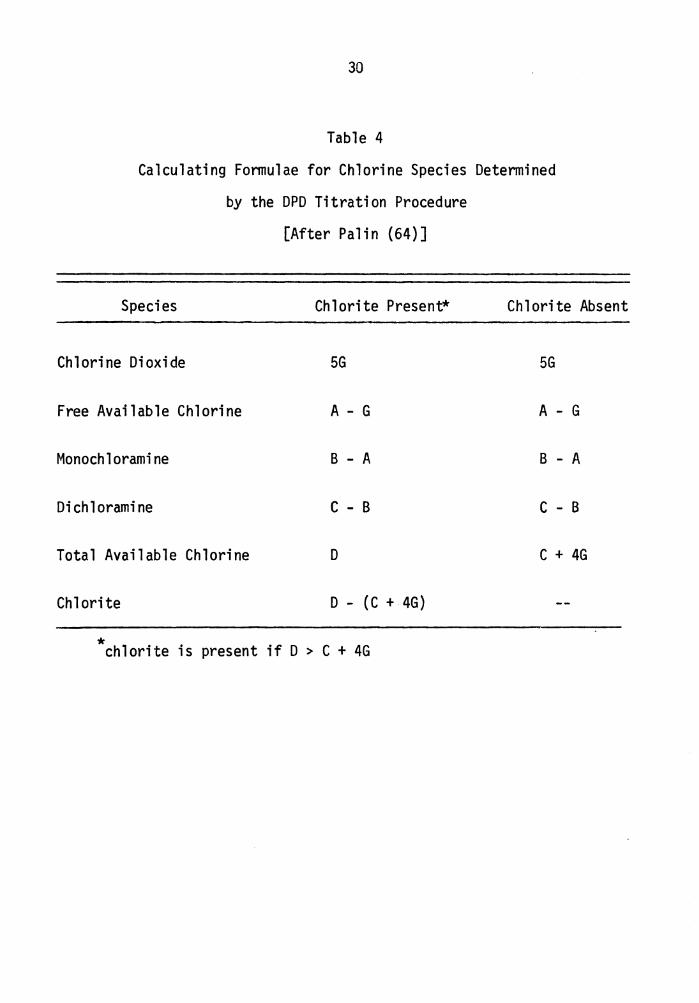
Calculating fonnulae for the various chlorine fractions are
given in Table 4. It should be noted that Readings A, B, C, and D
are taken as cumulative totals and not as incremental quantities of
titrant.
In colorimetric analyses with DPD, all steps in the titrametric
procedure just described are followed except the titrations are not
performed. After addition of reagents, the sample is transferred to
a spectrophotometer and the absorbance is determined. It is interesting
to note that in none of Palin's work (61, 62, 63, 64, 65, 66) is an
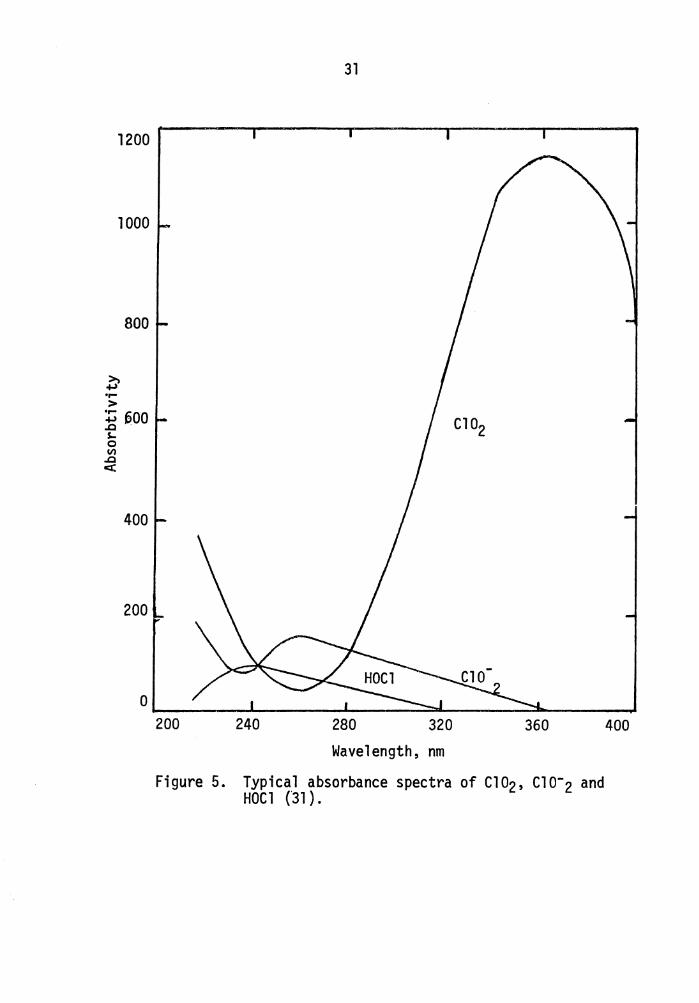
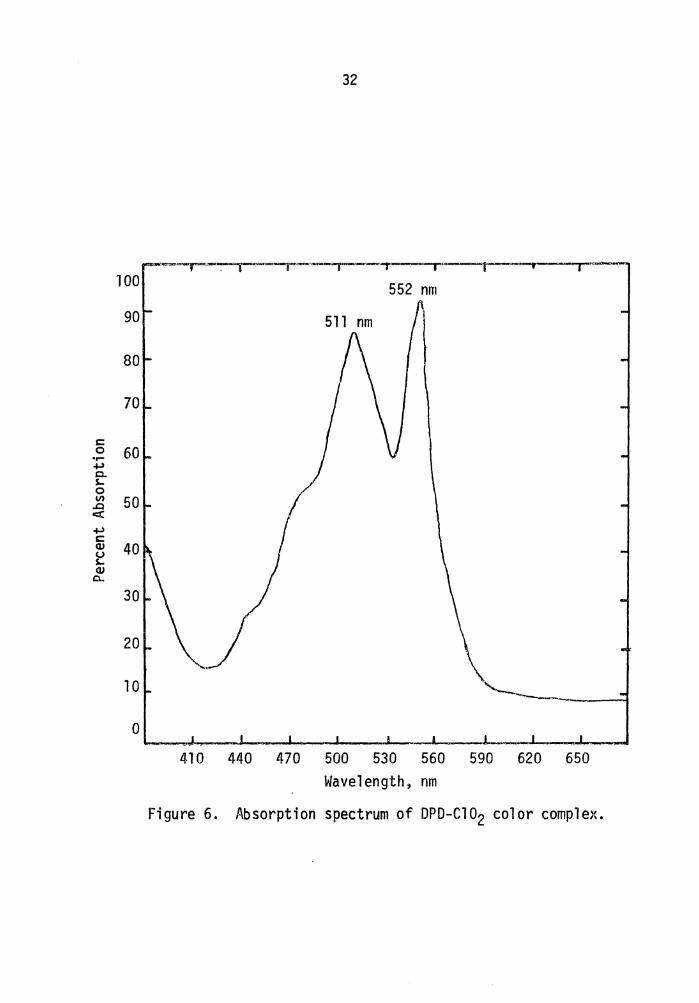
analytical wavelength given. Maximum absorbance of Cl02 is at
360nm {Fig. 5) and the Cl02-DPD complex exhibits two absorbance maxima,
one at 552 nm and the other at 511 nm {Fig. 6).
At low chlorine concentrations in distilled water, DPD, when
compared with eight other indicators, gave excellent results as a
colorimetric technique (59). A. comparison between DPD and starch-iodide
30
Table 4
Calculating Fonnulae for Chlorine Species Detennined
by the DPD Titration Procedure
[After Palin (64)]
Species Chlorite Present*
Chlorine Dioxide 5G
Free Available Chlorine A - G
Monochloramine B - A
Dichloramine C - B
Total Available Chlorine D
Chlorite D - (C + 4G)
* chlorite is present if D > C + 4G
Chlorite Absent
5G
A - G
B - A
C - B
C + 4G
1200
1000
800
~ .,.. > ~ pOO ..Q $... 0 Vl
..Q <C
400
200
31
200 240 280 320 360 Wavelength, nm
Figure 5. Typical absorbance spectra of Cl02, c10-2 and HOCl ('31).
400
32
·=~ f r I =t I -100 552 nm
90 511 nm
80
70
c: 0 60 ...... .µ c. s.. 0 (/) 50 ..Q ct .µ c: <LI 40 u s.. <LI o..
30
20
10
0 410 440 470 500 530 560 590 620 650
Wavelength, nm
Figure 6. Absorption spectrum of DPD-Cl02 color complex.

33
utilizing chlorinated sewage yielded an erratic relationship between
dosage applied and residual determined (70). It was concluded from
this study that, although DPD gave excellent results for chlorine in
demand-free water, it was unsatisfactory for determining chlorine
·residuals in sewage effluents.
Leuco crystal violet, LCV, was first proposed by Black and
Whittle (68) for the determination of iodine residuals. This method
was extended to include free and total chlorine (69) and has been
adapted to the analysis of ozone (70).
In the analytical procedure, the sample is buffered to pH4
using an acetate buffer. The colorless LCV reagent is added, and, in
the presence of chlorine, is reduced to the colored compound, crystal
violet. The proposed mechanism of this reaction {69):
involves a hydride transfer and a chloride substitution.
Free chlorine and total chlorine are differentiated by the
inclusion of potassium iodide in the total chlorine buffer. The
solution color produced by the two buffers are different, but both
are analyzed at 592 nm (69).

34
A comparison of starch-iodide and leuco crystal violet (67)
for the analysis of chlorine residuals in sewage effluent gave
excellent results. The technique gave a 97 percent recovery of
chlorine as compared to starch-iodide, and the authors recommended
its adoption for this purpose.
There are several other methods for the analysis of chlorine
dioxide reported in the literature. These are:
1. The colorimetric technique of Post and Moore (71) in
which H Acid (l-amino-8-naphthol-3,6-disulfonic acid) is
used as the indicator.
2. The colorimetric technique of Masschelein (72) which
requires the use of acid Chrome Violet K (l,5-bis-
(4-methyl-phenyl-amino-2-sodium sulfonate)-9,10-anthra-
quinone). The procedure relies on the selective decolori-
zation of the indicator by chlorine dioxide.
3. The colorimetric technique of Hodgden and Ingols (73)
using tyrosine indicator. Chlorine dioxide cleaves the
tyrosine ring structure, producing a red color.
4. The three-step, iodometric-potentiometric titration
procedure of Myhrstad and Samdal (20).
A search of the literature revealed no information on the use
of leuco crystal violet for the determination of chlorine dioxide
residuals.

III. MATERIALS AND METHODS
Basic LaboratoryProcedures
All reagents used in this study were made from reagent-grade
chemicals according to the procedures outlined in Standard Methods (32).
Formulations for these reagents are given in Appendix A. Demand-free
water was prepared by passing glass-distilled water through an anionic-
cationic exchange column (Barnstead ll3902). Ammonia content was moni-
tored daily by nesslerization and was never found to be present.
Tests conducted on this water gave better than 99 percent recovery of
chlorine as total available chlorine, and a 96 percent recovery as
free available chlorine when analyzed by amperometric titration
(Table 5).
All glassware was washed first with a standard laboratory
detergent, then by chromic acid. The glassware was then rinsed five
times in demand-free water and allowed to air dry.
Spectrophotometric analyses were conducted using a Coleman
124 double-beam spectrophotometer, and all amperometric titrations
were performed by a Fischer-Porter titrator.
Generation of Chlorine Dioxide
The chlorine dioxide used in this study was generated every
three to four weeks by the modified method of McGhee (16). In this
procedure, dilute sulfuric acid (10%) was added incrementally to
a sodium chlorite solution (10 gms/750 ml). The gas evolved was
35

Calculated Concentration
0.20
0.40
0.80
1.12
1.16
2.0
Average Recovery
36
Table 5
Chlorine Recovery in Demand-Free Water by
Amperometric Titration
Amperometric Concentration
Free Percent Total Chlorine Recovery Chlorine
0.21 105 0.20
0 .21 105 0.22
0.35 88 0.36
0.39 98 0.39
0.79 98 0 .81
0.69 86 0.81
1.14 95 1.19
1. 13 94 1.22
1.57 98 1.55
1.57 98 1.59
l.96 98 1.92
1.96 98 2.0
96.8%
Percent Recovery
100
110
90
98
101
101
99
102
97
99
99
100
99.7%
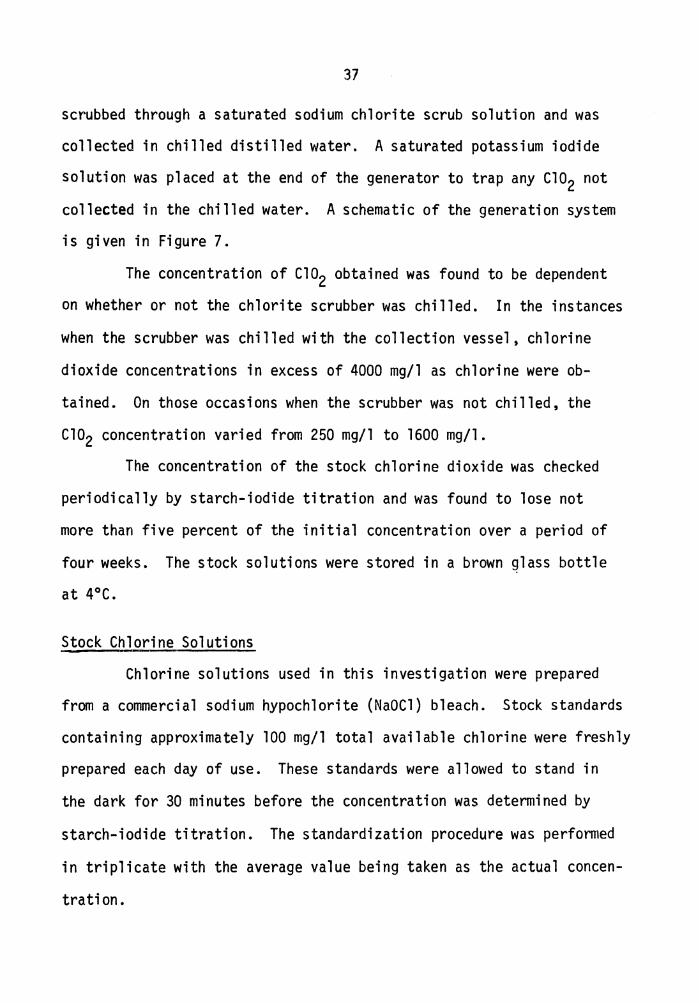
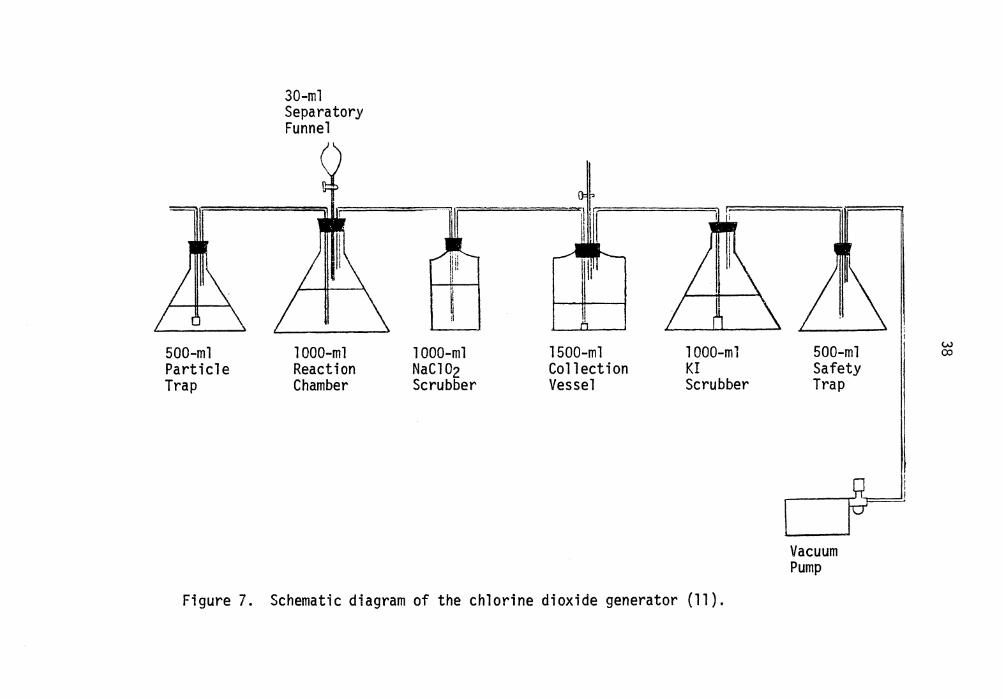
37
scrubbed through a saturated sodium chlorite scrub solution and was
collected in chilled distilled water. A saturated potassium iodide
solution was placed at the end of the generator to trap any c102 not
collected in the chilled water. A schematic of the generation system
is given in Figure 7.
The concentration of Cl02 obtained was found to be dependent
on whether or not the chlorite scrubber was chilled. In the instances
when the scrubber was chilled with the collection vessel, chlorine
dioxide concentrations in excess of 4000 mg/l as chlorine were ob-
tained. On those occasions when the scrubber was not chilled, the
Clo2 concentration varied from 250 mg/l to 1600 mg/l.
The concentration of the stock chlorine dioxide was checked
periodically by starch-iodide titration and was found to lose not
more than five percent of the initial concentration over a period of
four weeks. The stock solutions were stored in a brown ~lass bottle
at 4°C.
Stock Chlorine Solutions
Chlorine solutions used in this investigation were prepared
from a commercial sodium hypochlorite (NaOCl) bleach. Stock standards
containing approximately 100 mg/l total available chlorine were freshly
prepared each day of use. These standards were allowed to stand in
the dark for 30 minutes before the concentration was determined by
starch-iodide titration. The standardization procedure was performed
in triplicate with the average value being taken as the actual concen-
tration.
500-ml Particle Trap
30-ml Separatory Funnel
1000-ml Reaction Chamber
~ 1000-ml NaCl02 Scrubber
1500-ml Collection Vessel
1000-ml KI Scrubber
Figure 7. Schematic diagram of the chlorine dioxide generator (11).
500-ml Safety Trap
Vacuum Pump
w CX>
·~
Working Standards
Regardless of the particular experiment under way, the working
standards always were prepared in an identical manner. The volume of
stock solution necessary to make the desired concentration was calcu-
lated and added to a glass-stoppered volumetric flask containing
demand-free water. The chlorine standards were analyzed by ampero-
metric titration as outlined in Standard Methods 409 C. (32), and the
value obtained was regarded as the actual concentration of the halogen.
Chlorine dioxide standards were also analyzed by amperometric
titration. The procedure used was basically that given in Standards
Methods 411 C. (32) with the following exception: in those instances
where readjustment to pH 7 was required, one ml of a pH 7 buffer was
added to the sample immediately before pH readjustment. All chlorine
dioxide concentrations were recorded on an ••available chlorine•• basis
(e.g. Cl02 + 5e- +Cl-+ 20=).
pH Studies
A series of three experiments designed to test the effects of
varying pH were perfonned. A Fisher Accumet Model 120 pH meter was
used to measure pH.
The first was designed to evaluate the effects of variation in
pH on the rate of color development. In this study, 5 ml DPD reagent
was added to 100 ml of a S~rensen or Mc!lvaine buffer (Appendix B)
of known pH. The color development (as indicated by the increasing
absorbance of the solution) was measured every minute for fifteen

40
minutes at 552 nm using a 10.0 cm cell. Pure buffer was used as the
reagent blank.
The second experiment was designed to determine the pH changes
resulting from the additions of the various DPD reagents. Demand-free
water, and demand-free water containing l mg/l Cl02 or l mg/l c1 2 were
used. The sample w~s prepared, the DPD reagents were added singly or
in combination, and pH measurements were made after each addition.
In the third study, 5 ml DPD reagent was added to 100 ml dis-
tilled water. The pH was raised incrementally with 1 N NaOH, and the
absorbance at each pH was determined at 552 nm using a 10.0 cm cell.
DPD Color Development
An investigation of the spontaneous development of color by
DPD was conducted using chlorine and chlorine dioxide in demand-free
water and in filtered, secondary-treated municipal sewage effluent.
An identical series of samples was used as the controls wherein DPD
reagents but no chlorine or chlorine dioxide were added.
Chlorine and chlorine dioxide concentration, as single-halogen
solutions, were varied in these studies.
For the spectrophotometric studies, the samples were prepared
for analysis in the following manner:
1. Chlorine Dioxide: 2 ml glycine solution was added to 100 ml
sample in a 250 ml Erlenmeyer flask. After mixing, 5 ml
buffer and 5 ml DPD reagent were added and mixed. A
10.0 cm cell was rinsed with 10 ml of sample, and then

41
filled. Absorbance readings were made at 552 nm using a
blank containing demand-free water, glycine, and buffer.
2. Chlorine: A 100 ml sample was added to a 250 ml Erlen-
meyer flask containg 5 ml buffer and 5 ml DPD reagent,
and mixed. A 10.0 cm cell was rinsed with 10 ml of the
sample and then filled. The absorbance was read at 552 nm
against a blank containing demand-free water and buffer.
Absorbance readings were taken at intervals of either one or
five minutes during a thirty minute period. Several experiments were
performed to determine the effects of light on the color development.
Samples were either left in the instrument light path, removed to
darkness, or placed in room light (fluorescent) between readings.
Dosed and undosed demand-free water and secondary effluent were
also used in the titration procedures. The prepared samples were
reacted with the reagents as in the spectrophotometric procedure. The
samples were then titrated inmediately to the colorless endpoint with
standard FAS, and retitrated every five minutes for thirty minutes.
Between titrations, the samples were either removed to darkness or
left in the light. The incremental amount of titrant required to dis-
charge color was recorded.
Leuco Crystal Violet
The leuco crystal violet (LCV) analytical method used was that
given in Standard Methods 409 G. (32). This procedure was used for
chlorine dioxide as well as chlorine. The chlorine dioxide determina-
tions were made with no alteration to the basic procedure. A time

period in excess of one minute was allowed for color to develop. The
LCV complex has been shown to require this time for full color develop-
ment, and is stable for about fifteen minutes {Figure 8). All absor-
bance readings were made at 592 nm using 5.0 cm cells blanked against
distilled water.
Briefly, the analytical procedure is as follows:
1. Free chlorine: A 50 ml sample was transferred, using a
volumetric pipet, to a 100 ml volumetric flask. Free
chlorine buffer {1.0 ml} was added and mixed. LCV indica-
tor {1.0 ml} was carefully added by letting it flow down
the neck of the flask, and the contents were swirled im-
mediately to mix the reagents. After one minute, a 5.0 cm
cell was rinsed with 10 ml of sample, the sample added,
and the absorbance determined.
2. Total chlorine: A 50 ml sample was transferred to a 100
ml volumetric flask using a volumetric pipet. Total chlorine
buffer {1.0 ml} was added and mixed, and the sample was
allowed to stand for one minute. LCV indicator {1.0 ml}
was carefully added and mixed as previously described,
and the sample was then diluted to the 100 ml mark and
allowed to stand for one minute. A 5.0 cm cell was rinsed
with 10 ml of sample, the sample added, and the absorbance
determined.
All glassware coming into contact with leuco crystal violet-
chlorine solutions were subject to staining by the crystal violet

QJ u c: '°
0.60
0.50
0.40
-e 0.30 0 Vl ..c
ci::
0.20
43
0.10 -
0 2 4 6 8 10 12 14 16 Time, Minutes
Figure 8. Stability with time of the leuco crystal violet color complex (70).
44
formed in the color reaction. This was removed by rinsing with 90 per-
cent acetone followed by copious amounts of demand-free water. The
glassware was then dried in air.
Statistical Method
A series of fifteen replicates each of three concentrations
were analyzed for chlorine dioxide as free available and total avail-
able chlorine by the LCV and DPD spectrophotometric methods previously
described. Pmperometric titration was accepted as the primary stan-
dardized technique, and the concentration of each replicate was deter-
mined by this method immediately prior to analysis by DPD or LCV. The
mean absorbance at each concentration was calculated and a standard
curve was plotted using these means. The concentration of each repli-
cate was determined from the curves obtained, and percent recovery
was calculated as:
p t R r _ concentration from curve ercen ecove Y - Alriperometric concentration [18]
The values obtained were analyzed by the t-test.
Cl02 in the Presence of Chlorine
To investigate the feasibility of determining chlorine dioxide
in the presence of chlorine, a series of solutions having a "total
chlorine" concentration of 1 mg/l and c1 2:c102 ratios varying from
1:9 to 1:1 were prepared. The methods of analyses were DPD titration
and LCV.

45
The DPD titration procedure used was that described by Palin
(65) in 1974. This procedure involves five titrations and two 100 ml
samples:
1. Reading G: To 100 ml sample, add 2 ml glycine and mix.
Add 5 ml buffer and 5 ml DPD reagent, mix, and titrate
irrmediately, with standard FAS.
2. Reading A: Add 100 ml sample to 5 ml buffer and 5 ml DPD
reagent, mix and titrate immediately.
3. Reading B: To sample 2J add one small KI crystal, mix
and titrate.
4. Reading C: To sample 3)add 0.5-1.0 gm KI, mix and let
stand for two minutes. Continue titration.
5. Reading D: To sample 4)add 1 ml sulfuric acid solution,
mix and let stand for two minutes. Add 5.0 ml bicarbonate
solution, mix and titrate.
It should be emphasized again that this is a continuous titra-
tion procedure. Each reading is the sum total of titrant added to
the solution up to that particular point. Calculating formulae for
the chlorine fractions are given in Table 4.
Using LCV, the free available chlorine procedure was performed
twice on aliquots of the same sample, with glycine being used to sup-
press free chlorine in one aliquot. In the presence .of glycine, it
was assumed that only c102 would react, and in the absence of glycine
both chlorine and chlorine dioxide would produce color.
The total chlorine procedure was assumed to elicit a color
46
response from chlorine, chlorine dioxide, and any combined chlorine
forms present.
The standard curves used for the LCV analyses were those gene-
rated in the statistical analysis.
IV. RESULTS AND DISCUSSION
The four major phases of this study were designed to:
(1) investigate the effects of pH on the DPD reagent; (2) investigate
the spontaneous color development by DPD; (3) make a statistical
comparison of DPD and LCV in the analysis of Cl02; and (4) investigate
the determination of chlorine dioxide in the presence of chlorine by
both methods.
The figures and tables presented in this section were derived
from the experimental data presented in Tables Cl-Cl4. They are
arranged in the same sequence as the tables and graphs derived from
them, and are labeled to indicate the corresponding figures and tables
in this section.
pH Studies
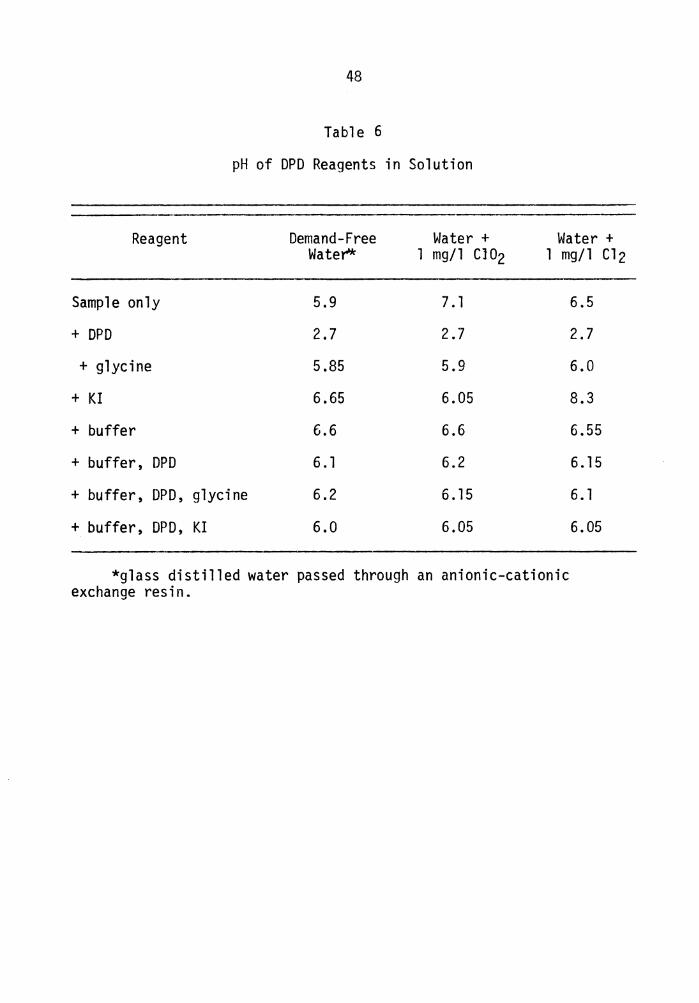
The results of the study involving the pH of various combina-
tions of DPD reagents in solution are given in Table 6. It can be
noted that the presence of glycine does have an effect, even though
slight, on the final pH of the sample. To maintain constant analytical
conditions throughout this investigation, glycine was added to all
c102 samples analyzed regardless of the known or suspected free chlorine
content. The addition of KI to the unbuffered samples raised the pH
in all cases, with the greatest increase being noted in the chlorine
solutions. Solutions of KI normally have an alkaline pH (8.9 for a 5%
solution) and this is reflected in the reported pH values.
47
48
Table 6
pH of DPD Reagents in Solution
Reagent
Sample only
+ DPD
+ glycine
+ KI
+ buff er
+ buffer, DPD
+ buffer, DPD, glycine
+ buffer, DPD, KI
Demand-Free Water'*
5.9
2.7
5.85
6.65
6.6
6. l
6.2
6.0
Water + 1 mg/l Cl02
7. l
2.7
5.9
6.05
6.6
6.2
6 .15
6.05
Water + l mg/l Cl2
6.5
2.7
6.0
8.3
6.55
6. 15
6. 1
6.05
*glass distilled water passed through an anionic-cationic exchange resin.

49
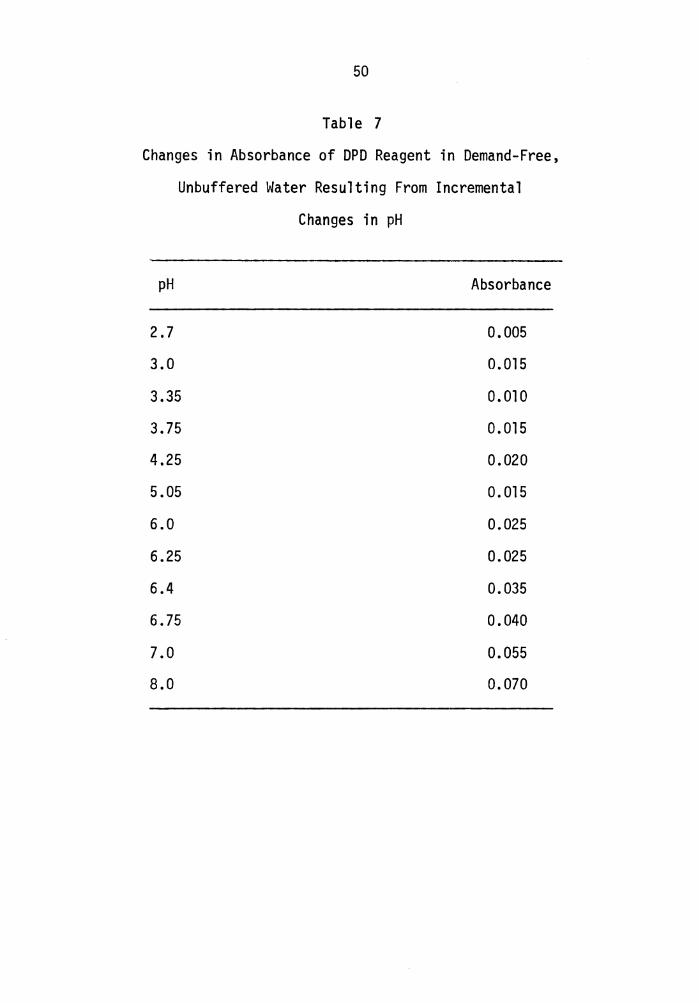
The absorbance of water containing only the appropriate amount
of DPD as a function of incremental changes in pH is given in Table
7. These were unbuffered solutions containing only the DPD reagent,
and the pH was raised using l N NaOH. As can be seen from the data
presented, absorbance exhibits a steady increase at pH > 6 under this
test condition.
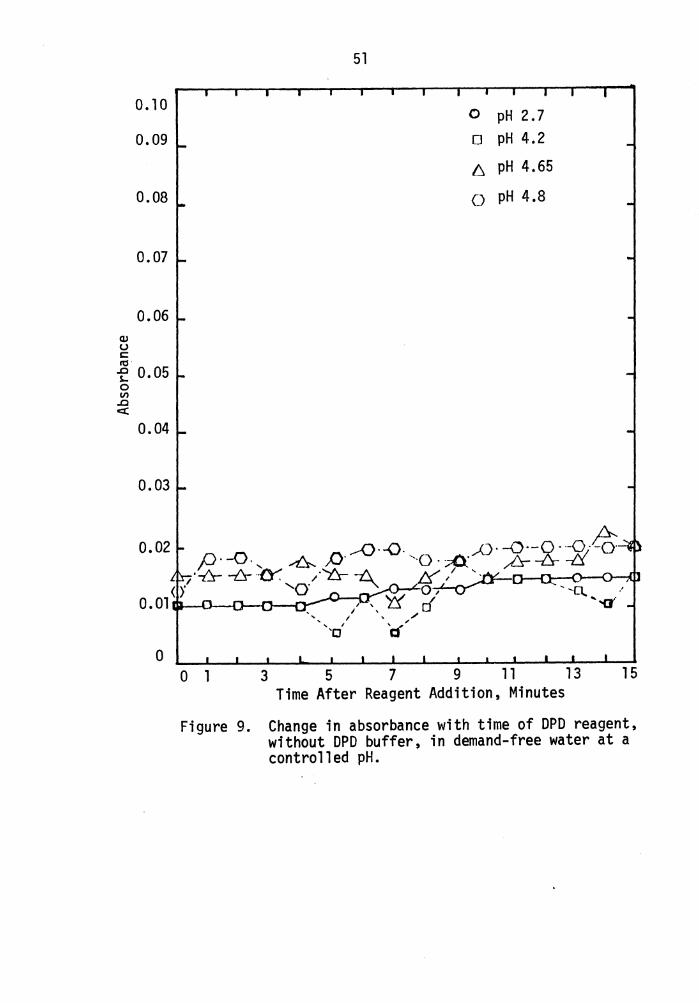
Figures 9, 10 and 11 show the increase in absorbance with
time when the DPD reagent {without buffer) is added to a S~rensen or
Mcilvaine buffer. This study was done to determine if the pH range
specified for the DPD titration and spectrophotometric procedures of
6.2-6.5 {32, 67) is too wide for accurate spectrophotometric deter-
minations. The pH of the DPD buffer is not specified by either Palin
{61, 62, 63, 64, 65, 66) or Standard Methods {32), but the pH of the
final reaction medium is. As can be seen from Table 7, absorption of
water containing only DPD reagent did increase between pH 6.25 and
6.4, and Figures 8, 9, and 10 show that absorbance in buffered water
containing DPD does increase with time above pH 6. This data indi-
cates that strict control of pH and reaction time is necessary in the
spectrophotometric procedure, insofar as the standards and samples
should be adjusted to the same pH and have the same reaction time to
avoid any errors in residual determinations due solely to pH.
The rapidity of the titration procedure eliminates the time
element in color develop~ent due to pH.
50
Table 7
Changes in Absorbance of DPD Reagent in Demand-Free,
Unbuffered Water Resulting From Incremental
Changes in pH
pH Absorbance
2.7 0.005
3.0 0.015
3.35 0.010
3.75 0.015
4.25 0.020
5.05 0.015
6.0 0.025
6.25 0.025
6.4 0.035
6.75 0.040
7.0 0.055
8.0 0.070
QJ u c: rtl
0.10
0.09
0.08
0.07
0.06
f 0.05 0 Vl ..a ct
0.04
0.03
0 0 l 3
51
5 7 9
0 pH 2. 7 o pH 4.2 6 pH 4.65
O pH 4.8
11 Time After Reagent Addition, Minutes
13 15
Figure 9. Change in absorbance with time of DPD reagent, without DPD buffer, in demand-free water at a controlled pH.

0. 1
0.09
0.08
0.07
0.06 Q) u c: .,, 0.05 ..c S-0 Ill ..c
C(
0.04
0.03
0.02
0. 01
52
ff /£
p( /:! /c{
~ /)
/ a JS cf
/ / /i o·
/
/< p· ft .0- ·01
/ fr' o· A I "
,.
fa--d / 0.. ,....Cl I ... D,.
Ii . /o-·d _f-0-.(} P.~ o----I
I I
o pH 5.4
~ pH 5.8
o pH 6.4
O pH 6.45
0 1 3 5 7 9 11 13 15 Time After Reagent Addition, Minutes
Figure 10. Change in absorbance with time of DPD reagent, with DPD buffer, in demand-free water at a controlled pH.

QJ u c:
0.20
0. 18
o. 16
0. 14
0.12
~ 0.10 ~ 0 (/) ..c c:(
0.08
0.06
0.02
53
o pH 7. 05
0 pH 7 .8
0.___._~-----~..._--~-----~..._--~_,__....~-----~---0 1 3 5 7 9 11 13 15
Time After Reagent Addition, Minutes
Figure 11. Change in absorbance with time of DPD ~eagent, without DPD buffer, in demand-free water at a controlled pH.

54
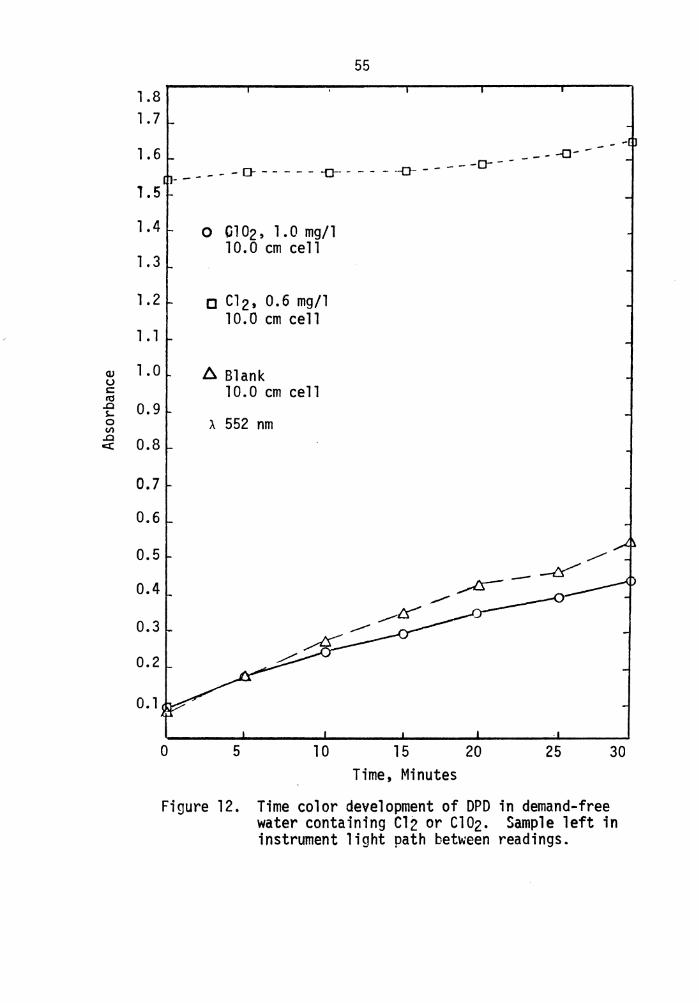
Spontaneous Color Development
The data for spontaneous color development are presented in
Figure 12-17. In all cases of DPD-Cl02 and DPD blanks in both demand-
free water and secondary effluent, absorbance increased with time.
The magnitude of this increase did vary with the test condition,
being most pronounced in demand-free water left in the instrument
light path. The temperature of a sample left in the light path did
not increase more than 1°C over a 35 minute period, indicating that
photosensitivity at the analytical wavelength, and not temperature,
may be responsible for the increase in absorbance.
The results involving the analysis of chlorine by DPD are
somewhat anomalous. In demand-free water, the absorbance of the
DPD-Cl2 complex increased only slightly with time as compared to DPD-
Cl02 and DPD-blank, and in one instance (Figure 14) actually decreased.
In filtered secondary effluent, the absorbance of the DPD-
Cl2 complex decreased with time except when the sample remained in
the instrument light path. In this instance, there was a dramatic
increase in the absorbance readings. This may be due to chemical
reactions between the DPD-Cl2 complex and oxidizing and reducing
compounds in the sewage that could have been further affected by
irradiation. The apparent photosensitivity of DPD-Cl02 and DPD-blank
exhibited in demand-free water was not found when secondary effluent
was used as the analytical medium.
Reaction time and sample chemical composition exert a greater
influence on color development than do darkness or exposure to room
light.
1. 8 1. 7
1.6
l.5
1.4
1.3
1.2
1.1
Q) 1.0 u c: It!
..0 0.9 s... 0 V)
..0 0.8 ct
0.7
0.6
0.5
0.4
0.3
0.2
0. 1
- - -
0
55
-a- -n------- - - 0- - - - - - -o-- - - - - ·-0-- - - - - -u
o Cl02, 1.0 mg/l 10.0 cm cell
a C 1 2 , o . 6 mg I 1 10.0 cm cell
6. Blank 10.0 cm cell
>. 552 nm
5 10 15 20 25 Time, Minutes
30
Figure 12. Time color development of DPD in demand-free water containing c12 or Cl02. Sample left in instrument light path between readings.

0.45
0.4
0.35
0.3
Q) 0.25 u s:: I'd
..0 S-0 V}
..0 0.2 ex:
0. 15
0. 1
0.05
0
56
_--0------ o------ -0- -. - - - - - -o- - - - - - 0- - -
0 Cl02, 1. 76 mg/1 10.0 cm cell
0 Cl2, 0,2 mg/1 10.0 cm cell
_..,., 6 Blank -'Y"" --10.0 cm cell p--
./
;\ 552 nm ~ ...... ../
~ ..,/"'
/ /
0 5 10 15 20 25 30 Time, Minutes
Figure 13. Time color development of DPD in demand-free water containing Cl2 or Cl02. Sample placed in room light between readings.

Q) u c: m ..a s... 0 Vl ..a ex:
1.8 1. 7
1.6
1.5
1.4
1.3
1.2 -
1. ..
1.0
0.9
0.8
0.7
0.6
0.6
0.4
57
- - - - - -o- - - - - - 0- - - - - -0- - - - - -0- - - -
O Cl02, 1.7 mg/l 10. 0 cm cell
O Cl2, 0.8 mg/l 10. 0 cm cell
6. Blank l 0. 0 cm cell
>. 552 nm
- -o - - - -
0.3 ,l_ __ --<:r--~----o-~---0------0----~1~~-:p
0.2
0. l
0 ·-0-
-6:-- -.JO- - --6- - -ts- -
-fr- - ~
5 10 15 Time, Minutes
20 25 30
Figure 14. Time color development of DPD in demand-free water containing Cl2 or Cl02. Sample removed to darkness between readings.


1.5
1.4
1.3
1.2
1.1
1.0
Q) 0. 9 u c: Al "f 0.8 0 Vl
..0 ct: 0.7
0.6
0.5
0.4
0.3
0.2
0. 1
59
o Cl02, 1.16 mg/l 10.0 cm cell
a c1 2, 1.16 mg/l 1.0 cm cell
A Blank 10.0 cm cell
>.. 552 nm
'"'0- - - ----a-. __ - - -r1
.. Ll'"" - - - - -o
___.o ~o
------o-----
A.-- ---6:- - -6-----6- - -L.l
15 Time, Minutes
Figure 16. Timed color development of DPD in secondary effluent containing Cl2 or Cl02. Sample placed in room light between readings.

1.5 1.4
1.3
1.2
1. l
1.0
0.9 Q) u s::: It! 0.8 ..0 s-0 Vl
..0 0.7 c(
0.6
0.5
0.4
0.3
0.2
0. 1
60
- - - - - -Q.. - - - - - 0- - - - - -" -i..r - - - - --"
-L,J- - - - - -0--·- - -
0
O Cl02, 1.16 mg/l 10.0 cm cell
a Cl2, 1.16 mg/l 1.0 cm cell
~ Blank l 0. 0 cm cell
>.. 552 nm
- -- --L::x- -- -l:::r- --
5 10 15 20 Time, Minutes
--&-- -
25 30
Figure 17. Timed color development of DPD in secondary effluent containing Cl2 or Cl02. Sample placed in darkness between readings.
61
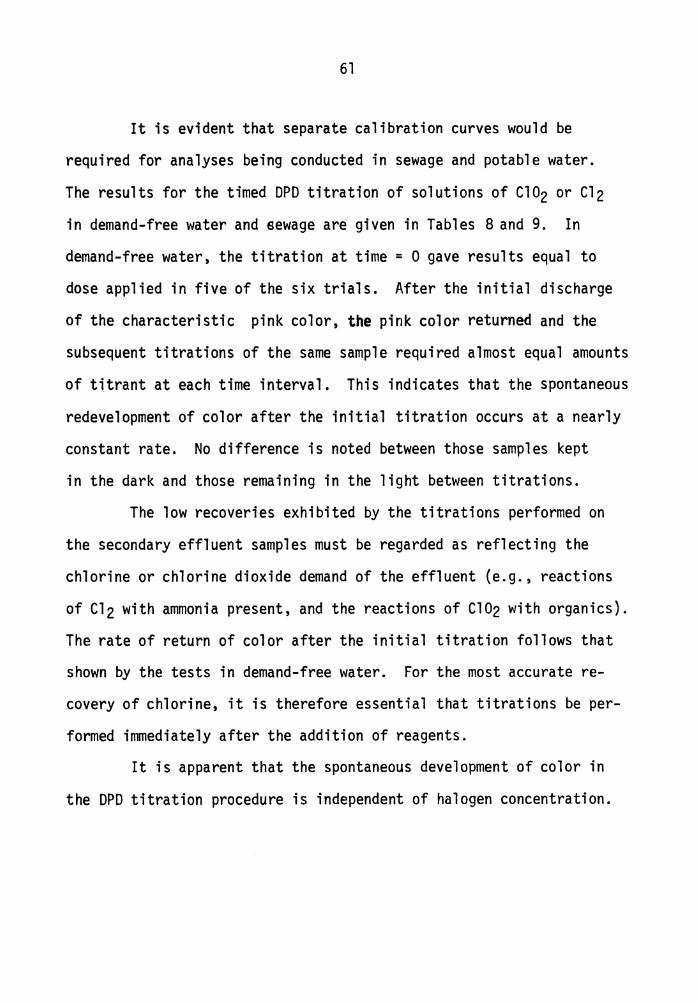
It is evident that separate calibration curves would be
required for analyses being conducted in sewage and potable water.
The results for the timed DPD titration of solutions of c102 or Cl2
in demand-free water and sewage are given in Tables 8 and 9. In
demand-free water, the titration at time = 0 gave results equal to
dose applied in five of the six trials. After the initial discharge
of the characteristic pink color, the pink color returned and the
subsequent titrations of the same sample required almost equal amounts
of titrant at each time interval. This indicates that the spontaneous
redevelopment of color after the initial titration occurs at a nearly
constant rate. No difference is noted between those samples kept
in the dark and those remaining in the light between titrations.
The low recoveries exhibited by the titrations performed on
the secondary effluent samples must be regarded as reflecting the
chlorine or chlorine dioxide demand of the effluent (e.g., reactions
of Cl2 with ammonia present, and the reactions of Cl02 with organics).
The rate of return of color after the initial titration follows that
shown by the tests in demand-free water. For the most accurate re-
covery of chlorine, it is therefore essential that titrations be per-
formed immediately after the addition of reagents.
It is apparent that the spontaneous development of color in
the DPD titration procedure is independent of halogen concentration.

Time
0
5
10
15
20
25
30
Total mls required
Table 8
Timed DPD Titration of Cl02 and Cl2 in Demand-Free Water, as Volume (mls) of
Standard FAS Required to Discharge Color in the Sample
Sample Remaining at Room Light Sample Removed to Darkness
Cl02 (2.0 mg/l) Cl2 (2.6 mg/l) Blank Cl02 (2.0 mg/l) Cl 2 (2.0 mg/l)
0.4 2.6 0 0.375 2.0
0.1 0. l 0.05 0. l 0.05
0. l 0. l 0.05 o. l 0.05
0.05 0.05 0.05 o. l 0.05
o. 15 0.05 0.05 o. l 0.05
0.1 0.05 0.05 0.15 0.05
0. l 0.05 0.05 0.2 0.05 - -- -- -- -
1.0 3.0 0.3 1.125 2.3
Concentration at T = 0 (5) (A) = 2mg/l 2.6 mg/l 0 mg/l (5) (.375) = 1.88 mg/l 2.0 mg/l
Blank
0
0.05 O'I
0.05 N
0.05
0.05
0.05
0.05
0.3
0 mg/l

Time
0
5
10
15
20
25
30
Total mls required
Table 9
Timed DPD Titration of Cl02 and Cl2 in Secondary Effluent, as Volume (mls) of
Standard FAS Required to Discharge Color in the Sample
Sample Remaining at Room Light Sample Removed to Darkness
Cl02 {2.0 mg/1) Cl2 {3.5 mg/1) Blank C 1 02 ( 2 . 0 mg /1 ) Cl2 (3.5 mg/1)
0 1.5 0.05 0 1.6
0. 1 0. 1 0.05 . 1 0.05
0. 1 0.05 0.05 . 1 0.05
0. 15 0.05 0.05 . 15 0.05
0. 15 0.05 0.05 . 1 0.05
0. 1 0.05 0.05 . 1 0.05
0. 15 0. 1 0.05 . 15 0.05 -- -- -- -- --0.75 1.5 0.3 0.7 1.6
Concentration at T = 0 ( 5) ( O) = O mg/1 1.5 mg/l 0 mg/1 (5) (0) = 0 mg/l 1.6 mg/l
Blank
0.05
0.05 O'I w
0.05
0.05
0.05
0.05
0.05 -
0.3
64
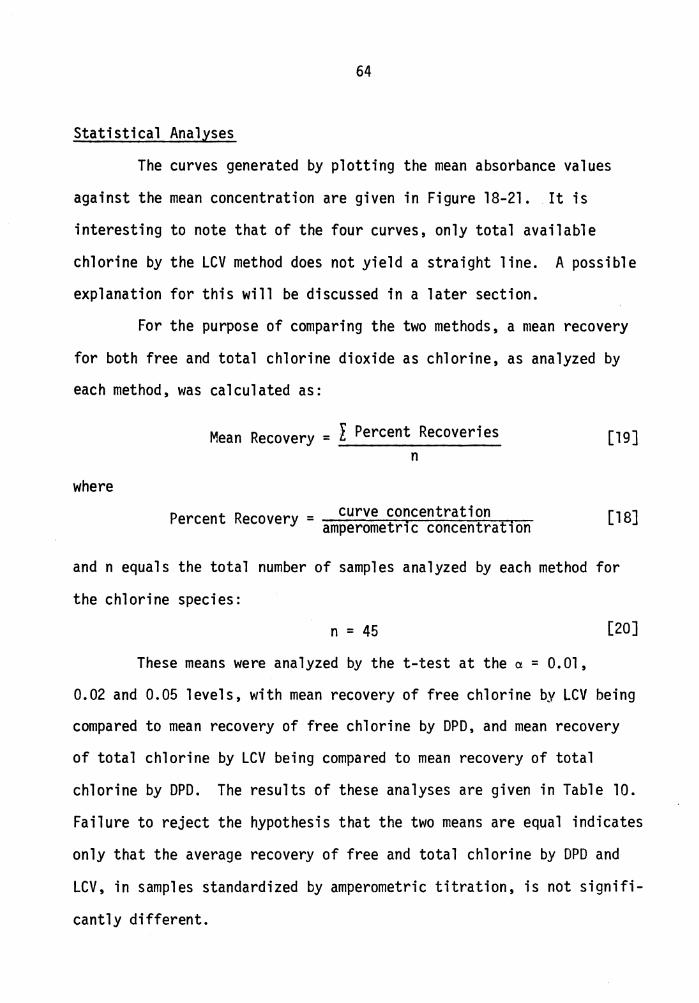
Statistical Analyses
The curves generated by plotting the mean absorbance values
against the mean concentration are given in Figure 18-21. It is
interesting to note that of the four curves, only total available
chlorine by the LCV method does not yield a straight line. A possible
explanation for this will be discussed in a later section.
For the purpose of comparing the two methods, a mean recovery
for both free and total chlorine dioxide as chlorine, as analyzed by
each method, was calculated as:
where
Mean Recovery = l Percent Recoveries n
Percent Recovery = curve concentration amperometr1c concentration
[19]
[18]
and n equals the total number of samples analyzed by each method for
the chlorine species:
n = 45 [20]
These means were analyzed by the t-test at the a= 0.01,
0.02 and 0.05 levels, with mean recovery of free chlorine by LCV being
compared to mean recovery of free chlorine by DPD, and mean recovery
of total chlorine by LCV being compared to mean recovery of total
chlorine by DPD. The results of these analyses are given in Table 10.
Failure to reject the hypothesis that the two means are equal indicates
only that the average recovery of free and total chlorine by DPD and
LCV, in samples standardized by amperometric titration, is not signifi-
cantly different.

Q) u c: It!
..0 s... 0 Cl)
..0 CJ:
0.5
0.4
0.3
0.2 r ./ -I
0. 1
0.2 0.4 0.6 0.8 1.0 1.2 1.4 1.6 1.8 2.0 Concentration, mg/l Cl2
Figure 18. Standard curve for Cl02 as total available chlorine by DPD, mean absorbance vs mean concentration (15 replicates for each point).
°' 01

CIJ u c: n:s .c s... 0 VI .c c(
0.5
0.4
0.3
0.2 ._ - .
0. l
0.2 0.4 0.6 0.8 1.0 1.2 1.4 1.6 1.8 2.0 Concentration, mg/l Cl2
Figure 19. Standard curve for Cl02 as free available chlorine by DPD, mean absorbance vs mean concentration (15 replicates for each point).
C'\ C'\

0.5
0.4
0.3 Q) u c: ,.,
..a S-0 Vl ..a <t 0.2
o. l
I-
0.2 0.4 0.6 0.8 1.0
/
5.0 cm path length
;\ = 592 nm
1.2 1.4 .6 Concentration, mg/l Cl2
r:-s
Figure 20. Standard curve for Cl02 as total available chlorine by LCV, mean absorbance vs mean concentration (15 replicates for each point).
-I O'l .......
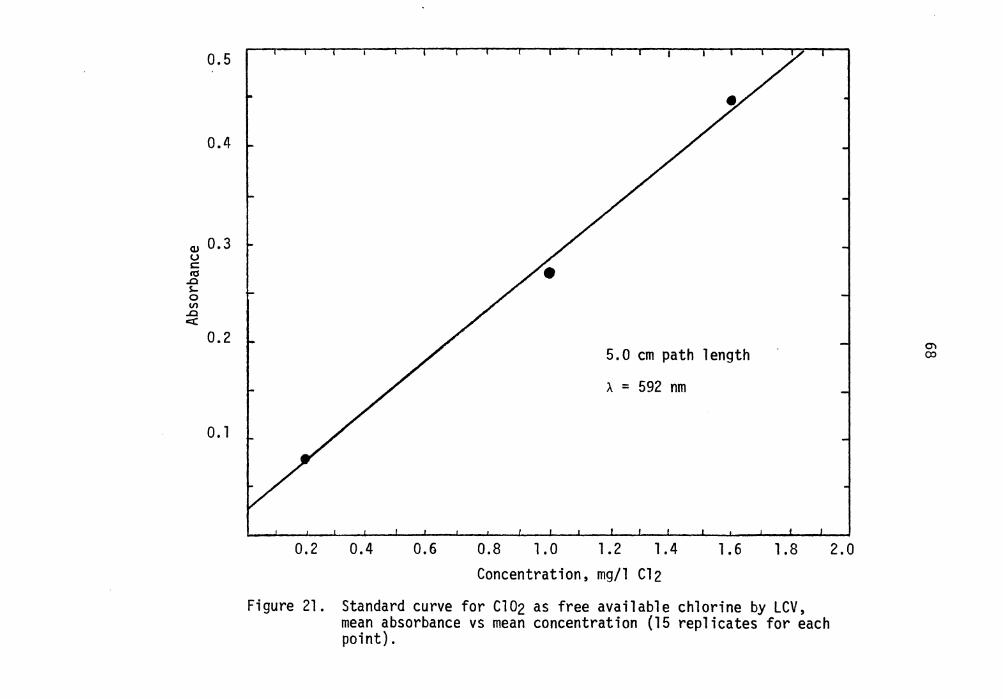
0.5
0.4
<1J 0.3 u s:: l'tS .0 s... 0 VI .0 c::(
0.2
0. 1
0.2 0.4 0.6 0.8 1.0
5.0 cm path length
>. = 592 nm
1.2 1.4 1.6 Concentration, mg/l Cl2
1.8
Figure 21. Standard curve for Cl02 as free available chlorine by LCV, mean absorbance vs mean concentration (15 replicates for each point).
2.0
°' o:>

0. 01
0.02
0.05
69
Table 10
Results of the T-Test on the Mean Recoveries of Free
Chlorine and Total Chlorine by LCV and DPD
2.643 45
2.375 45
1. 910 45
Note: Ho:µl = µ2
HA: µ1 = µ2
Free Chlorine Calculated t = 0.23
Fail to Reject
Fai 1 to Reject
Fail to Reject
l Yl - Y2l Reject if:
MSw~ l + 1' nl n2
Total Chlorine Calculated t = 0.595
Fail to Reject
Fail to Reject
Fail to Reject
> ta[n1 + n2 - 2]

70
The sample variance
[21] n - 1
where
Y = percent recovery value
n = number of observations
was calculated for the recovery of free and total chlorine dioxide
as chlorine by DPD and LCV, and these variances were compared using
the F-test at the a = 0.01 and 0.05 levels. As in the previous
statistical analysis, the sample variance of free chlorine recovery
by the DPD method was compared to the sample variance of free chlorine
recovery by LCV, and the sample variance of total chlorine recovery
by DPD was compared to the sample variance of total chlorine recovery
by LCV. The results of these analyses are given in Table 11.
Rejection of the hypothesis that the sample variances are
equal in all cases indicates that there is a significant difference
in the scattering of the data between the two methods.
Both methods give greater than 100 percent recovery of applied
chlorine dioxide dose, as standardized by amperometric titration, but
the lower sample variance values for the DPD procedures indicate less
scatter in the data. It can be concluded, therefore, that DPD is a
more precise analytical method for Cl02 as both free and total chlorine
than is leuco crystal violet.

71
Table 11
Results of the F-Test on the Sample Variances of the Free Chlorine
and Total Chlorine Analyses by DPD and LCV
a
o. 01
0.05
l/F a v2 = v1 F Free Chlorine 2 = n-1 Calculated F = 0.43
0.44
0.60
44 Reject
44 Reject
Note: H0 :a~ = a~ Reject if:
H ·a2 = a2 A. l 2
Total Chlorine Calculated F = 0.05
Reject
Reject
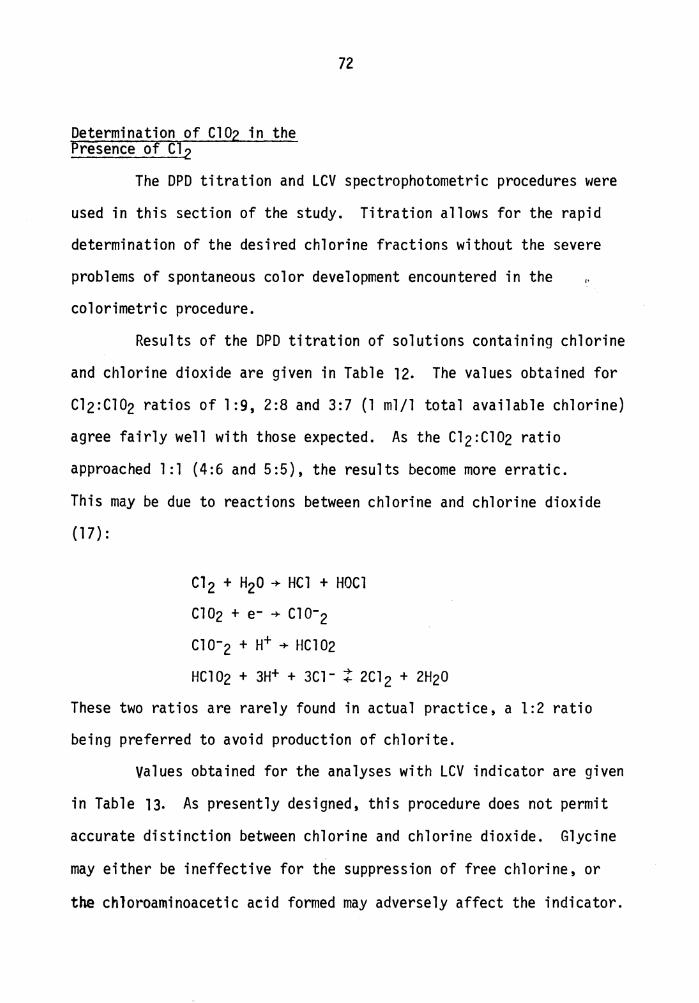
72
Determination of Cl02 in the Presence of C1 2
The DPD titration and LCV spectrophotometric procedures were
used in this section of the study. Titration allows for the rapid
determination of the desired chlorine fractions without the severe
problems of spontaneous color development encountered in the
colorimetric procedure.
Results of the DPD titration of solutions containing chlorine
and chlorine dioxide are given in Table 12. The values obtained for
Cl2:Cl02 ratios of 1:9, 2:8 and 3:7 (1 ml/l total available chlorine)
agree fairly well with those expected. As the Cl2:Cl02 ratio
approached 1:1 (4:6 and 5:5), the results become more erratic.
This may be due to reactions between chlorine and chlorine dioxide
(17):
Cl2 + H20 + HCl + HOCl
Cl02 + e- + Cl0-2
c10-2 + H+ + HC102
HCl02 + JH+ + 3Cl- ! 2Cl2 + 2H20
These two ratios are rarely found in actual practice, a 1:2 ratio
being preferred to avoid production of chlorite.
values obtained for the analyses with LCV indicator are given
in Table 13. As presently designed, this procedure does not permit
accurate distinction between chlorine and chlorine dioxide. Glycine
may either be ineffective for the suppression of free chlorine, or
the chloroaminoacetic acid formed may adversely affect the indicator.
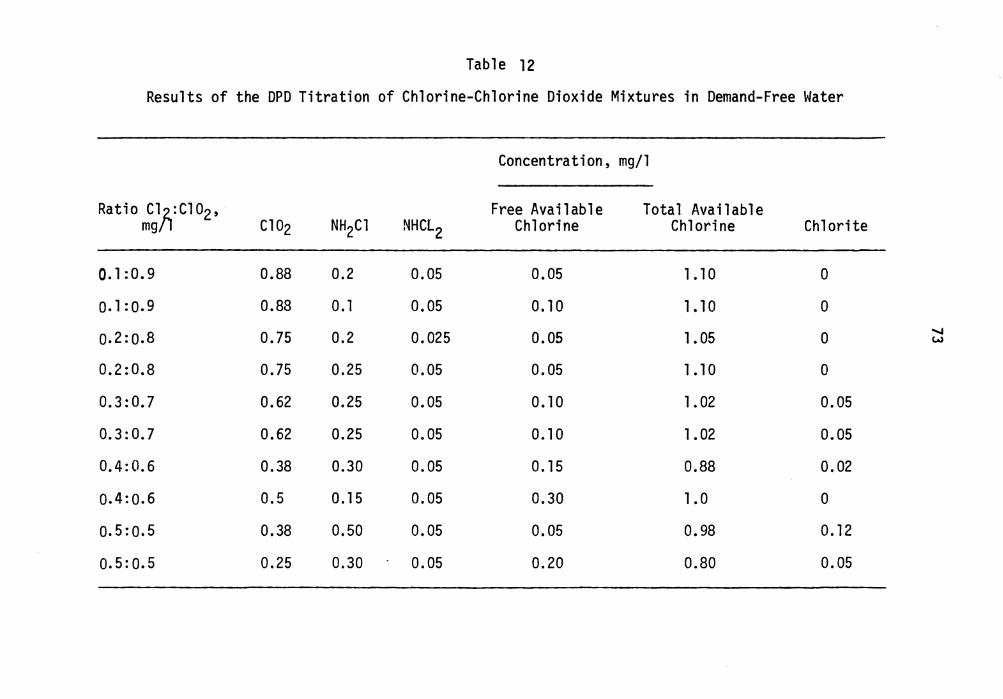
Table 12
Results of the DPD Titration of Chlorine-Chlorine Dioxide Mixtures in Demand-Free Water
Concentration, mg/l
Ratio c1A: Cl o2, Free Available Total Available mg Cl02 NH2Cl NHCL2 Chlorine Chlorine Chlorite
0.1 :0.9 0.88 0.2 0.05 0.05 1.10 0
o.l:0.9 0.88 0. l 0.05 0. 10 1.10 0
0.2:0.8 0.75 0.2 0.025 0.05 1.05 0 ....... w
0.2:0.8 0.75 0.25 0.05 0.05 1.10 0
0.3:0.7 0.62 0.25 0.05 0. 10 1.02 0.05
0.3:0.7 0.62 0.25 0.05 0.10 1.02 0.05
0.4:0.6 0.38 0.30 0.05 0. 15 0.88 0.02
o.4:o.6 0.5 0.15 0.05 0.30 1.0 0
o.5:0.5 0.38 0.50 0.05 0.05 0.98 0. 12
o.5:o.5 0.25 0.30 0.05 0.20 0.80 0.05
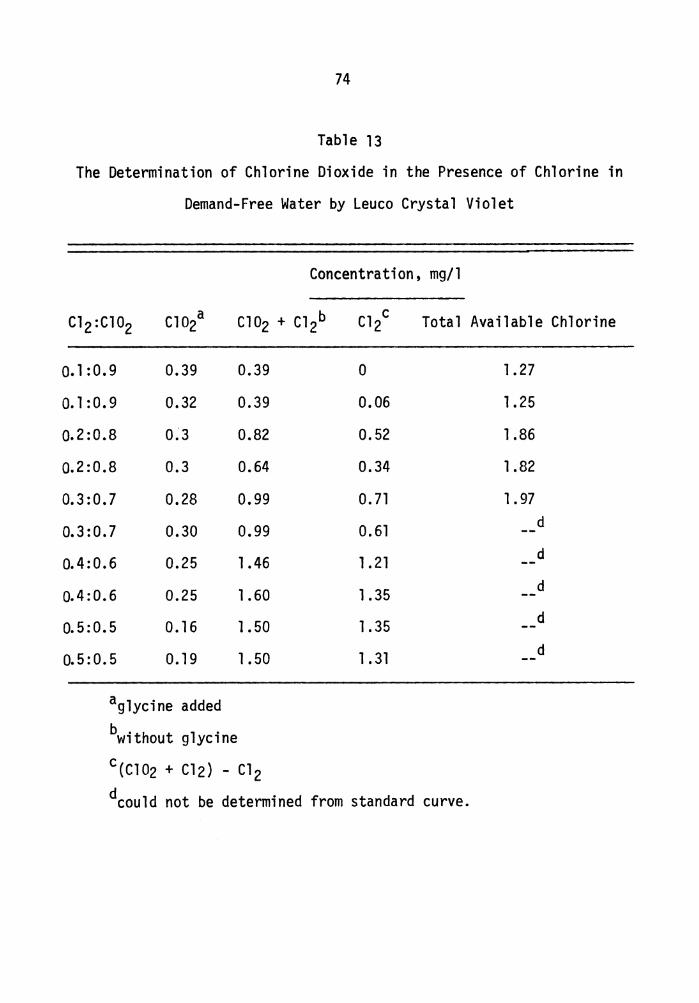
74
Table 13
The Determination of Chlorine Dioxide in the Presence of Chlorine in
Demand-Free Water by Leuco Crystal Violet
Concentration, mg/l
Cl2:Cl02 Cl02a Cl02 + Cl2b Cl2c Total Available Chlorine
o. l : 0. 9 0.39 0.39 0 1.27
o. l : 0. 9 0.32 0.39 0.06 1.25
o.2:0.8 0;3 0.82 0.52 1.86
o. 2: 0 .8 0.3 0.64 0.34 1.82
0. 3: 0. 7 0.28 0.99 0.71 1. 97
o. 3: 0. 7 0.30 0.99 0.61 d
o. 4: 0. 6 0.25 1.46 1.21 d
o. 4: 0. 6 0.25 1.60 1.35 d
0.5:0.5 0.16 1.50 1.35 d
o.5:0.5 0.19 1.50 1.31 d
aglycine added
bwithout glycine
c(Cl02 + Cl2) - Cl2
dcould not be determined from standard curve.
75
The color developed in the total chlorine procedure was so
intense that a concentration could not be determined from the standard
curve used {Fig. 20). In no instance did the values obtained even
approximate the concentrations present in solution.
The structure of leuco crystal violet may contribute to the
problems encountered in this analysis. Chlorine dioxide has been
proven capable of cleaving ring structures {26), and this mechanism
may be involved in the color reaction. Attack on the rings possibly
occurs at a rate which increases rapidly with only a small increase
in Cl02 concentration as shown by the curvilinear line in Figure 20.
Mixtures of halogens, and the presence of KI in the total chlorine
buffer, may increase the rate of chloride substitution and hydride
transfer { Eqn. [17]) involved in the reduction to crystal violet,
explaining the intense color produced in the total chlorine analysis.

V. SUMMARY AND CONCLUSIONS
The spontaneous color development phenomenon exhibited by DPD
in solution was investigated as a function of pH and time. It was
found that close control of reaction and pH were essential to the DPD
spectrophotometric procedure. The absorbance of the DPD-Cl02 complex
increased with time in both demand-free water and secondary effluent.
When only the DPD reagent is present in buffer or demand-free water,
absorbance increases with time above pH 6.
A statistical comparison of the mean recovery of free and total
chlorine dioxide by both of the procedures was made, and they were not
found to be significantly different, but the sample variances calcu-
lated for the two procedures indicated a significant difference in the
data scatter.
The analysis of chlorine dioxide by DPD and LCV was studied,
and the capability of these two procedures to determine chlorine
dioxide in the presence of chlorine was investigated.
The significant conclusions that can be derived from this
project are:
1. Close control of reaction time and pH are essential to the
DPD spectrophotometric procedures.
2. In the titration of DPD with standard FAS, the spontaneous
development of color occurs at a relatively constant rate regardless
of the reaction medium and concentration or type of halogen present.
76

77
3. Both the DPD and LCV spectrophotometric procedures exhibit
greater than 100 percent recovery of applied chlorine dioxide dose as
standardized against amperometric titration. The mean recovery of
45 samples each of free and total chlorine by both procedures are not
significantly different, but DPD is the more precise analytical method.
4. Leuco crystal violet is not a satisfactory method for the
determination of chlorine dioxide in the presence of chlorine. The
figures obtained for free chlorine did not approximate the concentra-
tions actually in solution, and the color produced by the total chlorine
procedure was too intense to be read spectrophotometrically.
5. The DPD titrametric procedure is a satisfactory method for
the determination of chlorine dioxide in the presence of chlorine in
demand-free water, in the range of c1 2:c102 ratios of 1:9 to 3:7,
showing a 94 percent recovery as standardized against amperometric
titration.

LITERATURE CITED
78

79
VI. LITERATURE CITED
1. Miltner, R. J., "The Effect of Chlorine Dioxide on Trihalomethanes in Drinking Water. 11 M.S. Thesis, University of Cincinnati, (1976).
2. Bunn, W. W. et ll·, "Formation of Trihalomethanes by Chlorination of Surface Waters. 11 En vi r. Letters, JQ, 205 ( 1975).
3. McDermott, J. H., "Virus Problems and Their Relation to Water Supplies. 11 Jour. Amer. Water Works Assoc., 66, 693 (1974).
4. Weber, W. J., Jr., 11 Physicochemical Processes for Water Quality Control. 11 Wiley-Interscience Publishers, New York (1974).
5. Culp, G. L., and Culp, R. L., 11 Disinfection. 11 New Concepts in Water Purification, Van Nostrand Rheinhold Co., New York (1974).
6. Chance, J. C., "The Effect of pH and Exposure Time on the Bac-terial Efficiency of Bromine Chloride Against Streptococcus faecalis. 11 M.S. Thesis, VP! & SU (1976).
7. Augenstein, H. W., "Use of Chlorine Dioxide to Disinfect Water Supplies. 11 Jour. Amer. Water Works Assoc., 66, 716 (1974).
8. Diaper, E.W. J., "Disinfection of Water and Wastewater Using Ozone. 11 In 11 Disinfection--Water and Wastewater." J. D. Johnson [Ed.], Ann Arbor Publishers, Ann Arbor (1975).
9. McCarthy, J. A., 11 BromineandChlorine as Water Disinfectants." Jour. New Eng. Water Works Assoc., 58, 55 (1944).
10. Chang, S. L., and Morris, J. C., "Elemental Iodine as a Disinfec-tant for Drinking Water. 11 Ind. Eng. Chem., 45, 1009 (1953).
11. Oliver, B. G., and Carey, J. H., 11 A Scale-up Investigation of Ultraviolet Disinfection as an Alternative to Chlorination for Sewage Effluents." Can. Jour. Chem. Eng., 53, 711 (1975).
12. Murphy, R. A., Kakehi, K., and Sarkanen, K. V., "Studies on the Mechanism of Chlorine Dioxide Bleaching," TAPP!, 44, 465 (1961).
13. Aston, R. N., "Chlorine Dioxide Use in Plants on the Niagara Border. 11 Jour. Amer. Water Works Assoc., 39, 687 ( 1947).

80
14. White, G. C., "Handbook of Chlorination." Van Nostrand Rheinhold Co., New York (1972}.
15. Bernarde, M. A. et al., "Efficiency of Chlorine Dioxide as a Bactericide ... -Applied Micro., Jl., 5 ( 1976}.
16. McGhee, J. S., Jr., "The Behavior of Chlorine Dioxide in the Disinfection of E. coli and Its Determination by the DPD Method of Analysis." M-:-s.The'sis, VPI & SU (1976).
17. Gordon, G. et al., "The Chemistry of Chlorine Dioxide." In 11 Progressinlnorganic Chemistry." S. J. Lippard [Ed.], Wiley-Interscience Publishers, New York (1972).
18. Kesting, E., "The Manufacture and Properties of Chlorine Dioxide." TAPPI, ~' 166 (1953).
19. lngols, R. S., and Ridenour, G. M., "Chemical Properties of Chlorine Dioxide in Water Treatment." Jour. New Eng. Water Works Assoc., 40, 1207 (1948}.
20. Myhrstad, J. A., and Samdal, J. E., "Behavior and Determination of Chlorine Dioxide." Jour. Amer. Water Works Assoc., fil_, 205 (1969).
21. lngols, R. S., and Ridenour, G. M., "The Elimination of Phenolic Tastes by Chloro-Oxidation. 11 Water and Sewage Works, 95, 187 (1948).
22. Burttschell, R. H. et al., "Chlorine Derivatives of Phenol Causing Taste and Odor.-11 JOur. Amer. Water Works Assoc., 51, 205 (1959). -
23. Harlock, C.R., and Dowlin, M. R., "Chlorine and Chlorine Dioxide for the Control of Algae Odors. 11 Water and Sewage Works, 100, 74 (1953).
24. Faber, H. A., 11A Theory of Taste and Odor Reduction by Chlorine Dioxide. 11 Jour. Amer. Water Works Assoc., 39, 691 (1947).
25. Rosenblatt, D. H., "Chlorine and Oxychlorine Species Reactivity with Organic Substances." In 11 Disinfection--Water and Waste-water." J. D. Johnson [Ed.], Ann Arbor Science Publishers, Ann Arbor (1975).
26. Sarkanen, K. V. et al., "Studies on Oxidative Delignification Mechanisms. Par~I. Oxidation of Vanillin with Chlorine Dioxide. 11 TAPPI, 45, 24 (1962).

81
27. Dennis, W. H. et tl·, 110xi dati on of Amines. IV. Oxidative Frag-mentation. 11 Jour. Org. Chem., 32, 3783 (1967).
28. Coote, R., "Chlorine Dioxide Treatment at Valparaiso, Indiana. 11 Water and Sewage Works, 97, 13 (1950).
29. Ringer, W. C., and Campbell, S. J., 11 Use of Chlorine Dioxide for Algae Control at Philadelphia. 11 Jour. Amer. Water Works Assoc., 47' 740 (1955).
30. Synan, J. F., MacMahon, J. D., and Vincent, G. P., "Chlorine Dioxide--A Development in the Treatment of Potable Water. 11 Water and Sewage Works, 21., 423 (1944).
31. Granstrom, M. L., and Lee, G. F., "Generation and Use of Chlorine Dioxide in Water Treatment." Jour. Amer. Water Works Assoc., 50, 1453 (1958).
32. "Standard Methods for the Examination of Water and Wastewater. 11 14th ed., Amer. Pub. Health Assoc., Washington, D.C. (1976).
33. Aston, R. N., and Synan, J. F., 11 Chl ori ne Dioxide as a Bacteri-cide in Water Works Operation." Jour. New Eng. Water Works Assoc., 62, 80 (1948).
34. Ridenour, G. M., and Armbruster, E. H., "Bactericidal Effects of Chlorine Dioxide. 11 Jour. Amer. Water Works Assoc., 41, 537 (1949). . -
35. Bernarde, M. A. et al., "Kinetics and Mechanisms of Bacterial Disinfection by Chlorine Dioxide." Applied Micro., 1§_, 257 (1967).
36. Bernarde, M.A. et al., "Efficiency of Chlorine Dioxide as a Bac-tericide.11 Applied Micro., .11, 776 (1965).
37. Ridenour, G. M., and Ingols, R. S., "Inactivation of Poliomyelitis Virus by 'Free' Chlorine." Jour. New Eng. Water Works Assoc., 36 ' 6 39 ( 19 46 ) .
38. Ridenour, G. M., Ingols, R. S., and Annbruster, E. H., 11Sporicidal Properties of Chlorine Dioxide. 11 Water and Sewage Works, 96, 279 (1949).
39. Olivieri, V. P. et al., 11The Comparative Mode of Action of Chlorine, Bromine, and Iod1ne on f2 Bacterial Virus. 11 In "Disinfection--Water and Wastewater. 11 J. D. Johnson [Ed.], Ann Arbor Publishers, Ann Arbor (1975).
40. Solle, F. W. et al., "Bromine Disinfection of Wastewater Efflu-ents.11 In-irD1sinfection--Water and Wastewater. 11 J. D. Johnson [Ed.], Ann Arbor Publishers, Ann Arbor (1975).
82
41. Johnson, J. D. , and Sun, W. , "Bromine Disinfection of Wastewater. 11
In 11 Disinfection--Water and Wastewater." J. D. Johnson [Ed.], Ann Arbor Publishers, Ann Arbor (1975).
42. Stringer, R. P. et al., "Comparison of Bromine, Chlorine, and Iodine as Dis1nfectants for Amoebic Cysts." In "Disinfection--Water and Wastewater." J. D. Johnson [Ed.], Ann Arbor Pub-lishers, Ann Arbor {1975).
43. Mills, J. F., 11 Interhalogens and Halogen Mixtures as Disinfec-tants. 11 In "Di si nfection--Water and Wastewater. 11 J. D. Johnson [Ed.], Ann Arbor Publishers, Ann Arbor {1975).
44. Taylor, R. B., "A Comparison of Bromine Chloride and Chlorine for the Disinfection of Municipal Wastewater." M.S. Thesis, VPI & SU, Blacksburg (1975).
45. Black, A. P., Lackey, J. B., and Lackey, E. W., 11 Effectiveness of Iodine for the Disinfection of Swimming Pool Water. 11
Amer. Jour. Pub. Health, 49, 1060 (1959).
46. Black, A. P., "Swimming Pool Disinfection with Iodine." Water and Sewage Works, 108, 286 (1961).
47. Black, A. P. et al., 11 Use of Iodine for Disinfection." Jour. Amer. Water-Works Assoc., 57, 1401 (1965).
48. Holden, W. S., 11 Water Treatment and Examination. 11 J. and A. Churchill, London (1970).
49. Shuva l, H. I., and Gruener, N. , 11 Hea 1th Considerations in Renovating Water for Domestic Reuse. 11 Envir. Sci. Tech., 7, 600 ( 1973). -
50. Long, W. N., and Bell, F. A., Jr., "Health Factors and Reused Water." Jour. Amer. Water Works Assoc., 64, 220 {1972).
51. Brodtman, N. V., Jr., "Continuous Analysis of Chlorinated Hydro-carbon Pesticides in the Lower Mississippi River. 11 Bull. Envir. Cont. and Tox., Ji, 33 (1976). --
52. Foulk, C. W., and Bowden, A. T., 11A New Type of Endpoint in Electrometric Titration and Its Application to Iodimetry. 11
Jour. Amer. Chem. Soc., 48, 2045 (1926).
53. Marks, H. C. , and Glass, J. R. , "A New Method of Determining Residual Chlorine." Jour. Amer. Water Works Assoc., 34, 1227 (1942). -

83
54. Marks, H. C., "Residual Chlorine by Amperometric Titration." Jour. New Eng. Water Works Assoc., 66, l (1952).
55. Marks, H. C., and Bannister, G. L., "Amperometric Methods in the Control of Water Chlorination." Anal. Chem., ~' 200 (1949}.
56. Marks, H. C. et al., "Determination of Residual Chlorine Com-pounds. 11 JOuY:-:- Amer. Water Works Assoc. , 43, 201 ( 1951}.
57. Mahan, W. A., "Simplified Amperometric Titration Apparatus for Determining Residual Chlorine in Water." Water and Sewage Works, 96, 171 (1949}.
58. Haller, J. F., and Listek, S.S., "Determination of Chlorine Dioxide and Other Active Chlorine Compounds in Water." Anal. Chem., 20, 639 (1948}. --
59. Nicolson, N. J., "An Evaluation of the Methods for Determining Residual Ch 1 ori ne in Water. Part I. Free Ch 1 ori ne. 11 The Analyst, 90, 187 (1965}.
60. Moore, W. A., "Use of £_-Aminodimethylaniline as an Indicator of Free Chlorine." Jour. Amer. Water Works Assoc., 35, 427 ( 1943}.
61. Palin, A. T., "The Determination of Free and Combined Chlorine in Water by the Use of Oiethyl-p-pheny1ene Diamine. 11 Jour. Amer. Water Works Assoc., 49, 873 (1957).
62. Pa 1 in, A. T., "Co 1 orimetri c Determi nation of Ch 1 ori ne Dioxide in Water." Water and Sewage Works, 107, 457 (1960).
63. Pa 1 in, A. T. , "Methods for the Determination, in Water, of Free and Combined Available Chlorine, Chlorine Dioxide and Chlorite, Bromine, Iodine, and Ozone, Using Diethyl-p-Phenylene Diamine (DPD}. 11 Jour. Inst. Water Eng.,£1., 537 (1967).
64. Palin, A. T., "Determining Chlorine Dioxide and Chlorite. 11 Jour. Amer. Water Works Assoc., 62, 483 (1970).
65. Palin, A. T., "Analytical Control of Water Disinfection with Special Reference to Differential DPD Methods for Chlorine, Chlorine Dioxide, Bromine, Iodine, and Ozone." Jour. Inst. Water Eng., 28' 139 ( 197 4} .
66. Palin, A. T., "Current OPO Methods for Residual Halogen Compounds and Ozone in Water." Jour. Amer. Water Works Assoc., 67, 32 (1975).
84
67. Lin, S., Hullinger, D. L., and Evans, R. L., "Selection of a Method to Determine Residua 1 Ch 1 ori ne in Sewage Effluent. 11 Water and Sewage Works, 118, 360 (1971).
68. Black, A. P., and Whittle, G. P., "New Methods for the Colori-metric Detennination of Halogen Residuals. Part I. Iodine, Iodide, and Iodate. 11 Jour. Amer. Water Works Assoc., 59, 471 (1967). -
69. Black, A. P., and Whittle, G. P., 11 New Methods for the Determina-tion of Halogen Residuals. Part II. Free and Total Chlorine. 11
Jour. Amer. Water Works Assoc., 59, 607 (1967).
70. Layton, R. F., and Kinman, R. N., 11 A New Analytical Method for Ozone. 11 In "National Specialty Conference on Disinfection." American Society of Civil Engineers, Washington, D.C. (1970).
71. Post, M. A., and Moore, W. A., "The Determination of Chlorine Dioxide in Treated Surface Waters. 11 Anal. Chem., 31, 1872 (1959). -
72. Masschelein, W., "Spectrophotometric Determination of Chlorine Dioxide with Acid Chrome Violet K. 11 Anal. Chem., 38, 1859 (1966). -
73. Hodgden, H. W., and Ingels, R. S., "Direct Colorimetric Method for the Detennination of Chlorine Dioxide in Water. 11 Anal. Chem., 26, 1225 (1954).
74. Woodfin, W. L., 11A Comparison of the Bactericidal Efficiency of Chlorine and Bromine Chloride. 11 M.S. Thesis, VPI & SU (1975).
APPENDIX A
REAGENTS
85

86
Table Al
Reagents for the DPD Method
1. Phosphate Buffer Solution:
Dissolve 24 gm anhydrous Na2HP04 and 46 gm anhydrous KH2Po4 in 500 ml distilled water. Dissolve 800 mg Na2-EDTA in 100 ml dis-tilled water. Combine these two solutions in a one liter volumetric flask and dilute to the mark. Add 20 mg HgC1 2 to inhibit mold growth.
2. DPD Reagent:
Dissolve 200 mg Na2-EDTA in chlorine free water. Add 8 ml of 1+3 H2so4, and 1 gm of DPD oxalate powder (Eastman 7102). Dilute to 1 liter. Store in a brown bottle at 4°C. Discard when discolored.
3. Standard FAS titrant:
Add 1.106 gm ferrous ammonium sulfate to freshly boiled and cooled distilled water containing 1 ml 1+3 H2so4. Dilute to one liter. Standardize against potassium dichromate (0.00284 !:!_). Discard after one month.

87
Table A2
Reagents for the Leuco Crystal Violet Procedure
1. Free Chlorine Buffer
a. Potassium hydroxide, 4 M:
Dissolve 224.4 gm KOH and dilute to one liter with demand free water.
b. Citric Acid, 2 M:
Dissolve.384.3 gm c6H8o7 (or 420.3 gm c6H8o7 • H20) and dilute to one liter.
c. Potassium Citrate Solution.
Mix 4M KOH and 2M citric acid in the ratio of 1:2 (350 ml:700 ml). Use immediately and discard any remaining.
d. Acetate Solution
Dissolve 161.2 gm glacial acetic and 49.5 gm NaH2H3o2 (or 82.l gm NaC2H3o2 • 3H20) and dilute to one liter.
e. Final Buffer.
Mix equal volumes of potassium citrate (c) and acetate (d). Add 20 mg HgC1 2 to inhibit mold growth. Final pH = 4.0.
2. Total Chlorine Buffer
Dissolve 480 gm glacial acetic acid and 146 gm NaC2H302 (or 243 gm NaC~H~02 • 3H?O) in 300 ml distilled water. Dilute to one liter. Transfer to a brown bottle and add 3 gm KI. Avoid undue exposure to the air.
3. Leuco Crystal Violet Indicator
a. Stock reagent
Add 14.0 ml 85% orthophosphoric acid to 500 ml demand free water in a brown bottle (one liter capacity). While gently
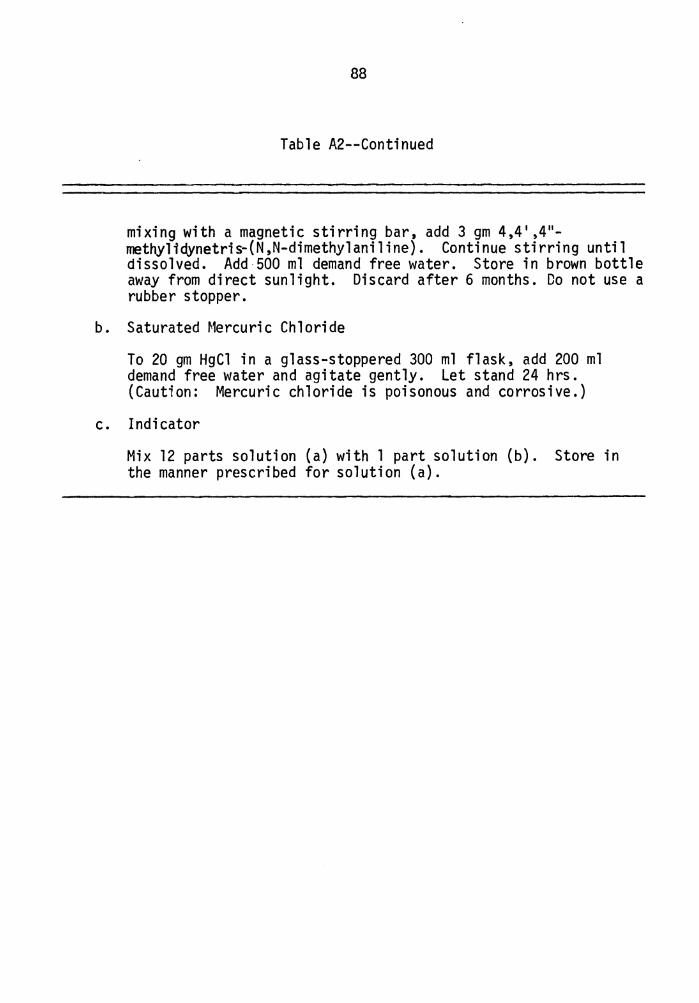
88
Table A2--Continued
mixing with a magnetic stirring bar, add 3 gm 4,4' ,4"-methylidynetris-(N,N-dimethylaniline). Continue stirring until dissolved. Add 500 ml demand free water. Store in brown bottle away from direct sunlight. Discard after 6 months. Do not use a rubber stopper.
b. Saturated Mercuric Chloride
To 20 gm HgCl in a glass-stoppered 300 ml flask, add 200 ml demand free water and agitate gently. Let stand 24 hrs. (Caution: Mercuric chloride is poisonous and corrosive.)
c. Indicator
Mix 12 parts solution (a) with l part solution (b). Store in the manner prescribed for solution (a).
APPENDIX B
BUFFERS
89

90
Table Bl
S~rensen Phosphate Buffers
pH a mls xb mls ye
5.7 93.5 6.5 5.8 92.0 8.0 5.9 90.0 10.0 6.0 87.7 12.3 6. 1 85.0 15.0 6.2 81.5 18.5
6.3 77 .5 22.5 6.4 73.5 26.5 6.5 68.5 31.5 6.6 62.5 37.5 6.7 56.5 43.5 6.8 51.0 49.0
6.9 45.0 55.0 7.0 39.0 61.0 7. 1 33.0 67.0 7.2 28.0 72.0 7.3 23.0 77 .o 7.4 19.0 81.0
7.5 16.0 84.0 7.6 13.0 87.0 7.7 10.5 90.5 7.8 8.5 91.5 7.9 7.0 93.0 8.0 5.2 94.7
aMix given amounts of Solutions X and Y for the pH desired.
bSolution X = 0.2 MNaHl04.
cSolution Y = 0.2MNa2HP04.
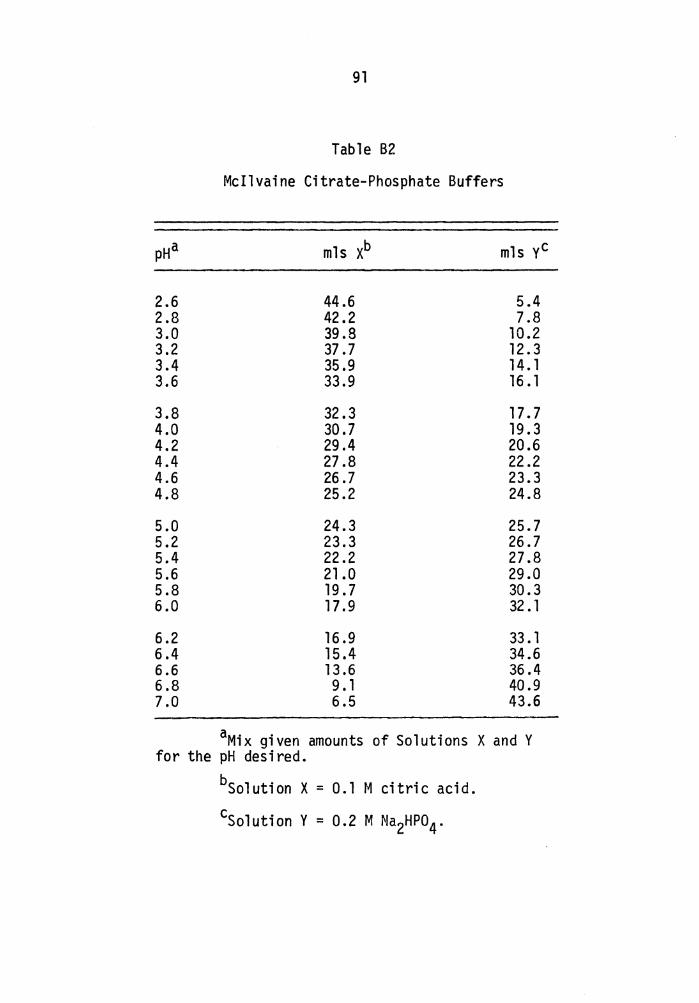
91
Table B2
Mcilvaine Citrate-Phosphate Buffers
pH a mls xb mls yc
2.6 44.6 5.4 2.8 42.2 7.8 3.0 39.8 10.2 3.2 37.7 12.3 3.4 35.9 14. 1 3.6 33.9 16. 1
3.8 32.3 17.7 4.0 30.7 19.3 4.2 29.4 20.6 4.4 27.8 22.2 4.6 26.7 23.3 4.8 25.2 24.8
5.0 24.3 25.7 5.2 23.3 26.7 5.4 22.2 27.8 5.6 21.0 29.0 5.8 19.7 30.3 6.0 17. 9 32 .1
6.2 16.9 33. 1 6.4 15.4 34.6 6.6 13 .6 36.4 6.8 9. l 40.9 7.0 6.5 43.6
aMix given amounts of Solutions X and Y for the pH desired.
bSolution X = 0.1 M citric acid.
cSolution Y = 0.2 M Na2HP04.
APPENDIX C
RAW DATA TABLES
92
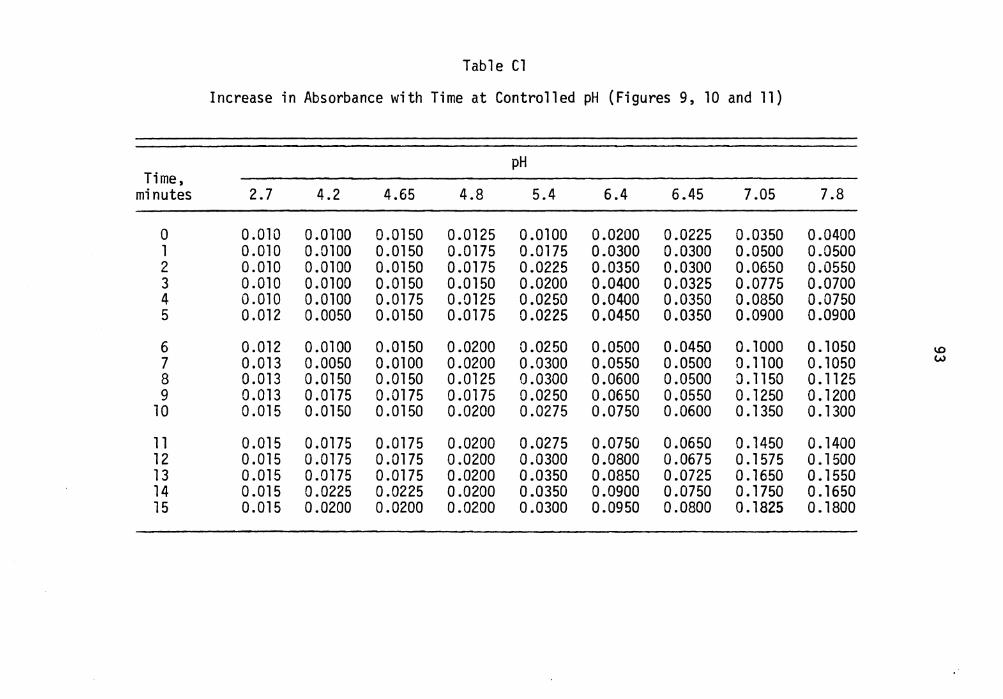
Table Cl
Increase in Absorbance with Time at Controlled pH (Figures 9, 10 and 11)
pH Time,
minutes 2.7 4.2 4.65 4.8 5.4 6.4 6.45 7.05 7.8
0 0.010 0 .0100 0.0150 0.0125 0 .0100 0.0200 0.0225 0.0350 0.0400 l 0.010 0 .0100 0.0150 0.0175 0.0175 0.0300 0.0300 0.0500 0.0500 2 0.010 0.0100 0.0150 0.0175 0.0225 0.0350 0.0300 0.0650 0.0550 3 0.010 0 .0100 0.0150 0.0150 0.0200 0.0400 0.0325 0.0775 0.0700 4 0.010 0.0100 0.0175 0.0125 0.0250 0.0400 0.0350 0.0850 0.0750 5 0.012 0.0050 0.0150 0.0175 0.0225 0.0450 0.0350 0.0900 0.0900
6 0.012 0 .0100 0.0150 0.0200 0.0250 0.0500 0.0450 0.1000 0. 1050 l.O
7 0.013 0.0050 0.0100 0.0200 0.0300 0.0550 0.0500 0 .1100 0. 1050 w 8 0.013 0.0150 0.0150 0.0125 0.0300 0.0600 0.0500 a. 1150 0. 1125 9 0.013 0 .0175 0.0175 0.0175 0.0250 0.0650 0.0550 0. 1250 0. 1200
10 0.015 0.0150 0.0150 0.0200 0.0275 0.0750 0.0600 0 .1350 o. Boo 11 0.015 0.0175 o .0175 0.0200 0.0275 0.0750 0.0650 0 .1450 0. 1400 12 0.015 0.0175 0.0175 0.0200 0.0300 0.0800 0.0675 0. 1575 0. 1500 13 0.015 0 .0175 0.0175 0.0200 0.0350 0.0850 0.0725 o .1650 0. 1550 14 0.015 0.0225 0.0225 0.0200 0.0350 0.0900 0.0750 0. 1750 0 .1650 15 0.015 0.0200 0.0200 0.0200 0.0300 0.0950 0.0800 0. 1825 0. 1800

Table C2
DPD Timed Color Development in Demand-free Water--
Spectrophotometric Method (Figures 12-14)
Cl02 Cl2 Blank --
A B c A B c Time (l.O mg/l) ( 1. 76 mg/l) ( 1. 7 mg/l) (.6 mg/l) ( .2 mg/ 1) (. 8 mg/l) A B c
0 0.095 0.385 0.300 1. 540 o.275 1. 73 o.075 0.035 0.060 1 0.115 1. 560 o.095 2 0. 135 1.560 0 .120 3 0. 155 1.560 0 .140 4 0. 170 1.560 0 .165 ~
~
5 0 .180 0.390 o.310 1.560 o.275 1. 72 o.185 0.075 0.095 6 0.200 1 .560 o.205 7 0.215 1. 560 Q.220 8 0.225 l. 560 o.235 9 0.235 1.560 Q.255
10 0.245 0. 395 0.315 l. 560 o.275 1. 72 o.270 0.100 0.105 11 0.260 1.560 o.285 12 0 .270 1.565 0 .305 13 0 .285 1.565 Q.320 14 0.295 1 .565 o.335
Note: 10.0 cm light path >.. = 552 nm A = Sample left in light path between readings; B = Sample left in room light
between readings; C = Sample removed to darkness between readings.
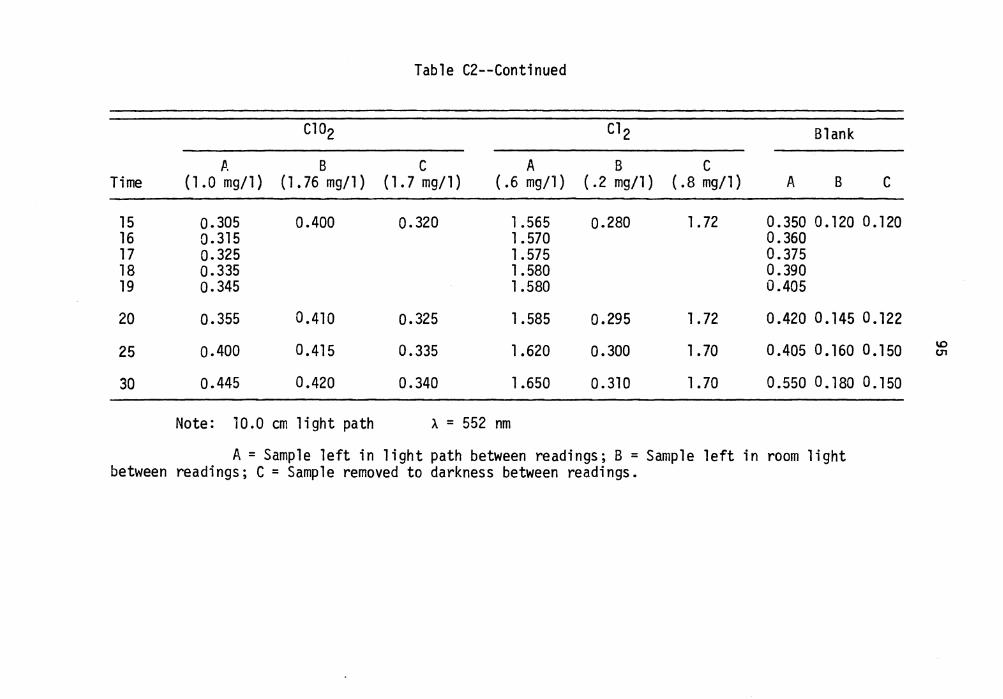
Table C2--Continued
Cl02 Cl 2 Blank
P. B c A B c Time { 1.0 mg/l) (l. 76 mg/l) ( l. 7 mg/l) (.6 mg/l) { .2 mg/l) {.Bmg/l) A B c
15 o.305 0.400 0.320 1.565 o.280 1.72 0.350 0.120 0.120 16 Q.315 1.570 0.360 17 o.325 1.575 0.375 18 o.335 1.580 0.390 19 0.345 l .580 0.405
20 o.355 0.410 0.325 1.585 0.295 1.72 0.420 0.145 0.122
25 o.400 0.415 0.335 1.620 0.300 1.70 0.405 0.160 0.150 \0 U'1
30 0.445 0.420 0.340 1.650 0.310 1.70 0.550 0.180 0.150
Note: 10.0 cm light path >. = 552 nm
A= Sample left in light path between readings; B = Sample left in room light between readings; C = Sample removed to darkness between readings.

Time
0 l 2 3 4
5 6 7 8 9
10 11 12 13 14
A (2 mg/l)
0.040 0.055 0.070 0.079 0.085
0.095 0. l 05 0. 110 0 .119 0. 122
0 .120 0. 135 0. 140 0 .145 0 .150
Table C3
DPD Timed Color Development in Filtered Secondary Effluent--
Spectrophotometric Method (Figures 15-17)
Cl02 Cl2
B c A B c ( 1. 16 mg/l) (1.16 mg/l) ( .5 mg/l) (1.16 mg/l) ( 1. 16 mg/l)
0 .100 0.050 0 .160 1.07 1.38 0.205 0.250 0.290 0.335
0 .140 0 .115 0.375 1.01 1.38 0.420 0 .460 0.500 0.540
0. 180 0. 155 0.580 0.98 1.37 0.620 0.650 0.700 0.730
-
Blank
A B c 0.015 0.015 0.015 0.020 0.022 0.025 0.028
0.030 8.030 0.025 0.032 0.035 0.038 0.040
0.040 0.045 0.035 0.042 0.045 0.045 0 .049
Note: c102 = 10.0 cm light path Cl 2 = 1.0 cm light path ). = 552 nm
A = light path; B = room light; C = darkness.
\0
°'

Table C3--Continued
Cl02 Cl2 Blank
A B c A B c Time (2 mg/l) (l.16 mg/l) ( 1. 16 mg/l) ( .5 mg/l) (l.16mg/l) ( 1.16 mg/1) A B c
15 o. 155 0.220 o.185 o.775 1.95 1.36 0.051 0.065 0.045 16 o. 159 0.820 0.055 17 o.162 0.860 0.058 18 o. 169 0.895 0.058 19 Q.175 0.930 0.059
20 o.179 0.240 0.210 0.970 0.93 1.35 0.060 0.085 0.055 \0
25 0.199 0.270 0.220 1.160 0.91 1.34 0.070 0.100 0.070 "' 30 0.215 0.300 0.245 1 .330 0.90 1.34 0.080 0.115 0.080
Note: Cl02 = 10.0 cm light path c1 2 = 1.0 cm light path ). = 552 nm
A= light path; B = room light; C = darkness.
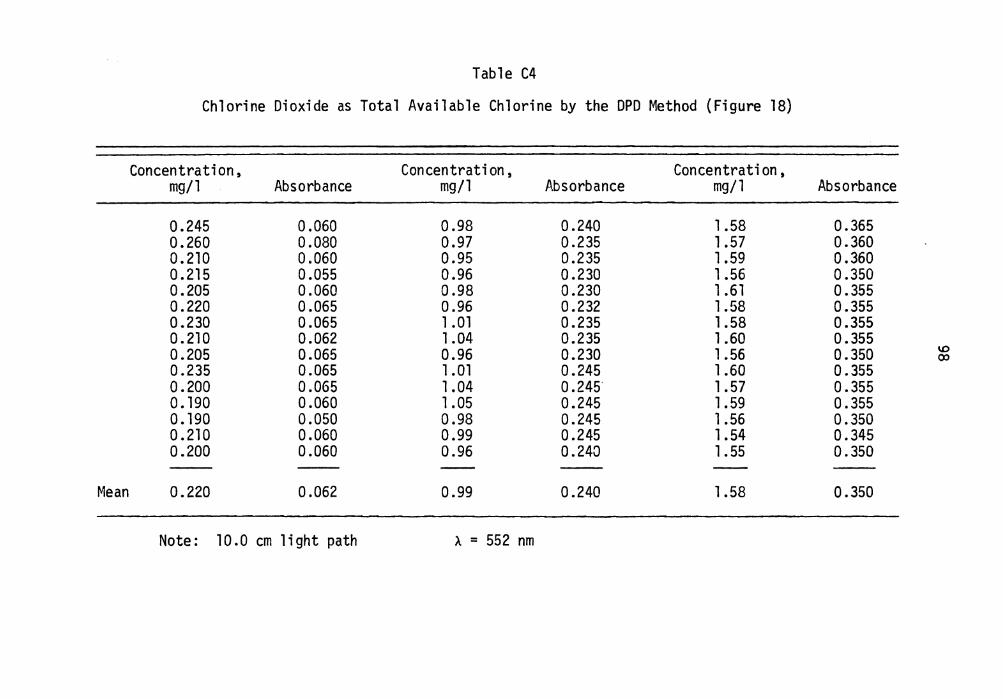
Table C4
Chlorine Dioxide as Total Available Chlorine by the DPD Method (Figure 18)
Concentration, Concentration, Concentration, mg/l Absorbance mg/l Absorbance mg/l Absorbance
0.245 0.060 0.98 0.240 1.58 0.365 0.260 0.080 0.97 0.235 1.57 0.360 0.210 0.060 0.95 0.235 1.59 0.360 0.215 0.055 0.96 0.230 1.56 0.350 0.205 0.060 0.98 0.230 1.61 0.355 0.220 0.065 0.96 0.232 1.58 0.355 0.230 0.065 1.01 0.235 1.58 0.355 0.210 0.062 1.04 0.235 1.60 0.355 0.205 0.065 0.96 0.230 1.56 0.350 "' 00 0.235 0.065 1.01 0.245 1.60 0 .355 0.200 0.065 1.04 0.245 1.57 0.355 0. 190 0.060 1.05 0.245 1.59 0.355 0.190 0.050 0.98 0.245 1.56 0.350 0.210 0.060 0.99 0.245 1.54 0.345 0.200 0.060 0.96 0.240 1.55 0.350
-- -- --Mean 0.220 0.062 0.99 0.240 1.58 0.350
Note: 10.0 cm light path A. = 552 nm

Table CS
Chlorine Dioxide as Free Available Chlorine by the DPD Method (Figure 19)
Concentration, Concentration, Concentration, mg/l Absorbance mg/l Absorbance mg/l Absorbance
0.225 0.050 1 .050 0.170 l.55 0.280 0.230 0.050 1.040 0. 170 1.58 0.280 0.220 0.048 1.060 0 .180 1.60 0.285 0.240 0.050 1.040 0.175 1.62 0.288 0.210 0.045 1.030 0. 175 1.63 0.285 0.250 0.048 0.975 0. 165 1.60 0.275 0.260 0.050 1.040 0 .175 1.61 0.275 0.215 0.048 1.060 0.180 1.56 0.275 0.205 0.045 0.990 0 .175 l.56 0.275 l.D
l.D
0.230 0.049 l .030 0. 175 1.58 0.275 0.200 0.048 1.060 0. 180 1.60 0.280 0.240 0.050 1.000 0. 175 l.56 0.275 0.220 0.045 0.960 0.170 1.57 0.275 0.230 0.045 0.980 0 .172 1.59 0.280 0.200 0.040 0.960 0 .170 1.56 0.270
- --Mean 0.225 0.047 1.020 0.174 1.58 0.280
Note: 10.0 cm light path ). = 552 nm

Table C6
Chlorine Dioxide as Total Available Chlorine by the Leuco Crystal Violet Method (Figure 20)
Concentration, Concentration, Concentration, mg/l Absorbance mg/l Absorbance mg/l Absorbance
0.20 0.055 0.97 0. 175 1.62 0.270 0.21 0.080 0.99 0 .170 1.64 0.425 0 .19 0.065 0.97 0 .170 1.61 0 .340 0.22 0.070 0.96 0 .168 1.63 0.370 0.20 0.080 0.96 0 .165 1.63 0.325 0.18 0.075 0.96 0 .160 1.61 o.290 0. 17 0.080 1.00 0.180 1.62 0.290 0. 19 0.091 1.04 0 .170 1.58 0.280 _, 0.20 0 .110 1.00 0.180 1.60 0.240 0
0 0.21 o.090 0.99 0 .150 1.56 0.270 0 .19 0.105 0.98 0. 160 1.61 0.280 0 .18 Q.085 0.95 0.165 l.62 0.300 0 .18 o.085 0.98 0.170 1.60 0.280 0.20 o.090 0.96 o.140 1.63 0.300 0 .19 0.080 0.95 o.160 1.55 0.260
- -- -- -- --Mean 0.19 o.082 0.97 0.166 1.61 0.300
-Note: 5.0 cm light path A = 592 nm

Table C7
Chlorine Dioxide as Free Available Chlorine by the Leuco Crystal Violet Method (Figure 21)
Concentration Concentration Concentration mg/l Absorbance mg/l Absorbance mg/l Absorbance
0.200 0.075 0.95 0.275 l.65 0.475 0.180 0.060 0.96 0.265 l.61 0.430 0 .180 0.060 0.94 0.260 l.64 0.465 0.185 0.065 0.97 0.270 l.61 0.420 0 .185 0.065 0.92 0.260 l.67 0.435 0 .190 0.050 l.00 0.265 l.65 0.480 0.220 0.085 0.98 0.270 l.68 0.465 0.210 0.070 0.96 0.270 1.63 0.445 ......
0 0.200 0.075 l.04 0.280 l.62 0.440 ...... 0.190 0.070 0.98 0.260 l.65 0.445 0 .185 0.065 l.05 0.300 l.60 0.430 0 .180 0.070 l.11 0.290 l.66 0.455 0.190 0.075 l.09 0.290 l.63 0.445 0.180 0.065 l.02 0.260 l.62 0.455 0 .180 0.065 0.98 0.265 l.59 0.400 - -- -- --
Mean 0.190 0.068 l.00 0.272 l.63 0.446
Note: 5.0 cm light path >- = 592 nm
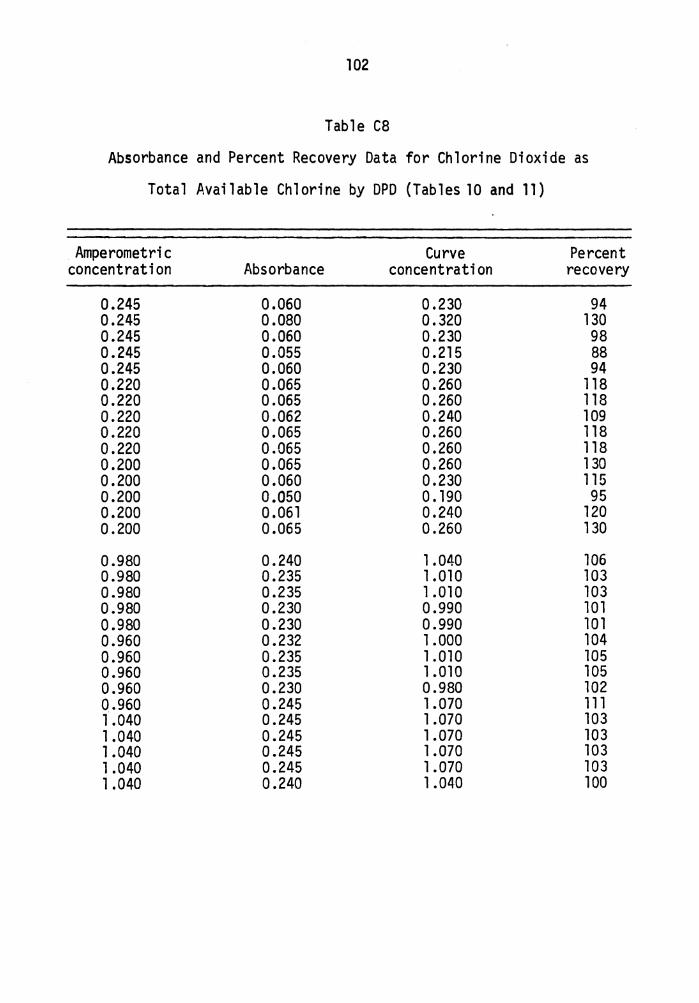
102
Table ca Absorbance and Percent Recovery Data for Chlorine Dioxide as
Total Available Chlorine by DPD (Tables 10 and 11)
Amperometric Curve Percent concentration Absorbance concentration recovery
0.245 0.060 0.230 94 0.245 0.080 0.320 130 0.245 0.060 0.230 98 0.245 0.055 0.215 88 0.245 0.060 0.230 94 0.220 0.065 0.260 118 0.220 0.065 0.260 118 0.220 0.062 0.240 109 0.220 0.065 0.260 118 0.220 0.065 0.260 118 0.200 0.065 0.260 130 0.200 0.060 0.230 115 0.200 0.050 0. 190 95 0.200 0.061 0.240 120 0.200 0.065 0.260 130
0.980 0.240 1.040 106 0.980 0.235 1.010 103 0.980 0.235 l .010 103 0.980 0.230 0.990 101 0.980 0.230 0.990 101 0.960 0.232 1.000 104 0.960 0.235 1.010 105 0.960 0.235 1.010 105 0.960 0.230 0.980 102 0.960 0.245 l .070 111 1.040 0.245 1 .070 103 l .040 0.245 1.070 103 1.040 0.245 1.070 103 l .040 0.245 1.070 103 1.040 0.240 1.040 100

103
Table C8--Continued
Amperometric Curve Percent concentration Absorbance concentration recovery
1 .580 0.365 1.590 101 1.580 0.360 1.570 99 1 .580 0.360 1.570 99 1.580 0.350 1.525 97 1.580 0.355 1.550 98 1.580 0.355 l. 550 98 1. 580 0.355 1.550 98 1.580 0.355 1.550 98 1.580 0.350 1.525 97 1.580 0.355 1 .550 98 1.570 0.355 1. 550 99 1.570 0.355 1.550 99 1. 570 0.350 1. 525 97 1.570 0.345 1 .500 96 1.570 0.350 1.525 97

104
Table C9
Absorbance and Percent Recovery Data for Chlorine Dioxide
as Free Available Chlorine by DPD (Tables 10 and 11)
Amperometric Curve concentration Absorbance concentration
0.225 0.0500 0.250 0.225 0.0500 0.250 0.225 0.0475 0.240 0.225 0.0500 0.250 0.225 0.0450 0.220 0.250 0.0480 0.240 0.250 0.0500 0.250 0.250 0.0480 0.240 0.250 0.0450 0.220 0.250 0.0490 0.245 0.200 0.0480 0.240 0.200 0.0500 0.250 0.200 0.0450 0.220 0.200 0.0450 0.220 0.200 0.0400 0 .180
1.050 0.1700 0.970 1.050 0. 1700 0.970 1.050 0. 1800 1.030 1.050 0. 1750 1.000 1.050 0. 1750 1.000 0.975 0. 1650 0.940 0.975 0. 1750 1.000 0.975 0 .1800 l .030 0.975 0. 1750 1.000 0.975 o .1750 1.000 1.030 o .1800 1.030 1.030 0.1750 1.000 1.030 0. 1700 0.970 1 .030 0. 1720 0.980 1.030 0 .1700 0.970
Percent recovery
111 111 107 111 98 96
100 96 88 98
120 125 111 111 90
92 92 98 95 95 96
103 107 103 103 100 99 94 95 94

105
Table C9--Continued
Amperometric Curve Percent concentration Ab.sorbance concentration recovery
1.550 0.2800 1.630 105 1.550 0.2800 1.630 105 1.550 0 .2850 1.660 107 1 .550 0.2880 1.680 108 1.550 0.2850 1.660 107 1.600 0.2750 1.600 100 1.600 0.2750 1.600 100 1.600 0.2750 1.600 100 1.600 0.2750 1.600 100 1.600 0.2750 1.600 100 1 .580 0.2800 1 .630 103 1.580 0.2750 1.600 101 1 .580 0.2750 1.600 101 1 .580 0.2800 1 .630 104 1.580 0.2700 1.580 100

106
Table ClO
Absorbance and Percent Recovery Data for Chlorine Dioxide
as Total Available Chlorine by LCV (Tables 10 and 11)
Amperometric Curve concentration Absorbance concentration
0 .19 0.0775 0 .19 0.19 0.0550 0 0. 19 0.0800 0.22 0 .19 0.0650 0 0 .19 0.0700 0.04 0 .19 0.0800 0.22 0 .19 0.0750 0. 11 0 .19 0.0800 0.22 0 .19 0.0910 0.34 0 .19 0 .1100 0.47 0 .19 0.0900 0.28 0. 19 0 .1050 0.42 0 .19 0.0850 0.27 0 .19 0.0850 0.27 0 .19 0.0900 0.28
0.97 0. 1750 1.02 0.97 0 .1700 0.99 0.97 0 .1700 0.99 0.97 0. 1680 0.98 0.97 0 .1650 0.95 0.96 0. 1600 0.91 0.96 0.1800 '1" ..,,_..':! '-~~ ·.-. . .. .. 1.06 0.96 0.1700 0.99 0.96 0 .1800 1.06 0.96 0. 1500 0.84 0.98 0 .1600 0.91 0.98 0 .1650 0.95 0.98 0. 1700 0.99 0~98 0 .1400 0.75 0.98 0. 1600 0.91
Percent recovery
100 0
116 0
21 116 58
116 179 247 147 221 142 142 147
105 102 102 101 98 95
110 103 110 88 93 97
101 77 93

107
Table.ClO--Continued
Amperornetric Curve Percent concentration Absorbance concentration recovery
1.62 0.2700 1.52 94 1.62 0.4250 1.82 112 1.62 0.3400 1. 70 105 1.62 0.3700 1. 75 108 l.62 0.3250 1.58 98 1.61 0.2900 1.58 98 l.61 0.2900 1.58 98 1.61 0.2800 1.55 98 l.61 0.2400 1.40 87 1.61 0.2700 1.50 93 l.61 0.2800 1.55 96 l.61 0.3000 1.61 120 1.61 0.2800 1.55 96 1.61 0.3000 1.61 100 1.61 0.2600 1.58 98
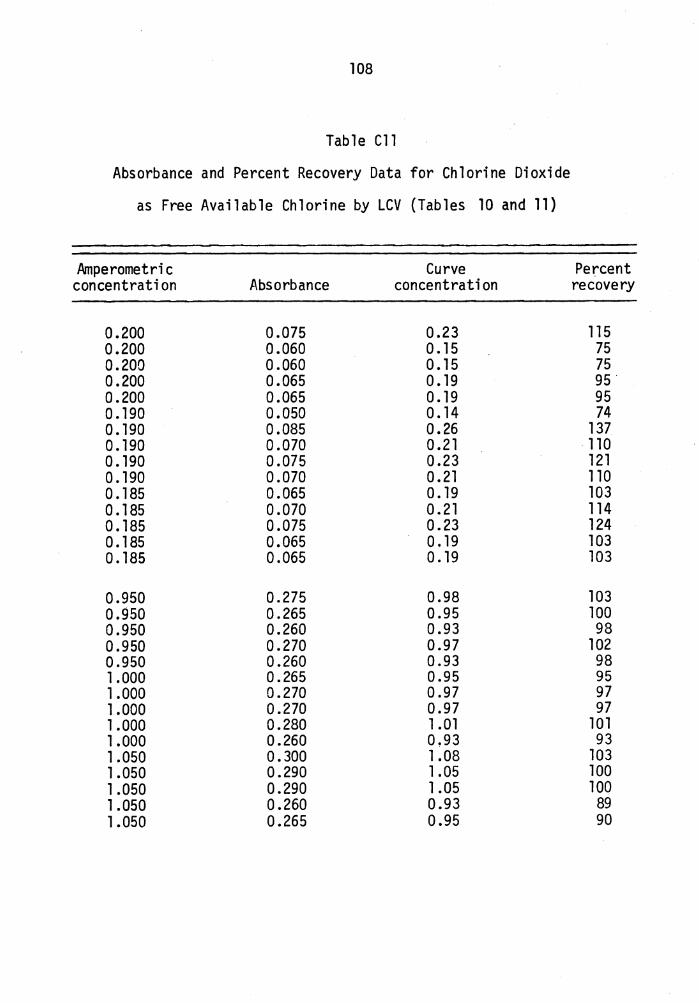
108
Table Cll
Absorbance and Percent Recovery Data for Chlorine Dioxide
as Free Available Chlorine by LCV (Tables 10 and 11)
Amperometric Curve concentration Absorbance concentration
0.200 0.075 0.23 0.200 0.060 0 .15 0.200 0.060 0. 15 0.200 0.065 0. 19 0.200 0.065 0. 19 0. 190 0.050 0. 14 0. 190 0.085 0.26 0. 190 0.070 0.21 0. 190 0.075 0.23 0.190 0.070 0.21 0.185 0.065 0. 19 0.185 0.070 0.21 0. 185 0.075 0.23 0.185 0.065 0. 19 0. 185 0.065 0. 19
0.950 0.275 0.98 0.950 0.265 0.95 0.950 0.260 0.93 0.950 0.270 0.97 0.950 0.260 0.93 1.000 0.265 0.95 1.000 0.270 0.97 1.000 0.270 0.97 1.000 0.280 1.01 1.000 0.260 0.93 1.050 0.300 1.08 1.050 0.290 1.05 1.050 0.290 1.05 1 .050 0.260 0.93 1.050 0.265 0.95
Percent recovery
115 75 75 95 95 74
137 110 121 110 103 114 124 103 103
103 100 98
102 98 95 97 97
101 93
103 100 100
89 90

109
Table Cll--Continued
Amperometric Curve Percent concentration Absorbance concentration recovery
1.650 0.475 1. 75 106 1.650 0.430 1.59 96 1.650 0.465 1.73 105 1.650 0.420 1.54 93 1.650 0.435 1.59 96 1.650 0.480 1.77 107 1.650 0.465 1.71 104 1.650 0.445 1.63 99 1.650 0.440 1.61 98 1.650 0.445 1.63 99 1.600 0.430 1.59 99 1.600 0.455 1.67 104 1.600 0.445 1.63 102 1.600 0.455 1.67 104 1.600 0.400 1.46 91
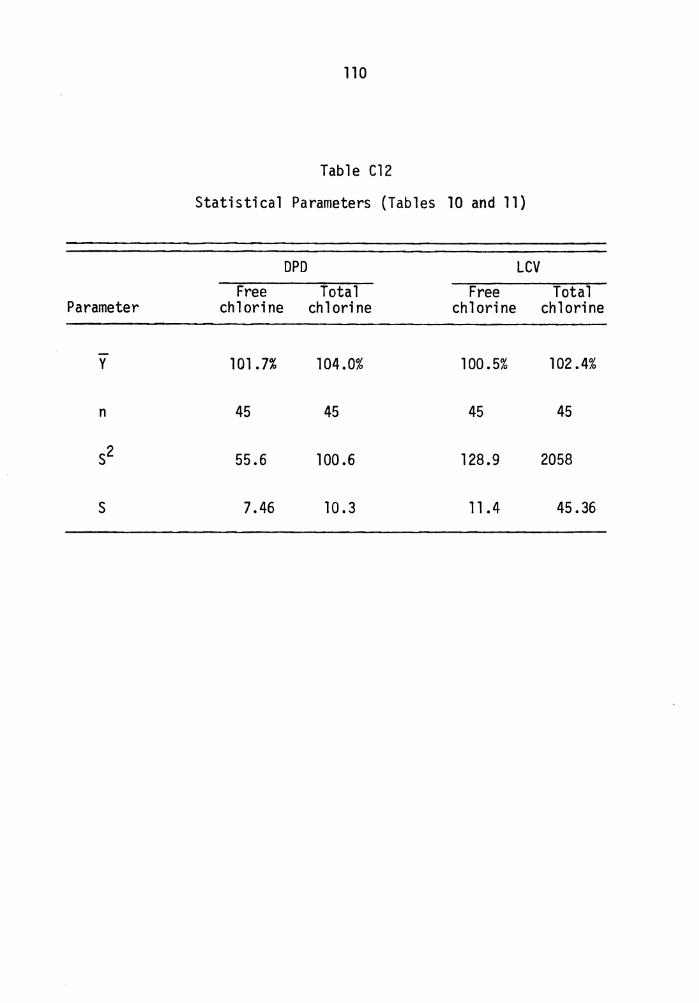
110
Table Cl2
Statistical Parameters (Tables 10 and 11)
DPD LCV Free Total Free Total
Parameter chlorine chlorine chlorine chlorine
y 101.7% 104.0% 100.5% 102.4%
n 45 45 45 45
s2 55 .6 100 .6 128.9 2058
s 7 .46 10. 3 11.4 45. 36

111
Table Cl3
DPD Titration of Cl 2:clo2 Mixtures with Standard FAS (Table 12}
mls FAS Sample Concentration
Cl 2:Cl02 G A B c D
0.1 mg/1:0.9 mg/l 0. 175 0.225 0.425 0.475 1.10
0.1 mg/1:0.9 mg/1 0. 175 Q.275 o.375 o.425 1.10
0.2 mg/1 0.8 mg/1 0 .150 o.200 o.400 0 .425 1.05
0.2 mg/1:0.8 mg/1 0. 150 o.200 0 .450 o.500 1.10
0.3 mg/1:0.7 mg/l 0. 125 o.225 0.475 0.525 1.10
0.3 mg/l :0.7 mg/1 0. 125 Q.225 0.475 Q.525 1.10
0.4 mg/1:0.6 mg/1 0.075 o.225 0.525 0.575 0.90
0.4 mg/1:0.6 mg/1 0. 100 o.400 o.550 0.600 1.00
0.5 mg/1:0.5 mg/1 o.075 0. 125 0.625 0.675 1.10
0.5 mg/1:0.5 mg/1 0.050 o.250 o.550 Q.600 0.80
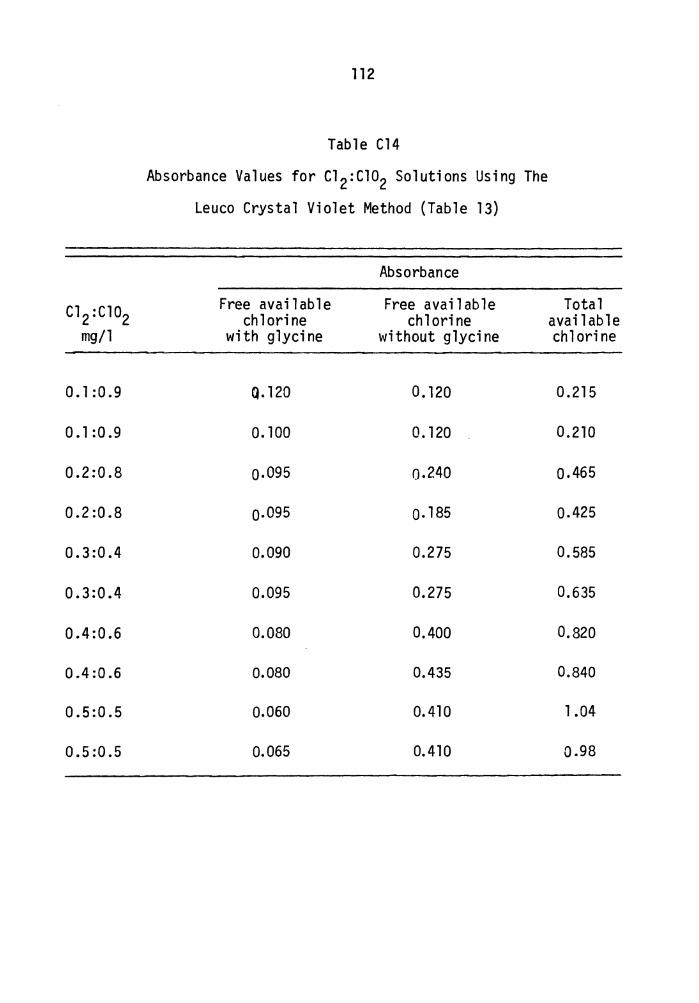
Cl 2:Cl02 mg/l
0.1:0.9
0.1:0.9
0.2:0.8
0.2:0.8
0.3:0.4
0.3:0.4
0.4:0.6
0.4:0.6
0.5:0.5
0.5:0.5
112
Table Cl4
Absorbance Values for c1 2:c102 Solutions Using The
Leuco Crystal Violet Method (Table 13}
Absorbance
Free avail ab 1 e Free avail ab le chlorine chlorine
with glycine without glycine
Q. 120 o. 120
o. 100 0.120
o.095 0.240
o.095 Q. 185
0.090 0.275
0.095 0.275
0.080 0.400
0.080 0.435
0.060 0.410
0.065 0.410
Total available chlorine
0.215
0.210
o.465
0.425
0.585
0.635
0.820
0.840
1.04
0 .98
The vita has been removed from the scanned document

A LABORATORY EVALUATION OF THE DPD AND LEUCO
CRYSTAL VIOLET METHODS FOR THE ANALYSIS OF
RESIDUAL CHLORINE DIOXIDE IN WATER
by
Nonna Jane Hood
{ABSTRACT)
The analysis of chlorine dioxide {Cl02) by DPD and leuco crystal
violet {LCV) was studied. The spontaneous development of color by DPD
was investigated as a function of pH and time. Both methods were evalu-
ated for the detennination of chlorine dioxide in the presence of chlor-
ine.
Spontaneous color development by the DPD spectrophotometric
procedure was found to be dependent on pH, time, sample composition and
halogen present. The development of color in the titration procedure
occurred at a constant rate, and was not influenced by sample composi-
tion or halogen present to the same extent as the spectrophotometric
procedure.
In solutions containing only Cl02, both the DPD and LCV spectro-
photometric methods yielded mean percent recoveries greater than 100
percent on solutions standardized by amperometric titration, but these
mean recoveries of free and total chlorine were not significantly dif-
ferent from each other at the a = 0.01, 0.02 and 0.05 levels using the
t-test. DPD was found to be a more precise analytical method based on