Embed Size (px)
Citation preview

theGuard! ApplicationManager
Data Collector
for SAP Web AS
Status: 11/6/2008
Copyright © REALTECH 2008 Page 2 of 15
ProduktnametheGuard! ApplicationManager – SAP Web AS Data Collector
Content
Introduction ................................................................................................................................................. 3Overview about SAP J2EE and Web AS Monitoring .................................................................................... 4theGuard! ApplicationManager: SAP Web AS Data Collector....................................................................... 6
Managed Objects..................................................................................................................................... 7State Monitoring of Instances, Servers, and Services............................................................................... 8Properties (Configuration data) ................................................................................................................ 8Performance Counters (Statistical Values) ..............................................................................................10Error Log Monitoring ...............................................................................................................................11Additional information for SAP XI ............................................................................................................13Reporting................................................................................................................................................14
Overview, Outlook, and Availability.............................................................................................................15

Copyright © REALTECH 2008 Page 3 of 15
ProduktnametheGuard! ApplicationManager – SAP Web AS Data Collector
Introduction
There's more to efficient application management than maximizing availability. Targeted tuning can increasethe performance and stability of business-critical applications without having to invest in additional hardware(processors, RAM, disk space).
A number of data collectors have been developed for theGuard! ApplicationManager that providecomprehensive monitoring and generate detailed data analyses. Data collectors do more than simply collectevents according to pre-defined rules. They deliver every performance value and the current status of eachapplication object in real time. They also provide insight into configuration attributes, such as the releasestatus or the application's parameter settings. Data collectors model an application in objects and sub-objects, enabling a dedicated handling of alerts, monitoring, or status messages. This model ensures thatinformation is clearly structured and that messages are easy to allocate to a problem.
Pre-defined and reusable policies for each type of application facilitate the implementation of the solutionand the adaptation of monitoring to dynamic landscapes. The ease with which thresholds are set ensuresthe early recognition of potential errors. Comprehensive reaction management enables flexible alerting formore than 100 different devices and alarm consoles.
The automatic discovery of new application instances and objects, including the automatic allocation ofpolicies, enables automatic monitoring even in those cases in which system administrators have completelyreconfigured the application, for example, by adding new instances or objects.
Central reporting at the application instance and application object level provides for a detailed and effectivecapacity management of all resources.
Integrated Service Level Management ensures that the service levels for application availability andperformance are achieved, while Operational Level Agreements (OLAs) can be easily defined at theapplication object level.
Copyright © REALTECH 2008 Page 4 of 15
ProduktnametheGuard! ApplicationManager – SAP Web AS Data Collector
Overview about SAP J2EE and Web AS Monitoring
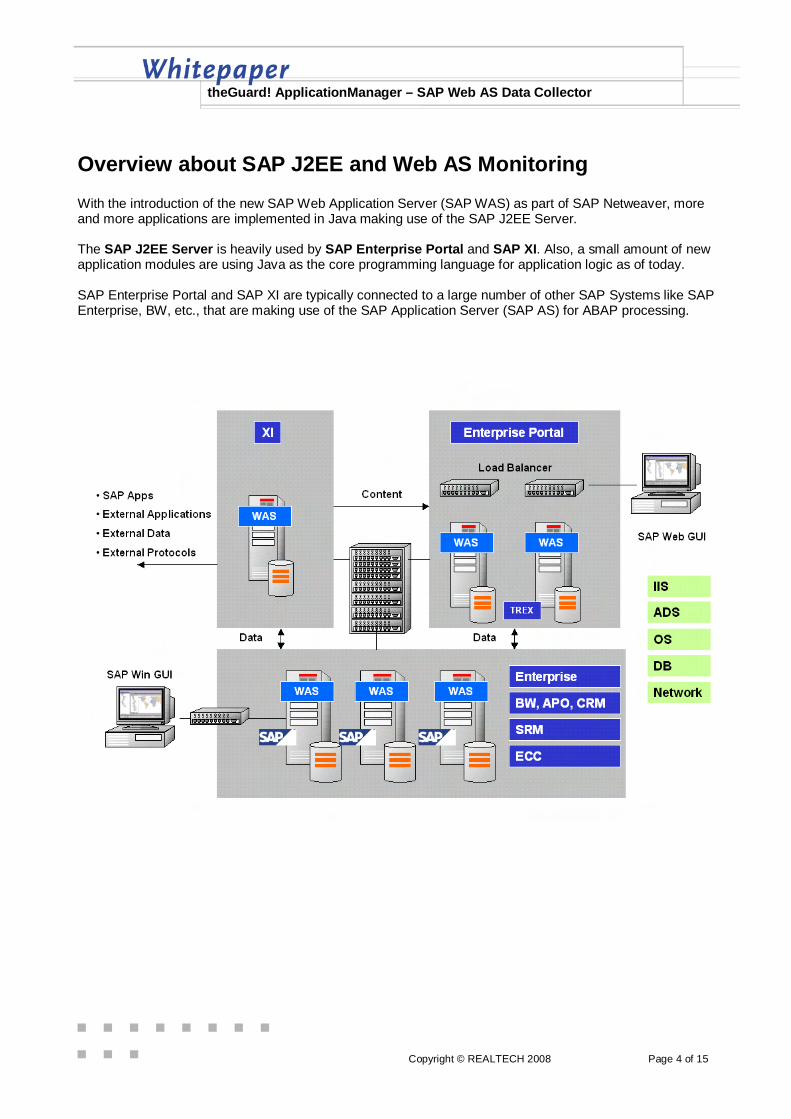
With the introduction of the new SAP Web Application Server (SAP WAS) as part of SAP Netweaver, moreand more applications are implemented in Java making use of the SAP J2EE Server.
The SAP J2EE Server is heavily used by SAP Enterprise Portal and SAP XI. Also, a small amount of newapplication modules are using Java as the core programming language for application logic as of today.
SAP Enterprise Portal and SAP XI are typically connected to a large number of other SAP Systems like SAPEnterprise, BW, etc., that are making use of the SAP Application Server (SAP AS) for ABAP processing.
Copyright © REALTECH 2008 Page 5 of 15
ProduktnametheGuard! ApplicationManager – SAP Web AS Data Collector
The challenge for monitoring and diagnosis are two-fold:
a) Monitoring all logs, processes, databases and network and application connection. This can be doneusing the existing data collectors as described in the White Paper “SAP Enterprise Monitoring“
b) The J2EE Server provides a standard interface to the application programmers or the programmerswho implement the kernel and kernel services. This standard interface is called JMX (JavaMonitoring Extension). The numbers of objects (M-Beans) that are available strongly depend on thevendor, the software release and the application type, and how much the interface is really used bythe developers. Nevertheless, this interface provides additional standard information that must beprovided in addition to the “external“ monitoring.
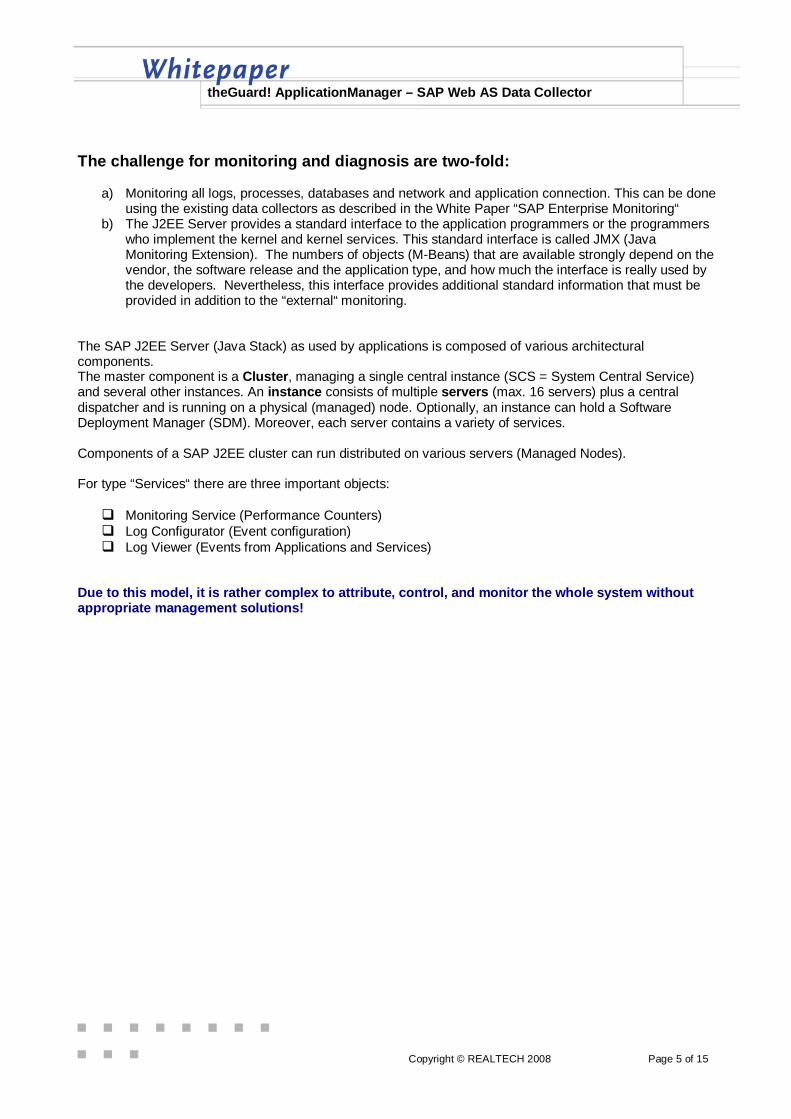
The SAP J2EE Server (Java Stack) as used by applications is composed of various architecturalcomponents.The master component is a Cluster, managing a single central instance (SCS = System Central Service)and several other instances. An instance consists of multiple servers (max. 16 servers) plus a centraldispatcher and is running on a physical (managed) node. Optionally, an instance can hold a SoftwareDeployment Manager (SDM). Moreover, each server contains a variety of services.
Components of a SAP J2EE cluster can run distributed on various servers (Managed Nodes).
For type “Services“ there are three important objects:
Monitoring Service (Performance Counters) Log Configurator (Event configuration) Log Viewer (Events from Applications and Services)
Due to this model, it is rather complex to attribute, control, and monitor the whole system withoutappropriate management solutions!
Copyright © REALTECH 2008 Page 6 of 15
ProduktnametheGuard! ApplicationManager – SAP Web AS Data Collector
theGuard! ApplicationManager: SAP Web AS Data Collector
The SAP Web AS data collector is running locally on those nodes, where components of a SAP J2EEcluster are running. It is using the SAP official JMX interface to collect data from the SAP J2EE Server or inother words, to monitor all middleware services belonging to the Java stack of the SAP Web ApplicationServer.
Using the SAP Web AS data collector it is easy to monitor, alarm, report, and analyze:
Events General Performance Availability of Instances, Servers, and Services
using the well-known functions and features of theGuard! ApplicationManager.Remark: The SAP Application Server (SAP AS) or the ABAP Stack is still monitored using the SAPEnterprise (or APO, BW, CRM) data collector.
SAP is delivering configuration tools like the SAP Visual Admin (see Appendix) and also interfaces to SAPCCMS. The REALTECH SAP Web AS data collector allows controlling many SAP J2EE Server from acentral spot using a professional Enterprise System Management solution such as theGuard!ApplicationManager.
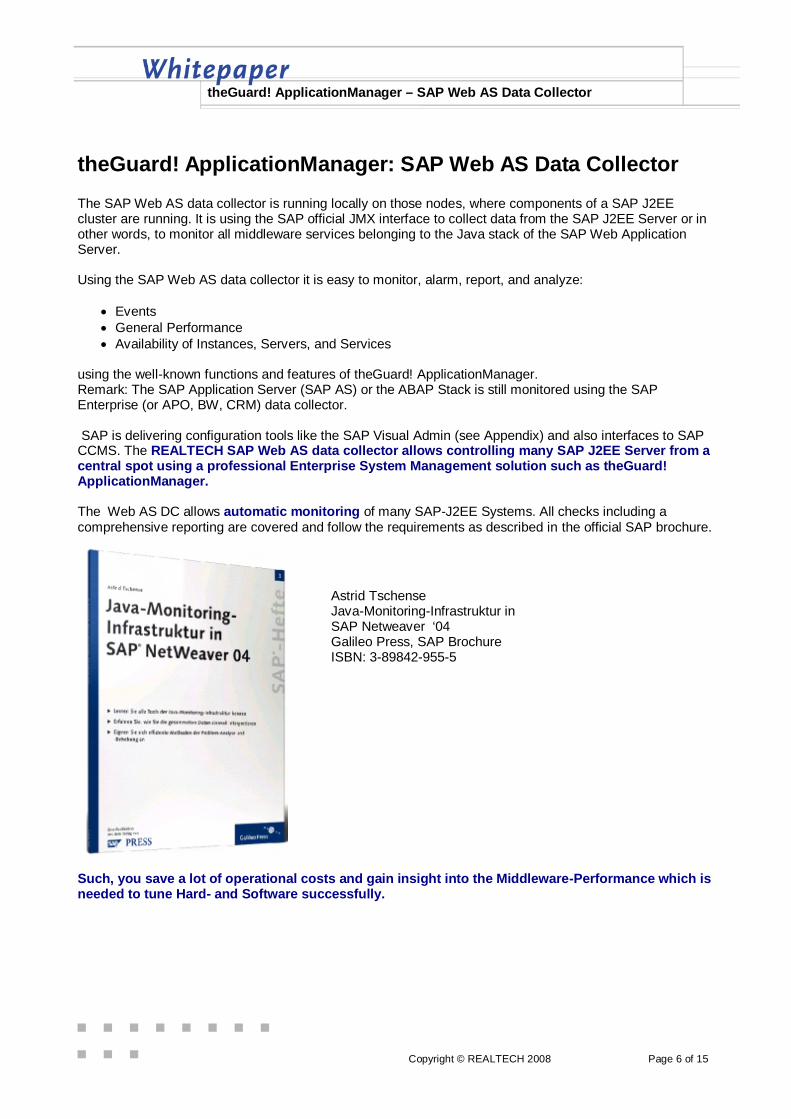
The Web AS DC allows automatic monitoring of many SAP-J2EE Systems. All checks including acomprehensive reporting are covered and follow the requirements as described in the official SAP brochure.
Such, you save a lot of operational costs and gain insight into the Middleware-Performance which isneeded to tune Hard- and Software successfully.
Astrid TschenseJava-Monitoring-Infrastruktur inSAP Netweaver ‘04Galileo Press, SAP BrochureISBN: 3-89842-955-5
Copyright © REALTECH 2008 Page 7 of 15
ProduktnametheGuard! ApplicationManager – SAP Web AS Data Collector
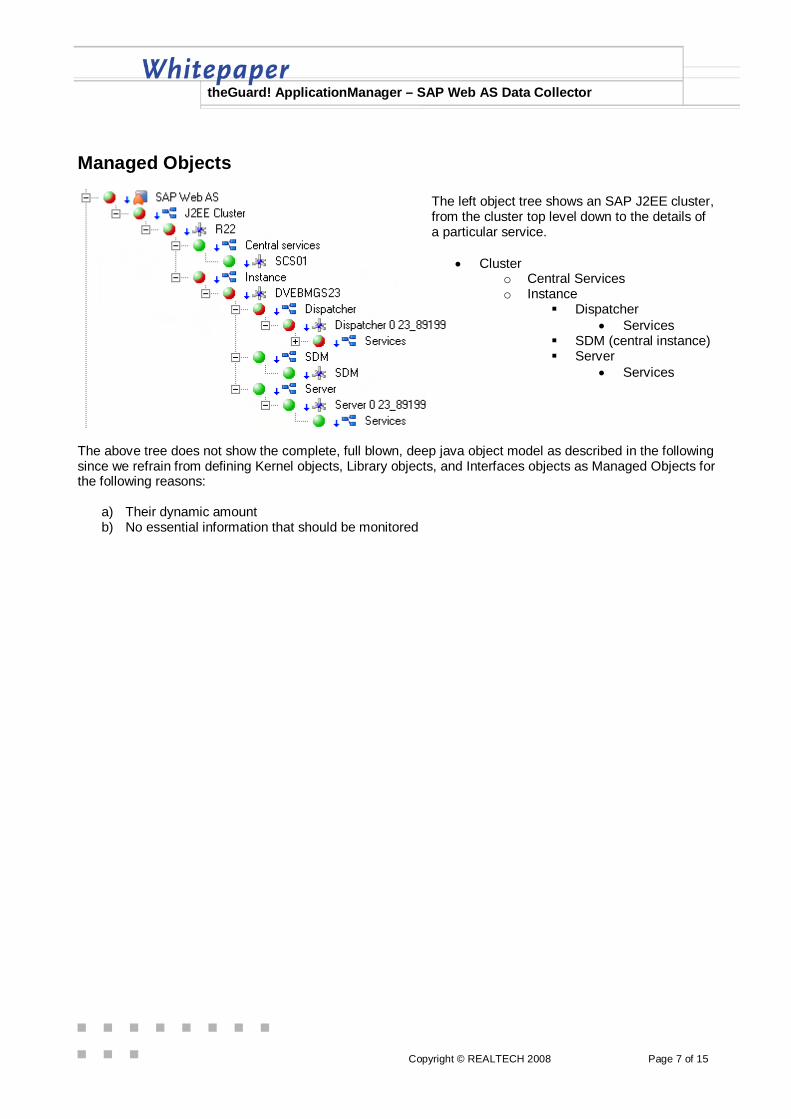
Managed Objects
The above tree does not show the complete, full blown, deep java object model as described in the followingsince we refrain from defining Kernel objects, Library objects, and Interfaces objects as Managed Objects forthe following reasons:
a) Their dynamic amountb) No essential information that should be monitored
The left object tree shows an SAP J2EE cluster,from the cluster top level down to the details ofa particular service.
Clustero Central Serviceso Instance
Dispatcher Services
SDM (central instance) Server
Services
ProduktnametheGuard! ApplicationManager – SAP Web AS Data Collector
State Monitoring of Instances, Servers, and Services
The states (available, not available) for the following object types and objects, as described in the object treein the previous chapter, can be monitored:
Clustero Central Serviceso Instances
Dispatcher Services
SDM Server
Services
Thus, it is very easy to find out if, e.g. server or dispatcher processes fail without using command line toolson the operating system level.
The JLAUNCH processes, which the servers and dispatchers are based on, can additionally be analyzedand monitored on the operating system with the operating system data collector (OS DC) and with theavailable application process configuration.
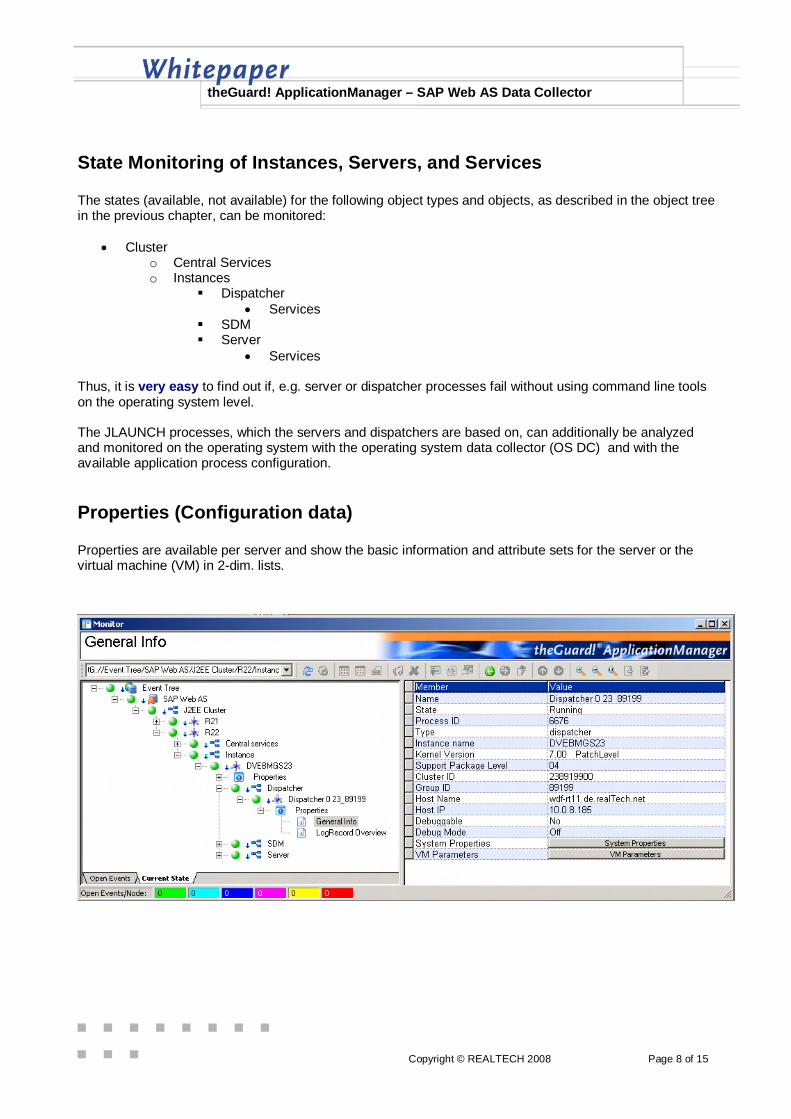
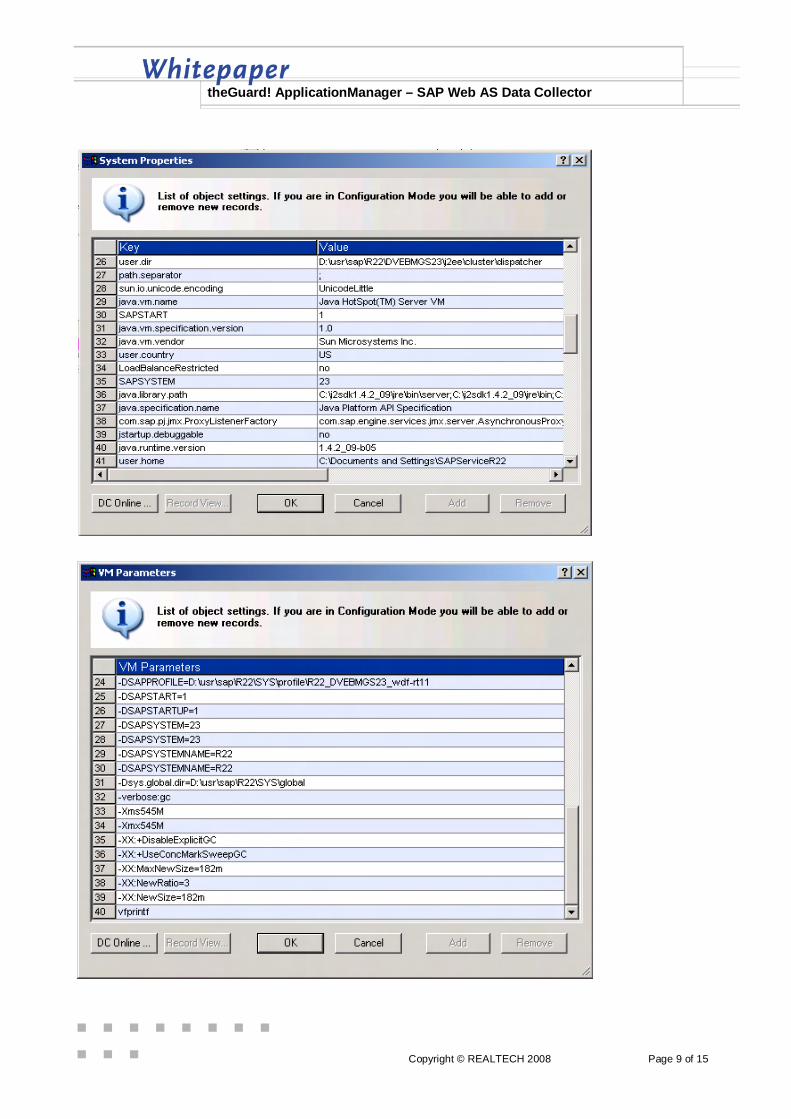
Properties (Configuration data)
Properties are available per server and show the basic information and attribute sets for the server or thevirtual machine (VM) in 2-dim. lists.
Copyright © REALTECH 2008 Page 8 of 15
ProduktnametheGuard! ApplicationManager – SAP Web AS Data Collector
Copyright © REALTECH 2008 Page 9 of 15

Copyright © REALTECH 2008 Page 10 of 15
ProduktnametheGuard! ApplicationManager – SAP Web AS Data Collector
Performance Counters (Statistical Values)
All relevant performance counters can be collected and evaluated using the SAP Web AS data collector.
The data collector will be shipped with a pre-defined policy for these counters to allow performancemonitoring out-of-the-box.
The most recent performance counters for operation are:
o Server and Dispatcher: “Used % Memory“ (> 70% alert)o Server-Thread Pool: Active Thread Count in % (> 80% alert)o Tasks: Task Queue Overflow (> 0 is a performance problem)o Dispatcher: HTTP-Connections (clue and measurement for number of users /activity)
Due to some dynamic SAP structures, depending on the present SAP Web AS release, it might benecessary to adapt a local configuration/mapping file per managed server.

Copyright © REALTECH 2008 Page 11 of 15
ProduktnametheGuard! ApplicationManager – SAP Web AS Data Collector
Error Log Monitoring
SAP logs a lot of important error situations in individual log files. You can browse these files regularly e.g.using the SAP Visual Admin tool. This is a very time consuming and insecure method.
In order to scan these files 7x24 automatically and to filter and condense messages, users are requestingprofessional system management solutions, which have done this for a lot of other application logs in thepast. Thus, SAP and REALTECH have decided to implement an Open-API for the SAP J2EE ErrorMessages, which was released, with SPA 6.40 SP15 and SAP 7.0 SP4.The new Web AS DC of theGuard! ApplicationManager is using this API to collect and analyze these data.Such, you can benefit from all function & features of theGuard! ApplicationManager for error log processing.
Central and comprehensive Logging of alldata for all SAP J2EE-servers of all SAPSystems is quite a challenge. The treeshows a selection of logs of a single serveras seen in the theGuard!ApplicationManager Monitor.
Professional filtering and condensation on alltiers (Source using “Location aggregation“,Server using the global „DuplicateDetection“, GUI) guarantee, that just the rightmessages are processed!
Copyright © REALTECH 2008 Page 12 of 15
ProduktnametheGuard! ApplicationManager – SAP Web AS Data Collector
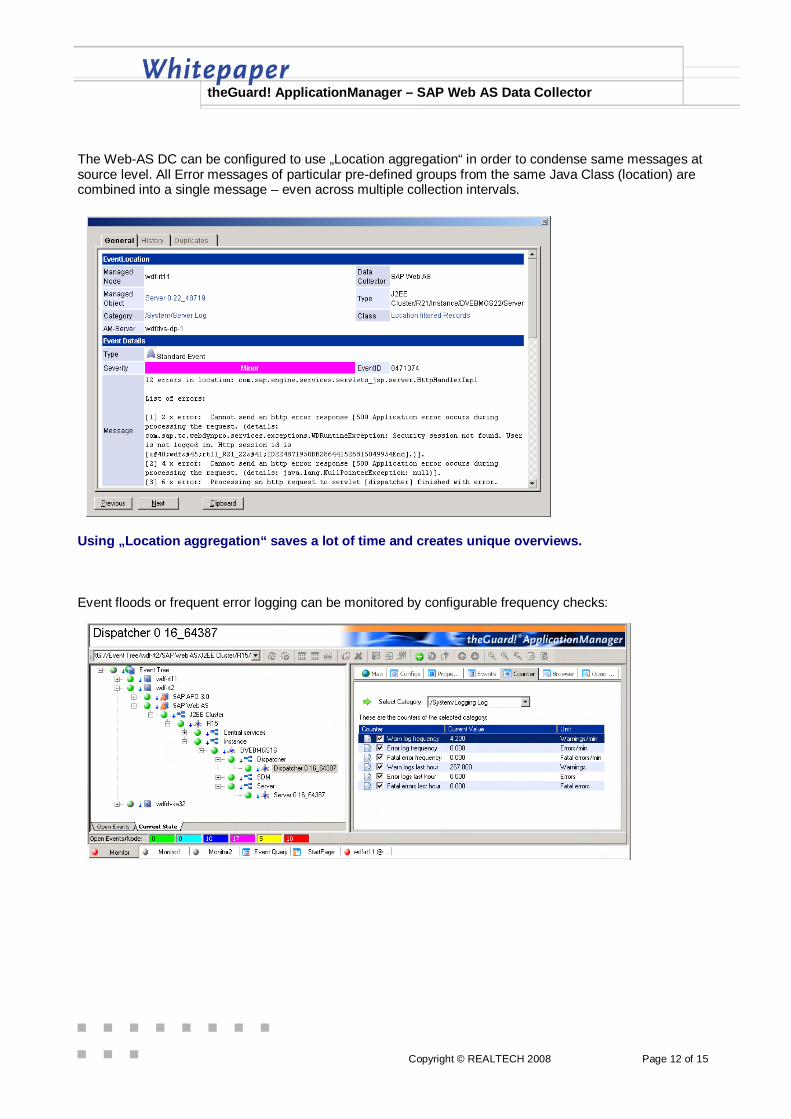
The Web-AS DC can be configured to use „Location aggregation“ in order to condense same messages atsource level. All Error messages of particular pre-defined groups from the same Java Class (location) arecombined into a single message – even across multiple collection intervals.
Using „Location aggregation“ saves a lot of time and creates unique overviews.
Event floods or frequent error logging can be monitored by configurable frequency checks:
Copyright © REALTECH 2008 Page 13 of 15
ProduktnametheGuard! ApplicationManager – SAP Web AS Data Collector
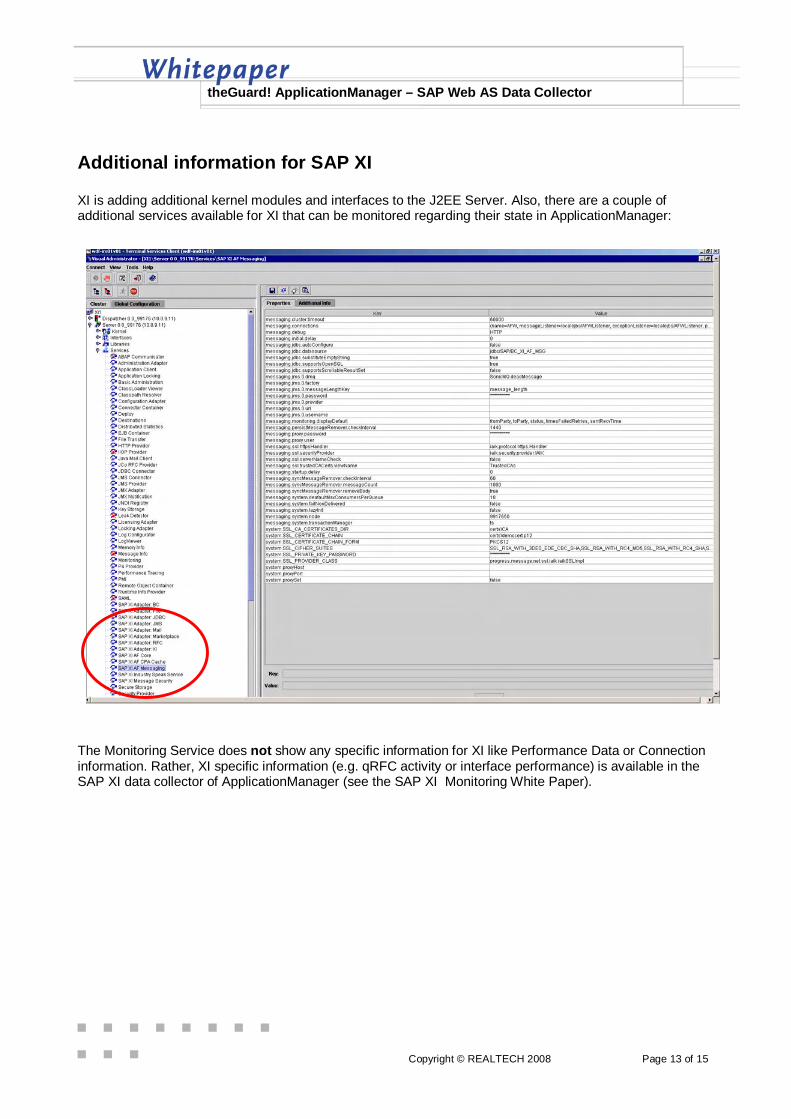
Additional information for SAP XI
XI is adding additional kernel modules and interfaces to the J2EE Server. Also, there are a couple ofadditional services available for XI that can be monitored regarding their state in ApplicationManager:
The Monitoring Service does not show any specific information for XI like Performance Data or Connectioninformation. Rather, XI specific information (e.g. qRFC activity or interface performance) is available in theSAP XI data collector of ApplicationManager (see the SAP XI Monitoring White Paper).

C
ProduktnametheGuard! ApplicationManager – SAP Web AS Data Collector
Reporting
With theGuard! ApplicationDashboard and its various widgets comprehensive analyzes on error quality (byservice, over time) critical areas and on all necessary KPIs (Key Performance Indicators) can be displayedand examined very easily. All performance data as published by SAP can be collected and reported.Such, multi-user and enterprise-critical systems like an SAP Enterprise Portal can be operated veryefficiently.
opyright © REALTECH 2008 Page 14 of 15
Copyright © REALTECH 2008 Page 15 of 15
ProduktnametheGuard! ApplicationManager – SAP Web AS Data Collector
Overview, Outlook, and Availability
External Monitoring of SAP J2EE:Basic monitoring of the operating system processes, services, and log content: This is available as of today,using the Operating System data collector and the File Parser data collector.
Comprehensive, internal SAP J2EE Monitoring:As described in this documentation, the full blown monitoring of the J2EE processes of the SAP Web AS isavailable using the SAP Web AS data collector for all SAP XI, SAP EP, and other SAP applications usingthe J2EE.The SAP Web AS data collector is available on Windows, UNIX, and LINUX platforms for SAPReleases > SAP WAS 6.40 SP14. Additional Error Logging is available for SAP Releases >= 6.40SP15 or 7.0 SP4 when SAP is releasing the respective API.
Additional SAP XI Monitoring:See the Development News about the SAP XI data collector
All target dates and features published in this brochure refer to predicted, non-binding general availabilitydates, and features of a product or a product component!
For more information aboutREALTECH’s software solutions see:
www.realtech.com
REALTECH AGIndustriestr. 39c
69190 Walldorf, GermanyTel.: +49-(0)6227-837 591Fax: +49-(0)6227-837-837
[email protected]://www.realtech.com