Embed Size (px)
Citation preview
GFCI 12
1. LONDON 2. NEW YORK
7. TOKYO 8. CHICAGO6. SEOUL 10. TORONTO
5. ZURICH4. SINGAPORE3. HONG KONG
9. GENEVA
TheGlobalFinancialCentresIndex12SEPTEMBER 2012
3 – 2012FinancialCentre Futures
The Qatar Financial Centre Authority sponsorsLong Finance’s ‘Financial Centre Futures’programme.
Qatar Financial Centre (QFC) is a financial andbusiness centre established by the governmentof Qatar in 2005 to attract international financialservices andmultinational corporations to growand develop themarket for financial services inthe region.
QFC consists of a commercial arm, the QFCAuthority; and an independent financialregulator, the QFC Regulatory Authority. Italso has an independent judiciary whichcomprises a civil and commercial court and aregulatory tribunal.
QFC aims to help all QFC licensed firms generatenew and sustainable revenue streams. It providesaccess to local and regional investmentopportunities. Business can be transacted insideor outside Qatar, in local or foreign currency.
Uniquely, this allows businesses to operate bothlocally and internationally. Furthermore, QFCallows 100%ownership by foreign companies,and all profits can be remitted outside of Qatar.
TheQFCAuthority is responsible for theorganisation’s commercial strategy and fordeveloping relationships with the globalfinancial community and other key institutionsboth within and outside Qatar. One of themostimportant roles of QFCA is to approve and issuelicences to individuals, businesses and otherentities that wish to incorporate or establishthemselves in Qatar with the Centre.
TheQFC Regulatory Authority is anindependent statutory body and authorises andsupervises businesses that conduct financialservices activities in, or from, the QFC. It haspowers to authorise, supervise and, wherenecessary, discipline regulated firms andindividuals.
Z/Yen Group thanks the City of LondonCorporation for its cooperation in thedevelopment of the GFCI and for the use of therelated data still used in the GFCI.
The author of this report, Mark Yeandle, wouldlike to thank Nick Danev for his contribution withresearch, modelling and ideas, alongwith othermembers of the GFCI team – in particularStephanie Rochford, Chiara von Gunten andMichael Mainelli.
The Global Financial Centres Index 12 1
The Global Financial Centres Index (GFCI) is abarometer which has been trackingmovementsin the competitiveness of financial centresaround the world since 2007. Today the GFCIfollows 77 centres, of which about one-third arein emerging economies.Within that group, twoof the fastest rising centres are Doha ,Qatar andDubai, United Arab Emirates.
The Gulf Cooperation Council (GCC) region,which includes Qatar and the UAE, enjoysoutstanding competitive advantages as a sourceof, and destination for, capital. The GCC’s hugenatural resources wealth – some 39%of theworld’s proven oil reserves and 23%of theworld’s proven gas reserves – has been themainforce behind its strong economic growth overthe last decade. The GCC’s combined GDP nowranks among the 20 largest economies in theworld. The region’s natural resources wealth hasbeen reinvested into broad-based economicdiversification which has placed considerableemphasis on expanding the financial servicessector and attracting international financialsector firms to set up branches there. This hasgiven rise to the increasing prominence of theGCC financial centres.
The GFCI has tracked this rise. In GFCI 1,published inMarch 2007, Dubai was the onlyMiddle Eastern centre the index covered. Theindex now follows four centres in theMiddleEast. In this latest GFCI, Qatar and Dubai are thehighest ranking financial centres in the GCCand have both gained points. This is noaccident. They have successfully establishedgrowing financial services centres which havebecome themost significant contributors to
national GDP after hydrocarbons. Qatar andDubai are rivals but they are alsomutuallysupportive and the GCC region is reaping thebenefits of having both centres.
The Qatar Financial Centre (QFC) has been amajor influence on the development of Qatar asa financial centre, offering international andlocal firms an onshore trading environment witha robust legal structure based on Englishcommon law, a world class regulatory structureand one of the friendliest tax regimes in theworld. The QFC Authority’s hub strategy is tocreate a uniquely sustainable platform forregional growth in reinsurance, captiveinsurance and asset management.
As the balance of the global economy shiftsmore towards emerging economies, I believewe can expect to see financial centres in thesecountries grow in terms of influence. Qatar,with its strong economic principles and long-term commitment to building its financialsector, is well placed to benefit from thisfundamental trend set to redefine ourinvestment landscape.
Dr. Abdulaziz AAl-GhorairiSenior Vice-President and Chief EconomistCommercialbank Capital
Foreword
The GFCI provides profiles, ratings and rankingsfor 77 financial centres, drawing on twoseparate sources of data – instrumental factors(external indices) and responses to an onlinesurvey. The GFCI was first published by Z/YenGroup inMarch 2007 and has subsequentlybeen updated every six months. Successivegrowth in the number of respondents and datahas enabled us to highlight the changingpriorities and concerns of financial professionalsover this time, particularly since financial crisesbegan to unfold in 2007 and 2008. This is thetwelfth edition of GFCI (GFCI 12).
Instrumental factors: previous researchindicates that many factors combine tomake afinancial centre competitive. These factors canbe grouped into five overarching ‘areas ofcompetitiveness’: People, BusinessEnvironment, Infrastructure, Market Access andGeneral Competitiveness. Evidence of a centre’sperformance in these areas is drawn from arange of external measures. For example,evidence about a fair and just businessenvironment is drawn from a corruptionperception index and an opacity index. 86factors have been used in GFCI 12, of which 37have been updated since GFCI 11 and 13 arenew to the GFCI (see page 44 for details on allexternal measures used in the GFCI 12model).
Financial centre assessments:GFCI usesresponses to an ongoing online questionnairecompleted by international financial servicesprofessionals. Respondents are asked to ratethose centres with which they are familiar andto answer a number of questions relating totheir perceptions of competitiveness. Overall,26,180 financial centre assessments from 1,890financial services professionals were used tocompute GFCI 12, with older assessmentsdiscounted according to age.
Full details of themethodology behind GFCI 12can be found on page 39. The ratings andrankings are calculated using a ‘factorassessment model’, which combinesthe instrumental factors andquestionnaire assessments.
Themain headlines of GFCI 12 are:
• The past trend of large risesin the ratings of Asia/Pacificcentres appears to have stalled.Hong Kong, Singapore, Tokyo,Shanghai, Beijing, Taipei andShenzhen all decline in GFCI 12.Centres on themainland of Chinahave seen significant declines withShanghai the largest faller in the index,down 31 points (following a decline of 37points in GFCI 11). Beijing is down 18 points.Hong Kong sees a 21 point drop (following adecline of 16 points in GFCI 11).
• GFCI respondents believe that the Asiancentres will continue to becomemoresignificant in themedium to long term. Somerespondents question whether financialcentres onmainland China will be able tocontinue their growthwithout relaxations incurrency controls.
• The offshore centres, having sufferedsignificant reputational damage in the pastfour years, regained ground in GFCI 10 andGFCI 11. GFCI 12 shows amixed picture withno significant moves (apart from the Bahamaswhich gained 22 points). Jersey and Guernseyremain the leading offshore centres.
• Progress is being shown in theMiddle Eastwith Qatar, Dubai, Abu Dhabi and Riyadh allseeing rises in both ratings and ranks in GFCI12.
2 The Global Financial Centres Index 12
GFCI 12 – Summary andHeadlines
The Global Financial Centres Index 12 3
• The Euro crisis continues to be reflected in theGFCI ratings of the financial centres withinthe weaker Euro economies. Madrid, Lisbon,Dublin and Athens were all down in GFCI 10and GFCI 11. These declines have continuedin GFCI 12. Frankfurt and Paris both roseslightly in GFCI 11 but GFCI 12 sees a reversalof these gains. There have been someimprovements in Europe. Geneva has now re-entered the GFCI top ten.
• Policy makers in Istanbul have been puttingsome resources into developing Istanbul as aregional financial hub and this is beginning tobe reflected in the GFCI with the city movingup five places in GFCI 12.
• The picture in the Americas is mixed. Themain centres in the USA are down in GFCI 12with New York, Chicago, Boston, SanFrancisco andWashington DC all seeing fallsin the ratings. In Canada, Toronto sees a verysmall decline whilst Montreal, Calgary andVancouver have all risen. In South America,Sao Paulo shows the largest rise of the threeLatin American centres.
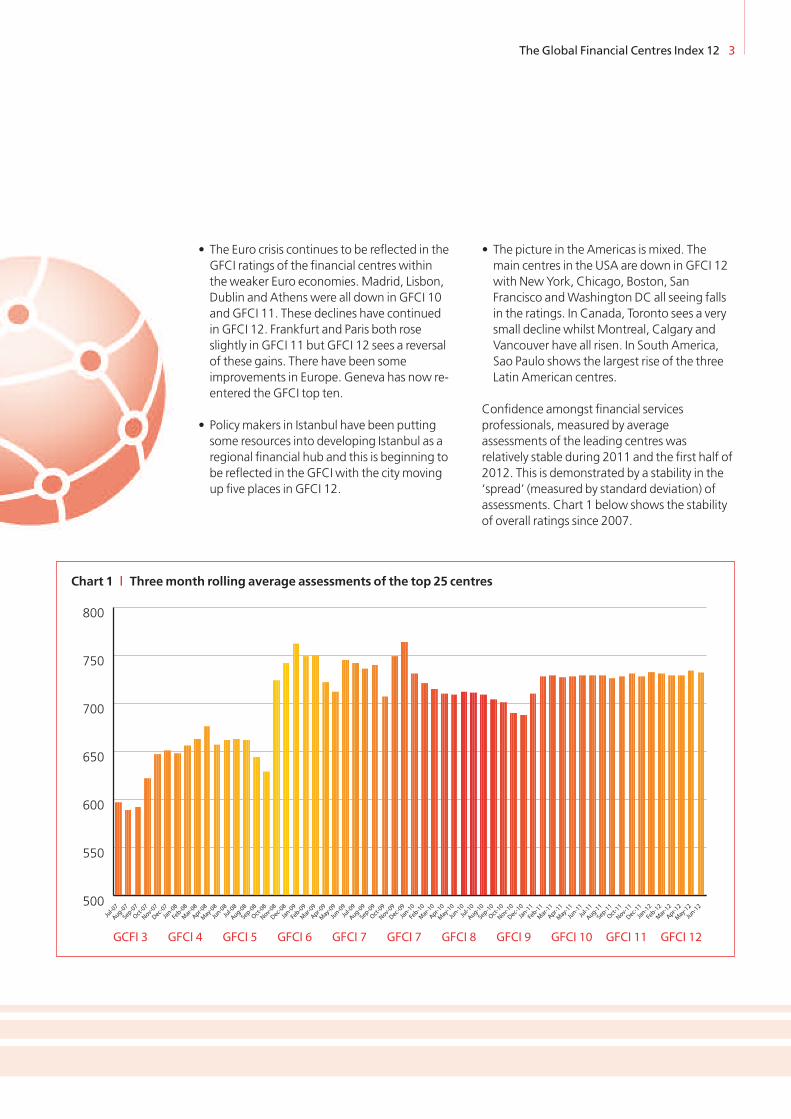
Confidence amongst financial servicesprofessionals, measured by averageassessments of the leading centres wasrelatively stable during 2011 and the first half of2012. This is demonstrated by a stability in the‘spread’ (measured by standard deviation) ofassessments. Chart 1 below shows the stabilityof overall ratings since 2007.
500
550
600
650
700
750
800
Jun-12
May-12
Apr-12
Mar-12
Feb-12
Jan-12
Dec-11
Nov-11
Oct-11
Sep-11
Aug-11Ju
l-11
Jun-11
May-11
Apr-11
Mar-11
Feb-11
Jan-11
Dec-10
Nov-10
Oct-10
Sep-10
Aug-10Ju
l-10
Jun-10
May-10
Apr-10
Mar-10
Feb-10
Jan-10
Dec-09
Nov-09
Oct-09
Sep-09
Aug-09Ju
l-09
Jun-09
May-09
Apr-09
Mar-09
Feb-09
Jan-09
Dec-08
Nov-08
Oct-08
Sep-08
Aug-08Ju
l-08
Jun-08
May-08
Apr-08
Mar-08
Feb-08
Jan-08
Dec-07
Nov-07
Oct-07
Sep-07
Aug-07Ju
l-07
GCFI 3 GFCI 4 GFCI 5 GFCI 6 GFCI 7 GFCI 7 GFCI 8 GFCI 9 GFCI 10 GFCI 11 GFCI 12
Chart 1 | Threemonth rolling average assessments of the top 25 centres
4 The Global Financial Centres Index 12
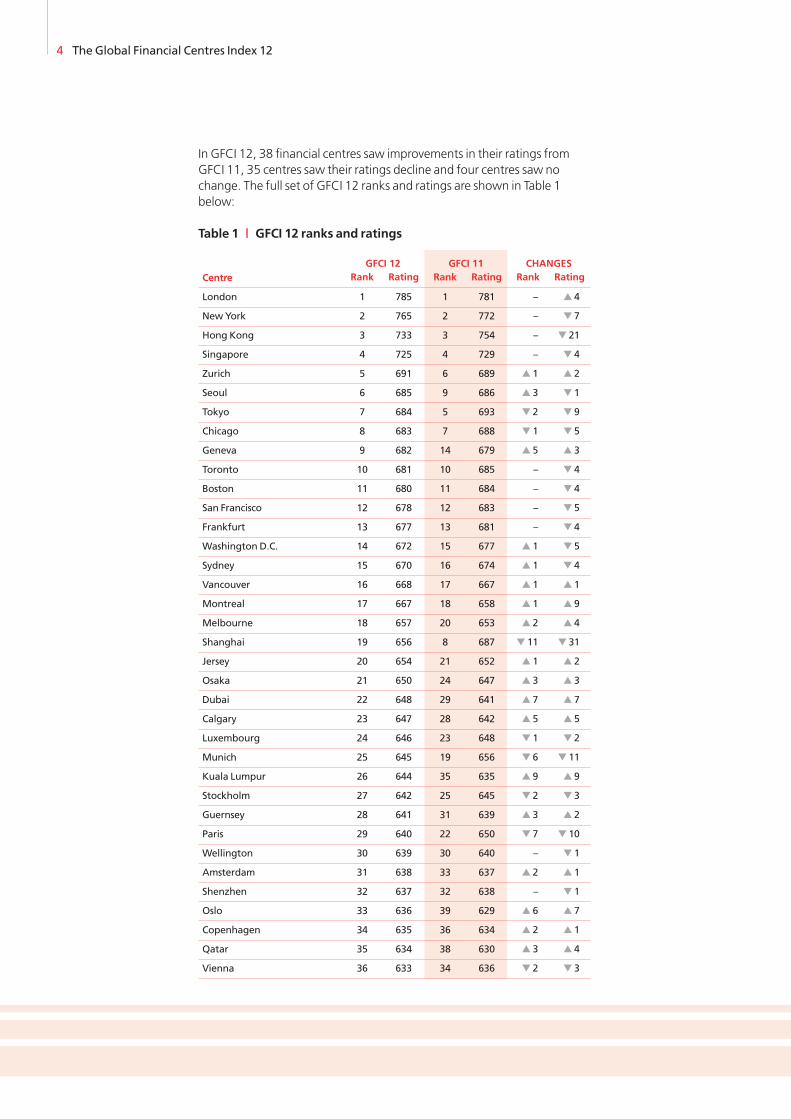
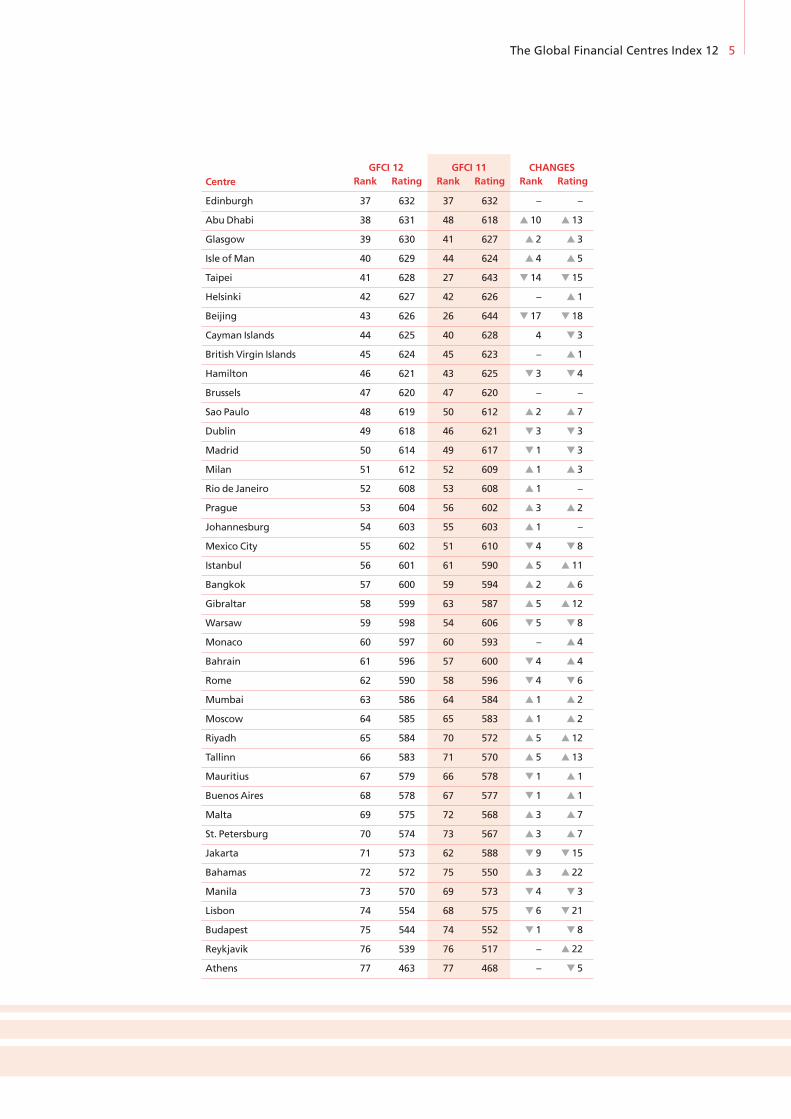
Table 1 | GFCI 12 ranks and ratings
In GFCI 12, 38 financial centres saw improvements in their ratings fromGFCI 11, 35 centres saw their ratings decline and four centres saw nochange. The full set of GFCI 12 ranks and ratings are shown in Table 1below:
GFCI 12 GFCI 11 CHANGESCentre Rank Rating Rank Rating Rank Rating
London 1 785 1 781 – � 4
NewYork 2 765 2 772 – � 7
Hong Kong 3 733 3 754 – � 21
Singapore 4 725 4 729 – � 4
Zurich 5 691 6 689 � 1 � 2
Seoul 6 685 9 686 � 3 � 1
Tokyo 7 684 5 693 � 2 � 9
Chicago 8 683 7 688 � 1 � 5
Geneva 9 682 14 679 � 5 � 3
Toronto 10 681 10 685 – � 4
Boston 11 680 11 684 – � 4
San Francisco 12 678 12 683 – � 5
Frankfurt 13 677 13 681 – � 4
Washington D.C. 14 672 15 677 � 1 � 5
Sydney 15 670 16 674 � 1 � 4
Vancouver 16 668 17 667 � 1 � 1
Montreal 17 667 18 658 � 1 � 9
Melbourne 18 657 20 653 � 2 � 4
Shanghai 19 656 8 687 � 11 � 31
Jersey 20 654 21 652 � 1 � 2
Osaka 21 650 24 647 � 3 � 3
Dubai 22 648 29 641 � 7 � 7
Calgary 23 647 28 642 � 5 � 5
Luxembourg 24 646 23 648 � 1 � 2
Munich 25 645 19 656 � 6 � 11
Kuala Lumpur 26 644 35 635 � 9 � 9
Stockholm 27 642 25 645 � 2 � 3
Guernsey 28 641 31 639 � 3 � 2
Paris 29 640 22 650 � 7 � 10
Wellington 30 639 30 640 – � 1
Amsterdam 31 638 33 637 � 2 � 1
Shenzhen 32 637 32 638 – � 1
Oslo 33 636 39 629 � 6 � 7
Copenhagen 34 635 36 634 � 2 � 1
Qatar 35 634 38 630 � 3 � 4
Vienna 36 633 34 636 � 2 � 3
The Global Financial Centres Index 12 5
GFCI 12 GFCI 11 CHANGESCentre Rank Rating Rank Rating Rank Rating
Edinburgh 37 632 37 632 – –
AbuDhabi 38 631 48 618 � 10 � 13
Glasgow 39 630 41 627 � 2 � 3
Isle ofMan 40 629 44 624 � 4 � 5
Taipei 41 628 27 643 � 14 � 15
Helsinki 42 627 42 626 – � 1
Beijing 43 626 26 644 � 17 � 18
Cayman Islands 44 625 40 628 4 � 3
British Virgin Islands 45 624 45 623 – � 1
Hamilton 46 621 43 625 � 3 � 4
Brussels 47 620 47 620 – –
Sao Paulo 48 619 50 612 � 2 � 7
Dublin 49 618 46 621 � 3 � 3
Madrid 50 614 49 617 � 1 � 3
Milan 51 612 52 609 � 1 � 3
Rio de Janeiro 52 608 53 608 � 1 –
Prague 53 604 56 602 � 3 � 2
Johannesburg 54 603 55 603 � 1 –
Mexico City 55 602 51 610 � 4 � 8
Istanbul 56 601 61 590 � 5 � 11
Bangkok 57 600 59 594 � 2 � 6
Gibraltar 58 599 63 587 � 5 � 12
Warsaw 59 598 54 606 � 5 � 8
Monaco 60 597 60 593 – � 4
Bahrain 61 596 57 600 � 4 � 4
Rome 62 590 58 596 � 4 � 6
Mumbai 63 586 64 584 � 1 � 2
Moscow 64 585 65 583 � 1 � 2
Riyadh 65 584 70 572 � 5 � 12
Tallinn 66 583 71 570 � 5 � 13
Mauritius 67 579 66 578 � 1 � 1
Buenos Aires 68 578 67 577 � 1 � 1
Malta 69 575 72 568 � 3 � 7
St. Petersburg 70 574 73 567 � 3 � 7
Jakarta 71 573 62 588 � 9 � 15
Bahamas 72 572 75 550 � 3 � 22
Manila 73 570 69 573 � 4 � 3
Lisbon 74 554 68 575 � 6 � 21
Budapest 75 544 74 552 � 1 � 8
Reykjavik 76 539 76 517 – � 22
Athens 77 463 77 468 – � 5
Panama, Cyprus and Tel Aviv have been addedto the GFCI questionnaire recently but have yetto acquire enough assessments to be rated inthe index.
Notable features of GFCI 12 include:
• Shanghai is the biggest faller down 31 pointsand 11 places, Beijing is also down 18 points;
• Geneva is back in the top ten – up five placesto ninth;
• Other top 50 centres that have donewellincludeMontreal, Abu Dhabi and KualaLumpur;
• Athens is now 76 points adrift at the bottomof the rankings, it was only 14 points belowthe next centre in GFCI 10;
• Assessments used in GFCI 12weremade upto the end of June 2012. The LIBOR crisisreally came to the fore in themedia at thebeginning of July. Any effect that the LIBORcrisis has on the reputation of London is notyet apparent.
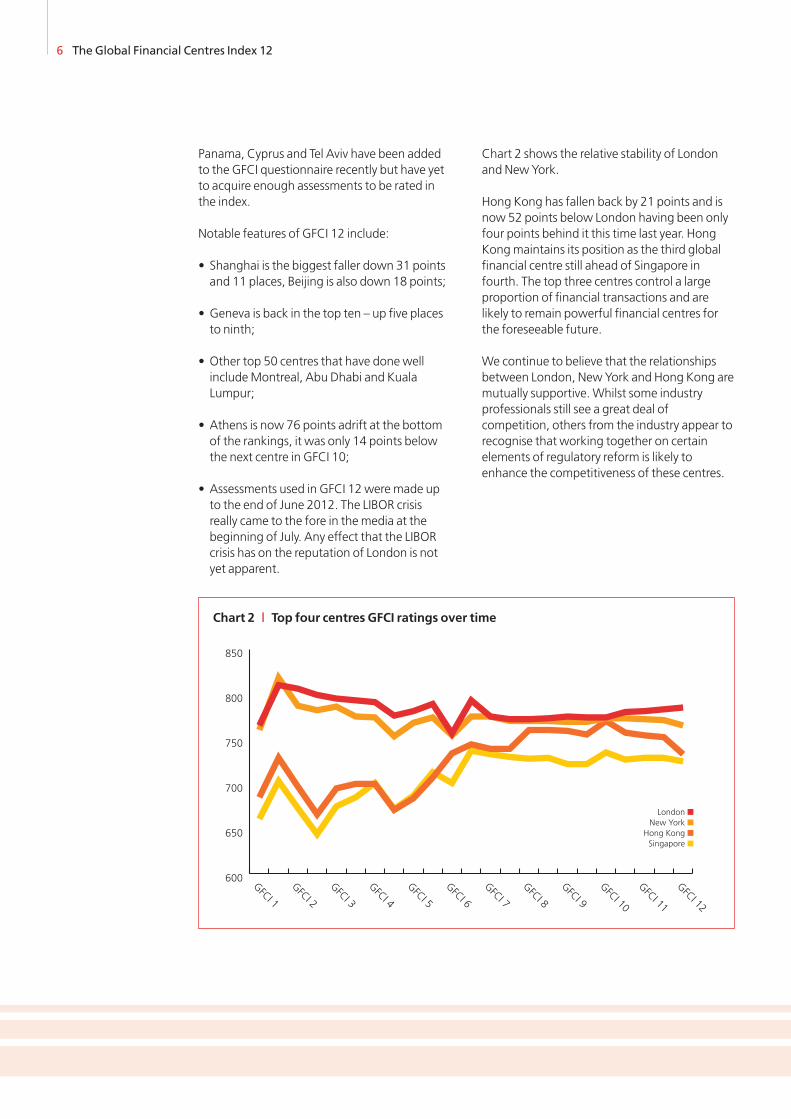
Chart 2 shows the relative stability of Londonand New York.
Hong Kong has fallen back by 21 points and isnow 52 points below London having been onlyfour points behind it this time last year. HongKongmaintains its position as the third globalfinancial centre still ahead of Singapore infourth. The top three centres control a largeproportion of financial transactions and arelikely to remain powerful financial centres forthe foreseeable future.
We continue to believe that the relationshipsbetween London, New York and Hong Kong aremutually supportive.Whilst some industryprofessionals still see a great deal ofcompetition, others from the industry appear torecognise that working together on certainelements of regulatory reform is likely toenhance the competitiveness of these centres.
6 The Global Financial Centres Index 12
600
650
700
750
800
850
GFCI 12
GFCI 11
GFCI 10
GFCI 9
GFCI 8
GFCI 7
GFCI 6
GFCI 5
GFCI 4
GFCI 3
GFCI 2
GFCI 1
London ■
New York ■
Hong Kong ■
Singapore ■
Chart 2 | Top four centres GFCI ratings over time
London and New Yorkmust not believe thatthey are ‘untouchable’. Whilst Hong Kong andother Asian centres have declined a little in GFCI12, the longer term trend of the leading Asiancentres is upward. London still has to negotiatesome challenging times.We asked respondentsto the online questionnaire about changes tothe competitiveness of the centre in which theyare based. Of the respondents based in London,49% felt that Londonwould becomemorecompetitive over the next three years. Thiscompares with 63%of respondents basedelsewhere in Europe, 73%of respondentsbased in Asia and 77%of respondents based inoffshore centres.
A number of questionnaire respondents feelthat finance is such a global industry that it isnowmore essential than ever to have a globallylinked trading hub in eachmain time zone. Theopinion is that within the European time zone,London is currently the only realistic option asFrankfurt and Paris are not sufficientlycompetitive.
The Global Financial Centres Index 12 7
“Hong Kong and Singapore stilllead the way in Asia, mainlandChina has a longway to go tocatch up.”Investment Banker based in Hong Kong
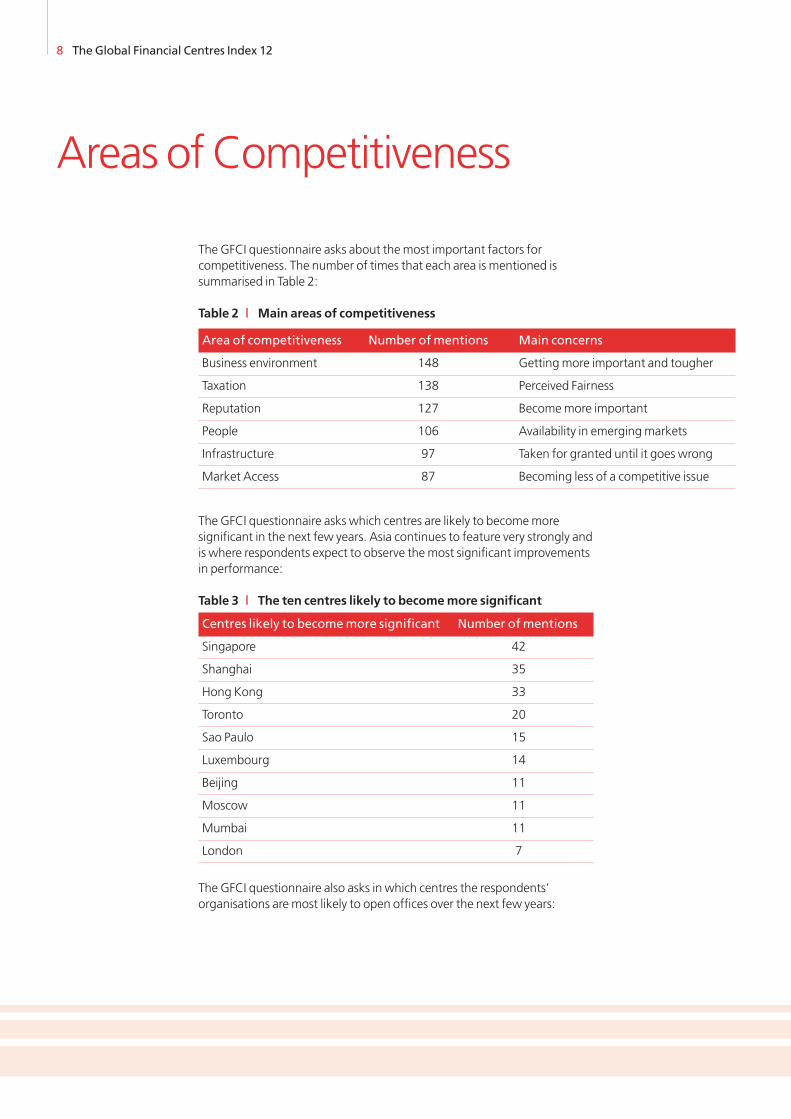
The GFCI questionnaire asks about themost important factors forcompetitiveness. The number of times that each area is mentioned issummarised in Table 2:
The GFCI questionnaire asks which centres are likely to becomemoresignificant in the next few years. Asia continues to feature very strongly andis where respondents expect to observe themost significant improvementsin performance:
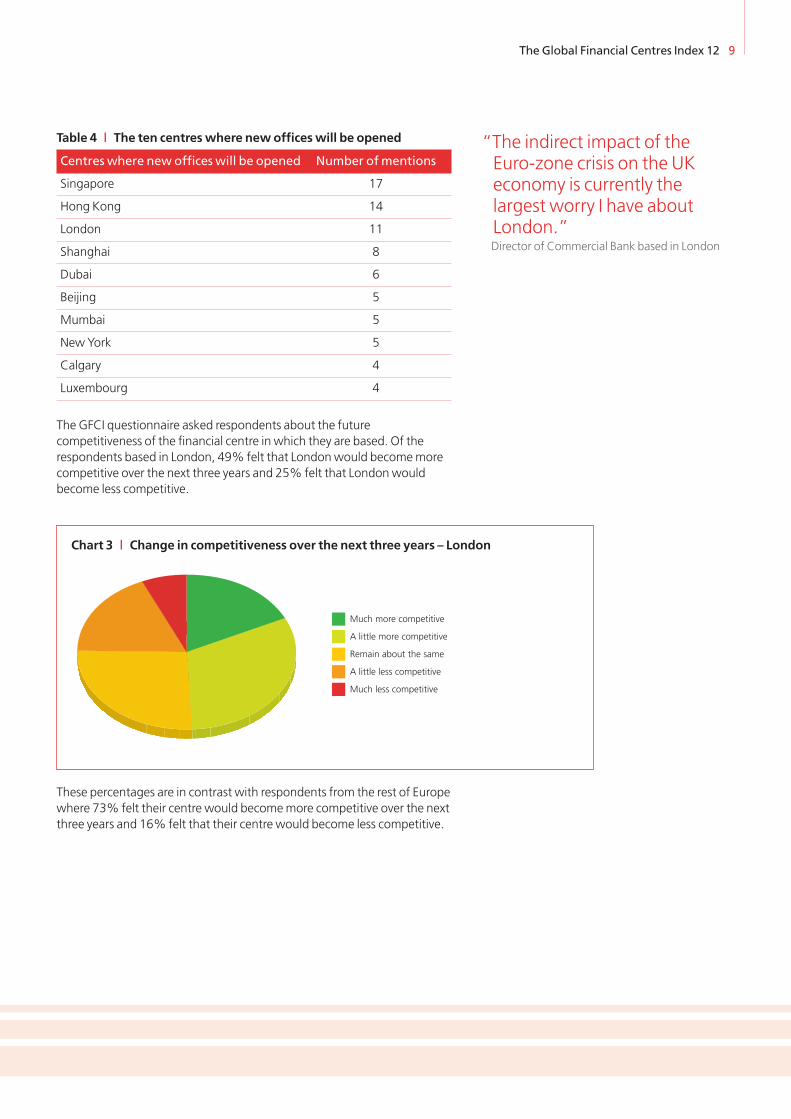
The GFCI questionnaire also asks in which centres the respondents’organisations are most likely to open offices over the next few years:
8 The Global Financial Centres Index 12
Areas ofCompetitiveness
Table 3 | The ten centres likely to becomemore significant
Centres likely to becomemore significant Number ofmentions
Singapore 42
Shanghai 35
Hong Kong 33
Toronto 20
Sao Paulo 15
Luxembourg 14
Beijing 11
Moscow 11
Mumbai 11
London 7
Table 2 | Main areas of competitiveness
Area of competitiveness Number ofmentions Main concerns
Business environment 148 Gettingmore important and tougher
Taxation 138 Perceived Fairness
Reputation 127 Becomemore important
People 106 Availability in emergingmarkets
Infrastructure 97 Taken for granted until it goes wrong
Market Access 87 Becoming less of a competitive issue
The Global Financial Centres Index 12 9
The GFCI questionnaire asked respondents about the futurecompetitiveness of the financial centre in which they are based. Of therespondents based in London, 49% felt that Londonwould becomemorecompetitive over the next three years and 25% felt that Londonwouldbecome less competitive.
These percentages are in contrast with respondents from the rest of Europewhere 73% felt their centre would becomemore competitive over the nextthree years and 16% felt that their centre would become less competitive.
Table 4 | The ten centreswhere newofficeswill be opened
Centres where newofficeswill be opened Number ofmentions
Singapore 17
Hong Kong 14
London 11
Shanghai 8
Dubai 6
Beijing 5
Mumbai 5
New York 5
Calgary 4
Luxembourg 4
Remain about the same
A little less competitive
A little more competitive
Much more competitive
Much less competitive
Chart 3 | Change in competitiveness over the next three years – London
“The indirect impact of theEuro-zone crisis on the UKeconomy is currently thelargest worry I have aboutLondon.”Director of Commercial Bank based in London
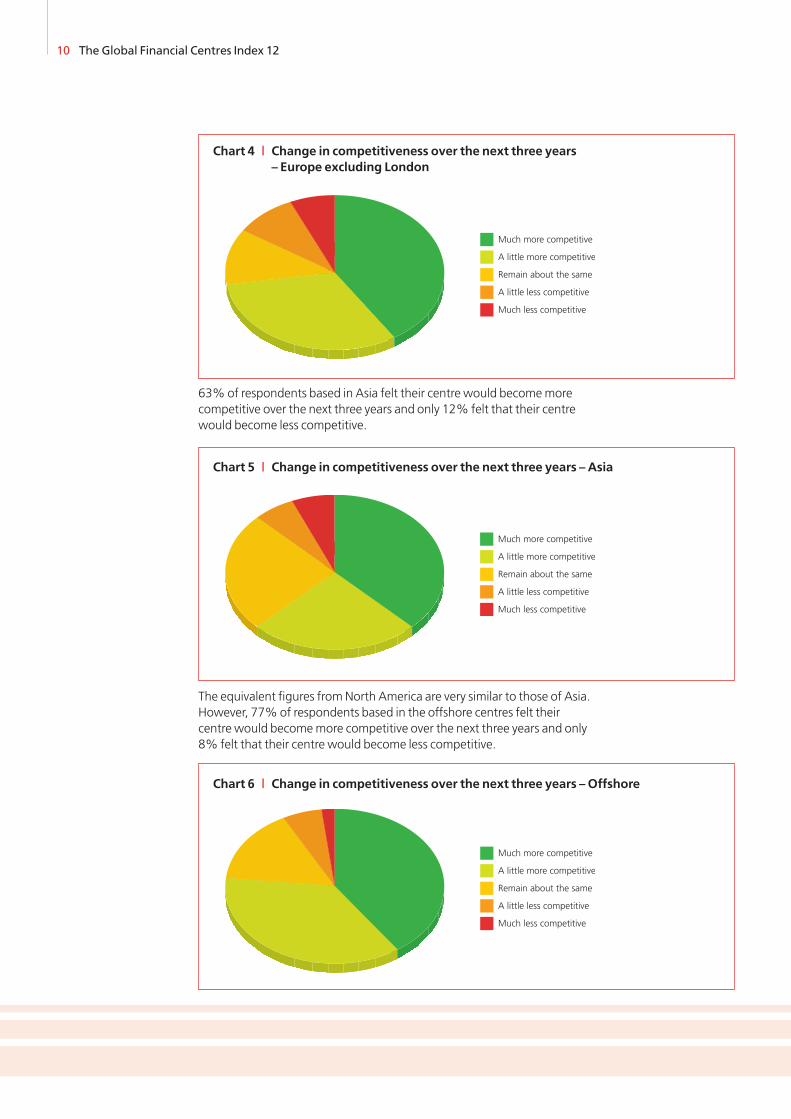
63%of respondents based in Asia felt their centre would becomemorecompetitive over the next three years and only 12% felt that their centrewould become less competitive.
The equivalent figures fromNorth America are very similar to those of Asia.However, 77%of respondents based in the offshore centres felt theircentre would becomemore competitive over the next three years and only8% felt that their centre would become less competitive.
10 The Global Financial Centres Index 12
Remain about the same
A little less competitive
A little more competitive
Much more competitive
Much less competitive
Chart 4 | Change in competitiveness over the next three years– Europe excluding London
Remain about the same
A little less competitive
A little more competitive
Much more competitive
Much less competitive
Chart 5 | Change in competitiveness over the next three years – Asia
Remain about the same
A little less competitive
A little more competitive
Much more competitive
Much less competitive
Chart 6 | Change in competitiveness over the next three years – Offshore
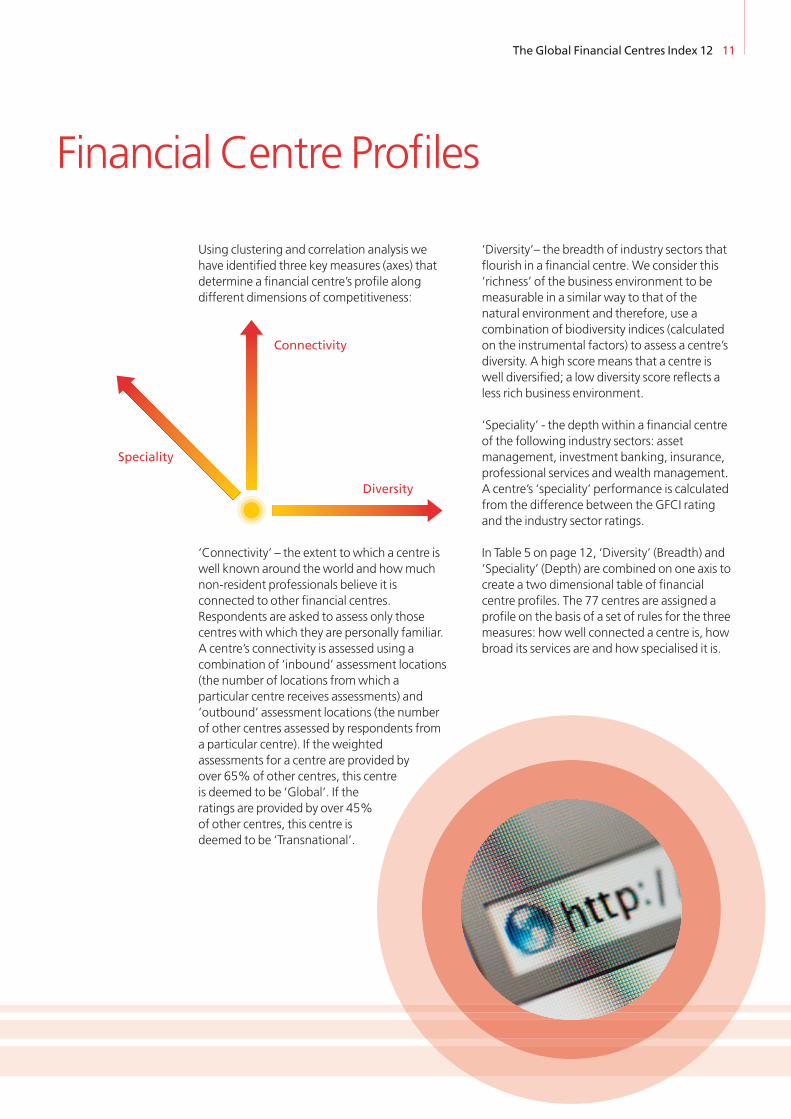
Using clustering and correlation analysis wehave identified three keymeasures (axes) thatdetermine a financial centre’s profile alongdifferent dimensions of competitiveness:
‘Connectivity’ – the extent to which a centre iswell known around the world and howmuchnon-resident professionals believe it isconnected to other financial centres.Respondents are asked to assess only thosecentres with which they are personally familiar.A centre’s connectivity is assessed using acombination of ‘inbound’ assessment locations(the number of locations fromwhich aparticular centre receives assessments) and‘outbound’ assessment locations (the numberof other centres assessed by respondents froma particular centre). If the weightedassessments for a centre are provided byover 65%of other centres, this centreis deemed to be ‘Global’. If theratings are provided by over 45%of other centres, this centre isdeemed to be ‘Transnational’.
‘Diversity’– the breadth of industry sectors thatflourish in a financial centre.We consider this‘richness’ of the business environment to bemeasurable in a similar way to that of thenatural environment and therefore, use acombination of biodiversity indices (calculatedon the instrumental factors) to assess a centre’sdiversity. A high score means that a centre iswell diversified; a low diversity score reflects aless rich business environment.
‘Speciality’ - the depth within a financial centreof the following industry sectors: assetmanagement, investment banking, insurance,professional services andwealthmanagement.A centre’s ‘speciality’ performance is calculatedfrom the difference between the GFCI ratingand the industry sector ratings.
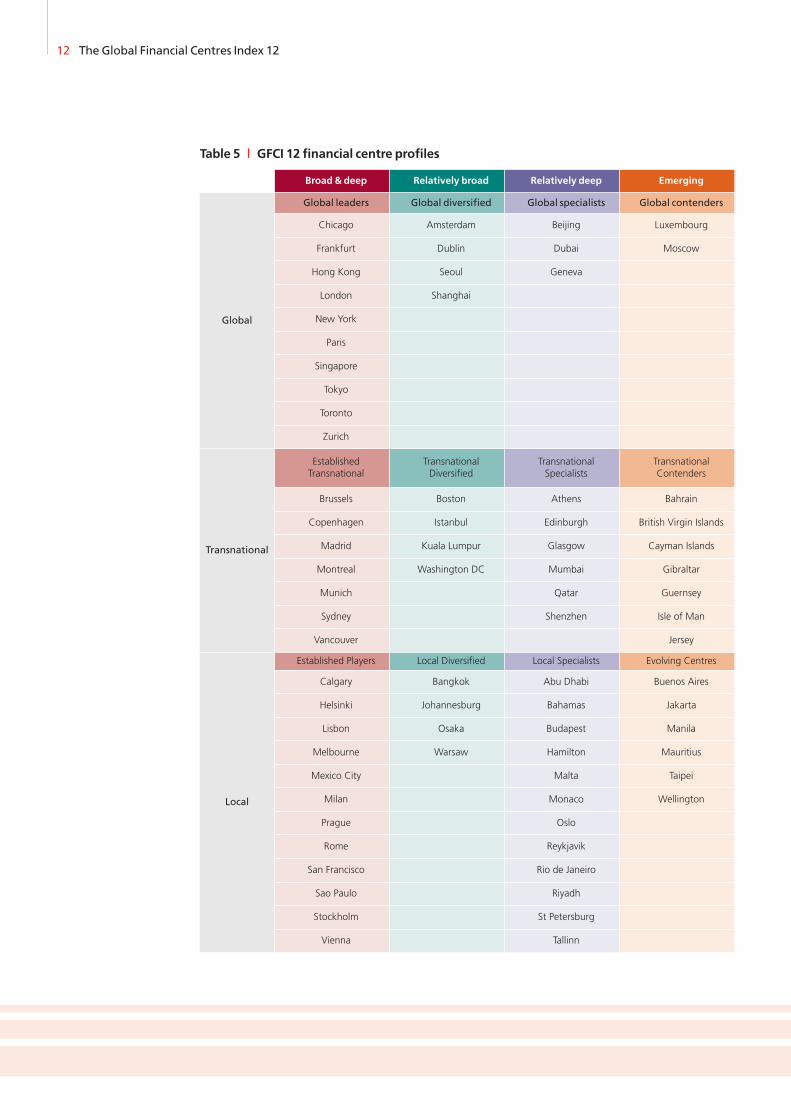
In Table 5 on page 12, ‘Diversity’ (Breadth) and‘Speciality’ (Depth) are combined on one axis tocreate a two dimensional table of financialcentre profiles. The 77 centres are assigned aprofile on the basis of a set of rules for the threemeasures: howwell connected a centre is, howbroad its services are and how specialised it is.
The Global Financial Centres Index 12 11
Financial Centre Profiles
Connectivity
Speciality
Diversity
12 The Global Financial Centres Index 12
Table 5 | GFCI 12 financial centre profiles
Broad& deep Relatively broad Relatively deep Emerging
Global
Global leaders Global diversified Global specialists Global contenders
Chicago Amsterdam Beijing Luxembourg
Frankfurt Dublin Dubai Moscow
Hong Kong Seoul Geneva
London Shanghai
New York
Paris
Singapore
Tokyo
Toronto
Zurich
Transnational
EstablishedTransnational
TransnationalDiversified
TransnationalSpecialists
TransnationalContenders
Brussels Boston Athens Bahrain
Copenhagen Istanbul Edinburgh British Virgin Islands
Madrid Kuala Lumpur Glasgow Cayman Islands
Montreal Washington DC Mumbai Gibraltar
Munich Qatar Guernsey
Sydney Shenzhen Isle of Man
Vancouver Jersey
Local
Established Players Local Diversified Local Specialists Evolving Centres
Calgary Bangkok Abu Dhabi Buenos Aires
Helsinki Johannesburg Bahamas Jakarta
Lisbon Osaka Budapest Manila
Melbourne Warsaw Hamilton Mauritius
Mexico City Malta Taipei
Milan Monaco Wellington
Prague Oslo
Rome Reykjavik
San Francisco Rio de Janeiro
Sao Paulo Riyadh
Stockholm St Petersburg
Vienna Tallinn
The Global Financial Centres Index 12 13
The ten Global Leaders (in the top left of thetable) have both broad and deep financialservices activities and are connected withmanyother financial centres. There are six centres thathavemoved profile since GFCI 11:
• Singapore is now aGlobal Leader (previouslya Global Diversified centre)
• Dubai and Geneva are nowGlobal Specialists(previously Transnational centres)
• Brussels is now an Established TransnationalCentre (previously an Established Player)
• Johannesburg and Osaka are now LocalDiversified Centres (previously EvolvingCentres).
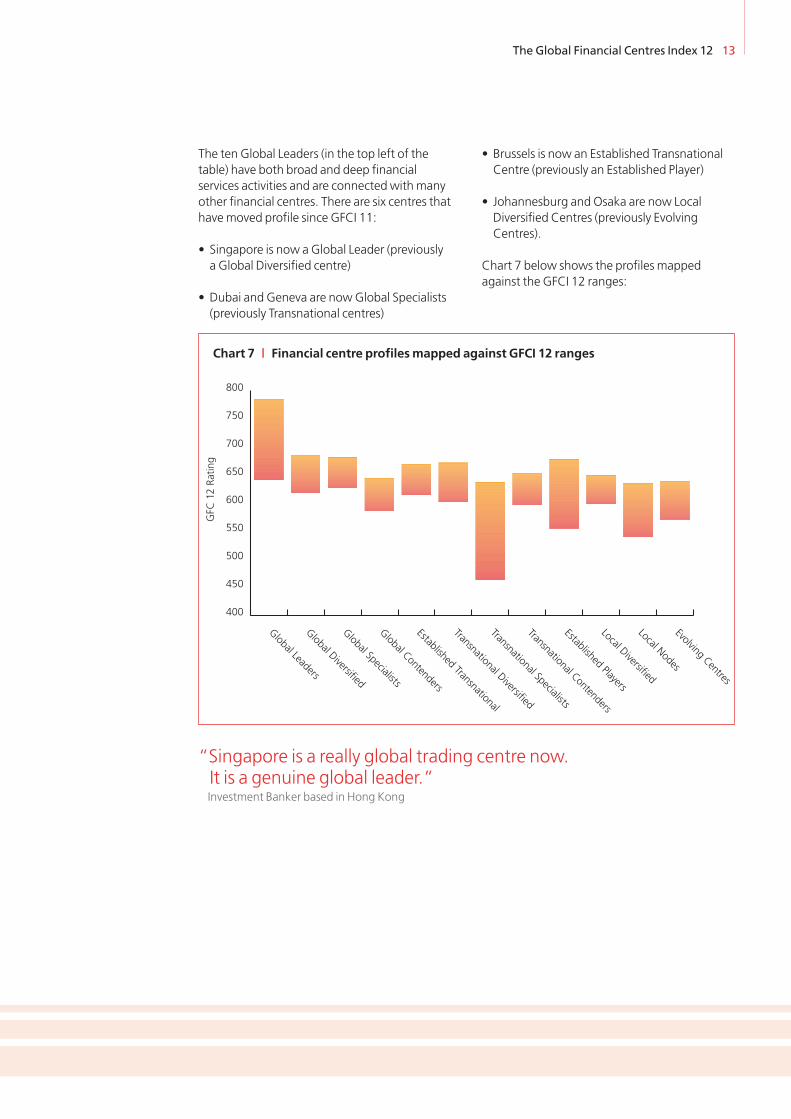
Chart 7 below shows the profiles mappedagainst the GFCI 12 ranges:
400
450
500
550
600
650
700
750
800
GFC
12Ra
ting
EvolvingCentres
Local Nodes
Local Diversified
EstablishedPlayers
Transnational Contenders
Transnational Specialists
Transnational Diversified
EstablishedTransnational
Global Contenders
Global Specialists
Global Diversified
Global Leaders
Chart 7 | Financial centre profilesmapped against GFCI 12 ranges
“Singapore is a really global trading centre now.It is a genuine global leader.”Investment Banker based in Hong Kong
14 The Global Financial Centres Index 12
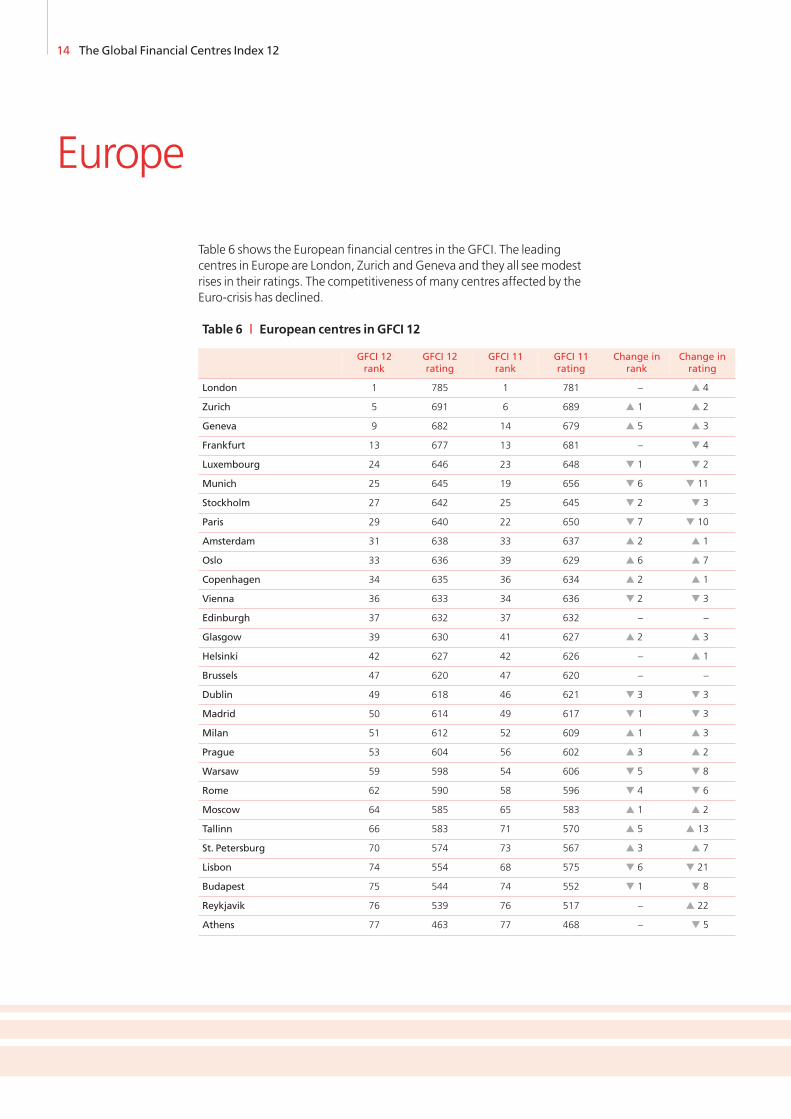
Europe
Table 6 shows the European financial centres in the GFCI. The leadingcentres in Europe are London, Zurich and Geneva and they all see modestrises in their ratings. The competitiveness of many centres affected by theEuro-crisis has declined.
Table 6 | European centres in GFCI 12
GFCI 12rank
GFCI 12rating
GFCI 11rank
GFCI 11rating
Change inrank
Change inrating
London 1 785 1 781 – � 4
Zurich 5 691 6 689 � 1 � 2
Geneva 9 682 14 679 � 5 � 3
Frankfurt 13 677 13 681 – � 4
Luxembourg 24 646 23 648 � 1 � 2
Munich 25 645 19 656 � 6 � 11
Stockholm 27 642 25 645 � 2 � 3
Paris 29 640 22 650 � 7 � 10
Amsterdam 31 638 33 637 � 2 � 1
Oslo 33 636 39 629 � 6 � 7
Copenhagen 34 635 36 634 � 2 � 1
Vienna 36 633 34 636 � 2 � 3
Edinburgh 37 632 37 632 – –
Glasgow 39 630 41 627 � 2 � 3
Helsinki 42 627 42 626 – � 1
Brussels 47 620 47 620 – –
Dublin 49 618 46 621 � 3 � 3
Madrid 50 614 49 617 � 1 � 3
Milan 51 612 52 609 � 1 � 3
Prague 53 604 56 602 � 3 � 2
Warsaw 59 598 54 606 � 5 � 8
Rome 62 590 58 596 � 4 � 6
Moscow 64 585 65 583 � 1 � 2
Tallinn 66 583 71 570 � 5 � 13
St. Petersburg 70 574 73 567 � 3 � 7
Lisbon 74 554 68 575 � 6 � 21
Budapest 75 544 74 552 � 1 � 8
Reykjavik 76 539 76 517 – � 22
Athens 77 463 77 468 – � 5
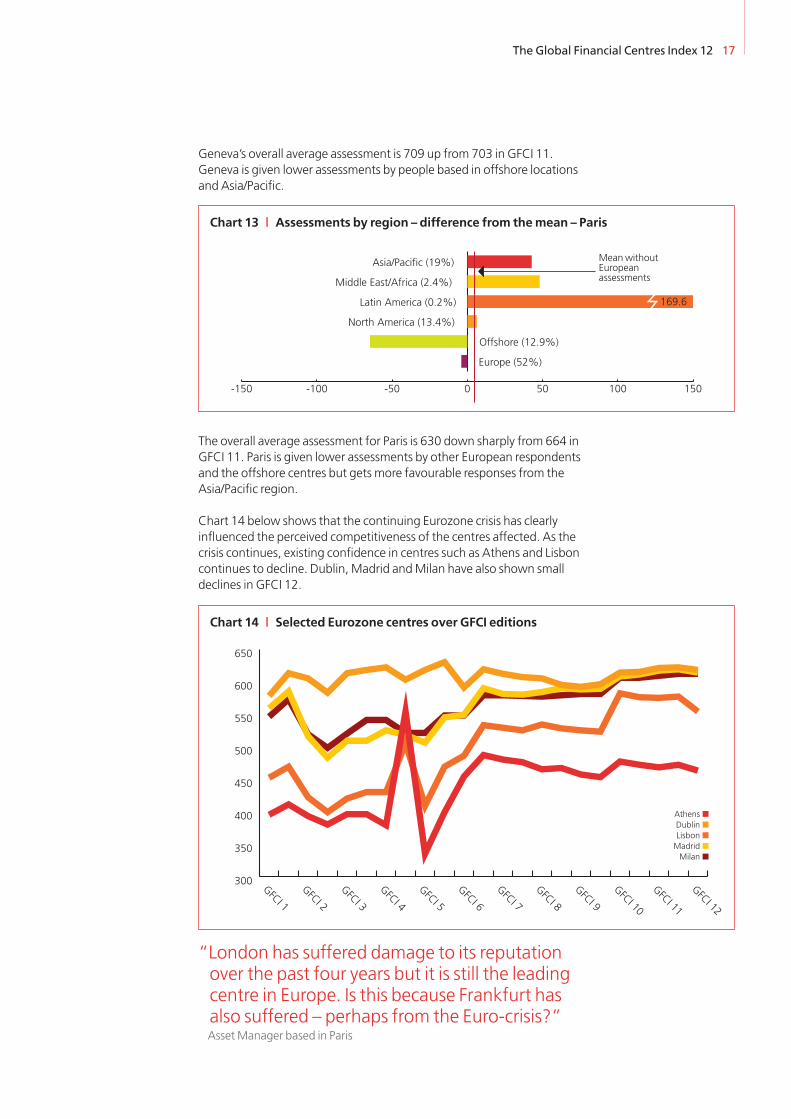
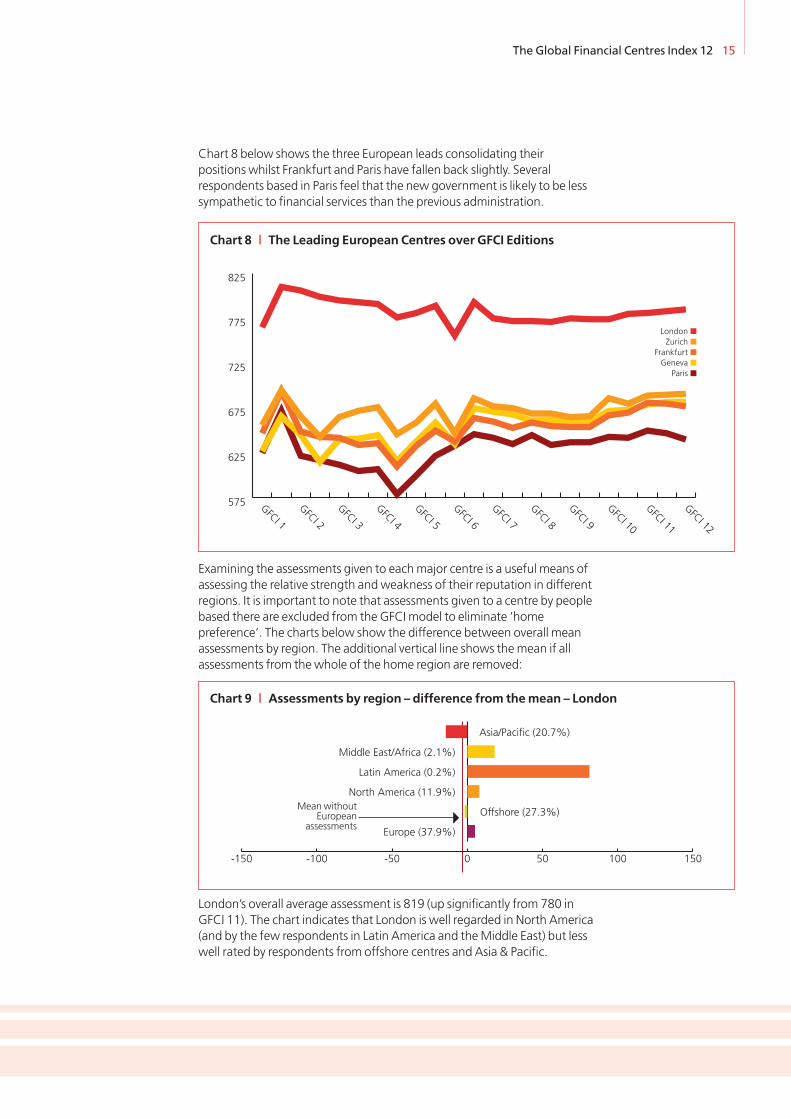
Chart 8 below shows the three European leads consolidating theirpositions whilst Frankfurt and Paris have fallen back slightly. Severalrespondents based in Paris feel that the new government is likely to be lesssympathetic to financial services than the previous administration.
Examining the assessments given to eachmajor centre is a useful means ofassessing the relative strength andweakness of their reputation in differentregions. It is important to note that assessments given to a centre by peoplebased there are excluded from the GFCI model to eliminate ‘homepreference’. The charts below show the difference between overall meanassessments by region. The additional vertical line shows themean if allassessments from the whole of the home region are removed:
London’s overall average assessment is 819 (up significantly from 780 inGFCI 11). The chart indicates that London is well regarded in North America(and by the few respondents in Latin America and theMiddle East) but lesswell rated by respondents from offshore centres and Asia & Pacific.
The Global Financial Centres Index 12 15
575
625
675
725
775
825
GFCI 12
GFCI 11
GFCI 10
GFCI 9
GFCI 8
GFCI 7
GFCI 6
GFCI 5
GFCI 4
GFCI 3
GFCI 2
GFCI 1
London ■
Zurich ■
Frankfurt ■Geneva ■
Paris ■
Chart 8 | The Leading European Centres over GFCI Editions
-150 -100 -50 0 50 100 150
Europe (37.9%)
Offshore (27.3%)
North America (11.9%)
Latin America (0.2%)
Middle East/Africa (2.1%)
Asia/Pacific (20.7%)
Chart 9 | Assessments by region – difference from themean – London
MeanwithoutEuropean
assessments
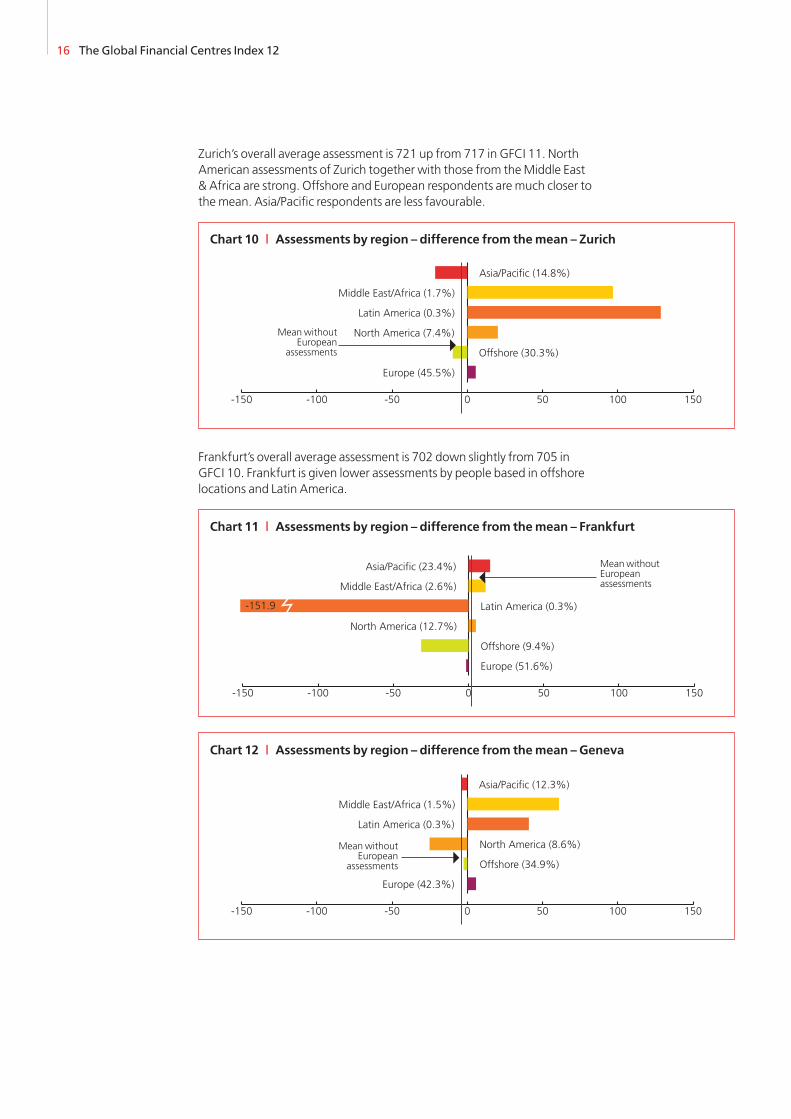
Zurich’s overall average assessment is 721 up from 717 in GFCI 11. NorthAmerican assessments of Zurich together with those from theMiddle East& Africa are strong. Offshore and European respondents are much closer tothemean. Asia/Pacific respondents are less favourable.
Frankfurt’s overall average assessment is 702 down slightly from 705 inGFCI 10. Frankfurt is given lower assessments by people based in offshorelocations and Latin America.
16 The Global Financial Centres Index 12
-150 -100 -50 0 50 100 150
Europe (51.6%)
Offshore (9.4%)
North America (12.7%)
Latin America (0.3%)
Middle East/Africa (2.6%)
Asia/Pacific (23.4%)
-151.9
Chart 11 | Assessments by region – difference from themean – Frankfurt
-150 -100 -50 0 50 100 150
Europe (42.3%)
Offshore (34.9%)
North America (8.6%)
Latin America (0.3%)
Middle East/Africa (1.5%)
Asia/Pacific (12.3%)
Chart 12 | Assessments by region – difference from themean – Geneva
MeanwithoutEuropean
assessments
-150 -100 -50 0 50 100 150
Europe (45.5%)
Offshore (30.3%)
North America (7.4%)
Latin America (0.3%)
Middle East/Africa (1.7%)
Asia/Pacific (14.8%)
Chart 10 | Assessments by region – difference from themean – Zurich
MeanwithoutEuropean
assessments
MeanwithoutEuropeanassessments
Geneva’s overall average assessment is 709 up from 703 in GFCI 11.Geneva is given lower assessments by people based in offshore locationsand Asia/Pacific.
The overall average assessment for Paris is 630 down sharply from 664 inGFCI 11. Paris is given lower assessments by other European respondentsand the offshore centres but gets more favourable responses from theAsia/Pacific region.
Chart 14 below shows that the continuing Eurozone crisis has clearlyinfluenced the perceived competitiveness of the centres affected. As thecrisis continues, existing confidence in centres such as Athens and Lisboncontinues to decline. Dublin, Madrid andMilan have also shown smalldeclines in GFCI 12.
“London has suffered damage to its reputationover the past four years but it is still the leadingcentre in Europe. Is this because Frankfurt hasalso suffered – perhaps from the Euro-crisis?”AssetManager based in Paris
The Global Financial Centres Index 12 17
-150 -100 -50 0 50 100 150
Europe (52%)
Offshore (12.9%)
North America (13.4%)
Latin America (0.2%)
Middle East/Africa (2.4%)
Asia/Pacific (19%)
169.6
Chart 13 | Assessments by region – difference from themean – Paris
300
350
400
450
500
550
600
650
GFCI 12
GFCI 11
GFCI 10
GFCI 9
GFCI 8
GFCI 7
GFCI 6
GFCI 5
GFCI 4
GFCI 3
GFCI 2
GFCI 1
Athens ■Dublin ■
Lisbon ■
Madrid ■
Milan ■
Chart 14 | Selected Eurozone centres over GFCI editions
MeanwithoutEuropeanassessments
18 The Global Financial Centres Index 12
Asia/Pacific
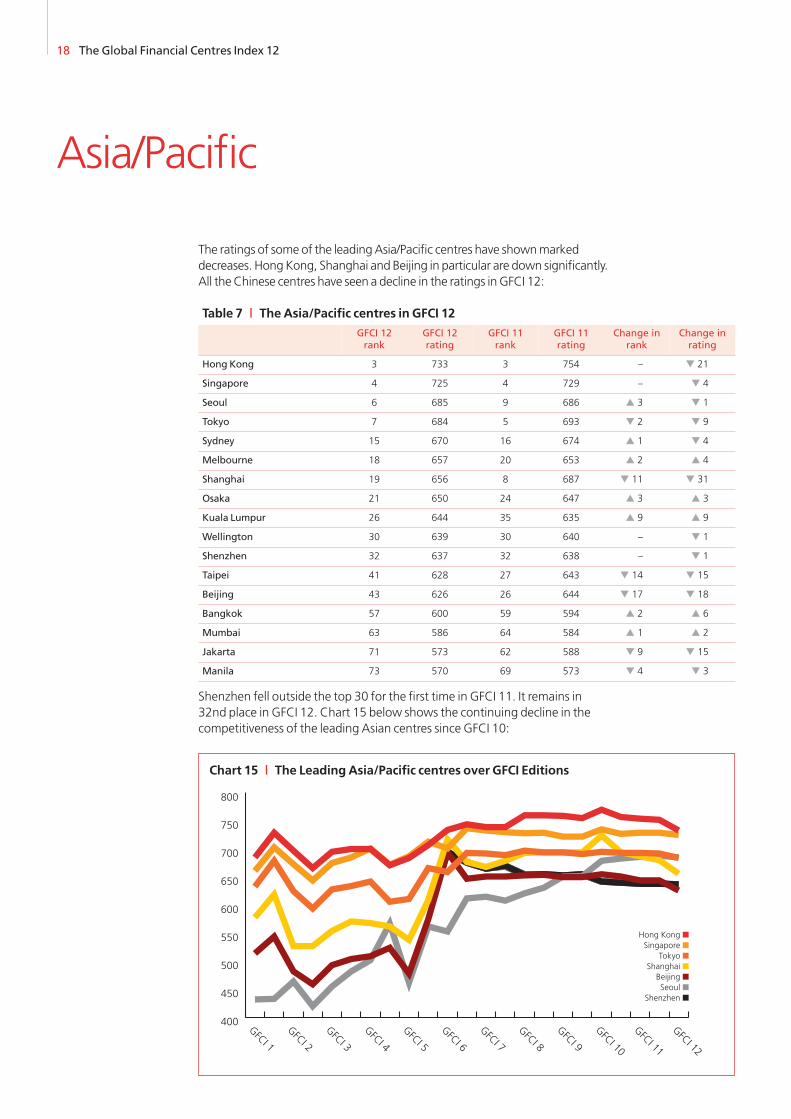
The ratings of some of the leadingAsia/Pacific centres have shownmarkeddecreases. HongKong, Shanghai and Beijing in particular are down significantly.All the Chinese centres have seen a decline in the ratings inGFCI 12:
Shenzhen fell outside the top 30 for the first time in GFCI 11. It remains in32nd place in GFCI 12. Chart 15 below shows the continuing decline in thecompetitiveness of the leading Asian centres since GFCI 10:
Table 7 | The Asia/Pacific centres in GFCI 12
GFCI 12rank
GFCI 12rating
GFCI 11rank
GFCI 11rating
Change inrank
Change inrating
Hong Kong 3 733 3 754 – � 21
Singapore 4 725 4 729 – � 4
Seoul 6 685 9 686 � 3 � 1
Tokyo 7 684 5 693 � 2 � 9
Sydney 15 670 16 674 � 1 � 4
Melbourne 18 657 20 653 � 2 � 4
Shanghai 19 656 8 687 � 11 � 31
Osaka 21 650 24 647 � 3 � 3
Kuala Lumpur 26 644 35 635 � 9 � 9
Wellington 30 639 30 640 – � 1
Shenzhen 32 637 32 638 – � 1
Taipei 41 628 27 643 � 14 � 15
Beijing 43 626 26 644 � 17 � 18
Bangkok 57 600 59 594 � 2 � 6
Mumbai 63 586 64 584 � 1 � 2
Jakarta 71 573 62 588 � 9 � 15
Manila 73 570 69 573 � 4 � 3
Hong Kong ■
Singapore ■
Tokyo ■
Shanghai ■Beijing ■
Seoul ■Shenzhen ■
400
450
500
550
600
650
700
750
800
GFCI 12
GFCI 11
GFCI 10
GFCI 9
GFCI 8
GFCI 7
GFCI 6
GFCI 5
GFCI 4
GFCI 3
GFCI 2
GFCI 1
Chart 15 | The LeadingAsia/Pacific centres over GFCI Editions
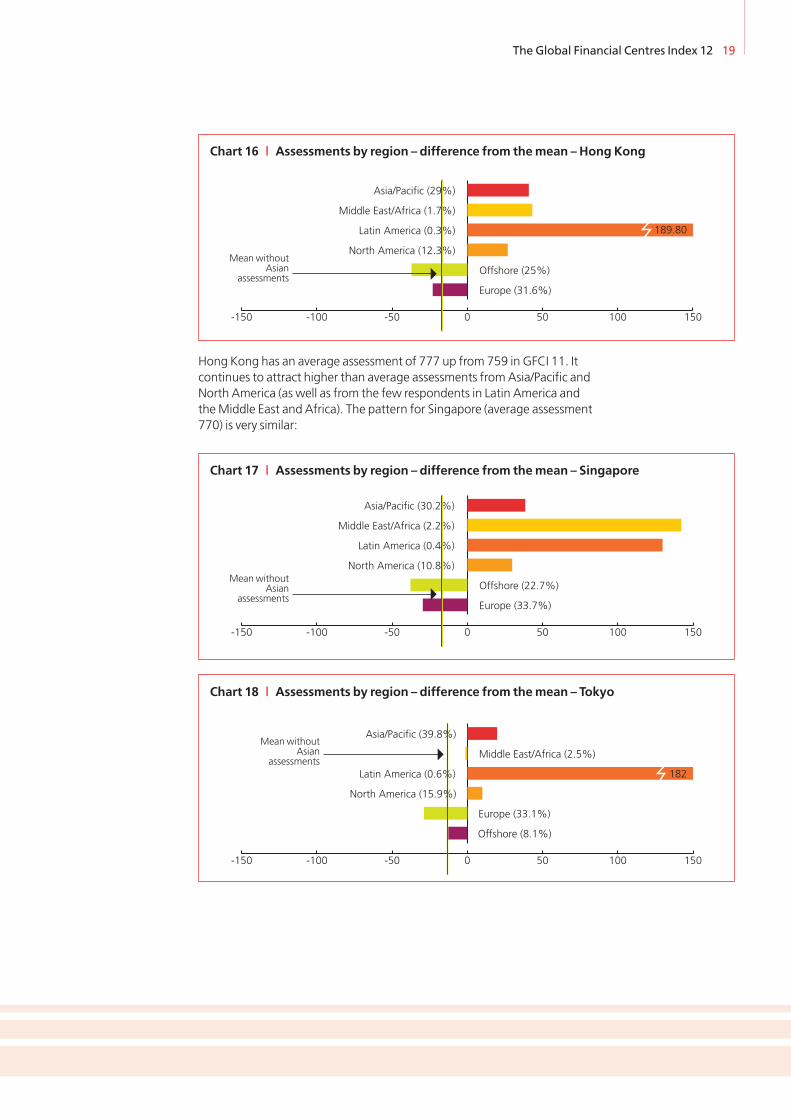
Hong Kong has an average assessment of 777 up from 759 in GFCI 11. Itcontinues to attract higher than average assessments fromAsia/Pacific andNorth America (as well as from the few respondents in Latin America andtheMiddle East and Africa). The pattern for Singapore (average assessment770) is very similar:
The Global Financial Centres Index 12 19
-150 -100 -50 0 50 100 150
Europe (31.6%)
Offshore (25%)
North America (12.3%)
Latin America (0.3%)
Middle East/Africa (1.7%)
Asia/Pacific (29%)
189.80
Chart 16 | Assessments by region – difference from themean – Hong Kong
-150 -100 -50 0 50 100 150
Offshore (8.1%)
Europe (33.1%)
North America (15.9%)
Latin America (0.6%)
Middle East/Africa (2.5%)
Asia/Pacific (39.8%)
182
Chart 18 | Assessments by region – difference from themean – Tokyo
MeanwithoutAsian
assessments
MeanwithoutAsian
assessments
-150 -100 -50 0 50 100 150
Europe (33.7%)
Offshore (22.7%)
North America (10.8%)
Latin America (0.4%)
Middle East/Africa (2.2%)
Asia/Pacific (30.2%)
Chart 17 | Assessments by region – difference from themean – Singapore
MeanwithoutAsian
assessments
20 The Global Financial Centres Index 12
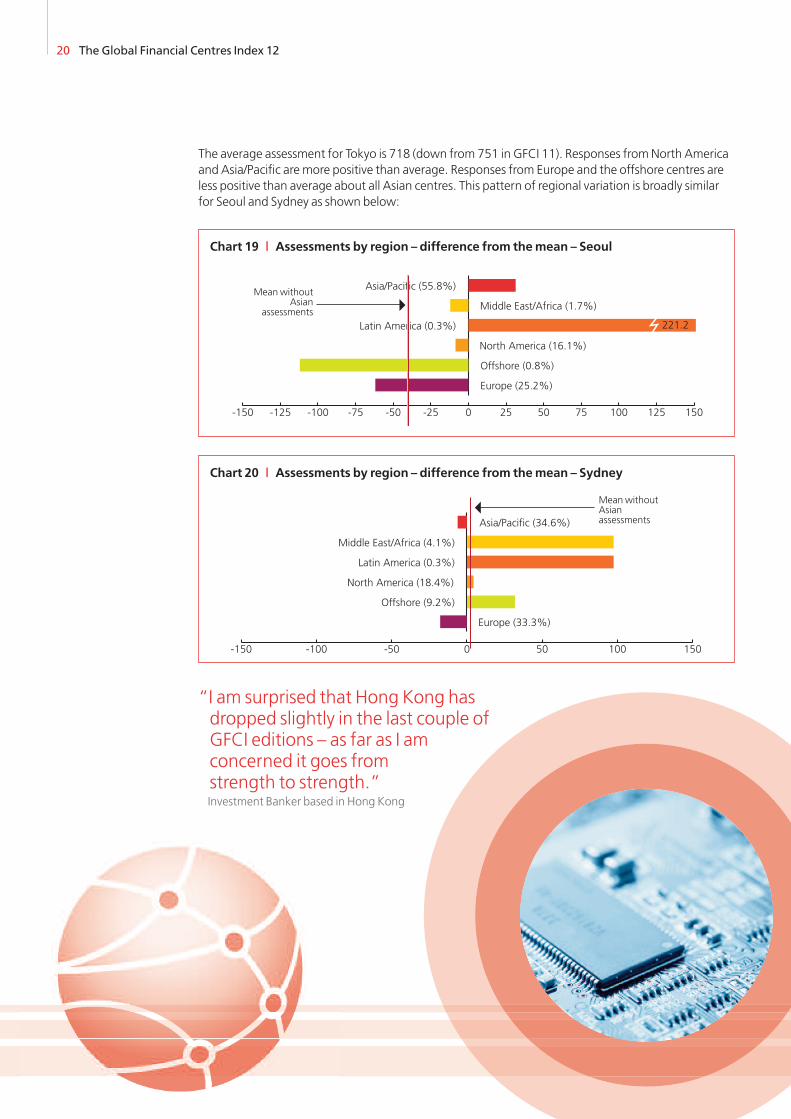
The average assessment for Tokyo is 718 (down from 751 in GFCI 11). Responses fromNorth Americaand Asia/Pacific are more positive than average. Responses from Europe and the offshore centres areless positive than average about all Asian centres. This pattern of regional variation is broadly similarfor Seoul and Sydney as shown below:
“I am surprised that Hong Kong hasdropped slightly in the last couple ofGFCI editions – as far as I amconcerned it goes fromstrength to strength.”Investment Banker based in Hong Kong
-150 -125 -100 -75 -50 -25 0 25 50 75 100 125 150
Europe (25.2%)
Offshore (0.8%)
North America (16.1%)
Middle East/Africa (1.7%)
Latin America (0.3%)
Asia/Pacific (55.8%)
221.2
Chart 19 | Assessments by region – difference from themean – Seoul
MeanwithoutAsian
assessments
-150 -100 -50 0 50 100 150
Europe (33.3%)
Offshore (9.2%)
North America (18.4%)
Latin America (0.3%)
Middle East/Africa (4.1%)
Asia/Pacific (34.6%)
Chart 20 | Assessments by region – difference from themean – Sydney
MeanwithoutAsianassessments
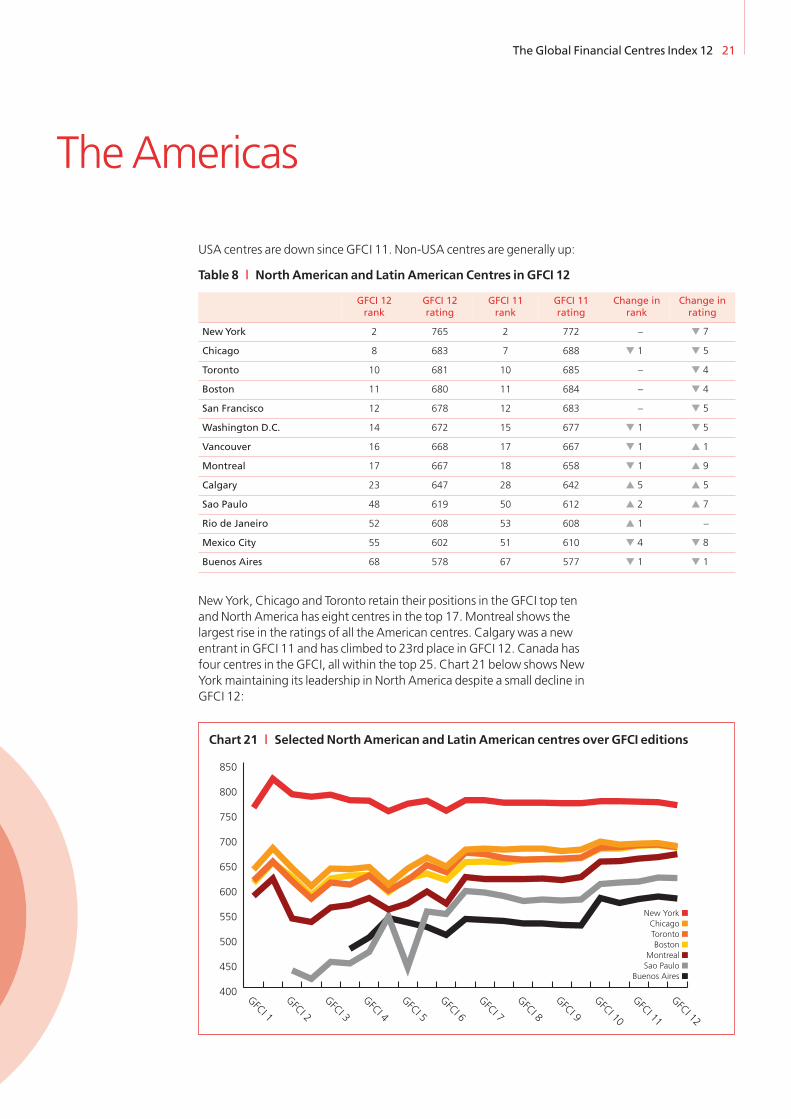
USA centres are down since GFCI 11. Non-USA centres are generally up:
New York, Chicago and Toronto retain their positions in the GFCI top tenand North America has eight centres in the top 17.Montreal shows thelargest rise in the ratings of all the American centres. Calgary was a newentrant in GFCI 11 and has climbed to 23rd place in GFCI 12. Canada hasfour centres in the GFCI, all within the top 25. Chart 21 below shows NewYorkmaintaining its leadership in North America despite a small decline inGFCI 12:
The Global Financial Centres Index 12 21
TheAmericas
Table 8 | North American and Latin American Centres in GFCI 12
GFCI 12rank
GFCI 12rating
GFCI 11rank
GFCI 11rating
Change inrank
Change inrating
NewYork 2 765 2 772 – � 7
Chicago 8 683 7 688 � 1 � 5
Toronto 10 681 10 685 – � 4
Boston 11 680 11 684 – � 4
San Francisco 12 678 12 683 – � 5
Washington D.C. 14 672 15 677 � 1 � 5
Vancouver 16 668 17 667 � 1 � 1
Montreal 17 667 18 658 � 1 � 9
Calgary 23 647 28 642 � 5 � 5
Sao Paulo 48 619 50 612 � 2 � 7
Rio de Janeiro 52 608 53 608 � 1 –
Mexico City 55 602 51 610 � 4 � 8
Buenos Aires 68 578 67 577 � 1 � 1
400
450
500
550
600
650
700
750
800
850
GFCI 12
GFCI 11
GFCI 10
GFCI 9
GFCI 8
GFCI 7
GFCI 6
GFCI 5
GFCI 4
GFCI 3
GFCI 2
GFCI 1
New York ■
Chicago ■
Toronto ■
Boston ■
Montreal ■Sao Paulo ■
Buenos Aires ■
Chart 21 | Selected North American and Latin American centres over GFCI editions
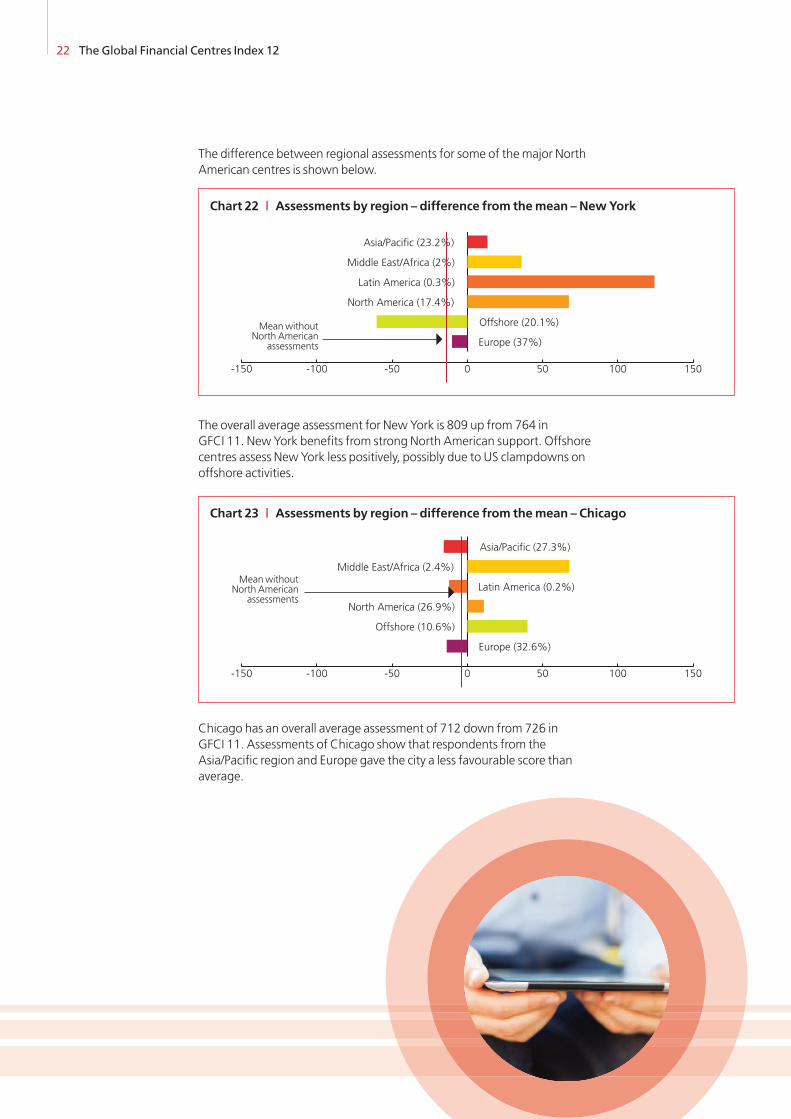
The difference between regional assessments for some of themajor NorthAmerican centres is shown below.
The overall average assessment for New York is 809 up from 764 inGFCI 11. New York benefits from strong North American support. Offshorecentres assess New York less positively, possibly due to US clampdowns onoffshore activities.
Chicago has an overall average assessment of 712 down from 726 inGFCI 11. Assessments of Chicago show that respondents from theAsia/Pacific region and Europe gave the city a less favourable score thanaverage.
22 The Global Financial Centres Index 12
-150 -100 -50 0 50 100 150
Europe (37%)
Offshore (20.1%)
North America (17.4%)
Latin America (0.3%)
Middle East/Africa (2%)
Asia/Pacific (23.2%)
Chart 22 | Assessments by region – difference from themean – NewYork
-150 -100 -50 0 50 100 150
Europe (32.6%)
Offshore (10.6%)
North America (26.9%)
Latin America (0.2%)
Middle East/Africa (2.4%)
Asia/Pacific (27.3%)
Chart 23 | Assessments by region – difference from themean – Chicago
MeanwithoutNorth American
assessments
MeanwithoutNorth American
assessments
The Global Financial Centres Index 12 23
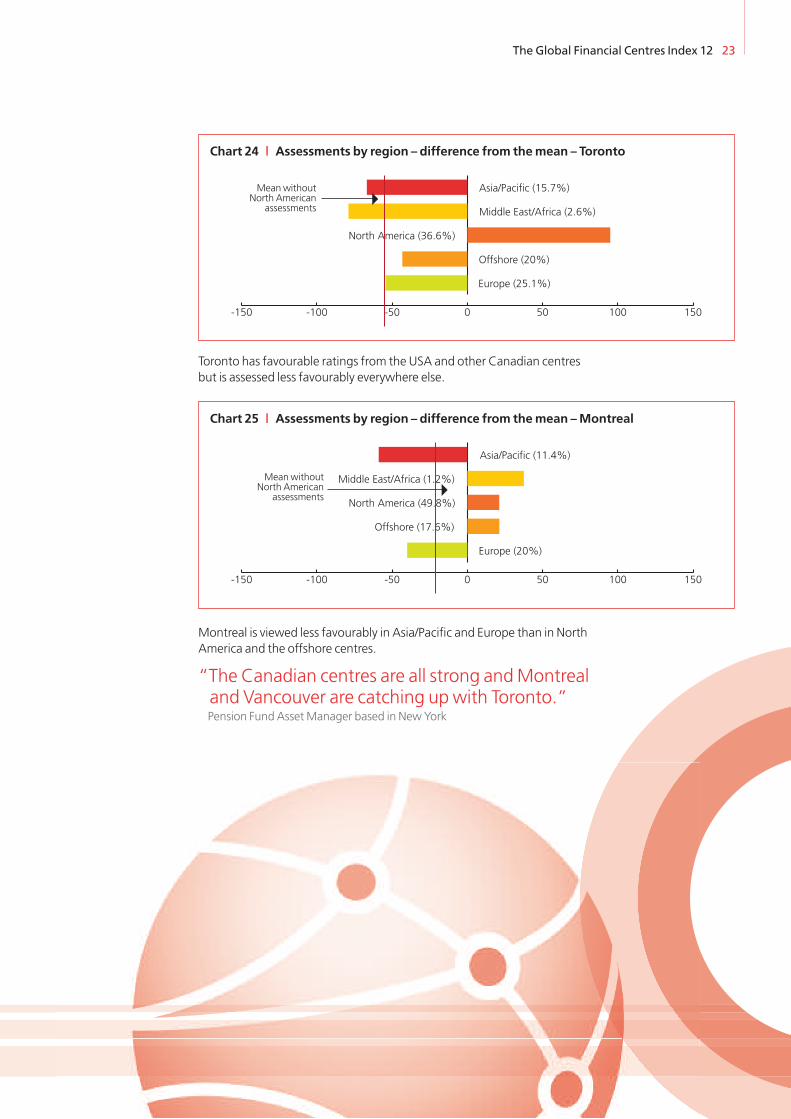
Toronto has favourable ratings from the USA and other Canadian centresbut is assessed less favourably everywhere else.
Montreal is viewed less favourably in Asia/Pacific and Europe than in NorthAmerica and the offshore centres.
“The Canadian centres are all strong andMontrealand Vancouver are catching upwith Toronto.”Pension Fund AssetManager based in New York
-150 -100 -50 0 50 100 150
Europe (25.1%)
Offshore (20%)
North America (36.6%)
Middle East/Africa (2.6%)
Asia/Pacific (15.7%)
Chart 24 | Assessments by region – difference from themean – Toronto
-150 -100 -50 0 50 100 150
Europe (20%)
Offshore (17.6%)
North America (49.8%)
Middle East/Africa (1.2%)
Asia/Pacific (11.4%)
Chart 25 | Assessments by region – difference from themean –Montreal
MeanwithoutNorth American
assessments
MeanwithoutNorth American
assessments
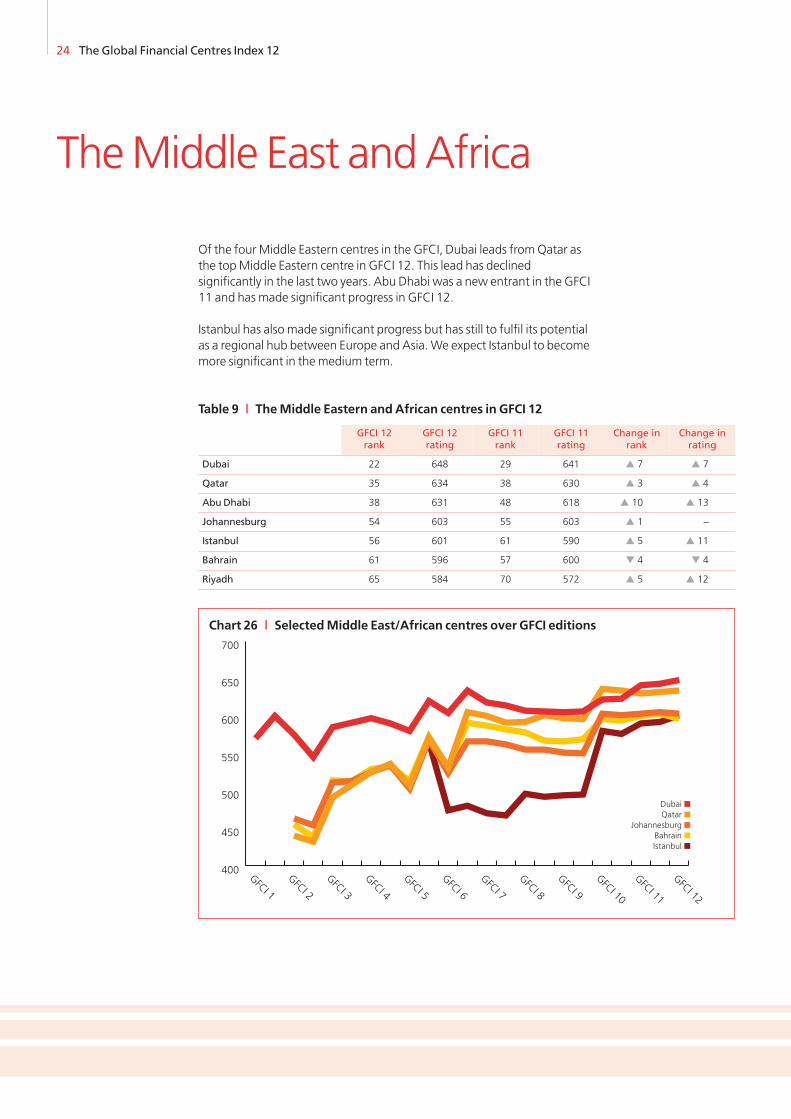
Of the fourMiddle Eastern centres in the GFCI, Dubai leads fromQatar asthe topMiddle Eastern centre in GFCI 12. This lead has declinedsignificantly in the last two years. Abu Dhabi was a new entrant in the GFCI11 and has made significant progress in GFCI 12.
Istanbul has alsomade significant progress but has still to fulfil its potentialas a regional hub between Europe and Asia.We expect Istanbul to becomemore significant in themedium term.
24 The Global Financial Centres Index 12
TheMiddle East andAfrica
Dubai ■Qatar ■
Johannesburg ■
Bahrain ■
Istanbul ■
400
450
500
550
600
650
700
GFCI 12
GFCI 11
GFCI 10
GFCI 9
GFCI 8
GFCI 7
GFCI 6
GFCI 5
GFCI 4
GFCI 3
GFCI 2
GFCI 1
Chart 26 | SelectedMiddle East/African centres over GFCI editions
Table 9 | TheMiddle Eastern andAfrican centres in GFCI 12
GFCI 12rank
GFCI 12rating
GFCI 11rank
GFCI 11rating
Change inrank
Change inrating
Dubai 22 648 29 641 � 7 � 7
Qatar 35 634 38 630 � 3 � 4
AbuDhabi 38 631 48 618 � 10 � 13
Johannesburg 54 603 55 603 � 1 –
Istanbul 56 601 61 590 � 5 � 11
Bahrain 61 596 57 600 � 4 � 4
Riyadh 65 584 70 572 � 5 � 12
The Global Financial Centres Index 12 25
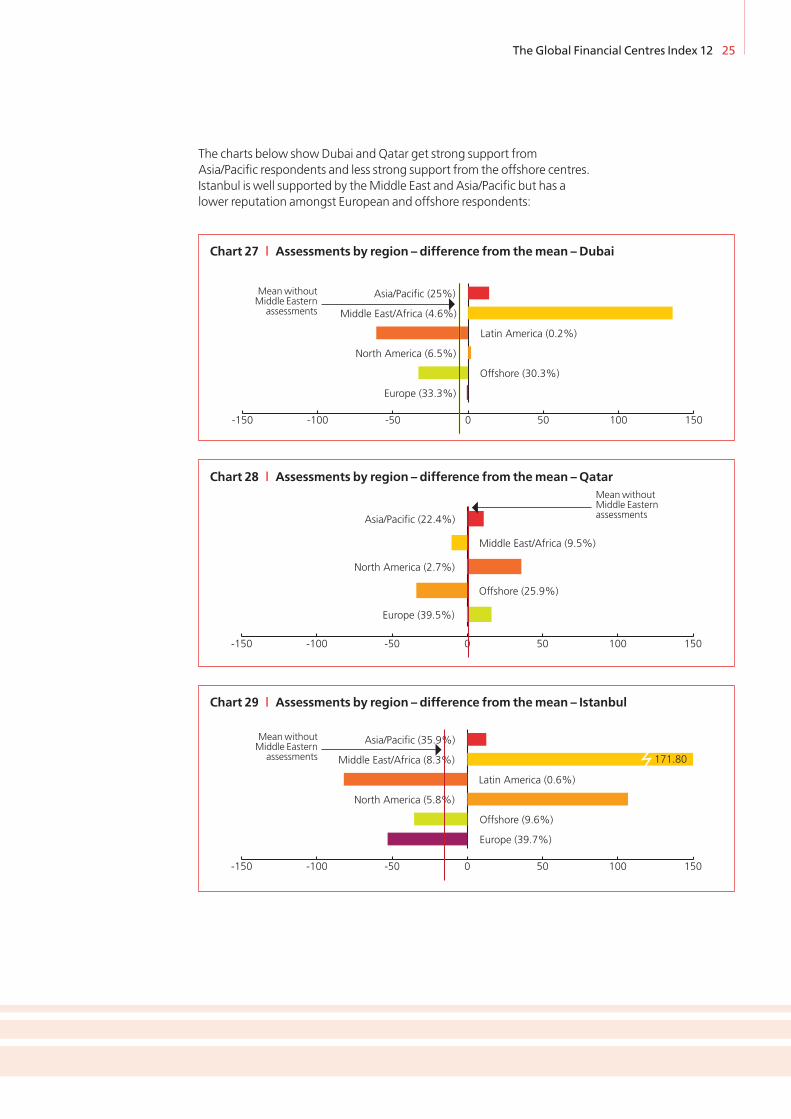
The charts below showDubai and Qatar get strong support fromAsia/Pacific respondents and less strong support from the offshore centres.Istanbul is well supported by theMiddle East and Asia/Pacific but has alower reputation amongst European and offshore respondents:
-150 -100 -50 0 50 100 150
Europe (33.3%)
Offshore (30.3%)
North America (6.5%)
Latin America (0.2%)
Middle East/Africa (4.6%)
Asia/Pacific (25%)
722
Chart 27 | Assessments by region – difference from themean – Dubai
-150 -100 -50 0 50 100 150
Europe (39.5%)
Offshore (25.9%)
North America (2.7%)
Middle East/Africa (9.5%)
Asia/Pacific (22.4%)
Chart 28 | Assessments by region – difference from themean –Qatar
-150 -100 -50 0 50 100 150
Europe (39.7%)
Offshore (9.6%)
North America (5.8%)
Latin America (0.6%)
Middle East/Africa (8.3%)
Asia/Pacific (35.9%)
171.80
Chart 29 | Assessments by region – difference from themean – Istanbul
MeanwithoutMiddle Eastern
assessments
MeanwithoutMiddle Easternassessments
MeanwithoutMiddle Eastern
assessments
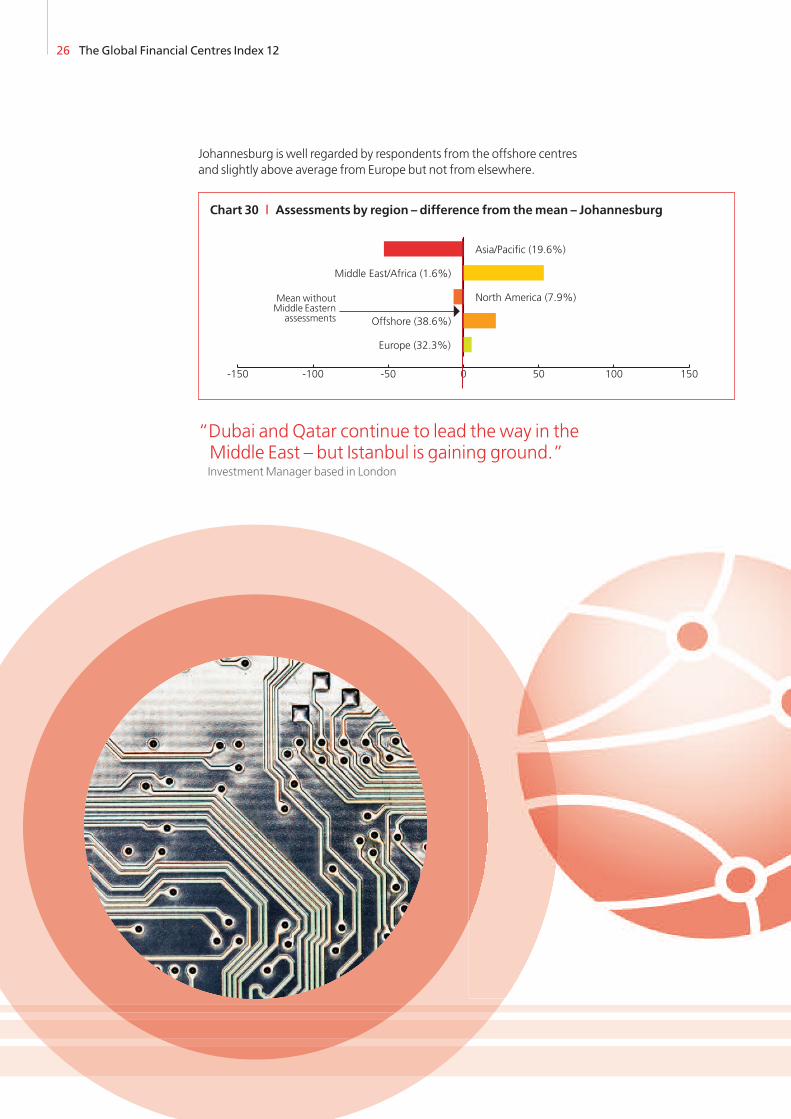
Johannesburg is well regarded by respondents from the offshore centresand slightly above average from Europe but not from elsewhere.
“Dubai and Qatar continue to lead the way in theMiddle East – but Istanbul is gaining ground.”InvestmentManager based in London
26 The Global Financial Centres Index 12
-150 -100 -50 0 50 100 150
Europe (32.3%)
Offshore (38.6%)
North America (7.9%)
Middle East/Africa (1.6%)
Asia/Pacific (19.6%)
Chart 30 | Assessments by region – difference from themean – Johannesburg
MeanwithoutMiddle Eastern
assessments
The Global Financial Centres Index 12 27
OffshoreCentres
Offshore centres have suffered significant reputational damage in the pastfour years. GFCI 10 and 11 showed that many of these centres’ reputationswere recovering lost ground. GFCI 12 shows a fairly static picture with nolargemovements (apart from the Bahamas and Gibraltar that both showgood increases). Jersey and Guernsey remain the leading offshore centres:
Jersey ■
Guernsey ■
Hamilton ■
Isle of Man ■
Cayman Islands ■British Virgin Islands ■
520
540
560
580
600
620
640
660
680
GFCI 12
GFCI 11
GFCI 10
GFCI 9
GFCI 8
GFCI 7
GFCI 6
GFCI 5
GFCI 4
GFCI 3
GFCI 2
GFCI 1
Chart 31 | The top offshore centres over GFCI Editions
Table10 | Top offshore centres in GFCI 12
GFCI 12rank
GFCI 12rating
GFCI 11rank
GFCI 11rating
Change inrank
Change inrating
Jersey 20 654 21 652 � 1 � 2
Guernsey 28 641 31 639 � 3 � 2
Isle ofMan 40 629 44 624 � 4 � 5
Cayman Islands 44 625 40 628 � 4 � 3
British Virgin Islands 45 624 45 623 – � 1
Hamilton 46 621 43 625 � 3 � 4
Gibraltar 58 599 63 587 � 5 � 12
Monaco 60 597 60 593 – � 4
Mauritius 67 579 66 578 � 1 � 1
Malta 69 575 72 568 � 3 � 7
Bahamas 72 572 75 550 � 3 � 22
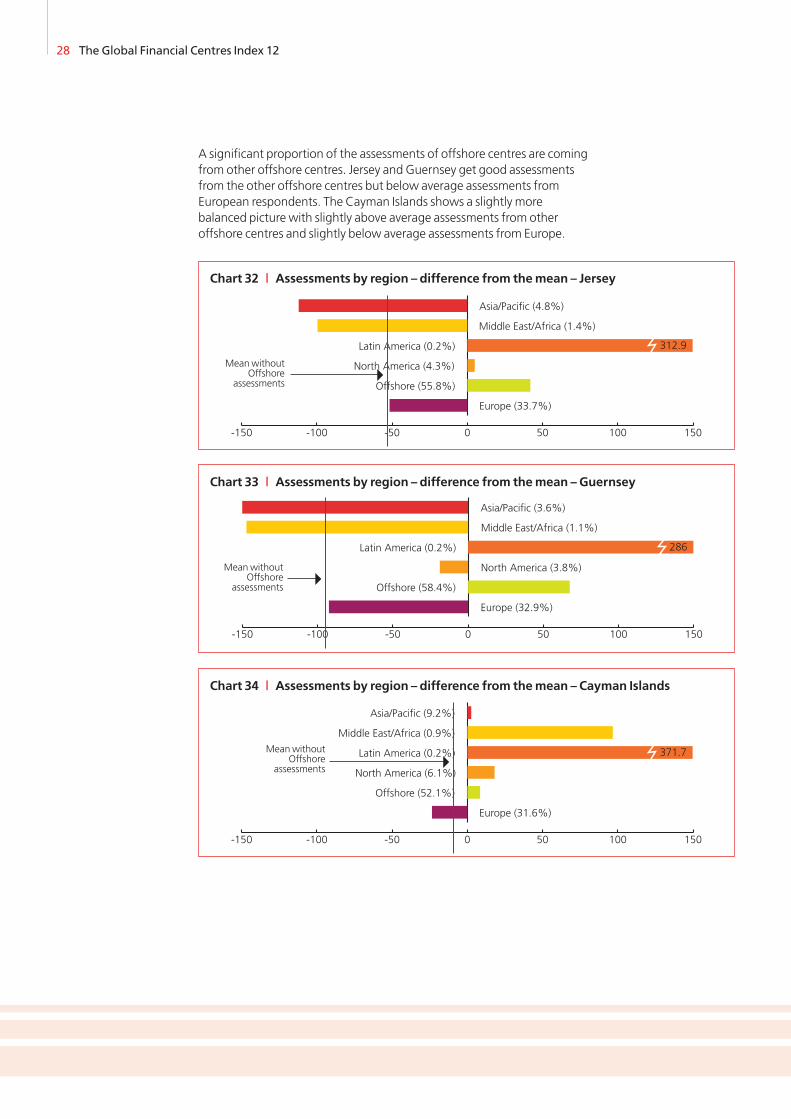
A significant proportion of the assessments of offshore centres are comingfrom other offshore centres. Jersey and Guernsey get good assessmentsfrom the other offshore centres but below average assessments fromEuropean respondents. The Cayman Islands shows a slightly morebalanced picture with slightly above average assessments from otheroffshore centres and slightly below average assessments from Europe.
28 The Global Financial Centres Index 12
-150 -100 -50 0 50 100 150
Europe (33.7%)
Middle East/Africa (1.4%)
Asia/Pacific (4.8%)
Offshore (55.8%)
North America (4.3%)
Latin America (0.2%) 312.9
Chart 32 | Assessments by region – difference from themean – Jersey
MeanwithoutOffshore
assessments
-150 -100 -50 0 50 100 150
Europe (32.9%)
Offshore (58.4%)
North America (3.8%)
Latin America (0.2%)
Middle East/Africa (1.1%)
Asia/Pacific (3.6%)
-185
286
Chart 33 | Assessments by region – difference from themean – Guernsey
-150 -100 -50 0 50 100 150
Europe (31.6%)
Offshore (52.1%)
North America (6.1%)
Latin America (0.2%)
Middle East/Africa (0.9%)
Asia/Pacific (9.2%)
371.7
Chart 34 | Assessments by region – difference from themean – Cayman Islands
MeanwithoutOffshore
assessments
MeanwithoutOffshore
assessments
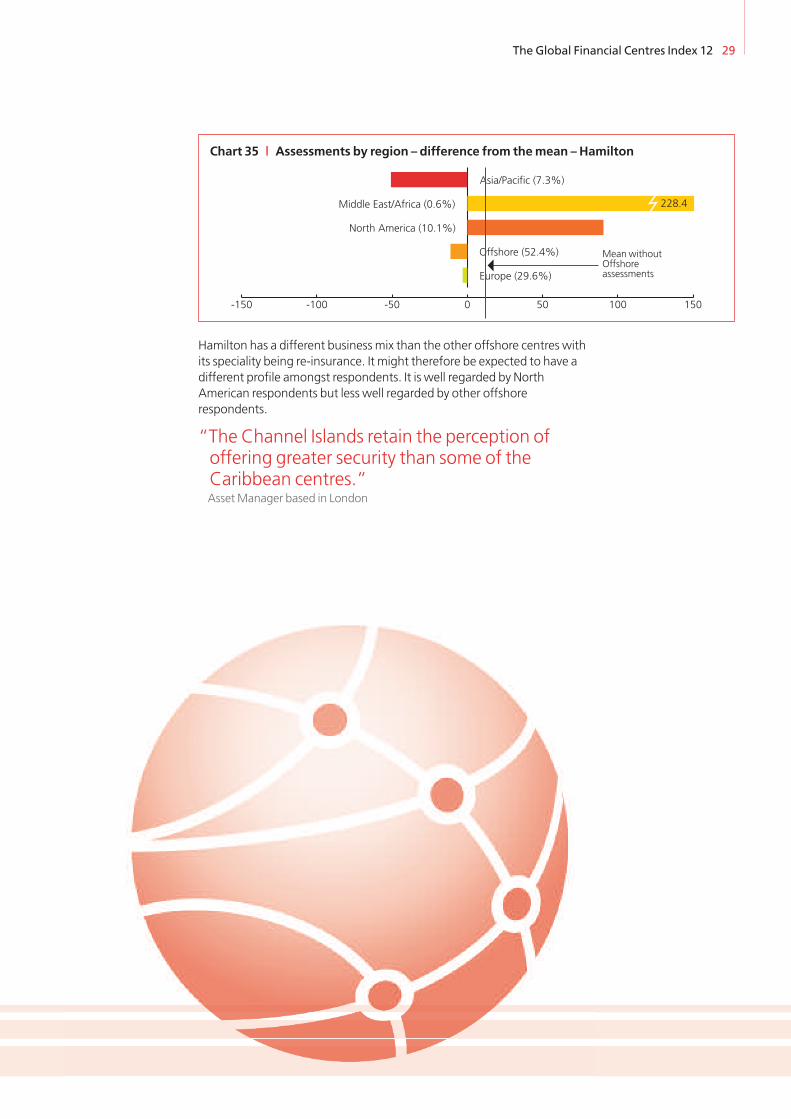
Hamilton has a different business mix than the other offshore centres withits speciality being re-insurance. It might therefore be expected to have adifferent profile amongst respondents. It is well regarded by NorthAmerican respondents but less well regarded by other offshorerespondents.
“The Channel Islands retain the perception ofoffering greater security than some of theCaribbean centres.”AssetManager based in London
The Global Financial Centres Index 12 29
-150 -100 -50 0 50 100 150
Europe (29.6%)
Offshore (52.4%)
North America (10.1%)
Middle East/Africa (0.6%)
Asia/Pacific (7.3%)
228.4
Chart 35 | Assessments by region – difference from themean – Hamilton
MeanwithoutOffshoreassessments
30 The Global Financial Centres Index 12
TheGFCIWorld
8 10
1411
45
17
2
16
44
52
68
72
46
55
12
23
76
48
28 20
50
31
29
1
34
279
47
56
77
58
60
69
27
51
4039 37
49
24
62
3342
74
5953
3613
5
70
75
66
See insetdetailedmap
The Global Financial Centres Index 12 31
4
7
15
32
436
19
413
6135 22
26
63
64
30
67
48
54
18
71
6357
21
65
Broad and deep
Global leaders
Established transnational
Established players
Relatively broad
Global diversified
Transnational diversified
Local diversified
Relatively deep
Global specialists
Transnational specialists
Local nodes
Emerging
Global contenders
Transnational contenders
Evolving centres
The numbers on themap show theGFCI ranking of the relevant centre
32 The Global Financial Centres Index 12
Industry Sectors
Industry sector sub-indices are created bybuilding the GFCI 12 statistical model using onlythe questionnaire responses from respondentsworking in the relevant industry sectors. TheGFCI 12 dataset has been used to produceseparate sub-indices for the Banking, AssetManagement, Insurance, Professional Services,Government & Regulatory andWealthManagement & Private Banking sectors.
London appears at the top of five of the six sub-indices. New York tops the Banking sub-index.Table 11 below shows the top ten rankedfinancial centres in the industry sector sub-indices:
The top four centres in the GFCI 12 overall indexare top of the AssetManagement, Government& Regulatory, Insurance and ProfessionalServices sub-indices.
The wealthmanagement sub-index shows thatthe specialist wealthmanagement centres cancompete with themulti-sector global centres.
Table 11 | GFCI 12 industry sector sub-indices Top 10
Rank Assetmanagement
Banking Government& regulatory
Insurance Professionalservices
Wealthmanagement
1 London (-) New York (-) London (-) London (+2) London (-) London (-)
2 New York (-) London (-) New York (-) New York (-) New York (-) Zurich (+4)
3 Singapore (+1) Seoul (-) Hong Kong (-) Singapore (+2) Hong Kong (-) Hong Kong (-)
4 Hong Kong (-1) Hong Kong (-) Singapore (-) Hong Kong (-3) Singapore (-) New York (-2)
5 Tokyo (+4) Singapore (-) Paris (+1) Zurich (+3) Zurich (-) Singapore (+1)
5 Boston (-1) Tokyo (-) Frankfurt (-1) Tokyo (-) Geneva (+1) Geneva (-)
7 Chicago (+1) Frankfurt (+2) Tokyo (-) Geneva (+14) Chicago (-) Toronto (-)
8 Toronto (-1) Zurich (-1) Geneva (+3) Chicago (-1) Toronto (-1) Vancouver (+1)
9 Zurich (+1) Toronto (-) Zurich (+3) Seoul (+10) Sydney (+4) Frankfurt (+3)
10 San Francisco (-4) Chicago (-3) Toronto (-) Sydney (+3) Montreal (+6) Jersey (-2)
“Zurichmaintains its strong reputation for private banking andwealthmanagement – despite international pressure for moredisclosure.”PrivateWealthManager based in Zurich
The Global Financial Centres Index 12 33
The instrumental factors used in the GFCI 12model are grouped into five key areas ofcompetitiveness (People, Business Environment,Market Access, Infrastructure and GeneralCompetitiveness). The GFCI 12 factorassessment model is run with one set ofinstrumental factors at a time. Table 12 showsthe top ten ranked centres in each sub-index:
The top four financial centres in GFCI 12 –London, New York, Hong Kong and Singapore –also share the top four places in each of thesesub indices (as they have in the past foureditions of GFCI). This confirms their strength inall five areas of competitiveness. It also confirmsour belief that a genuinely top global centre iscompetitive in all areas – successful people liketo live andwork in successful centres. Genevanow appears in the top ten in all five sub-indices, Seoul is now in four of the five sub-indices and Frankfurt is in the top ten in three ofthe five sub-indices.
“It is good to see Geneva’s scorenow reflects its strengths in somany areas.”Private Banker based in Geneva
FiveAreas of Competitiveness
Table 12 | GFCI 12 Area of competitiveness sub-indices – Top 10
Rank People Businessenvironment
Market access Infrastructure Generalcompetitiveness
1 London (-) London (-) London (-) London (-) London (-)
2 New York (-) New York (-) New York (-) New York (-) New York (-)
3 Hong Kong (-) Hong Kong (-) Hong Kong (-) Hong Kong (-) Hong Kong (-)
4 Singapore (-) Singapore (-) Singapore (-) Singapore (-) Singapore (-)
5 Zurich (+5) Zurich (+3) Zurich (+1) Zurich (+2) Zurich (+3)
5 Tokyo (-1) Geneva (+4) Geneva (+7) Seoul (-) Seoul (-1)
7 Seoul (-) Seoul (-2) Tokyo (-2) Geneva (+2) Tokyo (-1)
8 Chicago (-1) Tokyo (-1) Chicago (+1) Tokyo (-3) Geneva (+7)
9 Toronto (+5) Chicago (-3) Boston (+2) Chicago (-1) Chicago (-2)
10 Geneva (+5) Frankfurt (+2) Frankfurt (+3) Frankfurt (-) Toronto (-2)
It is useful to look at how the leading centres areviewed by respondents working for differentsizes of organisation.
Chart 36 above shows that London is stillassessedmore highly than both New York andHong Kong by respondents from smallorganisations (with fewer than 100 employees).At the other end of the scale New York isassessed slightly higher than London byrespondents from organisations with over5,000 employees. In themid-sizedorganisations (500 to 2,000 employees) Londonis a clear leader fromNewYork and Hong Kong.
34 The Global Financial Centres Index 12
Size ofOrganisation
“Tomymind London is thebest base for our assetmanagement business.”Director of mid-sized AssetManager based inLondon
600
650
700
750
800
850
900
Fewer than 100100 to 500500 to 1,0001,000 to 2,0002,000 to 5,000More than 5,000
London ■New York ■
Hong Kong ■
Chart 36 | Top three centres – average assessments by respondent’s organisation size
The Global Financial Centres Index 12 35
In the GFCI model, one way to look atreputation is to examine the difference betweenthe average assessment given to a centre and itsoverall rating (the average assessment adjustedto reflect the instrumental factors). If a centrehas a higher average assessment than the GFCI12 rating this indicates that respondents’perceptions of a centre are more favourablethan the quantitative measures alone wouldsuggest. This may be due to strongmarketing orgeneral awareness. Table 13 below shows the20 centres with the greatest positive differencebetween average assessment and the GFCIrating:
Reputation
Table 13 | GFCI 12 Top 20 centres assessments & ratings – reputational advantage
Centre Averageassessment
GFCI 12rating
Reputationaladvantage
Seoul 752 685 67
Singapore 769 725 44
Toronto 722 681 41
NewYork 805 765 40
Hong Kong 773 733 40
Shanghai 693 656 37
San Francisco 710 678 32
Zurich 722 691 31
Chicago 714 683 31
Vancouver 699 668 31
Tokyo 714 684 30
Boston 708 680 28
Sydney 697 670 27
Kuala Lumpur 670 644 26
Geneva 707 682 25
London 809 785 24
Frankfurt 700 677 23
Jersey 672 654 18
Dubai 666 648 18
Washington DC 683 672 11
36 The Global Financial Centres Index 12
Overall reputational advantage has remainedfairly stable since GFCI 11. It is notable that fourof the top six financial centres by reputationaladvantage are Asian. It should be stressed thatfor these centres a large proportion offavourable assessments came from other Asiancentres rather than from non-Asian centres.
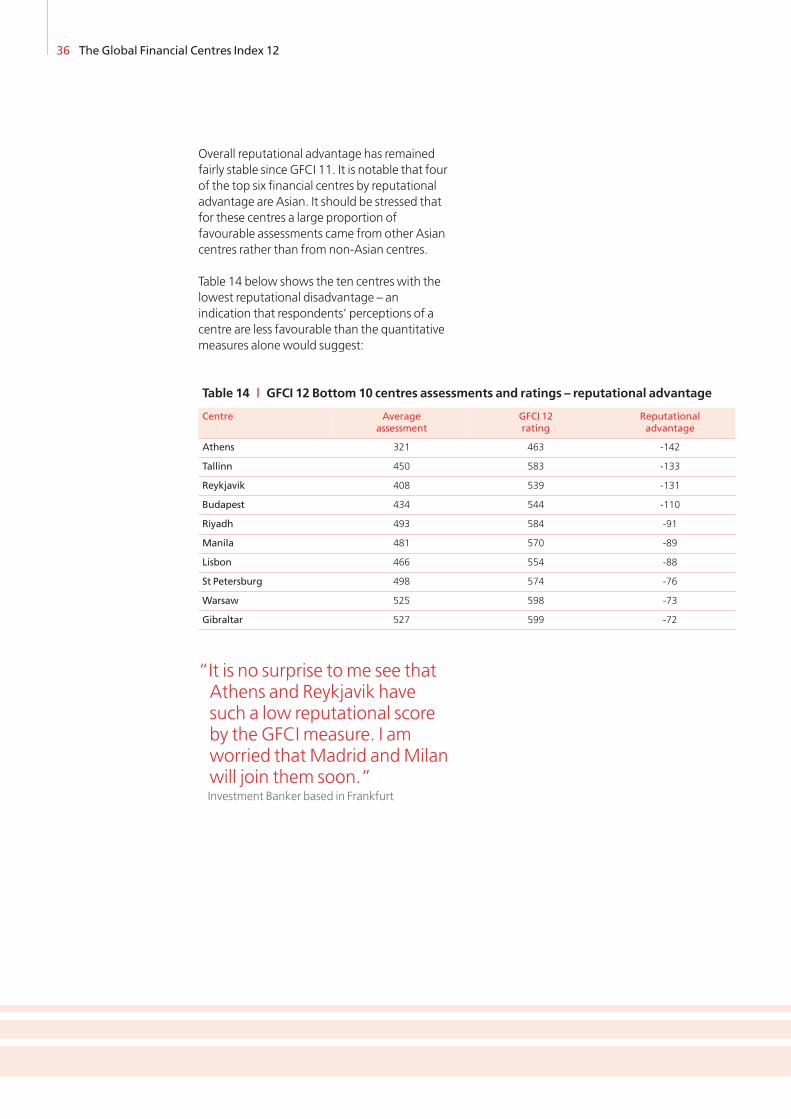
Table 14 below shows the ten centres with thelowest reputational disadvantage – anindication that respondents’ perceptions of acentre are less favourable than the quantitativemeasures alone would suggest:
“It is no surprise tome see thatAthens and Reykjavik havesuch a low reputational scoreby the GFCI measure. I amworried thatMadrid andMilanwill join them soon.”Investment Banker based in Frankfurt
Table 14 | GFCI 12 Bottom 10 centres assessments and ratings – reputational advantage
Centre Averageassessment
GFCI 12rating
Reputationaladvantage
Athens 321 463 -142
Tallinn 450 583 -133
Reykjavik 408 539 -131
Budapest 434 544 -110
Riyadh 493 584 -91
Manila 481 570 -89
Lisbon 466 554 -88
St Petersburg 498 574 -76
Warsaw 525 598 -73
Gibraltar 527 599 -72
The Global Financial Centres Index 12 37
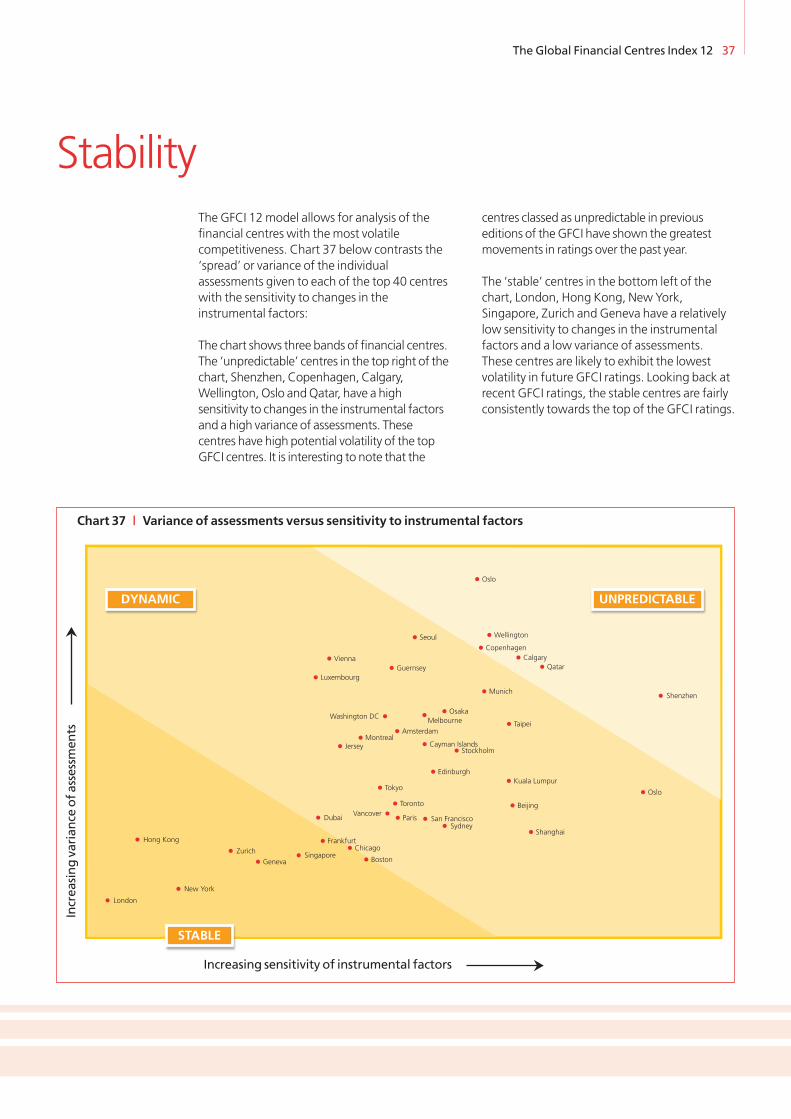
The GFCI 12model allows for analysis of thefinancial centres with themost volatilecompetitiveness. Chart 37 below contrasts the‘spread’ or variance of the individualassessments given to each of the top 40 centreswith the sensitivity to changes in theinstrumental factors:
The chart shows three bands of financial centres.The ‘unpredictable’ centres in the top right of thechart, Shenzhen, Copenhagen, Calgary,Wellington, Oslo andQatar, have a highsensitivity to changes in the instrumental factorsand a high variance of assessments. Thesecentres have high potential volatility of the topGFCI centres. It is interesting to note that the
centres classed as unpredictable in previouseditions of theGFCI have shown the greatestmovements in ratings over the past year.
The ‘stable’ centres in the bottom left of thechart, London, Hong Kong, New York,Singapore, Zurich and Geneva have a relativelylow sensitivity to changes in the instrumentalfactors and a low variance of assessments.These centres are likely to exhibit the lowestvolatility in future GFCI ratings. Looking back atrecent GFCI ratings, the stable centres are fairlyconsistently towards the top of the GFCI ratings.
Frankfurt
Geneva
London
Stockholm
Sydney
Zurich
Oslo
Hong Kong
Singapore
New York
Toronto
Calgary
Chicago
Paris
Boston
San Francisco
Montreal
Melbourne
Seoul
Copenhagen
Munich
Washington DC
Shanghai
Osaka
Oslo
Taipei
Tokyo
Qatar
Wellington
Vienna
Kuala Lumpur
Cayman Islands
Guernsey
Jersey
Vancover
Luxembourg
Edinburgh
Amsterdam
Beijing
Shenzhen
Dubai
Increasing sensitivity of instrumental factors
Increasingvarianceofassessm
ents
�
�
Chart 37 | Variance of assessments versus sensitivity to instrumental factors
UNPREDICTABLEDYNAMIC
STABLE
Stability
38 The Global Financial Centres Index 12
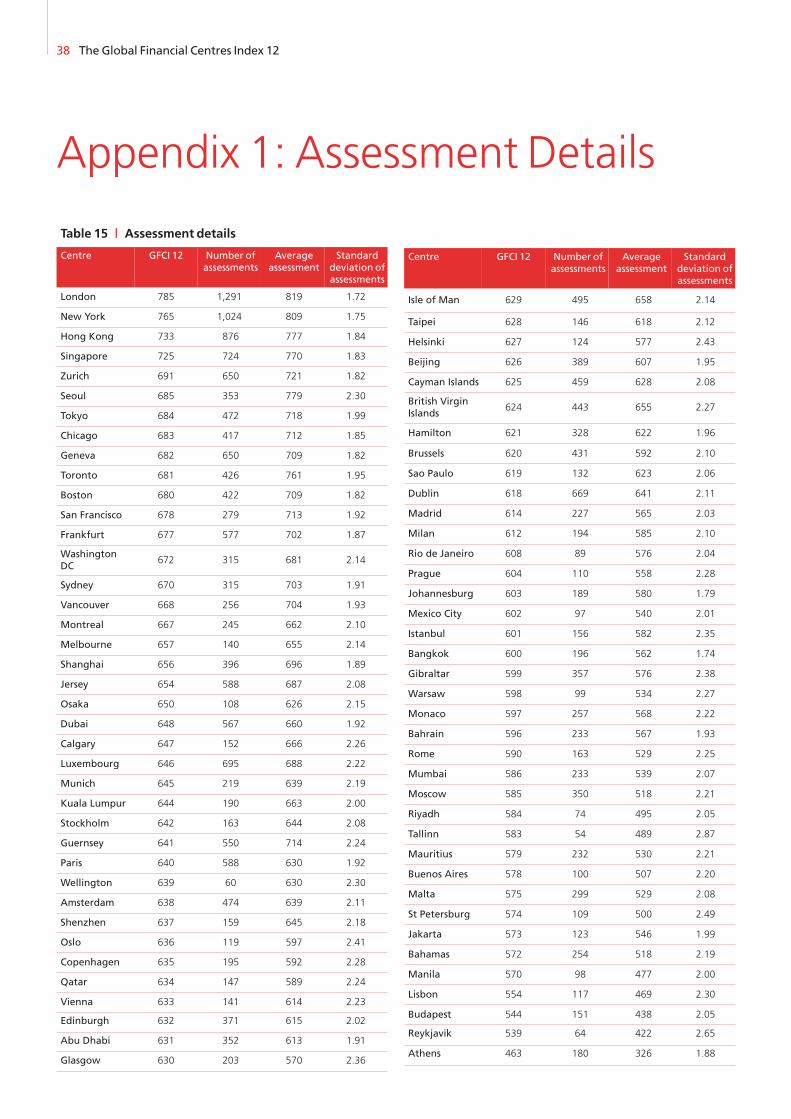
Appendix 1: Assessment Details
Table 15 | Assessment details
Centre GFCI 12 Number ofassessments
Averageassessment
Standarddeviation ofassessments
London 785 1,291 819 1.72
New York 765 1,024 809 1.75
Hong Kong 733 876 777 1.84
Singapore 725 724 770 1.83
Zurich 691 650 721 1.82
Seoul 685 353 779 2.30
Tokyo 684 472 718 1.99
Chicago 683 417 712 1.85
Geneva 682 650 709 1.82
Toronto 681 426 761 1.95
Boston 680 422 709 1.82
San Francisco 678 279 713 1.92
Frankfurt 677 577 702 1.87
WashingtonDC
672 315 681 2.14
Sydney 670 315 703 1.91
Vancouver 668 256 704 1.93
Montreal 667 245 662 2.10
Melbourne 657 140 655 2.14
Shanghai 656 396 696 1.89
Jersey 654 588 687 2.08
Osaka 650 108 626 2.15
Dubai 648 567 660 1.92
Calgary 647 152 666 2.26
Luxembourg 646 695 688 2.22
Munich 645 219 639 2.19
Kuala Lumpur 644 190 663 2.00
Stockholm 642 163 644 2.08
Guernsey 641 550 714 2.24
Paris 640 588 630 1.92
Wellington 639 60 630 2.30
Amsterdam 638 474 639 2.11
Shenzhen 637 159 645 2.18
Oslo 636 119 597 2.41
Copenhagen 635 195 592 2.28
Qatar 634 147 589 2.24
Vienna 633 141 614 2.23
Edinburgh 632 371 615 2.02
Abu Dhabi 631 352 613 1.91
Glasgow 630 203 570 2.36
Centre GFCI 12 Number ofassessments
Averageassessment
Standarddeviation ofassessments
Isle of Man 629 495 658 2.14
Taipei 628 146 618 2.12
Helsinki 627 124 577 2.43
Beijing 626 389 607 1.95
Cayman Islands 625 459 628 2.08
British VirginIslands
624 443 655 2.27
Hamilton 621 328 622 1.96
Brussels 620 431 592 2.10
Sao Paulo 619 132 623 2.06
Dublin 618 669 641 2.11
Madrid 614 227 565 2.03
Milan 612 194 585 2.10
Rio de Janeiro 608 89 576 2.04
Prague 604 110 558 2.28
Johannesburg 603 189 580 1.79
Mexico City 602 97 540 2.01
Istanbul 601 156 582 2.35
Bangkok 600 196 562 1.74
Gibraltar 599 357 576 2.38
Warsaw 598 99 534 2.27
Monaco 597 257 568 2.22
Bahrain 596 233 567 1.93
Rome 590 163 529 2.25
Mumbai 586 233 539 2.07
Moscow 585 350 518 2.21
Riyadh 584 74 495 2.05
Tallinn 583 54 489 2.87
Mauritius 579 232 530 2.21
Buenos Aires 578 100 507 2.20
Malta 575 299 529 2.08
St Petersburg 574 109 500 2.49
Jakarta 573 123 546 1.99
Bahamas 572 254 518 2.19
Manila 570 98 477 2.00
Lisbon 554 117 469 2.30
Budapest 544 151 438 2.05
Reykjavik 539 64 422 2.65
Athens 463 180 326 1.88

The Global Financial Centres Index 12 39
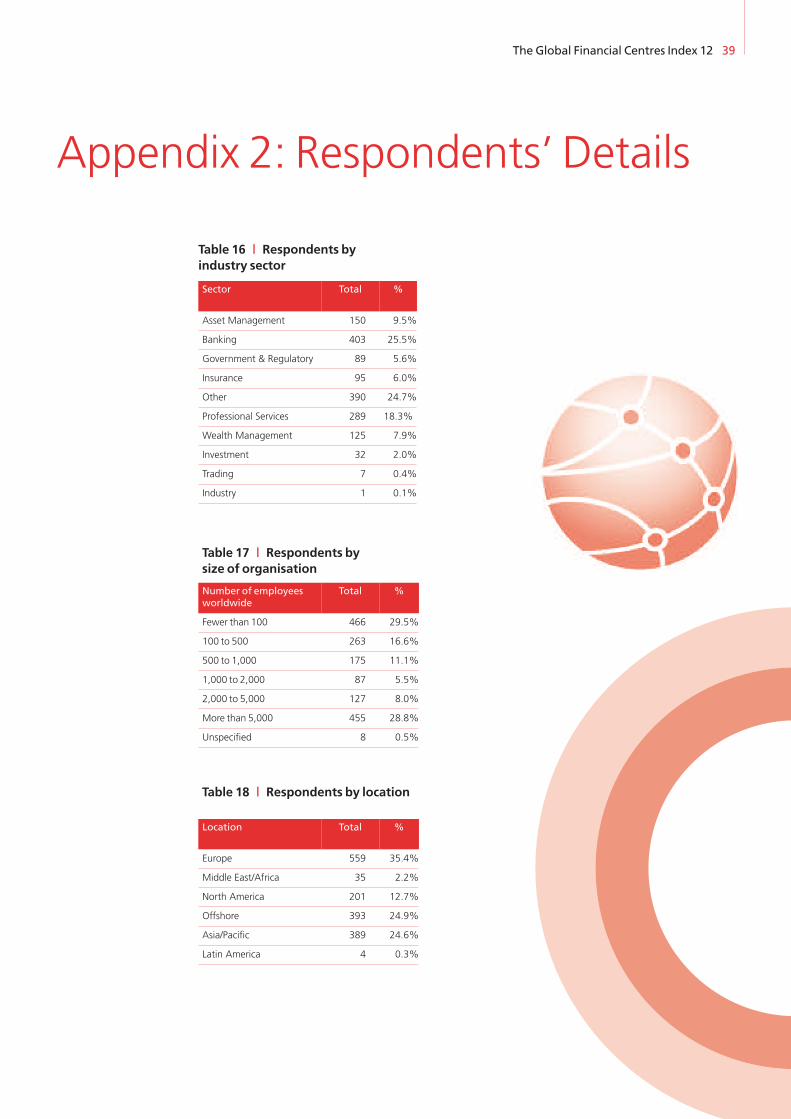
Table 16 | Respondents byindustry sector
Table 17 | Respondents bysize of organisation
Sector Total %
Asset Management 150 9.5%
Banking 403 25.5%
Government & Regulatory 89 5.6%
Insurance 95 6.0%
Other 390 24.7%
Professional Services 289 18.3%
Wealth Management 125 7.9%
Investment 32 2.0%
Trading 7 0.4%
Industry 1 0.1%
Number of employeesworldwide
Total %
Fewer than 100 466 29.5%
100 to 500 263 16.6%
500 to 1,000 175 11.1%
1,000 to 2,000 87 5.5%
2,000 to 5,000 127 8.0%
More than 5,000 455 28.8%
Unspecified 8 0.5%
Location Total %
Europe 559 35.4%
Middle East/Africa 35 2.2%
North America 201 12.7%
Offshore 393 24.9%
Asia/Pacific 389 24.6%
Latin America 4 0.3%
Table 18 | Respondents by location
Appendix 2: Respondents’ Details
40 The Global Financial Centres Index 12
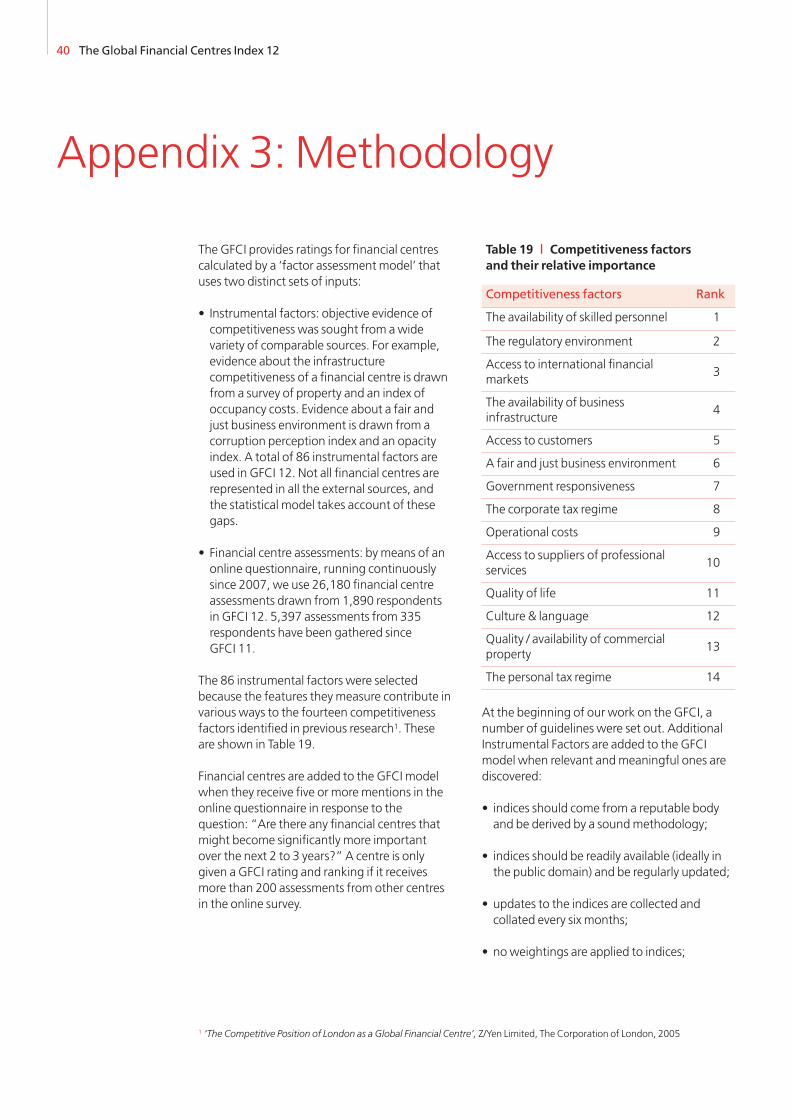
The GFCI provides ratings for financial centrescalculated by a ‘factor assessment model’ thatuses two distinct sets of inputs:
• Instrumental factors: objective evidence ofcompetitiveness was sought from awidevariety of comparable sources. For example,evidence about the infrastructurecompetitiveness of a financial centre is drawnfrom a survey of property and an index ofoccupancy costs. Evidence about a fair andjust business environment is drawn from acorruption perception index and an opacityindex. A total of 86 instrumental factors areused in GFCI 12. Not all financial centres arerepresented in all the external sources, andthe statistical model takes account of thesegaps.
• Financial centre assessments: by means of anonline questionnaire, running continuouslysince 2007, we use 26,180 financial centreassessments drawn from 1,890 respondentsin GFCI 12. 5,397 assessments from 335respondents have been gathered sinceGFCI 11.
The 86 instrumental factors were selectedbecause the features theymeasure contribute invarious ways to the fourteen competitivenessfactors identified in previous research1. Theseare shown in Table 19.
Financial centres are added to the GFCI modelwhen they receive five or morementions in theonline questionnaire in response to thequestion: “Are there any financial centres thatmight become significantly more importantover the next 2 to 3 years?” A centre is onlygiven a GFCI rating and ranking if it receivesmore than 200 assessments from other centresin the online survey.
At the beginning of our work on the GFCI, anumber of guidelines were set out. AdditionalInstrumental Factors are added to the GFCImodel when relevant andmeaningful ones arediscovered:
• indices should come from a reputable bodyand be derived by a soundmethodology;
• indices should be readily available (ideally inthe public domain) and be regularly updated;
• updates to the indices are collected andcollated every six months;
• noweightings are applied to indices;
Table 19 | Competitiveness factorsand their relative importance
Competitiveness factors Rank
The availability of skilled personnel 1
The regulatory environment 2
Access to international financialmarkets
3
The availability of businessinfrastructure
4
Access to customers 5
A fair and just business environment 6
Government responsiveness 7
The corporate tax regime 8
Operational costs 9
Access to suppliers of professionalservices
10
Quality of life 11
Culture & language 12
Quality / availability of commercialproperty
13
The personal tax regime 14
1 ‘The Competitive Position of London as a Global Financial Centre’, Z/Yen Limited, The Corporation of London, 2005
Appendix 3: Methodology
• indices are entered into the GFCI model asdirectly as possible, whether this is a rank, aderived score, a value, a distribution around amean or a distribution around a benchmark;
• if a factor is at a national level, the score willbe used for all centres in that country; nation-based factors will be avoided if financialcentre (city)-based factors are available;
• if an index has multiple values for a city ornation, themost relevant value is used (andthemethod for judging relevance is noted);
• if an index is at a regional level, themostrelevant allocation of scores to each centre ismade (and themethod for judging relevanceis noted);
• if an index does not contain a value for aparticular city, a blank is entered against thatcentre (no average or mean is used). Onlyindices which have values for at least onethird of the financial centres (currently 26) willbe included.
Creating the GFCI does not involve totaling oraveraging scores across instrumental factors. Anapproach involving totaling and averagingwould involve a number of difficulties:
• indices are published in a variety of differentforms: an average or base point of 100withscores above and below this; a simpleranking; actual values (e.g. $ per square footof occupancy costs); a composite ‘score’;
• indices would have to be normalised, e.g. insome indices a high score is positive while inothers a low score is positive;
• not all centres are included in all indices;
• the indices would have to be weighted.
The guidelines for financial centre assessmentsby respondents are:
• responses are collected via an onlinequestionnaire which runs continuously. A linkto this questionnaire is emailed to the targetlist of respondents at regular intervals andother interested parties can fill this in byfollowing the link given in the GFCIpublications;
• financial centre assessments will be includedin the GFCI model for 24months after theyhave been received;
• respondents rating fewer than 3 or more thanhalf of the centres are excluded from themodel;
• respondents who do not say where they workare excluded;
• financial centre assessments from themonthwhen the GFCI is created are given fullweighting and earlier responses are given areducedweighting on the log scale shown inChart 38.
The Global Financial Centres Index 12 41
0.0
0.2
0.4
0.6
0.8
Logm
ultiple
1.00
0-1-2-3-4-5-6-7-8-9-10-11
-12-13
-14-15
-16-17
-18-19
-20-21
-22-23
Months
Chart 38 | Log scale for timeweightings

42 The Global Financial Centres Index 12
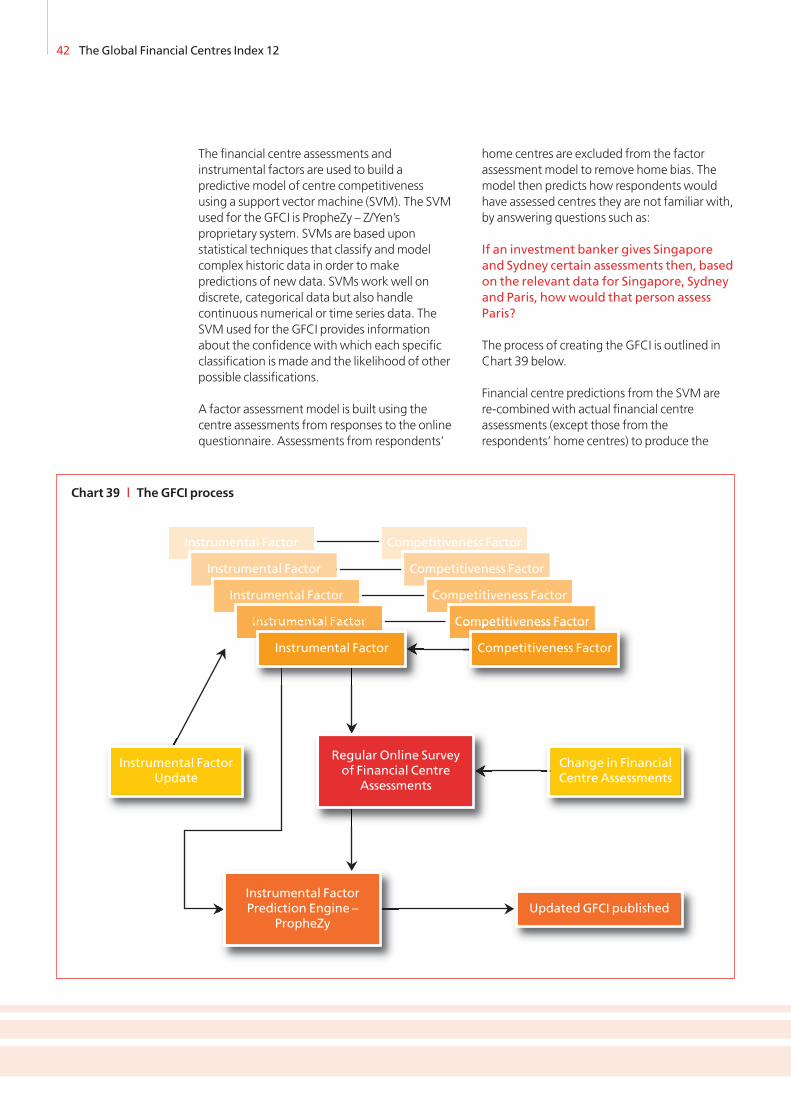
The financial centre assessments andinstrumental factors are used to build apredictive model of centre competitivenessusing a support vector machine (SVM). The SVMused for the GFCI is PropheZy – Z/Yen’sproprietary system. SVMs are based uponstatistical techniques that classify andmodelcomplex historic data in order tomakepredictions of new data. SVMswork well ondiscrete, categorical data but also handlecontinuous numerical or time series data. TheSVM used for the GFCI provides informationabout the confidence with which each specificclassification is made and the likelihood of otherpossible classifications.
A factor assessment model is built using thecentre assessments from responses to the onlinequestionnaire. Assessments from respondents’
home centres are excluded from the factorassessment model to remove home bias. Themodel then predicts how respondents wouldhave assessed centres they are not familiar with,by answering questions such as:
If an investment banker gives Singaporeand Sydney certain assessments then, basedon the relevant data for Singapore, Sydneyand Paris, howwould that person assessParis?
The process of creating the GFCI is outlined inChart 39 below.
Financial centre predictions from the SVM arere-combinedwith actual financial centreassessments (except those from therespondents’ home centres) to produce the
Chart 39 | The GFCI process
UpdatedGFCI published
�
�
Instrumental FactorUpdate
�
�
Instrumental Factor
Instrumental Factor
Instrumental Factor
Instrumental Factor
Competitiveness Factor
Competitiveness Factor
Competitiveness Factor
Competitiveness Factor
Competitiveness Factor
� Change in FinancialCentre Assessments
�Instrumental FactorPrediction Engine –
PropheZy
�
Regular Online Surveyof Financial Centre
Assessments
The Global Financial Centres Index 12 43
GFCI – a set of financial centre ratings. The GFCIis dynamically updated either by updating andadding to the instrumental factors or throughnew financial centre assessments. Theseupdates permit, for instance, a recentlychanged index of rental costs to affect thecompetitiveness rating of the centres.
It is worth drawing attention to a fewconsequences of basing the GFCI oninstrumental factors and questionnaireresponses.
• several indices can be used for eachcompetitive factor;
• a strong international group of ‘raters’ hasdeveloped as the GFCI progresses;
• sector-specific ratings are available - using thebusiness sectors represented by questionnairerespondents. This makes it possible to rateLondon as competitive in Insurance (forinstance) while less competitive in AssetManagement (for instance);
• the factor assessment model can be queriedin a ‘what if’ mode – “howmuchwouldLondon rental costs need to fall in order toincrease London’s ranking against NewYork?”
Part of the process of building the GFCI isextensive sensitivity testing to changes in factorsof competitiveness and financial centreassessments. There are over tenmillion datapoints in the current model. The accuracy ofpredictions given by the SVM are regularlytested against actual assessments.
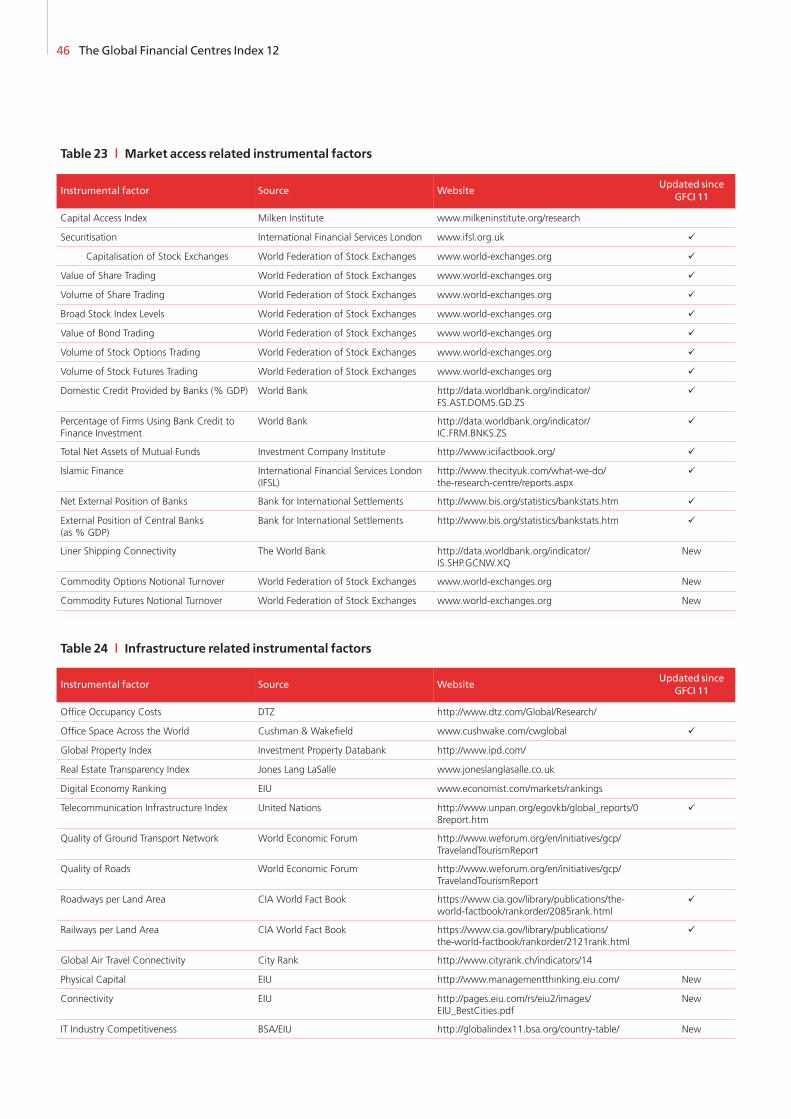
Table 20 shows how closely instrumental factorrankings correlate with the GFCI 12 rankings forthe top 20 instrumental factors:
It is interesting (but perhaps unsurprising) to seethat the broader measures of competitivenessseem to act as good indicators for financialcentre competitiveness. The top four of themost highly correlated instrumental factors areall broadmeasures of competitiveness ratherthan being specific to financial services. Thisindicates that cities that are successful at mostthings are likely to be very competitive financialcentres. A full list of instrumental factors isshown below.
44 The Global Financial Centres Index 12
Table 20 | Top20 instrumental factors bycorrelationwithGFCI 12
Instrumental factor Correlationmeasured by R2
Global City Competitiveness 0.5950
World Competitiveness Scoreboard 0.5528
Global Competitiveness Index 0.5103
Global Power City Index 0.5074
Banking Industry Country Risk Assessments 0.4686
Commodity Futures Notional Turnover 0.4544
Global Cities Index 0.4305
Capital Access Index 0.4124
IT Industry Competitiveness 0.3868
Office Occupancy Costs 0.3840
Global Innovation Index 0.3622
Connectivity 0.3574
Physical Capital 0.3455
Global Air Travel Connectivity 0.3447
Political Risk 0.3187
Institutional Effectiveness 0.3084
Business Environment 0.3068
GDP per Person Employed 0.2903
City Global Appeal 0.2877
Capitalisation of Stock Exchanges 0.2811
Appendix 4: Instrumental Factors
The Global Financial Centres Index 12 45
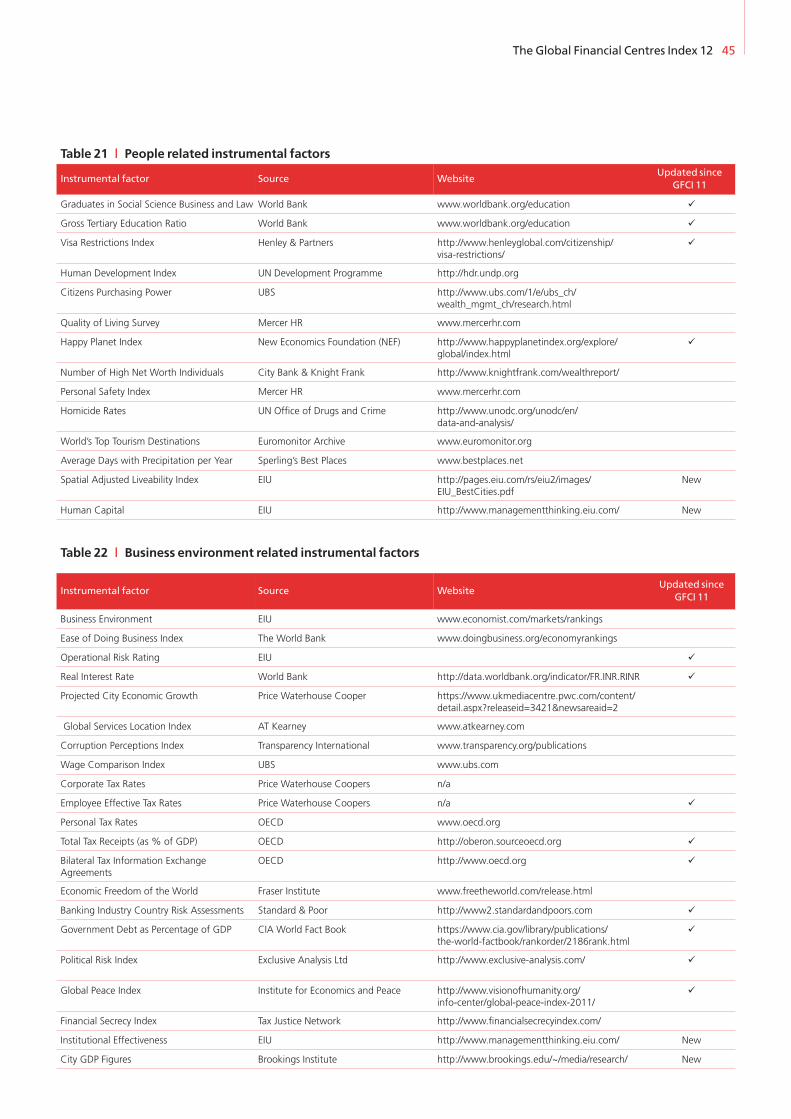
Table 21 | People related instrumental factors
Instrumental factor Source WebsiteUpdated since
GFCI 11
Graduates in Social Science Business and Law World Bank www.worldbank.org/education �
Gross Tertiary Education Ratio World Bank www.worldbank.org/education �
Visa Restrictions Index Henley & Partners http://www.henleyglobal.com/citizenship/visa-restrictions/
�
Human Development Index UN Development Programme http://hdr.undp.org
Citizens Purchasing Power UBS http://www.ubs.com/1/e/ubs_ch/wealth_mgmt_ch/research.html
Quality of Living Survey Mercer HR www.mercerhr.com
Happy Planet Index New Economics Foundation (NEF) http://www.happyplanetindex.org/explore/global/index.html
�
Number of High Net Worth Individuals City Bank & Knight Frank http://www.knightfrank.com/wealthreport/
Personal Safety Index Mercer HR www.mercerhr.com
Homicide Rates UN Office of Drugs and Crime http://www.unodc.org/unodc/en/data-and-analysis/
World’s Top Tourism Destinations Euromonitor Archive www.euromonitor.org
Average Days with Precipitation per Year Sperling’s Best Places www.bestplaces.net
Spatial Adjusted Liveability Index EIU http://pages.eiu.com/rs/eiu2/images/EIU_BestCities.pdf
New
Human Capital EIU http://www.managementthinking.eiu.com/ New
Table 22 | Business environment related instrumental factors
Instrumental factor Source WebsiteUpdated since
GFCI 11
Business Environment EIU www.economist.com/markets/rankings
Ease of Doing Business Index The World Bank www.doingbusiness.org/economyrankings
Operational Risk Rating EIU �
Real Interest Rate World Bank http://data.worldbank.org/indicator/FR.INR.RINR �
Projected City Economic Growth Price Waterhouse Cooper https://www.ukmediacentre.pwc.com/content/detail.aspx?releaseid=3421&newsareaid=2
Global Services Location Index AT Kearney www.atkearney.com
Corruption Perceptions Index Transparency International www.transparency.org/publications
Wage Comparison Index UBS www.ubs.com
Corporate Tax Rates Price Waterhouse Coopers n/a
Employee Effective Tax Rates Price Waterhouse Coopers n/a �
Personal Tax Rates OECD www.oecd.org
Total Tax Receipts (as % of GDP) OECD http://oberon.sourceoecd.org �
Bilateral Tax Information ExchangeAgreements
OECD http://www.oecd.org �
Economic Freedom of the World Fraser Institute www.freetheworld.com/release.html
Banking Industry Country Risk Assessments Standard & Poor http://www2.standardandpoors.com �
Government Debt as Percentage of GDP CIA World Fact Book https://www.cia.gov/library/publications/the-world-factbook/rankorder/2186rank.html
�
Political Risk Index Exclusive Analysis Ltd http://www.exclusive-analysis.com/ �
Global Peace Index Institute for Economics and Peace http://www.visionofhumanity.org/info-center/global-peace-index-2011/
�
Financial Secrecy Index Tax Justice Network http://www.financialsecrecyindex.com/
Institutional Effectiveness EIU http://www.managementthinking.eiu.com/ New
City GDP Figures Brookings Institute http://www.brookings.edu/~/media/research/ New

46 The Global Financial Centres Index 12
Table 23 | Market access related instrumental factors
Instrumental factor Source WebsiteUpdated since
GFCI 11
Capital Access Index Milken Institute www.milkeninstitute.org/research
Securitisation International Financial Services London www.ifsl.org.uk �
Capitalisation of Stock Exchanges World Federation of Stock Exchanges www.world-exchanges.org �
Value of Share Trading World Federation of Stock Exchanges www.world-exchanges.org �
Volume of Share Trading World Federation of Stock Exchanges www.world-exchanges.org �
Broad Stock Index Levels World Federation of Stock Exchanges www.world-exchanges.org �
Value of Bond Trading World Federation of Stock Exchanges www.world-exchanges.org �
Volume of Stock Options Trading World Federation of Stock Exchanges www.world-exchanges.org �
Volume of Stock Futures Trading World Federation of Stock Exchanges www.world-exchanges.org �
Domestic Credit Provided by Banks (% GDP) World Bank http://data.worldbank.org/indicator/FS.AST.DOMS.GD.ZS
�
Percentage of Firms Using Bank Credit toFinance Investment
World Bank http://data.worldbank.org/indicator/IC.FRM.BNKS.ZS
�
Total Net Assets of Mutual Funds Investment Company Institute http://www.icifactbook.org/ �
Islamic Finance International Financial Services London(IFSL)
http://www.thecityuk.com/what-we-do/the-research-centre/reports.aspx
�
Net External Position of Banks Bank for International Settlements http://www.bis.org/statistics/bankstats.htm �
External Position of Central Banks(as % GDP)
Bank for International Settlements http://www.bis.org/statistics/bankstats.htm �
Liner Shipping Connectivity The World Bank http://data.worldbank.org/indicator/IS.SHP.GCNW.XQ
New
Commodity Options Notional Turnover World Federation of Stock Exchanges www.world-exchanges.org New
Commodity Futures Notional Turnover World Federation of Stock Exchanges www.world-exchanges.org New
Table 24 | Infrastructure related instrumental factors
Instrumental factor Source WebsiteUpdated since
GFCI 11
Office Occupancy Costs DTZ http://www.dtz.com/Global/Research/
Office Space Across the World Cushman & Wakefield www.cushwake.com/cwglobal �
Global Property Index Investment Property Databank http://www.ipd.com/
Real Estate Transparency Index Jones Lang LaSalle www.joneslanglasalle.co.uk
Digital Economy Ranking EIU www.economist.com/markets/rankings
Telecommunication Infrastructure Index United Nations http://www.unpan.org/egovkb/global_reports/08report.htm
�
Quality of Ground Transport Network World Economic Forum http://www.weforum.org/en/initiatives/gcp/TravelandTourismReport
Quality of Roads World Economic Forum http://www.weforum.org/en/initiatives/gcp/TravelandTourismReport
Roadways per Land Area CIA World Fact Book https://www.cia.gov/library/publications/the-world-factbook/rankorder/2085rank.html
�
Railways per Land Area CIA World Fact Book https://www.cia.gov/library/publications/the-world-factbook/rankorder/2121rank.html
�
Global Air Travel Connectivity City Rank http://www.cityrank.ch/indicators/14
Physical Capital EIU http://www.managementthinking.eiu.com/ New
Connectivity EIU http://pages.eiu.com/rs/eiu2/images/EIU_BestCities.pdf
New
IT Industry Competitiveness BSA/EIU http://globalindex11.bsa.org/country-table/ New

The Global Financial Centres Index 12 47
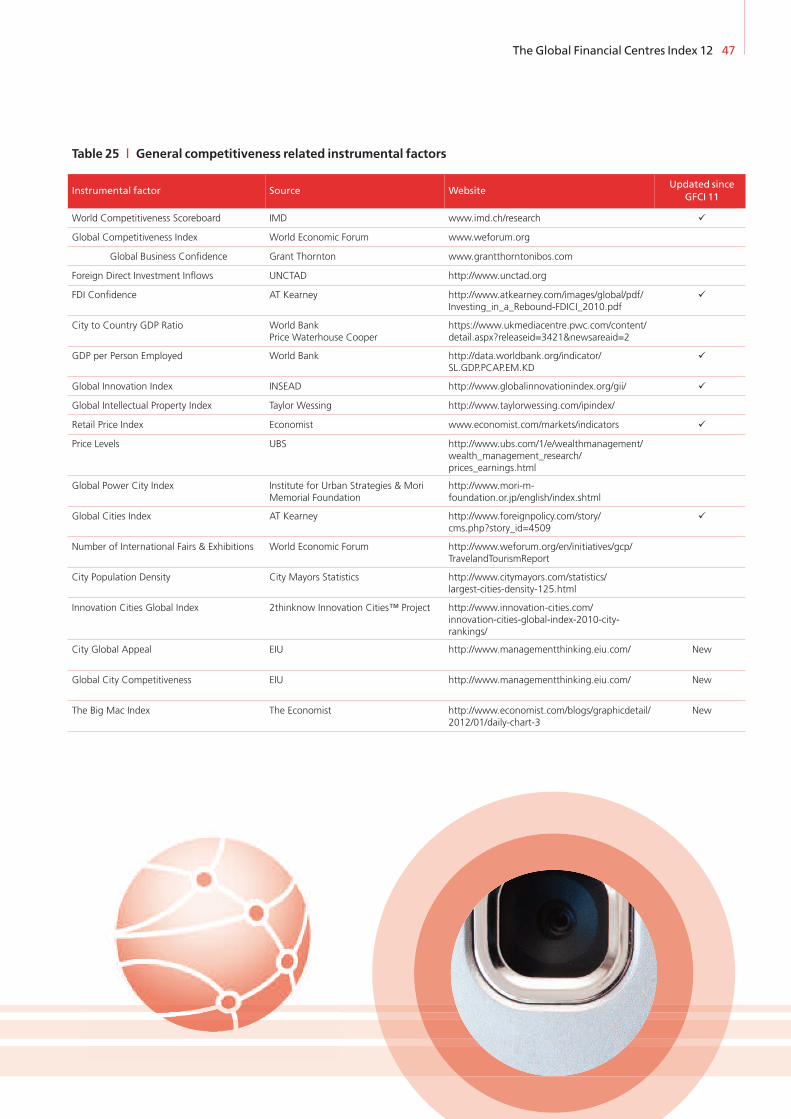
Table 25 | General competitiveness related instrumental factors
Instrumental factor Source WebsiteUpdated since
GFCI 11
World Competitiveness Scoreboard IMD www.imd.ch/research �
Global Competitiveness Index World Economic Forum www.weforum.org
Global Business Confidence Grant Thornton www.grantthorntonibos.com
Foreign Direct Investment Inflows UNCTAD http://www.unctad.org
FDI Confidence AT Kearney http://www.atkearney.com/images/global/pdf/Investing_in_a_Rebound-FDICI_2010.pdf
�
City to Country GDP Ratio World BankPrice Waterhouse Cooper
https://www.ukmediacentre.pwc.com/content/detail.aspx?releaseid=3421&newsareaid=2
GDP per Person Employed World Bank http://data.worldbank.org/indicator/SL.GDP.PCAP.EM.KD
�
Global Innovation Index INSEAD http://www.globalinnovationindex.org/gii/ �
Global Intellectual Property Index Taylor Wessing http://www.taylorwessing.com/ipindex/
Retail Price Index Economist www.economist.com/markets/indicators �
Price Levels UBS http://www.ubs.com/1/e/wealthmanagement/wealth_management_research/prices_earnings.html
Global Power City Index Institute for Urban Strategies & MoriMemorial Foundation
http://www.mori-m-foundation.or.jp/english/index.shtml
Global Cities Index AT Kearney http://www.foreignpolicy.com/story/cms.php?story_id=4509
�
Number of International Fairs & Exhibitions World Economic Forum http://www.weforum.org/en/initiatives/gcp/TravelandTourismReport
City Population Density City Mayors Statistics http://www.citymayors.com/statistics/largest-cities-density-125.html
Innovation Cities Global Index 2thinknow Innovation Cities™ Project http://www.innovation-cities.com/innovation-cities-global-index-2010-city-rankings/
City Global Appeal EIU http://www.managementthinking.eiu.com/ New
Global City Competitiveness EIU http://www.managementthinking.eiu.com/ New
The Big Mac Index The Economist http://www.economist.com/blogs/graphicdetail/2012/01/daily-chart-3
New

48 The Global Financial Centres Index 12
Notes

Long Finance
Established in 2007 by Z/Yen Group inconjunction with GreshamCollege, theLong Finance initiative beganwith aconundrum – “whenwould we know ourfinancial system is working?” Long Finance aimsto “improve society’s understanding and use offinance over the long term” in contrast to theshort-termism that defines today’s financial andeconomic views.
Long Finance publishes papers under theFinancial Centre Futures series in order to initiatediscussion on the changing landscape of globalfinance. Financial Centre Futures consists of in-depth research as well as the popular GlobalFinancial Centres Index (GFCI). Long Finance hasinitiated two other publication series: EternalBrevities and Finance Shorts. Long Finance is acommunity which can be explored and joined atwww.longfinance.net.

FINANCIAL CENTRE FUTURESIS SPONSORED BY
www.qfc.com.qa
The Qatar Financial Centre is afinancial centre established by thegovernment of Qatar in 2005 toattract international financial services
AND PRODUCED BY
www.zyen.com
As the City of London’s leadingcommercial think-tank, Z/Yen helpsorganisations make better choices.
Price: £10ISBN: 978-0-9546207-9-0
www.longfinance.net


![S,' /GF- 7--- 205U 4orientation,temporalvariationsin low frequencygravity field signalsand allow confirmationof certainrelativisticeffects[Tapley,1993]. TheGlobal](https://img.pdfslide.us/doc/110x75/5f0ee98f7e708231d4418ce1/s-gf-7-205u-4-orientationtemporalvariationsin-low-frequencygravity-field.jpg)