Embed Size (px)
Citation preview

Jeremy Rhodes, Jack Cochran, Will Steinhilber, Brandon Cobb,
Jeremy BoonePolymers
Final ReportDecember 4th, 2013
1

Table of Contents:
1 Abstract 3
2 introduction 4
3 Apparatus 5
4 Procedures 610
5 Results/Discussion 12
5.1 Materials selection 1114
5.2 Statistical analysis 15
5.3 Material Properties 1523
5.4 Ecoaudit/sustainability 2332
5.5 Physical Tests 3339
5.6 Impact Test 3942
5.7 Final Material Decision 4243
5.8 Conceptual prototype 4344
5.9 Economic feasibility 4445
6 Conclusion 4547
7 References
4850
8 Appendix 5169
2

AbstractThe GP Beverage Company has requested a new design for the bottle the
company is currently using to protect their product. The objective is to discover the most cost effective material within the Polymer family to fulfill this need. The material we chose has to be strong, cost efficient, and easy to manufacture. The experiments will show how the material reacts with the series of optical, mechanical, thermal, chemical, magnetic, and electrical tests. These results will provide further information about the final selection of one material within the polymer family. The material selection and material properties research yields vital information about which materials will satisfy the objective of the project. The three materials that were chosen include: Polyethylene terephthalate (PET), Polypropylene (PP), and Polyvinylchloride (PVC). The experiments still need to be conducted in order to fully analyze and select a final polymer for the GP Beverage Company.
3

IntroductionThe GP beverage company has requested the investigation of the various
materials within the assigned family in order to provide them with the best option in protecting their product throughout its life cycle. The life cycle of a bottle used to protect the product will be clearly outlined in this report. The objective is to find the best polymer to utilize in the protecting of the liquid inside the GP beverage container. The container that GP eventually uses to protect its product will be made from one of the polymers suggested in this report. The overall goal of the report is to maximize toughness and minimize cost. By doing so, GP beverage company will receive the greatest quality polymer. We will provide vast scientific data depicting why the specific polymers in that family of materials were chosen. The initial constraints of the project include, but are not limited to: a 5 Liter bottle, must withstand a fall from 5ft, and must be able to manufacture at least 100,000 bottles. All of these initial constraints will have environmental, social, technical, and economic impacts. Balancing these impacts will be a challenge in itself.
Polymers have been around in a natural form of science since life began and naturally occurring biological polymers play an extremely important role in plant and animal life (Young, 1). A polymer is a long molecule, which contains a chain of atoms held together by covalent bonds. A covalent bond is a chemical bond that involves the sharing of electron pairs between atoms. Polymers are produced through a process known as polymerization whereby monomer molecules react together chemically to form either linear chains or a threedimensional network of polymer chains (Young, 2). These can be classified into three groups, which include: thermoplastics, elastics, and thermosets. Currently, the specific polymer used to protect carbonated products as well as water is PET (polyethylene terephthalate)(Ophardt, 1). With that said, this report will mainly be concerned with thermoplastics because they are low in cost, easy to mold and shape, and possess mechanical and chemical properties that will enhance the protection of the GP beverage product. FDA has approved plastic beverage containers made from polyethylene terephthalate, PET. Several companies are using this polyester as a material for lightweight, energyefficient, breakageresistant containers (Beverage Container Deposit Legislation, 57).
One main problem that polymers have had in the past with beverage containment has been the fact that they are harmful to the environment because some of them are not recyclable. Some technical questions that we must ask ourselves include:
What is the life cycle of each polymer we are considering? How much CO2 admission does each polymer exert within the way we will be
utilizing it? How much raw polymer material will be needed to produce the amount of
bottles the GP Company has requested (100,000 bottles)? What are the dimensions of the bottle?
4

ApparatusA series of different apparatuses will be used during the testing of the three
polymers. The apparatuses used are included in the table below, separated by the test in which each one will be used for.
Figure 1: Apparatus
Note: In Figure 1, the * symbolizes the length of the material being used. All other dimensions are assumed to be a portion of the sheet for the respective material.
The estimated costs for the three materials chosen are listed below. The costs come straight from the manufactures’ websites. US Plastics will be the sole provider of the three materials that were chosen for this project. US Plastics have been recommended by John Wild and various other sources. US Plastics have great prices, quality products, and fast delivery time.
5

ProceduresA series of six different tests will be run in order to validate the design,
innovation, and modification. The six tests include, but are not limited to: optical, electrical, thermal, chemical, mechanical, and magnetic. Please note that each procedure will be conducted within the physics, chemistry, and engineering labs of James Madison University. The procedures are based off of what equipment is readily available to the team. Further tests may be conducted to learn more about each polymer. These tests are not to be considered limited factors during the research of these materials and may be subject to change.
OpticalTest Method 1 (UV Radiation)Tensile portion
1. Turn on Instron Machine2. Start up Blue Hill Software located on the desktop3. Login to Blue Hill by using “DUKES” as both the password and username (if
using this machine at James Madison University, home of the Dukes).4. Make sure the crossheads are in the correct position, 2 inches apart from
each other. If not, hit the “Return” button on the pendant of the machine.5. Place material sample in the top grip and make it as vertical as possible.6. Tare the machine by hitting the soft key and then hit “balance load”. This
ensures that the force recorded is due to the tensile force on the sample, rather than the weight of the sample or the crossheads.
7. Tighten the lower grip on the machine8. After logging into Blue Hill, click the correct dimensions, and saving
mechanism.9. Start the test by hitting “play” on the software and wait until material plastically
deforms. The machine will stop pulling at this point.10. Export data using USB device and import into excel on personal computer11. Analysis data by creating stress vs. strain graphs in excel.12. Repeat steps 411 for all three polymer samples
UV portion1. Place all three samples of polymers in separate containers2. Obtain three UV lights and place them directly over the samples3. Turn on the UV lights and let them run for a week straight, check up on
samples twice a day to ensure the lights have not burnt out and samples are still there.
4. After a week, turn off the UV lights and remove samples from their respective containers.
5. Take the samples and run the Instron tensile test for all three6. Repeat steps 112 in the tensile testing portion of this test.
6

Purpose: The purpose of this test is to see if long exposure to UV light affects the strength of the material in anyway. UV radiation could degrade the material and cause structural damage.Validate – ASTM D4329 – 13 Standard Practice for Fluorescent Ultraviolet (UV) Lamp Apparatus Exposure of Plastics
ElectricalTest Method 1 (Resistivity)
1. Gather Digital Multimeter (DMM), 3 doublesided wire sets, and a power source.
2. Connect the wires to the DMM, power source, and the polymer material3. Make sure that all items are in series with each other and that it is a closed
circuit4. DO NOT turn on power supply until you check to see if step 3 is complete5. Turn on power supply6. Using the DMM, measure the current running through the wires before the
polymer material and then again after the polymer material7. Repeat steps 36 for all three polymer samples
Purpose: The purpose of this test is to find out how much resistivity each polymer has. Knowing that polymers are insulators, results may be minimal and could possibly tell us nothing.Validate – ASTM D257 –07, “Standard Test Methods for DC Resistance or Conductance of Insulating Materials” The resistance of a material Is determined from a measurement of current and voltage drop under certain conditions. Using the appropriate electrode system can provide values that can be used to calculate resistivity and conductivity.
ThermalTest Method 1 (Melting Point)
1. Set up the hot plate on the table2. Cover the hot plate with Aluminum foil3. Record the temperature of the aluminum foil on the hot plate4. Record the room temperature5. Place the tested material on the aluminum foil6. Record the temperature of the material on the hot plate7. Turn on the hot plate to the highest setting8. Watch the material very closely to ensure that when it starts to plastically
deform in any way you are ready to record the temperature. Note that the temperature of the melting point will not change during the melting process.
9. Record the temperature at the melting point10. Repeat steps 29 for all three polymer samples
Purpose: The purpose of this test is to explore the experimental melting point of the specific material. The melting point will show what temperature the material begins to melt, which will inform the manufacturer of where not to place the material in the
7

factory. If the factory can get up to these temperatures, the company will risk plastic deformation of the bottles. This same concept applies to shipping across the world. If the company is shipping the material to an area of the world with known higher temperatures, than the melting point should be a concern.Validate – ASTM D3045 – 92(2010) Standard Practice for Heat Aging of Plastics Without Load
Test Method 2 (Thermal Conductivity)1. Turn on computer and open up LabView. Set up the DAQ to thermocouples2. Obtain polymer rod sample (10 inches in length)3. Drill one hole at the end of the rod4. Attach thermocouples to rod and LabView dock. Measure the distance from
the top of the rod to the thermocouples5. Place cartridge heater in drilled hole6. Attach cartridge heater to power supply7. Place other the other end of rod in ice8. Make sure everything is connected properly and turn on the power supply
(Note that power supply output reading should be somewhere between 030V)
9. Allow LabView to collect data until temperatures reach a steady state, or the slope of the line on the graph is zero.
10. Repeat steps 29 for all three polymer samplesPurpose: The purpose of this lab is to determine the thermal conductivity of each material tested. The thermal conductivity will allow the GP Beverage Company to see how long it takes for the bottle to become cold after being placed in the refrigerator of the customer. This should allow the company to market this result if it turns out to benefit the product.Validate – ASTM C177 – 10 Standard Test Method for SteadyState Heat Flux Measurements and Thermal Transmission Properties by Means of the GuardedHotPlate Apparatus
ChemicalTest Method 1 (Material Degradation)
1. Obtain nine separate containers with sealable tops. Make sure that the containers are at least 2 inches in height.
2. Pour phosphorous, carbonic acid, and citric acid into the nine containers. Make sure that three containers contain phosphorous, three contain carbonic acid, and three contain citric acid. Make sure that the containers are at least 5 inches apart.
3. Place a 2inch sample of each material into each one of the chemicals.4. Let the material samples sit in the chemicals for a week total, untouched.
This ensures that the chemicals will soak into the materials being tested.5. Move into the tensile testing portion to test the tensile strength of the material
after soaking in the chemicals. Refer to the tensile results in the tensile test towards the bottom of this procedure and the found tensile strengths in CES
8

to compare.Tensile portion
1. Turn on Instron Machine2. Start up Blue Hill Software located on the desktop3. Login to Blue Hill by using “DUKES” as both the password and username (if
using this machine at James Madison University, home of the Dukes).4. Make sure the crossheads are in the correct position, 2 inches apart from
each other. If not, hit the “Return” button on the pendant of the machine.5. Place material sample in the top grip and make it as vertical as possible.6. Tare the machine by hitting the soft key and then hit “balance load”. This
ensures that the force recorded is due to the tensile force on the sample, rather than the weight of the sample or the crossheads.
7. Tighten the lower grip on the machine8. After logging into Blue Hill, click the correct dimensions, and saving
mechanism.9. Start the test by hitting “play” on the software and wait until material plastically
deforms. The machine will stop pulling at this point.10. Export data using USB device and import into excel on personal computer11. Analysis data by creating stress vs. strain graphs in excel.
Repeat steps 411 for all three polymer samplesPurpose: The chemicals used in this test are chosen because they are the main three acids found in common soda. This test will ensure that if the materials are sitting in these chemicals for a long period of time, they will not be affected in terms of the strength of the material.Validate – ASTM D543 – 06 Standard Practices for Evaluating the Resistance of Plastics to Chemical Reagents
Test Method 2 (Material Degradation)1. Place eight containers on a table that will remain in the same location for at
least three weeks. Ensure that the containers have sealable caps and they are at room temperature. Also make sure to record what the room temperature is.
2. Fill one container with water, and one with CocaCola. Fill the next three with water and the different materials in each one, and three with CocaCola and the materials in each one.
3. Record the pH of all the containers right after the materials are placed in the said containers.
4. Let the containers sit for three weeks and take pH samples every week.5. After the three weeks, take a pH sample again and compare it to the first pH
samples taken.
Purpose: The purpose of this test is to discover whether the degradation, if any, of the materials are affecting the contents of the containers. The contents of the container will act as the product GP Beverage Company produces and provides to its customers. Please note that the lifecycle of a bottle far exceeds the testing
9

duration. This is because the testing duration is limited.Validate ASTM D5226 98(2010)e1, Standard Practice for Dissolving Polymer Materials
MechanicalTest Method (Tensile Test)
1. Turn on Instron Machine2. Start up Blue Hill Software located on the desktop3. Login to Blue Hill by using “DUKES” as both the password and username (if
using this machine at James Madison University, home of the Dukes).4. Make sure the crossheads are in the correct position, 2 inches apart from
each other. If not, hit the “Return” button on the pendant of the machine.5. Place material sample in the top grip and make it as vertical as possible.6. Tare the machine by hitting the soft key and then hit “balance load”. This
ensures that the force recorded is due to the tensile force on the sample, rather than the weight of the sample or the crossheads.
7. Tighten the lower grip on the machine8. After logging into Blue Hill, click the correct dimensions, and saving
mechanism.9. Start the test by hitting “play” on the software and wait until material plastically
deforms. The machine will stop pulling at this point.10. Export data using USB device and import into excel on personal computer11. Analysis data by creating stress vs. strain graphs in excel.12. Repeat steps 411 for all three material samples
Purpose: The purpose of this lab is to test the strength of the material to see how it will hold up under strenuous conditions. The strength of every material will vary based on how it was made and where it is from, so conducting this test is a necessity. The yield strength and Young’s Modulus can be found by conducting this experiment which will relate back to the stiffness and strength values in terms of compression.Validate – ASTM D63810 Standard Test Method for Tensile Properties of Plastics
MagneticTest Method 1 (Gauss Meter)
1. Gather three samples of the different materials.2. Tie a string to each of the materials3. One at a time, hold the material away from your body (full arms length)4. Place the metal node of the Gauss meter on the material and record the
reading displayed on the screen5. Repeat steps 3 and 4 for the remaining two polymers
Purpose: The purpose of this test was to test the magnetic field generated from each material. Magnetic field can create an electric field which can then create the possibility of shocking. It is important for the GP Beverage Company to know if the
10

materials will magnetically react with the different materials that may be placed around them. Validate ASTM E1444 Standard Practice for Magnetic Particle TestingMaterial Selection
There are many standardized methods for material selection within industry. The methods are divided between the design led approach and the science led approach. The team decided to use the design led process illustrated in Materials: engineering, science, processing and design by Michael Ashby, Hugh Shercliff, and David Cebon for the familiarity and ease of access with the team. The process is made up of four steps, translation, screening, ranking, and documentation. Translation is organizing the team’s objectives and customer needs into constraints or must be met criteria. Screening is eliminating materials that do not meet the constraints. Ranking is using material indices, which are based on what the designer wants to maximize, to rank the screened material. Documentation is using known literature to assist in deciding on a material. This report will fully dive into the first two steps of the design led process and partially into the latter two. The time between this report and the next report will be dedicated to fully completing the design material selection process.(Ashby)
The team first identified a list of customer needs based on the customers criteria as well research into the industry of bottle containers.
Table 1: Customer Needs
The customer needs are then translated into the function, the constraints, the objective, and free variables. The function is the purpose of the design. The constraints are the must be met criteria. The objective is what needs to be maximized or minimized. The free variables are variables that designers are permitted to change to any value that the designers see as beneficial towards the design. The four designations can be seen in Table 1.
11

Table 2: Design Variables
In order to narrow down the choice of materials to those that fit the design criteria, simulated values for the constraints must be calculated or found through available literature. Many of the constraints are dependent on the shape and dimensions of the container.
Workable DimensionsIn order to create dimensions that could be used to calculate estimated
constraint values, many assumptions had to be made as well as research on how the container will interact with the end user. It is assumed that the container will act as a pressure vessel since it will contain a carbonated beverage. The optimum shape for a pressure vessel is a sphere but a sphere is relatively difficult to produce compared to a cylinder so the team has decided to model the container after a cylinder. (Pressure Vessels Ensure Safety). Ergonomics is the use of introducing the human psyche into the design process. More ergonomic designs have a track record of selling more inventory (Ergonomics 101). It is assumed by the design team that a container that can be easily carried or grasped by the average person will be more enticing to a consumer then a container that is not easily grasped or carried. The average person’s hand has the length of 180.5 mm (Hand Grip Strength). The estimated circular cross section of the simulated cylindrical container will be a function of the average hand length. Appendix Figure 1 demonstrates how the length of the hand is curved around the cross section. It is assumed that a hand that is able to cover at least half of the bottle in order to satisfy the comfortable grasp for a human. With a hand wrapped around half of the cross section (π in 12

radians), an estimated radius can be calculated. It is also assumed that the thickness negligible compared to the radius.
Table 3: List of the constraint values calculated above.
Figure 2 shows the polymers that are left when the constraint values are placed in the limits of the CES software. The values entered can be seen in the material selection appendix.
Figure 2: Polymers passing constraintsThe objective of the material selection process was to minimize cost. The
cost limited design of the stiffness design in chapter 5 of the Materials: engineering, science, processing and design by Michael Ashby, Hugh Shercliff,
13

and David Cebon, was selected because the flat plate material indices was deemed close enough to what needs to be optimized for the container to be used.
(Eq. 11)M = E31
ρCThe material indices graphed with CES is seen in figure 3. The slope of the indices is in a unique spot where it cannot be limited to three. The selection jumps from two to four materials.
Figure 3: Material index Graph
The four materials that were left from the material indices are PET, PP, PLA, and tpPVC. The team then used documentation from known literature and research in how easily available the remaining materials are to narrow the choice down to three. The three materials remaining after documentation is PP, PET, and tpPVC.
14

Statistical AnalysisStatistical analysis was performed to determine if the material we selected
was significantly different from a material of another material group for a specific property. We chose to use the hardness test to compare PET and low carbon steel. The first equation below was used to determine the pooled standard deviation. Next, the t actual was determined by the second equation.
Once we knew t actual we could determine with what degree of certainty wecould say that the materials were different. We found t actual to be 643.5159. Thisan unusually high number for t actual could be explained because we used 30samples for each material and the materials we projected to have large differencesin hardness. Then it was determined that we could could say with a confidence levelof 99.9% and using a critical value for our degrees of freedom determined by thethird and last equation above. The critical value was 3.2368 which is much smallerthan the t actual which means we can statistically say with at least 99.9% certaintythat the two materials are different.
Material PropertiesPolyethylene terephthalate (PET)Almost all soda and water bottles in the U.S. are made from PET. PET is a synthetic fiber that is clear, strong, light, and stiff. PET is in the thermoplastic family and the polyester family. Water or carbon dioxide cannot pass through PET, but small amounts of oxygen can pass through. It can be recycled into carpet and clothing and the recycle number is one. PET is produced by using a process called polymerization (Polyethylene). The two ingredients in the process are ethylene glycol and terephthalic acid. This process also produces water (PET Resin). J.Rex Whinfield and James T. Dickson first patented the material in England in 1941 and production did not begin until 1952 by a USA company called Du Pont (John Rex).
Polypropylene (PP)This material is very similar to PET. It is also a synthetic polymer fiber and part of 15

the thermoplastic family. PP is tough, lightweight, heat resistant, and flexible. It also is flammable and degrades in UV rays. PP can be recycled and the recycle number is 5. Polypropylene is often used for ropes, crates, and insulation (Polypropylene). Giulio Natta discovered PP in 1954 and commercial production began in 1957.
Polyvinylchloride (tpPVC/PVC)PVC is lightweight and rigid, but can become more flexible by adding chemicals like phthalates. It is used for many things including plumbing, insulation, siding, signs, windows, and healthcare products. PVC is recyclable but is difficult to do so and the production process creates a very toxic chemical called dioxin (Polyvinyl). PVC was discovered in 1872 by Eugen Baumann but did not appear in commercial products until Waldo Semon developed a way to use additives to plasticize the chemical and make it more flexible and easily processed.
General propertiesThe tables show that PET and PP are similar in price but PVC is usually
much cheaper by the pound. The tables also show that if we had the same weight of each material PET and PVC would be similar in volume but PP would be much larger in volume. PET PVC and PP would all be lighter compared to soda lime glass (152155 Lb/ft^3) which could reduce transportation costs and may improve stacking ability. The prices of these polymers are slightly less expensive than the price of aluminum alloys which is 1.08 to 1.18 USD/lb. The main difference in the chemical composition is that PET is a much larger molecule than PP or PVC and PVC has a chlorine atom in its chemical composition.
Table 4: PETProperty Lower limit Upper limit UnitsDensity 80.5 87.4 Lb/ft^3Price .939 1.03 USD/lbMolecularcomposition
C10H8O4
Table 5: PPProperty Lower limit Upper limit UnitsDensity 55.6 56.8 Lb/ft^3Price .871 1 USD/lbMolecularcomposition
C3H6
Table 6: PVCProperty Lower limit Upper limit UnitsDensity 81.2 98.6 Lb/ft^3Price .64 .703 USD/lbMolecularcomposition
C2H3Cl
16

Mechanical propertiesMechanical properties are important to determine if a structure will fail when a load is applied. The loads that may be applied to the beverage may include the pressure inside the bottle, a person twisting the cap off the bottle, and any stacking bottles during transportation or storage. Yield strength, tensile strength, and compressive strength are important to determining if the bottle can withstand the applied loads. The bottle must also withstand an impact when dropped from 5 feet. The property most related to the impact test would be the fracture toughness. Fracture toughness determines if a material would fracture when a load is applied. These polymers would perform better than soda lime glass which has a fracture toughness of around 0.5 to 0.6 ksi in^0.5. PET does best with regards to fracture toughness follow by PVC then PP. Young’s modulus is a measure of stress divided by strain.
Table 7: PETProperty Lower limit Upper limit UnitsYoungs modulus 0.4 0.6 10^6 psiShear modulus 0.144 0.216 10^6 psiBulk modulus 0.718 0.754 10^6 psiYield strength 8.19 9.04 KsiTensile strength 7.01 10.5 KsiCompressivestrength
9.01 9.94 ksi
elongation 30 300 % strainFracture toughness 4.1 5.01 Ksi in^0.5Hardness (Vickers) 17 18.7 HV
Table 8: PPProperty Lower limit Upper limit UnitsYoungs modulus 0.13 0.225 10^6 psiShear modulus 0.0458 0.0795 10^6 psiBulk modulus 0.363 0.377 10^6 psiYield strength 3 5.4 KsiTensile strength 4 6 KsiCompressivestrength
3.64 8.01 ksi
elongation 100 600 % strainFracture toughness 2.73 4.1 Ksi in^0.5Hardness (Vickers) 6.2 11.2 HV
Table 9: PVCProperty Lower limit Upper limit UnitsYoungs modulus 0.31 0.6 10^6 psiShear modulus 0.111 0.216 10^6 psiBulk modulus 0.682 0.711 10^6 psi
17

Yield strength 5.13 7.56 KsiTensile strength 5.9 9.45 KsiCompressivestrength
6.16 13 ksi
elongation 11.9 80 % strainFracture toughness 1.33 4.66 Ksi in^0.5Hardness (Vickers) 10.6 15.6 HV
Thermal propertiesThermal properties are important in order to find out the best process to use to shape the material into a product. It is also important to determine if the temperatures the material might experience will cause the material to deform. Thermal conductivity determines how good the material is at conducting heat. The low thermal conductivity means that all three materials are very good insulators. It is important that these materials be insulators so that a person’s hand does not get cold if someone is drinking a cold drink. The materials here are much better than both soda lime glass(0.4040.751 BTU ft/(h*ft^2* °F)) and aluminum alloys (68.8139 BTU ft/(h*ft^2* °F)) when it comes to insulating. The specific heat is the amount of energy required to heat one pound of material.
Table 10: PETProperty Lower limit Upper limit UnitsMelting point 413 509 Degrees Fahrenheit
(°F)Maximum service temp
152 188 Degrees Fahrenheit (°F)
Minimum service temp
190 99.7 Degrees Fahrenheit ( °F)
Thermal conductivity 0.0797 0.0872 BTU ft/(h*ft^2* °F)Specific heat 0.339 0.352 BTU/lb*°F
Table 11: PPProperty Lower limit Upper limit UnitsMelting point 302 347 Degrees Fahrenheit
(°F)Maximum service temp
212 239 Degrees Fahrenheit (°F)
Minimum service temp
190 99.7 Degrees Fahrenheit (°F)
Thermal conductivity 0.0653 0.0965 BTU ft/(h*ft^2*°F)Specific heat 0.447 0.467 BTU/lb*°F
Table 12: PVCProperty Lower limit Upper limit UnitsMelting point 413 509 Degrees Fahrenheit
18

(°F)Maximum service temp
140 158 Degrees Fahrenheit (°F)
Minimum service temp
190 99.7 Degrees Fahrenheit (°F)
Thermal conductivity 0.0849 0.169 BTU ft/(h*ft^2*°F)Specific heat 0.324 0.345 BTU/lb*°F
Electrical propertiesElectrical properties determine whether a material is a conductor, semiconductor, or insulator. The high resistance in these polymers means that they are all good insulators. Good insulators can often be used in capacitors to increase capacitance. The dielectric constant determines the amount that capacitance is increased if put in the middle of the capacitor.
Table 13: PETProperty Lower limit Upper limit UnitsElectrical resistivity 3.3e20 3e21 Micro ohms cmDielectric constant 3.5 3.7 none
Table 14: PPProperty Lower limit Upper limit UnitsElectrical resistivity 3.3e22 3e23 Micro ohms cmDielectric constant 2.1 2.3 none
Table 15: PVCProperty Lower limit Upper limit UnitsElectrical resistivity 1e20 1e22 Micro ohms cmDielectric constant 3.1 4.4 none
Optical propertiesRefractive index is the ratio of the velocity of light in a vacuum to that in the material. This change of speeds causes the light to bend or refract. Transparent means that the materials is clear and all light is let through the material, while a translucent material only allows some light to travel through the material, and finally opaque materials don’t allow any light though the material.
Table 16: PETProperty Lower limit Upper limit UnitsRefractive index 1.57 1.58 noneTransparency Transparent
Table 17: PPProperty Lower limit Upper limit Units
19

Refractive index 1.48 1.5 noneTransparency Translucent
Table 18: PVCProperty Lower limit Upper limit UnitsRefractive index 1.54 1.56 noneTransparency Translucent
Chemical propertiesChemical properties describe weather or not a stimulus could change the chemical composition of the material. Stimuli include UV rays, solutions, or chemicals. We have chosen citric acid and phosphoric acid because these are chemicals that are often in sodas (Verhoff). The CES software says that all three materials perform very well in citric acid and phosphoric acid. The software also shows us that PP does not become very chemically stable when exposed to sunlight.Table 19: PETDurability citric acid 10% ExcellentDurability phosphoric acid 10% ExcellentDurability UV radiation good
Table 20: PPProperty Lower limit Upper limit UnitsDurability citric acid 10%
Excellent
Durabilityphosphoric acid 10%
Excellent
Durability UV radiation
Poor
Table 21: PVCDurability citric acid 10% ExcellentDurability phosphoric acid 10% ExcellentDurability UV radiation good
Magnetic propertiesWhen applying magnetic fields to our materials, they do not respond in a diamagnetic, paramagnetic, or ferromagnetic way. These polymers therefore do not have any magnetic properties.
ProcessabilityThe processability ratings indicate that these polymers should not use any type of cast molding where the material is melted down and poured into a mold and
20

allowed to re solidify. The high scores in moldability show that the materials can easily be shaped using injection molding, blow molding, or compression molding. They can also easily be welded and joint together very easily. The polymers may also experience good machinability, meaning that they may be effectively cut into shape and have a good finish.
Table 22: PETProcess Scale from 1 to 5 where one is not recommended and five
is excellentCastability 1/2Moldability 4/5Machinability 3/4Weldability 5
Table 23: PPProcess Scale from 1 to 5 where one is not recommended and five
is excellentCastability 1/2Moldability 4/5Machinability 3/4Weldability 5
Table 24: PVCProcess Scale from 1 to 5 where one is not recommended and five
is excellentCastability 1/2Moldability 4/5Machinability 3/4Weldability 5
Eco propertiesAll three polymers can be recycled but it is significantly more difficult to
recycle PVC. Pure PVC is easily recyclable but because there are many different chemicals and treatments that are usually performed on PVC, it becomes either non recyclable or only recyclable with PVC with similar treatments. The other materials also may undergo treatments, but there are not as many different types of treatment as PVC and they are also less common than in PVC. Therefore, it is important to consider whether the plastic should undergo treatment that might make it more difficult to recycle. The process that creates PVC also creates a powerful toxin known as dioxin, which is an environmental concern. There has been a considerable movement to avoid using PVC and instead use a different plastic for this reason. The carbon footprint of all three is significantly lower than Aluminum alloys, which is 12.5 to 13.8 lb/lb. The carbon footprint for a recycled version of the material is
21

significantly lower for PET and PP so recycling should be encouraged.
Table 25: PETProperty Lower limit Upper limit UnitsEmbodied energy 8.76e3 9.7e3 Kcal/lbCO2 Footprint 3.76 4.15 Lb/lbWater usage 15.1 16.8 Gal/lbRecycle Yes
Table 26: PPProperty Lower limit Upper limit UnitsEmbodied energy 8.2e3 9.07e3 Kcal/lbCO2 Footprint 2.96 3.27 Lb/lbWater usage 15.46 4.94 Gal/lbRecycle Yes
Table 27: PVCProperty Lower limit Upper limit UnitsEmbodied energy 6e3 6.63e3 Kcal/lbCO2 Footprint 2.37 2.62 Lb/lbWater usage 23.6 26.1 Gal/lbRecycle Yes
Summary of design guidelines, technical notes, and typical uses:
PETLimits of permeability to oxygen are overcome by having a layer of polyethylvinylidenealcohol between two layers of PET. This can still be blow molded. Made by using a condensation reaction with an alcohol and an acid creating the polymer and water. Typical uses include electrical fittings; blow molded bottles, films, magnetic tape, fibers, and credit cards.
PPStiffness and strength can be improved by reinforcing with glass chalk or talc. It is very resistant to water and can be colored many different colors. There are three basic groups of PP: homopolymers (pure PP), copolymers (PP made with another polymer), and composites. Typical uses include ropes, garden furniture, washing
22

machine tank, cable insulation, capacitor dielectrics, car bumpers, shatterproof glass, crates, and artificial turf.
PVCPlasticizers can make it into a softer material, which could then be used as a substitute to leather. It is also used for transparent disposable containers because it was so cheap. It can be join very easily. PVC may be a thermoplastic or thermoset depending on the process used to make it. Types of PVC include type I, type II, CPVC, acrylic/PVC blend, and clear PVC. Typical uses include pipes, fittings, road signs, canoes, garden hoses, vinyl flooring, medical tubes, artificial leather, wire insulation, and fabric.
Eco Audit and SustainabilityAfter researching possible materials and deciding on the materials that
would perform best for the project an Eco Audit had to be done using the CES software. To do this the three materials, polyethylene terephthalate (PET), polypropylene (PP), and polyvinylchloride (tpPVC), were placed into the Eco Audit Project Table. Once this was done the correct material was chosen. Once the material was put into the table the mass, primary process, end life, and quantity of each material was entered. The mass of the material was discussed in the Material Selection section. The primary process was chosen between polymer molding and polymer extrusion. After doing research it was found that the capital cost of polymer molding averaged to be $27,060 and the capital cost of polymer extrusion averaged to be $738,000 (CES). This was backed up by further research done that found that polymer molding had recently become much cheaper due to recent changes made in machines that perform polymer molding (AlHelou). The end of life of each polymer was chosen based on the fact that PET, PP, and tpPVC are all recyclable materials. The quantity of the material was known from the customer, GP Beverage, and how many bottles they are expecting.
Table 28: Material, Manufacture, End of Life (PET) (CES)
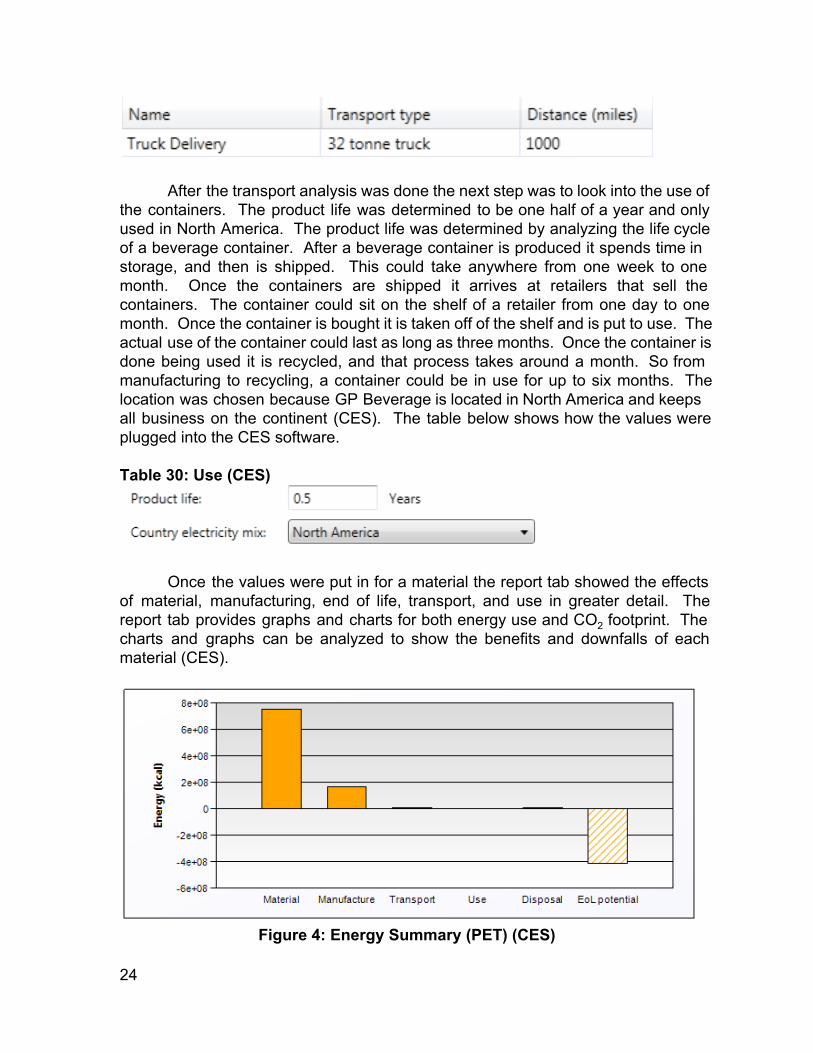
The next step of the Eco Audit was the transport type. The type of transport chosen for the beverage containers was Truck Delivery. This would be done on a 32ton truck and the trucks would have to drive an average of 1000 miles to deliver the containers to their destination (CES).
Table 29: Transport (CES)
23
After the transport analysis was done the next step was to look into the use of the containers. The product life was determined to be one half of a year and only used in North America. The product life was determined by analyzing the life cycle of a beverage container. After a beverage container is produced it spends time in storage, and then is shipped. This could take anywhere from one week to one month. Once the containers are shipped it arrives at retailers that sell the containers. The container could sit on the shelf of a retailer from one day to one month. Once the container is bought it is taken off of the shelf and is put to use. The actual use of the container could last as long as three months. Once the container is done being used it is recycled, and that process takes around a month. So from manufacturing to recycling, a container could be in use for up to six months. The location was chosen because GP Beverage is located in North America and keeps all business on the continent (CES). The table below shows how the values were plugged into the CES software.
Table 30: Use (CES)
Once the values were put in for a material the report tab showed the effects of material, manufacturing, end of life, transport, and use in greater detail. The report tab provides graphs and charts for both energy use and CO2 footprint. The charts and graphs can be analyzed to show the benefits and downfalls of each material (CES).
Figure 4: Energy Summary (PET) (CES)
24
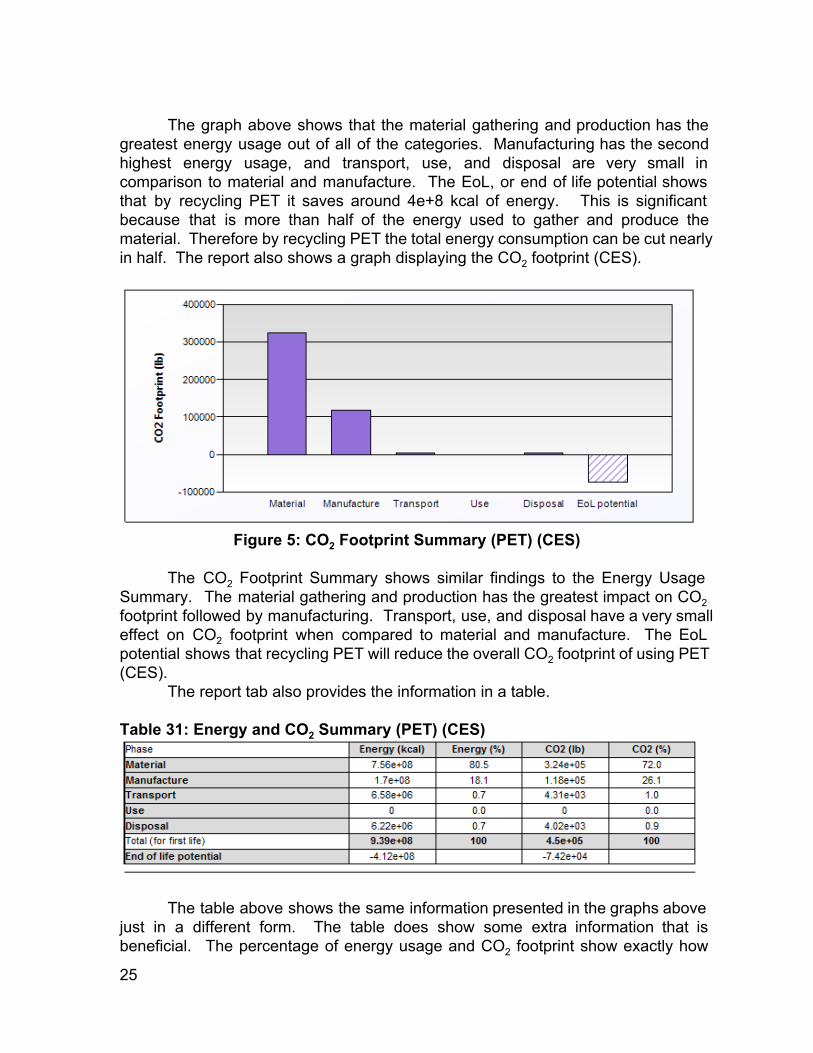
The graph above shows that the material gathering and production has the greatest energy usage out of all of the categories. Manufacturing has the second highest energy usage, and transport, use, and disposal are very small in comparison to material and manufacture. The EoL, or end of life potential shows that by recycling PET it saves around 4e+8 kcal of energy. This is significant because that is more than half of the energy used to gather and produce the material. Therefore by recycling PET the total energy consumption can be cut nearly in half. The report also shows a graph displaying the CO2 footprint (CES).
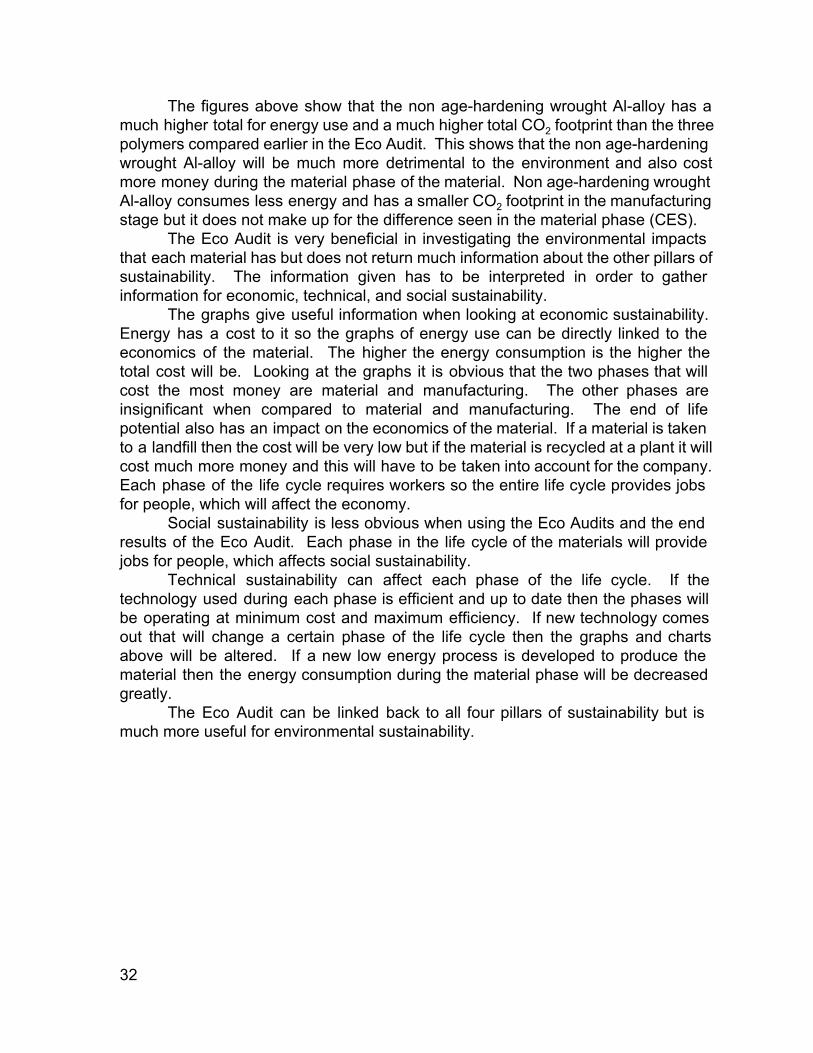
Figure 5: CO2 Footprint Summary (PET) (CES)
The CO2 Footprint Summary shows similar findings to the Energy Usage Summary. The material gathering and production has the greatest impact on CO2 footprint followed by manufacturing. Transport, use, and disposal have a very small effect on CO2 footprint when compared to material and manufacture. The EoL potential shows that recycling PET will reduce the overall CO2 footprint of using PET (CES).
The report tab also provides the information in a table.
Table 31: Energy and CO2 Summary (PET) (CES)
The table above shows the same information presented in the graphs above just in a different form. The table does show some extra information that is beneficial. The percentage of energy usage and CO2 footprint show exactly how
25

much each phase is responsible for. CES software also states that any phase with a percent fewer than twenty is usually not significant. The table also does a good job representing the “Total for first life” and then the end of life potential. It shows that by recycling the material and having a high end of life potential it decreases the total used in the first life (CES).
The report tab also provides more in depth information about the energy use and CO2 footprint during each phase of the materials life (CES).
Table 32: Detailed Energy Use (PET) (CES)
26

The tables above show each subcategory of the different phases of a material’s life. It then totals up the total energy used during each phase of a materials life. These tables can be used to see which phase has the greatest energy consumption and what is causing the phase to have the highest energy consumption. These tables are useful because they provide enough detail that the main energy consumer can be located and possibly altered if necessary or feasible. For PET the area that has the highest energy use is the material stage (CES). Below are tables showing the carbon footprint of PET.
Table 33: Detailed CO2 Footprint (PET) (CES)
27

The tables above are similar to the tables for Detailed Energy Use and show the CO2 footprint in each phase of a materials life. The tables can be used to find the phase that has the greatest CO2 footprint. For PET the material phase has the greatest CO2 footprint (CES).
(Tables and graphs for PP and tpPVC can be found in the Appendix (Eco Audit))
28

Another feature from CES is the summary chart. The summary chart compares the chosen materials to one another. This allows the user to look at the energy use and CO2 footprint of each material and compare them to one another (CES).
Figure 6: Summary Chart (Energy) (CES)
The figure above compares PP, tpPVC, and PET and their energy use. Looking at the material phase PP uses much more energy than the other two; tpPVC and PET have very similar energy usage in the material phase. In the manufacture phase of the materials life PET has the lowest energy consumption. In the transport, use, and disposal phases none of the polymers have enough energy consumption to consider when compared to the material and manufacture phases. In the end of life potential phase PET has the highest negative energy, which says that PET returns the most energy after being recycled. Since PET has the lowest total energy consumption and the highest end of life potential PET has the lowest total energy consumption over the life cycle of the polymers (CES).
CES also provides a summary chart based on CO2 footprint.
29

Figure 7: Summary Chart (CO2 footprint) (CES)
The figure above compares PP, tpPVC, and PET and the CO2 footprint of each polymer in the different life phases. In the material phase of the polymers life tpPVC has the lowest CO2 footprint followed by PET and PP has the highest CO2 footprint. In the manufacturing phase PET has the lowest CO2 footprint followed by tpPVC, and PP has the highest. The transport, use, and disposal phases are small enough to be disregarded when compared to the CO2 footprint during the material and manufacturing phases. In the end of life potential phase PET is the only polymer that has a negative CO2 footprint, which shows that recycling PET lessens the CO2 footprint for the total life of the polymer. Both tpPVC and PP increase the CO2 footprint for the total life of the material (CES).
CES also allows the user to compare polymers to any other material, which is beneficial because it shows the benefits and downfalls of polymers. This was done by using the Eco Audit feature and putting the materials in a summary chart to compare the energy use and CO2 footprint of the different materials. The following figures are the summary charts comparing the three polymers and non agehardening wrought Alalloys, which is commonly used to make aluminum cans for beverages (CES).
30

Figure 8: Summary Chart (Energy) (CES)
Figure 9: Summary Chart (CO2 footprint) (CES)
31
The figures above show that the non agehardening wrought Alalloy has a much higher total for energy use and a much higher total CO2 footprint than the three polymers compared earlier in the Eco Audit. This shows that the non agehardening wrought Alalloy will be much more detrimental to the environment and also cost more money during the material phase of the material. Non agehardening wrought Alalloy consumes less energy and has a smaller CO2 footprint in the manufacturing stage but it does not make up for the difference seen in the material phase (CES).
The Eco Audit is very beneficial in investigating the environmental impacts that each material has but does not return much information about the other pillars of sustainability. The information given has to be interpreted in order to gather information for economic, technical, and social sustainability.
The graphs give useful information when looking at economic sustainability. Energy has a cost to it so the graphs of energy use can be directly linked to the economics of the material. The higher the energy consumption is the higher the total cost will be. Looking at the graphs it is obvious that the two phases that will cost the most money are material and manufacturing. The other phases are insignificant when compared to material and manufacturing. The end of life potential also has an impact on the economics of the material. If a material is taken to a landfill then the cost will be very low but if the material is recycled at a plant it will cost much more money and this will have to be taken into account for the company. Each phase of the life cycle requires workers so the entire life cycle provides jobs for people, which will affect the economy.
Social sustainability is less obvious when using the Eco Audits and the end results of the Eco Audit. Each phase in the life cycle of the materials will provide jobs for people, which affects social sustainability.
Technical sustainability can affect each phase of the life cycle. If the technology used during each phase is efficient and up to date then the phases will be operating at minimum cost and maximum efficiency. If new technology comes out that will change a certain phase of the life cycle then the graphs and charts above will be altered. If a new low energy process is developed to produce the material then the energy consumption during the material phase will be decreased greatly.
The Eco Audit can be linked back to all four pillars of sustainability but is much more useful for environmental sustainability.
32

Physical Testing
Tensile TestingTensile testing was performed using the instron machine in the mechanics
lab. The yield strength and Young’s modulus was calculated for each material using the following equations:
/Aσ = FL/Lε = Δ/εE = σ
Where is the stress, F is the force, A is the cross sectional area, is theσ εstrain, is the change in length, L is the initial length, and E is Young’s modulus.LΔThree trials were conducted for each of the three sample materials, and the averagevalues for stress, strain, and young’s modulus were taken between the three trials.Graphs depicting stress vs. strain are shown in figure A16 in the appendix. The yieldstrength was found using these graphs, and are shown in table 34 below, along withthe young’s modulus of each material.
Table 34: Tensile Test ResultsMaterial Yield Strength (psi) Young’s Modulus (psi)
PET 10350.537 478,372.978
PP 5104.352 191,231.867
PVC 9362.543 463,356.735
These results show that PET has the highest yield strength, and from thegraph it is also seen that PET is much more ductile than PVC, which breaks almostimmediately after yielding. PP is quite ductile but has a much lower yield strengththan the other two. This indicates that based on the requirements provided for thebeverage container to withstand a five foot freefall, PET is the best choice.
Optical TestingThe optical test conducted in order to determine if material properties were
affected by extended exposure to UV radiation. The sun provides the Earth’s surface with roughly 4.7 kwh/day of sunlight to the Harrisonburg area on a sunny day(GW Solar Institute). Converting this to kJ/week gives a value of 118440 kJ/week.
Three samples of each material were placed under a 120W UV light for one week. This converts to approximately 72576 kJ/week. Upon comparison of the two, the material samples were exposed to UV radiation equivalent to roughly 4 days of sunlight in Harrisonburg, VA. This was chosen as gauge based on the example of a
33

beverage bottle accidentally being left in a car and exposed to sunlight for several days. It is necessary to ensure that any material selected would not be noticeably impacted by the UV exposure and have any effect on the structural integrity of the container.
All three samples of each material were then put through the same tensile testing process as their nonUV exposed counterpart. Using this data, stress, strain, young’s modulus, and yield strength values were again calculated and averaged across the three trials. Yield strength and young’s modulus values are shown in table 35, located below, and a graph of stress vs. strain for each material is shown in figure A19 of the appendix.
Table 35: Results of UV Exposed Tensile TestingMaterial Yield Strength (psi) Young’s Modulus (psi)
PET 9735.475 487,352.978
PP 4933.892 196,731.327
PVC 8955.436 463,364.757
The results of this test show that there was a very minimal impact on any ofthe three materials caused by UV exposure. This test does not affect final materialselection because all three materials responded in roughly the same manner.However, it does ensure that all three materials can withstand at least moderate UVexposure and do not need to be ruled out of consideration.
Chemical TestingTensile:
The acid test was performed by soaking the materials in soda instead of acid. This decision was reached because we did not have enough money in the budget to buy the acids separately. we used RC Cola as our soda because that is the most acidic soda with a pH of 2.387.
We then performed tensile test to determine if the acid in soda (citric, phosphoric, and carbonic) had deteriorated the physical properties of the material. The results are summarized in the table below.
34

Table 36: Results of Chemical Tensile Testing
The data collected was analyzed with statistics and was not found to bestatistically different than the trials conducted for the initial tensile test. Although thisshows that the chemicals did not affect the properties of the materials, not enoughtests were done to prove this statistically.
Material Degradation:The material degradation test was simplified because we spent almost all of
our money on the materials and did not have enough money to buy all of the containers. Instead we had one container with just soda (RC Cola was used again for the soda in this experiment because we had it available form the first chemical test) and three other containers with soda with one material submerged in each. We did not fill any containers with water and used the container with just soda as our control. Our results our shown in the table below.
Table 37: pH Change of Chemical Test
The change in pH from day one to day seven in the control solution was 0.0333, the change in pH from day one to day seven of the solution with PP was 0.030, the change in pH from day one to day seven of the solution with PET was 0.0267, and the change in pH from day one to day seven of the solution with PVC was 0.0333.
All solutions had an increase in pH. This could be explained by the loss of carbonation of the soda over time which would lead to a decrease in the carbonic acid levels in the solution. Another possible explanation for the increase in pH is that the same pH meter was not used for both trials.
Magnetic TestingThe magnetic testing for each material was done using a gaussmeter and a
35

magnet as seen in figures 10 and 11.
Figure 10: Gauss Meter
Figure 11: Ferrous MagnetThe test was set up to examine the change in magnetic flux associated with introducing the polymer material to the testing environment. The test was initiated by recording the measurement of the ferrous magnet with the Gauss meter without any polymer material added as a control to other trials. Each polymer material was oriented on top of the magnet in a way that would optimize the change in flux across the gauss meter. Each polymer was put through thirty trials of this. The data for each trial can be seen in appendix under magnetic testing and the averages of each trial set seen in table 38, below.
Table 38: Magnetic Properties Comparison
The comparison of the polymer samples to that of the control sample was done by statistical analysis of the two means. Since the values of the actual t values are less than the critical t values, it can be said that the average values of the polymers are not statistically different from that of the control average with 95% confidence. Calculations for the values in table 38 can be seen the appendix under magnetic testing.
36

Electrical TestingWe determined that our electrical test would not be possible because of the
extremely high resistivity of our material. Not only would it require a high voltage that is not obtainable in our labs, but it would also be extremely dangerous to be working with such high voltages without more advanced protection. This can be explained by ohms law.
RV = IV is the voltage, I is the current and R is the resistance. We would need an
extremely high voltage to get any significant amount of electrical current running the polymers because the resistance is so high. The safety problem is because the resistance of the human body is much less than that of the polymers. According to the NIOSH (National Institute for Occupational Safety and Health), the resistance of the human body under the best conditions is 100,000 ohms. The resistance of a tenth of a millimeter of our least resistive material is 1,000,000,000,000 ohms. If we were to accidently touch the wires connecting to oppositely charged wires the current running through the body would be 10,000,000 times greater than the current running through the polymer. High voltage may breakdown the skin, which would lower the resistance of the body and increases current flow even more. According to the NIOSH the current, duration, and path of the electricity impacts weather or not an electric shock is lethal. The possibility of an extremely high current running through the body makes this test too dangerous to conduct.
Thermal Testing
Thermal ConductivityThe thermal test was done as proposed in the procedures section of the
report. Rods were obtained of each material and were cut to ten inches and holes were drilled into the top of each rod. A cartridge heat was connected to a power supply supplying 1.35 amps to the cartridge heater. The cartridge heater was then put in the hole that was drilled in the top of the rod. Next, thermocouples were attached to the rod at 3 inches and 7 inches from the top (side with the cartridge heater). The other end of the thermocouples was then put into LabView that collected the data for the lab. The other side of the rod was placed in a cup of ice to try and get the maximum amount of heat transfer through the rod. The power supply was then turned on and heated up the cartridge heater. The experiment ran for 30 minutes. The experiment was ran for all three materials, PET, PP, and tpPVC. The figure below illustrates the set up of the experiment.
37

Figure 12: Thermal Conductivity Experiment
The figure above shows the rod in the cup with ice that has thermocouples attached to it as well as the cartridge heater in the top of it. The figure shows the power supply as well as the LabView equipment used to collect data.
After collecting and analyzing the data there was no significant temperature change throughout the rod. There were only small fluctuations which were most likely caused by temperature changes in the room or air flow through the room. Since there was no temperature change the thermal conductivity value must be very close to zero. This can be shown by using the equation, . It is A(dT /dx)Q = k obvious to see that if the temperature change in the system is zero then the heat transfer is going to zero. Ultimately, showing that the thermal conductivity value is going to be zero as well. This held true with our hypothesis that the thermal conductivity would be very low. Since our experiment did not yield any good data we decided to research the thermal conductivity values of our materials for comparison sake. The following table shows the thermal conductivity values for the three materials tested.
Table 39: Thermal Conductivities of Materials (CES)Material Thermal Conductivity (W/m*C)
PP 0.140
PET 0.145
tpPVC 0.220
The table above shows that the thermal conductivities of PP and PET are very similar but tpPVC has a much higher value. This suggests that PP and PET would be the first choices when selecting a material in terms of its thermal
38

properties. A low thermal conductivity will both keep heat out and keep the coolness of the drink in. In comparison to other materials, like metals and ceramics, all of these values are very small. This means that the three materials we have selected would do fine if used to make a beverage container. Since, we have a choice though PP would be our first choice followed closely by PET because their values are so close.
Melting PointBefore starting the melting point test discussed in the procedure section of
the report the team talked to Scott Padgett to ensure that the test was safe to run. He said the test was not safe to run without the proper equipment. The team decided to air on the side of safety and instead of doing the experiment rely on the values that were found during the research stage earlier in the project. Tables that show the melting points for the three materials are found in the material properties section of the report.
Impact Test Procedure
1. IntroductionThe accuracy of the results of the test are dependent on the liquid in the
plastic container. In order for the results of the test to be useable by the individual running the test, only containers with the same liquid can be compared to one another. The individual running the test should use the same liquid that the container is designed to carry. This test is not intended for containers that will contain hazardous materials.
2. Scope2.1This test method is used to determine the ability of a plastic container full of liquid to survive an impact of “standardized” pendulum type hammers, mounted in a “standardized” manner, in one pendulum swing. The results of the test method are reported in terms of pass and fail depending on if the container has been ruptured.
2.2The values stated in SI units are to be regarded as standard.
2.3 Reference DocumentsASTM Standards∙ D618 Practice for conditioning plastics for testing∙ D883 Terminology related to plastics∙ D25610 Standard test methods for determining the Izod pendulum impact resistance of plastics
2.4 Terminology∙ Definitions – For definitions related to plastics see terminology D883
39

3. Summary of Test Method3.1This test method operates by clamping a container at each of its ends so its center is exposed to a strike from the pendulum. The container should be aligned in the clamps so that the center of the container is in the path of the pendulum.
4. Significance and Use4.1Tests made on the conditions of this standard have value in comparing a containers ability to survive impact.4.2 The impact of the pendulum test indicates the energy needed to break containers, and are influence by the parameters, specimen mounting, container dimensions, expansion properties of the liquid, and pendulum velocity at impact.4.3 The energy lost by the pendulum during the breakage of the specimen is the sum of the following.∙ 4.3.1Energy to initiate fracture of the container∙ 4.3.2Energy to bend the container∙ 4.3.3Energy to create vibration in pendulum arm∙ 4.3.4Energy to indent the container∙ 4.3.5Energy to overcome friction caused by pendulum striker∙ 4.3.5Energy to overcome friction in pendulum arm bearing.4.4 The results of the test should be recorded as follows∙ CRComplete Rupturecontainer splits into two pieces∙ PRPartial Rupturecontainer splits and the inside liquid is leaking but the container is still one piece.∙ DDentedThe container has been permanently deformed but has none of its content leaking.∙ NNNot Noticeable The container has no noticeable effect from the pendulum.o CR and PR will be categorized as a failure to withstand impact. D and NN will be labeled as passing the impact test.4.5 The value of the impact container method is mainly in the areas of quality control, materials specification, and container specifications.5. Apparatus5.1 The machine which will hold the container shall have a wide base that is mounted and rooted to a rigid frame. The machine must also have a holding and releasing mechanism for the pendulum.5.2 The pendulum will consist of a single arm with a bearing on one end and a head at the other. The arm must be sufficiently rigid to withstand the energy of the impact.5.3 The head of the pendulum will made of hardened steel with a radius of curvature of 0.8±0.20 mm. The contact between the container and the pendulum will occur no farther than ±2.54 mm from the measured center of the container.5.4 The position of the pendulum in the holding and releasing mechanism will be raised to a vertical height of 610±2 mm which should produce a velocity of 3.5 m/s.5.5 The length of the pendulum arm shall be 0.4 mm.5.6 The machine shall come with a vice that is made up of two clamps. Each clamp secures each side of the container being tested.
40

Figure 13: Side View of Pendulum Impact Machine
Figure 14: Front View of Pendulum Impact Machine6. Procedure6.1The test should be run on an individual container ten times. The container obtains a passing grade if it gets a D or NN for all ten trials. If the container receives a CR or PR on a trial, the testing procedure ends and the container obtains a failing grade.6.2The dimensions of the container must stay consistent. The tolerance of the
41

dimensions of the container must be ± 0.005 inches from each other, if the result of the container is to be compared to the other materials.6.3Calculate the energy needed to test and select a pendulum of suitable energy.6.4Place the container in a clamped vice so that the center of the bottle is in line with the pendulum.6.5If windage and friction energy is given make appropriate adjustments to the pendulum so that the needed energy is delivered to the container.
Final Material SelectionThe team decided to use a decision matrix to select the final material. The
selection criteria was chosen by the experiments that were done as well as what the team decided was most important to the attributes of the bottle. Below is the decision matrix.
Table 40: Decision Matrix
The decision matrix shows the selection criteria as well as what material performed the best in the certain criteria. The selection criteria is weighted so the most important criteria have a bigger impact on the final score of the selection process. The decision matrix shows that PET was the best choice for our project followed by tpPVC, and PP was the last choice.
42

Conceptual PrototypeThe conceptual prototype was designed in SolidWorks. The design was
made by using the dimensions that were given in the Material Selection section of the report. The design used the radius, height, and thickness that were decided in the materials selection section and the volume, found by SolidWorks, was just over five liters. The drawing was then presented to Dr. Nagel who said that the drawing could be printed using the 3D printer but that it must be scaled down. The printers that JMU has can only print at a certain size and also since the prototype has no real use it would be a waste of material. Scaling the drawing down also meant that the prototype must be made solid because the thickness of the scale would not be strong enough to support the shape.
After the material was scaled down the team took the design to the printing room and with the help of Fletcher Grow, the TA for the solid modeling class, and sent the drawing to the 3D printer. The printer then began the process that took three hours. The final product was a scaled down version of the drawing found in the figure below.
SolidWorks
43

Figure 15: Beverage Container Prototype
The scaled down version was approximately three and a half inches tall, and the rest of the dimensions were scaled down the same. This gave the team an actual hard part that could be presented to the customer. GP Beverage could now have something to hold and see if it looked like something they would use and market. After feedback is received the team will make changes to the alpha prototype and then present the next stage of the prototype.
Economic Feasibility
The first thing that was done to see if the material being used would be economically feasible was the initial mass of the container. This was done by using the value previously found for the volume of the container itself and the density of the material. The mass of the PET container was found the be 0.367 kg. The next thing that was done was finding the cost of a single container. This was done by multiplying the cost of PET, $2.18/kg (CES), by the mass of a single container. Doing this gave the cost of one container to be $0.80.
GP Beverage wants 50,000 of these bottles so the next thing that had to be done was to find the cost of 50,000 containers. This came out to be $39911.25. This is the initial invest for GP Beverage. The cash flow depends on the amount that the GP is going to charge for the bottle. Assuming, that GP will charge at least one dollar per bottle and that the discount rate for the first year will be 5 percent. The net present value of the project can be found by using the equation,
. Using this equation with the values mentioned above thePV − o C/1 )N = C + ( + r NPV for the first year of the project will be $7707. 79.
Seeing that the NPV for the project is positive I would recommend that GP Beverage continue with the material chosen. Having an NPV that is positive gives a positive outlook on the project for the years to come because, if the project does well, the company will sell more bottles the next year which will return even more money. Also, if the beverage container becomes popular with the customers the company can start charging more per bottle which will also increase their profit.
ConclusionResearch suggests that using Polyethylene terephthalate (PET),
Polypropylene (PP), and Polyvinylchloride (PVC) from the polymer family would be the most cost efficient way to protect the product of the GP Beverage Company. These materials meet the criteria listed above. The material properties process shows a comparison of the three materials. This process compares the properties
44

of each material, which can highlight the strengths, and weaknesses of each material. The material selection process depicts which materials out of the polymer family would best be suited for the project. The designlead method of defining functions, constraints, objectives, and free variables is how each material was selected. Through estimations and research, the team was able to simulate values for defining the constraints of the bottle design. The team used material indices to figure out the top four materials within the polymer family that would satisfy the project objectives. Documentation is responsible for narrowing those four down to the three stated throughout this report. The ecoaudit analyzed the life phases of each material and the energy use and CO2 footprint during each life phase. The energy use and CO2 footprint of each material allows the GP Beverage Company to see which material is most environmentally sustainable. The ecoaudit also provides enough information for the team to explore the economic, social, and technical sustainability of each material. The manufacturers, chemical properties, and chemical structures of each material are depicted below.
b. c. a.
Figure 16:Polypropylene (PP) (a.), Polyvinylchloride (PVC) (b.), Polyethylene
terephthalate (PET)(c.)
45

Figure 17: Polymers Utilized (Note that the location is for the Manufacturer)
After the preliminary work was done for the project more research had to be done to decide on a final material that would be used. This was first done by doing the tests that were planned before the preliminary report. A test was run for thermal, optical, mechanical, magnetic, electrical, and optical. One of the major findings from running these tests is that the three polymers that were selected for testing were not impacted during the thermal, magnetic, or electrical tests. This was shown by running the experiments and not getting any noticeable results. Also, the chemical and optical tests did not have any majorly defining results. The chemicals did not have any major affect any properties of the polymers and the UV light did not affect the properties of the polymers.
The test that had the most impact on the project was the mechanical test. The mechanical test was a tensile test and from that the team gathered information about both the Young’s Modulus and the tensile strength of the three different materials. This was beneficial because the project calls for a material that is tough enough to survive a fall without breaking or cracking.
The final material was selected by using a decision matrix. Using this the team was able to rank the selection criteria and compare the materials to one another. After the team had finished the decision matrix it was decided that PET was going to be the material of choice. After PET was chosen there were other things that had to be done.
The team designed a bottle using SolidWorks. This was done by using the dimensions that were found in the material selection section of the report. The team drew the bottle and had to discuss the bottle with someone that was familiar with 3D printing. After doing this it was decided that the container needed to be scaled down before printing. The container was scaled down and then printed, giving the team an alpha prototype.
Lastly, the team analyzed the economical side of the project. The project was found to have a positive NPV for the first year which means the project has a bright future. The team believes that GP Beverage should continue with the project and with the material that the team has chosen for them.
Overall, the material we selected is the best material for the GP beverage bottle in both the material family of polymers, and compared to other material 46
families. PET is proved to be the best polymer for the project by our research, properties that we validated with physical tests, and decision matrix based upon customer needs. When compared with the other material families the polymer family makes the best sense for a bottle based upon the properties of cost, weight, performance and processability. Therefore we can conclude that, because PET is the best polymer and polymers are the best family group to construct the five liter bottle, PET is the best material to construct the five liter bottle out of all available materials according to our research.
References (MLA Format)1. "3. PRESSURE SAFETY PRACTICES." MN471000. N.p., n.d. Web. 24
Oct. 2013.
2. AlHelou, Bassam A. "Modification And Development Of A Blow Molding .Machine." Engineering 4.4 (2012): 188197. Academic Search .Complete. Web. 23 Oct. 2013.
3. Ashby, M. F., Hugh Shercliff, and David Cebon. Materials: Engineering, .Science, .Processing and Design. Oxford: ButterworthHeinemann, .2010.Print.
4. "Average Hand." Size. N.p., n.d. Web. 24 Oct. 2013.
47

5. "Battery Questions & Thoughtful Answers." Battery Questions & Thoughtful .Answers. N.p., n.d. Web. 25 Oct. 2013.Voltage of manufacturing
6. Beverage Container Deposit Legislation. [Melbourne]: Library, Parliament of. Victoria, 1983. 57. Print.—introduction
7. "Blow Moulding for Bottles." Borealis Group. Borealis Group, n.d. Web. 24Oct. . 2013.
8. Daniels, Carole. "Polymers: Structure and Properties." Polymers. N.p., n.d. Web. .21 Oct. 2013.
9. CES EduPack, version 11.9.9; Granta Design Limited: Cambridge,England, . 2012; (accessed March 15, 2013)
10. "Density of Coke." Density of Coke. N.p., n.d. Web. 24 Oct. 2013.
11. "Ergonomics 101 The Basics: What Retailers Need to Know." Ergonomics. 101. N.p., n.d. Web. 19 Oct. 2013.
12. "The Fatal Current." Electrical Safety:. N.p., n.d. Web. 25 Oct. 2013.
13. Frank H. Verhoff (2005), "Citric Acid", Ullmann's Encyclopedia of Industrial .Chemistry, Weinheim: WileyVCH
14. Senese, Fred. "Why Is Phosphoric Acid in Soda Pop?" General Chemistry .Online: FAQ: Chemistry of Everyday Life. Web. 24 Oct. 2013.
a. http://antoine.frostburg.edu/chem/senese/101/consumer/faq/whyphosphoricacidinsodapop.shtml
15. "Gases, Liquids, and Solids." Gases, Liquids, and Solids. N.p., n.d. Web. 25 Oct.2013.
16. "Hand Grip Strength." TNCCDAAR. Tufts Brown Johns Hopkins, n.d. Web.21 . Oct. 2013.Ergonomics
17. "How Do Differing Standards Increase Trade Costs? The Case of Pallets."By . Gaël Raballand, Enrique AldazCarroll. N.p., n.d. Web. 24 Oct.2013.
18. John Rex Whinfield and James Tennant Dickson (1941) "Improvements .Relating to the Manufacture of Highly Polymeric Substances", UK . Patent578,079;
19. "Justyne Neborak's AE Senior Thesis." Justyne Neborak's AE Senior Thesis. N.p., .
48

n.d. Web. 25 Oct. 2013.
20. "Magnetic Induction." Magnetic Induction. N.p., n.d. Web. 25 Oct. 2013.
21. "Magnetic Materials." Magnetic Materials. N.p., n.d. Web. 25 Oct. 2013.
22.Meienhofer, Johannes. "Nature: Biochemisty." Nature. N.p., n.d. Web. 23 Oct. .2013.
23. "Polymeric Linear Terephthalic Esters", U.S. Patent 2,465,319 Publication .date: March 22, 1949; Filing date: September 24, 1945; Priority date: .July 29, 1941
24.Ophardt, Charles E. "Polymers." Polymers. Elmhurst College, 10 Mar. 2003.. Web. 23 . Oct. 2013.—introduction
25. "Plastics." US Environmental Protection Agency. n. page. Print.<http://www.epa.gov/osw/conserve/materials/plastics.htm>.
26. "Plastic Bottle Manufacturing." Plastic Bottle Manufacturing. N.p., n.d. Web.. 24 Oct. 2013.
27. “polyethylene terephthalate (PET or PETE).” Encyclopædia Britannica. .Encyclopædia Britannica Online Academic Edition. Encyclopædia .Britannica Inc., 2013. Web. 23 Oct. 2013.
28. PET Resin Association. "An Introduction to PET." Fact Sheet. Web. 23 Oct. .2013.
a. http://www.petresin.org/news_introtoPET.asp
29. "polypropylene." Encyclopædia Britannica. Encyclopædia Britannica Online .Academic Edition. Encyclopædia Britannica Inc., 2013. Web. 23 Oct. .2013
30. "polyvinyl chloride (PVC)." Encyclopædia Britannica. Encyclopædia .Britannica Online Academic Edition. Encyclopædia Britannica Inc., .2013.Web. 23 Oct. 2013.
31. "Polyvinyl Chloride." Greenpeace International. Web. 24 Oct. .2013,http://www.greenpeace.org/international/en/campaigns/toxics/polyvinylchloride/
32. "Pressure in a Can of Soda." Pressure in a Can of Soda. N.p., n.d. Web. 24Oct. . 2013.
49

33. "Pressure Vessels Ensure Safety." ASME. N.p., n.d. Web. 25 Oct. 2013.
34. "PVC." Vinyl Chloride Monomer (VCM) Production . N.p., n.d. Web. 24Oct. . 2013
35. "Thermal Properties." Engin.brown.edu. N.p., n.d. Web. 22 Oct. 2013.
36. Smith, Duncan S. "Electrical Resistance of a Body." Mospace. N.p., n.d. Web. 24 .Oct. 2013.
37. "Standard Test Methods for DC Resistance or Conductance of Insulating .Materials." . Annual Book of ASTM Standards. 10.01. Conshohocken: .2012.—for procedure
38. "Statistics." Texas A&M Agrilife Extension. N.p., n.d. Web. 24 Oct. 2013.
39. "UV Damage to Polymers." UV Damage to Polymers. N.p., n.d. Web. 25 Oct. .2013.
40. "World Meteorological Organization." World: Highest Temperature. N.p., n.d. .Web. 25 Oct. 2013.
41. Young, Robert J. Introduction to Polymers. London: Chapman and Hall, 1981.. Print.—introduction
42. Jain, Nihill, Sobkowski, Agustin. General Dentistry, March/April 2007
43. "FAQ | The GW Solar Institute." FAQ | The GW Solar Institute. N.p., n.d. Web. 03Dec. 2013.
Appendix
Material SelectionBottle Dimensions Calculated
50

Figure A1: Radius of Bottleadius of the cross sectionr = rngle around cross sectionθ = aistance around cross sections = d
θ (Eq. 1)s = r80.5mm (π)1 = r7.45mm .05745mr = 5 = 0
With an estimated radius calculated the length of the estimated cylindrical container can be calculated knowing that the volume must be at least five liters.
olume of containerV = vadius of the cross sectionr = r
ength of containerL = Lr L (Eq. 2)V = π 2
10 )m (.05745m) (L)5 * ( −3 3 = π 2
.48mL = 0With the estimated cross section and length of the container, an estimated thickness can be calculated using equation 2. Equation 2 was found through a bottle design research paper at the University of Michigan (Plastic Bottling Manufacturing).
F afety FactorS = Snternal PressureP = I
pplied Outside ForceF = Aross Sectional Area of ContainerA = C
adius of Containerr = Rield strengthσy = y
(Eq. 3)t = σySF(P+ )rA
F
The applied outside force is representative of impulse force on the container full of its contents. Since energy is conserved equation 3 applies. Assume the mass of the container is negligible since thickness is needed to calculate for the mass of the container. The rebound distance was assumed to be 0.1m since the team wanted to maximize the possible impulse force. The mass of the contained liquid was calculated using the density of the densest carbonated soft drink as of 2013, CocaCola. This has a density of 1.11g/mL.
ass of contained liquidm = mravitational acceleration g = g
eighth = h
51

mpulse forceF = iebound distanced = r
gh (Eq. 4)m = F * dm = ρ * V1110 )(5L)m = ( L
g
550g .55kgm = 5 = 5ghm = F * d
5.55kg)(9.81 )(5ft .3084 ) 0.1m)( s2m * 0 f t
m = F * (27.6 NF = 8
The safety factor for pressurized vessels as described in the standards for Sandia National Laboratories should be at least 3.5 (Pressure Vessels Ensure Safety). The internal pressure can be represented by the highest pressured popular soft drink in the marketplace as of 2013, CocaCola, which is 380000 Pa (Pressure in a can of soda). Since these calculations are meant to give estimate values for the dimensions, the team needs a known yield strength that will work to finish the calculation. The yield strength can be taken from the most prevalent polymer container, polyethylene terephthalate. Which has a yield strength of about 59398702Pa (CES). With all the input variables accounted for, the thickness of the container can be calculated.
t = 59398702Pa(3.5)(380000Pa+ )0.05745m827.6N
π0.05745m2
.00156mt = 0With an estimated thickness calculated for the theoretical container, the estimated volume of the polymer container can be identified.
olume of material in containerV = vadius of the inside of containerr = rhickness of material wallt = t
ength of containerL = lπ(r ) r )L (Eq. 4)V = ( + t 2 − π 2
π(0.05745m .00156m) (0.05745m) )( 0.48m)V = ( + 0 2 − π 2
.000274 mV = 0 3
With the estimated dimensions calculated, rough estimates of individual constraint values can be calculated.
Preliminary Stiffness CalculationsThe representative model calculated for dimensions is shown figure 2.
52

Figure A2: Model of ContainerStiffness is the resistance to change shape if the material has elastic characteristics. Young’s Modulus is a good indicator of how stiff a substance is (Ashby). In order to calculate a Young’s Modulus for the container in figure 2. the theoretic container is put on its side and treated like a beam. This can be seen in figure 3. This procedure is done because the container will have forces applied to it from its side when dropped and it must be stiff enough to recover. The team wants a minimum Young’s Modulus in which to access the material with. The requirements for Young’s Modulus in this theoretical test will be greater than for the requirements for the five foot impact. This is due to the fact that the container hitting the ground will have its load distributed as opposed to a point load in the three point bend setup. So a material that satisfies the Young’s modulus requirement for the three point bend will also satisfy the requirement for the impact of the five foot drop.
53

Figure A3: Representation of a Bottle as a BeamThe conventional standard is for max deflection of a beam is seen in equation 5(cite beam deflection).
eflectionδ = d ength of BeamL = l(L) (Eq. 5)δmax = 1 m deflected
360 m Length
(0.48m) δmax = 1 m deflected360 m Length
.001333mδmax = 0Equation 6 is for when the container makes impact with the ground and lands on an elevated piece at its center. This is allows for a worse case than if the force was distributed evenly along the length.
mpact ForceF = Iength of the BeamL = Loungs ModulusE = Y ′
oment of Inertia of the Cross SectionI = M (Eq.6)δ = 48EI
(F)L3
E = 48δI(F)L3
((r ) )I = 4π + t 4 + r4
1.82431E 5)mI = ( − 0 4
E = (827.6N)(0.48m)348(0.001333m)((1.82431E−05)m )4
8410490 PaE = 7The material chosen should have a Young’s Modulus above 78410490 Pa.Preliminary Strength CalculationsStrength is the resistance to permanent distortion or total failure (Ashby). The minimum strength that a material needs to have in order to survive a five foot drop using the team’s theoretical model is found using the bending moment about the middle section of the beam. Once again this value, in this case stress, will be higher for the three point beam then for a container landing on an elevated piece at its
54

center. In order to find the bending moment of the particular arrangement that was set up for stiffness, the beam in figure A4 has to be cut in half. The beam cut in half can be seen in figure A4.
Figure A4: Max Moment OccurrenceThe moment at the beams center midpoint can be found using the equilibrium equation in Equation 7.
nternal Moment at Beam MidpointM = Impulse Force at the Center of the Beam F = I
otal Length of the BeamL = T
− )( ) (Eq. 7)∑
M = ( 2
F2L +M = 0
9.3NM = 4FL = 4
(827.6N)(0.48m) = 9 *mThe beam was cut at the center because the beams configuration makes it that the maximum moment and hence the maximum stress happens at the center of the beam. The stress at the center of the beam can be found using equation 8.
ax MomentM = Mistance from the Neutral Axis to the Extreme Fiberc = D
nertia of the BeamI = Inner Radius of Containerr = Ihickness of Containert = T
he Highest Stress on the Container from this Forceσ = T (Eq. 8)σ = I
Mc
c = r + t21293.9Paσ = ((1.82431E−05)m )4
(99.3 N m)(0.05745m+0.00156m)* = 3The material chosen should have a yield strength greater than 321293.9 Pa
Preliminary Fracture Toughness CalculationsSince the team has modeled the container after a pressure vessel this allows for the 55

use of fracture toughness equations specifically designed for pressure vessels. The team assumes that the design should leak before it breaks so the equation 8 from chapter ten of Materials: engineering, science, processing and design can be used to solve for a minimum fracture toughness.
racture ToughnessK1c = Ftress for a Pressurized V esselσ = S
hickness of Material in the Containert = Tressure of the Containerp = P
nner Radiusr = I (Eq. 8)σ = K1c
√ 2πt
σ K1c = √ 2πt
σ = tpr
4994230 Paσ = (0.00156m)(380000Pa)(0.05745m) = 1
14994230 Pa) 42243.5 Pa K1c = ( √ 2π(0.00156m) = 7 *m2
1
The fracture toughness of the material should be over 742243.5 Pa*m1/2
Preliminary Thermal Conductivity CalculationsThe thermal conductivity of the material should allow for a reasonable amount of time for the beverage to cool off and a reasonable amount of time to stay cold before consumption. The three main materials used for carbonated beverages are aluminum, sodalime glass, and PET. The thermal conductivity values are respectfully 247 , 17 , and 0.14 . The range of acceptable is thermal W
m k* Wm k* W
m k* conductivity is then 0.1 to 250 . The design team is limited to polymers so the W
m k* thermal conductivity will not go anywhere near 250 , so the thermal conductivity W
m k* shall be stated as any polymer greater than 0.1 . (CES)W
m k*Preliminary Electrical Resistivity CalculationsThe packaging and transportation of the polymer containers is constantly around heavy manufacturing machinery. Workers that handle the transportation and manufacturing of the containers are constantly near high voltage machines. A person constantly near high voltage increases that person’s chance of suffering from severe shock and/or death. If the material selected is conductive, the material can act as a pathway for workers to come in contact with dangerous voltages. Figure 5 shows the electrical circuit representation of current being delivered to a container worker.
56

Figure A5: Circuit of Human Worker and PolymerVoltage is necessary for current to flow but current is what is harmful for humans. Equation 9 is based from the ideal elements of figure 5 to solve for the lowest polymer resistance that will not be deadly for workers.
oltage from MachineryV machinery = Veadly Currentia = D
he Resistance of the Polymer ContainerRpolymer = Tesistance of an Average HumanRWorker = R
(R ) (Eq.9)V machinery = ia polymer + RworkerThe current needed to deliver deadly consequences is 0.1 0.2 amps. The resistance of a workers skin while wet is 2000 Ohms. The resistance is for a wet worker because the design team wants a worst case scenario. The voltage of manufacturing machines within a water bottle processing plant is 480 kV.
Rpolymer = iaV machinery − Rworker
2000Ω)Rpolymer = (0.1A)(480000V ) − (
798000ΩRpolymer = 4The uniform resistance of the polymer must be over 4798000 Ohms in order to make sure the current is under 0.1 amps. Using the dimensions of the estimated bottle, the resistivity value of the material can be calculated.
esistivity of the materialρ = Rross section of ContainerA = Cength of the ContainerL = L
(Eq. 10)ρ = LRA
ρ = (0.48m)(4798000Ω)(π(0.05745m+0.00156m) −π(0.05745m) )2 2
621.9ohmρ = 3 *mThe polymer selected should have a resistivity higher 3621.9 ohm*m
57

Preliminary Change to Magnetic Field NeededMaterial that is affected by a magnetic field can have a force acted upon them and/or have a current induced. (Magnetic Induction)When stored in warehouses a current through the containers and falling off of shelves from magnetic forces makes it a dangerous work environment. The materials magnetic properties will be identified as qualitatively not magnetic.
Preliminary Optical transparency NeededOptical transparency is important because light passing through the container can affect the contents of the container. There are many times when the container will be exposed to sunlight and the UV radiation passing through the bottle can cause damage to the contents. It is important that the refractive index of the material is high enough to not allow and degradation to the contents of the bottle. If the refractive index is not high enough then UV radiation can pass into the contents and possibly cause the contents to break down.The bottle should also be clear. Although clear bottles do not do the best for blocking UV radiation they are the cheapest alternative. A clear bottle with a high enough refraction index will do a sufficient job to keeping UV radiation out of the contents of the container. Therefore, choosing a clear polymer will be sufficient for the container.
Preliminary Melting Temperature NeededThe melting temperature of the material is important because the container has to be able to withstand temperatures found in everyday life. The melting temperature must be higher than 171 degrees Fahrenheit, which is a temperature observed during a summer day in a car. It is important for the melting temperature to be higher than this because if the bottle were to melt it would either, bust open and release its contents, or melt into the contents causing them to be unsafe for the consumer. The melting temperature should be considerably higher than 171 degrees Fahrenheit to ensure that melting will never be an issue for the container (Thermal Properties).
CES Tables for Material Indices
58

Figure A6: Mechanical Properties in Limit of CES (CES)
Figure A7:Thermal Properties in Limit of CES (CES)
59

Figure A8: Electrical Properties in Limit of CES (CES)
Material PropertiesTable A1: Polyethylene terephthalate (PET) (CES)Property Lower limit Upper limit UnitsDensity 80.5 87.4 Lb/ft^3Price .939 1.03 USD/lbYoungs modulus 0.4 0.6 10^6 psiShear modulus 0.144 0.216 10^6 psiBulk modulus 0.718 0.754 10^6 psiYield strength 8.19 9.04 KsiTensile strength 7.01 10.5 KsiCompressivestrength
9.01 9.94 ksi
elongation 30 300 % strainFracture toughness 4.1 5.01 Ksi in^0.5Hardness (Vickers) 17 18.7 HVMelting point 413 509 Degrees FahrenheitMaximum servicetemp
152 188 Degrees Fahrenheit
Minimum servicetemp
190 99.7 Degrees Fahrenheit
Thermal conductivity 0.0797 0.0872 BTU ft/(h*ft^2*F)Specific heat 0.339 0.352 BYU/lb*FElectrical resistivity 3.3e20 3e21 Micro ohmsEmbodied energy 8.76e3 9.7e3 Kcal/lbCO2 Footprint 3.76 4.15 Lb/lbWater usage 15.1 16.8 Gal/lbRecycle YesTransparency TransparentDurability citric acid10%
Excellent
60

Durabilityphosphoric acid10%
Excellent
Durability UVradiation
good
Table A2: Polypropylene (PP) (CES)Property Lower limit Upper limit UnitsDensity 55.6 56.8 Lb/ft^3Price .871 1 USD/lbMolecularcomposition
C3H6
Youngs modulus 0.13 0.225 10^6 psiShear modulus 0.0458 0.0795 10^6 psiBulk modulus 0.363 0.377 10^6 psiYield strength 3 5.4 KsiTensile strength 4 6 KsiCompressivestrength
3.64 8.01 ksi
elongation 100 600 % strainFracture toughness 2.73 4.1 Ksi in^0.5Hardness (Vickers) 6.2 11.2 HVMelting point 302 347 Degrees FahrenheitMaximum servicetemp
212 239 Degrees Fahrenheit
Minimum servicetemp
190 99.7 Degrees Fahrenheit
Thermal conductivity 0.0653 0.0965 BTU ft/(h*ft^2*F)Specific heat 0.447 0.467 BYU/lb*FElectrical resistivity 3.3e22 3e23 Micro ohmsEmbodied energy 8.2e3 9.07e3 Kcal/lbCO2 Footprint 2.96 3.27 Lb/lbWater usage 15.46 4.94 Gal/lbRecycle YesTransparency TranslucentDurability citric acid10%
Excellent
Durabilityphosphoric acid10%
Excellent
Durability UVradiation
Poor
61

Table A3: Polyvinylchloride (tpPVC/PVC) (CES)Property Lower limit Upper limit UnitsDensity 81.2 98.6 Lb/ft^3Price .64 .703 USD/lbMolecularcompostionYoungs modulus 0.31 0.6 10^6 psiShear modulus 0.111 0.216 10^6 psiBulk modulus 0.682 0.711 10^6 psiYield strength 5.13 7.56 KsiTensile strength 5.9 9.45 KsiCompressivestrength
6.16 13 ksi
elongation 11.9 80 % strainFracture toughness 1.33 4.66 Ksi in^0.5Hardness (Vickers) 10.6 15.6 HVMelting point 413 509 Degrees FahrenheitMaximum servicetemp
140 158 Degrees Fahrenheit
Minimum servicetemp
190 99.7 Degrees Fahrenheit
Thermal conductivity 0.0849 0.169 BTU ft/(h*ft^2*F)Specific heat 0.324 0.345 BYU/lb*FElectrical resistivity 1e20 1e22 Micro ohmsEmbodied energy 6e3 6.63e3 Kcal/lbCO2 Footprint 2.37 2.62 Lb/lbWater usage 23.6 26.1 Gal/lbRecycle YesTransparency TranslucentDurability citric acid10%
Excellent
Durabilityphosphoric acid10%
Excellent
Durability UVradiation
good
Eco AuditTable A4: Material, Manufacture, End of Life (PP) (CES)
62

Table A5: Material, Manufacture, End of Life (tpPVC)(CES)
Charts and Graphs for PP
Figure A9: Energy of PP (CES)
63

Figure A10: Charts and CO2 Graphs for PP (CES)
Charts and Graphs for tpPVC
Figure A11: Energy of PVC (CES)
64

Figure A12: Charts and CO2 Graphs for PVC (CES)
Physical TestingMagnetic TestingTable A6: Magnetic Testing Raw Data in Teslas
65

Pooled Standard Deviation Sp =√((n )S n )S )/((n ) n ))1 − 1
21 + ( 2 − 1
22 1 − 1 + ( 2 − 1
t actual x )/(S ( ) t actual = ( 1 − x 2 p √(1/n ) 1/n )1 + ( 2
Mechanical TestingGraphs of Tensile Testing Stress vs. Strain Data:
66

Figure A13: PET Stress vs. Strain
Figure A14: PP Stress vs. Strain
67

Figure A15: PVC Stress vs. Strain
Figure A16: Stress vs. Strain Comparison
68

Figure A17: UV Exposed Stress vs. Strain
Figure A18: UV Exposed PVC Stress vs. Strain
69

Figure A19: UV Exposed Stress vs. Strain Comparison
70


