Embed Size (px)
Citation preview
THEARUP JOURNAL
Vol. 6 No. 4 December 1971 Published by Ove A r j p Partnership 13 Fitzroy Street, London. W1 P 6BQ
Editor: Peter Hoggett Art Editor: Desmond Wyeth F S I A Editorial Assistant: David Brown
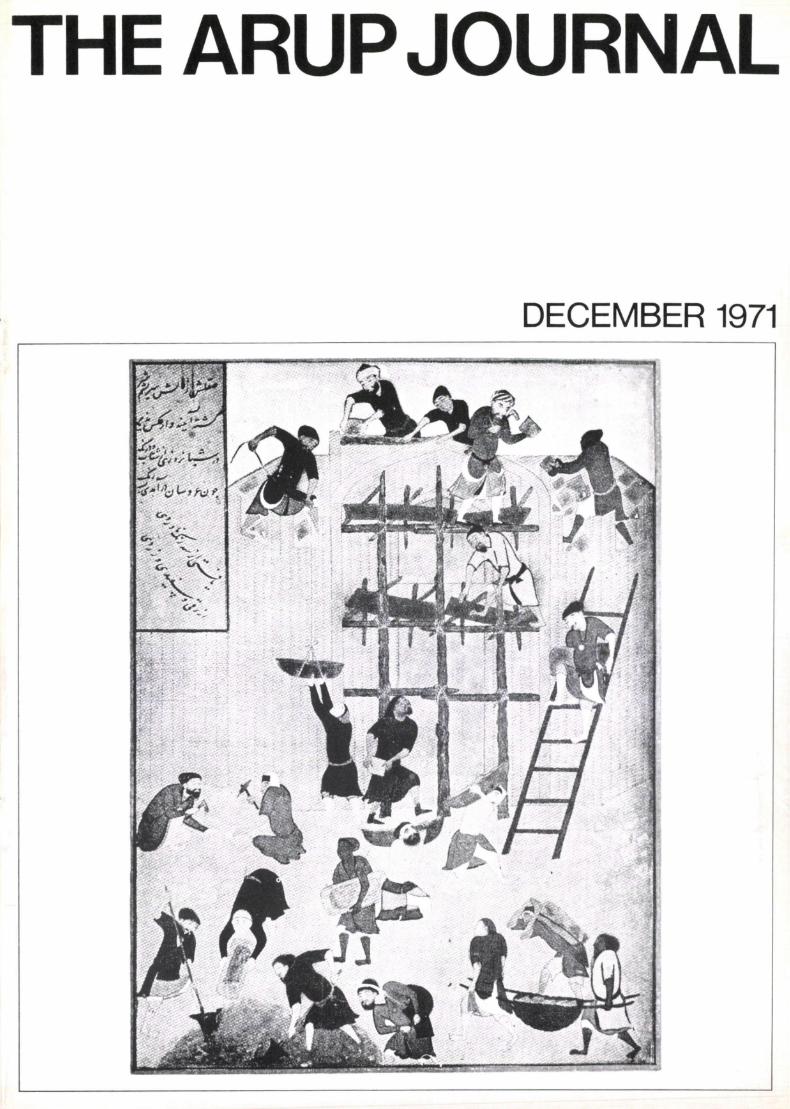
Front cover: Persian builders at work (From a Persian MS. , about A D 1494) Reproduced wi th the permission of the British Museum.
Back cover: Interior of the arch of the Shahyad Ariamehr (Photo: Duncan Michael)
The Shahyad Ariamehr pedestrian underpass John Harvey, Robert Afia and Peter Evans A r c h i t e c t s : H o s s e i n A m a n a t and A s s o c i a t e s
Ma in C o n t r a c t o r : M A P C o m p a n y
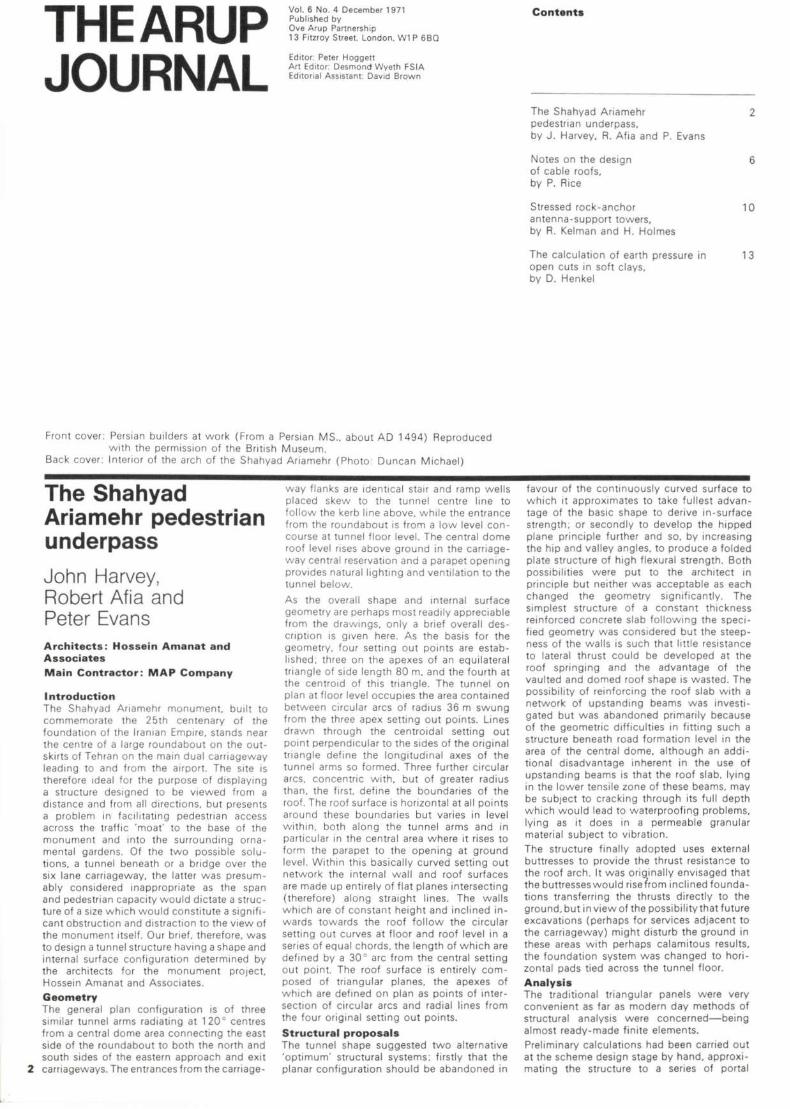
In t roduct ion The Shahyad Ariamehr monument, built to commemorate the 25th centenary of the foundation of the Iranian Empire, stands near the centre of a large roundabout on the outskirts of Tehran on the main dual carr iageway leading to and from the airport. The site is therefore ideal for the purpose of displaying a structure designed to be v iewed from a distance and from all directions, but presents a problem in facilitating pedestrian access across the traffic 'moat' to the base of the monument and into the surrounding ornamental gardens. Of the two possible so lutions, a tunnel beneath or a bridge over the six lane carr iageway, the latter w a s presumably considered inappropriate as the span and pedestrian capacity would dictate a structure of a size wh ich would constitute a significant obstruction and distraction to the v iew of the monument itself. Our brief, therefore, w a s to design a tunnel structure having a shape and internal surface configuration determined by the architects for the monument project. Hossein Amanat and Associates. G e o m e t r y The general plan configuration is of three similar tunnel arms radiating at 120° centres from a central dome area connect ing the east side of the roundabout to both the north and south sides of the eastern approach and exit
2 carr iageways. The entrances from the carriage
w a y flanks are identical stair and ramp wel ls placed skew to the tunnel centre line to fol low the kerb line above, whi le the entrance from the roundabout is from a low level con course at tunnel floor level. The central dome roof level rises above ground in the carriageway central reservation and a parapet opening provides natural lighting and ventilation to the tunnel below.
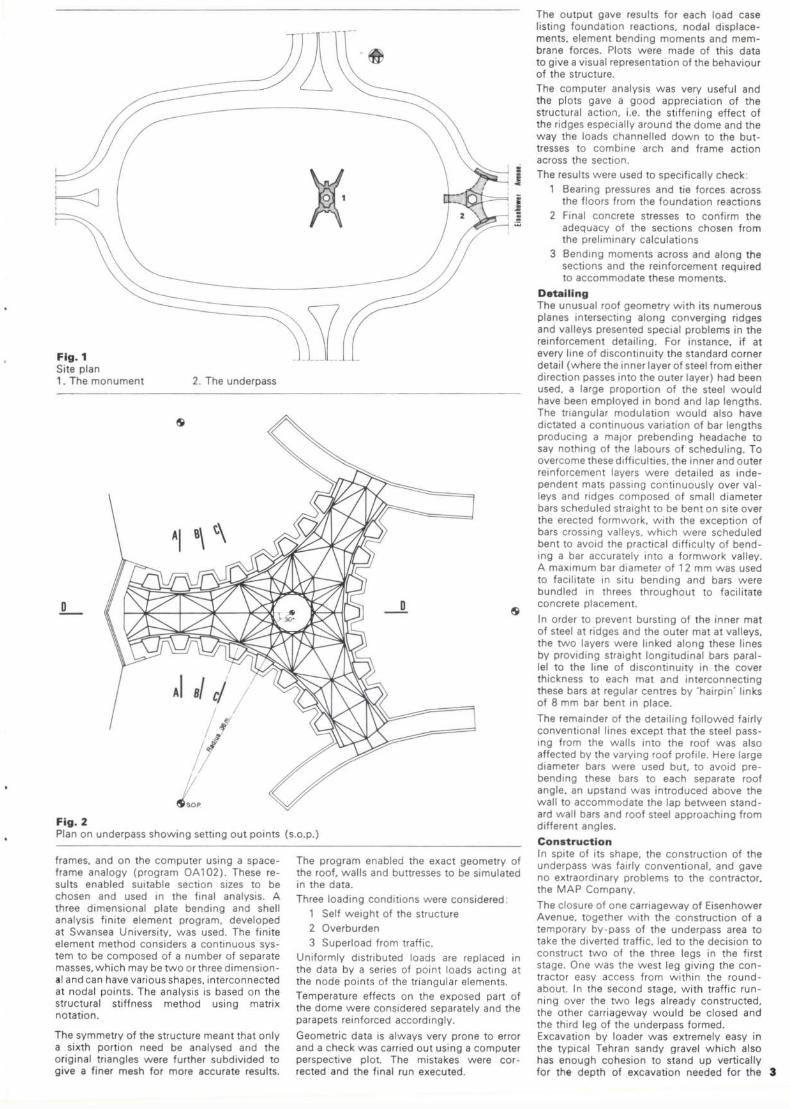
As the overall shape and internal surface geometry are perhaps most readily appreciable from the drawings, only a brief overall description is given here. As the basis for the geometry, four setting out points are establ ished; three on the apexes of an equilateral triangle of side length 80 m, and the fourth at the centroid of this triangle. The tunnel on plan at floor level occupies the area contained between circular arcs of radius 36 m swung from the three apex setting out points. L ines drawn through the centroidal setting out point perpendicular to the sides of the original triangle define the longitudinal axes of the tunnel arms so formed. Three further circular arcs, concentr ic wi th, but of greater radius than, the first, define the boundaries of the roof. The roof surface is horizontal at all points around these boundaries but varies in level wi thin, both along the tunnel arms and in particular in the central area where it rises to form the parapet to the opening at ground level. Within this basical ly curved setting out network the internal wal l and roof surfaces are made up entirely of flat planes intersecting (therefore) along straight l ines. The wa l ls wh ich are of constant height and incl ined inwards towards the roof fo l low the circular setting out curves at floor and roof level in a series of equal chords, the length of wh i ch are defined by a 30° arc from the central setting out point. The roof surface is entirely composed of triangular planes, the apexes of wh i ch are defined on plan as points of intersection of circular arcs and radial lines from the four original setting out points.
S t r u c t u r a l p r o p o s a l s The tunnel shape suggested two alternative 'opt imum' structural systems; firstly that the planar configuration should be abandoned in
C o n t e n t s
The Shahyad Ariamehr 2 pedestrian underpass, by J . Harvey, R. Afia and P. Evans
Notes on the design 6 of cable roofs, by P. Rice
Stressed rock-anchor 10 antenna-support towers, by R. Kelman and H. Holmes
The calculation of earth pressure in 1 3 open cuts in soft c lays, by D. Henkel
favour of the continuously curved surface to wh i ch it approximates to take fullest advantage of the basic shape to derive in-surface strength; or secondly to develop the hipped plane principle further and so, by increasing the hip and valley angles, to produce a folded plate structure of high flexural strength. Both possibilities were put to the architect in principle but neither w a s acceptable as each changed the geometry significantly. The simplest structure of a constant thickness reinforced concrete slab fol lowing the speci fied geometry w a s considered but the steepness of the wal ls is such that little resistance to lateral thrust could be developed at the roof springing and the advantage of the vaulted and domed roof shape is wasted. The possibility of reinforcing the roof slab wi th a network of upstanding beams w a s investigated but w a s abandoned primarily because of the geometric difficulties in fitting such a structure beneath road formation level in the area of the central dome, although an additional disadvantage inherent in the use of upstanding beams is that the roof slab, lying in the lower tensile zone of these beams, may be subject to cracking through its full depth wh ich would lead to waterproofing problems, lying as it does in a permeable granular material subject to vibration. The structure finally adopted uses external buttresses to provide the thrust resistance to the roof arch. It w a s originally envisaged that the buttresses would risefVom inclined foundations transferring the thrusts directly to the ground, but in v iew of the possibility that future excavat ions (perhaps for services adjacent to the carr iageway) might disturb the ground in these areas wi th perhaps calamitous results, the foundation system w a s changed to horizontal pads tied across the tunnel floor. A n a l y s i s
The traditional triangular panels were very convenient as far as modern day methods of structural analysis were concerned—being almost ready-made finite elements. Preliminary calculat ions had been carried out at the scheme design stage by hand, approximating the structure to a series of portal
C o n c l u s i o n The method developed in the paper appears to give good agreement between calculated and measured values of earth pressure where plastic zones develop below the base of the excavat ion for the four sites for wh i ch data are available. Further field data wi l l be required to substantiate the method over a wider range of condit ions but the new approach should assist the engineers in the design of excava tions in soft c lays. R e f e r e n c e s ( 1 ) B J E R R U M . L and E I D E , O. Stabil ity of strutted excavat ions in clay. Geotechnique, 6 ( 1 ) . pp. 3 2 - 4 7 . March 1 956. (2 ) S K E M P T O N . A. W. The bearing capacity of c lays. Bui lding Research Congress. London. Papers presented in Division 1 . pp. 1 8 0 - 1 8 9 , 1 9 5 1 .
(3) F L A A T E . K. S . Stresses and movements in connect ion wi th braced cuts in sand and clay. Ph.D Thes is . University of Ill inois, 1966. (4 ) T E R Z A G H I , K. and P E C K . R. B. Soil mechanics in engineering practice. 2nd edition, J o h n Wiley. 1967. (5 ) P E C K , R. B. State of the art report on deep excavat ions and tunnell ing in soft ground. Proceedings of the Seventh International Conference on Soi l Mechanics and Foundation Engineering, Mexico. State of the Art Volume pp. 2 2 5 - 2 9 0 , 1 969. (6 ) N O R W E G I A N G E O T E C H N I C A L I N S T I T U T E . Technical Report No. 6. Measurements at a strutted excavat ion. Oslo Subway . Vater-land 1 . km. 1.373. The Institute, 1962. (7 ) N O R W E G I A N G E O T E C H N I C A L I N S T I T U T E . Technical Report No. 7. Measurements at a strutter excavat ion, Oslo Subway . Vater-land 2. km. 1.408. The Institute, 1962.
(8 ) N O R W E G I A N G E O T E C H N I C A L I N S T I T U T E . Technical Report No 8. Measurements at a strutted excavat ion. Oslo Subway . Vater-land 3. km. 1.450. The Institute. 1962.
(9 ) R O D R I G U E Z , J . M. and F L A M O N D ; C . L. Strut loads recorded in a deep excava tion in clay. Proceedings of the Seventh In ternational Conference on Soil Mechanics and Foundation Engineering. Mexico, pp. 4 5 9 - 4 6 8 , 1969 .
CT.VM.UA
> C - 2 6 t / m !
underpinning piles
C b = 2 5 t / n V
Tlr, I BedrockTH"**T^L
Vater I and 2 IN G I Tech Report No 7 I 9 6 2 I
F i g . 5 Section through excavation at Vaterland 2
AWA.WAWAA 2 3 m
I f > 2 1 t / m 2
C b = 1 6 t / m 2
M e x i c o C i t y (Rodr iguez and F l t m a n d 1969 )
F i g . 6 Section through excavation in Mexico City
15
\ \
\ \
\ \
\
> <
F i g . 3 Unloading adjacent to excavat ion
is the undrained shear strength of the clay below the base of the excavat ion.
Now W (HdV2 + IH2) y
where y is the density of the soil above the base of the foundation excavat ion and
P. = UyH2 -2c.H) + dV2 {yH - (2 + n) c„)
or fol lowing Terzaghi and Peck
Pt i 4c \ 2 V 2 . d
In some excavat ions, local unloading adjacent to the cut has been carried out. but to be completely effective in reducing the apparent depth of cut, the local unloading wi l l have to go much further than the distance of about H which is normal practice. Th is case is considered in Fig. 3. The appropriate equation for K„ may be developed as before and is
2dV2
H
A / /
H P. 1 4c \
K. = = 1 iyH2 \ yH I
i (2 + n) c„\
( ' — = - )
H ( 1 + •
I D
H + ( A H / 2 )
dV2
2c AH
/ yH
i 2c AH \ l 5.14 + — . .
V C„ dy/ll J The term (1 - (Ac/yH)) represents the conventional value of Ka from Bell 's equation. The second term, wh i ch must be positive, indicates that when (yH/cb) > 5.14 there wi l l be an added component of earth pressure. AK..
The value of d to be used in the calculat ions wi l l depend on the local stratigraphy. If the depth of the Prandtl zone is limited by a strong stratum, as shown in Fig. 2, the appropriate value of d wi l l be the depth of the strong stratum below the bottom of the e x c a vation.
The inclusion of the plastic zone below the excavat ion into the deformation mechanism indicates that ground movements are likely to extend to a much greater distance from the edges of the excavat ion than would be expected if only movement above the base of the excavat ion is included.
(2 ) The second term may not be negative and x cannot be greater than d\/2 + H + (AH/2). In order to illustrate the magnitude of the effect
of plastic zones developing below the e x c a vation f low, the values of the second term in equation (1 ) i.e.
2<V2
H 1
(2 + x )
yH wh ich represents AK„. or the increase over the value found from Bel l 's equation, have been evaluated and are plotted in Fig. 4. The range covered is for (yH/cb) from 5.14 to 8.0 and for (d/H) from 0 to 1 . It wi l l be seen that for the higher values of (yH/cb) and (d/H) the value of AKa becomes very significant. A p p l i c a t i o n Three of the instrumental sect ions on the Oslo Subway , known as Vaterland 1 , 2 & 3 were located in areas where the values of (yH/cb) were greater than 5.14 and the methods outlined above have been applied to the calculation of the earth pressures. The details of the field measurements are given in Technical Reports Nos. 6, 7, 8 of the Norwegian Geotechnical Institute 6 - 8 wh i le some of the data have been interpreted by F laa te 3 . In the calculat ions that fol low Flaate's value for c. the average shear strength above the base of the excavat ion has been used together wi th his values for the measured K„. The va lues of c „ . the shear strength in the plastic zone beneath the excavat ion, have been estimated from the data in the Techn ica l Reports of the Norwegian Geotechnical In stitute. A section through the Vaterland I excavation is shown in Fig. 5 whi le the relevant field data and calculated and measured values of K. are tabulated in Table 1 . The other site in wh ich the condit ions covered by the paper apply is in Mexico City and has been described by Rodriguez and F lamond 9 . The section is shown in Fig. 6 and the field data and values of K„ are given in Table I. The agreement between the values of K, calculated by the new method and those measured is satisfactory. For comparison, the values of K. found from Bel l 's equation are included in the table and. as can be seen, the differences between these values and those measured are very important.
o V
1= / V / ^ I ^ * -
1
F i g . 4 Variation of AKa with N and (d/H)
Tab le 1
Site d m
H m
AH m
X m
y tonnes m 3
c tonnes m 2
C , tonnes m 2
measured
K. calc. ( A ) *
ca lc . ( B ) '
Vaterland 1 5.2 10.4 — — 1.89 2.6 2.7 0.88 0.89 0.47
Vaterland 2 6.4 10.7 — 1.89 2.6 2.5 1.12 1.06 0.49
Vaterland 3 8.1 9.2 2 8 9.4 1.90 2.9 3.5 0.92 0.90 0.34
Mexico City 5.0 9.0 2.3 11.0 1.22 2.1 1.6 0.66 - 0 . 8 0
0.79 0.23
*A Proposed new method * B Bel l 's equation
F i g . 1 Site plan 1 . The monument 2. The underpass
F i g . 2 Plan on underpass showing setting out points (s.o.p.)
frames, and on the computer using a space-frame analogy (program O A 1 0 2 ) . These results enabled suitable section sizes to be chosen and used in the final analysis. A three dimensional plate bending and shell analysis finite element program, developed at Swansea University, w a s used. The finite element method considers a continuous sys tem to be composed of a number of separate masses, wh i ch may be two or three dimensional and can have various shapes, interconnected at nodal points. The analysis is based on the structural stiffness method using matrix notation.
The symmetry of the structure meant that only a sixth portion need be analysed and the original triangles were further subdivided to give a finer mesh for more accurate results.
The program enabled the exact geometry of the roof, wa l ls and buttresses to be simulated in the data. Three loading condit ions were considered:
1 Self weight of the structure 2 Overburden 3 Superload from traffic.
Uniformly distributed loads are replaced in the data by a series of point loads acting at the node points of the triangular elements. Temperature effects on the exposed part of the dome were considered separately and the parapets reinforced accordingly.
Geometric data is a lways very prone to error and a check w a s carried out using a computer perspective plot. The mistakes were corrected and the final run executed.
The output gave results for each load case listing foundation reactions, nodal displacements, element bending moments and membrane forces. Plots were made of this data to give a visual representation of the behaviour of the structure. The computer analysis w a s very useful and the plots gave a good appreciation of the structural action, i.e. the stiffening effect of the ridges especially around the dome and the w a y the loads channel led down to the buttresses to combine arch and frame action across the section. The results were used to specif ically check:
1 Bearing pressures and tie forces across the floors from the foundation reactions
2 Final concrete stresses to confirm the adequacy of the sect ions chosen from the preliminary calculat ions
3 Bending moments across and along the sections and the reinforcement required to accommodate these moments.
Deta i l ing The unusual roof geometry wi th its numerous planes intersecting along converging ridges and valleys presented special problems in the reinforcement detailing. For instance, if at every line of discontinuity the standard corner detail (where the inner layer of steel from either direction passes into the outer layer) had been used, a large proportion of the steel wou ld have been employed in bond and lap lengths. The triangular modulation would also have dictated a continuous variation of bar lengths producing a major prebending headache to say nothing of the labours of schedul ing. To overcome these difficulties, the inner and outer reinforcement layers were detailed as independent mats passing continuously over va l leys and ridges composed of small diameter bars scheduled straight to be bent on site over the erected formwork, wi th the exception of bars crossing val leys, wh ich were scheduled bent to avoid the practical difficulty of bending a bar accurately into a formwork valley. A maximum bar diameter of 1 2 mm w a s used to facilitate in situ bending and bars were bundled in threes throughout to facilitate concrete placement.
In order to prevent bursting of the inner mat of steel at ridges and the outer mat at val leys, the two layers were linked along these lines by providing straight longitudinal bars parallel to the line of discontinuity in the cover thickness to each mat and interconnecting these bars at regular centres by 'hairpin' l inks of 8 mm bar bent in place.
The remainder of the detailing fol lowed fairly conventional lines except that the steel passing from the wal ls into the roof w a s also affected by the varying roof profile. Here large diameter bars were used but, to avoid prebending these bars to each separate roof angle, an upstand w a s introduced above the wal l to accommodate the lap between standard wal l bars and roof steel approaching from different angles.
C o n s t r u c t i o n In spite of its shape, the construction of the underpass w a s fairly convent ional, and gave no extraordinary problems to the contractor, the M A P Company.
The closure of one carr iageway of Eisenhower Avenue, together wi th the construction of a temporary by-pass of the underpass area to take the diverted traffic, led to the decision to construct two of the three legs in the first stage. One w a s the wes t leg giving the con tractor easy access from within the roundabout. In the second stage, wi th traffic running over the two legs already constructed, the other carr iageway would be closed and the third leg of the underpass formed. Excavat ion by loader w a s extremely easy in the typical Tehran sandy gravel w h i c h also has enough cohesion to stand up vertically for the depth of excavat ion needed for the 3
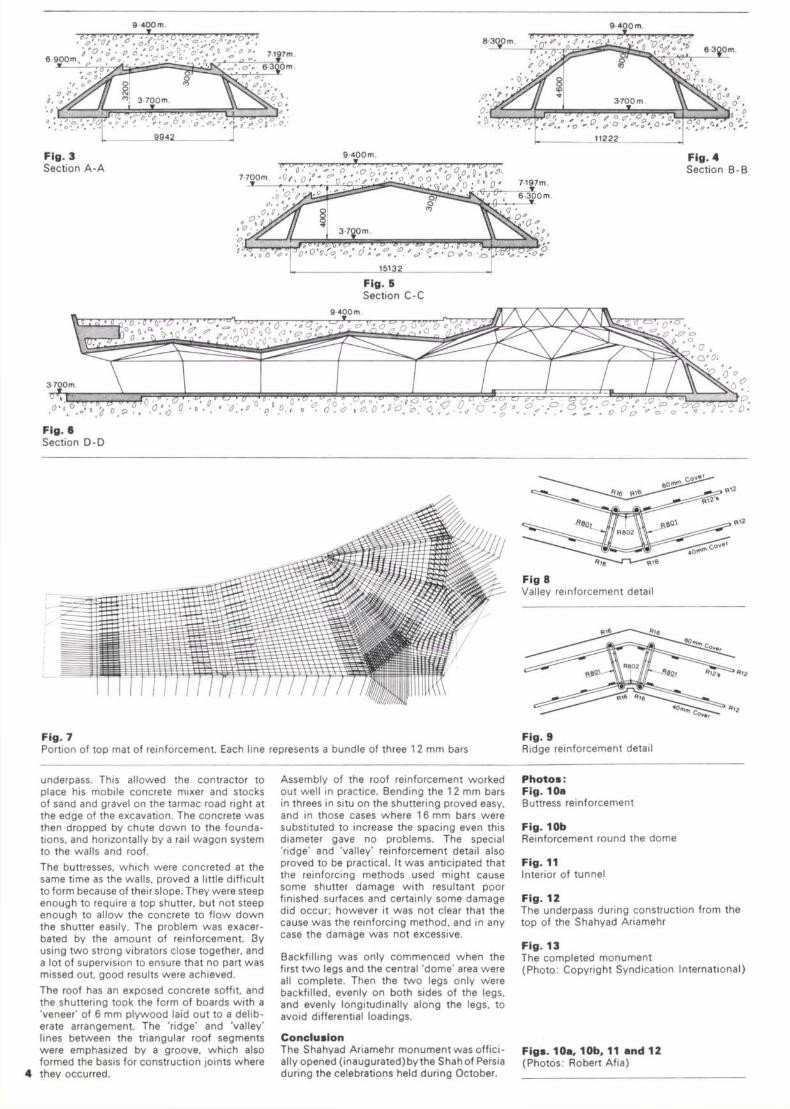
F i g . 3 Sect ion A - A •
7 7 0 0 m . . 0 / , Q 7197m c 6 3 0 0 m
3-700m i i
n'O o'a '<? 0
F i g . 4 Sect ion B - B
1 5 1 3 2
F i g . 5 Section C - C
9 4 0 0 m
" r 2 '0* oQ v "3 r
C V 0.
3 700m • ' • ' T " ' " — - — —-- — • —
f -1 C I • 5 U a 0 - s 0 0 5
F i g . 6 Sect ion D-D
••••• m m i i V r
:•!!
F i g . 7 Portion of top mat of reinforcement. Each line represents a bundle of three 1 2 mm bars
underpass. Th is al lowed the contractor to place his mobile concrete mixer and stocks of sand and gravel on the tarmac road right at the edge of the excavat ion. The concrete w a s then dropped by chute down to the foundations, and horizontally by a rail wagon system to the wal ls and roof.
The buttresses, wh ich were concreted at the same time as the wal ls , proved a little difficult to form because of their slope. They were steep enough to require a top shutter, but not steep enough to al low the concrete to f low down the shutter easily. The problem w a s exacerbated by the amount of reinforcement. 3y using two strong vibrators close together, and a lot of supervision to ensure that no part w a s missed out, good results were achieved.
The roof has an exposed concrete soffit, and the shuttering took the form of boards wi th a 'veneer' of 6 mm plywood laid out to a deliberate arrangement. The 'ridge' and 'val ley' l ines between the triangular roof segments were emphasized by a groove, w h i c h also formed the basis for construction joints where
4 they occurred.
Assembly of the roof reinforcement worked out wel l in practice. Bending the 1 2 mm bars in threes in situ on the shuttering proved easy, and in those cases where 1 6 mm bars were substituted to increase the spacing even this diameter gave no problems. The special 'ridge' and 'valley' reinforcement detail also proved to be practical. It w a s anticipated that the reinforcing methods used might cause some shutter damage wi th resultant poor f inished surfaces and certainly some damage did occur; however it w a s not clear that the cause w a s the reinforcing method, and in any case the damage w a s not excess ive.
Backfi l l ing w a s only commenced when the first two legs and the central 'dome' area were all complete. Then the two legs only were backfi l led, evenly on both sides of the legs, and evenly longitudinally along the legs, to avoid differential loadings.
C o n c l u s i o n The Shahyad Ariamehr monument w a s off icially opened ( inaugurated)by the Shah of Persia during the celebrations held during October.
a -« 8 0 ,
GO
F ig 8 Valley reinforcement detail
Co ...
F i g . 9 Ridge reinforcement detail
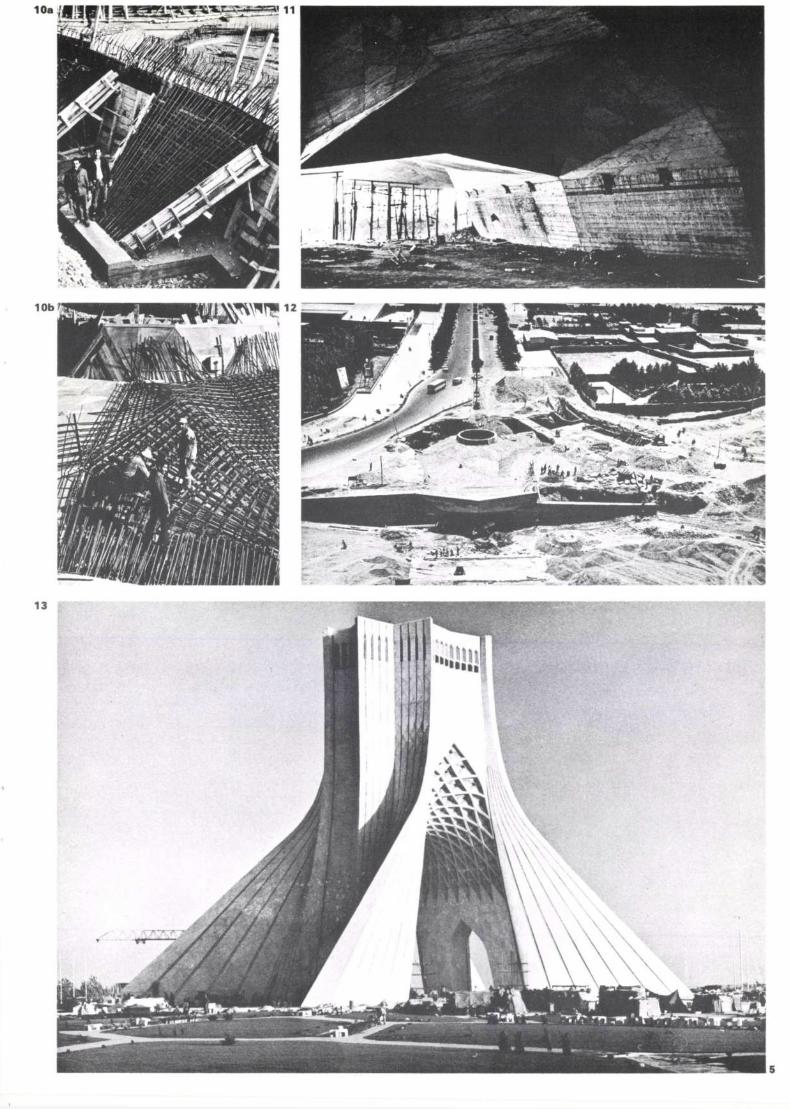
P h o t o s : F i g . 10a
Buttress reinforcement
F i g . 10b
Reinforcement round the dome
F i g . 11
Interior of tunnel
F i g . 12 The underpass during construction from the top of the Shahyad Ariamehr F i g . 13 The completed monument (Photo: Copyright Syndicat ion International)
F i g s . 10a , 10b, 11 and 12 (Photos: Robert Af ia)
The calculation of earth pressure in open cuts in soft clays David Henkel I n t roduc t ion The weight of the soil on either side of an open cut acts as a surcharge on the ground at the level of the base of the excavat ion. In clays the maximum possible depth of the e x c a vation, even if the strutting is adequate, is limited by base failure when the bottom of the cut heaves up into the excavat ion.
Bjerrum and Eide ' showed that base failure could be predicted with reasonable accuracy by treating the situation as the inverse of the normal foundation bearing capacity problem using the bearing capacity factors proposed by Skempton 2 . These factors, wh ich depend on the geometry of the excavat ion, vary between about 6 and 8 for normal excavat ions. The critical depth of excavat ion, Hc, at wh i ch base failure wi l l take place may be expressed as:
An index of the extent to wh ich the excava tion is approaching base failure is given by the dimensionless number
Hc = cbNc
where cb is the undrained strength of the clay beneath the excavation floor
Nc is the bearing capacity factor and y is the bulk density of the soil in wh ich the excavat ion is made.
N = yH
which cannot exceed Nc or col lapse wil l take place. As N increases above about 5, significant plastic deformations develop below the base of the excavat ion and experience has shown that the force P., due to earth pressures that have to be carried by the strutting system, becomes much greater than those computed by the normal procedures using Bel l 's equation
viz. P. = iyH2 - 2cH
where c is the undrained strength of the clay behind the face of the excavat ion.
The published methods for handling this problem are empirical ( F l a a t e 3 ; Terzaghi and P e c k 4 ) . In his General Report to the Mexico City Conference. P e c k 5 suggested that, as an expedient, pending the development of the appropriate theoretical treatment, a reduced value of the shear strength of the clay behind the wal l should be used in Bel l 's equation namely
P. = \yH2 - 2 mcH where
m < 1
For the two groups of field observations available Peck found that a value of m of 0.4 gave agreement wi th the field measurements for the sites in question in Oslo and Mexico City.
In order to provide a more satisfactory method of handling this problem the writer has de
veloped the theoretical treatment described below. T h a o r e t i c a l t rea tment The theoretical treatment is based on the development of plastic Prandtl zones beneath the floor of the excavation and is illustrated in Fig. 1 for a long excavat ion of depth H and width B. Where bedrock is at a distance greater than B/\/2 below the base of the excavat ion, the whole of the excavation width is involved in the plastic zone, as shown in Fig. 1 . If, however, the bedrock surface is closer than S / V 2 , the dimensions of the plastic zone are controlled by the distance, d. from the base of the excavat ion to bedrock as shown in Fig. 2. The potential failure mechanism involves the sliding of the mass of soil above the base of the excavation on a plane inclined at 45 ° to the horizontal and this sliding plane merges wi th the Prandtl zone beneath the base of the excavat ion as shown in Fig. 1. The total force P„ required to prevent the material from sliding wi th this mechanism may be found from the principle of virtual work. The kinematics require that if the vertical movement of the soil mass above the base of the excavat ion is S. the movement on the sl iding surface is 8\/2 and P. is pushed back by S. The work done in the system may be written as fo l lows: WS = P.6 + HV2 . SV2 . c + (2d. 6^2 + nd. 8y/2) c„ where W is the weight of the sliding soil mass above
the base of the excavat ion c is the undrained shear strength of the clay
above the base of the excavation
\ \
\ \
d = B / I 7
F i g . 1 Proposed failure mechanism
F i g . 2 Failure mechanism limited in depth by a layer of bed-rock
///. II I Tow«f L m
.. .
Touso.1
\ Concreti / Footing
\ 9 Oiam Pile \ \ /
60" We.ghl of con* of rock to balanc.
60" uplift force
F i g . 2 Anchor footing, general detail
F i g . 3 r ight A completed tower
agreed that these levels would be adequate to achieve the route performance required and also facilitate any late changes in reflector levels indicated by propagation tests.
At each level, platform steelwork w a s designed to suit the face or faces on wh ich reflectors were to be mounted. These platforms connected with the tower access ladder wh i ch had full rest platforms at a maxi mum spacing of 1 5 m. All tower bracing w a s proportioned to resist shear forces wh ich would result from reflectors at any level, independently of the actual usage.
W a v e g u i d e r u n s The type of waveguide used on this system. 145 mm x 68 mm elliptical, although flexible, placed considerable constraints on tower arrangements. On its H-plane axis the wave guide has a bending radius of 1.55 m, wh ich is signif icant compared with the total tower width of 2.4 m at the top of the structure. Moreover, each antenna had a specif ied polarization wh ich determined wh ich axis of the ellipse w a s horizontal.
The vertical waveguide runway w a s placed on the outside of the tower. Th is reduced difficulties in hauling the waveguide off the drums compared to that wh i ch would have been experienced wi th the normal w a v e guide run inside the structure. It also made the full tower width available for bends. Although the heights of many reflectors were known at the time of detailing steelwork, their polarization w a s not and waveguide bends could not be predetermined to establish the position of a reflector on the pair of horizontal mounting bars used to support it. It w a s therefore decided that mounting bars should be provided wi th holes to permit reflectors to be mounted at positions variable in 50 mm steps across the tower face.
Finally, it w a s necessaiy to design ancil lary supporting steelwork for a horizontal w a v e guide gantry between the tower and the shelters and to support the final bends in the waveguide to the reflectors at 1 m maximum spacing. The former w a s standardized into a
few simple component structures, but the latter had extensive provision for adjustment on site. E r e c t i o n T w o tower erection crews were employed, each wi th mobile camping arrangements as for the foundation c rews. Erection of steelwork to approximately 45 m height w a s done wi th a 27 ton mobile crane, having a total jib length of 49 m. Above this height, erection w a s done wi th an aluminium floating jib. The average erection time for a 76 m tower w a s six days. C o n c l u s i o n Notwithstanding the decision to adopt a completely new type of foundation requiring extensive preliminary development, all tower structures were finally erected within the intended time. By approaching the formidable problems of logistics and establishment in this difficult area in a proper manner, it w a s demonstrated that modern techniques could be employed on both foundations and tower structures with very favourable results.
•
S
On technical grounds, there is no doubt that the departure from the type of foundation traditionally accepted for towers has proved to be successfu l . It is effective, simple and quick to construct, adaptable to varied site condit ions (subject only to certain overriding requirements) and lends itself to the efficient organization of site labour, in that tower erection and foundation work can be done quite separately by special ist gangs. The end result is that the rock-anchor form of construction can give a considerable saving in both money and time over the traditional mass-foot ing method. Geological survey information is essential to establish that suff i cient number of the prestressed foundations can be constructed to justify the cost of mobilization of the special ized equipment required. In this case, the original assessment w a s that 48 out of the 58 sites would be suitable. In fact only 40 proved to be so, although the experience subsequently gained indicates that at least some of the eight might have been stressed foundations. It w a s particularly disadvantageous that the majority of these eight sites were in the most remote areas where the saving of transport costs for the great quantities of material for the mass footings would have given the stressed footings their greatest savings.
As a result of the standardized tower design erection costs, placing heavy emphasis on mechanical equipment, produced results wh ich compared very favourably wi th those achieved in erecting similar structures in much more hospitable locations. Appendix D e s i g n s t r e s s e s Concrete 20.7 N / m m 2 in bases.
27.6 N / m m 2 in piles. Grout 17.2 N / m m 2 . Cables At design working loads equiva
lent to 44 .7m/s w ind speed: 60% minimum guaranteed ultimate tensile strength.
Bond s t ress—Des ign loads Cables 0.97 N / m m 2
Concrete to rock 0.76 N / m m 2
Stressing values
Initial stress = 8 5 % ultimate strength of cables Check restress = 7 5 % ultimate strength of cables Minimum residual stress = 6 0 % ultimate strength of cables: and is the minimum permanent stress and thus equals the design w ind load uplift for the tower, increased by a factor wh ich depended on the overturning moment at the base. Due to the fact that cables were used in groups of 6, 8, 10 or 12, these increments did not exactly match the uplift forces for different tower heights and there w a s frequently an excess of cable capacity in the smaller towers.
Thus minimum ultimate load factor = 1.67.
'This article originally appeared in The Telecommunicat ion Journal of Austral ia. Bob Kelman works in our Sydney office: Harry Holmes is employed by Electric Power Transmissions, Pty. Ltd.
10a
'1.
!
>
4 T T I A I 2£A
1 0 b ' •V
. •
-
3E I
N O
•3
M i
(
Notes on the design of cable roofs Peter Rice This paper was given at the International Association for Shell Structures Pacific Symposium; Part 2: Tension structures and space frames, which was held in Tokyo and Kyoto. Japan. 17-23 October, 1971.
S u m m a r y The design of cable roofs consists of speci fying a compatible geometry, choosing the right materials and designing all the bits and pieces. All designers have an attitude towards the things they design. Th is paper describes the attitude of one designer. It describes how three unsymmetrical cable roof geometries were defined without the use of models. It describes the evolution of the geometrical shape of the third roof and it d iscusses the factors wh ich govern the selection of manufacturing tolerances, the choice between rope and strand and the design of fittings. It starts from the premise that cable roofs are meant to be flexible and that they should be specified exactly for manufacture.
I n t roduc t ion What does design mean? It is essential to define at least approximately what one means by the design of cable roofs before there can be a meaningful d iscussion. The designer, faced with a problem, starts wi th an attitude. This attitude is the product of his experience and his interpretation of it. When one wri tes a paper entitled 'Notes on the design of cable roofs' one is codifying an attitude, selecting those experiences wh ich have formed it, and describing how and w h y they have relevance to the general problems. There is, of course, a body of fact. The Young 's modulus of steel rope is a fact. Whether or not rope is a more suitable material than spiral steel strand is in the end an attitude. The answer wi l l vary from problem to problem and from designer to designer. There are other factors in the design process wh ich cannot be codif ied: imagination and flair are two. These are not the subject of this paper. One asks again, and now wi th particular reference to cable roofs, what does design mean ?
It means defining a geometry that is economic and feasible, a geometry wh ich exists and wil l resist the applied loads in a reasonable fashion, without local soft points, wi thout high stress concentrations. There are, of course, simple geometries, where there is little problem. It is the more complex geometries
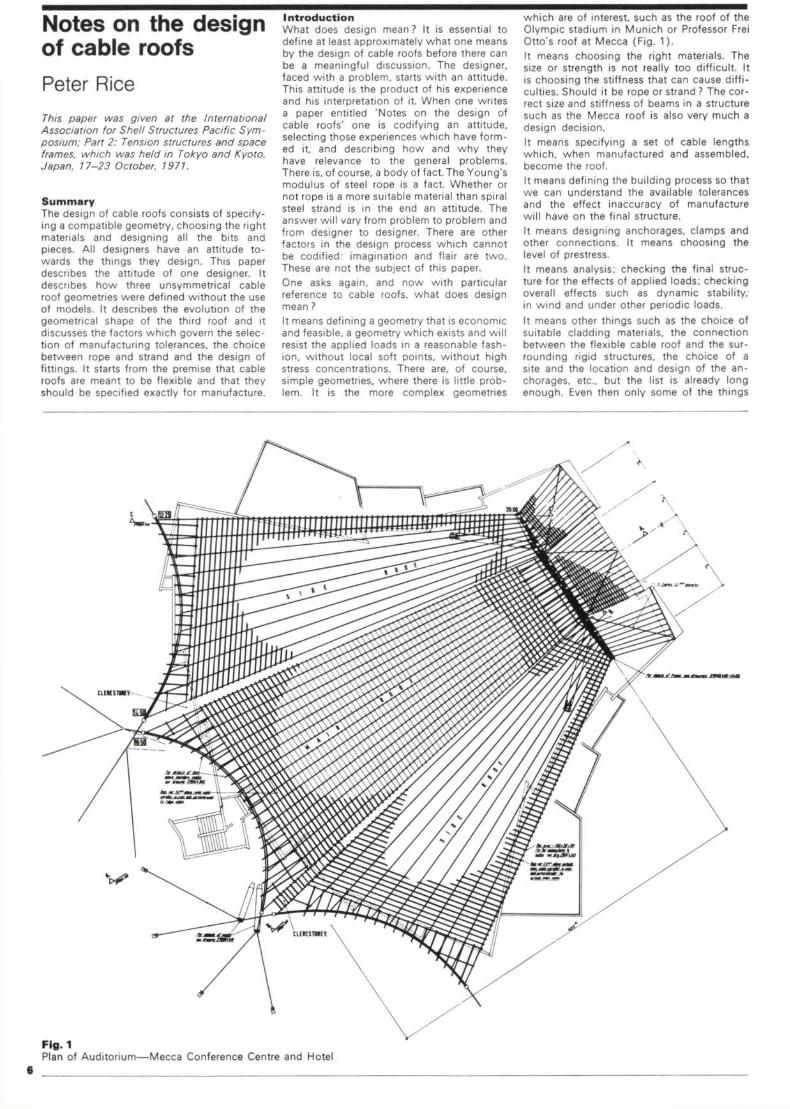
w h i c h are of interest, such as the roof of the Olympic stadium in Munich or Professor Frei Otto's roof at Mecca (F ig . 1 ) . It means choosing the right materials. The size or strength is not really too difficult. It is choosing the sti f fness that can cause diff icult ies. Should it be rope or strand ? The correct size and stiffness of beams in a structure such as the Mecca roof is also very much a design decision. It means specifying a set of cable lengths w h i c h , when manufactured and assembled, become the roof. It means defining the building process so that we can understand the available tolerances and the effect inaccuracy of manufacture wi l l have on the final structure. It means designing anchorages, c lamps and other connect ions. It means choosing the level of prestress.
It means analysis: checking the final structure for the effects of applied loads; checking overall effects such as dynamic stabil ity; in w ind and under other periodic loads.
It means other things such as the choice of suitable cladding materials, the connect ion between the flexible cable roof and the surrounding rigid structures, the choice of a site and the location and design of the a n chorages, etc., but the list is already long enough. Even then only some of the things
\
CifKSiBMY
\
V * * * * * * *
*» -r v -
SBSMa km w B -3 a £
•
CLEIEITMEY £ C M E
F i g . 1 Plan of Aud i to r ium—Mecca Conference Centre and Hotel
Tower leg
Packed M o r t a r V ^ ^ ^ 7 _ Tower Base Plate
Levelling Nuts H.D. Bolts Stressing Anchor Concrete Stressing Plate Adjusting Nuts for I J R est r ess infl
yBolt Template
Stressing Cables
4' Drilled Cable Duct
Steel Pipe Slip Joint Lining
Pile Concrete
Reinforcement Guide
F i g . 1 Connect ion to tower leg
although the South Australian section had 650 km of deeply pot-holed roads. However, the logistics of construction remained formidable. Concrete aggregates were carried from Ceduna and Kalgoorlie wi th a maximum distance between source and site of 800 km. Water w a s carried in 11,000 litre collapsible rubber tanks up to 650 km from Norseman and Ceduna. Cement w a s brought up to 1 600 km by road from Adelaide and Perth. It w a s necessary to maintain a stable and skilled labour force in this isolated area for more than a year when even daily variations in climate were from 50°C wi th wind and dust, to cold, wet winds from the Antarct ic Ocean. E P T decided to use completely mobile air-conditioned camps to be towed by con struction vehicles from site to site. The standard complex consisted of a 1 3 m messing and kitchen unit, a 6.7 m bathroom and toilet unit wi th pressurized hot water, a 6.7 m office and and foreman's accommodation and two 6.7 m sleeping units. Electric power w a s provided by a 75 kw generator. Such camps accommodated up to 17 men.
A s far as w a s possible, construction fol lowed an eight day cyc le , six or seven days work and a day moving camp to the next site. Stressing w a s carried out after one week and the re-stressing check and final grouting a week later again. Planning al lowed for a second stressing operation should the restress check indicate a loss of prestress to below 60% of the cable capacity.
Once camp w a s established on site, work proceeded approximately to the fol lowing sequence: Day 1 Survey, setting out. excavation
Day 2 Position pipe sleeve, bolts and reinforcement
Day 3 Place concrete Day 4 Drill pile hole through pipe sleeve,
place reinforcement cage and concrete pile
Day 5 Drill 100 mm duct in pile, place tendons and grout the lowest 3 m anchorage zone
With four bases to each tower, these operations tended to overlap a couple of days. C o n currently, the foundations for equipment shelters, waveguide bases and w ind-generator towers were constructed.
On sites incorporating mass concrete bases some 300 m 3 of excavat ion w a s required and the construction extended to 1 2 or 1 4 days.
Pile fa i lu re South Austral ian sites gave few problems. Condit ions were either dense igneous rock or deep sand. The type of foundation w a s clearly indicated and construction w a s straightforward.
In the west , the weathered granite proved to be extremely variable, from almost sound rock to material from wh ich most of the felspars had weathered away to a kaolinized grit.
A t the foundation level of the footing pads this material w a s firm and non-compressible, but tended to abrade easily. The percussion drill penetrated it rapidly and the drillings were ejected as fine talc-l ike powder.
When the foundation first constructed at Bulgin Rock (Si te number 2) w a s stressed, cable extensions apparently exceeded ca l cu lated elongations, and a careful check showed that the pile w a s in fact moving upwards through the slip joint in the footing. There w a s no alternative to extracting the piles and reconstruct ing the foundation to give more effective anchorage.
Th is w a s done wi th the prestressing jacks, but as these had a stroke of only abou ' 500 mm, the pile had to be broken up wi th jack hammers each time the jacks reached their limit. The procedure w a s s low, laborious and risky, because a broken cable wou ld have
eliminated the means of removal and necessitated complete reconstruction of the site. Means were then considered of ensuring against further pile slip. A bulb at the base of the pile seemed the obvious answer. D iscussions wi th an explosives expert in the New South Wales Department of Mines raised hopes, and on his advice, a bundle of 21 sticks of gelignite w a s detonated at the base of a deepened hole. Apparatus w a s developed to plot the size of the cavity produced and this proved to be from 500 to 600 mm diameter and from 1.2 to 1.5 m in height.
The foundation w a s reconstructed and re-stressed. On the first application and release of the load there w a s an upward yield of approximately 9.5 mm. This w a s not repeated on restressing and no creep or loss of stress w a s evident on restressing after seven days, even though the second and third holes had been detonated whi le the stress w a s held on the first.
It is interesting to record that this site was the most closely situated to the centre of the earthquake wh ich demolished the vil lage of Meckering in 1968. There w a s evidence that considerable ground movement had taken place at the tower, but no evidence of damage.
The lessons learnt at this site were put to good use later on. At all sites where rock appeared weathered, friable or soft, the hole depth w a s increased and a charge fired in the base to provide a bulb. Early diff iculties in checking the size of the bulb were overcome by the simple expedient of lowe' ing a light on a flex and swinging this across the hole. The period of darkness as the light went beyond the limits of the shaft gave a clear indication of the size of the bulb formed.
This experience all proved extremely valuable once construction had moved into the Nullar-bor l imestone and al lowed the use of stressed foundations continuously from sites 3 to 33.
C a v i t i e s in l i m e s t o n e Initial geological advice had emphasized the presence of cavit ies in the Nullarbor limestone. These could be vast, extending many tens of metres horizontally and vertically. The existence of such large ones w a s generally known, but smaller ones, from 1.5 to 6 m deep, constituted a real problem, and various techniques of sleeving the pile through these had been considered. In practice only one. at site 27, w a s encountered, about 2.5 m deep and it rapidly filled w h e n the pile w a s con creted.
No other serious problems were encountered, although the design of each foundation had to be confirmed, and often modified by the resident engineer on site, to accommodate the bearing capacity available and the depth of excavat ion necessary to achieve this, when these varied from the design assumptions shown on the drawings.
T o w e r d e s i g n Full calculat ions of a basic tower structure to support four to six reflectors were required by the specif icat ion. The towers were to resist a w ind velocity of 160 km/h at ground level, increasing wi th height, the design code being in accordance wi th a Post Off ice document, and wh ich wou ld result in a factor of safety on ultimate structure strength in the order of 1.5-1.7. The design used a common geometry for four- and six-ref lector towers and is very similar to that commonly used by the Post Off ice throughout Austral ia. All of this resulted in structures wi th standardized members wh i ch could be mass produced in an economical manner.
Reflectors were considered to be at two or three levels at the top of the tower, but route design required widely different levels, particularly for diversity reflectors. E P T proposed that reflector mounting positions should be established at 12 distinct heights. It w a s
The central problem wi th friction fittings is the choice of a co-eff icient of friction. The co efficient of friction determines the clamping force and hence the size of the clamp. (Certain people feel that the length of clamp also affects the co-eff ic ient of friction but this is not wel l documented). Recently a series of tests w a s made on friction fittings, giving quite different results. In each test the cables were galvanized. The three tests were:
(a ) A cast and galvanized intermediate clamp 200 mm long on a 60 mm spiral steel strand wi th a clamping force of 200 tons. The co-eff icient of sliding friction w a s 0.10.
(b) The same clamp ungalvanized wi th the same force and strand. The co-eff icient of sliding friction w a s 0.23.
(c ) A 150 mm galvanized end clamp on a 1 6 mm rope wi th a clamping force of 44 tons. The co-eff ic ient of sliding friction w a s 0.3 and that for sustained friction w a s 0.28.
In each case the co-eff icient of friction w a s measured against the nett compression on the cable without any effect of tension bending in the clamp (i.e. twice the bolt tension). Bending curvature w a s not considered likely. In the case of the rope clamp, the result w a s the same whether the cable w a s whol ly inside the clamp or sticking out the other side. These results indicate the wide range of results that can occur and are indicative of the care that must be taken.
It is not. however, easy to define the effective compression on the clamp in use. This is particularly true of intermediate clamps. The tests described above were done when there w a s no tension in the supporting cable. A s the supporting cable is tensioned. the d iameter wi l l decrease (how much is not known) . The resultant diameter decrease wil l represent a loss of strain in the clamping bolts. Many people, including most manufacturers, recommend using long high tensile bolts to counteract this. However, high tensile bolts, particularly if cadmium plated, are prone to failure and are less able to accept distortions in the clamp than ordinary mild steel bolts. Professor Otto is on record as preferring mild steel bolts. These can be re-tightened after the initial strain in the boundary cable to counteract the cable reduction.
C o n c l u s i o n s The conclusions are simple, that is if con clusions, other than a built design, can be said to exist for the designer. Cable structures are flexible. Their true strength lies in their ability to absorb large distortions. They should be conceived and designed as flexible systems, with materials and parts carefully chosen. In specif ication, manufacture and erection they are akin to precast concrete. Accurate design and specification and control at the manufacturing stage are essential for simple erection. The need for accurate specif ication need not hinder adventurous design. Perhaps if this reality were accepted, cable systems wou ld be less expensive, less frightening for the con tractor and they could take their rightful place in the designer's catalogue.
R e f e r e n c e s ( 1 ) Frei Otto at Work. Architectural Design, 41. pp. 1 3 7 - 1 6 7 . March 1 9 7 1 .
(2 ) B U C H H O L D T . H. A. and others. The analysis of cable nets. Journal of the Institute of mathematics and its applications, 4, pp. 3 3 9 - 3 5 8 . December 1968.
(3 ) B R O O K S . D. F. and B R O T T O N . D. M. Formulation of a general space frame programme for a large computer. Structural Engineer. 44 ( 1 1 ) . pp. 3 8 1 - 3 9 6 . November 1 966.
(4 ) W Y A T T , T. A. Secondary stresses in parallel wire suspension cables. ASCE Proc-ceedings: Journal of the Structural Division,
10 86 ( S T 7 ) . pp. 3 7 - 5 9 . J u l y 1960.
Stressed rock-anchor antenna-support towers Bob Kelman and Harry Holmes* I n t roduc t ion At the time of its inception in 1 964 , the East-West route linking Port Pirie in South Australia wi th Northam, 80 miles north-east of Perth ( job no. A 1 6 5 ) , w a s the longest microwave route yet considered.
Of the total route length of 2250 km, the central section crossed 1100 km of barren, featureless plain, virtually devoid of any services, with summer temperatures reaching 50°C, and with no recognized sources of water. Supply of materials, maintenance of equipment and adequate accommodation for men over a period of a year, presented formidable problems. The normal gravity type of foundation for a 75 m tower contained nearly 80 m 3
of concrete for each leg, and it w a s obvious that any design wh ich could reduce excavation and concrete quantities w a s desirable. Furthermore, little knowledge of local geology existed and there were f ew known sources of supply of concrete materials. Such were the considerations that led to the development of stressed rock-anchor foundations.
Si te inves t iga t ion At the time of tendering, only the sites for the end sections of the route were firmly established. Provisional sites existed for the central section. A site investigation w a s carried out by George Wimpey and Co. Ltd. during wh ich test bores for soil investigation were carried out at all accessible established sites, and the central section of the route sampled by drilling approximately every fifth provisional site. The results were encouraging and indicated three zones wi th transition areas in between.
(a) Western Australia (Northam to Ka l -goorl ie)—general ly a sandy soil over decomposed granite
(b) Central Nullarbor region—Nullarbor limestones, porous and very variable and likely to contain cavit ies of considerable size
(c ) South Australia (Ceduna to W h y a l l a ) — hard igneous rock often close to, or at the surface
D e s i g n The design of rock-anchor foundation had to satisfy certain requirements. It had to provide: (1 ) adequate anchorage against uplift forces (2 ) adequate resistance to downward forces (3 ) adequate stability against sliding or over
turning under combinat ions of vertical and horizontal forces and
(4 ) adequate factor of safety against overload and long term corrosion.
In principle it is simple. The tower leg base plate (F ig . 1) is directly connected to the stressing anchorage plate through the holding down bolts. Uplift forces are conveyed to the anchorage zone at the lower end of the pile. Under no-load condit ions, the stressing forces are restrained by the bearing of the footing on the soil or rock. Not until the tower uplift forces exceed the residual stress is there any tendency for the footing to lift.
The disadvantage is that the downward load on any footing is doubled, as it must resist the stressing force together wi th the maximum downward tower leg force. Thus a foundation bearing value of about 6.4 M N / m 2 w a s considered essential if the stressed footings were to be much smaller than gravity footings. On sound igneous rock, the stressed footing pad w a s just sufficient to accommodate base
plate, anchorage and bolts. Towers varied in height from 2 3 - 7 6 m. Upl i f t forces varied from 52,000 to 104,000 kg. For the purpose of design, two types of footing were developed, one for towers from 23 m to 46 m and the other for 53 m to 76 m. Various prestressing systems were examined and the Freyssinet System was chosen. It proved most easily adaptable to the design and offered cable capacit ies most suited to the range of forces required. Anchorage forces available from the ground were assumed to be the weight of a 60° inverted cone wi th its vertex at the anchorage depth (F ig . 2 ) . No advantage w a s taken of soil cohesion, internal friction or tensile strength in soil or rock. A factor of safety w a s taken at 1.6 for the weight of the soil cone over uplift forces exerted by the tower under design wind speed of 160 km/h .
To ensure that the stressing force w a s restrained between the footing bearing on the ground and the pile anchored at its lower extremity, a slip joint w a s provided through the depth of the footing. If this were omitted, the risk would exist of the pile resisting the stressing force as a column in compression, and the stressing operation, designed to load test the pile anchorage for each foundation, wou ld give no indication of pile slip.
D e v e l o p m e n t A test programme, prior to any field con struction, was designed to perfect and prove each phase of the operation and to establish safe values for bond between cable and grout and between concrete and rock. The basic problem to be overcome w a s the means of placing and anchoring cables 9 m down in the ground, wi th efficient protection from corrosion over a long period. It w a s sus pected that ground water, if present, could be high in sulphates and chlorides, and the Nullarbor l imestones were known to be porous. It w a s not considered that suff icient corrosion protection could be given to cables if these were simply grouted into a bored hole. It w a s therefore decided to cast a concrete pile in the ground, with a central 100 mm duct for the cables. Minimum pile diameter was considered to be 230 mm. Equipment selected for boring the 230 mm pile hole w a s the Ingersol l -Rand rotary percussion 'Down the Hole' hammer used in conjunction wi th a Pioneer rotary drill and compressors. After several attempts at 'casting in' the 100 mm duct, it w a s successful ly achieved by casting a solid pile wi th a concentr ic cage of reinforcement and then drilling a 100 mm duct down the centre. The reinforcement cage acted as a guide to the drill. Three full scale foundations were constructed and a routine established for setting out, drilling, con creting, grouting and stressing.
The experience gained during the test programme, itself the result of collaboration between Arups and the contractors. Electric Power Transmission Pty Ltd. ( E P T ) , w a s incorporated in the final design. E P T were able to go into the field wi th a new form of con struction wi th wh ich they were already experienced, wi th the result that field procedure generally ran smoothly and efficiently.
C o n s t r u c t i o n Field work commenced at Whyal la in November 1 967 and at the western end of the route in February 1968. Each gang w a s fully equipped to construct both stressed and mass type of foundations, although only two mass types were con structed in the west . Each gang w a s accompanied by a resident engineer and Clerk of Works provided by Arups. Condit ions along the route had improved con siderably since the time of tendering. The road over the Nullarbor Plain w a s carrying much more traffic and, from the West Austral ian border to Perth, w a s substantially sealed.
F i g . 2 Section through Aud i to r ium—Mecca Hotel and Conference Centre
(!)
Main cable profile checked on CAB NET V Give* forces on boundary cable
Boundary cable run on CABNET<] R"un tun on DATCAB, gives lengths, loads, etc V Run on F I N D E F
successful DATCAB output
F i g . 3 Flow diagram for hanging roof
can be dealt wi th , some aspects of some of the problems. In the discussion wh ich fol lows. I have tried to limit the description to those things where there are at least some facts to relate. The beginning is the shape. In general terms three types of shape are used:
(1 ) The anti clast ic curvature broadly based on the hyperbolic paraboloid, or on minimum tension nets
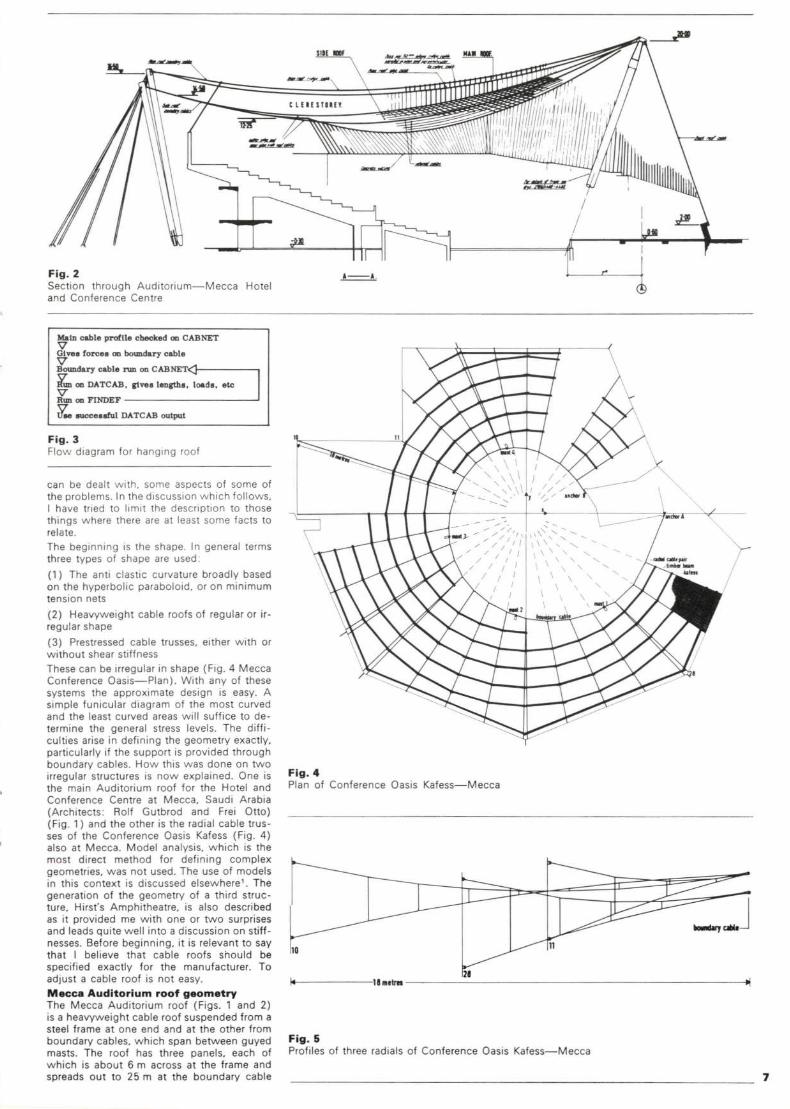
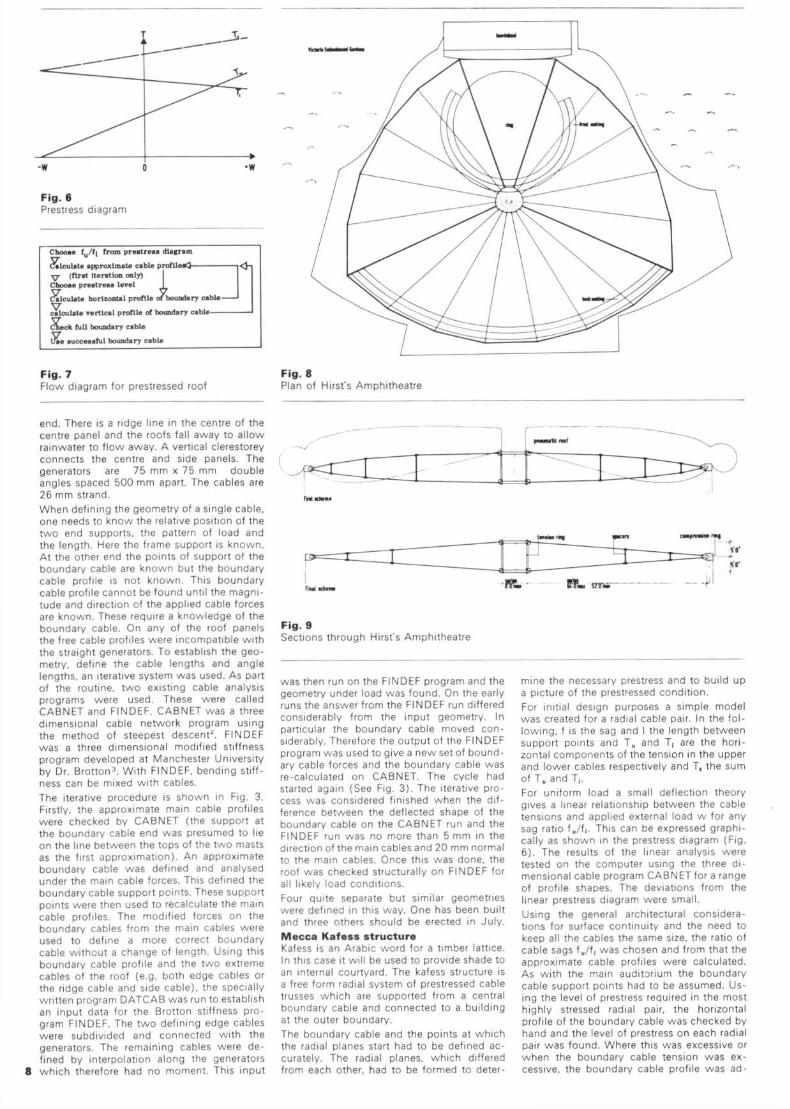
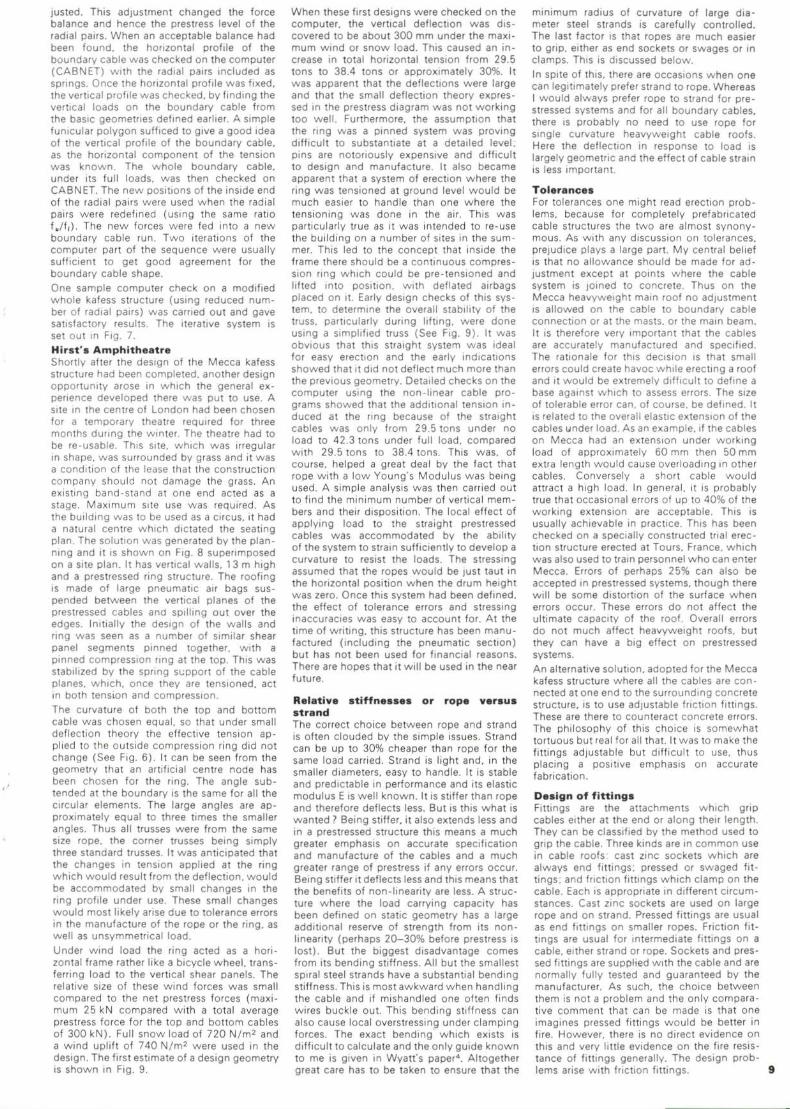
(2 ) Heavyweight cable roofs of regular or irregular shape (3 ) Prestressed cable trusses, either wi th or without shear stiffness These can be irregular in shape (F ig . 4 Mecca Conference O a s i s — P l a n ) . With any of these systems the approximate design is easy. A simple funicular diagram of the most curved and the least curved areas wi l l suff ice to determine the general stress levels. The difficulties arise in defining the geometry exactly, particularly if the support is provided through boundary cables. How this w a s done on two irregular structures is now explained. One is the main Auditorium roof for the Hotel and Conference Centre at Mecca , Saudi Arabia (Archi tects: Rolf Gutbrod and Frei Otto) (F ig . 1) and the other is the radial cable trusses of the Conference Oasis Kafess (F ig . 4 ) also at Mecca . Model analysis, w h i c h is the most direct method for defining complex geometries, w a s not used. The use of models in this context is discussed e lsewhere ' . The generation of the geometry of a third structure. Hirst's Amphitheatre, is also described as it provided me wi th one or two surprises and leads quite wel l into a discussion on stiffnesses. Before beginning, it is relevant to say that I believe that cable roofs should be specif ied exactly for the manufacturer. To adjust a cable roof is not easy. M e c c a A u d i t o r i u m roof g e o m e t r y The Mecca Auditorium roof (F igs . 1 and 2) is a heavyweight cable roof suspended from a steel frame at one end and at the other from boundary cables, wh i ch span between guyed masts. The roof has three panels, each of wh ich is about 6 m across at the frame and spreads out to 25 m at the boundary cable
F i g . 4 Plan of Conference Oasis Kafess- -Mecca
llmttm
F i g . 5 Profiles of three radials of Conference Oasis K a f e s s — M e c c a
F i g . 6 Prestress diagram
Choose iu/t\ from prestress diagram Calculate approximate cable p r o f i l e s < J -TJ- (first Iteration only) Choose preatress level (Calculate horizontal profile of"boundary cable-V
e p r o f
J, i Of be
<h
calculate vertical profile of boundary cable-
C?neck full boundary cable
l5ae successful boundary cable
F i g . 7 Flow diagram for prestressed roof
F i g . 8 Plan of Hirst's Amphitheatre
end. There is a ridge line in the centre of the centre panel and the roofs fall away to a l low rainwater to f low away. A vertical clerestorey connects the centre and side panels. The generators are 75 mm x 75 mm double angles spaced 500 mm apart. The cables are 26 mm strand. When defining the geometry of a single cable, one needs to know the relative position of the two end supports, the pattern of load and the length. Here the frame support is known. At the other end the points of support of the boundary cable are known but the boundary cable profile is not known. This boundary cable profile cannot be found until the magnitude and direction of the applied cable forces are known. These require a knowledge of the boundary cable. On any of the roof panels the free cable profiles were incompatible wi th the straight generators. To establish the geometry, define the cable lengths and angle lengths, an iterative system was used. As part of the routine, two existing cable analysis programs were used. These were called C A B N E T and F I N D E F . C A B N E T w a s a three dimensional cable network program using the method of steepest descent 2 . F I N D E F w a s a three dimensional modified sti f fness program developed at Manchester University by Dr. Brot ton 3 . With F I N D E F , bending stiffness can be mixed wi th cables. The iterative procedure is shown in Fig. 3. Firstly, the approximate main cable profiles were checked by C A B N E T (the support at the boundary cable end w a s presumed to lie on the line between the tops of the two masts as the first approximation). An approximate boundary cable w a s defined and analysed under the main cable forces. This defined the boundary cable support points. These support points were then used to recalculate the main cable profiles. The modified forces on the boundary cables from the main cables were used to define a more correct boundary cable without a change of length. Using this boundary cable profile and the two extreme cables of the roof (e.g. both edge cables or the ridge cable and side cab le) , the special ly written program D A T C A B w a s run to establish an input data for the Brotton stiffness program F I N D E F . The two defining edge cables were subdivided and connected wi th the generators. The remaining cables were defined by interpolation along the generators
8 wh i ch therefore had no moment. This input
F i g . 9 Sect ions through Hirst's Amphitheatre
w a s then run on the F I N D E F program and the geometry under load w a s found. On the early runs the answer from the F I N D E F run differed considerably from the input geometry. In particular the boundary cable moved considerably. Therefore the output of the F I N D E F program w a s used to give a new set of boundary cable forces and the boundary cable w a s re-calculated on C A B N E T . The cycle had started again (See Fig. 3 ) . The iterative process w a s considered finished when the difference between the deflected shape of the boundary cable on the C A B N E T run and the F I N D E F run was no more than 5 mm in the direction of the main cables and 20 mm normal to the main cables. Once this w a s done, the roof w a s checked structurally on F I N D E F for all likely load conditions. Four quite separate but similar geometries were defined in this way . One has been built and three others should be erected in Ju l y . M e c c a K a f e s s s t r u c t u r e Kafess is an Arabic word for a timber lattice. In this case it wi l l be used to provide shade to an internal courtyard. The kafess structure is a free form radial system of prestressed cable trusses wh ich are supported from a central boundary cable and connected to a building at the outer boundary.
The boundary cable and the points at wh ich the radial planes start had to be defined ac curately. The radial planes, wh ich differed from each other, had to be formed to deter
mine the necessary prestress and to build up a picture of the prestressed condition. For initial design purposes a simple model w a s created for a radial cable pair. In the following, f is the sag and I the length between support points and T„ and T, are the horizontal components of the tension in the upper and lower cables respectively and T , the sum of T „ and T,. For uniform load a small deflection theory gives a linear relationship between the cable tensions and applied external load w for any sag ratio f „ / f ( . This can be expressed graphically as shown in the prestress diagram (F ig . 6 ) . The results of the linear analysis were tested on the computer using the three dimensional cable program C A B N E T for a range of profile shapes. The deviations from the linear prestress diagram were small. Using the general architectural considerations for surface continuity and the need to keep all the cables the same size, the ratio of cable sags f „ / f ( w a s chosen and from that the approximate cable profiles were calculated. As wi th the main auditorium the boundary cable support points had to be assumed. U s ing the level of prestress required in the most highly stressed radial pair, the horizontal profile of the boundary cable w a s checked by hand and the level of prestress on each radial pair w a s found. Where this w a s excessive or when the boundary cable tension w a s excessive, the boundary cable profile w a s ad
justed. Th is adjustment changed the force balance and hence the prestress level of the radial pairs. When an acceptable balance had been found, the horizontal profile of the boundary cable was checked on the computer ( C A B N E T ) wi th the radial pairs included as springs. Once the horizontal profile was f ixed, the vertical profile w a s checked, by finding the vertical loads on the boundary cable from the basic geometries defined earlier. A simple funicular polygon suff iced to give a good idea of the vertical profile of the boundary cable, as the horizontal component of the tension w a s known. The whole boundary cable, under its full loads, w a s then checked on C A B N E T . The new positions of the inside end of the radial pairs were used when the radial pairs were redefined (using the same ratio f „ / f i ) . The new forces were fed into a new boundary cable run. T w o iterations of the computer part of the sequence were usually sufficient to get good agreement for the boundary cable shape.
One sample computer check on a modified whole kafess structure (using reduced number of radial pairs) w a s carried out and gave satisfactory results. The iterative system is set out in Fig. 7. H i r s t ' s A m p h i t h e a t r e Shortly after the design of the Mecca kafess structure had been completed, another design opportunity arose in wh ich the general experience developed there w a s put to use. A site in the centre of London had been chosen for a temporary theatre required for three months during the winter. The theatre had to be re-usable. This site, wh ich w a s irregular in shape, w a s surrounded by grass and it was a condition of the lease that the construction company should not damage the grass. An existing band-stand at one end acted as a stage. Maximum site use was required. As the building w a s to be used as a circus, it had a natural centre wh ich dictated the seating plan. The solution w a s generated by the planning and it is shown on Fig. 8 superimposed on a site plan. It has vertical wal ls , 1 3 m high and a prestressed ring structure. The roofing is made of large pneumatic air bags suspended between the vertical planes of the prestressed cables and spilling out over the edges. Initially the design of the wal ls and ring was seen as a number of similar shear panel segments pinned together, with a pinned compression ring at the top. This w a s stabilized by the spring support of the cable planes, wh i ch , once they are tensioned, act in both tension and compression. The curvature of both the top and bottom cable w a s chosen equal, so that under small deflection theory the effective tension applied to the outside compression ring did not change (See Fig. 6 ) . It can be seen from the geometry that an artificial centre node has been chosen for the ring. The angle subtended at the boundary is the same for all the circular elements. The large angles are approximately equal to three times the smaller angles. Thus all trusses were from the same size rope, the corner trusses being simply three standard trusses. It w a s anticipated that the changes in tension applied at the ring wh ich would result from the deflection, would be accommodated by small changes in the ring profile under use. These small changes would most likely arise due to tolerance errors in the manufacture of the rope or the ring, as wel l as unsymmetrical load. Under wind load the ring acted as a horizontal frame rather like a bicycle whee l , transferring load to the vertical shear panels. The relative size of these w ind forces w a s small compared to the net prestress forces (max i mum 25 kN compared wi th a total average prestress force for the top and bottom cables of 300 k N ) . Full snow load of 720 N / m 2 and a wind uplift of 740 N / m 2 were used in the design. The first estimate of a design geometry is shown in Fig. 9.
When these first designs were checked on the computer, the vertical deflection w a s discovered to be about 300 mm under the maximum wind or snow load. This caused an increase in total horizontal tension from 29.5 tons to 38.4 tons or approximately 30%. It was apparent that the deflections were large and that the small deflection theory expressed in the prestress diagram w a s not working too we l l . Furthermore, the assumption that the ring w a s a pinned system w a s proving difficult to substantiate at a detailed level; pins are notoriously expensive and difficult to design and manufacture. It also became apparent that a system of erection where the ring w a s tensioned at ground level wou ld be much easier to handle than one where the tensioning w a s done in the air. Th is was particularly true as it w a s intended to re-use the building on a number of sites in the summer. This led to the concept that inside the frame there should be a continuous compression ring wh ich could be pre-tensioned and lifted into position, wi th deflated airbags placed on it. Early design checks of this sys tem, to determine the overall stability of the truss, particularly during lifting, were done using a simplified truss (See Fig. 9 ) . It was obvious that this straight system w a s ideal for easy erection and the early indications showed that it did not deflect much more than the previous geometry. Detailed checks on the computer using the non-l inear cable programs showed that the additional tension induced at the ring because of the straight cables w a s only from 29.5 tons under no load to 42.3 tons under full load, compared wi th 29.5 tons to 38.4 tons. This w a s . of course, helped a great deal by the fact that rope wi th a low Young 's Modulus w a s being used. A simple analysis was then carried out to find the minimum number of vertical members and their disposition. The local effect of applying load to the straight prestressed cables w a s accommodated by the ability of the system to strain sufficiently to develop a curvature to resist the loads. The stressing assumed that the ropes would be just taut in the horizontal position when the drum height w a s zero. Once this system had been defined, the effect of tolerance errors and stressing inaccuracies w a s easy to account for. At the time of wri t ing, this structure has been manufactured ( including the pneumatic sect ion) but has not been used for f inancial reasons. There are hopes that it wi l l be used in the near future.
Rela t ive s t i f f n e s s e s or rope v e r s u s s t r a n d The correct choice between rope and strand is often clouded by the simple issues. Strand can be up to 30% cheaper than rope for the same load carried. Strand is light and, in the smaller diameters, easy to handle. It is stable and predictable in performance and its elastic modulus E is wel l known. It is stiffer than rope and therefore deflects less. But is this what is wanted ? Being stiffer. it also extends less and in a prestressed structure this means a much greater emphasis on accurate specif ication and manufacture of the cables and a much greater range of prestress if any errors occur. Being stiffer it deflects less and this means that the benefits of non-linearity are less. A structure where the load carrying capacity has been defined on static geometry has a large additional reserve of strength from its non-linearity (perhaps 2 0 - 3 0 % before prestress is lost) . But the biggest disadvantage comes from its bending stiffness. All but the smallest spiral steel strands have a substantial bending stiffness. This is most awkward when handling the cable and if mishandled one often finds wires buckle out. This bending stiffness can also cause local overstressing under clamping forces. The exact bending wh ich exists is difficult to calculate and the only guide known to me is given in Wyatt 's paper 4 . Altogether great care has to be taken to ensure that the
minimum radius of curvature of large diameter steel strands is carefully controlled. The last factor is that ropes are much easier to grip, either as end sockets or swages or in clamps. This is discussed below. In spite of this, there are occasions when one can legitimately prefer strand to rope. Whereas I would a lways prefer rope to strand for prestressed systems and for all boundary cables, there is probably no need to use rope for single curvature heavyweight cable roofs. Here the deflection in response to load is largely geometric and the effect of cable strain is less important.
T o l e r a n c e s For tolerances one might read erection problems, because for completely prefabricated cable structures the two are almost synonymous. As wi th any discussion on tolerances, prejudice plays a large part. My central belief is that no al lowance should be made for adjustment except at points where the cable system is joined to concrete. Thus on the Mecca heavyweight main roof no adjustment is al lowed on the cable to boundary cable connection or at the masts, or the main beam. It is therefore very important that the cables are accurately manufactured and specif ied. The rationale for this decision is that small errors could create havoc whi le erecting a roof and it would be extremely difficult to define a base against wh i ch to assess errors. The size of tolerable error can, of course, be defined. It is related to the overall elastic extension of the cables under load. As an example, if the cables on Mecca had an extension under work ing load of approximately 60 mm then 50 mm extra length would cause overloading in other cables. Conversely a short cable would attract a high load. In general, it is probably true that occasional errors of up to 40% of the working extension are acceptable. This is usually achievable in practice. This has been checked on a specially constructed trial erection structure erected at Tours, France, wh ich was also used to train personnel w h o can enter Mecca. Errors of perhaps 2 5 % can also be accepted in prestressed systems, though there wil l be some distortion of the surface when errors occur. These errors do not affect the ultimate capacity of the roof. Overall errors do not much affect heavyweight roofs, but they can have a big effect on prestressed systems.
An alternative solution, adopted for the Mecca kafess structure where all the cables are con nected at one end to the surrounding concrete structure, is to use adjustable friction fittings. These are there to counteract concrete errors. The philosophy of this choice is somewhat tortuous but real for all that. It w a s to make the fittings adjustable but difficult to use, thus placing a positive emphasis on accurate fabrication.
D e s i g n of f i t t ings Fittings are the attachments wh ich grip cables either at the end or along their length. They can be classif ied by the method used to grip the cable. Three kinds are in common use in cable roofs: cast zinc sockets wh i ch are a lways end fittings; pressed or swaged fitt ings; and friction fittings wh ich clamp on the cable. Each is appropriate in different c i rcumstances. Cast z inc sockets are used on large rope and on strand. Pressed fittings are usual as end fittings on smaller ropes. Friction fittings are usual for intermediate fittings on a cable, either strand or rope. Sockets and pressed fittings are supplied with the cable and are normally fully tested and guaranteed by the manufacturer. As such, the choice between them is not a problem and the only comparative comment that can be made is that one imagines pressed fittings would be better in fire. However, there is no direct evidence on this and very little evidence on the fire resistance of fittings generally. The design problems arise wi th friction fittings.
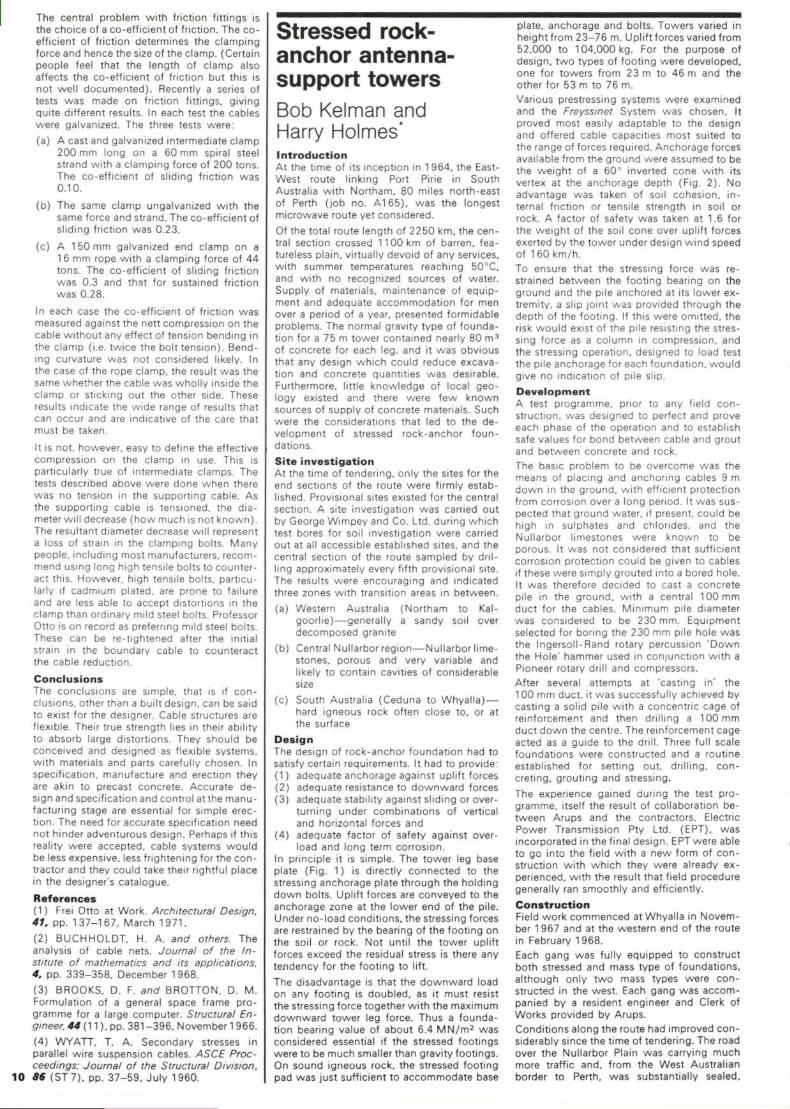
The central problem wi th friction fittings is the choice of a co-eff icient of friction. The co efficient of friction determines the clamping force and hence the size of the clamp. (Certain people feel that the length of clamp also affects the co-eff ic ient of friction but this is not wel l documented). Recently a series of tests w a s made on friction fittings, giving quite different results. In each test the cables were galvanized. The three tests were:
(a ) A cast and galvanized intermediate clamp 200 mm long on a 60 mm spiral steel strand wi th a clamping force of 200 tons. The co-eff icient of sliding friction w a s 0.10.
(b) The same clamp ungalvanized wi th the same force and strand. The co-eff icient of sliding friction w a s 0.23.
(c ) A 150 mm galvanized end clamp on a 1 6 mm rope wi th a clamping force of 44 tons. The co-eff ic ient of sliding friction w a s 0.3 and that for sustained friction w a s 0.28.
In each case the co-eff icient of friction w a s measured against the nett compression on the cable without any effect of tension bending in the clamp (i.e. twice the bolt tension). Bending curvature w a s not considered likely. In the case of the rope clamp, the result w a s the same whether the cable w a s whol ly inside the clamp or sticking out the other side. These results indicate the wide range of results that can occur and are indicative of the care that must be taken.
It is not. however, easy to define the effective compression on the clamp in use. This is particularly true of intermediate clamps. The tests described above were done when there w a s no tension in the supporting cable. A s the supporting cable is tensioned. the d iameter wi l l decrease (how much is not known) . The resultant diameter decrease wil l represent a loss of strain in the clamping bolts. Many people, including most manufacturers, recommend using long high tensile bolts to counteract this. However, high tensile bolts, particularly if cadmium plated, are prone to failure and are less able to accept distortions in the clamp than ordinary mild steel bolts. Professor Otto is on record as preferring mild steel bolts. These can be re-tightened after the initial strain in the boundary cable to counteract the cable reduction.
C o n c l u s i o n s The conclusions are simple, that is if con clusions, other than a built design, can be said to exist for the designer. Cable structures are flexible. Their true strength lies in their ability to absorb large distortions. They should be conceived and designed as flexible systems, with materials and parts carefully chosen. In specif ication, manufacture and erection they are akin to precast concrete. Accurate design and specification and control at the manufacturing stage are essential for simple erection. The need for accurate specif ication need not hinder adventurous design. Perhaps if this reality were accepted, cable systems wou ld be less expensive, less frightening for the con tractor and they could take their rightful place in the designer's catalogue.
R e f e r e n c e s ( 1 ) Frei Otto at Work. Architectural Design, 41. pp. 1 3 7 - 1 6 7 . March 1 9 7 1 .
(2 ) B U C H H O L D T . H. A. and others. The analysis of cable nets. Journal of the Institute of mathematics and its applications, 4, pp. 3 3 9 - 3 5 8 . December 1968.
(3 ) B R O O K S . D. F. and B R O T T O N . D. M. Formulation of a general space frame programme for a large computer. Structural Engineer. 44 ( 1 1 ) . pp. 3 8 1 - 3 9 6 . November 1 966.
(4 ) W Y A T T , T. A. Secondary stresses in parallel wire suspension cables. ASCE Proc-ceedings: Journal of the Structural Division,
10 86 ( S T 7 ) . pp. 3 7 - 5 9 . J u l y 1960.
Stressed rock-anchor antenna-support towers Bob Kelman and Harry Holmes* I n t roduc t ion At the time of its inception in 1 964 , the East-West route linking Port Pirie in South Australia wi th Northam, 80 miles north-east of Perth ( job no. A 1 6 5 ) , w a s the longest microwave route yet considered.
Of the total route length of 2250 km, the central section crossed 1100 km of barren, featureless plain, virtually devoid of any services, with summer temperatures reaching 50°C, and with no recognized sources of water. Supply of materials, maintenance of equipment and adequate accommodation for men over a period of a year, presented formidable problems. The normal gravity type of foundation for a 75 m tower contained nearly 80 m 3
of concrete for each leg, and it w a s obvious that any design wh ich could reduce excavation and concrete quantities w a s desirable. Furthermore, little knowledge of local geology existed and there were f ew known sources of supply of concrete materials. Such were the considerations that led to the development of stressed rock-anchor foundations.
Si te inves t iga t ion At the time of tendering, only the sites for the end sections of the route were firmly established. Provisional sites existed for the central section. A site investigation w a s carried out by George Wimpey and Co. Ltd. during wh ich test bores for soil investigation were carried out at all accessible established sites, and the central section of the route sampled by drilling approximately every fifth provisional site. The results were encouraging and indicated three zones wi th transition areas in between.
(a) Western Australia (Northam to Ka l -goorl ie)—general ly a sandy soil over decomposed granite
(b) Central Nullarbor region—Nullarbor limestones, porous and very variable and likely to contain cavit ies of considerable size
(c ) South Australia (Ceduna to W h y a l l a ) — hard igneous rock often close to, or at the surface
D e s i g n The design of rock-anchor foundation had to satisfy certain requirements. It had to provide: (1 ) adequate anchorage against uplift forces (2 ) adequate resistance to downward forces (3 ) adequate stability against sliding or over
turning under combinat ions of vertical and horizontal forces and
(4 ) adequate factor of safety against overload and long term corrosion.
In principle it is simple. The tower leg base plate (F ig . 1) is directly connected to the stressing anchorage plate through the holding down bolts. Uplift forces are conveyed to the anchorage zone at the lower end of the pile. Under no-load condit ions, the stressing forces are restrained by the bearing of the footing on the soil or rock. Not until the tower uplift forces exceed the residual stress is there any tendency for the footing to lift.
The disadvantage is that the downward load on any footing is doubled, as it must resist the stressing force together wi th the maximum downward tower leg force. Thus a foundation bearing value of about 6.4 M N / m 2 w a s considered essential if the stressed footings were to be much smaller than gravity footings. On sound igneous rock, the stressed footing pad w a s just sufficient to accommodate base
plate, anchorage and bolts. Towers varied in height from 2 3 - 7 6 m. Upl i f t forces varied from 52,000 to 104,000 kg. For the purpose of design, two types of footing were developed, one for towers from 23 m to 46 m and the other for 53 m to 76 m. Various prestressing systems were examined and the Freyssinet System was chosen. It proved most easily adaptable to the design and offered cable capacit ies most suited to the range of forces required. Anchorage forces available from the ground were assumed to be the weight of a 60° inverted cone wi th its vertex at the anchorage depth (F ig . 2 ) . No advantage w a s taken of soil cohesion, internal friction or tensile strength in soil or rock. A factor of safety w a s taken at 1.6 for the weight of the soil cone over uplift forces exerted by the tower under design wind speed of 160 km/h .
To ensure that the stressing force w a s restrained between the footing bearing on the ground and the pile anchored at its lower extremity, a slip joint w a s provided through the depth of the footing. If this were omitted, the risk would exist of the pile resisting the stressing force as a column in compression, and the stressing operation, designed to load test the pile anchorage for each foundation, wou ld give no indication of pile slip.
D e v e l o p m e n t A test programme, prior to any field con struction, was designed to perfect and prove each phase of the operation and to establish safe values for bond between cable and grout and between concrete and rock. The basic problem to be overcome w a s the means of placing and anchoring cables 9 m down in the ground, wi th efficient protection from corrosion over a long period. It w a s sus pected that ground water, if present, could be high in sulphates and chlorides, and the Nullarbor l imestones were known to be porous. It w a s not considered that suff icient corrosion protection could be given to cables if these were simply grouted into a bored hole. It w a s therefore decided to cast a concrete pile in the ground, with a central 100 mm duct for the cables. Minimum pile diameter was considered to be 230 mm. Equipment selected for boring the 230 mm pile hole w a s the Ingersol l -Rand rotary percussion 'Down the Hole' hammer used in conjunction wi th a Pioneer rotary drill and compressors. After several attempts at 'casting in' the 100 mm duct, it w a s successful ly achieved by casting a solid pile wi th a concentr ic cage of reinforcement and then drilling a 100 mm duct down the centre. The reinforcement cage acted as a guide to the drill. Three full scale foundations were constructed and a routine established for setting out, drilling, con creting, grouting and stressing.
The experience gained during the test programme, itself the result of collaboration between Arups and the contractors. Electric Power Transmission Pty Ltd. ( E P T ) , w a s incorporated in the final design. E P T were able to go into the field wi th a new form of con struction wi th wh ich they were already experienced, wi th the result that field procedure generally ran smoothly and efficiently.
C o n s t r u c t i o n Field work commenced at Whyal la in November 1 967 and at the western end of the route in February 1968. Each gang w a s fully equipped to construct both stressed and mass type of foundations, although only two mass types were con structed in the west . Each gang w a s accompanied by a resident engineer and Clerk of Works provided by Arups. Condit ions along the route had improved con siderably since the time of tendering. The road over the Nullarbor Plain w a s carrying much more traffic and, from the West Austral ian border to Perth, w a s substantially sealed.
F i g . 2 Section through Aud i to r ium—Mecca Hotel and Conference Centre
(!)
Main cable profile checked on CAB NET V Give* forces on boundary cable
Boundary cable run on CABNET<] R"un tun on DATCAB, gives lengths, loads, etc V Run on F I N D E F
successful DATCAB output
F i g . 3 Flow diagram for hanging roof
can be dealt wi th , some aspects of some of the problems. In the discussion wh ich fol lows. I have tried to limit the description to those things where there are at least some facts to relate. The beginning is the shape. In general terms three types of shape are used:
(1 ) The anti clast ic curvature broadly based on the hyperbolic paraboloid, or on minimum tension nets
(2 ) Heavyweight cable roofs of regular or irregular shape (3 ) Prestressed cable trusses, either wi th or without shear stiffness These can be irregular in shape (F ig . 4 Mecca Conference O a s i s — P l a n ) . With any of these systems the approximate design is easy. A simple funicular diagram of the most curved and the least curved areas wi l l suff ice to determine the general stress levels. The difficulties arise in defining the geometry exactly, particularly if the support is provided through boundary cables. How this w a s done on two irregular structures is now explained. One is the main Auditorium roof for the Hotel and Conference Centre at Mecca , Saudi Arabia (Archi tects: Rolf Gutbrod and Frei Otto) (F ig . 1) and the other is the radial cable trusses of the Conference Oasis Kafess (F ig . 4 ) also at Mecca . Model analysis, w h i c h is the most direct method for defining complex geometries, w a s not used. The use of models in this context is discussed e lsewhere ' . The generation of the geometry of a third structure. Hirst's Amphitheatre, is also described as it provided me wi th one or two surprises and leads quite wel l into a discussion on stiffnesses. Before beginning, it is relevant to say that I believe that cable roofs should be specif ied exactly for the manufacturer. To adjust a cable roof is not easy. M e c c a A u d i t o r i u m roof g e o m e t r y The Mecca Auditorium roof (F igs . 1 and 2) is a heavyweight cable roof suspended from a steel frame at one end and at the other from boundary cables, wh i ch span between guyed masts. The roof has three panels, each of wh ich is about 6 m across at the frame and spreads out to 25 m at the boundary cable
F i g . 4 Plan of Conference Oasis Kafess- -Mecca
llmttm
F i g . 5 Profiles of three radials of Conference Oasis K a f e s s — M e c c a
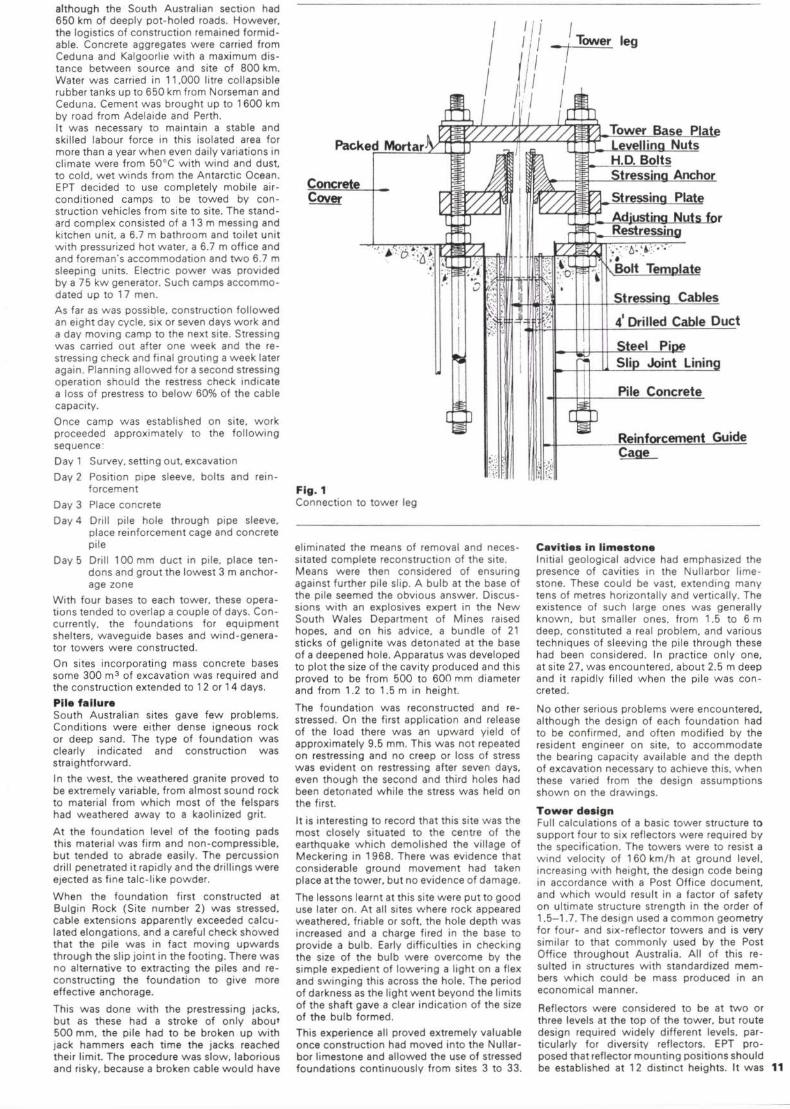
Notes on the design of cable roofs Peter Rice This paper was given at the International Association for Shell Structures Pacific Symposium; Part 2: Tension structures and space frames, which was held in Tokyo and Kyoto. Japan. 17-23 October, 1971.
S u m m a r y The design of cable roofs consists of speci fying a compatible geometry, choosing the right materials and designing all the bits and pieces. All designers have an attitude towards the things they design. Th is paper describes the attitude of one designer. It describes how three unsymmetrical cable roof geometries were defined without the use of models. It describes the evolution of the geometrical shape of the third roof and it d iscusses the factors wh ich govern the selection of manufacturing tolerances, the choice between rope and strand and the design of fittings. It starts from the premise that cable roofs are meant to be flexible and that they should be specified exactly for manufacture.
I n t roduc t ion What does design mean? It is essential to define at least approximately what one means by the design of cable roofs before there can be a meaningful d iscussion. The designer, faced with a problem, starts wi th an attitude. This attitude is the product of his experience and his interpretation of it. When one wri tes a paper entitled 'Notes on the design of cable roofs' one is codifying an attitude, selecting those experiences wh ich have formed it, and describing how and w h y they have relevance to the general problems. There is, of course, a body of fact. The Young 's modulus of steel rope is a fact. Whether or not rope is a more suitable material than spiral steel strand is in the end an attitude. The answer wi l l vary from problem to problem and from designer to designer. There are other factors in the design process wh ich cannot be codif ied: imagination and flair are two. These are not the subject of this paper. One asks again, and now wi th particular reference to cable roofs, what does design mean ?
It means defining a geometry that is economic and feasible, a geometry wh ich exists and wil l resist the applied loads in a reasonable fashion, without local soft points, wi thout high stress concentrations. There are, of course, simple geometries, where there is little problem. It is the more complex geometries
w h i c h are of interest, such as the roof of the Olympic stadium in Munich or Professor Frei Otto's roof at Mecca (F ig . 1 ) . It means choosing the right materials. The size or strength is not really too difficult. It is choosing the sti f fness that can cause diff icult ies. Should it be rope or strand ? The correct size and stiffness of beams in a structure such as the Mecca roof is also very much a design decision. It means specifying a set of cable lengths w h i c h , when manufactured and assembled, become the roof. It means defining the building process so that we can understand the available tolerances and the effect inaccuracy of manufacture wi l l have on the final structure. It means designing anchorages, c lamps and other connect ions. It means choosing the level of prestress.
It means analysis: checking the final structure for the effects of applied loads; checking overall effects such as dynamic stabil ity; in w ind and under other periodic loads.
It means other things such as the choice of suitable cladding materials, the connect ion between the flexible cable roof and the surrounding rigid structures, the choice of a site and the location and design of the a n chorages, etc., but the list is already long enough. Even then only some of the things
\
CifKSiBMY
\
V * * * * * * *
*» -r v -
SBSMa km w B -3 a £
•
CLEIEITMEY £ C M E
F i g . 1 Plan of Aud i to r ium—Mecca Conference Centre and Hotel
Tower leg
Packed M o r t a r V ^ ^ ^ 7 _ Tower Base Plate
Levelling Nuts H.D. Bolts Stressing Anchor Concrete Stressing Plate Adjusting Nuts for I J R est r ess infl
yBolt Template
Stressing Cables
4' Drilled Cable Duct
Steel Pipe Slip Joint Lining
Pile Concrete
Reinforcement Guide
F i g . 1 Connect ion to tower leg
although the South Australian section had 650 km of deeply pot-holed roads. However, the logistics of construction remained formidable. Concrete aggregates were carried from Ceduna and Kalgoorlie wi th a maximum distance between source and site of 800 km. Water w a s carried in 11,000 litre collapsible rubber tanks up to 650 km from Norseman and Ceduna. Cement w a s brought up to 1 600 km by road from Adelaide and Perth. It w a s necessary to maintain a stable and skilled labour force in this isolated area for more than a year when even daily variations in climate were from 50°C wi th wind and dust, to cold, wet winds from the Antarct ic Ocean. E P T decided to use completely mobile air-conditioned camps to be towed by con struction vehicles from site to site. The standard complex consisted of a 1 3 m messing and kitchen unit, a 6.7 m bathroom and toilet unit wi th pressurized hot water, a 6.7 m office and and foreman's accommodation and two 6.7 m sleeping units. Electric power w a s provided by a 75 kw generator. Such camps accommodated up to 17 men.
A s far as w a s possible, construction fol lowed an eight day cyc le , six or seven days work and a day moving camp to the next site. Stressing w a s carried out after one week and the re-stressing check and final grouting a week later again. Planning al lowed for a second stressing operation should the restress check indicate a loss of prestress to below 60% of the cable capacity.
Once camp w a s established on site, work proceeded approximately to the fol lowing sequence: Day 1 Survey, setting out. excavation
Day 2 Position pipe sleeve, bolts and reinforcement
Day 3 Place concrete Day 4 Drill pile hole through pipe sleeve,
place reinforcement cage and concrete pile
Day 5 Drill 100 mm duct in pile, place tendons and grout the lowest 3 m anchorage zone
With four bases to each tower, these operations tended to overlap a couple of days. C o n currently, the foundations for equipment shelters, waveguide bases and w ind-generator towers were constructed.
On sites incorporating mass concrete bases some 300 m 3 of excavat ion w a s required and the construction extended to 1 2 or 1 4 days.
Pile fa i lu re South Austral ian sites gave few problems. Condit ions were either dense igneous rock or deep sand. The type of foundation w a s clearly indicated and construction w a s straightforward.
In the west , the weathered granite proved to be extremely variable, from almost sound rock to material from wh ich most of the felspars had weathered away to a kaolinized grit.
A t the foundation level of the footing pads this material w a s firm and non-compressible, but tended to abrade easily. The percussion drill penetrated it rapidly and the drillings were ejected as fine talc-l ike powder.
When the foundation first constructed at Bulgin Rock (Si te number 2) w a s stressed, cable extensions apparently exceeded ca l cu lated elongations, and a careful check showed that the pile w a s in fact moving upwards through the slip joint in the footing. There w a s no alternative to extracting the piles and reconstruct ing the foundation to give more effective anchorage.
Th is w a s done wi th the prestressing jacks, but as these had a stroke of only abou ' 500 mm, the pile had to be broken up wi th jack hammers each time the jacks reached their limit. The procedure w a s s low, laborious and risky, because a broken cable wou ld have
eliminated the means of removal and necessitated complete reconstruction of the site. Means were then considered of ensuring against further pile slip. A bulb at the base of the pile seemed the obvious answer. D iscussions wi th an explosives expert in the New South Wales Department of Mines raised hopes, and on his advice, a bundle of 21 sticks of gelignite w a s detonated at the base of a deepened hole. Apparatus w a s developed to plot the size of the cavity produced and this proved to be from 500 to 600 mm diameter and from 1.2 to 1.5 m in height.
The foundation w a s reconstructed and re-stressed. On the first application and release of the load there w a s an upward yield of approximately 9.5 mm. This w a s not repeated on restressing and no creep or loss of stress w a s evident on restressing after seven days, even though the second and third holes had been detonated whi le the stress w a s held on the first.
It is interesting to record that this site was the most closely situated to the centre of the earthquake wh ich demolished the vil lage of Meckering in 1968. There w a s evidence that considerable ground movement had taken place at the tower, but no evidence of damage.
The lessons learnt at this site were put to good use later on. At all sites where rock appeared weathered, friable or soft, the hole depth w a s increased and a charge fired in the base to provide a bulb. Early diff iculties in checking the size of the bulb were overcome by the simple expedient of lowe' ing a light on a flex and swinging this across the hole. The period of darkness as the light went beyond the limits of the shaft gave a clear indication of the size of the bulb formed.
This experience all proved extremely valuable once construction had moved into the Nullar-bor l imestone and al lowed the use of stressed foundations continuously from sites 3 to 33.
C a v i t i e s in l i m e s t o n e Initial geological advice had emphasized the presence of cavit ies in the Nullarbor limestone. These could be vast, extending many tens of metres horizontally and vertically. The existence of such large ones w a s generally known, but smaller ones, from 1.5 to 6 m deep, constituted a real problem, and various techniques of sleeving the pile through these had been considered. In practice only one. at site 27, w a s encountered, about 2.5 m deep and it rapidly filled w h e n the pile w a s con creted.
No other serious problems were encountered, although the design of each foundation had to be confirmed, and often modified by the resident engineer on site, to accommodate the bearing capacity available and the depth of excavat ion necessary to achieve this, when these varied from the design assumptions shown on the drawings.
T o w e r d e s i g n Full calculat ions of a basic tower structure to support four to six reflectors were required by the specif icat ion. The towers were to resist a w ind velocity of 160 km/h at ground level, increasing wi th height, the design code being in accordance wi th a Post Off ice document, and wh ich wou ld result in a factor of safety on ultimate structure strength in the order of 1.5-1.7. The design used a common geometry for four- and six-ref lector towers and is very similar to that commonly used by the Post Off ice throughout Austral ia. All of this resulted in structures wi th standardized members wh i ch could be mass produced in an economical manner.
Reflectors were considered to be at two or three levels at the top of the tower, but route design required widely different levels, particularly for diversity reflectors. E P T proposed that reflector mounting positions should be established at 12 distinct heights. It w a s
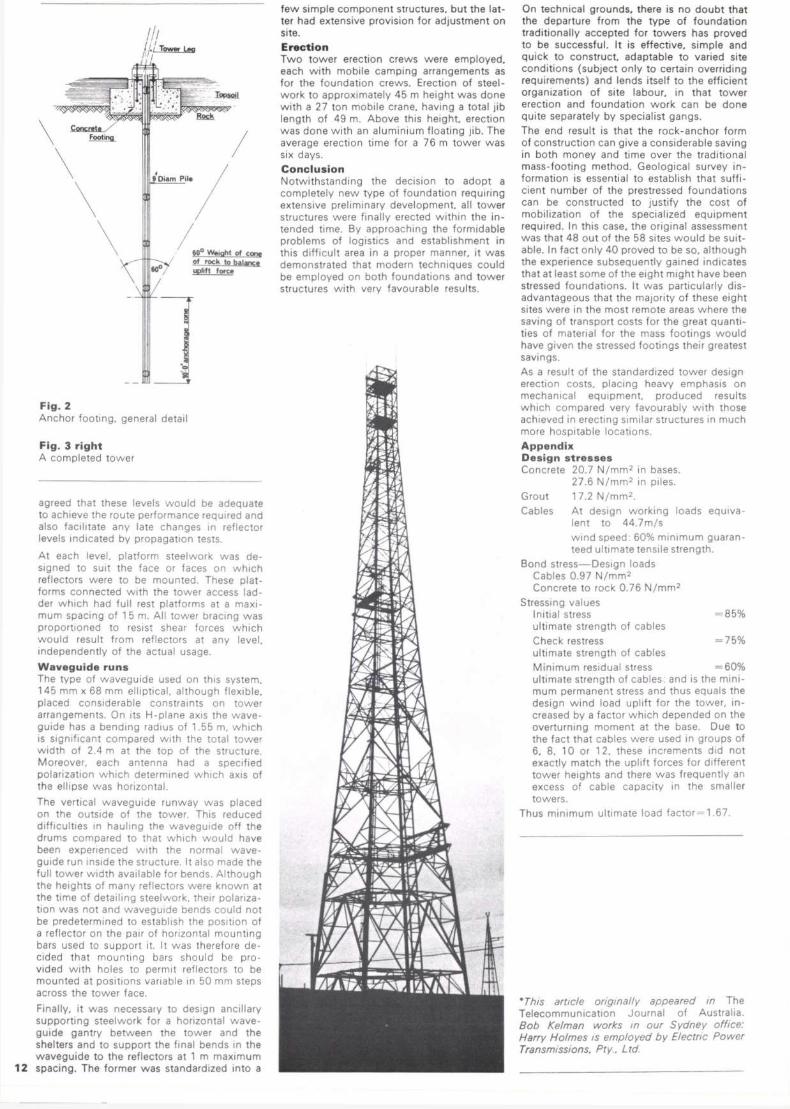
///. II I Tow«f L m
.. .
Touso.1
\ Concreti / Footing
\ 9 Oiam Pile \ \ /
60" We.ghl of con* of rock to balanc.
60" uplift force
F i g . 2 Anchor footing, general detail
F i g . 3 r ight A completed tower
agreed that these levels would be adequate to achieve the route performance required and also facilitate any late changes in reflector levels indicated by propagation tests.
At each level, platform steelwork w a s designed to suit the face or faces on wh ich reflectors were to be mounted. These platforms connected with the tower access ladder wh i ch had full rest platforms at a maxi mum spacing of 1 5 m. All tower bracing w a s proportioned to resist shear forces wh ich would result from reflectors at any level, independently of the actual usage.
W a v e g u i d e r u n s The type of waveguide used on this system. 145 mm x 68 mm elliptical, although flexible, placed considerable constraints on tower arrangements. On its H-plane axis the wave guide has a bending radius of 1.55 m, wh ich is signif icant compared with the total tower width of 2.4 m at the top of the structure. Moreover, each antenna had a specif ied polarization wh ich determined wh ich axis of the ellipse w a s horizontal.
The vertical waveguide runway w a s placed on the outside of the tower. Th is reduced difficulties in hauling the waveguide off the drums compared to that wh i ch would have been experienced wi th the normal w a v e guide run inside the structure. It also made the full tower width available for bends. Although the heights of many reflectors were known at the time of detailing steelwork, their polarization w a s not and waveguide bends could not be predetermined to establish the position of a reflector on the pair of horizontal mounting bars used to support it. It w a s therefore decided that mounting bars should be provided wi th holes to permit reflectors to be mounted at positions variable in 50 mm steps across the tower face.
Finally, it w a s necessaiy to design ancil lary supporting steelwork for a horizontal w a v e guide gantry between the tower and the shelters and to support the final bends in the waveguide to the reflectors at 1 m maximum spacing. The former w a s standardized into a
few simple component structures, but the latter had extensive provision for adjustment on site. E r e c t i o n T w o tower erection crews were employed, each wi th mobile camping arrangements as for the foundation c rews. Erection of steelwork to approximately 45 m height w a s done wi th a 27 ton mobile crane, having a total jib length of 49 m. Above this height, erection w a s done wi th an aluminium floating jib. The average erection time for a 76 m tower w a s six days. C o n c l u s i o n Notwithstanding the decision to adopt a completely new type of foundation requiring extensive preliminary development, all tower structures were finally erected within the intended time. By approaching the formidable problems of logistics and establishment in this difficult area in a proper manner, it w a s demonstrated that modern techniques could be employed on both foundations and tower structures with very favourable results.
•
S
On technical grounds, there is no doubt that the departure from the type of foundation traditionally accepted for towers has proved to be successfu l . It is effective, simple and quick to construct, adaptable to varied site condit ions (subject only to certain overriding requirements) and lends itself to the efficient organization of site labour, in that tower erection and foundation work can be done quite separately by special ist gangs. The end result is that the rock-anchor form of construction can give a considerable saving in both money and time over the traditional mass-foot ing method. Geological survey information is essential to establish that suff i cient number of the prestressed foundations can be constructed to justify the cost of mobilization of the special ized equipment required. In this case, the original assessment w a s that 48 out of the 58 sites would be suitable. In fact only 40 proved to be so, although the experience subsequently gained indicates that at least some of the eight might have been stressed foundations. It w a s particularly disadvantageous that the majority of these eight sites were in the most remote areas where the saving of transport costs for the great quantities of material for the mass footings would have given the stressed footings their greatest savings.
As a result of the standardized tower design erection costs, placing heavy emphasis on mechanical equipment, produced results wh ich compared very favourably wi th those achieved in erecting similar structures in much more hospitable locations. Appendix D e s i g n s t r e s s e s Concrete 20.7 N / m m 2 in bases.
27.6 N / m m 2 in piles. Grout 17.2 N / m m 2 . Cables At design working loads equiva
lent to 44 .7m/s w ind speed: 60% minimum guaranteed ultimate tensile strength.
Bond s t ress—Des ign loads Cables 0.97 N / m m 2
Concrete to rock 0.76 N / m m 2
Stressing values
Initial stress = 8 5 % ultimate strength of cables Check restress = 7 5 % ultimate strength of cables Minimum residual stress = 6 0 % ultimate strength of cables: and is the minimum permanent stress and thus equals the design w ind load uplift for the tower, increased by a factor wh ich depended on the overturning moment at the base. Due to the fact that cables were used in groups of 6, 8, 10 or 12, these increments did not exactly match the uplift forces for different tower heights and there w a s frequently an excess of cable capacity in the smaller towers.
Thus minimum ultimate load factor = 1.67.
'This article originally appeared in The Telecommunicat ion Journal of Austral ia. Bob Kelman works in our Sydney office: Harry Holmes is employed by Electric Power Transmissions, Pty. Ltd.
10a
'1.
!
>
4 T T I A I 2£A
1 0 b ' •V
. •
-
3E I
N O
•3
M i
(
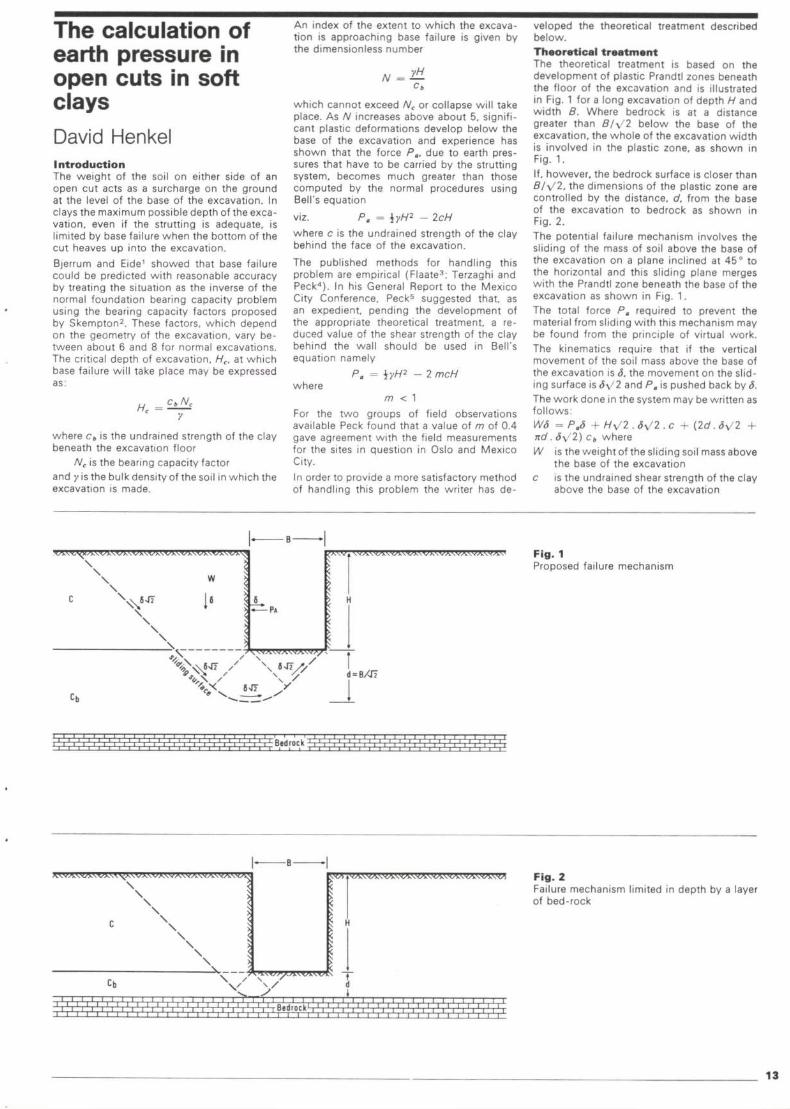
F i g . 3 Sect ion A - A •
7 7 0 0 m . . 0 / , Q 7197m c 6 3 0 0 m
3-700m i i
n'O o'a '<? 0
F i g . 4 Sect ion B - B
1 5 1 3 2
F i g . 5 Section C - C
9 4 0 0 m
" r 2 '0* oQ v "3 r
C V 0.
3 700m • ' • ' T " ' " — - — —-- — • —
f -1 C I • 5 U a 0 - s 0 0 5
F i g . 6 Sect ion D-D
••••• m m i i V r
:•!!
F i g . 7 Portion of top mat of reinforcement. Each line represents a bundle of three 1 2 mm bars
underpass. Th is al lowed the contractor to place his mobile concrete mixer and stocks of sand and gravel on the tarmac road right at the edge of the excavat ion. The concrete w a s then dropped by chute down to the foundations, and horizontally by a rail wagon system to the wal ls and roof.
The buttresses, wh ich were concreted at the same time as the wal ls , proved a little difficult to form because of their slope. They were steep enough to require a top shutter, but not steep enough to al low the concrete to f low down the shutter easily. The problem w a s exacerbated by the amount of reinforcement. 3y using two strong vibrators close together, and a lot of supervision to ensure that no part w a s missed out, good results were achieved.
The roof has an exposed concrete soffit, and the shuttering took the form of boards wi th a 'veneer' of 6 mm plywood laid out to a deliberate arrangement. The 'ridge' and 'val ley' l ines between the triangular roof segments were emphasized by a groove, w h i c h also formed the basis for construction joints where
4 they occurred.
Assembly of the roof reinforcement worked out wel l in practice. Bending the 1 2 mm bars in threes in situ on the shuttering proved easy, and in those cases where 1 6 mm bars were substituted to increase the spacing even this diameter gave no problems. The special 'ridge' and 'valley' reinforcement detail also proved to be practical. It w a s anticipated that the reinforcing methods used might cause some shutter damage wi th resultant poor f inished surfaces and certainly some damage did occur; however it w a s not clear that the cause w a s the reinforcing method, and in any case the damage w a s not excess ive.
Backfi l l ing w a s only commenced when the first two legs and the central 'dome' area were all complete. Then the two legs only were backfi l led, evenly on both sides of the legs, and evenly longitudinally along the legs, to avoid differential loadings.
C o n c l u s i o n The Shahyad Ariamehr monument w a s off icially opened ( inaugurated)by the Shah of Persia during the celebrations held during October.
a -« 8 0 ,
GO
F ig 8 Valley reinforcement detail
Co ...
F i g . 9 Ridge reinforcement detail
P h o t o s : F i g . 10a
Buttress reinforcement
F i g . 10b
Reinforcement round the dome
F i g . 11
Interior of tunnel
F i g . 12 The underpass during construction from the top of the Shahyad Ariamehr F i g . 13 The completed monument (Photo: Copyright Syndicat ion International)
F i g s . 10a , 10b, 11 and 12 (Photos: Robert Af ia)
The calculation of earth pressure in open cuts in soft clays David Henkel I n t roduc t ion The weight of the soil on either side of an open cut acts as a surcharge on the ground at the level of the base of the excavat ion. In clays the maximum possible depth of the e x c a vation, even if the strutting is adequate, is limited by base failure when the bottom of the cut heaves up into the excavat ion.
Bjerrum and Eide ' showed that base failure could be predicted with reasonable accuracy by treating the situation as the inverse of the normal foundation bearing capacity problem using the bearing capacity factors proposed by Skempton 2 . These factors, wh ich depend on the geometry of the excavat ion, vary between about 6 and 8 for normal excavat ions. The critical depth of excavat ion, Hc, at wh i ch base failure wi l l take place may be expressed as:
An index of the extent to wh ich the excava tion is approaching base failure is given by the dimensionless number
Hc = cbNc
where cb is the undrained strength of the clay beneath the excavation floor
Nc is the bearing capacity factor and y is the bulk density of the soil in wh ich the excavat ion is made.
N = yH
which cannot exceed Nc or col lapse wil l take place. As N increases above about 5, significant plastic deformations develop below the base of the excavat ion and experience has shown that the force P., due to earth pressures that have to be carried by the strutting system, becomes much greater than those computed by the normal procedures using Bel l 's equation
viz. P. = iyH2 - 2cH
where c is the undrained strength of the clay behind the face of the excavat ion.
The published methods for handling this problem are empirical ( F l a a t e 3 ; Terzaghi and P e c k 4 ) . In his General Report to the Mexico City Conference. P e c k 5 suggested that, as an expedient, pending the development of the appropriate theoretical treatment, a reduced value of the shear strength of the clay behind the wal l should be used in Bel l 's equation namely
P. = \yH2 - 2 mcH where
m < 1
For the two groups of field observations available Peck found that a value of m of 0.4 gave agreement wi th the field measurements for the sites in question in Oslo and Mexico City.
In order to provide a more satisfactory method of handling this problem the writer has de
veloped the theoretical treatment described below. T h a o r e t i c a l t rea tment The theoretical treatment is based on the development of plastic Prandtl zones beneath the floor of the excavation and is illustrated in Fig. 1 for a long excavat ion of depth H and width B. Where bedrock is at a distance greater than B/\/2 below the base of the excavat ion, the whole of the excavation width is involved in the plastic zone, as shown in Fig. 1 . If, however, the bedrock surface is closer than S / V 2 , the dimensions of the plastic zone are controlled by the distance, d. from the base of the excavat ion to bedrock as shown in Fig. 2. The potential failure mechanism involves the sliding of the mass of soil above the base of the excavation on a plane inclined at 45 ° to the horizontal and this sliding plane merges wi th the Prandtl zone beneath the base of the excavat ion as shown in Fig. 1. The total force P„ required to prevent the material from sliding wi th this mechanism may be found from the principle of virtual work. The kinematics require that if the vertical movement of the soil mass above the base of the excavat ion is S. the movement on the sl iding surface is 8\/2 and P. is pushed back by S. The work done in the system may be written as fo l lows: WS = P.6 + HV2 . SV2 . c + (2d. 6^2 + nd. 8y/2) c„ where W is the weight of the sliding soil mass above
the base of the excavat ion c is the undrained shear strength of the clay
above the base of the excavation
\ \
\ \
d = B / I 7
F i g . 1 Proposed failure mechanism
F i g . 2 Failure mechanism limited in depth by a layer of bed-rock
\ \
\ \
\ \
\
> <
F i g . 3 Unloading adjacent to excavat ion
is the undrained shear strength of the clay below the base of the excavat ion.
Now W (HdV2 + IH2) y
where y is the density of the soil above the base of the foundation excavat ion and
P. = UyH2 -2c.H) + dV2 {yH - (2 + n) c„)
or fol lowing Terzaghi and Peck
Pt i 4c \ 2 V 2 . d
In some excavat ions, local unloading adjacent to the cut has been carried out. but to be completely effective in reducing the apparent depth of cut, the local unloading wi l l have to go much further than the distance of about H which is normal practice. Th is case is considered in Fig. 3. The appropriate equation for K„ may be developed as before and is
2dV2
H
A / /
H P. 1 4c \
K. = = 1 iyH2 \ yH I
i (2 + n) c„\
( ' — = - )
H ( 1 + •
I D
H + ( A H / 2 )
dV2
2c AH
/ yH
i 2c AH \ l 5.14 + — . .
V C„ dy/ll J The term (1 - (Ac/yH)) represents the conventional value of Ka from Bell 's equation. The second term, wh i ch must be positive, indicates that when (yH/cb) > 5.14 there wi l l be an added component of earth pressure. AK..
The value of d to be used in the calculat ions wi l l depend on the local stratigraphy. If the depth of the Prandtl zone is limited by a strong stratum, as shown in Fig. 2, the appropriate value of d wi l l be the depth of the strong stratum below the bottom of the e x c a vation.
The inclusion of the plastic zone below the excavat ion into the deformation mechanism indicates that ground movements are likely to extend to a much greater distance from the edges of the excavat ion than would be expected if only movement above the base of the excavat ion is included.
(2 ) The second term may not be negative and x cannot be greater than d\/2 + H + (AH/2). In order to illustrate the magnitude of the effect
of plastic zones developing below the e x c a vation f low, the values of the second term in equation (1 ) i.e.
2<V2
H 1
(2 + x )
yH wh ich represents AK„. or the increase over the value found from Bel l 's equation, have been evaluated and are plotted in Fig. 4. The range covered is for (yH/cb) from 5.14 to 8.0 and for (d/H) from 0 to 1 . It wi l l be seen that for the higher values of (yH/cb) and (d/H) the value of AKa becomes very significant. A p p l i c a t i o n Three of the instrumental sect ions on the Oslo Subway , known as Vaterland 1 , 2 & 3 were located in areas where the values of (yH/cb) were greater than 5.14 and the methods outlined above have been applied to the calculation of the earth pressures. The details of the field measurements are given in Technical Reports Nos. 6, 7, 8 of the Norwegian Geotechnical Institute 6 - 8 wh i le some of the data have been interpreted by F laa te 3 . In the calculat ions that fol low Flaate's value for c. the average shear strength above the base of the excavat ion has been used together wi th his values for the measured K„. The va lues of c „ . the shear strength in the plastic zone beneath the excavat ion, have been estimated from the data in the Techn ica l Reports of the Norwegian Geotechnical In stitute. A section through the Vaterland I excavation is shown in Fig. 5 whi le the relevant field data and calculated and measured values of K. are tabulated in Table 1 . The other site in wh ich the condit ions covered by the paper apply is in Mexico City and has been described by Rodriguez and F lamond 9 . The section is shown in Fig. 6 and the field data and values of K„ are given in Table I. The agreement between the values of K, calculated by the new method and those measured is satisfactory. For comparison, the values of K. found from Bel l 's equation are included in the table and. as can be seen, the differences between these values and those measured are very important.
o V
1= / V / ^ I ^ * -
1
F i g . 4 Variation of AKa with N and (d/H)
Tab le 1
Site d m
H m
AH m
X m
y tonnes m 3
c tonnes m 2
C , tonnes m 2
measured
K. calc. ( A ) *
ca lc . ( B ) '
Vaterland 1 5.2 10.4 — — 1.89 2.6 2.7 0.88 0.89 0.47
Vaterland 2 6.4 10.7 — 1.89 2.6 2.5 1.12 1.06 0.49
Vaterland 3 8.1 9.2 2 8 9.4 1.90 2.9 3.5 0.92 0.90 0.34
Mexico City 5.0 9.0 2.3 11.0 1.22 2.1 1.6 0.66 - 0 . 8 0
0.79 0.23
*A Proposed new method * B Bel l 's equation
F i g . 1 Site plan 1 . The monument 2. The underpass
F i g . 2 Plan on underpass showing setting out points (s.o.p.)
frames, and on the computer using a space-frame analogy (program O A 1 0 2 ) . These results enabled suitable section sizes to be chosen and used in the final analysis. A three dimensional plate bending and shell analysis finite element program, developed at Swansea University, w a s used. The finite element method considers a continuous sys tem to be composed of a number of separate masses, wh i ch may be two or three dimensional and can have various shapes, interconnected at nodal points. The analysis is based on the structural stiffness method using matrix notation.
The symmetry of the structure meant that only a sixth portion need be analysed and the original triangles were further subdivided to give a finer mesh for more accurate results.
The program enabled the exact geometry of the roof, wa l ls and buttresses to be simulated in the data. Three loading condit ions were considered:
1 Self weight of the structure 2 Overburden 3 Superload from traffic.
Uniformly distributed loads are replaced in the data by a series of point loads acting at the node points of the triangular elements. Temperature effects on the exposed part of the dome were considered separately and the parapets reinforced accordingly.
Geometric data is a lways very prone to error and a check w a s carried out using a computer perspective plot. The mistakes were corrected and the final run executed.
The output gave results for each load case listing foundation reactions, nodal displacements, element bending moments and membrane forces. Plots were made of this data to give a visual representation of the behaviour of the structure. The computer analysis w a s very useful and the plots gave a good appreciation of the structural action, i.e. the stiffening effect of the ridges especially around the dome and the w a y the loads channel led down to the buttresses to combine arch and frame action across the section. The results were used to specif ically check:
1 Bearing pressures and tie forces across the floors from the foundation reactions
2 Final concrete stresses to confirm the adequacy of the sect ions chosen from the preliminary calculat ions
3 Bending moments across and along the sections and the reinforcement required to accommodate these moments.
Deta i l ing The unusual roof geometry wi th its numerous planes intersecting along converging ridges and valleys presented special problems in the reinforcement detailing. For instance, if at every line of discontinuity the standard corner detail (where the inner layer of steel from either direction passes into the outer layer) had been used, a large proportion of the steel wou ld have been employed in bond and lap lengths. The triangular modulation would also have dictated a continuous variation of bar lengths producing a major prebending headache to say nothing of the labours of schedul ing. To overcome these difficulties, the inner and outer reinforcement layers were detailed as independent mats passing continuously over va l leys and ridges composed of small diameter bars scheduled straight to be bent on site over the erected formwork, wi th the exception of bars crossing val leys, wh ich were scheduled bent to avoid the practical difficulty of bending a bar accurately into a formwork valley. A maximum bar diameter of 1 2 mm w a s used to facilitate in situ bending and bars were bundled in threes throughout to facilitate concrete placement.
In order to prevent bursting of the inner mat of steel at ridges and the outer mat at val leys, the two layers were linked along these lines by providing straight longitudinal bars parallel to the line of discontinuity in the cover thickness to each mat and interconnecting these bars at regular centres by 'hairpin' l inks of 8 mm bar bent in place.
The remainder of the detailing fol lowed fairly conventional lines except that the steel passing from the wal ls into the roof w a s also affected by the varying roof profile. Here large diameter bars were used but, to avoid prebending these bars to each separate roof angle, an upstand w a s introduced above the wal l to accommodate the lap between standard wal l bars and roof steel approaching from different angles.
C o n s t r u c t i o n In spite of its shape, the construction of the underpass w a s fairly convent ional, and gave no extraordinary problems to the contractor, the M A P Company.
The closure of one carr iageway of Eisenhower Avenue, together wi th the construction of a temporary by-pass of the underpass area to take the diverted traffic, led to the decision to construct two of the three legs in the first stage. One w a s the wes t leg giving the con tractor easy access from within the roundabout. In the second stage, wi th traffic running over the two legs already constructed, the other carr iageway would be closed and the third leg of the underpass formed. Excavat ion by loader w a s extremely easy in the typical Tehran sandy gravel w h i c h also has enough cohesion to stand up vertically for the depth of excavat ion needed for the 3
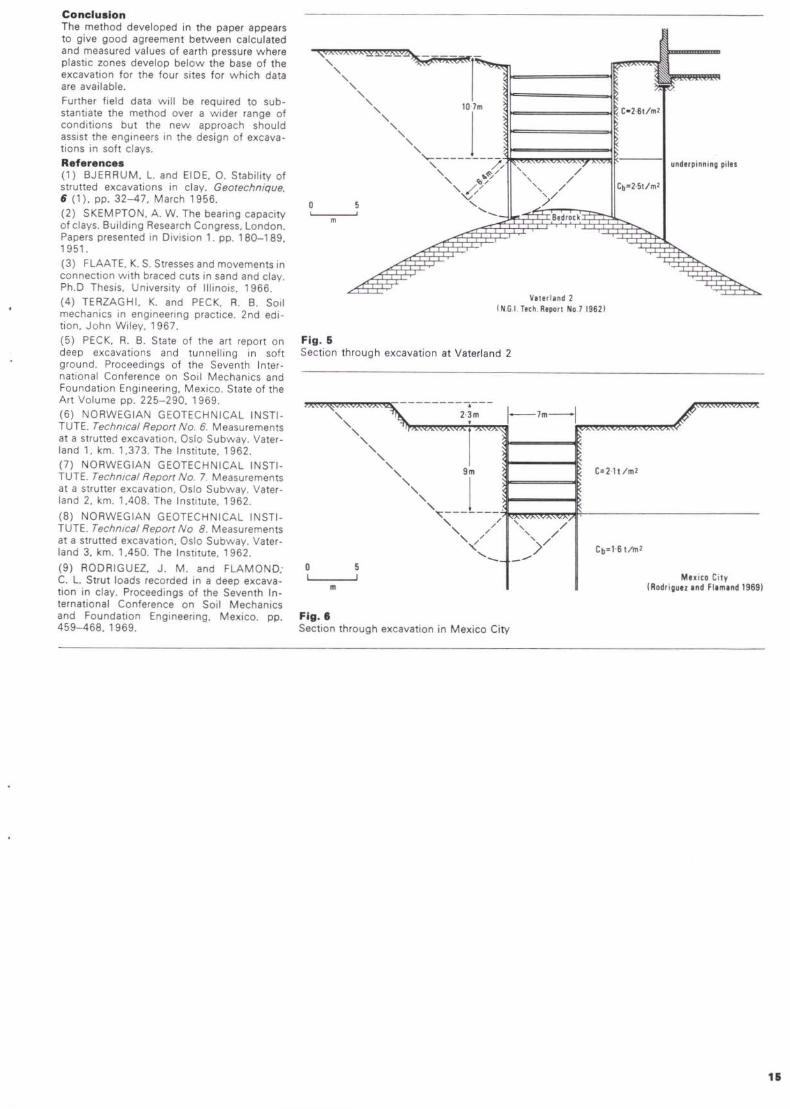
THEARUP JOURNAL
Vol. 6 No. 4 December 1971 Published by Ove A r j p Partnership 13 Fitzroy Street, London. W1 P 6BQ
Editor: Peter Hoggett Art Editor: Desmond Wyeth F S I A Editorial Assistant: David Brown
Front cover: Persian builders at work (From a Persian MS. , about A D 1494) Reproduced wi th the permission of the British Museum.
Back cover: Interior of the arch of the Shahyad Ariamehr (Photo: Duncan Michael)
The Shahyad Ariamehr pedestrian underpass John Harvey, Robert Afia and Peter Evans A r c h i t e c t s : H o s s e i n A m a n a t and A s s o c i a t e s
Ma in C o n t r a c t o r : M A P C o m p a n y
In t roduct ion The Shahyad Ariamehr monument, built to commemorate the 25th centenary of the foundation of the Iranian Empire, stands near the centre of a large roundabout on the outskirts of Tehran on the main dual carr iageway leading to and from the airport. The site is therefore ideal for the purpose of displaying a structure designed to be v iewed from a distance and from all directions, but presents a problem in facilitating pedestrian access across the traffic 'moat' to the base of the monument and into the surrounding ornamental gardens. Of the two possible so lutions, a tunnel beneath or a bridge over the six lane carr iageway, the latter w a s presumably considered inappropriate as the span and pedestrian capacity would dictate a structure of a size wh ich would constitute a significant obstruction and distraction to the v iew of the monument itself. Our brief, therefore, w a s to design a tunnel structure having a shape and internal surface configuration determined by the architects for the monument project. Hossein Amanat and Associates. G e o m e t r y The general plan configuration is of three similar tunnel arms radiating at 120° centres from a central dome area connect ing the east side of the roundabout to both the north and south sides of the eastern approach and exit
2 carr iageways. The entrances from the carriage
w a y flanks are identical stair and ramp wel ls placed skew to the tunnel centre line to fol low the kerb line above, whi le the entrance from the roundabout is from a low level con course at tunnel floor level. The central dome roof level rises above ground in the carriageway central reservation and a parapet opening provides natural lighting and ventilation to the tunnel below.
As the overall shape and internal surface geometry are perhaps most readily appreciable from the drawings, only a brief overall description is given here. As the basis for the geometry, four setting out points are establ ished; three on the apexes of an equilateral triangle of side length 80 m, and the fourth at the centroid of this triangle. The tunnel on plan at floor level occupies the area contained between circular arcs of radius 36 m swung from the three apex setting out points. L ines drawn through the centroidal setting out point perpendicular to the sides of the original triangle define the longitudinal axes of the tunnel arms so formed. Three further circular arcs, concentr ic wi th, but of greater radius than, the first, define the boundaries of the roof. The roof surface is horizontal at all points around these boundaries but varies in level wi thin, both along the tunnel arms and in particular in the central area where it rises to form the parapet to the opening at ground level. Within this basical ly curved setting out network the internal wal l and roof surfaces are made up entirely of flat planes intersecting (therefore) along straight l ines. The wa l ls wh ich are of constant height and incl ined inwards towards the roof fo l low the circular setting out curves at floor and roof level in a series of equal chords, the length of wh i ch are defined by a 30° arc from the central setting out point. The roof surface is entirely composed of triangular planes, the apexes of wh i ch are defined on plan as points of intersection of circular arcs and radial lines from the four original setting out points.
S t r u c t u r a l p r o p o s a l s The tunnel shape suggested two alternative 'opt imum' structural systems; firstly that the planar configuration should be abandoned in
C o n t e n t s
The Shahyad Ariamehr 2 pedestrian underpass, by J . Harvey, R. Afia and P. Evans
Notes on the design 6 of cable roofs, by P. Rice
Stressed rock-anchor 10 antenna-support towers, by R. Kelman and H. Holmes
The calculation of earth pressure in 1 3 open cuts in soft c lays, by D. Henkel
favour of the continuously curved surface to wh i ch it approximates to take fullest advantage of the basic shape to derive in-surface strength; or secondly to develop the hipped plane principle further and so, by increasing the hip and valley angles, to produce a folded plate structure of high flexural strength. Both possibilities were put to the architect in principle but neither w a s acceptable as each changed the geometry significantly. The simplest structure of a constant thickness reinforced concrete slab fol lowing the speci fied geometry w a s considered but the steepness of the wal ls is such that little resistance to lateral thrust could be developed at the roof springing and the advantage of the vaulted and domed roof shape is wasted. The possibility of reinforcing the roof slab wi th a network of upstanding beams w a s investigated but w a s abandoned primarily because of the geometric difficulties in fitting such a structure beneath road formation level in the area of the central dome, although an additional disadvantage inherent in the use of upstanding beams is that the roof slab, lying in the lower tensile zone of these beams, may be subject to cracking through its full depth wh ich would lead to waterproofing problems, lying as it does in a permeable granular material subject to vibration. The structure finally adopted uses external buttresses to provide the thrust resistance to the roof arch. It w a s originally envisaged that the buttresses would risefVom inclined foundations transferring the thrusts directly to the ground, but in v iew of the possibility that future excavat ions (perhaps for services adjacent to the carr iageway) might disturb the ground in these areas wi th perhaps calamitous results, the foundation system w a s changed to horizontal pads tied across the tunnel floor. A n a l y s i s
The traditional triangular panels were very convenient as far as modern day methods of structural analysis were concerned—being almost ready-made finite elements. Preliminary calculat ions had been carried out at the scheme design stage by hand, approximating the structure to a series of portal
C o n c l u s i o n The method developed in the paper appears to give good agreement between calculated and measured values of earth pressure where plastic zones develop below the base of the excavat ion for the four sites for wh i ch data are available. Further field data wi l l be required to substantiate the method over a wider range of condit ions but the new approach should assist the engineers in the design of excava tions in soft c lays. R e f e r e n c e s ( 1 ) B J E R R U M . L and E I D E , O. Stabil ity of strutted excavat ions in clay. Geotechnique, 6 ( 1 ) . pp. 3 2 - 4 7 . March 1 956. (2 ) S K E M P T O N . A. W. The bearing capacity of c lays. Bui lding Research Congress. London. Papers presented in Division 1 . pp. 1 8 0 - 1 8 9 , 1 9 5 1 .
(3) F L A A T E . K. S . Stresses and movements in connect ion wi th braced cuts in sand and clay. Ph.D Thes is . University of Ill inois, 1966. (4 ) T E R Z A G H I , K. and P E C K . R. B. Soil mechanics in engineering practice. 2nd edition, J o h n Wiley. 1967. (5 ) P E C K , R. B. State of the art report on deep excavat ions and tunnell ing in soft ground. Proceedings of the Seventh International Conference on Soi l Mechanics and Foundation Engineering, Mexico. State of the Art Volume pp. 2 2 5 - 2 9 0 , 1 969. (6 ) N O R W E G I A N G E O T E C H N I C A L I N S T I T U T E . Technical Report No. 6. Measurements at a strutted excavat ion. Oslo Subway . Vater-land 1 . km. 1.373. The Institute, 1962. (7 ) N O R W E G I A N G E O T E C H N I C A L I N S T I T U T E . Technical Report No. 7. Measurements at a strutter excavat ion, Oslo Subway . Vater-land 2. km. 1.408. The Institute, 1962.
(8 ) N O R W E G I A N G E O T E C H N I C A L I N S T I T U T E . Technical Report No 8. Measurements at a strutted excavat ion. Oslo Subway . Vater-land 3. km. 1.450. The Institute. 1962.
(9 ) R O D R I G U E Z , J . M. and F L A M O N D ; C . L. Strut loads recorded in a deep excava tion in clay. Proceedings of the Seventh In ternational Conference on Soil Mechanics and Foundation Engineering. Mexico, pp. 4 5 9 - 4 6 8 , 1969 .
CT.VM.UA
> C - 2 6 t / m !
underpinning piles
C b = 2 5 t / n V
Tlr, I BedrockTH"**T^L
Vater I and 2 IN G I Tech Report No 7 I 9 6 2 I
F i g . 5 Section through excavation at Vaterland 2
AWA.WAWAA 2 3 m
I f > 2 1 t / m 2
C b = 1 6 t / m 2
M e x i c o C i t y (Rodr iguez and F l t m a n d 1969 )
F i g . 6 Section through excavation in Mexico City
15


![DCS World Su-25T - Escuadr??n de Vuelo Virtual Ruso World Su-25T Manual de... · Manual de Vuelo. DCS [Su-25T Frogfoot] ii DCS World Su-25T es un juego para PC gratis. Incluye el](https://img.pdfslide.us/doc/110x75/5a7958ae7f8b9af91c8d127b/dcs-world-su-25t-escuadrn-de-vuelo-virtual-world-su-25t-manual-demanual-de.jpg)