Embed Size (px)
Citation preview
The Zero Emission Vehicle Program An Analysis of Industry’s Ability to
Meet the Standards
Simon Mui, Ph.D., Scientist, Clean Vehicles and Fuels, NRDC Alan Baum, Principal, Baum and Associates, LLC
May 2010 Natural Resources Defense Council
2
Table of Contents
Table of Contents .......................................................................................................................................... 2
1. Summary ............................................................................................................................................... 3
2. Forecasts ............................................................................................................................................... 7
2.1 Assumptions .................................................................................................................................. 7
2.2 Results ........................................................................................................................................... 9
2.3 Comparison with Other Forecasts ............................................................................................... 12
2.4 Planned Production Locations .................................................................................................... 13
2.5 California Share of Electric-Drive Vehicles ............................................................................... 14
3. The Zero Emission Vehicle Program (ZEV) ...................................................................................... 15
3.1 ZEV Program Requirements ....................................................................................................... 16
3.2 Can the ZEV program requirements be met? An analysis of the industry’s ability to comply ... 18
3.3 Forecasted ZEV Credit Generation by the Industry .................................................................... 19
3.4 Forecasted ZEV Credit Generation by Manufacturer ................................................................. 20
3.5 ZEV and Section 177 States........................................................................................................ 23
4. Conclusion .......................................................................................................................................... 25
About the Authors: .................................................................................................................................. 26
Disclaimer: The Planning Edge and Baum and Associates are pleased to collaborate with NRDC
on the technical analysis presented in this paper. The policy recommendations contained
herein do not represent the views of the Planning Edge or Baum and Associates, whose
expertise is limited to the technical and forecasting areas.
3
1. Summary
Since the 1990s, California’s Zero Emission Vehicle (ZEV) program has served as a critical technology-
forcing component of the state’s vehicle emissions program. Today, the ZEV program has also been
adopted by ten other states, making it one of the single-largest policy drivers for the production of
electric-drive vehicles nationally such as pure battery electrics (BEVs), fuel cell vehicles (FCVs), and plug-
in hybrid electric vehicles (PHEVs).
Currently, California’s Air Resources Board (ARB) is moving to strengthen the program for model years
2015 and beyond, focusing the program more on electric-drive vehicles and greenhouse gas (GHG)
emissions reduction.1 The goals of the ZEV program include helping assure the transformation needed
for very low or zero-emitting vehicles consistent with the State goal of an 80% reduction in GHG
emissions by 2050. Improvements in conventional internal combustion engine vehicles are critical, but
will be unlikely to enable this 2050 goal to be reached. A strengthened ZEV program that leads to
commercialization of electric-drive vehicles in the near term will be needed to achieve this goal because
of the time needed for the current fleet to turnover, or be replaced, and the emission reductions
trajectory.
An assessment was conducted to evaluate automaker’s ability to comply with the ZEV requirements in
California and in other states that have adopted the standards (herein, section 177 states). Forecasts
generated by The Planning Edge were conducted on automakers’ planned production and sales of
electric-drive vehicles over the next five model years. Over forty vehicle models from twelve major
original equipment manufacturers (OEMs) and ten new entrants are considered in the forecasts.
The results of the forecasts show that the U.S. market for electric-drive vehicles will grow from
approximately 85,000 vehicles in model year (MY) 2012 to between 320,000 to 540,000 by MY 2015,
with cumulative U.S. sales reaching 1 to 1.3 million for electric-drive vehicles by 2015. The range reflects
low and high oil price cases. Slightly over one-quarter of these vehicles are estimated to be produced by
new entrants.
For California, it is estimated that 40,000 to 140,000 vehicles could be sold in MY 2015 in the low and
high cases, respectively, with cumulative sales ranging from 115,000 to 370,000 by 2015. The analysis
also considers the industry’s ability to comply given California’s requirements together with other states
that have adopted California’s ZEV program, as authorized under Clean Air Act Section 177. As shown
below, the forecasted U.S. sales over each ZEV period will likely greatly exceed the ZEV requirements for
both CA and Section 177 states. Overall, the forecasts show that the auto industry will likely over-
comply with the ZEV requirements through the MY 2020 time period even for a low-growth case
scenario that holds MY 2015 sales nearly flat out to MY 2020.
1 The ARB is also moving to simplify the program by removing some categories commercialized “partial” zero emission vehicles and considering their emission benefits as part of the next revision of the state’s low emission vehicle (LEV) standards for criteria emission. Air Resources Board, State of California, Resolution 09-66, December 9, 2009.
4
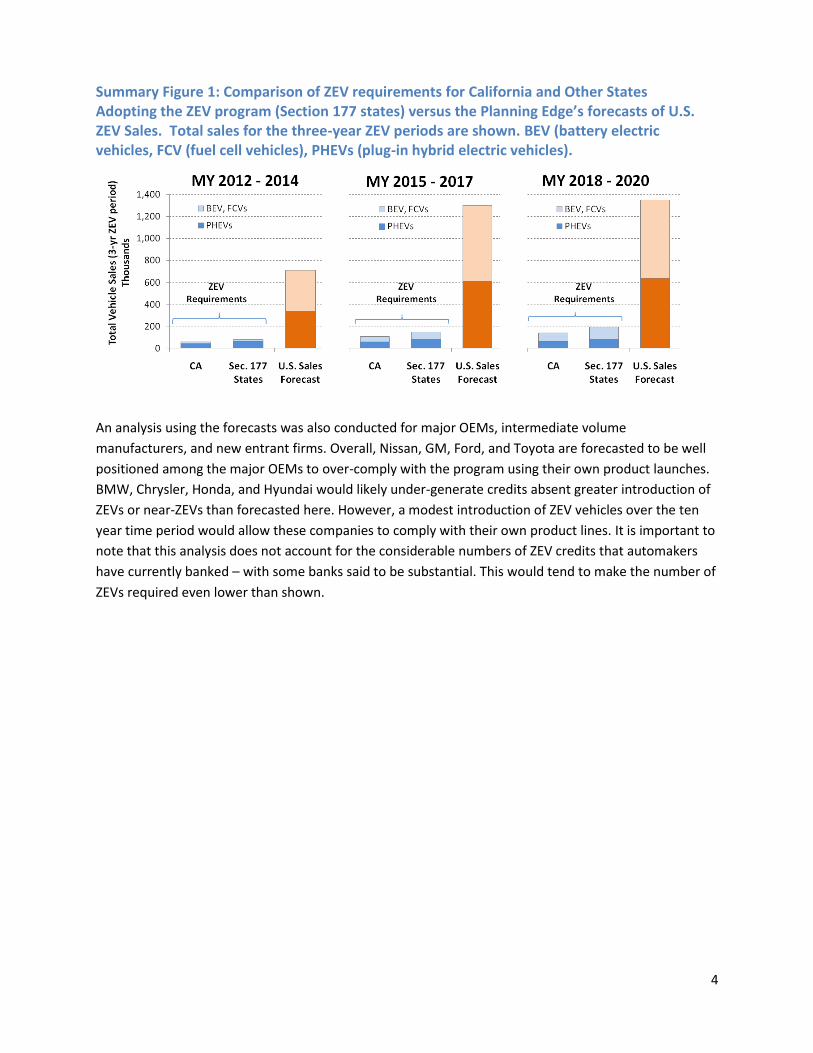
An analysis using the forecasts was also conducted for major OEMs, intermediate volume
manufacturers, and new entrant firms. Overall, Nissan, GM, Ford, and Toyota are forecasted to be well
positioned among the major OEMs to over-comply with the program using their own product launches.
BMW, Chrysler, Honda, and Hyundai would likely under-generate credits absent greater introduction of
ZEVs or near-ZEVs than forecasted here. However, a modest introduction of ZEV vehicles over the ten
year time period would allow these companies to comply with their own product lines. It is important to
note that this analysis does not account for the considerable numbers of ZEV credits that automakers
have currently banked – with some banks said to be substantial. This would tend to make the number of
ZEVs required even lower than shown.
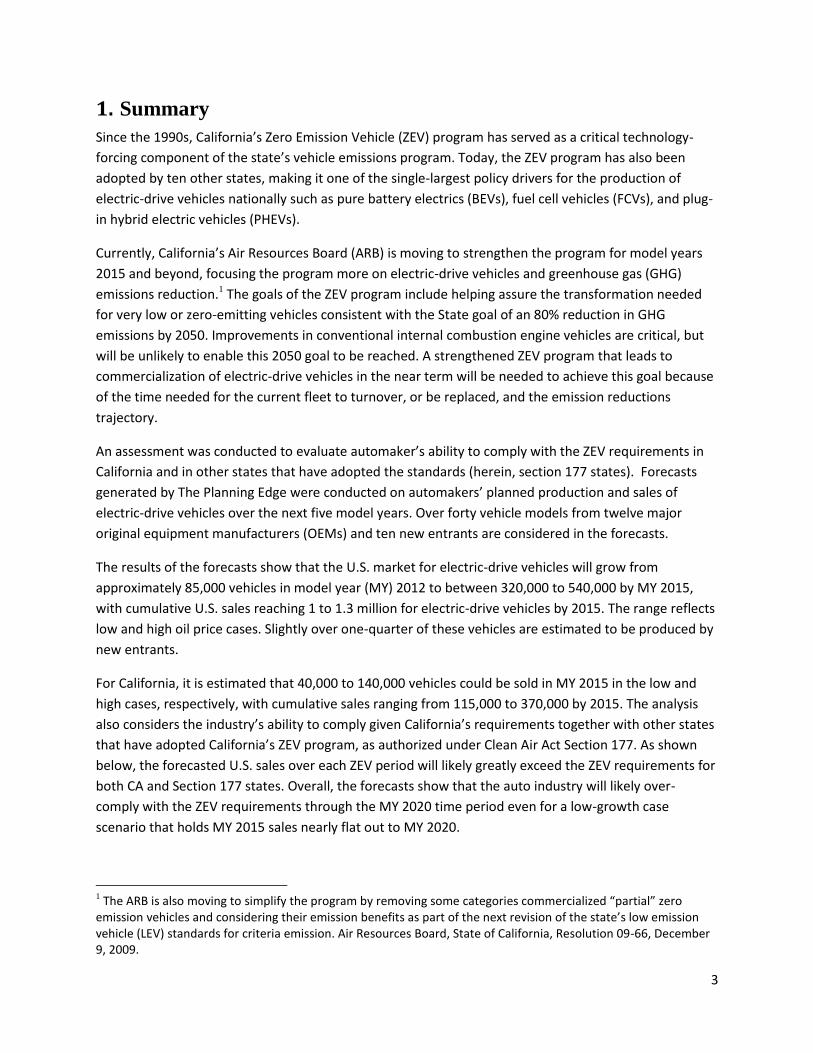
Summary Figure 1: Comparison of ZEV requirements for California and Other States Adopting the ZEV program (Section 177 states) versus the Planning Edge’s forecasts of U.S. ZEV Sales. Total sales for the three-year ZEV periods are shown. BEV (battery electric vehicles, FCV (fuel cell vehicles), PHEVs (plug-in hybrid electric vehicles).
5
Summary Figure 2: ZEV credits required by each major OEM (left bar) compared to the ZEV credits forecasted to be generated by the OEMs in the low sales case (middle bar) and higher sales case (right bar). Results for MY 2015 are shown.
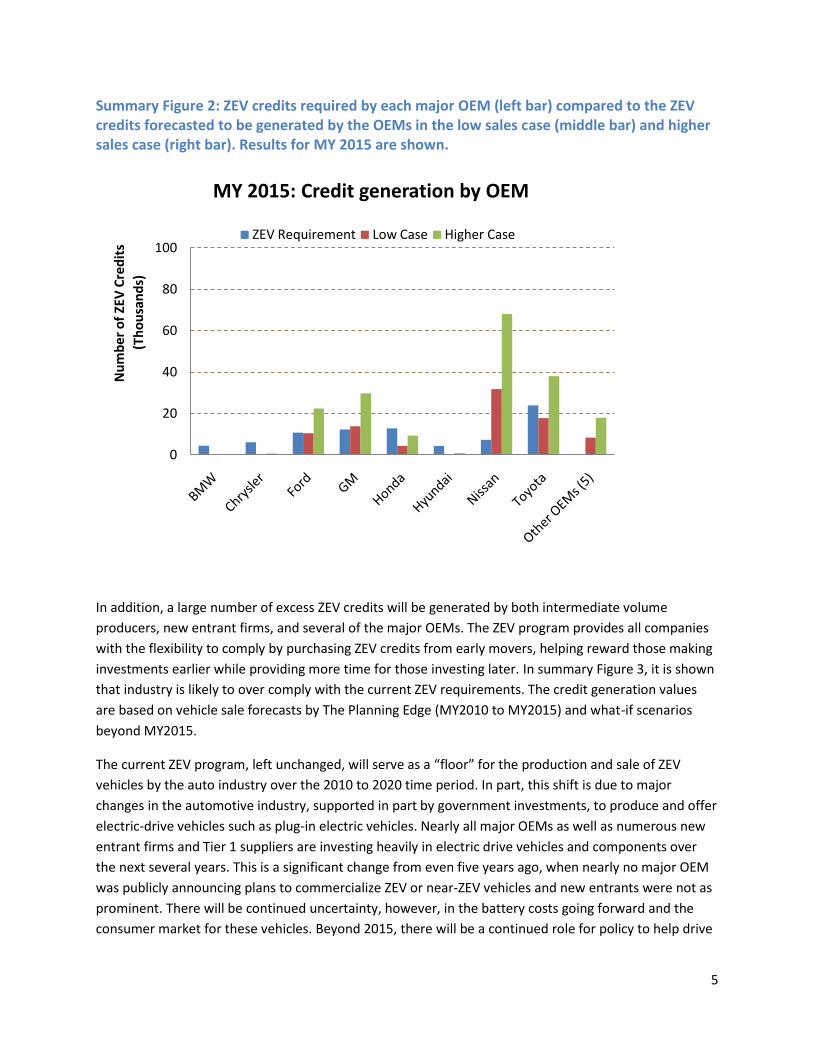
In addition, a large number of excess ZEV credits will be generated by both intermediate volume
producers, new entrant firms, and several of the major OEMs. The ZEV program provides all companies
with the flexibility to comply by purchasing ZEV credits from early movers, helping reward those making
investments earlier while providing more time for those investing later. In summary Figure 3, it is shown
that industry is likely to over comply with the current ZEV requirements. The credit generation values
are based on vehicle sale forecasts by The Planning Edge (MY2010 to MY2015) and what-if scenarios
beyond MY2015.
The current ZEV program, left unchanged, will serve as a “floor” for the production and sale of ZEV
vehicles by the auto industry over the 2010 to 2020 time period. In part, this shift is due to major
changes in the automotive industry, supported in part by government investments, to produce and offer
electric-drive vehicles such as plug-in electric vehicles. Nearly all major OEMs as well as numerous new
entrant firms and Tier 1 suppliers are investing heavily in electric drive vehicles and components over
the next several years. This is a significant change from even five years ago, when nearly no major OEM
was publicly announcing plans to commercialize ZEV or near-ZEV vehicles and new entrants were not as
prominent. There will be continued uncertainty, however, in the battery costs going forward and the
consumer market for these vehicles. Beyond 2015, there will be a continued role for policy to help drive
0
20
40
60
80
100
Nu
mb
er o
f ZE
V C
red
its
(Th
ou
san
ds)
MY 2015: Credit generation by OEM
ZEV Requirement Low Case Higher Case
6
down technology costs and to address other hurdles faced by ZEVs and near-term ZEVs, such as the
need for ZEV charging or refueling infrastructure. However, the ZEV program by itself provides a critical
floor to ensure that current investments continue and that certainty is provided to the marketplace for
the nascent electric-drive industry.
Based on NRDC’s analysis, the ZEV program can be justifiably strengthened above current requirements
over the MY2015 to MY2020 time period. Doing so will allow the ZEV program to better reflect real
changes in the industries’ expected product offerings and help ensure automakers are investing to
commercialize technology necessary to reach post 2020 GHG emission reduction goals. Particularly in
the post MY 2015 time period, increased ZEV requirements would help ensure that major OEMs offer
ZEV or near-ZEV technologies in their product lines.
Summary Figure 3: Estimated industry ZEV credit generation versus current industry ZEV requirements (California).
0
100
200
300
400
500
ZEV
Cre
dit
s (t
ho
usa
nd
s)
Model Year
Annual ZEV Credit Generation
Higher Sales Case
Low Sales Case
ZEV Requirements
7
2. Forecasts
The forecast of sales volumes for the U.S. market, conducted by The Planning Edge, includes estimates
for plug-in hybrid electric vehicles (PHEVs), pure battery electric vehicles (BEVs), and fuel cell vehicles
(FCVs). Note that The Planning Edge’s forecast period was for the 2010 through 2015 model years (MY)
only. This forecast was then used by NRDC as a basis to consider “what if” cases for sales to the
California market, with a low case based on California’s historic market share and a higher case based on
a higher market share for California, analogous to historic sales of conventional hybrids.
2.1 Assumptions
The data and figures are based on a bottom-up assessment of over forty vehicle models planned for
introduction over the next five years. The list includes twelve large and intermediate volume
manufacturers and ten new entrant firms. The estimates by The Planning Edge account for information
from company reports, media reports, consulting reports, capital investments, expert judgment, and
forecasting tools. The approach is described below in more detail by walking through the methodologies
for established OEMs and for new entrants.
In general, these estimates are more conservative – in some cases far more -- than media or company
reports. This approach reflects several hurdles including:
concerns about market demand (perhaps due to lower fuel prices than anticipated);
concerns that government policies and incentives do not reach the level to maintain demand beyond early adopters; and
lack of technological progress that would not allow for reduced costs beyond current levels for large automakers.
The Planning Edge forecasts use different approaches for established automakers and the significant
number of startups. Established OEMs have a number of key advantages that allow us to have more
confidence in their ability to reach higher levels of output at a quicker pace including:
1) an existing product development process which is critical in an area where technology is so critical;
2) access to an existing supply base and the ability to broaden that base as required; 3) capital availability as well as the ability to sustain financial losses early on; 4) production capacity either in place or which can be added; and 5) an existing system to market and sell its products.
The Planning Edge forecast results for these manufacturers take into account their stated goals and put
them into context with other programs from these companies, including those in the new technology
area or in more traditional products. We also evaluate the positioning of this product within their
broader product mix, the goals of the product for the company (e.g., the Volt is central to GM’s
positioning of the entire company), and the company’s financial position. Different companies are
focusing on different approaches within the alternative vehicle area and an evaluation is made of each
product and how it “fits” with the company’s goals. In the early years, demand is less important than the
available supply since volumes will generally be limited due to cost and production constraints. In later
8
years, customer demand will be critical and the alternative scenarios account for variations in that
demand based on a number of factors including product cost and the price of gasoline. Thus, beyond
2015 there will still be a continued role for policy to help drive down costs and to address other hurdles
faced by ZEVs and near-term ZEVs, such as the need for ZEV charging or refueling infrastructure.
The approach for startup manufacturers takes into account their special circumstances with a focus on
the following factors:
1) access to capital varies among these firms with some well-funded from established sources,
while others are more reliant on a limited number of sources (e.g., more than one company has
foundered due to its failure to obtain government loan and grant funding);
2) ability to develop product is a factor with some “starting from scratch” while others are using
full or partial existing designs and modifying them for their specific purpose;
3) ability to produce the product and attract appropriate suppliers to their projects; and
4) marketing approach to attract customers beyond the early adopters who are already interested
in new technology products.
The Planning Edge is particularly conservative, and in some cases skeptical, of the volumes cited by
many of the new startup companies (particularly as compared to existing OEMs) because these numbers
are often used to attract both private capital and governmental support. The track record of key
individuals is important (some of which have big names from the financial or governmental sectors), but
must be supplemented by operating personnel in the product development, manufacturing, and
marketing arenas. With these firms in particular, the ramp-up from initial production to greater scale is
subject to a number of hurdles.
For the more speculative, new entrant firms, the hurdles include marketing hurdles, even if the segment
takes off, since the larger firms will exploit that opportunity thereby taking a greater share of the overall
demand. There are many uncertainties because this market is a nascent one, but the analysis attempts
to balance these factors in order to arrive at a forecast that encompasses multiple scenarios.
While costs to both the manufacturers and the consumers are a major issue (and in any event will have
a significant impact on the level of supply and demand of alternative vehicles), it would be too simplistic
to assume that these costs will preclude the industry from succeeding. The significant amount of public
and private investment as well as national Corporate Average Fuel Economy (CAFE),greenhouse gas
requirements, and California’s ZEV requirements are providing useful incentives to the developing
industry. The Advanced Technology Credits for ZEVs and near ZEVs written into the U.S. Environmental
Protection Agency and Department of Transportation’s National Program, also called Advanced
Technology Credits, will provide additional incentive to this growing market.2 While it might seem that
2 As part of the joint final rule for light duty vehicle GHG emission and CAFE standards (http://www.epa.gov/otaq/climate/regulations.htm), EPA provides an incentive for the first 200,000 vehicles produced by each automaker over the MY2012 to MY2016 time period that are EVs, PHEVs, or FCVs. The incentive
9
the ZEV market is unusual in terms of its development, the consumer market and the automotive
market in particular is full of examples where new products were costly to both companies and
consumers at early stages of development. Costs are of course critical to the timing and scale of the
development of the market, but it should not be assumed that the current cost level will result in an
aborted effort in this product area.
The forecast for ZEV vehicles benefits from being part of a forecasting model of the entire North
American automotive market. This model incorporates a variety of economic and industry factors and
uses mathematical relationships among these factors, but also includes the judgment of the model’s
authors to inform the assumptions. This is particularly critical for this developing market where a long
history of experience is not available. While detailed econometric models have their place, better results
for the ZEV market will be obtained with detailed analysis by forecasters understanding the unique
circumstances of the companies involved in the production of the vehicles and knowledge of the
consumers that will purchase these products. Of course, emerging markets such as this one are difficult
to forecast. The inclusion of multiple scenarios is intended to address this issue.
2.2 Results
Figure 1 displays a summary of the forecasts broken down by technology type and model year. Note
that FCVs are largely expected to be test fleets before 2015, and that numbers will increase modestly
after 2015 if these tests are successful, technology and cost milestones are met, and market conditions
and/or incentives are favorable.3 The percent of total annual sales that is forecasted to be comprised of
offerings by new entrant firms is also shown on the right-axis. New entrants firms are defined as
automakers that have not sold vehicles previously in the U.S. in intermediate or large volumes. New
entrants include start-ups such as Tesla or Coda as well as Fisker, BYD, Meyers Motors, and Reva.
is in the form of a “zero” CO2e/mile value for these ZEV and near-ZEV vehicles. Manufacturers that act early to produce 25,000 advanced technology vehicles in MY2012 will have their production cap increased to 300,000 vehicles. 3 Note that several major OEMs are investing in hydrogen fuel cell programs and are considering vehicle launches, particularly in areas where infrastructure concerns are addressed by policy, such as with California’s Clean Fuels Outlet regulations for example.
10
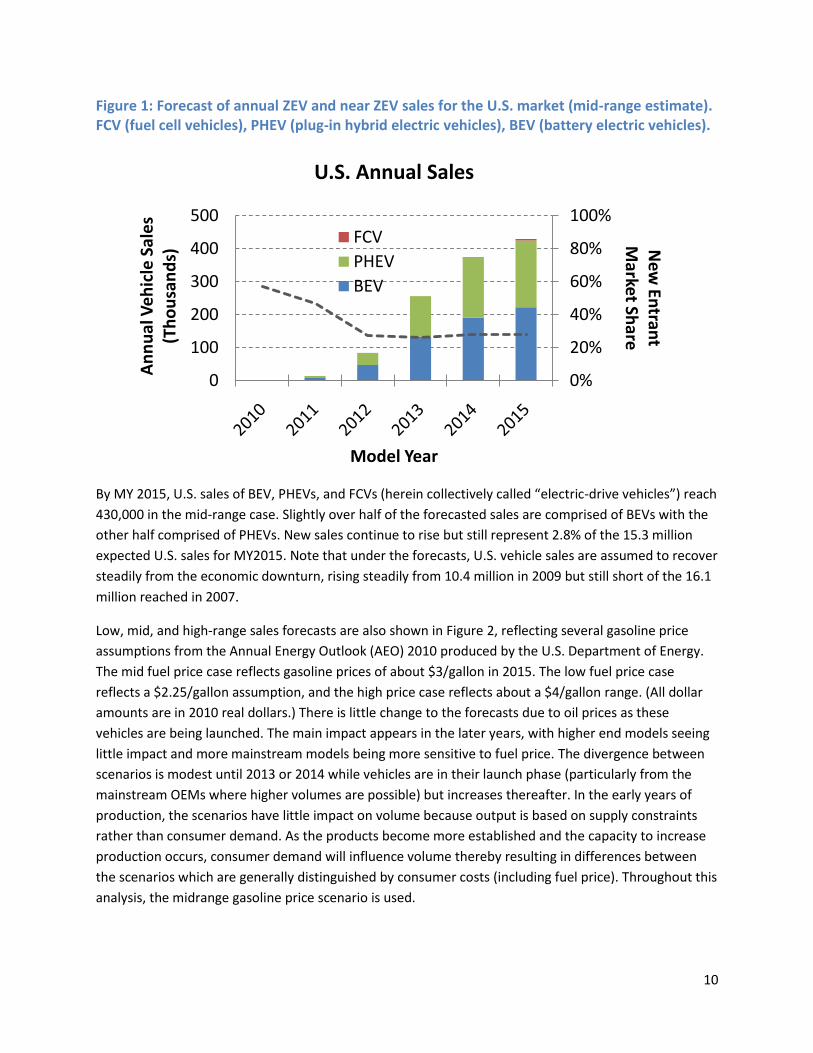
Figure 1: Forecast of annual ZEV and near ZEV sales for the U.S. market (mid-range estimate). FCV (fuel cell vehicles), PHEV (plug-in hybrid electric vehicles), BEV (battery electric vehicles).
By MY 2015, U.S. sales of BEV, PHEVs, and FCVs (herein collectively called “electric-drive vehicles”) reach
430,000 in the mid-range case. Slightly over half of the forecasted sales are comprised of BEVs with the
other half comprised of PHEVs. New sales continue to rise but still represent 2.8% of the 15.3 million
expected U.S. sales for MY2015. Note that under the forecasts, U.S. vehicle sales are assumed to recover
steadily from the economic downturn, rising steadily from 10.4 million in 2009 but still short of the 16.1
million reached in 2007.
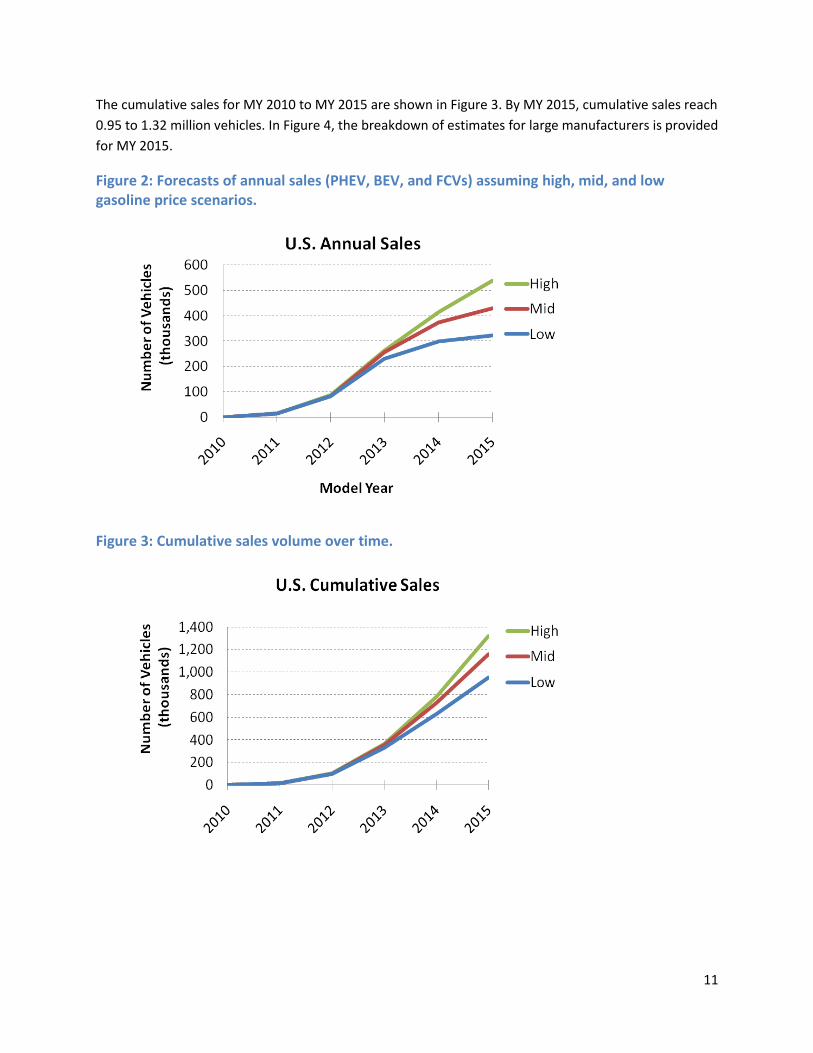
Low, mid, and high-range sales forecasts are also shown in Figure 2, reflecting several gasoline price
assumptions from the Annual Energy Outlook (AEO) 2010 produced by the U.S. Department of Energy.
The mid fuel price case reflects gasoline prices of about $3/gallon in 2015. The low fuel price case
reflects a $2.25/gallon assumption, and the high price case reflects about a $4/gallon range. (All dollar
amounts are in 2010 real dollars.) There is little change to the forecasts due to oil prices as these
vehicles are being launched. The main impact appears in the later years, with higher end models seeing
little impact and more mainstream models being more sensitive to fuel price. The divergence between
scenarios is modest until 2013 or 2014 while vehicles are in their launch phase (particularly from the
mainstream OEMs where higher volumes are possible) but increases thereafter. In the early years of
production, the scenarios have little impact on volume because output is based on supply constraints
rather than consumer demand. As the products become more established and the capacity to increase
production occurs, consumer demand will influence volume thereby resulting in differences between
the scenarios which are generally distinguished by consumer costs (including fuel price). Throughout this
analysis, the midrange gasoline price scenario is used.
0%
20%
40%
60%
80%
100%
0
100
200
300
400
500
New
Entran
t M
arket Share
An
nu
al V
eh
icle
Sal
es
(Th
ou
san
ds)
Model Year
U.S. Annual Sales
FCV
PHEV
BEV
11
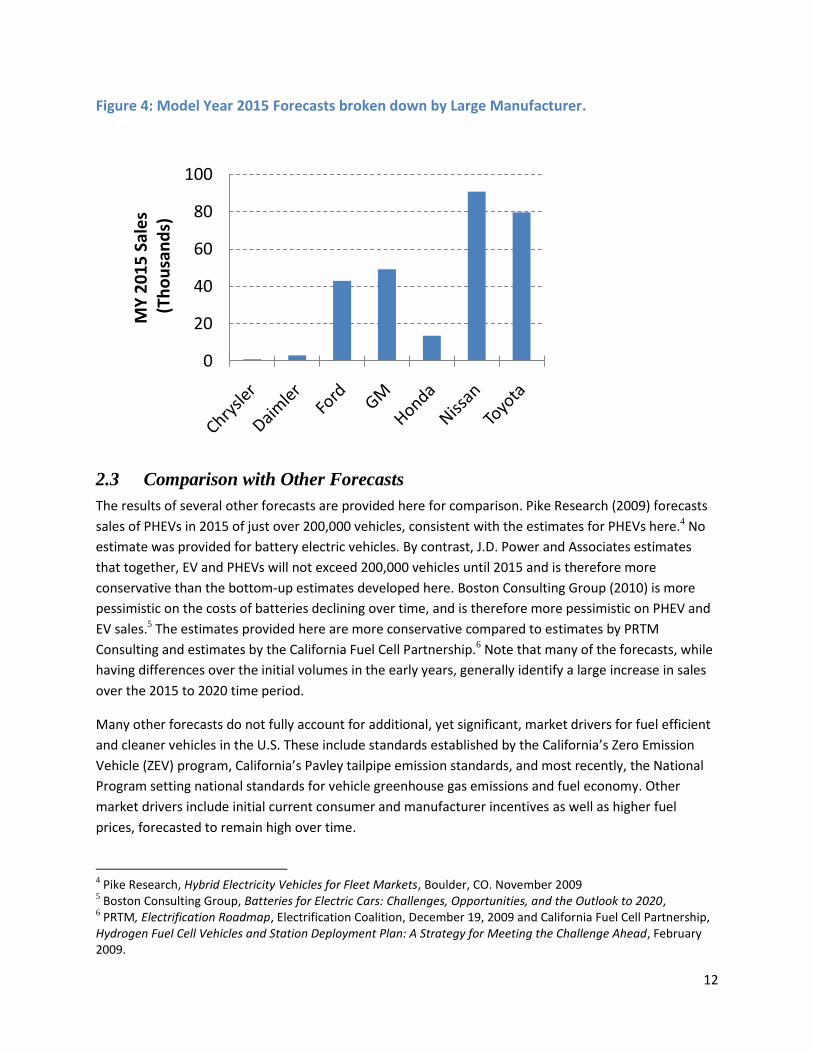
The cumulative sales for MY 2010 to MY 2015 are shown in Figure 3. By MY 2015, cumulative sales reach
0.95 to 1.32 million vehicles. In Figure 4, the breakdown of estimates for large manufacturers is provided
for MY 2015.
Figure 2: Forecasts of annual sales (PHEV, BEV, and FCVs) assuming high, mid, and low gasoline price scenarios.
Figure 3: Cumulative sales volume over time.
12
Figure 4: Model Year 2015 Forecasts broken down by Large Manufacturer.
2.3 Comparison with Other Forecasts
The results of several other forecasts are provided here for comparison. Pike Research (2009) forecasts
sales of PHEVs in 2015 of just over 200,000 vehicles, consistent with the estimates for PHEVs here.4 No
estimate was provided for battery electric vehicles. By contrast, J.D. Power and Associates estimates
that together, EV and PHEVs will not exceed 200,000 vehicles until 2015 and is therefore more
conservative than the bottom-up estimates developed here. Boston Consulting Group (2010) is more
pessimistic on the costs of batteries declining over time, and is therefore more pessimistic on PHEV and
EV sales.5 The estimates provided here are more conservative compared to estimates by PRTM
Consulting and estimates by the California Fuel Cell Partnership.6 Note that many of the forecasts, while
having differences over the initial volumes in the early years, generally identify a large increase in sales
over the 2015 to 2020 time period.
Many other forecasts do not fully account for additional, yet significant, market drivers for fuel efficient
and cleaner vehicles in the U.S. These include standards established by the California’s Zero Emission
Vehicle (ZEV) program, California’s Pavley tailpipe emission standards, and most recently, the National
Program setting national standards for vehicle greenhouse gas emissions and fuel economy. Other
market drivers include initial current consumer and manufacturer incentives as well as higher fuel
prices, forecasted to remain high over time.
4 Pike Research, Hybrid Electricity Vehicles for Fleet Markets, Boulder, CO. November 2009 5 Boston Consulting Group, Batteries for Electric Cars: Challenges, Opportunities, and the Outlook to 2020, 6 PRTM, Electrification Roadmap, Electrification Coalition, December 19, 2009 and California Fuel Cell Partnership, Hydrogen Fuel Cell Vehicles and Station Deployment Plan: A Strategy for Meeting the Challenge Ahead, February 2009.
0
20
40
60
80
100
MY
20
15
Sal
es
(Th
ou
san
ds)
13
The history of penetration of standard hybrid vehicles provides some guidance for the extent to which
ZEV vehicles are likely to be adopted absent fuel efficiency or GHG emission standards and at relatively
low fuel prices. However, the market drivers for hybrids during the late 1990s and past decade were
significantly different than today. In general, the adoption of these vehicles has been relatively modest,
with rates of 2 to 3 percent of total national vehicle sales. However, the commitment of most
manufacturers to hybrid products has also been modest until more recently. The first five years of
hybrid introduction into the U.S. (starting in 1999) was characterized by two OEMs introducing a total of
three hybrid model (Toyota Prius, Honda Insight and Civic). More recently, other manufacturers
recognized the marketing advantages obtained by Toyota as the leader in hybrids via the Prius, thereby
influencing other manufacturers to invest in alternative vehicle products.
Compared to the early years of hybrid introduction, The Planning Edge forecasts that the first five years
of ZEV and near ZEV introductions could see thirteen (13) intermediate and major volume OEMs offering
over thirty (30) models and ten (10) new entrants offering over ten (10) models. While not all of these
model offerings are expected to go forward, significantly more ZEV models will likely be introduced
compared to the experience with conventional hybrids. In addition, both the market and regulatory
environment have significantly changed since the late 1990s. As noted above, stronger regulations in the
U.S. – and globally – in the areas of fuel efficiency and GHG emissions are resulting in increased
commitment by automakers to producing electric-drive products. Fuel prices are also forecasted to
remain high versus the previous decade and rise over time as global oil demand increases. Going
forward, increased ZEV demand will occur from consumers as product choice increases along with more
competitive pricing for these vehicles (including government incentives).
Normalizing the hybrid sale volumes by model offering is illustrative. In 2007, when U.S. hybrid sales
peaked, approximately 350,000 hybrids were sold in the U.S. and six hybrid models offered. On average,
roughly 58,300 units were sold per model offering in 2007, led mainly by the Toyota Prius. By 2009, the
economic downturn had dramatically reduced U.S. auto and hybrid sales. By then, twenty-one hybrid
models were offered with most of the new hybrids being in the first year or two of introduction (four
Lexus hybrid, eight GM hybrids, two additional Ford hybrids, and one Toyota hybrid). With the economic
downturn and most of the hybrids being in their initial year of sales, just over 290,000 hybrid units were
sold. On average, 13,800 units per were sold per model offering in 2009. For comparison, the forecasts
by The Planning Edge show on average result in 9,500 ZEV or near-ZEV vehicles sold per model offering.
This is significantly less than the hybrid experience in both the peak year (2007) and low year (2009).
2.4 Planned Production Locations
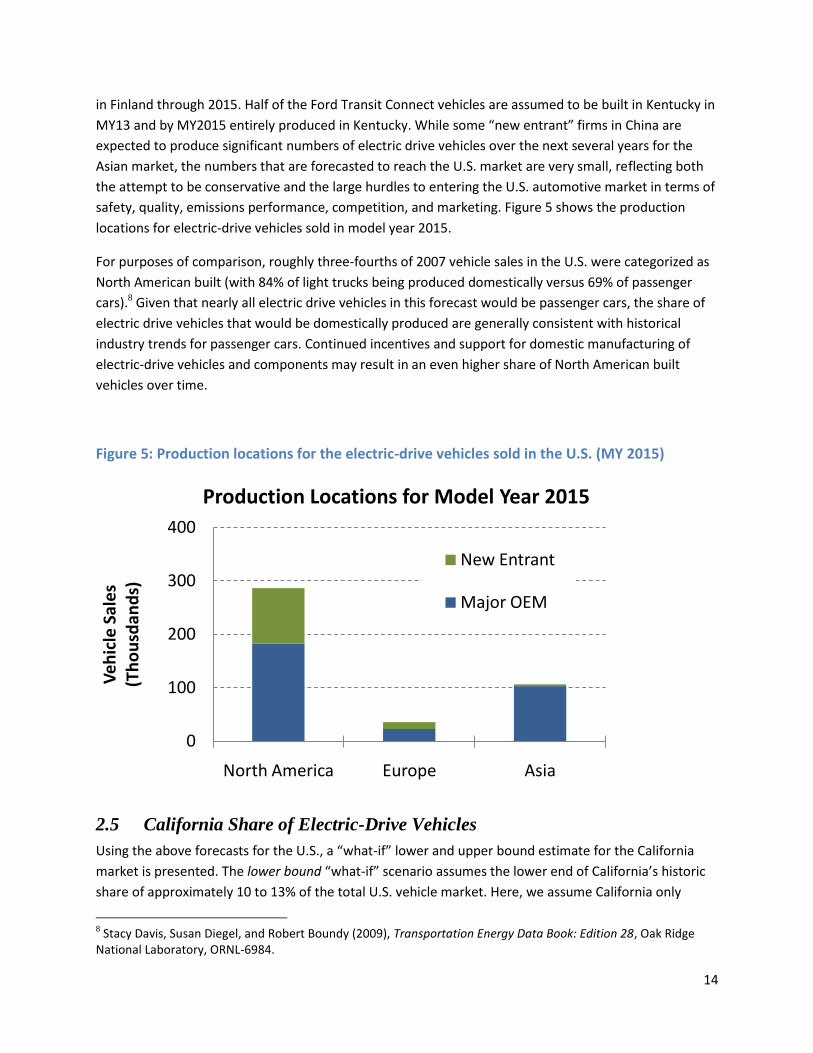
By model year 2015, approximately two-thirds of electric drive vehicles sold in the U.S. market would
likely be produced in North America.7 These include both domestic automakers as well as transplants
with facilities in the U.S. The Nissan LEAF will initially be produced and imported from Japan. For
MY2013, it is assumed that half of Nissan LEAF production will be produced in the US, and by MY2014
and MY2015, all production will likely be domestic. The Fisker Karma is assumed to be produced entirely
7 At least one automaker has considered producing a fuel cell vehicle in Ontario, Canada. All other electric drive vehicles in the forecast have planned production facilities in the U.S.
14
in Finland through 2015. Half of the Ford Transit Connect vehicles are assumed to be built in Kentucky in
MY13 and by MY2015 entirely produced in Kentucky. While some “new entrant” firms in China are
expected to produce significant numbers of electric drive vehicles over the next several years for the
Asian market, the numbers that are forecasted to reach the U.S. market are very small, reflecting both
the attempt to be conservative and the large hurdles to entering the U.S. automotive market in terms of
safety, quality, emissions performance, competition, and marketing. Figure 5 shows the production
locations for electric-drive vehicles sold in model year 2015.
For purposes of comparison, roughly three-fourths of 2007 vehicle sales in the U.S. were categorized as
North American built (with 84% of light trucks being produced domestically versus 69% of passenger
cars).8 Given that nearly all electric drive vehicles in this forecast would be passenger cars, the share of
electric drive vehicles that would be domestically produced are generally consistent with historical
industry trends for passenger cars. Continued incentives and support for domestic manufacturing of
electric-drive vehicles and components may result in an even higher share of North American built
vehicles over time.
Figure 5: Production locations for the electric-drive vehicles sold in the U.S. (MY 2015)
2.5 California Share of Electric-Drive Vehicles
Using the above forecasts for the U.S., a “what-if” lower and upper bound estimate for the California
market is presented. The lower bound “what-if” scenario assumes the lower end of California’s historic
share of approximately 10 to 13% of the total U.S. vehicle market. Here, we assume California only
8 Stacy Davis, Susan Diegel, and Robert Boundy (2009), Transportation Energy Data Book: Edition 28, Oak Ridge National Laboratory, ORNL-6984.
0
100
200
300
400
North America Europe Asia
Ve
hic
le S
ale
s (T
ho
usd
and
s)
Production Locations for Model Year 2015
New Entrant
Major OEM
15
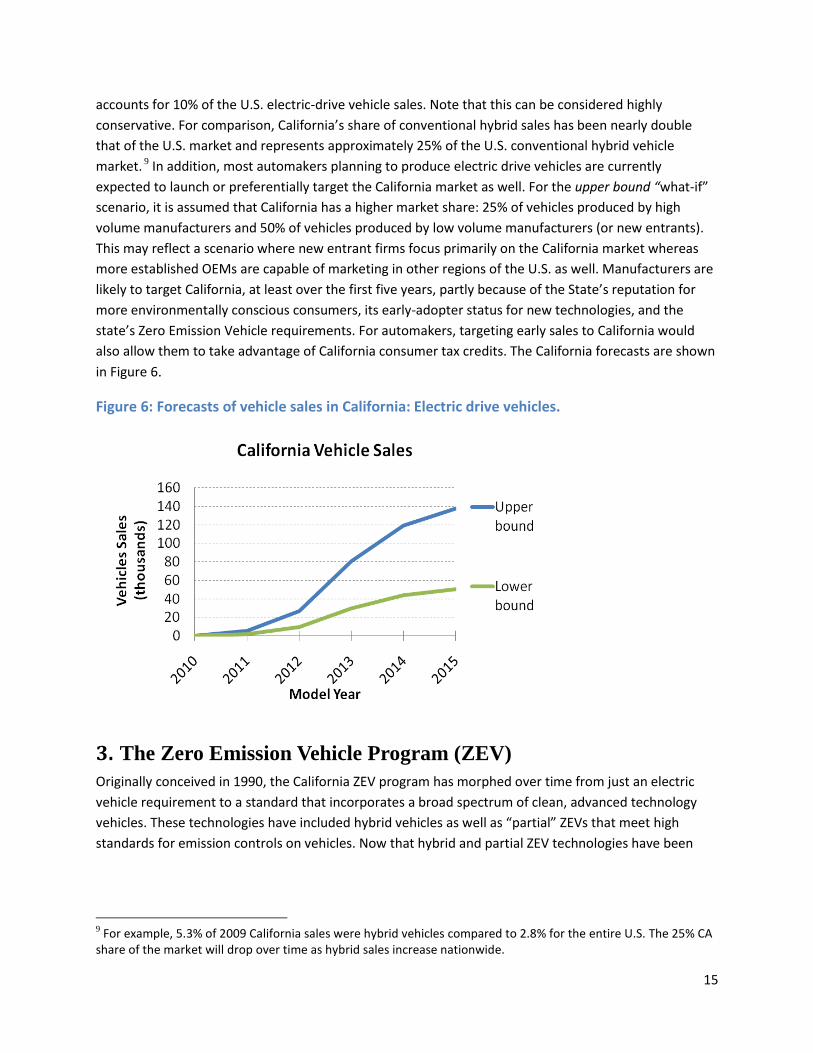
accounts for 10% of the U.S. electric-drive vehicle sales. Note that this can be considered highly
conservative. For comparison, California’s share of conventional hybrid sales has been nearly double
that of the U.S. market and represents approximately 25% of the U.S. conventional hybrid vehicle
market. 9 In addition, most automakers planning to produce electric drive vehicles are currently
expected to launch or preferentially target the California market as well. For the upper bound “what-if”
scenario, it is assumed that California has a higher market share: 25% of vehicles produced by high
volume manufacturers and 50% of vehicles produced by low volume manufacturers (or new entrants).
This may reflect a scenario where new entrant firms focus primarily on the California market whereas
more established OEMs are capable of marketing in other regions of the U.S. as well. Manufacturers are
likely to target California, at least over the first five years, partly because of the State’s reputation for
more environmentally conscious consumers, its early-adopter status for new technologies, and the
state’s Zero Emission Vehicle requirements. For automakers, targeting early sales to California would
also allow them to take advantage of California consumer tax credits. The California forecasts are shown
in Figure 6.
Figure 6: Forecasts of vehicle sales in California: Electric drive vehicles.
3. The Zero Emission Vehicle Program (ZEV)
Originally conceived in 1990, the California ZEV program has morphed over time from just an electric
vehicle requirement to a standard that incorporates a broad spectrum of clean, advanced technology
vehicles. These technologies have included hybrid vehicles as well as “partial” ZEVs that meet high
standards for emission controls on vehicles. Now that hybrid and partial ZEV technologies have been
9 For example, 5.3% of 2009 California sales were hybrid vehicles compared to 2.8% for the entire U.S. The 25% CA share of the market will drop over time as hybrid sales increase nationwide.
16
successfully introduced and commercialized in the marketplace, the ZEV requirement is currently being
retooled to focus more exclusively on electric-drive vehicles and reducing GHG emissions.10
3.1 ZEV Program Requirements
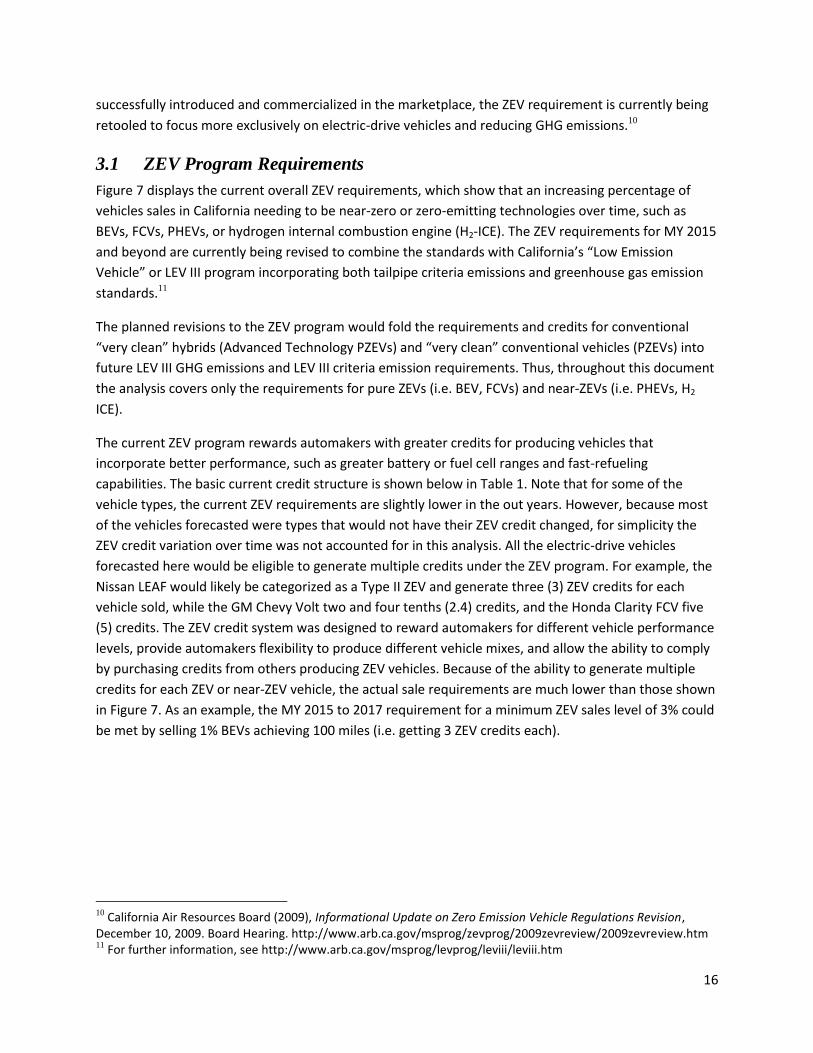
Figure 7 displays the current overall ZEV requirements, which show that an increasing percentage of
vehicles sales in California needing to be near-zero or zero-emitting technologies over time, such as
BEVs, FCVs, PHEVs, or hydrogen internal combustion engine (H2-ICE). The ZEV requirements for MY 2015
and beyond are currently being revised to combine the standards with California’s “Low Emission
Vehicle” or LEV III program incorporating both tailpipe criteria emissions and greenhouse gas emission
standards.11
The planned revisions to the ZEV program would fold the requirements and credits for conventional
“very clean” hybrids (Advanced Technology PZEVs) and “very clean” conventional vehicles (PZEVs) into
future LEV III GHG emissions and LEV III criteria emission requirements. Thus, throughout this document
the analysis covers only the requirements for pure ZEVs (i.e. BEV, FCVs) and near-ZEVs (i.e. PHEVs, H2
ICE).
The current ZEV program rewards automakers with greater credits for producing vehicles that
incorporate better performance, such as greater battery or fuel cell ranges and fast-refueling
capabilities. The basic current credit structure is shown below in Table 1. Note that for some of the
vehicle types, the current ZEV requirements are slightly lower in the out years. However, because most
of the vehicles forecasted were types that would not have their ZEV credit changed, for simplicity the
ZEV credit variation over time was not accounted for in this analysis. All the electric-drive vehicles
forecasted here would be eligible to generate multiple credits under the ZEV program. For example, the
Nissan LEAF would likely be categorized as a Type II ZEV and generate three (3) ZEV credits for each
vehicle sold, while the GM Chevy Volt two and four tenths (2.4) credits, and the Honda Clarity FCV five
(5) credits. The ZEV credit system was designed to reward automakers for different vehicle performance
levels, provide automakers flexibility to produce different vehicle mixes, and allow the ability to comply
by purchasing credits from others producing ZEV vehicles. Because of the ability to generate multiple
credits for each ZEV or near-ZEV vehicle, the actual sale requirements are much lower than those shown
in Figure 7. As an example, the MY 2015 to 2017 requirement for a minimum ZEV sales level of 3% could
be met by selling 1% BEVs achieving 100 miles (i.e. getting 3 ZEV credits each).
10 California Air Resources Board (2009), Informational Update on Zero Emission Vehicle Regulations Revision, December 10, 2009. Board Hearing. http://www.arb.ca.gov/msprog/zevprog/2009zevreview/2009zevreview.htm 11 For further information, see http://www.arb.ca.gov/msprog/levprog/leviii/leviii.htm
17
Figure 7: Current ZEV Requirements, broken down by example vehicle technologies.12
Table 1: ZEV credit generation for different technologies and performance characteristics.
12 Very clean conventional vehicles refer to the “Partial ZEV or PZEV” category and include vehicles like the 2009 Honda Accord and Ford Fusion that meet SULEV emission standards, have zero evaporative emissions, and offer a 15-year (or 150,000 mile) warranty on emission control systems. Very clean hybrids refer to the “Advanced Technology PZEV “ category and include vehicles like the 2009 Honda Civic Hybrid and Toyota Prius that contain advanced technologies such as a hybrid drive train and meet PZEV requirements. PHEVs and Hydrogen Internal Combustion Engines (H2-ICE) would fall into the “Enhanced Advanced Technology PZEV” technology and refers to vehicles that use ZEV fuels such as hydrogen or electricity. The BEVs and FCVs are considered pure ZEVs.
Tier Expected Tech Credit/veh
Type V FCV ≥300mi, fast fuel 7
Type IV FCV ≥200mi, fast fuel 5
Type III FCV 100-199mi, BEV ≥200mi 4
Type II BEV ≥100mi 3
Type I.5 BEV 75-99mi 2.5
Type I BEV 50-74mi 2
Type 0 BEV < 50 1
Enh AT-PZEV PHEV, 40 mile AER 2.4
Enh AT-PZEV PHEVs 20 mile AER, H2ICE 1.5
18
3.2 Can the ZEV program requirements be met? An analysis of the industry’s
ability to comply
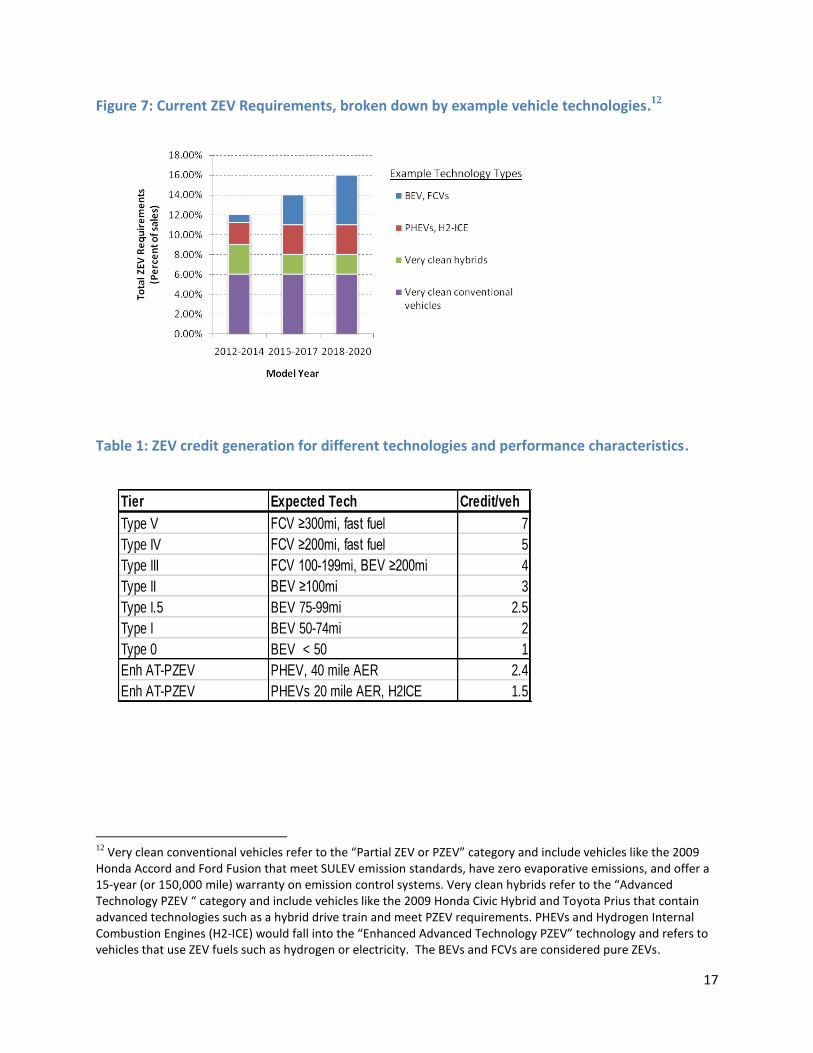
Using the above forecasts as a basis, an analysis was conducted of the ability for the industry as a whole,
as well as each manufacturer, to meet the ZEV standards. For purposes of evaluating the ability for
industry compliance beyond 2015 (the end of the forecast period) the California lower and upper bound
cases were extrapolated from 2015 to 2020 (Figure 8). To remain highly conservative, the low case
extrapolation assumes that, for each vehicle model, sales do not grow after 2015 and remain flat to
2020. This might reflect a scenario where sales plateau and electric-drive vehicles remain a niche
market; or it may reflect a scenario where the forecasts here are overly optimistic by several years. As
discussed above, this is highly conservative as all other forecasts show faster growth over the 2015 to
2020 time period. For the higher case, the sales trend is extrapolated to MY2020 at a quarter (25%) of
the sales growth rate forecasted for the MY2010-2015 period. This might reflect a scenario where
technology adoption of electric-drive vehicles gradually moves from early adopters to more mainstream
consumers. However this higher case is still conservative and does not reflect an aggressive vehicle
penetration case.
Figure 8: Low and higher case “what-if scenarios” for the California market. Beyond MY 2015, it was assumed in the low case that sales remains flat while for the higher case, the rate of growth slows.
Figure 9 below shows one possible ZEV compliance scenario (based on the ZEV requirements) and
compares this against the California forecasts. The ZEV requirements calculated here are based on light-
duty vehicle sales of approximately 1.6 million vehicles per year, extended over the 2010 to 2020 time
period. As discussed earlier, overall national sales (including California sales) have decreased
dramatically over the past two years and are not expected to fully recover until after 2015. Because of
19
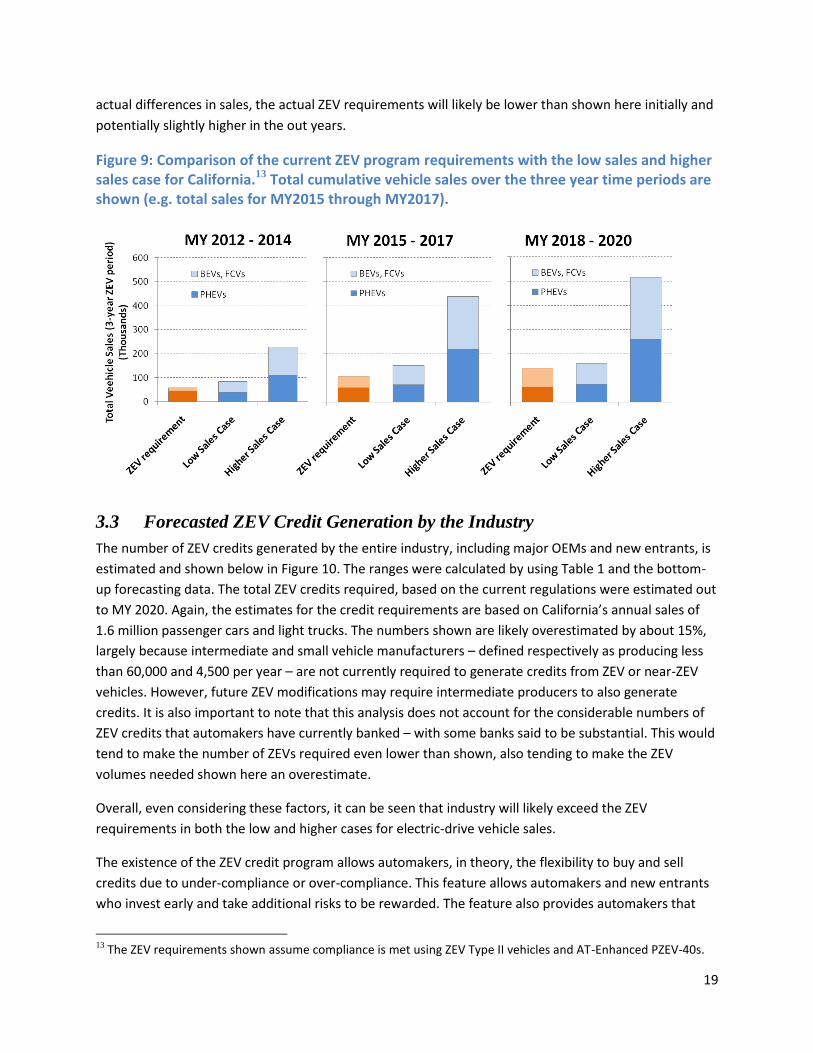
actual differences in sales, the actual ZEV requirements will likely be lower than shown here initially and
potentially slightly higher in the out years.
Figure 9: Comparison of the current ZEV program requirements with the low sales and higher sales case for California.13 Total cumulative vehicle sales over the three year time periods are shown (e.g. total sales for MY2015 through MY2017).
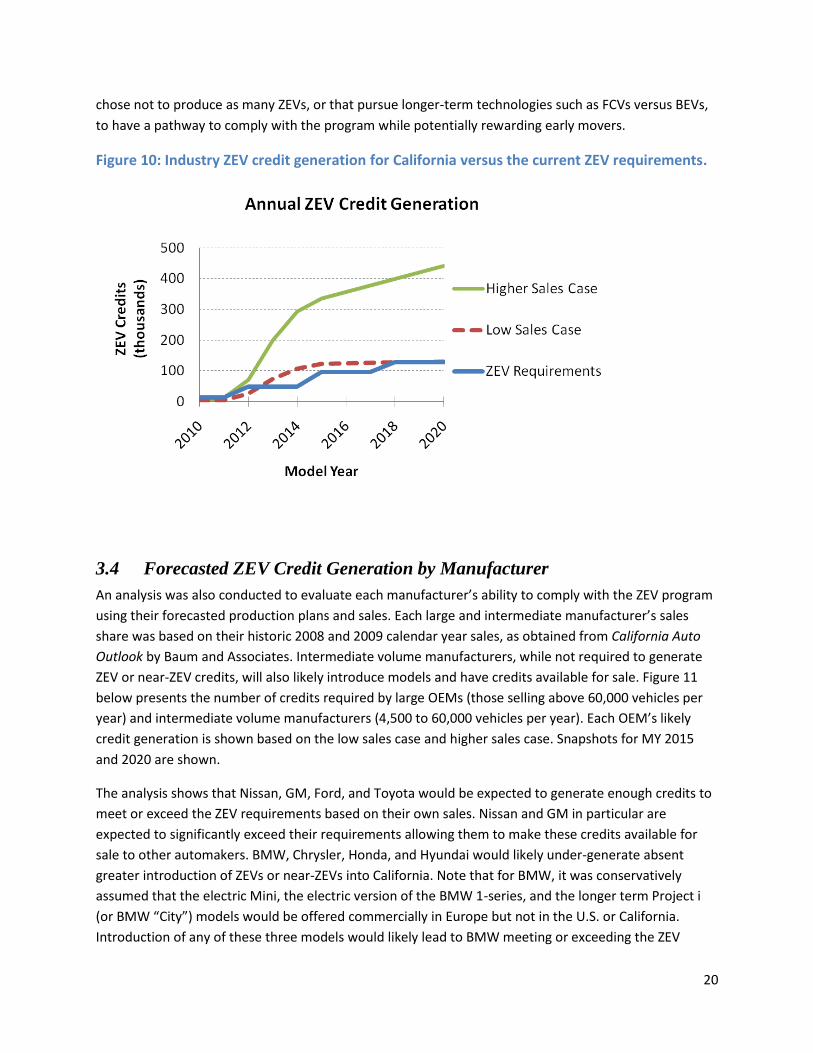
3.3 Forecasted ZEV Credit Generation by the Industry
The number of ZEV credits generated by the entire industry, including major OEMs and new entrants, is
estimated and shown below in Figure 10. The ranges were calculated by using Table 1 and the bottom-
up forecasting data. The total ZEV credits required, based on the current regulations were estimated out
to MY 2020. Again, the estimates for the credit requirements are based on California’s annual sales of
1.6 million passenger cars and light trucks. The numbers shown are likely overestimated by about 15%,
largely because intermediate and small vehicle manufacturers – defined respectively as producing less
than 60,000 and 4,500 per year – are not currently required to generate credits from ZEV or near-ZEV
vehicles. However, future ZEV modifications may require intermediate producers to also generate
credits. It is also important to note that this analysis does not account for the considerable numbers of
ZEV credits that automakers have currently banked – with some banks said to be substantial. This would
tend to make the number of ZEVs required even lower than shown, also tending to make the ZEV
volumes needed shown here an overestimate.
Overall, even considering these factors, it can be seen that industry will likely exceed the ZEV
requirements in both the low and higher cases for electric-drive vehicle sales.
The existence of the ZEV credit program allows automakers, in theory, the flexibility to buy and sell
credits due to under-compliance or over-compliance. This feature allows automakers and new entrants
who invest early and take additional risks to be rewarded. The feature also provides automakers that
13 The ZEV requirements shown assume compliance is met using ZEV Type II vehicles and AT-Enhanced PZEV-40s.
20
chose not to produce as many ZEVs, or that pursue longer-term technologies such as FCVs versus BEVs,
to have a pathway to comply with the program while potentially rewarding early movers.
Figure 10: Industry ZEV credit generation for California versus the current ZEV requirements.
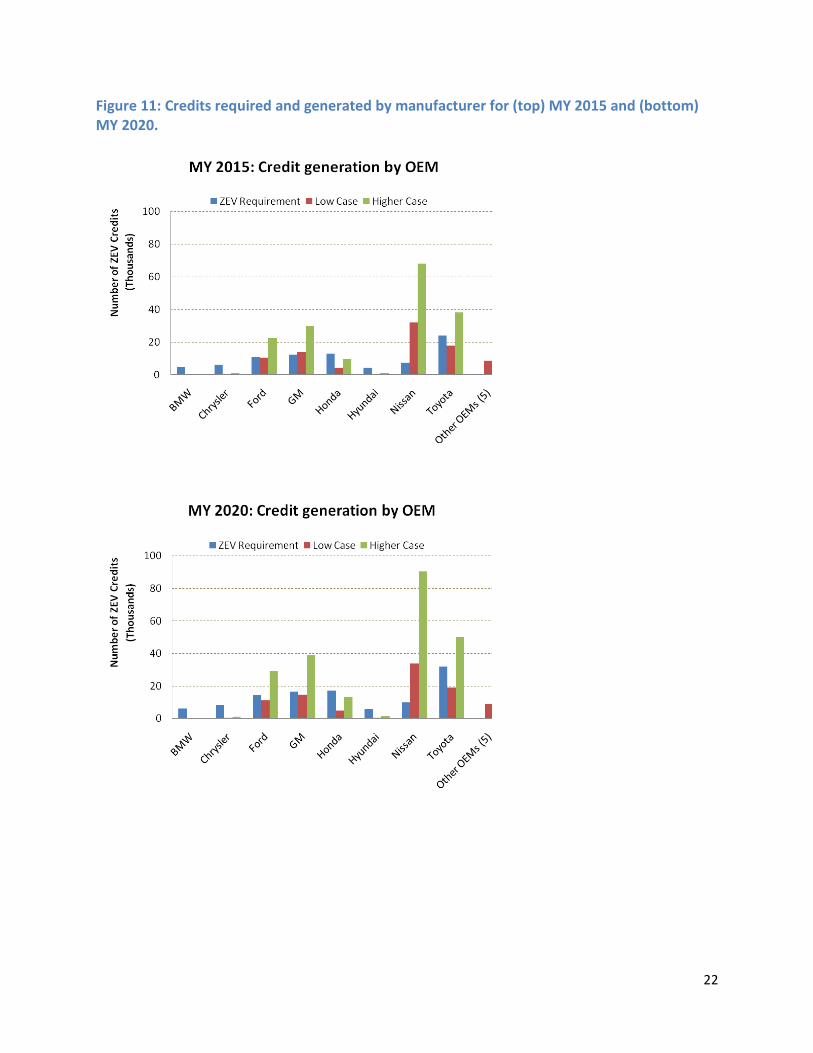
3.4 Forecasted ZEV Credit Generation by Manufacturer
An analysis was also conducted to evaluate each manufacturer’s ability to comply with the ZEV program
using their forecasted production plans and sales. Each large and intermediate manufacturer’s sales
share was based on their historic 2008 and 2009 calendar year sales, as obtained from California Auto
Outlook by Baum and Associates. Intermediate volume manufacturers, while not required to generate
ZEV or near-ZEV credits, will also likely introduce models and have credits available for sale. Figure 11
below presents the number of credits required by large OEMs (those selling above 60,000 vehicles per
year) and intermediate volume manufacturers (4,500 to 60,000 vehicles per year). Each OEM’s likely
credit generation is shown based on the low sales case and higher sales case. Snapshots for MY 2015
and 2020 are shown.
The analysis shows that Nissan, GM, Ford, and Toyota would be expected to generate enough credits to
meet or exceed the ZEV requirements based on their own sales. Nissan and GM in particular are
expected to significantly exceed their requirements allowing them to make these credits available for
sale to other automakers. BMW, Chrysler, Honda, and Hyundai would likely under-generate absent
greater introduction of ZEVs or near-ZEVs into California. Note that for BMW, it was conservatively
assumed that the electric Mini, the electric version of the BMW 1-series, and the longer term Project i
(or BMW “City”) models would be offered commercially in Europe but not in the U.S. or California.
Introduction of any of these three models would likely lead to BMW meeting or exceeding the ZEV
21
requirements. Honda would nearly meet its ZEV requirements with the forecasted introduction of an
electric vehicle planned for Japan into the California market and through pre-commercialization of the
FCX Clarity. The annual sale volumes needed by Honda for MY2018+ would be on the order of roughly
3,500 city-type electric vehicles (50-75 mile range) and roughly 1,600 fuel cell vehicles for the California
market out of the 190,000 vehicles sold by Honda. Because of the uncertainty of Chrysler’s electric-drive
vehicle plans, virtually no vehicle sales were forecasted over the MY 2010 – 2015. The cancellation of
the Chrysler ENVI program as well as the uncertainty regarding introduction of the Fiat Doblo resulted in
no to little credits being assigned, respectively. However, introduction of an electric-drive vehicle post
MY 2015 is possible, but the model-by-model forecasts do not extend beyond MY 2015. Hyundai also
may have one potential product offering involving a plug-in electric vehicle but, similar to the Chrysler
case, the uncertainty leads to little credits being assigned to Hyundai. Introduction of electric-drive
vehicles post MY 2015 remain distinct possibilities but was beyond the range of the forecast.
As shown in Figure 11 and 12, intermediate volume manufacturers as well as new entrants are
forecasted to generate substantial numbers of ZEV credits. The ZEV program allows for automakers that
choose not to produce ZEVs or near-ZEVS to purchase credits from other producers. Collectively, as
shown in Figure 10, the industry would over-generate ZEV credits.
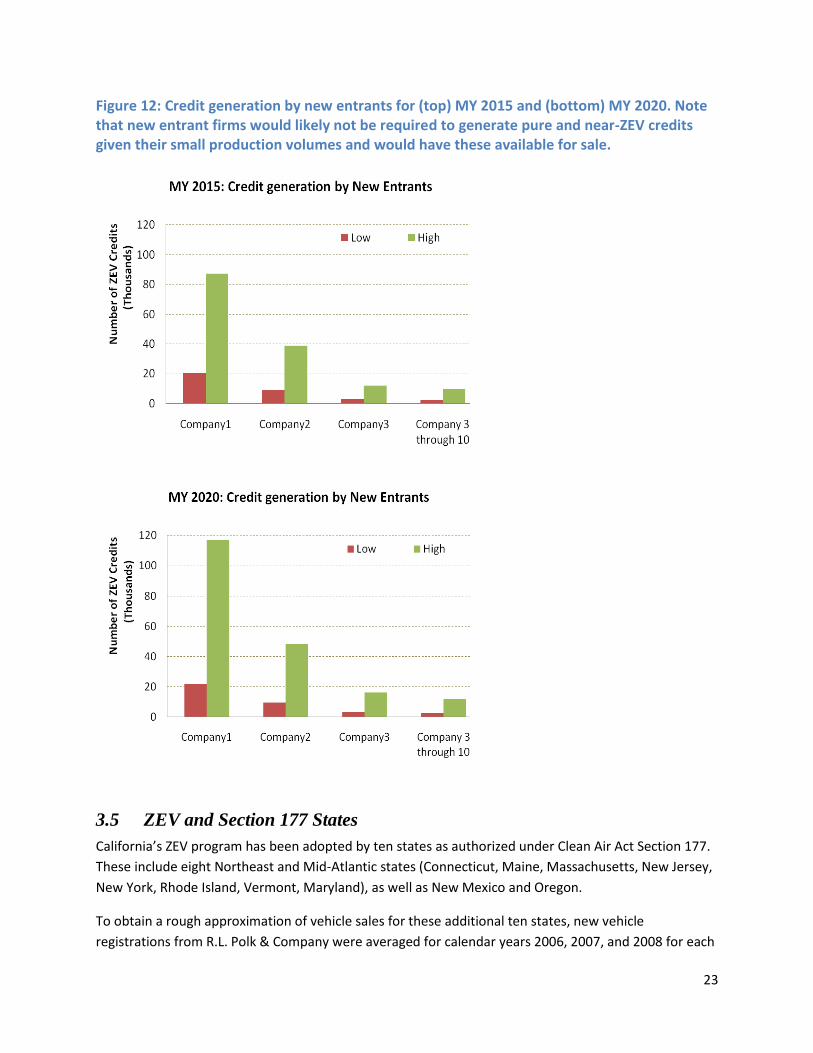
Ten new entrant firms were also evaluated for their ability to generate ZEV credits that could be
purchased by larger OEMs (Figure 12). At least one new entrant, Tesla Motors, has already sold credits
to a major OEM. It is important to note that not all new entrant firms are expected to produce vehicles
and sell in the U.S. market over the 2010 to 2020 time period given the challenges and barriers to
introducing vehicles. Thus, the forecast suggests only a handful of companies being successful and
reaching intermediate sale volumes and generating significant credits. The large variation in ZEV credits
generated by new entrants reflect the possible upper and lower bound cases where new entrants target
mainly the CA market (50% of their U.S. sales) and where new entrants do not specifically target the CA
market (10% of their U.S. sales).
22
Figure 11: Credits required and generated by manufacturer for (top) MY 2015 and (bottom) MY 2020.
23
Figure 12: Credit generation by new entrants for (top) MY 2015 and (bottom) MY 2020. Note that new entrant firms would likely not be required to generate pure and near-ZEV credits given their small production volumes and would have these available for sale.
3.5 ZEV and Section 177 States
California’s ZEV program has been adopted by ten states as authorized under Clean Air Act Section 177.
These include eight Northeast and Mid-Atlantic states (Connecticut, Maine, Massachusetts, New Jersey,
New York, Rhode Island, Vermont, Maryland), as well as New Mexico and Oregon.
To obtain a rough approximation of vehicle sales for these additional ten states, new vehicle
registrations from R.L. Polk & Company were averaged for calendar years 2006, 2007, and 2008 for each
24
of the above states.14 New vehicle registrations generally exceed the actual model year sales, so an
adjustment factor was estimated based on sales data obtained for seven of the eleven states. The
average vehicle sales were estimated to be 2.2 million vehicles per year for Section 177 ZEV states. This
results in an estimate slightly below the peak in sales for 2006, but still above the drop in sales in 2008
due to the economic collapse.
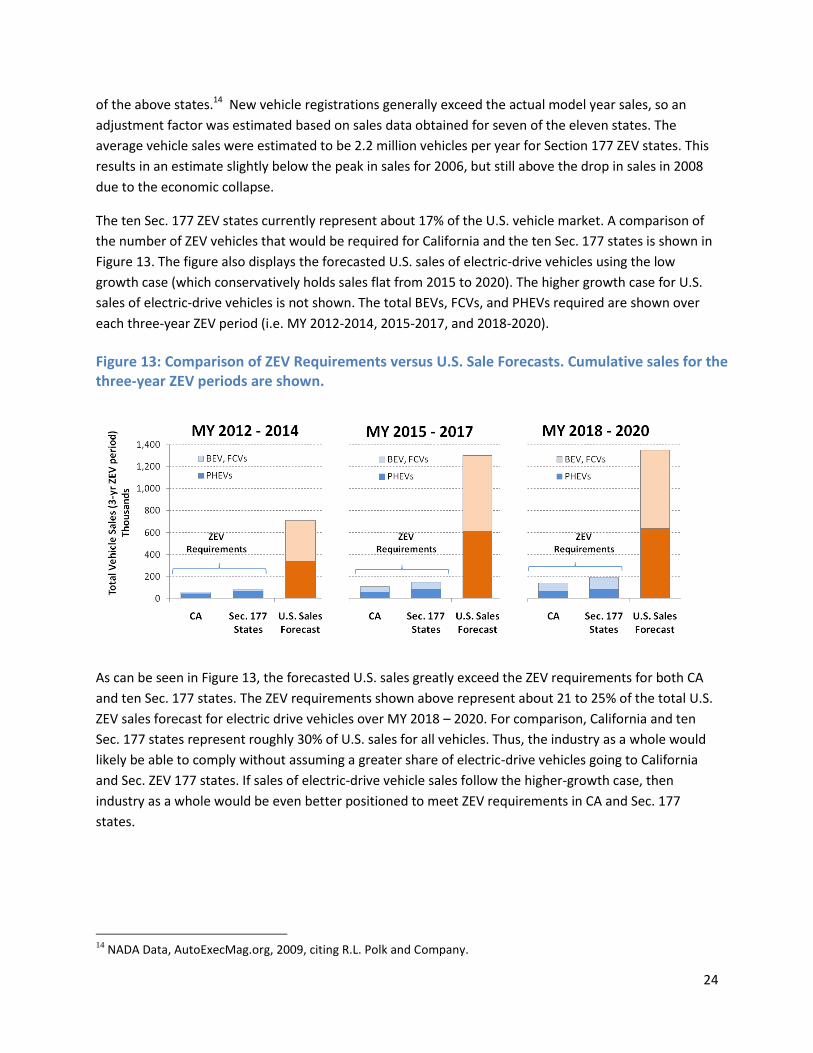
The ten Sec. 177 ZEV states currently represent about 17% of the U.S. vehicle market. A comparison of
the number of ZEV vehicles that would be required for California and the ten Sec. 177 states is shown in
Figure 13. The figure also displays the forecasted U.S. sales of electric-drive vehicles using the low
growth case (which conservatively holds sales flat from 2015 to 2020). The higher growth case for U.S.
sales of electric-drive vehicles is not shown. The total BEVs, FCVs, and PHEVs required are shown over
each three-year ZEV period (i.e. MY 2012-2014, 2015-2017, and 2018-2020).
As can be seen in Figure 13, the forecasted U.S. sales greatly exceed the ZEV requirements for both CA
and ten Sec. 177 states. The ZEV requirements shown above represent about 21 to 25% of the total U.S.
ZEV sales forecast for electric drive vehicles over MY 2018 – 2020. For comparison, California and ten
Sec. 177 states represent roughly 30% of U.S. sales for all vehicles. Thus, the industry as a whole would
likely be able to comply without assuming a greater share of electric-drive vehicles going to California
and Sec. ZEV 177 states. If sales of electric-drive vehicle sales follow the higher-growth case, then
industry as a whole would be even better positioned to meet ZEV requirements in CA and Sec. 177
states.
14 NADA Data, AutoExecMag.org, 2009, citing R.L. Polk and Company.
Figure 13: Comparison of ZEV Requirements versus U.S. Sale Forecasts. Cumulative sales for the three-year ZEV periods are shown.
25
4. Conclusion
Forecasts generated by The Planning Edge for over forty vehicle models were used to assess the ability
of the industry to comply with ZEV requirements both in California and in Section 177 states. Total U.S.
sales of ZEV or near-ZEV vehicles are forecasted to be between 320,000 to 540,000 in MY 2015
depending on fuel prices. Cumulative new entrant firms are estimated to represent slightly over one
quarter of new sales.
For California, it is estimated that 40,000 to 140,000 vehicles could be sold in MY 2015 in the low and
higher cases, respectively. These estimates exceed the estimated 32,000 ZEVS and near-ZEVs required
by the program for MY 2015. Overall, the forecasts show that the auto industry will over-comply the ZEV
requirements through the MY2020 time period even for a low what-if scenario, where there is a zero
increase in sales rate after MY 2015, which is likely to be highly conservative.
Nissan, GM, Ford, and Toyota are the best positioned among the major OEMs to comply or over-comply
with ZEVs using their own product launches. BMW, Chrysler, Honda, and Hyundai would likely under-
generate credits absent greater introduction of ZEVs or near-ZEVs than forecasted. However, a modest
introduction of ZEV vehicles over the ten year time period would allow these companies to comply with
using their own product lines. For example, Honda could comply through producing roughly 3,500 city-
type electric vehicles (50-75 mile range) and roughly 1,600 fuel cell vehicles for the California market for
MY 2018+.
In addition, a large number of excess ZEV credits will be generated by both intermediate volume
producers, new entrant firms, and several of the major OEMs. The ZEV program provides companies not
meeting the ZEV requirements with the flexibility to purchase ZEV credits.
Based on this analysis, the ZEV program can be justifiably strengthened by simply reflecting the
forecasted vehicle offerings by the industry. Particularly in the post MY 2015 time period, increased
credit requirements would help ensure that all major OEMs offer ZEV or near-ZEV technologies in their
own product lines and that all OEMs are on track to achieve longer-term GHG emission reduction goals
post 2020.
26
About the Authors:
Simon Mui is a scientist with the Natural Resources Defense Council (NRDC) working on clean vehicles
and fuels. The Natural Resources Defense Council is a national nonprofit environmental organization
with more than 1.3 million members and online activists. Since 1970, NRDC’s lawyers, scientists, and
other environmental specialists have worked to protect the world’s natural resources, public health, and
the environment. NRDC has offices in New York City, Washington, D.C., Chicago, Los Angeles, San
Francisco, and Beijing. Visit us at www.nrdc.org.
Alan Baum is currently Principal of Baum and Associates LLC, a consulting firm providing research and
analysis to automotive industry stakeholders. Baum and Associates is active in projects focusing on
vehicles with alternative powertrains including hybrids (regular and plug-ins) and other electric vehicles.
This knowledge is based upon a detailed forecast of North American volumes including breakdowns by
vehicle, powertrain, and plant. Before establishing Baum and Associates in early 2010, Baum was the
Director of Forecasting at The Planning Edge (also cited in this paper).