Embed Size (px)
Citation preview


The Yo–Yo Yen

Also by Brendan Brown
THE FLIGHT OF INTERNATIONAL CAPITAL
MONETARY CHAOS IN EUROPE
ECONOMISTS AND FINANCIAL MARKETS

The Yo–Yo Yenand the Future of the Japanese Economy
Brendan Brown
Foreword by Robert Z. Aliber

© Brendan Brown 2002Foreword © Robert Z. Aliber 2002
All rights reserved. No reproduction, copy or transmission of this publication may be made without permission.
No paragraph of this publication may be reproduced, copied or transmitted save with written permission or in accordance with the provisions of the Copyright, Designs and Patents Act 1988, or under the terms of any licence permitting limited copying issued by the Copyright Licensing Agency, 90 Tottenham Court Road, London W1T 4LP.
Any person who does any unauthorised act in relation to this publication may be liable to criminal prosecution and civil claims for damages.
The author has asserted his right to be identified as the author of this work in accordance with the Copyright, Designs and Patent Act 1988.
First published 2002 byPALGRAVEHoundmills, Basingstoke, Hampshire RG21 6XS and 175 Fifth Avenue, New York, N.Y. 10010Companies and representatives throughout the world
PALGRAVE is the new global academic imprint of St. Martin’s Press LLC Scholarly and Reference Division and Palgrave Publishers Ltd (formerly Macmillan Press Ltd).
ISBN 0–333–92949–7
This book is printed on paper suitable for recycling and made from fully managed and sustained forest sources.
A catalogue record for this book is available from the British Library.
Library of Congress Cataloging-in-Publication DataBrown, Brendan, 1951–
The yo-yo yen: and the future of the Japanese economy/BrendanBrown.
p. cm.Includes bibliographical references and index.ISBN 0–333–92949–7
1. Yen, Japanese–History. 2. Money–Japan–History. 3. Monetary policy–Japan–History. I. Title.
HG1272.B76 2002332.4�952–dc21 2001059054
10 9 8 7 6 5 4 3 2 111 10 09 08 07 06 05 04 03 02
Printed and bound in Great Britain by Antony Rowe Ltd, Chippenham, Wiltshire

Contents
List of Figures vi
List of Tables ix
Acknowledgements x
Foreword by Robert Z. Aliber xii
Introduction 1
1 Historic Roots of the Yo–Yo Yen (1859–1949) 5
2 A Brief History of the Modern Yen (1960–87) 30
3 Who Pulls the String of the Yo–Yo Yen? 63
4 From Bubble Economy to Yen Bubble (1988–93) 116
5 Yen Opportunity Gained and Lost (1993–2000) 163
6 What To Do About the Yo–Yo Yen? 215
Bibliography 240
Index 244
v

List of Figures
1.1 Gold–silver parity, 1868–94 121.2 US$/yen exchange rate, 1880–97 141.3 US$/yen exchange rate, 1918–25 222.1 Real effective exchange rate index of the yen, 1971–2001 322.2 Japan vs. Germany economic growth in the 1960s 342.3 Real appreciation of the yen vs. dollar, 1960–71 362.4 Japan vs. US economic growth, 1965–76 372.5 Yen exchange rate vs. US$ and DM, 1971–9 422.6 Japan budget deficit (per cent of GDP), 1960–2000 432.7 Japan vs. US business cycles, 1965–76 452.8 Japan interest rates, 1970–80 462.9 Real exchange rate index of the dollar against yen,
1970–2000 472.10 Japan business investment and saving (per cent of GDP),
1960–80 482.11 Japan vs. US inflation, 1971–9 522.12 Japan vs. US economic growth, 1976–90 532.13 Japan vs. US government bond yields, 1975–80 542.14 Japan current account balance, 1970–80 552.15 Exchange rates: yen/DM and yen/US$, 1979–87 572.16 Japan current account balance, 1981–90 582.17 Japan vs. US government bond yields, 1985–6 602.18 Japan vs. US money market rates, 1985–6 613.1 Switzerland current account balance vs. real effective
exchange rate, 1980–2000 693.2 US Federal funds rate vs. Japan unsecured overnight
call rate, 1991–5 743.3 Euro corner, 1973–7 813.4 US dollar corner, 1973–7 823.5 Japanese yen corner, 1973–7 833.6 Euro corner, 1978–81 843.7 US dollar corner, 1978–81 853.8 Japanese yen corner, 1978–81 863.9 Euro corner, 1982–5 873.10 US dollar corner, 1982–5 883.11 Japanese yen corner, 1982–5 893.12 Euro corner, 1986–90 903.13 US dollar corner, 1986–90 913.14 Japanese yen corner, 1986–90 92
vi

3.15 Euro corner, 1991–4 933.16 US dollar corner, 1991–4 943.17 Japanese yen corner, 1991–4 953.18 Euro corner, 1995–7 963.19 US dollar corner, 1995–7 973.20 Japanese yen corner, 1995–7 983.21 Euro corner, 1998–2001 993.22 US dollar corner, 1998–2001 1003.23 Japanese yen corner, 1998–2001 1013.24 Sterling, 1995–2001 1103.25 Swiss franc, 1995–2001 1123.26 Singapore dollar, 1992–2001 1143.27 Taiwanese dollar, 1992–2001 1154.1 Japan, US and euro-area GDP per capita, 1990–5 1184.2 Japan, US and euro-area GDP per capita, 1995–2000 1194.3 Japan productivity growth, 1985–90 1224.4 Japan inflation, 1987–94 1244.5 Japan money supply, 1988–94 1254.6 Japan money rates, 1989–95 1284.7 US dollar vs. DM and yen, 1987–92 1294.8 Yen vs. US dollar and DM, 1987–92 1304.9 Japan vs. US money rates, 1986–91 1314.10 Japan vs. US equity markets, 1987–93 1344.11 Finnish mark real effective exchange rate, 1985–95 1364.12 British pound real effective exchange rate, 1988–95 1364.13 Japan, UK and Finland current account balances, 1987–95 1374.14 Switzerland real effective exchange rate, 1988–2001 1384.15 Switzerland inflation, 1988–2000 1384.16 Switzerland yield curve, 1988–2001 1394.17 Switzerland current account surplus vs. general
government balance, 1987–2000 1394.18 US$–DM–yen triangle – US dollar corner, 1987–92 1414.19 US$–DM–yen triangle – DM corner, 1987–92 1424.20 US$–DM–yen triangle – yen corner, 1987–92 1434.21 Japan vs. US leading indicators, 1986–92 1444.22 Japan 10-year JGB yield vs. overnight call rate, 1990–5 1454.23 Japan, US and (West) Germany real GDP, 1990–4 1474.24 3-month euro-yen, dollar and DM rates, 1990–3 1484.25 Japan vs. US current account balance as per cent of GDP,
1987–95 1514.26 Japan industrial production vs. real GDP, 1990–2001 1524.27 10-year JGB yields vs. 10-year T-bond yields, 1991–5 1594.28 Japan vs. US leading indicators, 1992–8 1604.29 Japan, US and euro-area real GDP, 1989–2001 161
List of Figures vii

5.1 Yen vs. US dollar and DM, 1993–8 1645.2 US dollar vs. yen and DM, 1993–8 1655.3 DM corner, 1993–8 1715.4 US dollar corner, 1993–8 1725.5 Yen corner, 1993–8 1735.6 10-year yield spreads, T-bond over JGB and Bund, 1993–5 1745.7 10-year JGB, T-bond and Bund yields, 1994–7 1745.8 Japan equity market vs. 10-year JGB yields, 1993–2001 1755.9 Japan private consumption deflator, 1985–2001 1775.10 Japan official discount rate vs. overnight call rate, 1993–7 1785.11 Yen vs. US dollar and DM, Feb–April 1995 1815.12 US dollar vs. yen and DM, Feb–April 1995 1815.13 10-year JGB vs. T-bond yields, 1996–9 1905.14 Japan, US and Germany real GDP growth, 1993–7 1915.15 Real GDP: Japan, US and euro-area, 1995–2000 1915.16 10-year bond spread (T-bond over JGB), 1996–2000 1935.17 3-month Japan CD rate vs. 3-month euro-dollar rate,
April–May 1997 1975.18 10-year JGB vs. T-bond yields, April–May 1997 1975.19 US$ vs. Yen and DM, April–May 1997 1995.20 Yen vs. US$ and DM, April–May 1997 1995.21 US dollar vs. Yen and DM, October 1998 2065.22 Japan yield curve, 1995–2001 2085.23 10-year JGB yield vs. 3-month CDs, June 1998–March 1999 2095.24 Euro currency corner, 1999–2001 2105.25 US$ currency corner, 1999–2001 2115.26 Yen currency corner, 1999–2001 212
viii List of Figures

List of Tables
3.1 Japan savings–investment balance, 1960–72 643.2 Japan savings–investment balance, 1974–82 653.3 Japan savings–investment balance, 1984–9 663.4 Japan savings–investment balance, 1990–9 673.5 Switzerland savings–investment balance, 1990–7 703.6 US savings–investment balance, 1982–90 773.7 US savings–investment balance, 1992–9 783.8 Euro-area savings–investment balance, 1991–8 793.9 Solo and axis movement in the US$–euro–yen triangle:
how frequent? 1033.10 US$, euro and yen: how long has each been in the limelight? 104
ix

Acknowledgements
On arrival at the University of Chicago’s Graduate School of Business, I hadno idea that my career would be in international finance and that my acad-emic source of inspiration would be Robert Z. Aliber. On departure, I wascertain about both points.
The era of floating exchange rates had just dawned. The Smithsonian fixbetween the yen, US dollar and DM had broken down. A new frontier – fullof danger and opportunity – had opened up for international business deci-sion-makers, whether as investors or borrowers. In his classes Bob Aliberintroduced us to the essential tools – Fisher Open, Fisher Closed, PPP, eco-nomic risk exposure (versus accounting) – for rational strategy-making inthe face of expected and unexpected exchange rate change.
I had some floating intention of immediately proceeding with doctoralstudy on these topics at the University of Chicago. But Bob was in nodoubt about the advantages of first engaging oneself in the real world of markets and offered me (jokingly!) a two-year forward contract of a place in his PhD programme. He must have known that once immersed in markets and in the European centre of action I would not exercise thecontract.
Just around the time when the contract would have matured, I had goneinto an art museum near the Bank for International Settlements. Suddenlya familiar voice called out my name. Bob had also been visiting the Bankand was travelling on the same plane to London that evening.
I do not recall whether we spoke about Japan, but that flight was the startof a continuous dialogue between us which has been a never-ending sourceof stimulus to my thinking about international financial developments. Myrecollection is that Japan became a big topic in our discussion by the early1980s. Huge Japanese capital inflows into the US were helping to sustain astrong dollar despite a record size US current account deficit.
Bob had no doubts about the driving force behind the new pattern ofglobal capital flows – the big private sector savings surplus in Japan whichhad emerged as its economic miracle faded away. He made the key compar-ison with Britain in the twenty years before the First World War.Unfortunately, policy-makers in Washington and Tokyo did not share BobAliber’s grasp of the essential problem – how Japan’s savings surplus wouldbe absorbed in the global economy.
Prophecy is a lonely business. And there is no doubt about Bob’sprophetic powers. His visits to my office in London were wake-up calls towhat lay ahead – whether the bursting of the Tokyo equity market bubble,the entry of the US economy into a low inflation era, the Asian crisis of
x

summer 1997, and most recently the bursting of the US bubble and subse-quent recession.
The one prediction where I can claim to have disagreed with Bob andbeen vindicated is about the future of floating exchange rates. Bob thoughtit possible that the end of the worldwide inflation storm which had ragedthrough the 1970s would bring a return to fixed exchange rates betweenthe major currencies.
As is so often the case, correct foresight was based on thinking which wasin fact incomplete. I failed to take full account of the Japanese-relatedfactors impeding a return to fixed rates. The focus of my argument (infavour of no return being likely) was too narrow and parochial. I took theBundesbank as the centre of the currency world.
That distortion of vision – too much importance to the DM and too littleto the yen – should have corrected itself during the many years I have hadthe deep privilege of being a member of the research team atTokyo–Mitsubishi International (and previously Mitsubishi Finance).Experience of talking to clients and to my colleagues about the outlook foryen markets in particular stretches back to the years of Japan’s bubbleeconomy.
Economic research activity at Tokyo–Mitsubishi International enjoyshigh respect from senior management and takes place in an environmentof total professional independence. The views expressed in this book arestrictly personal and in no way reflect those of my colleagues either indi-vidually or as a group.
When I mentioned to Bob some time ago that I was embarking on abook about the yen he had no doubts about the title. Back came the mail,crossing out my suggestion as too narrow, and replacing it with ‘Yo–Yo Yenand the Future of the Japanese Economy’. I know now from where the ideacame for the title of his bestseller The International Money Game.
A game suggests there are winners and losers, which there certainly are ininternational financial markets. The yo–yo yen has showered big gains andlosses on different groups both inside Japan and outside. On balance,though, the successive throws of the yo–yo have been a drag on Japaneseeconomic prosperity and exposed flaws in the international economicorder.
It is time to change the rules of the game.BRENDAN BROWN
Acknowledgements xi

Foreword
The economic developments in Japan in the last fifteen years present oneof the most interesting sets for economic analysis and one of the most chal-lenging for policy makers. The rate of economic growth has declined fromone of the most rapid in forty years prior to 1990 to one of the slowestamong the industrial countries. Japan is now experiencing its third eco-nomic contraction in the last ten years. The consumer price level is declin-ing by 1 per cent a year, and there is the prospect of a debt-deflation cycle;because prices are declining more rapidly than costs, profits are squeezedand the business failure rate has soared, which constrains the growth ofbank credit which leads to further downward pressure on prices. The banksand other financial institutions have been struggling under a mountain ofnon-performing loans as a result of the implosion of the asset price bubbleof the late 1980s and the recessions; because of the high rate of bankruptcy,banks have to dispose of old loans at an increasingly rapid rate to avoid anincrease in the number of non-performing loans on their balance sheets.The nominal interest rates on short term deposits and short term govern-ment securities are zero and real interest rates are slightly positive; thenominal interest rates on ten-year government bonds are below 2 per centand real interest rates are about 3 per cent. The fiscal deficit has been in therange of 8 to 10 per cent a year for each of the last four years, and the ratioof government debt in the hands of the public to GDP is much higher thanin any other large country. Either tax revenues must increase relatively togovernment expenditures by 6 per cent of GDP, or the government eventu-ally will default on its debt, either formally a, more likely, informally.
Still the cranes are back in Tokyo and the capital city is experiencinganother major construction boom. Despite the economic slowdown, thereremain fabulously successful Japanese firms – Toyota, Sony, Fuji Film, Fujitsu,Fanuc, Canon, DoCoMo, Honda, Nikon, Komatsu, Kubota and Toshiba.
Moreover Japanese-owned foreign assets are much larger than those of allother creditor countries combined; the ratio of these assets to the country’sGDP is twice the peak value for this same ratio for the United States.
In the last fifty years Japan has achieved the highest rate of growth of percapita income in any of the industrial countries. In the late 1940s percapita incomes had been at the equivalent of the proverbial $100 a year, aresult of the tremendous physical damage from the bombing during thelast several years of World War II, the loss of what had been its colonies,and limited ability to gain the advantage of international specialisationbecause of the lack of the ability to produce goods that could be sold inforeign markets.
xii
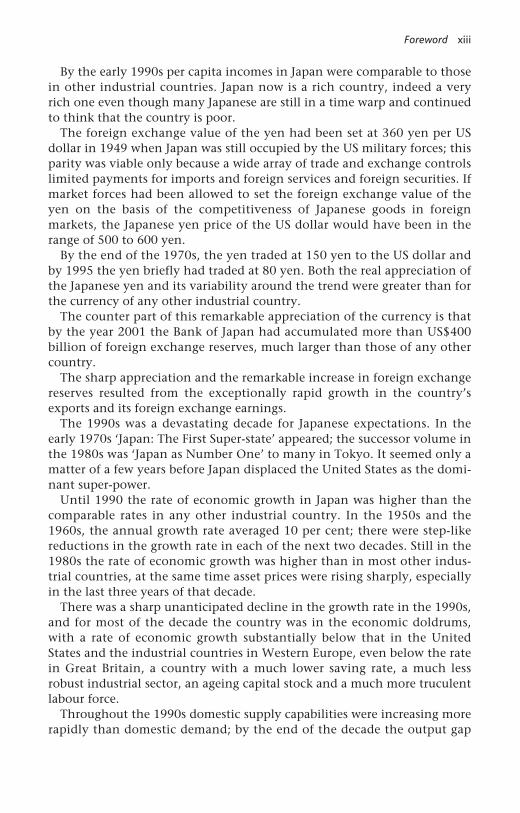
By the early 1990s per capita incomes in Japan were comparable to thosein other industrial countries. Japan now is a rich country, indeed a veryrich one even though many Japanese are still in a time warp and continuedto think that the country is poor.
The foreign exchange value of the yen had been set at 360 yen per USdollar in 1949 when Japan was still occupied by the US military forces; thisparity was viable only because a wide array of trade and exchange controlslimited payments for imports and foreign services and foreign securities. Ifmarket forces had been allowed to set the foreign exchange value of theyen on the basis of the competitiveness of Japanese goods in foreignmarkets, the Japanese yen price of the US dollar would have been in therange of 500 to 600 yen.
By the end of the 1970s, the yen traded at 150 yen to the US dollar andby 1995 the yen briefly had traded at 80 yen. Both the real appreciation ofthe Japanese yen and its variability around the trend were greater than forthe currency of any other industrial country.
The counter part of this remarkable appreciation of the currency is thatby the year 2001 the Bank of Japan had accumulated more than US$400billion of foreign exchange reserves, much larger than those of any othercountry.
The sharp appreciation and the remarkable increase in foreign exchangereserves resulted from the exceptionally rapid growth in the country’sexports and its foreign exchange earnings.
The 1990s was a devastating decade for Japanese expectations. In theearly 1970s ‘Japan: The First Super-state’ appeared; the successor volume inthe 1980s was ‘Japan as Number One’ to many in Tokyo. It seemed only amatter of a few years before Japan displaced the United States as the domi-nant super-power.
Until 1990 the rate of economic growth in Japan was higher than thecomparable rates in any other industrial country. In the 1950s and the1960s, the annual growth rate averaged 10 per cent; there were step-likereductions in the growth rate in each of the next two decades. Still in the1980s the rate of economic growth was higher than in most other indus-trial countries, at the same time asset prices were rising sharply, especiallyin the last three years of that decade.
There was a sharp unanticipated decline in the growth rate in the 1990s,and for most of the decade the country was in the economic doldrums,with a rate of economic growth substantially below that in the UnitedStates and the industrial countries in Western Europe, even below the ratein Great Britain, a country with a much lower saving rate, a much lessrobust industrial sector, an ageing capital stock and a much more truculentlabour force.
Throughout the 1990s domestic supply capabilities were increasing morerapidly than domestic demand; by the end of the decade the output gap
Foreword xiii

may have been in rage of 10 to 15 per cent. Nominal interest ratesdeclined, and the creditors who depended on interest receipts for a sub-stantial part of their income experienced a real decline in their incomes;they became increasingly sensitive to the differences in the prices ofsimilar goods. There was a surge in imports of competitive manufacturesfrom Korea, China, and other countries in the region, which contributedto the downward pressure on the price level. The ‘100 yen’ stores greatlyincreased their share of the domestic market with consumer goods pro-duced in China – often in Japanese-owned plants dedicated to producingfor the markets in Tokyo and Osaka – and there are 2000 such stores inJapan.
The prospect of ‘debt deflation’ cycle increased – a downward spiral inprices and bank capital. Excess supply resulted in downward pressure onprices. Profit rates and profit levels were squeezed because prices weredeclining more rapidly than costs. Many firms incurred losses, and somewent bankrupt; some of the losses were transferred to the bank lenders. Thevalue of bank capital declined and became more uncertain, and so itbecame more difficult for banks to raise capital. The banks were reluctant toexpand their loans to all except the most creditworthy borrowers, and thesluggish growth in credit meant that investment spending was not increas-ing and so excess supply continued to place downward pressure on theJapanese price level.
Japan continues to have the basic inputs that enabled it to achieve highrates of economic growth in the 1970s and the 1980s – the savings rate ishigh and the supply of capital is large, the labour force is skilled anddiligent and hard working, and firms are leaders in their ability to developnew technologies and to adapt those from other countries to the Japanesecircumstances.
The likelihood is high that the implosion of the asset price bubble of thelate 1980s derailed the economy. But why has the economy failed to moveback to its growth trajectory? Why has Say’s Law failed to operate in Japanfor a decade? Why hasn’t the remarkable supply capability created its owndemand? The central question is whether the tepid economic performanceof Japan in the last decades reflects the shortcomings of government policy– both the adoption of policies that were inappropriate following theimplosion of the asset price bubble and the failure to adopt policies thatwould have been appropriate – or whether instead there has been a ‘marketfailure’ and if so in which market and why?
The failure of government policy may reflect the delay in formally re-capitalising the banks after the large loan losses, or the increase in the con-sumption tax, or the efforts of the Bank of Japan to talk up the foreignexchange value of the yen, or the tepid approach to a more aggressivemonetary policy in the early 1990s, to cope with the effects of the implosionof a massive asset price bubble. To some extent the failure of government
xiv Foreword
policy might be attributed to the US authorities who at times were reluc-tant to see the yen depreciate and the trade surplus of Japan increase. The policy failure also might reflect that the ‘Japanese establishment’ wasreluctant to accept the financial losses and to accept the inevitable re-structuring of industry so that corporate Japan would be more profitable.The market failure would instead reflect that either the level of investmentor the level of saving are not sufficiently sensitive to the declines in interestrates. Thus the usual expectation is that as interest rates decline, invest-ment would increase and saving would decline until the amount thathouseholds wish to save, when the economy is fully employed, wouldcorrespond to the amount that business firms wish to invest.
Moreover, to what extent has the seemingly lost decade been anextended transient factor associated with the implosion of the bubble, andto what extent has the implosion revealed some permanent and underlyingstructural defects in the economy that had previously been obscured?
The next section of this introduction summarises the unique aspects ofJapan’s industrial structure and the relation between this structure and thecomposition of the country’s foreign trade. The third section considers theimpacts of the implosion of the asset price bubble and on the relationshipbetween the banks and their affiliated firms. The fourth section developsthe major hypothesis that the dominant problem in Japan is that theamount that households wish to save, if the economy were growing atcapacity, is significantly larger than the amount that Japanese firms wouldwish to invest at home and can profitably invest at this rate of growth. Thefifth section evaluates the proposals for getting the Japanese economy togrow again in terms of this statement of the problem. The sixth section dis-cusses direct approaches to increase consumption spending relative toincome. The final section evaluates the major theme of the ‘The Yo-Yo Yen’.
Economic structure and the foreign exchange value of the yen
Japan is different from the other industrial countries. The domesticresource base is limited; virtually all raw materials, much of energy, andmany foodstuffs are imported. The surprising aspect of the Japanese econ-omy is that the ratio of imports to GDP is remarkably low, much belowthose of other industrial countries with much richer resource bases.
If this ratio had been more nearly similar to that of Germany or GreatBritain, then the ratio of exports to GDP also would have been higher, andJapan would have had to have grown its exports and increased its share ofthe domestic markets in most other industrial countries at more rapid rates.
For most of the period 1950 to 1990, Japan’s exports were increasingtwice as rapidly as world exports. At the beginning of the period, most ofthe exports were inexpensive commodity-like manufactures – textiles,apparel, toys, and bicycles – goods that were sold on the basis of a price
Foreword xv

advantage. Relatively few products then had recognisable brand names.The more rapid growth of Japanese exports than of world exports reflectedthat the Japanese firms were able to increase their share of foreign markets– despite many protectionist barriers – on the basis of declines in price andimprovements in quality and the development of a more favourable atti-tude in foreign countries toward Japanese brands.
The change in the composition of exports has been impressive. Therewas the move into steel and radios and then TVs and then motorcycles andthen small cars and then computers and sophisticated electronics. The ratioof Japanese value, added to the total price of the product, seemed to beincreasing exponentially; Japanese brand names became dominant in autosand electronics and photo-optics. Much of the growth in exports was ingoods that Japan had begun to produce relatively recently.
By the mid-1980s Japan had become an economic superpower, secondonly to the United States. Japanese firms had become dominant players inthe global markets for autos, steel, electronics, and photo-optics. Toyotawas one of the four or five major competitors in the global auto industry,while Honda had become one of the most innovative firms. Sony set thestandard for innovation and quality in the electronics industry – and therewere many firms like Matsushita and Sanyo with extensive product linesand others like Denon and Luxman and Yamaha and Nakamichi withmarket niches in quality components. Japanese financial institutions dom-inated the hit parades of the world’s largest firms. The assets of NomuraSecurities were larger than the combined assets of the five largest US invest-ment banks.
The rapid growth in Japanese exports was facilitated by its unique indus-trial structure that nurtured the development of new firms in new indus-tries. Most of the major industrial groups have organised around what hadbeen feudal families – the Mitsuis, the Yamamotos, the Sumitomos. Beforethe Second World War, each group had a bank holding company that con-trolled a trading company, a shipping line, an insurance company, and afirm in each of a large number of manufacturing and service industries.This zaibatsu arrangement was outlawed by the occupation, but its sub-stance was retained with significant cross-shareholdings between the banksand the firms, and among the firms. The cross-shareholdings accounted forabout two-thirds of the total share ownership of the relevant firms. (Not allfirms were part of one of these groups.)
Perhaps 30 per cent of the labour force was employed under ‘lifetimecontracts.’ The firm was a ‘village’ and the wage payment based onseniority meant that the residual owners were the employees. The stock-holders traded titles to ownership in a casino, but the managers of thefirms felt no commitment to enrich the anonymous shareholders. Becausewage rates were firm-specific, the less efficient firms could match the pricescharged by the more efficient by providing less rapid increases in wages
xvi Foreword

and bonuses. The first call on the firm’s revenues was the funds to expandand enrich its product line.
There were and are many more firms in each industry than in the UnitedStates and Western Europe; for example, for a long time there were ninefree-standing firms in the automobile industry (Toyota, Nissan, Honda,Mitsubishi, Mazda, Suzuki, Isuzu, Subaru, Daihatsu), more than the com-bined number for the United States and Western Europe. The flexibility inthe wage payment system meant that the smaller and less efficient firmscould continue to compete with the leaders in their industries.
Industrial policy captured by the motto ‘Japan Inc.’ facilitated economicgrowth. The domestic market was protected from imports until Japanesefirms had reduced their costs so that they were internationally competitive.Government financial regulations were extensive and led to high levels ofinvestments; the system was rigged so that household savers required sub-sidised industrial borrowers. Interest rate ceilings on bank deposits after wereat levels below the inflation rate, so the real rates of interest were negative.Initially loans were subject to interest rate ceilings. The demand for credit atthese low interest rates was larger than the supply, and some firms withaccess to credit profited by lending some of the funds at rates significantlyhigher than the regulated rates. Exchange controls prevented householdsavers and financial intermediaries from buying foreign securities.
Japan had a ‘dual economy’ or more of a dual economy than otherindustrial countries. Firms in a few industries were super internationalcompetitors, with output per worker per hour significantly higher than inother industrial countries. A typical statement might be was that it took 78worker-hours to produce an automobile in a Toyota factory in Japan, and110 worker-hours to produce an automobile in a Ford factory in the UnitedStates. These descriptive comparisons applied to perhaps 30 or 40 per centof the firms in various manufacturing industries. In the remaining sectorsof the economy – agriculture, the rest of manufacturing industry, and theservice sectors – productivity was much below that in the United States.Observers noticed the large numbers of service personnel in departmentstores and hotels. Most of the industries in the productive sector producedtradable goods, but not all the industries that produced these goods were inthe modern sector, the operative distinction appears to be between thosefirms that produce relatively new goods at those in traditional manufacturing.
The rapid growth of exports led to the secular appreciation of the yen; atthe same time the reduction in trade and exchange controls led to an increasein imports that limited the appreciation of the yen. Japanese foreign invest-ment began to surge in the early 1980s as exchange controls were relaxed;initially in the purchase of foreign securities and subsequently in the acquisi-tion of established firms in the United States and to a lesser extent in WesternEurope. The Japanese authorities apparently realized that domestic savingswere sufficiently large so that foreign investment would not significantly
Foreword xvii

‘crowd out’ domestic investment, and that the purchase of foreign securitiesand assets would limit the appreciation of the yen. Japanese investors wereattracted to the higher anticipated rates of return abroad.
By the end of the 1980s Japan had displaced the United States as theworld’s largest creditor country. This trend continued throughout the1990s, and at the end of that decade, Japanese net foreign assets were morethan $2,000 billion, larger than the net foreign assets of all other creditorcountries combined. Japan’s net foreign assets were one-third of its GDP.The country’s net foreign assets were increasing by about 2 per cent of itsGDP, or about $100 billion a year, and the investment income on the netforeign assets had increased to about one half the value of the tradesurplus.
The United States had become the world’s largest debtor, and its net lia-bilities were larger than the combined net foreign liabilities of all otherdebtor countries as a group. To a large extent, the development of the USinternational debtor position was the mirror-image of the changes in theJapanese external balance.
One of the major questions is whether the secular trend to a higherforeign exchange value of the Japanese yen resulted from the productivitysurge in autos and steel and electronics; the story is that continued highlevels of productivity growth led to declines in selling prices which led toincreases in foreign sales which led to increases in export earnings whichled to increases in the foreign exchange value of the yen.
The competing story is that the appreciation of the yen induced placedmany firms between the proverbial “rock and the hard place”; their profitson exports disappeared, and either they would have to reduce costs tomaintain the profitability on export sales or their market share would havedeclined.
Both stories are true for different industries at different times. When theproductivity gains in a particular industry were especially large, because ofthe rapid growth in production and sales, the firms in this industry reducedtheir selling prices and that led to increases in exports and the appreciationof the yen. Then five or ten years later, the rapid productivity gainsoccurred in a second group of industries, and the resulting appreciation ofthe yen led to a decline in the profitability of the firms in those industriesthat had experienced their most rapid productivity gains earlier, and so thefirms in these industries would experience a sharp decline in profits onexports unless they reduced their costs significantly.
As long as Japanese imports consisted primarily of foodstuffs and basicraw materials, the volume of Japanese imports was not sensitive to changesin their prices. Japanese exports did not appear especially sensitive tochange in the foreign exchange value of the yen; the caricature was thatJapanese firms would sell abroad at any price and that the profits on salesin the protected domestic markets were subsidising the losses on export
xviii Foreword

sales. Few firms would reduce their exports in response to the increase inthe foreign exchange value of the yen and the apparent decline in theprofitability of export sales.
Because of the combination of the composition of imports and themarket share orientation of exporting firms, relatively large changes in theforeign exchange value of the yen were necessary to effect a significantchange in Japan’s trade balance that might be associated with changes inthe price of imports like a change in the price of oil or changes in thevolume of capital outflows from Japan.
If the range of Japanese imports had been much broader – if a large pro-portion of these imports had been competitive with goods produced inJapan – then the shocks in the form of capital flows and changes in theimport prices would have had a smaller impact on the foreign exchangevalue of the yen. It is plausible that the economic planners in Tokyo fiftyyears ago asked the ‘Never Again’ question, ‘How can we minimise ourdependence on the rest of the world?’ Their answer might have been, ‘Tothe extent possible, minimise the dependence on imports – which also willhave the advantage that the protectionists and other problems that we willencounter in increasing our share of foreign markets will be minimised.’Initially the whole array of government controls facilitated the developmentof an industrial structure that was minimally dependent on imports. Theconsequence of this skewed structure is that the range of the movement inthe foreign exchange value of the yen in response to a share is much largerthan it would have been if there had been a significantly more diverse com-position of imports.
The asset price bubble and its implosion
In the 1980s Japan experienced a massive asset price bubble. Real estateprices increased by a factor of eight or nine, and the ratio of real estateprices to GDP increased by a factor of seven. The increase in the price ofreal estate led to an increase in the price of stocks by a factor of seven. Realestate was the primary collateral for bank loans, and as the value of realestate increased, individuals and firms borrowed more from the banks.There was a massive investment boom, and consumption spendingincreased at an above trend rate. Because banks and other financial institu-tions owned large amounts of both real estate and stocks, the increase inthe value of these assets led to large increases in bank capital and in theability of the banks to grow their loans.
It seemed like a perpetual motion machine. Increases in property pricesand stock prices meant that the value of the collateral of the borrowers wasincreasing at the same time that bank capital was increasing. Bank lendinghad some of the characteristics of ‘evergreen finance’ because the borrowerswere able to use the cash from new loans to pay the interest on outstand-
Foreword xix

ing loans. Loan losses were trivial because the increases in the value of realestate collateral were larger than the interest rates on bank loans.
It was too good to last and so it did not. Stock prices have fallen to onefourth of their value at the peak, and real estate prices have declined by acomparable amount. The Japanese financial community learned that theperpetual motion machine worked in reverse, and that the loan losses ofthe lenders and the value of their capital were highly correlated. TheJapanese banks and other financial institutions have been de-capitalised.
Still there were few ‘runs’ on banks; the Japanese savers believed that thebanks were ‘too big to fail’ – that in effect they had 100 per cent depositinsurance.
Until the 1980s the major function of the credit officers of the banks wasto ensure that the market value of the real estate pledged as collateral forloans more or less corresponded with the values stated by the borrowers intheir loan applications.
The de-capitalisation of the Japanese banks de-stabilised the relationshipbetween the main banks and their traditional borrowers. The credit officersin the banks were caught in a generational change – once real estate pricesbegan to decline, their algorithm for evaluating credit risk had becomeobsolete.
The de-capitalisation of the banks has doomed the keiritsu arrangement;the main bank is no longer able to act as lender of last resort to firms thathad been within its group. Twelve or so banks have been merged into fourmain groups, and the party lines among the feudal groups have beenshattered.
Now the credit officers in the banks must determine whether new loanswould have a positive impact on the cash flows of the borrowers. Once thebanks began to use financial data to scrutinise loan applications, the bor-rowers had to developed a capital budgeting approach to determinewhether potential projects would add to the firm’s market value. The likeli-hood is high that many firms needed to develop new accounting systemsbefore they could make this evaluation.
One policy innovation in the 1990s was that Japanese firms and bankswere required to unwind their cross-shareholdings. A notable objective forthe long run. This was like a massive initial public offering; the majorimpact was to reduce share prices and increase the cost of capital toJapanese firms.
As more Japanese firms began to apply the capital budgeting approach tocurrent and new proposed activities they found that many of their existingprojects were not earning their capital costs. The implication is that firmsmust raise the rates of return on these activities or exit the businesses. Theeconomic intuition is that many of the firms that first began to follow thisapproach have decided to shrink activities and for a while at least arepaying down bank loans.
xx Foreword

Eventually the Japanese banks will learn how to do credit analysis andcorporate Japan will develop an understanding of the usefulness of thecapital budgeting algorithm in evaluating the profitability of the plants andbranches of large firms with many subsidiaries and activities.
Identifying the problem – what went wrong?
There is a long tradition across the Pacific that countries with the successfultrack record for economic growth offer advice to the less successful ones toadopt ‘our types of policies’. In the 1980s Tokyo offered a lot of advice thatthe United States should increase both the national savings rate and theexpenditures on research and development and the policies to improvelabour-management relations. Washington offered a lot of industry-specificrecommendations that were grouped under the heading of the StrategicImpediments Initiative; most of these suggestions were intended to reducethe Japanese trade surplus.
There has been an extensive debate about the policies that the Japanesegovernment should adopt to get the ‘country moving again’. A distinctionshould be made between targets and instruments. For example financialrestructuring is an instrument that might be used to increase investmentspending (which is the target). But the story needed for the links betweenthis instrument and target often is vague.
In the best of all possible worlds, each proposal might be adopted, unlessthere were a conflict among them. Most proposals would impose costs onthe well-being of one or several groups if adopted. Proposals can be rankedin terms of their benefit-cost ratios – their ability to lead to an increase inthe rate of economic growth in terms of minimal cost in terms of welfarelosses to particular groups.
One set of proposals is macro and includes a more aggressive monetarypolicy for the Bank of Japan, for a while a more aggressive fiscal policy, anda more ambitious approval to reduce the foreign exchange value of theJapanese yen. The set of micro-policies include corporate restructuring andfinancial restructuring.
Those who advocate one of the macro policies believe that the majorproblem is that demand is too modest relative to the supply capabilities,and that either investment demand or consumption demand should beincreased.
One shortcoming in the debate is the failure to distinguish targets andinstruments. The targets are the output gap or the rate of growth of realincome, the instruments are the macro-policies and the micro-policies.Those who advance one of the micro-policies need to identify the linkagesbetween these policies and one of the targets.
There has been relatively little discussion of the features or attributes ofthe model of the Japanese economy at full employment. For example,
Foreword xxi

given the upper limit to the rate of potential growth of the Japaneseeconomy, what would be the ratio of investment to GDP and what wouldbe the household savings rate?
There was a minor debate about the upper limit to feasible rate ofJapanese economic growth. As the observed rate of economic growth haddeclined, estimates of the potential rate of economic growth have beenrevised downward. The prospective decline in the population growth rateseemed to be associated with the decline in the estimates of productivitygrowth, even though the economic intuition is that the prospectiveshortage of labour should lead to increases in the investment rate as capitalis substituted for labour.
The higher the rate of economic growth, the larger the share of domesticsaving that would be absorbed by investment in plant and equipment, andthe smaller the problem – if any – with insufficient aggregate demand.
Those who advocate one of the macro-policies believe that the majorproblem is that demand is too modest relative to the supply capabilities,and that either investment demand or consumption demand should beincreased.
The amount that Japanese households would wish to save if theeconomy were to grow at a rate consistent with the Japanese version of fullemployment is significantly larger than the amount that Japanese firmscould profitably invest at this rate of economic growth. If the potential rateof growth of GDP is 2.5 per cent a year and the marginal capital outputratio is 4, then the investment-GDP ratio would be 10 if the economy wereto grow at this capacity rate. If the potential rate of economic growth is3 per cent, then this ratio would be 12 per cent at the same marginalcapital output ratio. Japanese households save about 20 per cent of theirincome.
The core economic problem is that the amount that Japanese householdswould like to save if the economy were to operate at full employmentgrowth is substantially larger than the amount that Japanese firms wish toinvest at home. The savings rate in Japan is higher than in other industrialcountries, and one of the major questions is how the economy has adjustedto this rate in the previous five decades, and the policies that might beadopted now to use these savings efficiently.
Two adjustments are necessary to the new financial environment inJapan. There needs to be a permanent adjustment so that there is a sustain-able relationship between savings and investment; either institutionalarrangements will develop so that savings can be used efficiently and prof-itably or the economy will fail to grow at its potential rate, much as in the1990s, and a non-trivial part of actual savings will be wasted – and therewill be foregone savings because income will not increase at the potentialrate. Then there is an extended transition from a time when the Japanesefinancial arrangements were effectively segmented from those in the
xxii Foreword

United States and other industrial countries; during this period there wasno systematic relation between the return on capital in Japan and theseother countries. During this transition – which has been on-going fornearly ten years – a large number of assets in Japan must be re-priced.
There are a limited number of ways in which Japan can adjust to itsmuch higher savings rate. The investment rate in Japan might be muchhigher than in other industrial countries; either because the growth rate ismuch higher while the marginal product of capital is comparable to thelevels in other countries or because the growth rate is similar to those inother industrial countries and capital is used much more inefficiently. Partor all of the excess of Japanese savings over Japanese domestic investmentmight be invested abroad – used to buy foreign securities and real assetsabroad. Part of the excess might be used to buy government securities andto finance the government’s fiscal deficit; the excess of government expen-ditures over tax revenues could be used to build roads and schools andhousing for the elderly and the poor and improve the water and sewageand transportation systems. Finally, if together these several measures arenot sufficient to absorb all of domestic saving, then Japan will adjust to theexcess of ex ante saving over ex ante investment by producing at a lowerlevel of output.
In the 1950s and the 1960s, the real rate of economic growth averaged10 per cent a year, and domestic investment was modestly greater thandomestic saving; the economy tended to become ‘over-heated’ and therewas a secular tendency toward current account deficits at least until the late1960s. The capital-output ratio was relatively low, and the rate of return oninvestment was high. In the 1970s the rate of economic growth declinedand so domestic saving began to exceed domestic investment; the capital-output ratio began to increase and there was a sharp decline in the rate ofreturn on domestic investments. Moreover, the Bank of Japan began topurchase US dollars to limit the appreciation of the yen and so foreigninvestment increased.
In the 1980s more of the excess saving was used to buy foreign securitiesand real assets including real estate; foreign investment increased to 2 percent of GDP. The combination of this level of investment and the rate ofeconomic growth of 4 per cent meant that the capital output ratio wasnearly 5 – the rate of return on investment had declined sharply, and a sig-nificant part of Japanese domestic investment was inefficient or wasteful.Because the economy was growing rapidly and household wealth wasincreasing at a rapid rate, the waste in the use of saving was not readilyapparent.
Domestic investment declined sharply in the 1990s. There was a modestincrease in foreign investment, in part because foreigners were borrowingin Tokyo to finance offshore activities. The major adjustment was theincrease in the fiscal deficit; the story or part of the story was that spending
Foreword xxiii

on public works increased sharply, and there were roads that went nowhere, airports without traffic, and parallel bridges across Tokyo Bay.Determining the value component and the waste component of thesepublic works expenditures is complex. The wasteful private investmentspending of the 1980s had been replaced by the wasteful public investmentspending of the 1990s. Finally, the rate of growth of income was modestbecause foreign investment and the fiscal deficit together were not suffi-ciently large to absorb all the saving that would have been available hadthe economy operated at full employment levels. One component of thewaste was that productive potential was underutilised.
In the long run, the rate of return on investment in Japan and thecapital-output ratio must be comparable to those in the United States andother industrial countries. The question then becomes the costs of thevarious adjustments to the higher ex ante savings in Japan, and whetherthese savings will be used efficiently.
Proposed solutions – restructuring and demand-expansion
The various proposals to solve the problem of the large and growingoutput gap in Japan can be evaluated in terms of the story that theamount that Japanese households would want to save if the economyoperated at its full employment level is significantly higher than theamount that Japanese households would want to invest. The challenge forthe proponents of individual measures to get the economy moving againis how the suggested measures will impact the relationship between savingand investment.
The dominant practice among analysts is to propose a modest number ofproposals – a more expansive monetary policy, a more expansive fiscalpolicy (at least until the ratio of government debt in the hands of thepublic begins to approach 150 per cent), re-capitalisation of the banks andother financial institutions, corporate re-structuring, and an increase inhousehold consumption. One reason that the policy makers may havebeen sluggish in adopting these measures is that almost always some groupwould become less well off if a particular measure were adopted.
An alternative approach is to endow the policy makers with ‘one thou-sand points.’ Their objective is to chose those policies which will be mosteffective in reducing the output gap in terms of the costs to different con-stituencies. The one thousand points is a metaphor for a budget constraint,the policy makers now have to choose among competing proposals. Thischoice now requires that they have a ‘production function’ for each ofthese proposals, so that they can be readily compared in terms of theireffectiveness in closing the output gap relative to their costs.
Each of the proposed policies that has been advocated to get theeconomy moving again can be evaluated in terms of how well the measures
xxiv Foreword
would enable the Japanese economy to begin to close the output gap byreducing the imbalance between saving and investment.
Corporate restructuring and financial restructuring often are viewed as‘twins’. Today financial restructuring might complicate or delay corporaterestructuring. Corporate restructuring is necessary for banks and otherfinancial institutions but it is distinct from financial restructuring.
The objective of the corporate re-structuring is to increase the profit rateon assets already on the ground. Those who advocate corporate re-structur-ing believe that the excess capacity is so extensive in some industries thatthe anticipated profit rate on new investments would be significantly belowthe cost of capital and that additional investments would depress themarket value of these firms.
Until the implosion of the bubble, most Japanese firms were interested inmarket share or in developing more sophisticated products; few were inter-ested in the relationship between the cost of capital – which was quite lowin the bubble years of the 1980s – and the anticipated rate of return oninvestment.
Now the cost of capital to Japanese firms is much higher than in the1980s as a result of the tumble in stock prices – a decline which has been intensified by the untimely decision to reduce and eliminate cross-holdings.
The implosion of the bubble and the financial stringency of Japanesefirms mean that money is no longer ‘free’ for Japanese firms, as it had beenin the 1980s and earlier decades, Now these firms have to convince bothlenders and investors that their investment projects will be profitable.
The required change in the investment behaviour of Japanese firmstoward the use of capital is seismic. These firms need to increase the rates ofreturn on the assets that are already on the ground so that they are compa-rable to the rates in the United States and other industrial countries.
Selling prices must be increased relative to costs. The managers mustrecognise and accept that the increases in selling prices may lead to adecline in sales and market share. If selling prices cannot be increased, thencosts must be reduced. Labour costs might be reduced by attrition of thenumber of employees.
Increasing the rate of return on the assets that are ‘already in the ground’requires that the owners of these assets revalue them downward – in effectto take a re-structuring charge and perhaps a large charge. These assets needto be priced so that their rates of return would be comparable to the ratesof return on new investments. Some assets might be scrapped.
The economic loss associated with the decline in the market value ofthese assets relative to their historic cost already has occurred. The ownersof these assets must recognise these losses.
The firms can shrink their non-profitable subsidiaries and activities, andstop, or at least sharply diminish, the cross-subsidisation from the prof-
Foreword xxv

itable to the non-profitable. The non-profitable activities and subsidiariescan be spun off, and allowed to sink or swim; swimming would likely meanthat the labour costs would be reduced, perhaps in part by reducing wagerates.
The Japanese government can encourage mergers to reduce excess capac-ity. The government might sponsor measures for labour retraining andearly retirement.
Increasing the rate of return on new investments is difficult as long asthere are many similar assets whose current market value is significantlybelow their reproduction costs.
The objective of financial re-structuring is to encourage banks to be moreaggressive lenders. Those who advocate financial re-structuring believe thatbanks would make a larger number of loans and investment spendingwould be significantly larger if banks were more adequately capitalised.
As a result of loan losses, the market value of the assets of many banksand financial institutions has declined below their liabilities; these institu-tions have levels of capital below the required level. Nevertheless therehave been very few runs on Japanese banks; the Japanese public believedthat their deposits were fully guaranteed by the government.
As long as there was substantial uncertainty about the value of many ofthe loans held by the Japanese banks, there was substantial uncertaintyabout the value of their capital, and it was virtually impossible for thebanks to raise additional capital in private markets. As long as banks arenot confident that they are adequately capitalised, they are likely to be cau-tious in extending new loans. The cliché that ‘they would lend only tothose firms that didn’t need to borrow’ is relevant. Private investors werereluctant to buy ‘a pig in a poke’; the insiders generally believed that thevalue of bank capital after recognition of these losses was much higherthan the outside investors. It was only in1997 that the Japanese govern-ment developed a programme that would enable the banks to becomeformally re-capitalised.
One of the buzz-words for financial re-structuring is the ‘sale of non-per-forming loans’. This term is generic and has several different meanings.Usually banks allocate part of each year’s income to a loan-loss reserve onthe assumption that loan losses are episodic and that it is desirable tosmooth reported income from the occasional losses. When loan losses arefirst recognised, the value of the loan-loss reserve (an entry in the bank’scapital account) and the loan are reduced. Subsequently the banks can sellthe loans or they can sell the collateral that they might have acquired inthe settlement of the loan; if the funds received from the sale are largerthan the value of the loan on their balance sheet, the banks have a capitalgain.
The view that financial restructuring might occur at a more rapid pacemight mean that the amounts that the banks were adding to their loan loss
xxvi Foreword
reserves were too small or that the banks were too slow in writing down thevalue of the loans or that the banks were too slow in selling the loans thatwere in default or the collateral acquired from the borrowers that defaulted.
The sluggishness in re-capitalising banks could have two impacts. One isthat the banks were reluctant to lend to many firms because they were souncertain about the value of their own capital; the implication is that if thebanks had been better capitalised, they would make a larger volume ofsomewhat riskier loans, and the level of business investment would behigher.
The second way in which the sluggishness of banks in selling non-performing loans affects the real economy is that the overhang of theseassets on the market would depress the prices of these assets. Firms would bereluctant to invest because of the concern that a more rapid sale of the non-performing loans would lead to a decline in the value of real estate assets.
Both factors may operate at the same time. If the dominant factor is thatbanks are sluggish lenders, then the interest rates spread between govern-ment securities and securities of commercial borrowers should be excep-tionally large. If the dominant factor is that the borrowers are reluctant toincrease their loans because of the concern that the sale of non-performingloans will depress asset values, then the interest rate spread should beexceptionally low.
If both factors are operating, then the relation of interest rates on bankloans to interest rates on government debt would provide the basis forinferring which factor was relatively more important.
Even if the banks had sold all their non-performing loans and had beenfully re-capitalised Japan would still face the problem that the amount thathouseholds would like to save, if the economy were operating at fullemployment, would exceed the amount that firms would like to investdomestically. Moreover, domestic investment might still be significantlybelow the level associated with full employment because many Japanesefirms still had not been able to increase the anticipated rate of return ontheir investments to correspond with their cost of capital.
The Japanese banks eventually will be re-capitalised and they will selltheir non-performing assets. Still these measures should receive priorityonly after a much larger number of firms have been successful in increasingthe profit rates on their current investments.
The necessary condition for believing that financial restructuring shouldbe a priority for the government is evidence that there are significantnumbers of firms with profitable investment projects that cannot obtainfinance. That seems unlikely.
The decline in the rate of business investment in the late 1990s is evi-dence that more and more firms realise that they must raise the rate ofreturn on their investments to their cost of capital. The decision to requirethat banks and firms reduce their cross shareholdings has increased the cost
Foreword xxvii

of capital by depressing share prices. The firms that are among the first intheir industries to understand the importance of increasing the rate ofreturn to match the cost of capital will be capturing market share from theslow learners. The banks – at least some of the banks – understand the newfinancial environment and now are reluctant to lend to those firms whohave failed to learn the lesson.
Those who favoured macro-policies believed that the dominant problemwas that aggregate demand was inadequate – that the amount thatJapanese households would want to save if the economy were operating atits full potential is significantly higher than the sum of the amounts thatJapanese firms can invest profitably domestically and the amount thatfirms and individuals can and want to invest abroad. This type of compari-son leads to the conclusion that measures should be adopted to increaseconsumption – in effect to reduce saving.
One of the objectives in most countries is to increase the savings rate sothat the consumption levels in the future will increase more rapidly. Thesavings rate in Japan is significantly higher than in virtually every otherindustrial country. But Japan is different from other countries, and the keyquestion is whether the households are myopic and are saving too much.Assume that the objective of saving is to smooth consumption over the lifecycle, so that spending to maintain the living standards in the post-retirement period will be comparable to the standards in the working years.The wealth of Japanese households is in the range of three to four timestheir incomes; assume that this same ratio is in the range of six to eight onthe eve of retirement. Assume that the life expectancy of individualJapanese at age 65 is twenty five years. Finally, assume that the real rate ofreturn on household wealth is zero.
During each of the retirement years the individual Japanese would sellsome of the assets acquired while in the active labour force to get the fundsto finance current consumption. If the spending is constant during thetwenty five years of retirement, then the individual Japanese would be ableto spend twenty four per cent of pre-retirement income if the wealth toincome ratio is six on the eve of retirement and thirty two per cent of thepre-retirement income if this ratio is eight. If consumption had been 80 percent of personal income, then the consumption spending in retirementwould be 30 per cent and 40 per cent with the two different values for thewealth-income ratio on the eve of retirement. In addition many Japanesewould have corporate pensions and government pensions, but in generalthese pensions are modest.
The funds available to finance consumption from the depletion of capitalmust be adjusted for the real rate of return on household saving. Duringmost of the period since 1950, the real rate of return to household saverswas not significantly above zero, since the inflation rate more or less cor-responded with the nominal interest rate.
xxviii Foreword

The higher the real interest rate on household savings, the larger theincome of the retired. Moreover, the higher the real interest rate, the morerapidly the stock of saving would increase. At some stage, the increase inthe stock of saving from a higher real rate of return on the previously accu-mulated savings would be so large so that households could achieve theirwealth targets with a lower level of saving from current income.
The conclusion, from the comparison of the amount available for con-sumption in the post-retirement years with the pre-retirement years, is thatJapanese households have not been saving too much. Many households arelikely to experience a sharp decline in the funds available for consumptionin the retirement years.
The reason that Japanese households may have such a high savings rate isthat they have responded rationally – and inadequately – to the very low realinterest rate on their household savings. (In a curious way this is the ‘saver’srevenge – for decades the mandarins in the Ministry of Finance used interestrate ceilings to ‘tax’ savers to subsidise business investment.) Householdsresponded by increasing the amount they saved out of current income.
Hence there are two somewhat overlapping transitions. The first transi-tion is that Japanese firms are adjusting to the requirement that theyinvested only in those projects that will prove sufficiently profitable thatthey ‘earn their cost of capital.’ Japanese savers are adjusting – slowly andcautiously – to the increase in the real rate of return on their savings. Theimplication is that the most effective approach that the Japanese policymakers might adopt to reduce the savings rate is to facilitate an increase inthe real rate of return to the savers.
Nevertheless, there is likely to be an extended period in which theamount that Japanese households wish to save will be significantly larger than the amount that Japanese firms can and want to investdomestically.
A more expansive fiscal policy would stimulate final demand; to theextent that tax rates were reduced, consumption spending and investmentspending would increase since after-tax incomes would be higher.Otherwise government expenditures would be increased. A more expansivemonetary policy would stimulate business investment and household con-sumption spending. The exchange rate policy would lead to a lower foreignexchange value for the Japanese yen.
During the 1990s Japan adopted a large number of programmes to stimu-late government spending. By the late 1990s the fiscal deficit had increasedto the range of 7 to 10 per cent of GDP; the government debt outstandinghad increased to 130 per cent of GDP and government debt in the hands ofthe public had increased to 100 per cent of GDP. These ratios increase by20 percentage points after adjustment is made for the increase in govern-ment expenditures required to formally re-capitalise the banks and otherfinancial institutions.
Foreword xxix

The persistence of a large output gap despite the large fiscal deficits hasbeen interpreted to mean that the increase in the fiscal deficit has not ledto a decline in the output gap. The alternative interpretation is that theoutput gap would have been significantly larger if the fiscal deficit hadbeen significantly smaller.
The Japanese government is on a non-sustainable fiscal trajectory; debtcannot continue to increase relative to GDP without leading to a reductionin the willingness of the public to hold government debt. The credit ratingagencies already have begun to downgrade government debt. If the ratio ofdebt to GDP continues to increase, these agencies will continue to reducethe credit ratings.
It is arguable that the agencies are mistaken in down-rating Japanesegovernment debt, since the government can always rely on the bankingsystem to finance the maturing debt. At some stage however that processwould lead to a depreciation of the yen, and the purchasing power of theyen securities would decline. As the ratio of debt in the hands of the publicto GDP increases, an increasingly large number of investors might shiftmore of their wealth into foreign securities and the yen would depreciate.Interest rates on yen securities will increase, and the interest component ofgovernment payments would increase.
At some stage and probably in the not-too-distant future, the Japanesegovernment must reduce the primary fiscal deficit from its current level of6 per cent to 5 per cent to 4 per cent; eventually the government musthave a primary fiscal surplus. The investors and the credit rating agenciesmust be convinced that the fiscal policy is on a sustainable trajectory.
The implication is that the reduction in the fiscal deficit will lead to adecline in aggregate demand, and so the excess of household saving overdomestic investment will increase.
One inference from the combination of the short term interest rateshovering about zero and the large level of bank reserves is that the Bank ofJapan has followed an expansive monetary policy. Some economists haveargued that the Bank of Japan should be even more expansive and adopt aprice level target, perhaps an increase of 1 or 2 per cent a year. The Bank ofJapan would buy assets as well as securities until the annual price leveltarget had been achieved.
One rationale for the price level target is that the more expansive mone-tary policy would lead to an increase in investment spending. The implicitassumption is that real interest rates would decline because the increase inthe inflation rate would be larger than the increase in nominal interestrates. Thus the cost of capital to Japanese firms would decline relative tothe anticipated profit rate on domestic investments. The alternative resultis that the increase in the inflation rate would be smaller than the increasein nominal interest rates because investors would want to maintain thepurchasing power of their interest income and principal.
xxx Foreword

The Bank of Japan’s monetary policy might be able to forestall theincrease in short term interest rates, but it is not likely that conventionalmonetary policies could prevent an increase in nominal and real interestrates on longer term securities.
A second rationale for the more expansive monetary policy is that con-sumption spending would increase because households would be con-cerned that the purchasing power of their time and saving deposits woulddecline, and so they would increase their spending to forestall or dampenthe decline in their purchasing power of these balances.
The competing view is that household saving would increase as the realpurchasing power of the money balances declined.
One possible result is that investment spending would increase if theBank of Japan were to follow a policy of price level targeting while house-hold spending would decline and partially or fully offset the increase ininvestment spending. That result may seem a bit paradoxical, since one ofthe motivation for the increase in investment spending would be a morerapid increase in consumption spending. Moreover, even if the householdspending increases, it is not clear that the increase in spending will make asignificant dent in reducing the output gap.
The more expansive monetary policy is likely to lead to a decline in theforeign exchange value of the yen as Japanese investors adjust to theincrease in inflationary expectations by reducing their holding of yen secu-rities. The counterpart of the increase in the capital outflow would be anincrease in the current account surplus; the increase in Japan’s net exportswould close part of the output gap. Moreover the increase in the yen priceof the US dollar would lead to an increase in the profit rate on the produc-tion of exports and import competing goods, which in turn would lead to ahigher level of investment.
The alternative approach to increasing the Japanese trade surplus is forthe Bank of Japan to buy US dollar securities – in effect the Bank of Japanwould conduct its open market operations in US dollar securities.
A major difference between these two approaches is that the yen rate ofreturn on Japanese foreign investments has been significantly smaller thanthe rate of return measured in the foreign currencies because of the seculartendency toward the appreciation of the yen. The revaluation losses thatJapanese investors have encountered on their foreign investments varieswith the choice of holding periods; this loss has been in the range of 3 to4 per cent for most extended holding periods involving the purchase of USdollar securities.
The Bank of Japan might be more willing to incur the revaluation lossesthan private investors because of the positive externalities for the countryof a larger trade surplus.
One question is the relation between the increase in the capital outflowfrom Japan, and the decline in the foreign exchange value of the yen.
Foreword xxxi

Japan’s major trading partners and particularly the United States mayconclude that attempting to reduce the output gap by significantlyincreasing net exports and the current account surplus, smacks of a‘beggar-thy-neighbor’ policy. In part the US reaction to the increase inthe Japanese trade surplus of a given amount will depend on the changein the foreign exchange value of the yen associated with the increase inthe Japanese trade surplus. The smaller the decline in the foreignexchange value of the yen associated with the increase in the Japanesetrade surplus, the less likely is an adverse or hostile reaction from USpolicy makers.
One of the empirical concerns is how much of the output gap in Japanmight be closed by an increase in the trade surplus.
The second factor limiting the reduction in the output gap that might beassociated with the increase in the Japanese trade surplus is that at somestage Japan must move from being a young creditor country to a maturecreditor; then Japan would have a trade deficit that would be fully financedfrom the income on its foreign investments. That transition is likely to beassociated with a real appreciation of the yen. In the past Japaneseinvestors who have purchased foreign securities have experienced revalua-tion losses as the Japanese yen has appreciated; the nominal appreciationhas absorbed most of the excess of interest rates on US dollar securities overthe interest rates on comparable yen securities.
If the yen were pegged to the US dollar, then Japanese investors mightconclude that the likelihood of a revaluation loss would be smaller and theamount of this loss would be smaller. In the short run, say for a year ortwo, Japanese purchases of foreign securities would be smaller because theywould lack confidence in the stability of the parity. As their confidenceincreases, their purchases of foreign securities would increase.
The review of the menu of alternatives available to the Japanese gov-ernment is complete. Corporate restructuring with the intent to increasethe profit rate on new investments and hence on old investments is toppriority. Financial restructuring in contrast is low priority because theproblem is not the shortage of funds available for lending – and the saleof assets would depress the rate of return on new investments. (At somestage these assets must be sold, but the sale should wait until the rate ofeconomic growth has increased toward the rate of growth of output.)Fiscal policy must move into a less expansive stance. Monetary policy ishighly risky. Exchange rate policy may be successful in closing part of theoutput gap, but the window for a potent increase in the trade surplusbegan to narrow rapidly when the United States moved into a recession.Japan’s competitors in the export markets are unlikely to accept a signifi-cant decline in their own competitive position, and the United States is notlikely to accept a major increase in its trade deficit with Asian countries as agroup.
xxxii Foreword

Adjusting the savings gap
One of the central questions noted at the beginning of this introduction iswhether the increase in the output gap in Japan should be attributed to thefailure of government policy or to a market failure. The companion ques-tion is whether the surge in the output gap is more nearly a transientphenomenon or whether instead the increase is permanent.
There have been failures in Japanese policy – errors because of the fail-ures of economic analysis and of an appreciation in Tokyo and inWashington about the major changes in the financial environmenteffected by the implosion of the bubble. The major policy errors were theeffort to ‘talk up’ the foreign exchange value of the yen and the timid andbelated efforts to formally re-capitalise the banks. The major problem isthat a great deal of time would have been required for those involved infinance at the corporate level and the banking level to recognise the impli-cations of the need for the rates of return on assets in Japan to adjust toworld levels.
The adjustment has been complicated because there is a strong presump-tion that there has been a market failure – that Japanese savers as a groupwill not reduce the amount they want to save as interest rates decline inconformance with the usual textbook model. So a non-trivial componentof saving has been ‘wasted’. During the 1980s the waste involved an exces-sively high level of private investment; in the 1990s the waste involved theexcessive expenditures on public works and an increasingly high levelunderemployment. ‘Saving is a private virtue and a public vice’, at least forthe last twenty years in Japan.
The implosion of the bubble effectively de-capitalised the banks, with theconsequence that Japanese firms now for the first time must satisfy a cost-of-capital test comparable to the one faced by firms headquartered in mostother industrial countries. Many Japanese multinational firms already arecomfortable in dealing with this global standard.
The seismic shift is that for the first time the managers are being requiredto be concerned with the profitability of the firm’s subsidiaries and otheractivities. The task of increasing profitability is immensely more difficultbecause of the commitment to lifetime employment.
The attention to financial restructuring is misplaced. There is relativelylittle evidence tha the sluggishness in investment has resulted because thebanks were tepid lenders; the dominant factor has been that firms havebeen adjusting their investment spending downward as they strive toincrease the rate of return on existing assets.
The dominant economic problem of a large and growing output gap inJapan reflects that the domestic saving rate at the full employment level ofoutput growth would be significantly larger than the amount that businessfirms wish to invest at this output level. In the 1980s the primary adjust-
Foreword xxxiii
ment to this imbalance involved an excessively high level of private invest-ment. Some of this investment was wasteful, and ongoing adjustments tothis level of investment continue to depress investment spending.
In the 1990s and especially in the second half of the decade, the growingand large fiscal deficit absorbed some of the excess saving; part of thepublic works spending and perhaps a large part was frivolous. The secondadjustment was that the output gap continued to increase.
The government’s fiscal policy now is on an unsustainable trajectory. Aslong as the annual fiscal deficit continues to increase much more rapidlythan GDP, the credit rating agencies will lower the ranking of governmentdebt. At some stage the government will be obliged to reduce the primarydeficit; initially the government may place a ceiling on the interest rate onthis debt. This interest rate ceiling will reduce the nominal and real rate ofreturn to Japanese savers.
A monetary policy of inflation targeting might lead to an increase ininvestment spending if real interest rates decline. But it is a bit ironic tothink that the Japanese savers will passively adjust to the decline in the realvalue of their saving; they might tend to increase their saving to compen-sate for the decline in the purchasing power of their saving.
The increase in the trade surplus associated with a more expansivedomestic monetary policy, either with the purchase of domestic securitiesthat leads to an increase in the Japanese purchase of foreign securities orthe purchase of US dollar bonds by the Bank of Japan will absorb some ofthe ‘excess saving’.
The sad experience for Japanese savers is that the ‘promises’ that havebeen made to them by the system about the real purchasing power of theirsavings have not been maintained. In the 1950s, the 1960s and the 1970s,the annual inflation rate generally was higher than the nominal interestrate. In the 1980s many savers experienced large real rates of return on theirholdings of stocks and real estate, but a large part of these gains have beenerased by the decline in the prices of these assets since the early 1990s.
The market failure is that there appears to be no interest rate at whichthe level of household saving would decline to the amount that theeconomy is prepared to invest. The savings function may be backwardbending; as interest rates decline, households may increase the amountthat they wish to save.
The failure of saving to adjust leads to the question of whether theJapanese government should adopt direct measures to reduce the savingrate – or more appropriately to alter the form of saving. The Japanesegovernment might be encouraged to distribute ‘housing investmentvouchers.’ Each household that intends to build a new home would begiven a government voucher that would pay for 30 or 40 per cent of thecost of the house. Private investment in housing would be encouraged atthe same time that debt financed public works spending would decline.
xxxiv Foreword
‘The yo-yo yen’
Brendan Brown’s contribution to this debate highlights that saving is a‘public good’ and that global welfare would be enhanced by an increase inJapanese foreign investment. His model is that of Great Britain in the nine-teenth century and especially in the last third of that period; about half ofthe country’s saving was re-invested abroad. Much of the investment wasin the ‘new lands’ – the United States, Canada, and Australia – areas that interms of law and business practice were extensions of Great Britain.
Japan could readily invest 5 or 6 or 7 per cent of its national incomeabroad if the institutional mechanisms were accommodating. BecauseJapanese national income is so large, the amount that Japan could investabroad is large relative to the domestic saving in the developing countries.Asset preferences seem mis-matched; the Japanese portfolio investors arereluctant to acquire claims on developing country borrowers. Theseinvestors can satisfy their demand by purchasing US dollar securities andthe securities available in a few other developed countries, and investorsresident in these countries in turn would purchase securities issued by theborrowers in the developing countries.
Large flows of financial capital from one country to another raise thequestion of the transfer problem – what is the mechanism that will inducethe changes in relative prices and incomes so that the transfer of realresources that is the counterpart of the transfer of financial capital can beeffected? Currency values were pegged in the nineteenth century althoughthe US dollar floated for nearly twenty years after the beginning of the CivilWar.
The transfer mechanism appears to have operated less efficiently in thelast twenty years. Part of the answer may be that a large part of Britishforeign investment flowed to what had been its colonies; in effect a verylarge share of this foreign investment occurred within a group of countriesthat were parts of an English-speaking club with similar business practices.
Part of the answer is that exchange risk is significantly larger when cur-rencies float. When currencies are pegged, the authorities in each country –or at least most of them – have significant commitment to adopt domesticfinancial policies so that the parities can be maintained. They succeedextensively but occasionally they fail. In contrast when currencies are notpegged, there is one less constraint on the choice of domestic financialpolicies with the frequent result that the inflation rates are higher andmore variable.
Japanese household savers must have concluded that the financialenvironment is hostile. In the 1950s, the 1960s and the 1970s real rate ofinterest were negative. When they began to invest abroad – diversificationis next to motherhood as a classic virtue – they incurred revaluation lossesthat may have led them conclude that they should have stayed at home.
Foreword xxxv
During this period the United States was often viewed as having a uniquerole as an international banker – investors in one group of countries wouldbuy US dollar securities, and Americans in turn would be able to buy acomparable amount of foreign securities, with the US trade and currentaccount deficits largely unchanged. The story was that the foreign investorswould buy short term US dollar securities and so the United States wouldprovide liquidity services, while American investors would buy longer termforeign securities. Nice in theory, but in practice for most of the last twentyyears the United States has proven to be more of a destination than aconduit. Interest rates on foreign securities have been higher than those onUS dollar securities, but not by enough to compensate foreign investors theadditional risks they associate with these investments.
Thus the transfer mechanism has been partially frustrated both in theflow of capital from Japan and the flow of ‘imported capital’ from theUnited States. In the best of all possible worlds, Japanese savings mighthave added $200 billion to $300 billion a year to the real assets of thecapital importing countries. Exchange risk and uncertainty about exchangerates has deterred the flow of capital. In part the Japanese decision to mini-mize dependence on imports has contributed to this uncertainty, sinceshocks have led to a much greater range of movement in the foreignexchange value of the yen. In part the decision to adjust the exchange rateto the price level rather than the price level to the exchange rate has alsocontributed, since the revaluation losses associated with the appreciation ofthe yen has deterred the capital outflow.
Brendan Brown has provided a comprehensive and compelling story ofthe waste of hundreds of billions of dollars of Japanese savings that other-wise could have contributed to the enhancement of living standardsaround the world.
ROBERT Z. ALIBER
xxxvi Foreword

1
Introduction
Why tell the history of a currency? That is an obvious question to ask atthe start of a book which though not primarily a historical narrative doescontain four out of six chapters whose focus is the yen’s past. After all,what happened to the yen when linked to gold or silver surely has littlerelevance to us understanding the situation of the modern yen. Of coursethere is always the unifying theme of curiosity. People visit museums to seewhat life was like in their cities in previous eras. In the same way Japanesetoday may be curious about the type of currency problems – both at amicro and macro level – that previous generations of Japanese faced. Andthat curiosity can extend to non-Japanese with an interest in Japan. But theaim here goes well beyond the satisfying of the historically curious –though if some satisfaction for some readers is provided on that score, thenall to the good. A knowledge of yen history should help us understand thepresent situation of the yen in a number of ways.
First, there have been some distinctive characteristics to Japanese currencyproblems through the last 150 years which justifies grouping them togetherfor the purpose of analysis. Our understanding of the old problems shouldhelp us understand at least some aspects of some newer and maybe somefuture problems. Examples of distinctive characteristics include periodicallystrong aversion to the risk of investing in foreign assets; the occasional giantwaves of foreign speculation in the Japanese currency market; an officialdomwhich is uneasy with taking bold stances on currency or monetary policy onthe basis of any particular economic theory, even though within the seniorranks of policy-makers there exist pockets where these theories are well under-stood; a sometimes bloated perception (amongst both market-participants andpolicy-makers) of Washington’s power; and a pendulum in monetary policy-making which swings between tolerance of inflation and a weak currency,and obstinate pursuance of deflation and hard money doctrine.
Second, policy-makers and some market-participants refer to the labora-tory of their own currency’s history when diagnosing the present situationand creating possible scenarios for the future. In the period around the

collapse of Bretton Woods, for example, Japanese officials studied the lastperiod in which Japan ran large current account surpluses – during the FirstWorld War. And in the banking crises of the late 1990s they referred backto Japan’s previous crisis period of the 1920s. Market-participants in the1990s were still haunted by the Nixon shock (1971) and the Plaza mini-shock (1985). When the Kobe earthquake struck in January 1995 somemarket-participants looked back to the currency impact of the Great TokyoEarthquake in September 1923. Hence to understand the reaction of policy-makers and market-participants to events we should have some knowledgeof the national laboratory to which they refer, even if it is arguable whetherthat is the most relevant and whether they should have paid moreattention than they did to foreign laboratories.
Third, by putting ourselves in the situation of market-participants atprevious crucial points in the history of the yen, assessing the possiblescenarios of what could have occurred and comparing these with whatactually happened, we should be able to sharpen our probabilistic visionregarding the future – both of the yen and indeed of wider issues concern-ing the global flow of international capital. (Probabilistic vision means themapping out of the main possible scenarios for the future, attaching proba-bilities to each outcome.) The bulk of the historical narrative in this bookrelates to the 30 years of floating exchange rates since the final breakdownin 1971 of the Bretton Woods international monetary order, and so anysharpening of probabilistic vision is likely to be of considerable relevance toa whole range of decision-makers over coming years.
Is the exercise of putting together a factual and counterfactual history ofthe yen – and drawing broader implications for the Japanese economy – notone which can be better done in Tokyo than London (or any other globalfinancial market-place)? That is a type of question that often arises when anauthor writes about a subject where he or she is at some apparent geographicdisadvantage. But in the case of currency analysis it would be hard to pressthe case that any geographic advantage exists. There are two currenciestraded against each other in any exchange market. An understanding ofglobal capital flows together with what drives them is surely much moreimportant than any extra anecdotal evidence which might be obtainablefrom a specific geographic location regarding one of the issuing economies.
Indeed throughout the narrative in this book the yen’s fluctuations arepresented in a global context. A methodology is presented in Chapter 3 fordistinguishing periods when the yen is in the limelight of the currencymarket from when the other two major currencies – the US dollar and theeuro (previously the DM) – are holding sway, either unilaterally ortogether. Currency motion within the key US dollar–euro(DM)–yen triangletakes the form of either unilateral moves by one of the three currencies oraxis dominance by one pair of currencies (sometimes the euro–dollar axis,sometimes the euro–yen axis, and sometimes the yen–dollar axis). And why
2 The Yo–Yo Yen

do we speak of a key currency triangle in which the yen is one corner,rather than a quadrilateral which includes the British pound, or a pentagonwhich includes the pound and Swiss franc? Fitting the yen into a geographyof currencies is the final topic of Chapter 3.
Chapter 3 is in fact the watershed in this book. Having finished tellingthe pre-history of the modern yen (in the years from 1860 to 1935) andthen the evolution of the yen through the Bretton Woods period up untilthe Plaza Accord (1985), there is then a pause in the narrative to draw out acentral theme. The violent fluctuations and prevailing misalignment (over-valuation) which have marred the post-Plaza history of the yen(1987–2001) stem from a malfunctioning of the normal equilibratingmechanisms which would export a huge domestic savings surplus into therest of the world. This malfunctioning was already apparent at times in thelate 1970s when Japan’s private sector savings surplus first emerged in size.But the problem became acute in the aftermath of the bursting bubbles inJapan’s real estate and equity markets, from 1990 onwards. Japan shouldhave been running massive capital exports with the yen at a competitivelevel, its current account surplus reaching the peak levels seen in previoushistory and in contemporary times for other high savings economies.Instead, an infernal set of circumstances caused the yen to rise towards thesky and the huge private sector savings surplus to be deployed in buildingbridges and dams in the middle of nowhere.
Analysis of that infernal set is the subject-matter of Chapters 4 and 5,based on a provisional hypothesis put forward already in Chapter 3.According to this hypothesis, neo-mercantilists in Washington were notthe prime cause of malfunction. They could not have inflicted seriousharm without many coincidental factors in Japan playing an importantrole. Chief amongst these were first grave errors in monetary policy. Andsecond, two heads of the Bank of Japan (1990–4 and 1998– ) believed in astrong yen for its own sake, hoping that the shock of currency apprecia-tion would help trigger economic reform. They failed to see, let alonebroadcast the message, that the surge in the savings surplus which fol-lowed the bursting of the bubble economy should mean both a hugecurrent account surplus and a weaker yen. Third, the lack of constitu-tional-type rules for either monetary policy or fiscal policy created avacuum where an unholy alliance could develop between LiberalDemocratic Party (LDP) big spenders and Washington. Fourth, anti-economic reformers in Tokyo saw advantage in a strong yen as a way ofdeflecting US pressures to demolish restrictive practices. And fifth, tradi-tional groups within the Japanese bureacracy (particularly in the ForeignOffice) that favoured a reorientation towards Asia and away from the USAwere pleased with the transplantation of Japanese industry into neigh-bouring economies brought about by the strong yen, even if that processof hollowing out meant zero or low growth in Japan.
Introduction 3

For a brief period in 1996 and early 1997 it seemed that the infernal setof circumstances was about to disintegrate as capital exports gained consid-erable momentum and the yen fell. Briefly Japan was at the top of the G-7growth league. But a series of events – including Japan’s acquiescence in abizarre appreciation of the yen under pressure from Washington, a failureof monetary policy to accommodate the brief attempt to rein in fiscaldeficits, and then the Asian crisis – drove an already vulnerable Japan into aserious deflationary situation. The coincidence of a scandal at the Bank ofJapan (BoJ) resulting in the appointment of a new Govenor renowned forhis strong yen views and zealous in his pursuance of independence for thecentral bank from the Ministry of Finance (possible under the just passedBank of Japan law) was unhelpful at the least.
What can and should be done about flaws in the Japanese policy-makingsystem – and in the international monetary system – which allowed theyo–yo yen to fluctuate so violently and cause so much damage? This finalquestion is the subject of Chapter 6. Two recipes are discarded – theseinclude turning the clock back to a fixed exchange rate regime and doingnothing. Instead the proposal is put forward of a new constitutional frame-work for monetary and fiscal policy to accompany a completely free float ofthe yen. This framework would include contingency arrangements whichwould come into force if a state of deflation alert were declared. Most prob-ably the framework could have produced better results for the Japaneseeconomy in the recent past and it might well improve prospects in thefuture, both for the working population and rapidly growing retired popu-lation. Yet the actual drama of the yo–yo yen through the 1990s remainstroubling. Confidence in international economic cooperation and in skilleduse of fiscal and monetary policy tools being capable always of preventingsevere global recessions has surely been undermined. International eco-nomic institutions such as the International Monetary Fund simply failedto meet the challenges presented by wild fluctuations and serious overvalu-ation of one of the three key currencies in the world.
4 The Yo–Yo Yen

5
1Historic Roots of the Yo–Yo Yen(1859–1949)
The pre-historical period of the Japanese yen begins and ends with criticaldecisions made by the USA. The so-called Ansei-Man’en monetary reformsof 1859/60 which accompanied the re-establishment of diplomatic andtrade relations between Japan and the Western Powers after more than twocenturies of seclusion were largely influenced by US pressures. Less than acentury later, in the aftermath of the Pacific War, it was the US OccupationAuthorities who relaunched the yen at a rate of 360 to the US dollar as partof the Dodge Plan. The pattern of critical US intervention was to continueinto the modern era – including, first, the forced revaluation of the yen inAugust 1971 under irresistible pressure from the Nixon Administration andsecond, the Plaza Accord of 1985. In the middle years of the 1990s (1993–7)the Clinton Administration sought to manipulate the yen on a number ofoccasions. But the violent fluctuations and misalignment of the yen duringthat Lost Decade for the Japanese economy stemmed also from manyimportant sources inside Japan.
Ever since Commander Perry and his black ships sailed into Edo harbourin 1853, there have been winners and losers in Japan from US intervention.The power of Washington to prescribe yen policy has depended – invarying degrees – on cooperation from those within Japan who stood togain. And so it was with the drastic reforms of 1859/60. The agenda of theUSA and other Western Powers (France and Britain were also very involvedin the chain of events from the opening of Japan in the mid-1850s to thefall of the feudal Tokugawa regime in 1868) was to create trade links withthe almost totally closed island economy (the only opening was via theofficially tolerated Dutch colony in Nagasaki). An essential precondition tointernational trade between Japan and the outside world was the setting ofa rate of exchange between Japanese and foreign monies.
In Tokugawa Japan money consisted of gold, silver, and copper coins butthere was no free market in bullion. A narrow market existed for preciousmetals bought and sold for non-monetary purposes, but the rate ofexchange between gold and silver bore no close relationship to international

prices (hardly surprising given the absence of trade). Moreover, the silvercoinage had been heavily debased during successive ‘reforms’ instituted bythe shoguns in need of extra funds. (Shogun was the name given to themilitary rulers of Japan, all stemming from the Tokugawa family.) The totalmisalignment of the rate of exchange between silver and gold money insideJapan to that outside Japan (and most of the world was then at leastformally on a bimetallic standard based on gold and silver) was the problemwhich had to be addressed.
The demands made by US negotiators and the response by the Tokugawaregime culminated in a period of hyperinflation, which itself played a criticalrole in undermining the feudal state and bringing about the Meiji restoration(1868) (marked by the end of the shogunate and the assumption of power bya reformist regime legitimised by the ‘restoration’ of power to the Emperor).The hyperinflation was not planned but the income redistribution con-sequences of the currency changes made to accommodate US demands wereforeseeable. Large landowners, bankers, and merchants gained, whilst peas-ants, urban commoners, and the lower-ranking samurai lost.
The key role of inflation in undermining the established social andpolitical order was not a new feature of world history. Silver brought toEurope by Spain from its conquests in South America had been the catalystfor revolutionary change in the sixteenth and seventeenth centuries. Thenew aspect, in the case of Japan, was the source of the inflation storm – aforeign power dictating exchange rate policy aimed at extracting favourableconditions of trade (albeit without significant success, as the price of theprincipal Japanese export, silk, jumped to take full account of currencymanipulation and access to the international market).
The Ansei-Man’en monetary reforms, 1859–60: a first shock fromWashington
In 1858, Japan’s metallic money (in contrast to various forms of papermoney issued by feudal domains) consisted of 53 per cent gold coin (theryõ), 40 per cent silver coin (principally the ichibu-gin, equivalent legally toone-quarter of a ryõ) and 7 per cent silver currency by weight (mainly usedin western Japan around Osaka). The silver coins (ichibu-gin), valued on thebasis of silver content and at the international exchange rate between silverand gold (the ratio of gold to silver prices – each measured for the same unitweight – in the world market was around 15.5 and was anchored in theFrench bimetallic system), were worth far less than their legal equivalent interms of gold coin (12–13 ichibu-gin rather than four ichibu-gin would haveexchanged for one ryõ).
The US negotiators led by Townsend Harris – the US representativeresident in Japan since 1854 and described by Allinson (1999) as ‘a patri-cian Yankee down on his luck’ – took the silver coin (ichibu-gin) as the basis
6 The Yo–Yo Yen

for determining an international exchange rate. Silver money, in particularthe Mexican silver dollar, was the medium of exchange used in trade by theWestern Powers with the Far East (for example, the Dutch East Indies,China and India) and it was natural that Japan should fit into that samesystem. The USA determined an official exchange rate between theMexican silver dollar and the ichibu-gin based on the relative silver contentof the two coins. (At this time the USA was nominally on a bimetallicstandard; but effectively it was on a gold standard, with silver dollars out ofcirculation, as the ratio of exchange between gold and silver coins as fixedby the Mint Act of 1837 had undervalued silver relative to its internationalprice. Hence the Mexican silver dollar sold at a premium to the US golddollar.)
For official transactions one silver dollar was fixed at three ichibu-gin. Atthat official rate of exchange, 100 ryõ could be obtained against 133 silverdollars. In fact, rates of exchange for private transactions were freelynegotiable, and in the early days the ichibu-gin’s free market value (indollars) was above its official rate under the influence of the arbitrage trans-actions described below. Various forms of leakage, however, set a limit tothe discrepancy between the free and official rates, even though there wasno provision for the free minting of coins (whereby anyone can takebullion to the mint office and have it made into coins at no charge) whichin countries on a full metallic standard sets a ceiling to their currency’s value(in terms of other currencies on the same metallic standard). For example,the shogunate could profit when the free market rate of the ichibu-gin wasabove its official rate by the minting of new coins. Their agents could turnMexican dollars into ichibu-gins (a process that involved melting down andminting) and then sell the newly created coins in the private market for a greater number of Mexican dollars than to start with. Of course, theoperation was only undertaken if the profit margin covered the costs of re-minting.
In 1859, immediately following the opening up of trade, there was ahuge arbitrage opportunity for foreigners in the form of buying ichibu-gin(either at the official rate or somewhat more expensively in private trans-actions), exchanging them into ryõ (at the legal tender rate of 4:1), ship-ping these gold coins back home, and melting them down. The shogunateimmediately sought to close the arbitrage opportunity by reforming itssilver coinage. A new silver coin, the nishu-gin, was issued, of similar silvercontent to the debased ichibu-gin, which was to exchange (on the basis oflegal tender) against the ryõ at a rate close to the international exchangevalue of their respective metallic contents (around 13 nishu-gin per goldryõ). The intention was to withdraw the ichibu-gin from circulation bybringing to an end their legal tender. The exchange of ichibu-gin into nishu-gin would have imposed a loss on present holders and the overall impactwould have been deflationary.
Historic Roots of the Yo–Yo Yen (1859–1949) 7

However, before the issuance of the new coin had barely got under way,vigorous opposition from the USA brought the operation to a stop. TheUSA saw the step as a ploy to reduce at one stroke the purchasing power ofthe Mexican dollar, in terms of Japanese goods, to one-third. Bowing underUS pressure, the shogunate switched strategy. The gold ryõ was now to beroughly between one-half and one-third of its previous size. Small new ryõcoins (Man’en) were to replace the old larger ryõ coins (Ansei) at a ratio ofslightly less than 3:1. During the three-to-four month interim period untilthe new coins appeared in circulation the existing coins were ‘called up’ inface value by a multiple of two to three. The implicit rate of exchange forthe new coins against the Mexican dollar was still 100 ryõs/133mex$ (usingthe official rate).
The huge increase in the money supply (measured in ryõs) had fullypredictable consequences. Within one year, the price level (quoted in ryõs)jumped by 30 per cent and by 1866 was up 400 per cent from pre-tradelevels. Peasants and urban commoners, the main holders of silver coin,suffered loss, as did the general wage-earner and the lower-ranking samurai(feudal administrators). By 1865 the real wages of carpenters in Osaka werehalf of what they had been in the 1840s. Excluding extreme famineperiods, peasant riots and urban revolts became more numerous than atany time. The price of the main export, raw silk, soared (up by more than250 per cent immediately following the opening of trade).
There were only fleeting gains for the USA or other Western Powersbefore price rises had extinguished any benefit (whether for foreignconsumers or merchants) from the exchange rate of the ichibu-gin (and byimplication the ryõ) having been set so low. Furthermore, there were theonce-and-for-all profits made by coin arbitrageurs before monetary reformcounter-measures took effect. In summary, the US negotiators had not beenvery smart. Was the shogunate any more astute? Was there really noalternative to the self-destructive policy of hyperinflation?
One possibility would have been for the shogun’s agents to permit andeven promote a free market in Japan for gold ryõs against Mexican silverdollars (where the rate of exchange would have reflected closely the relativeprice of gold and silver in world markets). Notionally one ryõ would haveremained equal to four ichibu-gin, but no holder of ryõs would have partedwith them at that rate given the alternative of readily exchanging themfirst into silver dollars in the free market. Silver dollars would have circu-lated alongside ichibu-gins as a parallel money albeit at a rate of exchangebetween the two which would have been somewhat variable. Theshogunate could have met the increased demand for ichibu-gins (now themain medium of exchange, given the effective withdrawal of gold ryõs fromcirculation) by minting more of these coins (either out of silver bullion orfrom first melting down Mexican dollars), so preventing their value fromrising substantially above their official price (in terms of Mexican dollars).
8 The Yo–Yo Yen

Gold ryõs would simply have ceased to be money but would haveremained an important part of private wealth. Some share of the pre-reform stock of gold ryõs would have been exported in exchange for silver,which would have been minted into an additional stock of ichibu-gins. Theryõ could have remained as the unit of account. But ichibu-gins and to alesser extent Mexican dollars would have been used for transaction pur-poses. (Indeed, Mexican silver dollars did circulate to some extent in theyears up to the currency reforms undertaken in the mid-1870s under theMeiji Restoration). The price level measured in ryõs (in effect an accountingunit equivalent to four ichibu-gins) would have increased (as the windfallgains in private wealth from the jump in silver value of gold ryõs wouldhave fuelled an increase in spending) and the money supply (consistingmainly of ichibu-gins) would have grown in step.
Inflation might well have been less than what actually occurred becausethe gold ryõs withdrawn from circulation by their owners and hoardedwould not have formed part of the money supply. The shogunate couldhave earned some profit from its arbitrage-type operations and the arbi-trage profits made by foreigners (at the expense of Japanese who disposedof their gold coins) in the months before the eventual monetary reformwould have been prevented. In time a much bigger silver coin could havebeen minted to form part of the circulating money without any oppositionfrom the Western Powers. Indeed, that is what occurred a decade laterfollowing the Meiji restoration.
Another option was for the shogunate to have bargained more effectivelywith the USA (and the other Western Powers who were negotiating treatiessimultaneously). Perhaps the shogun’s representatives could have insistedon the official rate of exchange being fixed in terms of gold ryõs rather thansilver (ichibu-gins). (The free market rate of the ryõ could have risen abovethe official rate unless the shogunate introduced the free minting of goldinto gold ryõs.) After all, the USA was itself effectively on gold, Britain wason gold, and France was fully on a bimetallic standard (gold and silver). Orperhaps the Tokugawa regime could have simply said no to the requestfrom the USA that Japan desist from reforming its silver coinage. Indeedthe outbreak of the US Civil War was soon to reduce any imminentmilitary threat from Washington to zero and Britain was later apologeticfor the whole sorry episode. Were there insiders (in the shogunate), orpotential domestic opponents of the Tokugawa regime, who stood to gainfrom the confused state of US currency policy? Or was the shogunatesimply inept in matters of currency policy? The facts presented here areconsistent with both hypotheses (which are, in any case, not mutuallyexclusive) but proof is beyond the subject-matter of this book. The same setof questions, however, reappear frequently in Japanese currency history –particularly in the last three decades of the twentieth century, which formthe content of later chapters.
Historic Roots of the Yo–Yo Yen (1859–1949) 9
The long march from silver to gold, 1868–1897: inflation, deflationand devaluation
Soon after the Meiji restoration in 1868 (the term given to the successfulrebellion against the shogunate by a group of ‘clans’ in western Japan whotook power under the banner of restoring the Emperor as the head ofgovernment and who were intent on modernisation as the means of resist-ing colonisation by foreign powers) the new rulers initiated monetaryreform soon after they assumed power in 1868. As a first step the circula-tion of silver weight currency (prevalent still amongst Osaka merchants)was suspended (leaving ichibu-gins as the only silver element in monetarycirculation). Then in 1870 a new silver coin of the same weight andfineness as the Hong Kong trade dollar was minted, with the intention ofJapan moving on to the silver standard. A year later, there was a change ofcourse, under the influence of Germany’s adoption of the gold standard(following the Franco-Prussian War) and of early moves in the US Congresstowards putting the USA on the gold standard (convertibility of the dollarinto gold or silver had been suspended during the Civil War).
According to the ‘New Currency Ordinance’ promulgated in 1871, thebasic unit of the Japanese currency was fixed as a gold coin called the yen.This was specified as having a weight of 25.72 troy grains and 90 per centfineness. The new coin was to be round and the decimal system was used(100 sen = 1 yen). (New small silver and copper coins, denominated in mul-tiples of 1 sen, replaced the ichibu-gins and other smaller change.) The tra-ditional gold coin, the ryõ, was declared equivalent to 1 yen. The goldcontent of the new coin (one yen) was around 25 per cent less than of theold and so the yen gold coin sold for less than the ryõ in terms of foreigncurrencies. Around 25 per cent fewer Mexican dollars were required to buy100 yen in 1871 than 100 ryõs in 1860, despite little change so far in theinternational rate of exchange between gold and silver. The motivationbehind the shrinkage of the gold content was concern at the growingamount of paper money and debts redeemable in coins (see below). Ineffect the ‘New Currency Ordinance’ was a devaluation of Japan’s money(albeit that some holders of the old ryõ coins might have sold them into aninternational market where they would be priced according to their goldweight rather than using them to effect payments which could be made 1:1with the new yen coin of lower gold content).
For the convenience of trade with Asia a one yen silver coin (much largerin size than the yen gold coin), equivalent in weight to the Mexican dollar,was also minted, but its use restricted to the open ports. A parity of 100 yenin silver equivalent to 101 yen in gold was fixed. In 1875 the weight of thesilver coin was increased slightly and the following year gold and silvercoins were declared interchangeable (1 yen gold = 1 yen silver). In accor-dance with the rules of a metallic standard (whether gold, silver or bimetal-
10 The Yo–Yo Yen

lic), the coins were freely minted (meaning that silver or gold could be con-verted into coins at par value on demand). This meant that the yen couldnot rise significantly higher in the currency markets than the level impliedby the lower of its value in silver or gold form. (Note that free minting hadnot applied previously, even though first the shogunate, and later the Meijirulers, did effectively set a limit to any potential rise of the yen above silverpar value by their plentiful supply of new coins.)
Meanwhile, an international slump in the price of silver had set in,caused by huge new discoveries of the metal and the demand for goldfollowing Germany’s shift from a silver to a gold standard. France (andother countries in the Latin Monetary Union) made a first step towardsabandoning bimetallism by restricting the free minting of silver, and theUSA was progressing further towards adopting the gold standard. (In 1873Congress passed legislation which excluded silver from future mintingoperations.) The fall in the price of silver against gold resulted in large-scaleexports of gold coins from Japan (arbitrage took the form of importingsilver into Japan, having the silver minted into silver yen coins, exchanginginto gold yen coins at 1:1, and exporting the gold coins to be melted downand sold). The silver yen became the dominant medium of exchange asgold yen dropped out of circulation (partly due to the arbitrage trans-actions described and partly due to Japanese hoarding the gold coins ratherthan parting with them at an undervalued level domestically). In 1878 theauthorities recognised the inevitable by officially permitting the unlimiteddomestic circulation of the silver yen. Though Japan was still legally on abimetallic gold and silver standard, in practice it had moved on to a silverstandard, on which it remained for the next nineteen years.
Why did Japan opt for the silver standard rather than following theexample of European countries and the USA, which were shifting frombimetallism to gold? In principle, Japan could have suspended the freecoinage of silver. The main consideration was that Japan did not have largegold reserves, and the issuance of paper money (which under the goldstandard would be redeemable on demand in gold) was growing rapidly asa consequence of the weak state of government finances in the early yearsof the Meiji restoration (exacerbated by the armed revolt of the samurai in1877). There was a better chance of anchoring the yen to silver than togold and the fact that the other main countries in Asia were on silver musthave been important.
The new instability in the ratio of silver to gold prices in the worldmarket meant that exchange rates between countries on the silver standardand those on the gold standard now became volatile, with the currencies ofthe silver countries on a falling trend (Figure 1.1). (An exception to thefalling trend was a short-lived 25 per cent surge of the silver currencies in1890 on speculation that the Sherman Act, passed that year by the USCongress, would lead to large official US purchases of silver.) In any case,
Historic Roots of the Yo–Yo Yen (1859–1949) 11

the higher transport costs, relative to value, of silver over gold, meant thatexchange rates between silver currencies or between silver and gold curren-cies could move within wider margins – for any given relative price of silverand gold – than between the gold currencies.
By 1879, when the USA effectively went on to the gold standard, thelargest area (in terms of economic size) of the world currency map was in agold bloc (including the USA, Great Britain, France, Germany, and manysmaller countries), and there was a smaller area of countries on the silverstandard (principally Japan, China, Russia and India). In Russia theconvertibility of paper currency into silver had been suspended followingperiods of war causing the exchange rate of the rouble (in non-metallicform) against the gold standard currencies to be weaker than implied bythe relative price of silver and gold. Over the next decade (the 1880s) thefall in the silver price aided the return of rouble notes to their par value.Eventually, in 1893, Russia abandoned the silver standard (suspending thefree coinage of silver in the face of a huge influx of the metal, whichcreated an inflation menace). India also moved off the silver standard inthe same year. And so when Japan shifted from the silver to gold standardin 1897 the silver area had effectively narrowed to include only China andHong Kong.
12 The Yo–Yo Yen
Figure 1.1 Gold–silver parity, 1868–94*
* Relative price of gold in terms of silver, based on London market prices.

However, we are rushing too far ahead in our story. Returning to 1878,Japan was already well into a period of paper inflation, in which yen notesfell to a steep discount below silver yen, similar to what had occurred inRussia during the previous two decades. Very early on (1868), the Meijiadministration had started issuing ‘gold notes’ (kinsatsu) to finance itsbudget deficit and soon these were quoted at below par. Nonetheless theygradually came to be accepted as currency (the government helped bringthis about by announcing that part would be redeemed in newly mintedcurrency and part with government bonds bearing 6 per cent interest).Throughout the 1870s the plight of the Treasury grew more and moredesperate and the government issued paper money in several forms.Following the abolition of the feudal clans, which had held great power inpre-Meiji restoration Japan, all their outstanding notes (1,694 differentvarieties of paper money called hansatsu) became an obligation of thecentral government and in 1871 were redeemed with new paper money.
The rapid increase in paper money and the sharp rise in prices (inflationwas less rapid when measured in terms of silver yen than paper yen) hadalarming repercussions on the whole fabric of the economy. Action wasfinally taken in the early 1880s by Masayoshi Matsukata, who was appointedFinance Minister in October 1881. He pursued a policy of stringent fiscaldeflation (cutting government expenditure and increasing taxation), sellingpublic enterprises to private buyers, usually at knock-down prices (amongstthe buyers were the ‘political merchants’ who formed the great conglomer-ates, the so-called zaibatsu), and accumulating silver as the counterpart to anemerging trade surplus (technically, the government lent paper money toexporters against their bills of exchange, then collected the amounts due forthe goods in silver). As the reserve ratio of government and bank notes incirculation rose to over 35 per cent (calculated as the value of silver inofficial reserves as a proportion of paper outstanding), the paper yen rosetowards parity with silver yen, which was achieved by end-1885.
In modern-day terms the so-called Matsukata deflation was a severe fiscaland monetary deflation following an inflationary boom during which bothmonetary and fiscal policy had been stimulatory. During the deflation itself(1882–5) the exchange rate between the silver yen and the dollar was on aflat trend, meaning that the paper yen appreciated sharply. In itself theofficial purchases of silver (equivalent to foreign exchange intervention inthe direction of selling yen) dampened the extent of monetary contraction –but the budget surpluses plus sales proceeds of public enterprises far offsetthe silver purchases and so the overall money supply (including silver coinand paper money) fell, as the net surplus was used to retire note issues.Many of the small and industrial enterprises that had mushroomed in theinflationary period went into bankruptcy. A number of banks had tosuspend business whilst many suffered huge losses. Round the corner,however, from 1885 to 1887, lay a 20 per cent depreciation of the yen
Historic Roots of the Yo–Yo Yen (1859–1949) 13

against the dollar and other gold currencies, in line with a sudden sharp fallin the price of silver (Figure 1.2). A new period of prosperity dawned, withthe fillip from yen devaluation playing an important role. Indeed, the yenfell substantially further against the dollar and other gold currencies in theperiod 1891–4, in line with new weakness in the price of silver. This was anearly example in Japanese history of devaluation pulling the economy outof a post-bubble depression – an exit door that was to be barred, with severeconsequences, a little more than a century later (in the 1990s).
With paper yen now back to par with silver yen in 1884, the govern-ment published its ‘convertible bank note regulations’ and in May 1885the Bank of Japan issued its first convertible 10-yen notes, which werefollowed by 1-yen and 100-yen notes. The Bank had already started opera-tions in 1882 (modelled largely on the Belgian central bank which hadbeen set up in 1850 and thus possessed more elaborate statutes than theBritish or French central banks), but its privilege of issuing convertiblebanknotes had so far been withheld. Implementing the privilege did notmean that the Bank of Japan had any real control over monetary develop-ments. Japan was now fully on a silver standard. In the new period of pros-perity that started in 1886, Japan’s exports to countries using the goldstandard boomed (spurred by devaluation) and the inflow of silver via thetrade surplus led to monetary expansion. Overall there was mild inflation(in contrast to the deflation then experienced by the gold standard coun-
14 The Yo–Yo Yen
Figure 1.2 US$/yen exchange rate, 1880–97
$ y

tries which stemmed from a world-wide scarcity of the yellow metal – notrelieved until well into the following decade as a result of huge newdiscoveries).
In 1893 the government appointed a Commission to study the problemof inflation, but its report, submitted in July 1895, was inconclusive. TheCommission discussed in particular the question of whether to adopt thegold standard, but showed no decisive preference in that direction.However, Masayoshi Matsukata, an advocate of gold, became PrimeMinister in September 1896 (holding office until January 1898) whilstretaining the post of Minister of Finance. China was now paying largeindemnities in sterling to Japan under the terms of the Treaty ofShimonoseki, which had ended the 1894–5 Sino-Japanese War (Japan alsogained Taiwan). The new additions to Japan’s gold and near-gold reserves(sterling was convertible into gold) reduced the apparent risks of shifting tothe gold standard (less danger of being forced off by a shortage of bullionduring any subsequent financial crisis). In March 1897 a currency law waspassed prescribing that the yen was equal to 750mg of gold and that coinsof ¥20, ¥10, and ¥5 would be minted. Hence the yen against gold wasvalued at one-half the level fixed by the 1871 currency reform. Theexchange parity against the US dollar corresponding to the new gold valuewas ¥100 = $49.845. And so the yen had fallen more than 60 per centagainst the US dollar since an official exchange rate had first been set in1859. In October 1897, the new currency law became effective, puttingJapan on the gold standard.
There followed almost twenty years of exchange rate stability against theUS dollar and major European currencies – roughly equal in length to theother main period of stability in the history of the yen from 1950 to 1971under the Bretton Woods System. Even whilst war raged between Japanand Russia in 1905, the yen remained on gold (as did the Russian rouble).But the monetary experience of the first forty years that followed theopening of trade with the outside world had left currency devaluation andinflation as no strangers to the modernising Japanese economy. Later boutsof enthusiasm for monetary orthodoxy and a strong national currency,whether briefly at the end of the 1920s, or during the lost decade of the1990s, were not the results of historical conditioning.
Japanese currency policy during the First World War: new problem –how to recycle a huge trade surplus?
Japan’s break with the gold standard came during the First World War. InSeptember 1917, the USA (which entered the war in April 1917) prohibitedthe export of gold, stifling the equilibrating mechanism that kept the yenwithin tight limits against the US dollar. The yen climbed well above its parvalue (to the US dollar) in line with a huge surplus which had developed in
Historic Roots of the Yo–Yo Yen (1859–1949) 15

Japan’s trade balance (as much as 40 per cent of GDP according to someestimates). Japan, an ally of Great Britain, had declared war on Germany atthe outbreak of hostilities in 1914, but it played virtually no part in mili-tary operations. As a non-belligerent economy, its industries thrived,meeting demand particularly from other Asian countries that had been cutoff from traditional European sources of imports. Suddenly Japan, which inthe years prior to the First World War had been in substantial trade deficit(normal for a developing economy importing capital from the rest of theworld), found itself in the reverse situation.
Yen strength did not emerge immediately at the outbreak of war. Indeed,during the early weeks, Japan found itself in a liquidity crisis. The shipmentof export bills to the London market via the Trans-Siberian railway wassuspended and so the inward flow of foreign exchange fell sharply. TheBank of Japan had to sell gold to prevent payments for imports forcing theyen below its normal floor (set by gold arbitrage) against sterling or the US dollar. Junnosuke Inouye, who alternated roles between Governor ofthe Bank of Japan and Minister of Finance through the 1920s, wrote thatsenior officials felt that Japan was well down the road to bankruptcy(meaning a moratorium on international debts) in autumn 1914 and thefollowing winter. By spring 1915 the fog had lifted as orders for arms andmunitions began streaming into Japan from the entente governments(mainly France and Great Britain). As military and non-military exportsboomed (in volume and in price), Japan faced a new problem that wouldresurface in a much more enduring form fifty years later. How was it torecycle a huge trade surplus into foreign assets?
So long as the dollar and yen were on the gold standard, Japan’s hugetrade surplus was largely matched by an inflow of gold, which in turnfuelled monetary growth and inflation. The problem of inflation and whatto do about it preoccupied Japanese financial officials, and some of the solu-tions they came up with bear some resemblance to various policy optionsdiscussed or even implemented in the much longer period of surplus duringthe last three decades of the twentieth century. Most involved the promot-ing of capital exports. In principle a boost to capital outflows would meanless upward pressure from the trade surplus on the money supply (or on theexchange rate, once this was floating as from 1917).
During 1915 and 1916 the Japanese government made a series ofdomestic debt issues for the purpose of repaying external debts. But thisapproach came up against the barrier of the No Loan Policy imposed by thegovernment of the day (zero addition to government debt). Then therewere the official loans to China (the so-called Nishihara loans made in aspirit of conciliation after initial strong-arm diplomacy). Foreign govern-ments – France, Great Britain, and Russia – made debt issues in Tokyo. Andfinally, Japanese investors bought a small amount of loans placed in the USmarket by the British and French governments.
16 The Yo–Yo Yen

In general the Japanese public showed no great enthusiasm for foreigninvestments. According to Inouye, as a contemporary observer, ‘in count-ries such as England, France, and Germany, the man in the street is aforeign investor. Japan, by contrast, had never been wealthy enough forpeople here to indulge in such investment. During the war period therewas a lot of talk about how we ought to invest abroad, but a nation cannotacquire discrimination in such a matter all at once, and to all intents andpurposes no such investments were made by this country.’ Maybe Inouyewas making too much of wealth and discrimination as factors in foreigninvestment. More important were the relatively high interest rates at hometypical of the pre-war savings shortage – the counterpart to the trade deficit– and wariness of investment in assets of warring nations. Europeaninvestors may have had more experience of foreign assets, but the hugelosses made by Dutch and Swiss speculators buying German marks duringthe First World War and beyond hardly testifies to wisdom. The speculatorsin marks, however, were only a subset of the investment population. SomeDutch and Swiss investors gained from buying US securities when thedollar fell sharply against their own currencies during 1917–18.
Indeed, in many respects, the Japanese yen during the First World Warfits into the group of neutral currencies – including the Dutch guilder,Swiss franc, and Spanish peseta – rather than to the belligerent currencies,even though Japan was technically a military participant (on the side of theentente powers – Britain, France and Russia). There were, however, someimportant differences. The flow of gold between the USA on one the handand Switzerland and the Netherlands on the other was disrupted early onin the conflict, unlike the situation between Japan and the USA (where sea-lanes between Tokyo and San Francisco remained fully open). Henceemerging balance of payments surpluses for Switzerland or the Netherlandshad little automatic offset in the form of gold inflows and had a biggereffect on the exchange rate. Moreover, both Switzerland and theNetherlands were the recipients of huge volumes of capital flight, much ofit out of Germany. Japan, by contrast, did not attract refuge capital. On theother hand, Japan did not face the physical constraints on internationaltrade experienced by Switzerland and the Netherlands (the British fleet’sinterruption of shipping across the North Sea to check that supplies werenot headed for Germany, and German interference with Rhine traffic).
During the first three years of the war, the Swiss franc and Dutch guilderfluctuated quite sharply, whilst the Japanese yen remained near its goldparity to the dollar. For example, in the early stages of the war the Swissfranc fell below its gold parity to the dollar on pessimism about theprospects for the Swiss economy, given its high dependence on imports ofgrain (much of which had come from Russia), energy, meat and wool, andits land-locked position. Also there were some fears about whether Swissneutrality would be respected, especially for a brief interval following Italy’s
Historic Roots of the Yo–Yo Yen (1859–1949) 17

entry into the war (May 1915). Into 1916, however, the Swiss franc rosesharply under the influence of growing inflows of refuge funds. By contrast,the Dutch guilder, which had been strong through much of 1915, fell backin 1916 as the Netherlands exporters provided larger credits to theirGerman customers and the British grip over Dutch trade tightened. Spain,unlike the Netherlands and Switzerland, was so far largely free of restric-tions on its international trade. As Spain’s agricultural and steel exportsboomed, its government took measures similar to those in Japan towardspromoting capital exports – repaying foreign loans and providing largecredits to France. The Spanish peseta, unlike the Japanese yen, had notbeen on the gold standard, and rose sharply.
The Japanese yen, though on gold, did move sharply against thecurrency of its number one trade partner, China. In fact, the yen fellsteeply against the Chinese currency (the Shanghai tael) and Hong Kongdollar, which were still on the silver standard, as silver prices soared(explained by the use of this metal in the manufacture of explosives). FromSeptember 1917, however, it was the movement of the dollar that tookcentre-stage in Asia. With gold arbitrage operations now fully suspendedbetween the USA and Japan, the yen climbed to over US$52/¥100 (com-pared to parity of US$49.845 = ¥100). Even so, the extent of that climb canonly be described as very modest compared to either the experience of theneutral currencies or to later events (in the last three decades of the twenti-eth century). For example, the Swiss franc reached a peak level (in June1918) of more than 30 per cent above its gold parity against the US dollar.
One principal difference in the Japanese experience was the huge buyingof dollars by the central bank. The Bank of Japan stemmed the rise of theyen by accumulating vast foreign balances (¥1.1 bn in 1920), largely inNew York, even though there was no longer any possibility of convertingthese into gold. These foreign balances were to play a large part in the man-agement of the exchange rate in the post-war years. Already Japan hadaccumulated huge reserves in gold (until the US embargo on gold exportsin September 1917). Financial officials in the Japanese government and theBank of Japan were not at all happy with the rapid accumulation of foreignbalances, partly out of concern at exchange risk (the dollar could fallfurther against the yen), and partly out of inflation fears (the process ofaccumulating the balances involved domestic monetary expansion).
In May 1918, the Exchange Investigation Committee was appointed toexamine the question of currency policy. The issues considered by theCommittee would have been only too familiar to currency policy-makers atthe end of the twentieth century – possible concerted action by the centralbanks in Japan and the USA, concerted action between the leading privatebanks in Japan and the US, limitation of interest on bank deposits, encour-agement of foreign investments, and limitation of exports. In fact war cameto an end (November 1918) before the Committee reported. If there had
18 The Yo–Yo Yen

indeed been a final report it would have been seriously flawed for not con-sidering one key option – letting the yen float freely (no further acquisitionby the government of foreign balances), albeit coupled with a clear state-ment of intent to return to the gold standard as soon as possible after thewar ended.
The big advantage of a free float, whenever adopted (from summer 1915onwards), could have been the lowering of inflation pressure. Buoyantdemand for Japanese exports would have sent the yen higher. The boomwould have been less intense in the export sector, as profits there werecooled by the yen’s ascent. The rate of monetary creation would haveslowed with the government (via the Bank of Japan) no longer acquiringforeign balances. The outflow of private capital into foreign investmentswould have been stronger, as Japanese investors could look forward to alarger currency gain from the eventual fall in the yen once peace came.What were the disadvantages?
First, a free float would have been a journey into the unknown. Virtuallyever since the Meiji restoration the yen had been on the silver or gold stan-dard. True, there had been experiences elsewhere of floating currencies forlimited periods (for example, the Russian rouble in the late nineteenthcentury between leaving the silver standard and joining the gold standard,or the US dollar in the decade following the Civil War). But their relevanceto the Japanese situation during the First World War was dubious. Andthere was the contemporary experience of sharply fluctuating (and gener-ally appreciating) European neutral currencies to suggest caution.
Second, on the eve of the First World War, Japan was still a relativelyunderdeveloped economy compared to the USA, Great Britain, France andGermany. War brought a big fillip to Japan’s developing industries, whichgained not only from booming export demand, but also effective protec-tion (as competitor economies were mobilised for military production). Thewar was most likely to only last a few years and the acceptance of inflationmight be a sacrifice worth making for the one-off benefits of acceleratedindustrial development.
Third, the country’s gold and foreign exchange reserves were small andoverall it was a large net debtor. A massive build-up of gold and foreignexchange reserves was consistent with the aim of furthering Japan’s posi-tion as a great military power.
The first era of a floating yen, 1919–32
In principle, Japan could have moved back to the gold standard as early as June 1919. That was when the USA lifted its embargo on the export ofgold – almost simultaneously with the conclusion of the Versailles PeaceConference. The essential step would have been for Japan to lift its ownembargo (introduced in 1917, as reciprocal action to the US embargo
Historic Roots of the Yo–Yo Yen (1859–1949) 19

imposed two days earlier) on gold exports. That step was not taken finallyuntil a doomed moment in early 1930 when the world economy was in thefirst phase of its greatest ever depression. Japan’s only response to thelifting of the US embargo in June 1919 was to make important conversionsof dollar balances into gold.
The hesitation in Tokyo towards restoring the gold standard reflected thehuge uncertainty as to how the Japanese economy would perform now thatpeace had returned and the special elements in its wartime prosperity nolonger applied. The price level in Japan had risen rapidly during the FirstWorld War – substantially more than in the USA. Fixing the yen prema-turely to the dollar at its previous gold parity might mean considerableproblems for Japan’s export industries when faced with an expected sharpfall in demand. In addition the war chest of huge gold and dollar reservescould be frittered away. At the Genoa Conference of 1922 the report ofexperts hinted at the merits of Japan returning to gold at a devalued rate,and a leading economist, Gustav Cassel, calculated the so-called purchasingparity level of the yen against the dollar as between 35 and 40 US$/100yen. Returning to gold at a devalued rate was not a first time experience inJapanese currency history. That is what happened, after all, when Japanadopted the gold standard in 1897, following more than twenty years onthe silver standard. But that was not the path followed in the 1920s, eventhough several prominent Japanese economists argued the case strongly.
Hence the Japanese yen joined the other major currencies of the world ina new era of floating exchange rates following the First World War. Therewere several important differences between this first era and the second erathat started in 1971. First, the US dollar remained fully convertible intogold (both domestically and internationally). Second, there were powerfuland persistent expectations about an early return to a fixed exchange ratesystem (based on gold), albeit that in the case of the French franc eventualreturn was to be at a devalued gold parity, and the German mark was toexpire worthless before its successor currency, the Reichsmark, waslaunched on a gold basis. Third, the yen of the 1920s was to a considerableextent a commodity currency – with Japan’s principal export, raw silk,having its price determined in dollars on the world market. Fourth, byeconomic size, the Japanese yen tied for fifth place (with the Italian lira) inthe 1920s, rather than occupying second place as by the 1970s.
During the first forty years or so of the Meiji restoration (1870–1913),living standards in Japan (GDP/capita) had grown at a similar annualaverage rate to those in the US and Germany (around 2 per cent p.a.).Overall economic growth had been much faster in the USA (4.6 per centp.a. compared to 2.4 per cent p.a. in Japan), reflecting the rapid populationincrease there amidst a great wave of immigration. In the next twenty-fiveyear period, 1913–38, Japanese economic growth (at 3.9 per cent p.a. onaverage) ran far ahead of that in the USA (1.1 per cent p.a.) or Europe
20 The Yo–Yo Yen

(Germany, 1.8 per cent p.a.; Great Britain, 0.7 per cent p.a.). Some econ-omic historians see in that growth spurt for Japan in the quarter centuryfrom 1913 the forerunner to the miracle years of 1953–73. But that sweep-ing overview fails to distinguish some very large variations in economicfortune, both in Japan and in the rest of the world.
First there was the great wartime boom in Japan from 1915 to 1919.Economic growth from 1913 to 1919 has been estimated at 6.2 per centp.a., with investment spending increasing by 8.4 per cent p.a.. Then therewas a lost decade of low growth, financial crises, and the Tokyo earthquake.Economic growth during 1919–31 ran at only 1.6 per cent p.a. on average,with investment spending down by 0.7 per cent p.a.. A change in currencypolicy in 1931 ushered in several years of very rapid growth before theJapanese economy went on to a war footing from 1937 onwards. From1931 to 1937, the economy grew by 6.2 per cent p.a., with investment up8.3 per cent p.a.. By contrast, the US economy enjoyed a wave of prosperitythrough the 1920s, before passing through the Great Depression of 1930–3.
Misguided currency policy played a role in the lost decade of the 1920s as itdid in the 1990s, albeit that the mistakes stemmed from a quite different com-bination of circumstances. Later in this volume the question will be posed as tohow different the 1990s would have been for Japan if the yen had fallensharply after the ‘Bubble economy’ burst rather than rising to the sky. In theearly 1920s the counterfactual currency question is how the economy wouldhave performed if the yen had been allowed to fall freely (and far) after thebusiness cycle peak of early 1920 and had subsequently been re-pegged to goldat say 35 US$/100 yen rather than at almost 50 US$/100 yen. The counter-factual story would start with the Japanese stock market crisis of March 1920and would also have to include the real events of the Great Kanto earthquakein 1923 and Japan’s military advance into Manchuria in autumn 1931.
The economy had remained in boom after the First World War ended,right through 1919 and into early 1920. The banks had continued to fuel abuild-up of speculative credit. As during the war, the government hadremained in large fiscal surplus. Interest rates had remained low through-out the war (reaching in 1917 the lowest level since 1911) and only beganto rise in winter 1919/20 as imports boomed and the trade surplus van-ished. Suddenly, on 15 March 1920, the bottom fell out of the stock marketand panic ensued. The Tokyo stock exchange closed its doors for two days.Later there was a stock exchange holiday from mid-April to late May. Theindex of stock prices (July 1914=100) fell from 250 in January to 113 inJune. There followed two years of economic stagnation as export marketswon during the war were lost one after the other, producing a large-scaledeficit in the balance of payments. The government and Bank of Japanresponded with a policy of bold lending to depressed industries. A slightbusiness recovery got under way in winter 1921/22, but in late 1922 runson banks (eleven in western Japan failed) led to new confusion.
Historic Roots of the Yo–Yo Yen (1859–1949) 21

The currency policy that accompanied this set of events was effectively adirty float – large-scale intervention to prevent the yen falling far. Indeed,the immediate trigger to the Crash of March 1920 had been an unsterilisedsale of dollar balances by the government aimed at preventing a fall of theyen as imports outstripped exports (unsterilised means that the yen pur-chased by the government was taken out of monetary circulation andthereby put upward pressure on interest rates). The dollar balances acquiredduring the war years became a key determinant of the exchange rate for theyen. In somewhat convoluted language, Inouye described the rate of theyen as ‘artificial – in that the sale of the government’s balances abroadexerts on [the yen] an influence which has been powerful and not natural;the determining factors on which the yen exchange rate depends are thecurrent amount of our balances abroad and our policy in regard to thesebalances. Their free liquidation means a rate moving towards $49, whilst arefusal to draw on them entails a movement below $40.’
During the depression of spring 1920 to 1922 the government allowed theyen to fall only modestly to a low of US$47/100 yen (Figure 1.3). That was at atime when it was appreciating sharply against the currency of a principaltrade partner (albeit now second to the USA) – China. The price of silver (towhich the Chinese currency was linked) collapsed in half from its wartimepeak until the end of 1920. In late 1922 and early 1923 the Kato governmentadopted the policy of pushing the yen higher (using the official dollar
22 The Yo–Yo Yen
Figure 1.3 US$/yen exchange rate, 1918–25
$ y

balances for this purpose), with the purpose of reducing import prices (whichparticularly favoured the important cotton spinning industry). By the end ofApril 1923, the exchange rate had gone to $49, and there was much talkabout an early lifting of the embargo on gold exports (meaning that the yenwould again return to the gold standard at the pre-war parity). But the govern-ment, concerned at the low level to which its foreign balances had declined(depleted by years of intervention to support the yen), hesitated.
Then in September 1923, calamity struck as the Great Kanto earthquakedestroyed much of Tokyo. Today, the question is sometimes posed as towhether earthquake disaster could strengthen the yen in the short run bybringing a sea-change in international capital flows. A sudden increase indomestic investment (for reconstruction) and fall in personal savings couldtrigger a big jump in interest rates and bond yields creating heavy capitalinflow rather than outflow (as discussed in a later chapter). But in 1923 therewas no ambiguity – the yen came under immediate downward pressure,which was initially countered by heavy official intervention (the governmentrunning down its dollar balances) but subsequently led to a sharp fall. Thescale of the disaster included 105,000 dead, 554,000 homes destroyed (out of2.3 million total), and 7 per cent of national wealth destroyed. In Tokyo, inthe immediate aftermath of the earthquake, there was an outbreak of socialviolence, as frenzied mobs attacked Koreans and the police murdered com-munists, amidst false rumours that Japanese communists and Korean nation-alists were trying to set up a revolutionary government. (The news of thisviolence was hushed up until several weeks after the earthquake.)
Why was the currency market so convinced of the negative consequenceof the earthquake for the yen in 1923 in contrast to the diversity ofopinion that a similar catastrophe would provoke at the beginning of thetwenty-first century? A key difference could have been the behaviour ofcapital flows. Today a jump in Japanese bond yields set off by an earth-quake would attract a large amount of foreign capital inflows and wouldalso encourage some Japanese investors to lighten up on their holdings offoreign bonds, reinvesting the proceeds in yen. Back in the 1920s, Japanwas not regarded as a high-quality debtor. Foreign exchange reserves hadfallen sharply since the war (although large gold reserves had been main-tained) and the private sector did not hold a large amount of foreign assets.The earthquake itself lowered the implicit credit-rating of Japan, as USinvestors in particular (the biggest international lenders in the 1920s) wereconcerned about the huge trade deficits which were likely to lie ahead.Bonds denominated in yen, still a floating currency unlinked to gold, werenot attractive to investors outside of Japan. The idea that a currency couldbe driven higher by high interest rates despite a large trade deficit wasstrange to the investment community of the 1920s (in contrast to its famil-iarity with investors at the end of the century who had much recent experi-ence of currencies floating upwards despite large trade deficits).
Historic Roots of the Yo–Yo Yen (1859–1949) 23

If Japan had been on the gold standard at a devalued rate (say, US$35/100 yen) when the earthquake struck, capital might well have flowed in tofinance the widened trade deficit, with just a slight rise in yen interest ratestaking place. At the pre-war parity, by contrast, the yen would probablyhave been toppled off gold. In the world of the 1920s huge flows of capitaldriven by interest arbitrage did take place between currencies on gold atrealistic parities. For example, Germany attracted huge volumes of capitalinflows, especially from the USA, in the years 1924–7. The German economyhad many admirers in the USA and its central bank (the Reichsbank) wassubject to an international treaty (the Dawes Plan) which seemed to guaran-tee financial stability and a fixed exchange rate (against the US dollar) forthe Reichsmark. By contrast, US investor opinion was not friendly to Japan.Washington distrusted the expansionist designs of the Japanese military(even though Tokyo had agreed to limitations on naval armaments follow-ing the Washington Conference of 1922). New measures to curb immigra-tion into the US (eventually signed into law in 1924) were viewed in Japanas hostile, considering the tough restrictions applied to ‘Orientals’.
On top of these unfavourable factors was the fact that the governmentand central bank did everything possible to stop interest rates rising in thewake of the earthquake, even though that is what would have happened onthe gold standard (or under a modern monetary regime where the centralbank targets a stable price level). The authorities’ immediate objective wasto prevent any seizing up of liquidity. Beyond that, the aim was to foster agenerous supply of credit for the purpose of reconstruction. In early 1924,the Japanese government arranged a series of foreign loan offerings withthe declared purpose of preventing a shortage of capital from pushing uprates in the domestic market. In the currency markets, the Japanese author-ities battled during the first few months following the earthquake toprevent the yen from falling far by running their dollar balances downfurther. In January 1924 a new government abandoned the policy of prop-ping up the yen, even though each subsequent decline was heralded bydeclarations that the rate would not be permitted to go any lower.
In the first few months of 1924 the yen fell by around 20 per cent invalue to $40/¥100 and by the end of 1924 was down to $38/¥100. Animmediate factor behind that decline was the jump in the trade deficitaccompanied by the policy of holding down interest rates. The deteriora-tion in the trade balance stemmed from both the underlying increase ininvestment (reconstruction expenditure) and a fall in savings and tempo-rary bottlenecks in domestic supply. As illustration of the latter factor,there was the need to import timber despite there being forests acrossJapan. Yes, the raw timber was there all right, but what was not there wasany proper plant for sawing it. Japanese domestic architecture used shapedtimber (posts and boards), not logs. Such sawmills as there were provedentirely inadequate to cope with the demand for materials suitable for the
24 The Yo–Yo Yen

construction of homes on the scale required. Accordingly the quickest andcheapest way out to the difficulty was to import sawn timber from the USA.Moreover, there were practically no factories in Japan equipped for theproduction of builders’ hardware.
In principle, a currency beaten down to a low level by a temporary surgein imports should become attractive to speculative investors. And that isexactly what happened in the case of the yen in early 1925. True, the yenat $38/¥100 was not fundamentally cheap (indeed, still somewhat higherthan the purchasing power parity level against the dollar), but given its pre-earthquake level and the probability of an eventual restoration of the goldstandard at the pre-war parity, there were obvious speculative attractions.According to Inouye, the turnaround of the yen originated with heavydemand from speculators in Shanghai. The Chinese currency (and silver)tended to follow a seasonal pattern, reaching its peak at the end of the(Chinese) year when heavy demand for cash to settle accounts created aliquidity shortage. Hence Chinese traders were particularly interested inlooking for foreign currency assets at the turn of the year (given the likeli-hood of a seasonal fall in the Chinese currency during following months).In 1925 the end of the Lunar Year was in the first week of February and awave of speculation on a yen rise swept Shanghai. By the end of March theexchange rate had risen to $42/¥100. Late in the same year a broad-basedadvance of the yen got under way on signs of a falling trade deficit andsubstantial progress in reconstruction. There were hints that Japan mightuse part of its gold reserves to bolster the yen. Briefly, spring shoots of par-liamentary democracy appeared following the elections of 1924, and thismay have helped underpin demand for Japanese bond issues in the USA.
Into 1926 there was growing speculation on a return of Japan to the goldstandard, and the new Finance Minister in September of that year pushedforward preparations for the move. But the plans were interrupted by asevere financial crisis, which erupted in spring 1927, and brought on a cropof bank failures culminating in a three-week moratorium on all financialobligations. An immediate trigger to the crisis was government indecisionas to how far to bail out banks which held large amounts of so-called‘earthquake bills’ (debts which had been frozen in the immediate wake ofthe earthquake). But the ultimate source of the difficulties were the hugespeculative activities in the years 1915–20 and the floundering of theeconomy since. There is the obvious parallel here with the banking crisis ofsummer/autumn 1997 which came a full six years after the bursting of theBubble (of 1987–90) during which time the economy had stagnated.Banking stability was undermined by a combination of original speculativeexcess and dismal macro-economic performance largely stemming frompolicy error. Banking crisis (at a national rather than international level)usually goes along with a flow of capital out of the afflicted centre and sothe yen weakened in the midst of the 1927 crisis.
Historic Roots of the Yo–Yo Yen (1859–1949) 25

By 1929, however, speculation was again riding high that Japan wouldlift its embargo on gold exports (and thereby returning to the gold standardat the pre-war parity). Through the spring, the government (formed fromthe Seiyukai party) repeatedly denied that a move was imminent, andissued a particularly strong refutation in May 1929. In July, however, a newgovernment (formed from the Minseitõ party) came into office and pledgedto lift the embargo. Inouye, the Minister of Finance, pursued fiscaldeflation laying the groundwork for the restoration of the gold standard.Loans were arranged with New York banks. The crash of the New Yorkequity market in October 1929 was seen in the market-place (and byJapanese officials) as facilitating an early lifting of the embargo, as creditbecame available in New York at much lower cost (dollar interest rates fellsharply and competing US domestic demand for margin-related creditplummeted) and as the worldwide flow of capital towards the USA weak-ened and might even go into reverse. (Foreign capital had piled into NewYork during 1928 and the first three quarters of 1929 to take advantage ofthe high call rates stemming from broker demand for funds to finance theirclients’ speculation in the equity market.)
Before the Wall Street Crash, there was the danger that a lifting of thegold embargo would unleash huge outflows of capital from Japan to theUSA to take advantage of the high interest rates there (and so lead to anunsustainable loss of gold or a sharp rise in Japanese interest rates, undesir-able given the weak domestic economy). What policy-makers and marketopinion failed to see in October 1929 was that a severe US recession layahead which would hit the whole world economy, including Japan,making the financial orthodoxy of the new government unsustainable.Anyhow, on 21 November 1929, the government announced the repeal,effective 11 January 1930, of the ordinance prohibiting the export of gold.
Already the cold winds of world depression were blowing. Raw-silkexports to the USA slumped and the outflow of funds from Japan intoforeign securities increased. The Chinese currency was falling sharply inline with the price of silver. The Japanese authorities made use of theirshort-term credit facilities in New York, but in July 1931 foreign borrowingbecame more difficult due to the collapse of the Danat Bank in Germany.Finance Minister Inouye responded by pushing up borrowing costs, but thedrain continued. The Manchurian Incident (18 September 1931), in whichthe Japanese Army launched an offensive towards extending control overthat area of north-east China, and Britain’s departure from the gold stan-dard (23 September), aggravated the loss of confidence in the yen. Finallythere was dissension within the Cabinet (some call it self-interest – HomeMinister Adachi Kenzo, who, advocating a coalition with the oppositionSeiyukai Party, was later suspected, but never proved, of being an accom-plice to a speculator’s ‘plot’) and on 11 December 1931, the Minseitõgovernment fell. Two days later a new Seiyukai government, with Korekiyo
26 The Yo–Yo Yen
Takahashi as Finance Minister, reimposed the embargo on gold exports.Japan had at last abandoned the gold standard system. Two months laterex-Finance Minister Inouye was assassinated in a growing tide of right-wingnationalist violence.
There followed five years of rapid economic growth (until the full-scaleinvasion of China) during which reflationary monetary and fiscal policieswere followed, and the yen fell to a highly competitive level. Already by end-1931 the yen was down to US$34.5/100 yen, the rate advocated ten yearsearlier by economic experts at the League of Nations. By late the followingyear the yen had collapsed to almost US$20/100 yen despite exchangerestrictions introduced that summer (1932) to counter capital flight. Anintensification of political violence in Japan and a wave of protectionismagainst Japanese exports played a part in the rout. As exports (particularly oftextiles) boomed, boycotts, discriminatory tariffs and import quotas wereimposed on Japanese goods and there were numerous trade disputes. Thedevaluation of the dollar in 1933–4 under the Roosevelt Administrationbrought some subsequent recovery of the yen. But the Japanese currency wasalready well outside the shrinking group of freely tradable currencies.
Postscript: re-fixing the yen, 1949
It is not a purpose here to chart the course of the yen through thecalamity of war and its aftermath. In broad terms, inflation during thewar, from the invasion of China (1937) until the Surrender in summer1945, was suppressed by comprehensive controls. Under the early periodof the US occupation, hyperinflation caught up with Japan as the massiveincreases in money balances, that had occurred during previous years andhad continued into the defeat, came into balance with a severelyshrunken productive capacity of the economy. Measures of the occupationauthorities to block large bank deposits and cancel large-denominationnotes did not quell the fires of inflation. As US policy towards Japanshifted from March 1947 (under the so-called Truman doctrine reconstruc-tion took over as the priority from demilitarisation and reparations), thefocus gradually shifted to monetary and budgetary reform, and exchangerate stabilisation.
In December 1948, General MacArthur, in a ‘letter to the Japanese PrimeMinister Concerning the Economic Stabilization Program’, spelt out nineprinciples, including fiscal balance, effective tax collection, limited creditextension to projects contributing to economic recovery, and paving theway for the early establishment of a single general exchange rate. Joseph M.Dodge, a Detroit banker who had previously been associated with the post-war currency reform in Germany, came to Japan in February 1949 as afinancial adviser to General MacArthur concerning Japan’s economic stabil-isation. The measures he initiated became known as the ‘Dodge Line’.
Historic Roots of the Yo–Yo Yen (1859–1949) 27

They implied, firstly, a balanced budget applied to all categories –general accounts, special accounts, and agencies connected with the gov-ernment (for example, government corporations). Secondly, governmentsubsidies and price controls were to be gradually phased out. And thirdly,international trade was to return to private channels rather than beingconducted through government agencies. Concerning the exchange rate, amemorandum of 23 April 1949, from the US Occupation Authoritydirected the Japanese government ‘to take the steps necessary to put intoeffect at 0001 hours, 25 April 1949, an official foreign exchange rate of360 Japanese yen to one US dollar. Rates for other currencies will be basedon this rate translated into the US dollar values of such currencies asregistered with the International Monetary Fund.’
A whole folklore has built up around the choice of stabilisation level forthe yen, which brought to an end a system of multiple exchange rates (dif-ferent products at different rates), and ushered in a fixed rate between theUS dollar and yen which was to last for over twenty-two years (until August1971). According to one popular account, the occupying authorities chosea rate of ¥/$360 because they lacked any better guide than the number ofdegrees in a circle. In fact during the weeks before the decision, there hadbeen widespread expectations of the rate being stabilised at a rate ofbetween ¥/$330 and ¥/$350.
Almost a year before, in May 1948, Ralph Young, a Federal Reserve Boardeconomist, had suggested an exchange rate of ¥/$300 which he thoughtwould undervalue the yen to encourage exports. An October 1948 Ministryof Finance report recommended that exports be priced at ¥/$350. Thewholesale price index, which was used in that report for international com-parison purposes, did not include black-market prices. Taking account ofthese, some unofficial calculations put the purchasing power parity value ofthe exchange rate at over ¥/$400.
On balance, the final rate chosen of ¥/$360 was probably well within anormal confidence range for where the purchasing power parity of theexchange rate then lay – but with the yen somewhat expensive rather thancheap. Most hyperinflations, however, end with exchange rate stabilisationat what seems an expensive level – and Japan was no exception to that rule.(A somewhat overvalued exchange rate helps to arrest inflationary expecta-tions, and as demand for money rises strongly in the post-hyperinflationeconomy, the price level may actually fall back as part of a deflationprocess, meaning that the initial overvaluation is corrected.)
The fact that the purchasing power parity value of the yen in spring 1949lay near ¥/$360 compared to ¥/$2.70 (US$37/100 yen) as estimated by theLeague of Nations economists in the early 1920s is a key measure of theextent of hyperinflation in Japan during the war and its aftermath. And itwas by no means certain that the new exchange rate would be sustainable.The devaluation of the British pound in September 1949, which countries
28 The Yo–Yo Yen

in the sterling area followed, raised new concerns about Japan’s ability tocompete in world markets. But those concerns faded away as exportsboomed in the Korean War. And as Japan entered an era of rapid growththat transformed the economy, the question of whether the yen had beenovervalued in 1949 simply became irrelevant.
In any event, from the late 1950s onwards (right through until the late1980s) the yen was on a strong long-run upwards trend against the USdollar measured relative to its purchasing power parity level. As Japanbecame more and more expensive (the price of a representative basket ofgoods and services in Japan climbing relative to that of the same basket inthe USA calculated at the given exchange rate) analysts soon saw this assymptomatic of the growing duality in the Japanese economy (rapid pro-ductivity growth in the export sectors compared to much slower productiv-ity growth elsewhere) rather than as a threat to trade performance, whichsurpassed even optimistic expectations.
Historic Roots of the Yo–Yo Yen (1859–1949) 29

30
2A Brief History of the Modern Yen(1960–87)
It was well into the miracle period of 1953–73, during which Japanesegrowth averaged near 10 per cent p.a., that the modern history of the yenbegins. Only in 1963 did Japan become an ‘Article 8’ member of theInternational Monetary Fund (meaning Japanese residents could convertyen into foreign currencies for all trade transactions and non-residentscould exchange yen deposits freely for whatever purpose) and in the fol-lowing year a member of the OECD (Organization for EconomicCooperation and Development). Those landmark steps were the culmina-tion of a process originating in 1960 when, in response to internationalcriticism for moving slowly, an outline plan for trade and foreign exchangeliberalisation was introduced (90 per cent of imports to be free of quota orother restrictions).
1960 was indeed a seminal year. In mid-June, the US–Japan Treaty hadbeen signed despite a wave of protests in Tokyo including the entry ofpolice into the Diet to disperse rioters. Kishi Nobusuke, the last PrimeMinister to have served in a pre-war cabinet, resigned. A strike over hugeredundancies in the coal industry faced with the competition of cheap oilended in complete defeat for the union, ushering in a long period of labourtranquillity. The new Prime Minister, Ikeda Hayata, who survived in thatpost for a long time by Japanese standards, adopted the famed ‘incomedoubling plan’ (income doubling in ten years) whose ambitious targetswere in fact exceeded, notwithstanding French President de Gaulle’s dis-paraging remarks about ‘the transistor radio salesman’. Also in 1960, theyen started its long climb, at first only in real (inflation-adjusted) terms,much later (1971) in nominal terms against the US dollar.
The climb was far from smooth. The yo–yo yen already made its appear-ance in the late 1970s. With hindsight the climb ended in the late 1980s(by the time of the Louvre Accord in spring 1987). For the remainder of thetwentieth century there were violent swings around a flat trend. In total,the first forty years of the modern yen (1960–2001) can be divided into thethirteen phases described below:

A Brief History of the Modern Yen (1960–87) 31
1. First, there was the sharp real appreciation from 1960 to 1965, whenthe yen remained at a fixed exchange rate to the dollar (360 yen) whilethe consumer price level in Japan rose by 30 per cent relative to theUSA (hence one yen of constant internal purchasing power bought30 per cent more dollars of constant internal purchasing power in 1965than in 1960).
2. From 1966 to 1970 the yen was virtually unchanged against the dollarboth in nominal and real terms (the yen/dollar exchange rate remainedfixed at 360 whilst inflation in Japan and the USA ran at similar levels).
3. The yen revaluation of summer and autumn 1971, which formed themost important component of the dollar devaluation orchestrated byofficials in Washington.
4. A long period of the yen/dollar rate on a flat trend against the dollarthrough to late 1976 at around 300 (an initial period of pegging duringthe brief life of the Smithsonian Accord from December 1971 toFebruary 1973, followed by a sharp rise of the yen as the dollartumbled in spring 1973 but then a rapid reversal by early 1974).
5. The sharp appreciation of the yen from late 1976 until autumn 1978(most of all against the US dollar but also against the DM).
6. The yen fell steeply from its peak of autumn 1978 until late 1979, asthe second oil shock erupted, US interest rates rose sharply, and Japan’strade balance swung into substantial deficit.
7. From 1980 until mid-1985 there was a long period of near stabilityfor the yen in overall real effective exchange rate terms at a levelsome 10 per cent higher than during the period from spring 1973 to1976 (the fourth period above) but well below the level of 1978(Figure 2.1).
8. A near 100 per cent appreciation of the yen against the dollar from thePlaza Accord (September 1985) through to the Louvre Accord (February1987) and ending in the immediate aftermath of the Wall Street Crash(autumn 1987). Broadly speaking, the main theme was the bursting ofthe euphoria regarding Reaganomics and a growing optimism aboutthe Japanese economy.
9. A sharp fall of the yen (by over 20 per cent in real effective terms) fromlate 1988 until early 1990, which accompanied the final stage of thebubble economy in Japan and then the Tokyo equity market crash. Theweakness of the yen was evident not just against the dollar but most ofall against the DM (which rose during German unification).
10. A 60 per cent overall (real effective) appreciation of the yen from early1990 until spring 1995. This coincided with a period of dollar weak-ness, but the yen was much stronger than the DM, and surged aheadon its own during spring and summer 1993 and again, briefly, in earlyspring 1995.

32 The Yo–Yo Yen
* Calculation based on consumer prices.
Figure 2.1 Real effective exchange rate index of the yen, 1971–2001*
11. The yen plunged in just three years (spring 1995 to summer 1998) bynearly 50 per cent against the US dollar (from a peak of 80 yen/$ to a lowof 145 – a level last seen during the Tokyo equity market crash of early1990). Generally, the US dollar was strong during this period, but less soagainst the European currencies than against the yen. This plunge, inreal effective terms, brought the yen back to around the high level firstreached in the early aftermath (one year on) of the Plaza Accord.
12. From autumn 1998 to the end of 1999 a new violent surge occurred,including a near 20 per cent jump in one day, bringing the yen/$ rateback to 100 and the currency in real effective terms to its lofty level ofend-1994 (albeit well short of the final summit reached in spring 1995).
13. After some brief stability in early 2000, the yen slid – from around 100against the dollar in winter 1999/2000 to around 135 two years later.
In total there were six episodes of a surging yen or yen jump, three of sta-bility (either against the dollar or in overall effective terms), and four of aplunging yen. From 1960 until 1987–8, the yen was on a clear upwardtrend (as measured in real effective exchange rate terms). After that therewas a long period of remarkable volatility with no clear direction. The yenat the end of 2000 was not significantly higher than in 1987–8 and the tur-bulence had been so great as to make any judgement of a trend difficult.

A Brief History of the Modern Yen (1960–87) 33
Symptomatically, in the 1990s the yen became the most volatile of thethree big currencies (US dollar, DM, and yen), with the standard deviationof monthly change in the yen–dollar and yen–DM exchange rate about30 per cent larger than for the dollar–DM exchange rate (by contrast, in the1980s, the US dollar had been the most volatile currency).
In this chapter the first eight episodes are reviewed. We will give the finalfive episodes close attention in Chapters 4 and 5 after considering, inChapter Three, some general principles to be derived from the story up tothe end of 1987.
The first two episodes, 1960–71
At the start of this period, Japan was in the middle of the so-called Iwatoboom (1959–61), the second phenomenal burst of investment-led expan-sion (the first was the Jimmu boom of 1956-7) which marked the far-from-even progress of the economy through its miracle two decades. TheJapanese economy had made huge advances since 1953, when output hadfirst regained its pre-war peak level (though in income per capita terms,Japan in 1953 compared unfavourably with Brazil), but still ranked wellbelow Germany and the UK in overall size (the Federal Republic had over-taken the UK in 1959). By the time President Nixon finally scuppered theBretton Woods System in August 1971, Japan had become the secondlargest economy in the world (overtaking Germany in 1966), even thoughreal GDP per person employed there was at the lower limit of the rangeobserved in developed Western countries. In terms of GDP per hourworked, Japan was even less well placed, given the unusually long hours ofwork in what had become Asia’s ‘new giant’.
The years 1960 and 1965 are dividing lines not just in the currencyhistory of the yen, but also in the economic history of Japan. Some of thewatershed political economic events have already been described. In addi-tion, 1960 was when Japan entered a long period of fairly high inflation(CPI up 1.5 per cent p.a. in 1955–60, 6.2 per cent p.a. in 1960–65 and5.5 per cent in 1965–70). The outbreak of inflation in Japan pre-dated thatin the USA by more than five years, meaning that nominal exchange ratestability between the yen and dollar at the 360 parity (set under the DodgePlan in 1949) required a sharp real appreciation of the yen (in the yearsfrom 1960 to 1965). In the second half of the 1960s, inflation was at asimilar pace in Japan and the USA, so real appreciation of the yen halted.
At the level of the real economy, 1965 was a break year in that it markedthe most severe recession to date during the miracle years (Figure 2.2)(recession is used here to describe periods of sharply slower growth, includ-ing only rarely a quarter of negative growth; there were seven such reces-sions during the period 1953–73, all accompanied by a dip in at least one

34 The Yo–Yo Yen
–
Figure 2.2 Japan vs. Germany economic growth in the 1960s
key component of investment spending). The previous recession ofDecember 1961 to October 1962 had been mild. By contrast, in the reces-sion of October 1964 to October 1965 (which became evident soon afterthe Olympic Games in Tokyo) there was unusual pessimism, aggravated bythree big corporate bankruptcies (Yamaichi Securities, Sanyo Special Steeland Sun Wave Cabinet Making). The preceding boom had been unusuallyshort and during the first half of the 1960s the growth of business invest-ment spending slowed (compared to the second half of the 1950s). Therewas talk that the miracle years had ended.
In this climate, one of the pillars of the ‘economic constitution’ put inplace by the Dodge Plan began to weaken. The balanced budget rule(according to which the central government should not borrow from theBank of Japan or issue marketable bonds) was revoked in favour of two newweaker conditions – that government bond issues should never exceed theamount spent on construction and that bond issues should never be solddirectly to the Bank of Japan but issued in the open market, as the govern-ment of the day turned to Keynesian demand management to tackle therecession. In practice, the stance of fiscal policy hardly changed whenaccount was taken of government spending financed via the parallelbudget (outside the central government accounts). But the change in theconstitutional position was to have important consequences for fiscalpolicy from the early 1970s onwards.

A Brief History of the Modern Yen (1960–87) 35
In fact the immediate pessimism of 1965 proved to be misplaced. Byearly 1966 the economy had emerged into a powerful new expansionwhich was to last through until summer 1970. Growth was even higherthan during the years 1955–64 and capital spending was racing ahead.Productivity growth accelerated, and inflation (CPI measure) actually fell to4.2 per cent p.a. in 1967 from its peak of 6.4 per cent p.a. in 1965 (subse-quently to accelerate to 6.7 per cent in 1969 and 7.2 per cent in 1970). Thiswas a period of rapid development in the consumer durables industries (the‘three Cs’ – cars, colour televisions, and air conditioners) where Japanachieved considerable competitive advantage. And domestic costs were nolonger running ahead much faster in Japan than in the USA, as had beenthe case in the first half of the 1960s, thereby exerting some restraint onprofits growth in the export industries and so ultimately on exports.Correspondingly, by the late 1960s Japan was moving into large currentaccount surplus, in sharp contrast to the situation of near current accountbalance through most of the previous two decades, broken by periodicdeficits near the peak of each cycle (the appearance of a deficit triggeredmonetary policy tightening in each case).
A big current account surplus in the midst of an investment spendingboom with no evident domestic savings surplus was not an equilibrium situation. (A current account surplus is sustainable in the long run only if the economy has an inherent tendency to generate more savings in total – public and private – than can be absorbed by domestic invest-ment opportunity.) Exiting the disequilibrium situation depended on aresumed (including a catch-up) real appreciation of the yen or stimulatingdomestic savings (and removing controls in the way of their flowing out as capital exports). A real appreciation could be achieved either via anacceleration of domestic inflation or an upward revaluation of theyen–dollar parity, or some combination of the two. In practice the routefollowed started with revaluation and later included a powerful dose ofinflation.
An intriguing question of counterfactual history is to consider an alterna-tive route out of disequilibrium. Suppose in the late 1960s Japanese eco-nomic policy-makers had realised that since US inflation had accelerated tothe same level as in Japan (meaning no further real appreciation of the yenso long as its exchange rate against the dollar remained fixed (Figure 2.3)) alarge external surplus was likely to emerge, which might provoke calls fromWashington for yen revaluation (or dollar devaluation). They could havedeliberately stoked up domestic inflation. Or they could have tightenedfiscal policy sharply, driving the budget into large surplus (or, equivalently,cut the deficit in the parallel budget through which public investment wasfinanced directly from savings placed in government financial institutions).Then an underlying domestic savings surplus (private and public sectorcombined) would have matched the current account surplus and have
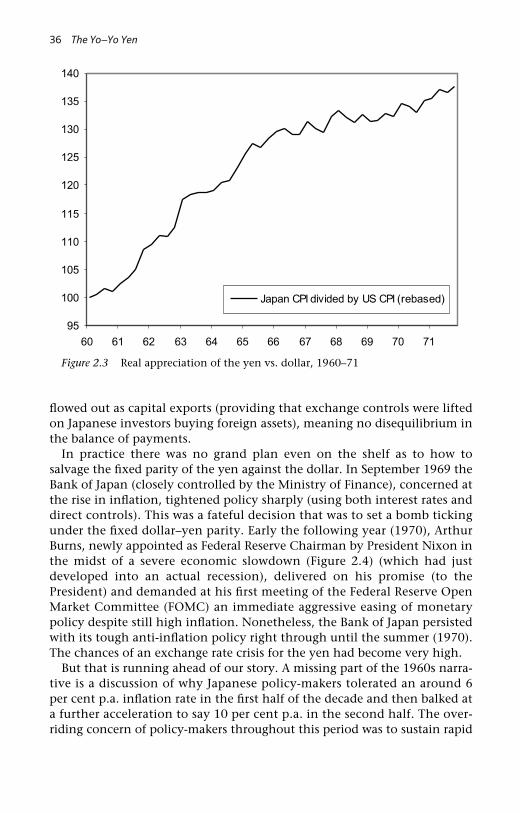
36 The Yo–Yo Yen
Figure 2.3 Real appreciation of the yen vs. dollar, 1960–71
flowed out as capital exports (providing that exchange controls were liftedon Japanese investors buying foreign assets), meaning no disequilibrium inthe balance of payments.
In practice there was no grand plan even on the shelf as to how tosalvage the fixed parity of the yen against the dollar. In September 1969 theBank of Japan (closely controlled by the Ministry of Finance), concerned atthe rise in inflation, tightened policy sharply (using both interest rates anddirect controls). This was a fateful decision that was to set a bomb tickingunder the fixed dollar–yen parity. Early the following year (1970), ArthurBurns, newly appointed as Federal Reserve Chairman by President Nixon inthe midst of a severe economic slowdown (Figure 2.4) (which had justdeveloped into an actual recession), delivered on his promise (to thePresident) and demanded at his first meeting of the Federal Reserve OpenMarket Committee (FOMC) an immediate aggressive easing of monetarypolicy despite still high inflation. Nonetheless, the Bank of Japan persistedwith its tough anti-inflation policy right through until the summer (1970).The chances of an exchange rate crisis for the yen had become very high.
But that is running ahead of our story. A missing part of the 1960s narra-tive is a discussion of why Japanese policy-makers tolerated an around 6per cent p.a. inflation rate in the first half of the decade and then balked ata further acceleration to say 10 per cent p.a. in the second half. The over-riding concern of policy-makers throughout this period was to sustain rapid

A Brief History of the Modern Yen (1960–87) 37
Figure 2.4 Japan vs. US economic growth, 1965–76
Japan GDP (real, YoY)
US GDP (real, YoY)
65 66 67 68 69 70 71 72 73 74 75 76
15
10
5
0
–5
growth of exports, which was seen as essential to a continuing economicmiracle. Stability (rather than increases) in export prices was consistentwith that objective. Given the especially rapid rate of productivity increase(including product improvement) in the export sector, stable export pricesmeant inflation elsewhere in the economy. As wage increases accelerated inthe early 1960s (led by strong demand for labour by the big export compa-nies together with shrinking supply from the agricultural sector), theauthorities took no action to resist the trend so long as the export indus-tries could absorb the costs without problem, even though it meant sub-stantial inflation overall.
The policy of no resistance to inflation so long as export prices remainedstable did not have any natural evolutionary trait whereby it woulddevelop into a policy of promoting still higher inflation when US inflationpicked up, thereby underpinning the fixed exchange rate between thedollar and yen. In any case, even the 5–6 per cent p.a. inflation rate of theearly 1960s had not been popular, but it was somehow accepted as anuncomfortable side-effect of rapid growth. The Bank of Japan had had con-siderable experience during the 1950s and early 1960s of tightening policyin the boom phase of the economic cycle so as to prevent the currentaccount of the balance of payments going deeply into the red and under-mining the yen–dollar parity. But the Bank had no knowledge or experi-ence of how to deliberately let a current account surplus in a boom phase

38 The Yo–Yo Yen
of the cycle stimulate monetary growth and inflation and thereby pre-emptirresistible international pressures for a revaluation of the yen.
Dollar devaluation, and then a return to yen–dollar stability, 1971–6
The third and fourth episodes span five years in total, from the so-called USclosing of the gold window in August 1971 until summer 1976. Inoverview, the yen was at an embryonic stage of international development.In some respects it was still an open question whether the yen wouldremain effectively linked to the US dollar even though the old interna-tional monetary order of Bretton Woods had broken down irreparably. Incontrast to the yen, the DM had made a clear break from its dollar-linkedpast and there was no inclination amongst German policy-makers, mostimportantly at the Bundesbank, to turn back.
Indeed, Germany (and the Netherlands) had already abandoned thedollar standard in spring 1971, well before the Nixon Administration’s finalcoup (August 1971) against the Bretton Woods international monetarysystem. In the face of huge money inflows from the USA, where the FederalReserve under Chairman Arthur Burns was pursuing an aggressively easypolicy (aimed at jump-starting the economy out of its hesitant recoveryfrom the recession of 1970 and, thereby, aiding President Nixon’s chancesof re-election in 1972), Bonn had allowed the Deutsche mark to float ratherthan run the risk of importing inflation. Switzerland had simultaneouslyrevalued its currency (the first change in the franc’s official dollar exchangerate since 1936).
Thus the twin pillars of the Bretton Woods System – first, a dollar stan-dard under which all currencies were pegged to the US currency, andsecond, convertibility of dollars into gold at the official price of $35 perounce (the US Treasury in effect standing ready to supply gold at that price)– were already tottering before the Nixon Administration delivered its fatalblows. Back in 1968, in the midst of a worldwide scramble out of dollarsinto gold, the convertibility of dollars into gold at the official price hadbeen suspended except for transactions between central banks; in effect, afree market in gold at a fluctuating price existed for all private transactions.
Indeed it was the remnants of the gold–dollar link that triggered Nixonto call a summit meeting of his economic advisers at Camp David duringthe weekend of 14–15 August. On 12 August, the British government hadasked the USA to ‘cover’ or guarantee (in terms of gold) US$750m of itsdollar reserves. The message from London was garbled and the US Treasurybelieved that the British wanted Washington to cover a much largeramount. US acquiescence was likely to set off a scramble by other countriesto get the US government to either guarantee their dollar holdings or toconvert them into dollars.
A Brief History of the Modern Yen (1960–87) 39
As is often the case, the trigger to the summit was not the main topic onthe summit agenda. The priority, albeit not spelt out, was how to assurethat the US economy would be in a boom by Presidential election time.The sharp easing of monetary policy effected by Chairman Burns immedi-ately following his appointment in early 1970 had so far failed to propelthe economy into a strong economic expansion. Yet inflation remainedobstinately high, at more than 5 per cent p.a. In retrospect, monetarycritics could argue that it would have been better if the FOMC had per-severed with tight money well into 1970, albeit at the risk of seriousrecession, so as to kill off inflation.
But the FOMC could hardly reverse course now and Chairman Burnsnever gave any indication of regretting earlier monetary decisions. Instead,his inclination was to blame stagflation on monopoly power on the part ofboth corporations and labour unions. Already in summer 1970 he hadstarted to advocate an incomes policy, for which there was much supportin Congress, especially amongst the Democrats. At Camp David, a hithertoreluctant Administration accepted a prices and incomes policy – initially a100-day freeze – as a key component of the programme for electoral (andeconomic) success.
The second major plank of the economic package for re-election of thePresident was an aggressive trade policy. The charge made was that the restof the world had stolen competitive advantage from the USA by maintain-ing undervalued currencies. Now it was time for the USA to repair thedamage and seek an immediate revaluation of the major foreign currencies.The instrument of policy was to be an emergency 10 per cent tariff onimports to the USA, to be repealed only once an agreement had beenreached on new exchange rate levels for the dollar. The policy of devalua-tion was sure to be supported in Congress. Just the week before, aCongressional Sub-Committee had warned that Europe, but more particu-larly Japan, were gaining at the expense of the USA, as a result of their cur-rencies being undervalued against the US dollar.
Perhaps the most amazing aspect of the Camp David discussions washow 100 per cent unanimity prevailed amongst the participants regardingthe adoption of this neo-mercantilist exchange rate policy (see Wells,1994). Even Paul Volcker, who had spent much of his working life fightingin one international meeting after another to defend the status quo of theUS dollar, voted for the emergency import tariff. Yet the economic argu-ment in favour of overall dollar devaluation at this time was weak.
The top European currency (the DM) was already at a free market leveland had been substantially revalued over recent years. And what was sowrong with a US trade deficit? So long as the rest of the world had excessdemand for US assets, then the USA was bound to run a deficit on itscurrent account. That was a matter of simple economic arithmetic. WithUS inflation a problem, surely a devaluation of the dollar would only make

40 The Yo–Yo Yen
matters worse? True the new big surplus country, Japan, had yet to removebarriers in the way of its citizens accumulating foreign (most probably US)assets. But under some gentle prodding from Washington, Tokyo wouldsurely oblige and scrap its exchange controls.
The case against deliberate devaluation of the dollar, spearheaded by anemergency import tariff, was lost by default at Camp David and also in thepublic discussion that followed. Powerful trade lobbies had gained sway forthe moment over US currency policy – a take-over that was to be repeatedat various points of economic weakness over the next three decades. Thespecial interests of the automobile producers (Detroit), steel makers andothers at the front line fighting the onslaught of Japanese competitioncounted for much more (in Washington) than fears amongst a few non-mainstream economists about the inflationary consequences of dollardepreciation.
Was there anything that Tokyo could have done immediately followingthe bombshell of 16 August 1971 to make the US Administration reversecourse? Probably not. In any event, the path that the Japanese authoritiestrod in the immediate aftermath of the announcements from Washingtonwas doomed to failure. For ten days, the Bank of Japan bought massivequantities of US dollars against yen.
Large-scale intervention in the currency markets had fended off revalua-tion pressure on the yen in May 1971, in the wake of the DM’s revaluation.But now, the imposition of the import tariff made the pressure irresistible.Japan was hardly in a position to say no to the whole world.
The only counter-strategy which Tokyo could have adopted with anychance of even small success would have been to persuade Washington torescind the import tariff in exchange for an immediate unilateral sweepingaside of all import tariffs and quotas, abolition of all controls on capitalexports, and a new dose of monetary expansion. The Bank of Japan hadonly started to ease monetary policy in August 1970, and very gradually(even though the decline in business activity which had peaked in July1970 continued through 1971) – in sharp contrast to the aggressive easingof US monetary policy under way since January 1970. If Tokyo were seriousabout maintaining the yen on the dollar standard, then Japanese monetarypolicy had a lot of catching up to do.
In reality there is no evidence of Japanese policy-makers considering alast-ditch macro-economic and commercial deal with the USA to avoid ayen revaluation. Instead, on 27 August, the yen was floated, with itsmaximum appreciation set at 8 per cent from previous parity.
Did the closing of the gold window (announced together with the rest ofthe new economic policy on 16 August) have any bearing on thatoutcome? There is no evidence of any direct link. Contemporary Japanesepolicy-makers had never demonstrated any special affection for gold andthe fact that dollar reserves in future were purely paper (rather than having

A Brief History of the Modern Yen (1960–87) 41
a metallic link) was not a serious deterrent to Japan staying on the dollarstandard.
Indeed, the closing of the gold window was a small help to Japan in itsbattle to resist yen revaluation. France, long a protagonist of gold ratherthan the dollar being at the centre of the international monetary system,became a ‘co-belligerent’ against Washington’s currency policy. If PresidentNixon had heeded the lone voice of Arthur Burns at Camp David insupport of maintaining the dollar’s gold link (the voice was not all thatstrong! – the chairman argued the window could be closed later if the neweconomic policy did not bring a return of confidence in the dollar asexpected), then France might well have agreed to an immediate revaluationof its franc. Instead France fought a four-month battle with an armoury ofexchange restrictions (instituting in effect a dual exchange market, wherefinancial transactions occurred at a free rate whilst current transactions stilltook place at near the unchanged official parity against the dollar) to blocka revaluation of the franc until Washington changed its policy on gold.
The value, however, of France as a co-belligerent to Japan should not beexaggerated. Paris backed down in mid-December 1971 and agreed to arevaluation of the French franc when Washington conceded a virtuallymeaningless rise in the official price of gold (but no reopening of the goldwindow). In the few days between Paris’s withdrawal from combat and theSmithsonian Agreement the yen rose by around 4 per cent against the USdollar. That must be the maximum of any estimate of French usefulness toTokyo in resisting a large revaluation of the yen. Throughout the period fromthe closing of the gold window in mid-August to the SmithsonianAgreement, Tokyo’s best chance of limiting revaluation lay in its own hands.
In fact a sharp easing of Japanese monetary policy was ultimately tofollow the appreciation of the yen. The counterfactual historian mightspeculate whether even half of that policy adjustments (ideally combinedwith trade liberalisation) offered up front, in summer and autumn 1971,might have substantially diminished the extent of revaluation whichTokyo finally had to concede as part of the Smithsonian Agreement. Inreality, the 8 per cent limit to yen appreciation announced by Tokyo on27 August had a short life (Figure 2.5). At the Smithsonian Agreement(18 December 1971) a new parity was fixed for the yen against the dollar of308 with 2.25 per cent bands of fluctuation permitted on either side.
A huge miscalculation by Japanese economic policy-makers was tofollow. Their premise was that the revaluation of the yen would have apowerful deflationary influence on the economy, which had to be offset byequally powerful monetary and fiscal stimulus. To some degree, the mone-tary stimulus occurred passively, as waves of speculative funds came intoJapan on expectations of a further revaluation of the yen. These expecta-tions were due in part to the rise in Japan’s current account surplus, albeitthat this was more than entirely attributable to the so-called J-curve effect

42 The Yo–Yo Yen
Figure 2.5 Yen exchange rate vs. US$ and DM, 1971–9
(revaluation brings an immediate fall in import prices), with the tradesurplus in volume terms already narrowing. Throughout 1972 the Japanesemonetary authorities pursued an aggressively easy monetary policy despiteaccumulating evidence (from spring 1972) of economic recovery havingtaken root.
With regard to fiscal policy, the yen revaluation and the perceived needto provide an offsetting stimulus was an important catalyst to implementa-tion of the Tanaka government’s ambitious spending programme entitled‘Plan for Re-Building the Archipelago’. The normally cautious Ministry ofFinance was won over – marking the first time that currency policy set byWashington played into the hand of big spenders in Japan’s ruling party(Figure 2.6). The Plan, which assumed 10 per cent p.a. economic growththrough until 1985, envisaged eliminating regional inequities by relocatingin the interior and on the Japan Sea coast industries which had been con-centrated on the Pacific Coast belt, and linking together the entire countryby constructing a 9000 km Bullet Train, 10,000 km of superhighway, and7,500 km of oil pipeline. Modern cities with populations of around aquarter of a million were to be built across the nation.
Tanaka Kakuei had become Prime Minister in July 1972, following a lead-ership election in the ruling Liberal Democratic Party (LDP). Tanaka, apopulist, had been chosen as the candidate most likely to bring victory forthe LDP in looming general elections (for the Lower House of the Diet).

A Brief History of the Modern Yen (1960–87) 43
–
–
–
–
Figure 2.6 Japan budget deficit (% of GDP), 1960–2000
Many in the LDP were concerned at growing disaffection amongst theurban electorate and voted for Tanaka as their potential saviour. A verystimulative budget for fiscal year 1972 (April 1972 to March 1973) hadalready been passed when the economy was still perceived to be in reces-sion. In May, August, and October (1972) there were further packages offiscal reflation. The budget for fiscal year 1973 (published in late 1972) wasagain highly stimulatory and played its part in the re-election of theTanaka government that December (1972).
The election campaigns of Richard Nixon in the USA and of TanakaKakuei in Japan were, in effect, macro-economic extravaganzas for whichthe bills started to appear as soon as January 1973. Arthur Burns had beenin charge of Nixon’s extravaganza even though he never recognised hisparticular role either at the time or subsequently. Burns had allowed a rapidrate of monetary growth to occur in the second half of 1972 – against con-siderable misgivings of several FOMC members and Federal Reserve econo-mists – arguing that unemployment was still too high at 5 per cent andthat big interest rate hikes would jeopardise the prices and wages policy. Atthe start of 1973, however, the prices and wages policy virtually lapsed(moving into a voluntary phase three), and concerns about rising USinflation brought about a new dollar crisis.
According to a commentary from the New York Federal Reserve (pub-lished March 1973), the ‘atmosphere’ for the dollar had already begun to

44 The Yo–Yo Yen
deteriorate in mid-January 1973 as US inflation risks increased and USequity prices fell sharply. On 22 January, the Swiss franc was floated inresponse to a huge inflow of funds, largely from Italy where the lira wasunder attack. In the following few weeks outflows from the dollar gainedmomentum, fuelled in part by adverse trade news (US current accountdeficit in 1972, Japanese and German current account surpluses – all verymodest by later standards, measured relative to economic size, but enoughat the time to cause concern in the marketplace that Washington mightpress for a further devaluation of the dollar).
On Tuesday, 13 February, following an emergency meeting of interna-tional financial officials from Japan, the EU, and the USA, the Japanese yenwas floated whilst the dollar was devalued by 10 per cent against the EUcurrencies. A month later (12 March) the EU currencies jointly floatedagainst the US dollar. The yen reached a brief peak of 248 against the dollar(compared to Smithsonian parity of 308). This was the turning point forthe Japanese currency, though not yet for the DM. In the following fewweeks the yen fell back to around 260, at which level the Japanese author-ities effectively supported the currency until late in the year, interveningheavily at times (selling dollars and buying yen). Then during winter1973/4, in the midst of the Great Oil Shock, the yen fell back to itsSmithsonian level of around 300, where it remained until late 1976.
What brought about the turn of the yen? The most fundamental causewas the rampant monetary expansion in Japan culminating in an outbreakof severe inflation. The Tanaka bubble economy was in full swing (Figure2.7). The nationwide land price index for urban property increased by morethan 50 per cent from 1972 to 1974 (surveyed in March of each year at1614, 1821, 2286 and 2812 in 1971–4 respectively). Even before theincrease in oil prices in October, inflation had become virulent. Wage rateswere rising at an annual rate of 16.5 per cent, consumer prices at 18 percent, and wholesale prices at 26 per cent. From January (1973) the Bank ofJapan had started pushing up money interest rates, and from the spring,the government had made a succession of cutbacks in its ambitious spend-ing plans.
The run-up of inflation in 1973 was, of course, a worldwide phenome-non, but amongst the G-3 countries it was most acute in Japan. Also inearly 1973 Federal Reserve Chairman Burns became alarmed at risinginflation and at last acknowledged that monetary policy must play a criticalrole in restoring stability. He had considered the further devaluation of thedollar in February and March as ‘unavoidable’ but he did not like it.‘I cannot emphasise too much or too often that as far as I am concernedthis is the last devaluation.’ Wholesale prices in the USA increased by 21 percent p.a. in the first quarter (of 1973) whilst consumer prices were up by8 per cent p.a.. The Federal funds rate was pushed up progressively from5 per cent in the fourth quarter of 1972 to 10.5 per cent in the third quarter

A Brief History of the Modern Yen (1960–87) 45
Figure 2.7 Japan vs. US business cycles, 1965–76
Japan GDP (real, QoQ annualised)
US GDP (real, QoQ annualised)
7675747372717069686766 65–15
–10
–5
0
5
10
15
20
25
of 1973. But Arthur Burns leant against the wind of rising rates. He was con-cerned about their influence on wage negotiations and he cajoled New Yorkbankers into not raising prime rate fully in line with market rates.
By contrast, in Germany the Bundesbank was now following a toughmonetarist policy against inflation, similar to that adopted by the FederalReserve five-and-a-half years later under Paul Volcker. Average three-monthmoney market rates in Frankfurt rose from 8.75 per cent p.a. in March 1973to 14.25 per cent in July. Day-to-day rates reached as high as 30 per cent inearly summer. The Bundesbank was targeting the monetary base andaccepting the cost of violent fluctuations in short-term rates, unlike theFederal Reserve, which was still targeting interest rates. Three-month euro-dollar rates rose by less than one percentage point between March and June1973. Consistent with the Bundesbank’s tough policy, the DM rose sharplyagainst the dollar, from DM/$2.75 in early May (the same level as in mid-March) to a peak of 2.25 in early July. That was a turning point for thedollar against the DM, as the Federal Reserve allowed US money marketrates to rise by 200 basis points (bp) by end-August and the USA intervened(in support of the dollar against the DM) in the foreign exchange markets.The yen, still being stabilised at around 260 against the dollar, recovered instep against the DM (Figure 2.5).
The Japanese authorities were also toughening up their anti-inflationarypolicies in autumn 1973. Interest rates rose sharply and credit restrictions

46 The Yo–Yo Yen
Figure 2.8 Japan interest rates, 1970–80
were applied to all financial institutions (Figure 2.8). Further budget cut-backs were announced. The Tanaka Cabinet temporarily – and in the eventpermanently – abandoned its plans for ‘Re-building the Archipelago’ andmade reining in inflation its top economic priority. In the exchangemarkets, the Bank of Japan supported the yen to prevent any depreciationagainst the dollar. The support was withdrawn once the oil crisis erupted.On 18 October 1973, in the midst of the Arab-Israeli war, Saudi Arabia cutits oil production by 10 per cent. As the oil crisis deepened in Novemberand December, the dollar powered higher against both the DM and yen(more against the DM at first as the Bank of Japan tried for a time toprevent the yen depreciating beyond 280 to the dollar but then moreagainst the yen when, in early January 1974, the Bank allowed a fall to the300 level).
Alarm about rising inflation in the USA and the end of capital exportcontrols there brought a brief correction (down) of the dollar in spring1974, most of all against the DM but also against the yen. But then a deci-sive further tightening of monetary policy by Chairman Burns, who wasnow fighting inflation with rare single-mindedness (while President Nixonwas increasingly immersed in the Watergate affair), brought a recovery ofthe Greenback, with the yen returning to around 300 to the US dollar.Thus by summer 1974 the yen re-stabilised against the dollar at a levelsome 35 per cent higher in real terms than in the mid-1960s (Figure 2.9).

A Brief History of the Modern Yen (1960–87) 47
* Calculated on the basis of consumer prices.
Figure 2.9 Real exchange rate index of the dollar against yen,* 1970–2000
That result, broadly similar to the amount of real appreciation between1960 and 1965, was achieved by a combination of a cumulative appreci-ation by around 20 per cent of the yen against the dollar in the foreignexchange markets together with a faster rate of inflation in Japan than inthe USA through 1973–4 (US consumer prices had risen by 18 per centcompared to 39 per cent for Japan).
The sudden descent of the US economy into recession in late 1974brought a relapse of the US dollar, initially just against the DM but alsoagainst the yen in early 1975 (as the Japanese authorities allowed the yento move through its unofficial peg of 300 towards 285). By summer (1975)the yen was back to 300 as the USA entered a strong economic recoverymuch sooner than generally expected. The fall-back of the yen against thedollar was much less than that of the DM. Japan, like the USA, was emerg-ing decisively from recession (mining and manufacturing production hadfallen almost 20 per cent from the fourth quarter of 1973 to the firstquarter of 1975). From the second half of 1975 Japan’s exports began toclimb steeply (automobiles and colour televisions were at the front of theexport boom). Export strength compensated for weak domestic demand.Business investment did not recover to the vigorous growth path of previ-ous economic expansions and public investment was held back in line withthe intent of improving public finances after the ravages of the recession.

48 The Yo–Yo Yen
In fact the Japanese economy that emerged from the 1974–5 recessionhad changed mode from the pre-recession high growth era. Corporationsand households had scaled back their expectations from rapid to slowgrowth and entered a process which economist Takafusa Nakamuradescribes as ‘Operation Scale-Down’. No doubt this process would havegradually got under way even without the recession, as the growth ofJapanese economic productive potential slowed from the miracle period,but the adjustment would have been more gradual. Businesses, typicallyhighly levered on the eve of the recession, were determined to improvetheir financial ratios and became much more cautious in their capital bud-geting than during the high-growth era of the 1950s and 60s. Householdshad raised their savings rates, having experienced the ravages of highinflation and falling asset values, now aware of increased risks of employ-ment, and no longer able to count on rapid income growth to provide fortheir pensions (Figure 2.10).
As we shall discuss in much more detail in Chapter 3, a swing of aneconomy into large private sector savings surplus at a time when the fiscalbalance is being held in check tends to go along with a rising currentaccount surplus. In effect the savings surplus is exported in the form ofcapital outflows to the rest of the world. It is likely that the nationalcurrency would fall in international value as part of the process of macro-economic adjustment, unless there are powerful offsetting influences.
Figure 2.10 Japan business investment and saving (% of GDP), 1960–80

A Brief History of the Modern Yen (1960–87) 49
And indeed during late 1975 and 1976 Japan appeared to be following thisroute, although restrictions on capital exports were a handicap. True theyen was stable rather than weakening, but Operation Scale-Down wasleading to big efficiency gains in the export sector. Japan’s current accountwas moving into modest surplus again despite the huge oil bills that had tobe paid to OPEC. But unknown or unrecognisable to contemporaryobservers Washington was about to deliver a new shock, emanatingfirst from the Federal Reserve under Chairman Burns (who had beenreappointed for four years in January 1974), which was to blow theJapanese economy and the yen off course.
Arthur Burns had been relieved at the US economy’s exit from recessionin spring 1975 – an exit which he had confidently predicted against achorus of pessimism from consensus economists in Washington and onWall Street. But he was concerned at the continuation of the high inflationrate (underlying inflation rate was close to 6 per cent p.a. that year). Hismonetary strategy called for a relatively slow recovery in which economicslack in the form of idle capacity and unemployment (at around 8 per cent)would bear down on inflation. By the first half of 1976 his strategyappeared to be working well. The economy grew by an impressive 8.5 percent p.a. rate in the first quarter and a still strong 5 per cent p.a. in thesecond while consumer prices increased at ‘only’ 5 per cent p.a.
But in the summer quarter (1976) there was a deterioration – theeconomy seemed to be slowing. Unemployment crept up to near 8 per centin the second half of 1976. Chairman Burns argued that temporary pauseswere not uncommon during periods of economic expansion, but thelooming Presidential contest complicated policy decisions. In response tosome slowdown in monetary growth, the FOMC allowed money rates tofall, with the prime rate declining from 7.25 per cent in June to 6.25 percent in December. (Even so, President Ford, with whom Burns had formeda good working relationship, lost the election to Jimmy Carter.)
The easing of US monetary policy, coinciding with the swing of theJapanese trade balance into significant surplus, brought some upward pres-sure on the yen, which in late summer/early autumn 1976 briefly brokebelow 290 yen/$. The yen advanced more rapidly than the DM. For thefirst time under the floating exchange rate regime (dating back to the startof 1973), the yen was the focal point in currency markets, moving at theopposite end of the pole to the US dollar with the DM in between. Untilthis point, the yen had either moved in strict parallel with the DM versusthe dollar, or had been in between the DM and dollar – rising against oneand falling against the other; never had the yen moved on its own with theDM and dollar stable against each other or at the opposite end of the poleto the DM or US dollar. Beyond early autumn, the yen fell back to near 300as the Bank of Japan itself eased monetary policy in response to the falter-ing economic recovery. By contrast, the DM continued its rise against the

50 The Yo–Yo Yen
US dollar, and so the yen found itself at the opposite end of the pole to theDM, with the dollar moving in-between.
The yo–yo yen is born, 1977–80
The return of the yen to near its unofficial parity of around 300, which hadbroadly been in place since spring 1974, was brief. The election victory ofJimmy Carter (in November 1976), expected to be more interventionist ininternational economic policy than his predecessor, was the catalyst of thefirst unilateral rise of the yen against both the US dollar and DM under thepost-1973 floating exchange rate regime. In the three months following theelection the yen moved to 275 against the dollar whilst the DM/dollar rateremained virtually stable. This modest but solo move marked the birth ofthe yo–yo yen which in its first huge oscillation went to 180 against thedollar and 90 against the DM by summer 1978 (from 290 and 125 respec-tively in late 1976), and then reversed violently to 240 and 145 by winter1979/80 (Figure 2.5).
The rise of the yen against the dollar to its peak of 180 in summer 1978occurred in the context of a general decline of the US dollar. But thatdecline was much greater against the yen (and the Swiss franc) than againstthe DM. During the subsequent fall of the yen through to winter 1979/80,the DM/dollar rate remained largely stable. Thus at the end of its first bigfluctuation, the yen was much lower (worth less) against the DM than atthe start. Overall, in real effective terms the yen started the 1980s at a levelsimilar to that just before the start of its ascent in late 1976. What were thedriving forces behind the climb of the yen to its summer 1978 summit andits subsequent startling descent?
US monetary policy played a lead role in the decline of the dollar to itslowpoint in the third quarter of 1978 but not directly in the much greaterrise of the yen than the DM. The US economic pause in the second half of1976 gave way to rapid growth and a jump of inflation in the first half of1977 (headline CPI rose by 10 per cent p.a. and 8.1 per cent p.a. respec-tively in the first and second quarters, albeit exacerbated by a surge in foodprices). The White House cut back its planned fiscal stimulus, of which somuch had been made during the election campaign, and even began totalk about balancing the Federal budget by 1981. The Federal Reserve stillunder Arthur Burns started to raise rates – the Federal funds rate, which hadfallen to around 4.75 per cent during the previous election quarter(1976Q4), edged up to 5.5 per cent by summer 1977. But that could hardlybe called an anti-inflation monetary policy!
It was no wonder that the currency markets became gripped by a crisis ofconfidence in the dollar. Burns was concerned about the weakness of thedollar, seeing it as a dangerous development for inflation, but did not

A Brief History of the Modern Yen (1960–87) 51
recognise it as a symptom of monetary policy being far too easy. Instead hegave verbal support to measures designed to cut back petroleum importsand urged action to make US companies more competitive (for example acut in corporate taxes). Declining headline inflation in the second half ofthe year, fresh anxiety within the Administration about whether theeconomy was slowing and the looming reappointment decision regardingthe Federal Reserve Chairman all acted against any bold tightening of mon-etary policy in the second half of 1977 (nonetheless the Federal Funds ratedid rise 100bp to 6.5 per cent by the fourth quarter) and the dollar contin-ued to fall.
In the event, President Carter decided against reappointing Arthur Burns.In early 1978 Burns left the Federal Reserve, to be replaced by William G.Miller, the president of Textron Corporation. The appointment got thethumbs-down in the markets. History has been more severe on ArthurBurns than his contemporaries were. They saw the chairman as a fighteragainst inflation in the face of overwhelming counter-forces, including avery hostile Congress (which was always demanding higher growth and thetaking of less recession risk) and an aggressive White House (first, PresidentNixon in the years 1970–2 and subsequently President Carter in 1977) thatdemanded monetary stimulus and fretted at any counter-inflationarymove. Contemporaries viewed William Miller as a lightweight who couldput up no fight against rising prices and the experience of spring throughautumn 1978 when the Federal Reserve acted tamely in the face of risinginflation did not prove them wrong.
US inflation and Federal Reserve ineptitude were only two factors in thedecline of the dollar during 1977–8. International investor concern aboutUS inflation tended to have its biggest impact on the Swiss franc followedby the DM. Thus when the crisis of confidence in US monetary policy wasat its worst, in autumn 1978, the Swiss franc soared and the DM was alsostrong. By contrast, the Japanese yen hardly rose (against the dollar) fromthe peak it reached earlier in the summer (1978). The DM and Swiss franchad more appeal than the yen to international investors seeking a safehaven against monetary disorder in the USA. The yen had historically beena relatively high inflation currency and 1978 was the first year in whichJapanese inflation was below that in the USA (since the start of the historyof the modern yen presented in this chapter) (Figure 2.11).
Another key factor in the decline of the US dollar through 1977–8 wasconcern about the widening US trade deficit. This factor had its biggestimpact on the yen. Rapidly rising Japanese exports to the USA were anobvious (albeit misguided!) issue for officials in Washington to raise whenseeking cures for the perceived trade deficit problem. Furthermore, theyviewed yen and to a lesser extent Deutsche mark appreciation as part of thesolution. Markets were influenced by opinion in Washington, not leastbecause the Nixon shock (summer 1971) had demonstrated that the USA

52 The Yo–Yo Yen
Figure 2.11 Japan vs. US inflation, 1971–9
was ready, on occasion, to take forceful action to implement its exchangerate policy. The US trade deficit, which had totalled about $10 billion in1976 more than tripled in 1977 as oil imports rose sharply, manufacturedimports surged, and export growth was weak. The rising energy deficit wasblamed on inappropriate price controls on domestic production, whilst thenon-oil deficit seemed (to Washington observers) to reflect a lack of UScompetitiveness and the failure of European nations and Japan to takesufficient action to reflate their economies. At an international conferencein June 1977, US Treasury Secretary Blumenthal tried to put pressure on theJapanese and German governments by hinting that the USA wanted theyen and DM to appreciate.
Japan was in the front line of criticism not just because its export per-formance was most striking but also because its recovery effort (fromthe recession of the mid-1970s) appeared to be the most inadequate (Figure2.12). The IMF, for example, in the highly provocative ‘Witteveen paper’issued in spring 1978, called for Japan to grow at 7.5 per cent p.a. annuallyover the next three years and pressed both Tokyo and Bonn to take furthermeasures of fiscal reflation. IMF officials at that time simply had not seizedthe new fact that Japan’s miracle years had ended – possibly already by1970 but certainly by the mid-1970s (the reflation of 1971–2 produced ahuge inflation boom because productive potential growth had alreadyslowed unbeknownst to Japanese economic policy-makers). The suggestion

A Brief History of the Modern Yen (1960–87) 53
Figure 2.12 Japan vs. US economic growth, 1976–90
–
–
that Japan could reattain high growth by Keynesian demand-side stimula-tion was implausible. Nonetheless, under the weight of US pressure (whichmattered much more than the European accompaniments), Tokyo substan-tially eased fiscal policy through 1977–8. For example, the Fukuda Cabinetannounced in December 1977 that it was aiming for 7 per cent economicgrowth in the next fiscal year and towards that end unveiled ambitiouspublic spending plans.
In principle, if Washington’s chief concern in economic policy relationswith Tokyo was to get faster domestic demand growth in Japan, it wouldhave been indifferent between monetary or fiscal policy being used to thatend. A striking feature of the policy ‘debate’ between the US Treasury, IMF,and Tokyo (as on several later occasions, particularly the early 1990s) wasan implicit silence on both sides about the monetary options. Japanese ret-icence was understandable – after all, Japan had just recently emerged froma severe inflationary period, and even in 1977 average CPI inflation haddeclined to only around 7 per cent. The Bank of Japan was following aquasi money supply target (implicitly) and was not prepared to jettison itsprice stability policy by again subjugating everything to exchange ratepolicy as it had done in the early 1970s. Also understandable was the keen-ness of LDP politicians to use pressure from Washington in their battleagainst the Ministry of Finance’s attempts to limit public spending. The US

54 The Yo–Yo Yen
Treasury was silent on potential monetary expansion in Japan as its prefer-ence was for a stronger yen – and thereby increased competitiveness for USmanufacturers – which could accompany fiscal expansion but was unlikelyto co-exist with monetary reflation.
Barely had Japan embarked on a major easing of fiscal policy in spring1978, than the upward pressures on the yen began to abate. The US tradedeficit peaked in the first quarter and then started to fall sharply. Japan’sown trade surplus reached its peak around the same time and thenremained on a plateau before falling sharply from the fourth quarteronwards. As US inflation rose amidst general evidence that the US economywas now overheating it became untenable for Carter Administrationofficials to continue repeating the mantra that Japan and Germany wereexporting unemployment to the USA. In Japan, the Ministry of Financewas rapidly easing restrictions on capital exports so that these could play arole in offsetting upward pressure on the yen from the trade surplus. Thefact that US bond yields had now risen well above Japanese yields washelpful (Figure 2.13). Obstacles were removed to the issuance of foreignbonds in Tokyo, Japanese insurance companies were encouraged (by theMinistry of Finance) to buy foreign bonds, and banks entered the rapidlygrowing market for syndicated loans to the developing countries (in somecases having access to cheap funds directly from the Bank of Japan which
Figure 2.13 Japan vs. US government bond yields, 1975–80

A Brief History of the Modern Yen (1960–87) 55
re-lent dollars purchased in the foreign exchange market to the Japanesebanks under swap arrangements designed to stem the yen’s rise). Indeed,the restrictions on capital exports and the unfamiliarity of Japaneseinvestors with foreign assets, or foreign borrowers with the yen, had allplayed a part in the extraordinary rise of the yen under the influence of thecurrent account surplus (during 1977 and the first half of 1978). Thenormal mechanism of capital outflows absorbing a current account surplushad not been fully operational. To some extent the decline of the yen latein 1978 can be seen as symptomatic of the relief to an overheated currencyfrom opening the tap of capital exports.
A significant tightening of US monetary policy in November 1978 as partof a package of dollar–defence measures announced by the CarterAdministration (indicating that Washington no longer wanted a weakerdollar or stronger yen) played a role in the yen’s downturn. A further factorwas the Iranian revolution and associated surge in energy prices, which theJapanese economy was viewed in markets as particularly vulnerable to. Intothe second half of 1979, Japan’s current account balance had swung intolarge deficit (around 2 per cent of GDP), reflecting not just the oil priceshock but also a boom in domestic demand (spurred in part by the fiscalreflation of the previous year) (Figure 2.14).
Figure 2.14 Japan current account balance, 1970–80
–
–
–

56 The Yo–Yo Yen
Almost six years of overall near-stability, 1980–5, and then thePlaza ‘shock’
By contrast to the yen, the DM in 1979 kept broadly level with the USdollar, buoyed by an increase in international investor demand in the wakeof Washington’s order freezing Iranian deposits with US banks. In overallreal effective exchange rate terms (Figure 2.9) the yen had already fallenback to its level of late 1976 before Paul Volcker unleashed the monetaryshock of Saturday night, 6 October 1979 (the recently appointed FederalReserve Chairman, replacing his predecessor William Miller, set the stage forsharp rises in US money rates by adopting a direct target for monetary basegrowth). The yen was then at around 240 to the US dollar – the same levelas just prior to the Plaza Accord almost six years later. But in the intervalthere was to be a further throw of the yo–yo yen, although much smallerthan the violent episode which had just occurred (from 1977 to 1979).
In real effective terms the yen was broadly stable from winter 1979/80until the Plaza Accord (September 1985). The yen rose from its lows of late1979 as the Japanese current account balance swung back into surplus in1980 and exports boomed. However, this climb was terminated by the elec-tion victory of Ronald Reagan (November 1980) and a subsequent surge inUS interest rates (in part related to the rebound of the US economy fromthe recession of January–August 1980, the Volcker Federal Reserve takingthe opportunity to complete its anti-inflation mandate and, in part, to thefiscal expansion associated with Reaganomics). By summer 1981 the yenhad fallen back to 240 against the dollar having almost touched 200 in late1980 (Figure 2.15). Next came a brief but sharp lurch of the yen to 280 byautumn 1982 as the US economy passed through the second and mostserious recession of the Volcker years. The recovery of the yen against thedollar was even more violent once the recession ended to 240 yen/US$ bythe end of 1982. There followed almost two years (until Plaza) of the yenoscillating by ±5 per cent around 245 yen/US$.
There were several factors behind the overall stability (in real effectiveexchange rate terms) of the yen during the first half of the 1980s. First,except for 1980 and 1982, the yen was not centre-stage in the currencymarkets. It was the DM rather than the yen that was at the opposite end ofthe pole to the US dollar during the great anti-inflation battles of theVolcker Federal Reserve and then the Reaganomics boom (the latter coin-cided with a first episode of acute Euro-pessimism).
Second, currency politics was anathema to the first ReaganAdministration (1980–4). Markets did not have to reckon with the risk of aNixon-type shock in which Washington would seek to devalue the dollarand revalue the yen in order to promote economic recovery. Indeed, duringthe deep US recession of late 1981 and 1982 (first three quarters) the yenwas generally weak, as a normal response to concerns about the impact of
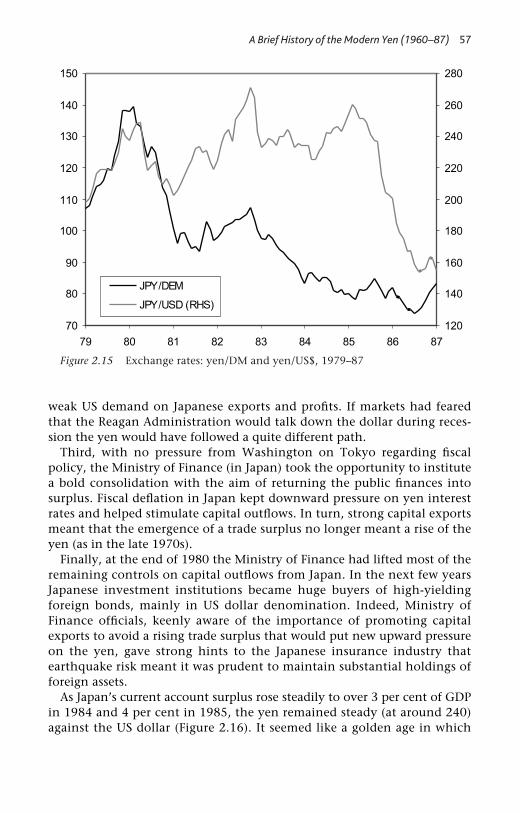
A Brief History of the Modern Yen (1960–87) 57
Figure 2.15 Exchange rates: yen/DM and yen/US$, 1979–87
weak US demand on Japanese exports and profits. If markets had fearedthat the Reagan Administration would talk down the dollar during reces-sion the yen would have followed a quite different path.
Third, with no pressure from Washington on Tokyo regarding fiscalpolicy, the Ministry of Finance (in Japan) took the opportunity to institutea bold consolidation with the aim of returning the public finances intosurplus. Fiscal deflation in Japan kept downward pressure on yen interestrates and helped stimulate capital outflows. In turn, strong capital exportsmeant that the emergence of a trade surplus no longer meant a rise of theyen (as in the late 1970s).
Finally, at the end of 1980 the Ministry of Finance had lifted most of theremaining controls on capital outflows from Japan. In the next few yearsJapanese investment institutions became huge buyers of high-yieldingforeign bonds, mainly in US dollar denomination. Indeed, Ministry ofFinance officials, keenly aware of the importance of promoting capitalexports to avoid a rising trade surplus that would put new upward pressureon the yen, gave strong hints to the Japanese insurance industry thatearthquake risk meant it was prudent to maintain substantial holdings offoreign assets.
As Japan’s current account surplus rose steadily to over 3 per cent of GDPin 1984 and 4 per cent in 1985, the yen remained steady (at around 240)against the US dollar (Figure 2.16). It seemed like a golden age in which

58 The Yo–Yo Yen
Figure 2.16 Japan current account balance, 1981–90
huge flows of capital would move across the globe to equalise rates ofreturn in the face of differential investment opportunity and varyingnational savings rates. Trade balances would be a statistic on the back pageof the financial press rather than the focus of Finance Ministers’ attention(including, most prominently, a US Treasury Secretary following a neo-mercantilist agenda). A giant US trade deficit was of no consequence if itwas the by-product of booming investment opportunity unleashed byReaganomics, and large Japanese trade surpluses were simply a reflection ofthe high savings rate in Japan, not a plot of Tokyo to knock out US compe-tition and take over the world. Events were soon to show, however, thatcelebration was premature. Growing trade protectionism in the USCongress and gestures of appeasement by the Reagan Administration wereominous. Could another Nixon shock be in the making that would set backthe stabilising role of international capital flows for years to come?
Just months after coming to office the Reagan Administration hadworked towards a voluntary agreement to restrain Japanese automobileexports. In 1983–4 the so-called ‘yen–dollar’ talks had culminated in agreedmeasures for opening up the Tokyo financial markets to some foreign par-ticipation (in particular US investment houses). Treasury Secretary Reganhad made clear that he expected the measures would bolster the yen viamaking domestic asset markets more attractive (in terms of say liquidityand sophistication) to Japanese investors who would otherwise favour US

A Brief History of the Modern Yen (1960–87) 59
assets. In January 1985, Washington proposed a new set of Market-Oriented Sector-Specific (MOSS) talks with the Japanese aimed at removinga wide range of barriers to foreign access in four sectors (telecommunica-tions, medical equipment, forest products and electronics). But even as theAdministration was attempting to reclaim the initiative, congressionaldemands for a more aggressive trade policy were reaching new heights.
During 1985 more than 300 trade bills were introduced as members ofCongress, faced with mounting pressure from industry and labour, rushedto introduce harshly worded resolutions and protectionist bills. One resolu-tion, passed 92–0 by the Senate in March 1985, blasted Japan for its unfairtrading practices and urged retaliation unless the nation significantlyincreased its imports from the USA. The most notorious of the legislativeinitiatives was the Gephardt Amendment, based on legislation first intro-duced by Senator Lloyd Bentsen (subsequently the Treasury Secretary in the first Clinton Administration) and Representatives Gephardt andRostenkowski in summer 1985, under which Japan and other surplus coun-tries would have had to reduce their surpluses by 10 per cent per annum orelse face sanctions.
The table was turned on the trade protectionists when the ReaganAdministration reluctantly abandoned the position that the dollar shouldbe determined in the free market, and embraced, at Plaza (September 1985),the idea of concerted central bank intervention, accompanied by monetarypolicy shifts, to lower the dollar’s international value. By promoting asmaller trade deficit, a weaker dollar was supposed to keep protectionism atbay. The depreciation of the dollar from 240 against the yen just beforePlaza to 150 a year later (autumn 1986) was certainly far beyond whatanyone envisaged at the meeting. Indeed, in testimony before the Diet inJuly 1987, the Finance Minister Kiichi Miyazawa disclosed that the PlazaAgreement was based on a target of around 220 yen/US$. Miyazawa main-tained that the ‘concerned countries judged that reducing the dollar’s valueby about 10 per cent before the International Monetary Fund’s annualgeneral meeting in Seoul two weeks later would help the success of themeeting’.
It is very difficult to blame Plaza (and thereby the ReaganAdministration) for more than a small part of the huge losses that Japaneseinvestors were to make on their first big foray into foreign currency assets.These losses were to become part of the folklore explaining the extraordi-narily sluggish capital outflow from Japan on various occasions during thenext fifteen years. Rather, Japanese (and European) investors had embracedfar too optimistic scenarios for the US economy over the following years –scenarios where extraordinarily high interest rates could co-exist with eco-nomic prosperity. By spring 1985 it was evident that the Reaganomic boomwas drawing to a close, and by the time of the Plaza Accord, the USeconomy was almost certainly in a growth-recession (period of well below

60 The Yo–Yo Yen
trend growth) that, with the benefit of many years of hindsight, is nowdated as running from late 1984 to early 1987. Between mid-1985 and mid-1986, ten-year US T-bond yields fell almost 300bp while the Federal Fundsrate dropped by 150bp (Figures 2.17 and 2.18).
In many respects Plaza was indeed an empty agreement. Finance minis-ters and central bankers can talk about preferred exchange rate levels andthreaten large-scale intervention but why should anyone in markets sit upand take notice? Intervention is widely seen as futile if not accompanied bya substantial shift in monetary policy. The only shift that explicitly fol-lowed Plaza was a bizarre short-lived tightening of monetary policy by theBank of Japan. Short-term money rates in Tokyo jumped by almost 150bpand JGB yields by almost 100bp in the immediate aftermath and, corre-spondingly, the yen shot up against both the US dollar and DM in a fewweeks following the agreement, from 240 to 215 against the dollar andfrom 85 to 80 against the DM (Figure 2.15). But there was no basis fortighter monetary policy in Japan at this point. Perhaps an easing of fiscalpolicy would have provided cause (for tighter money). But significantly, atPlaza, Washington did not (as on many previous or later occasions) pressfor budget reflation and the Ministry of Finance was, in any case, totallyopposed to reversing its hard-won gains on the road to budget balance.
By early 1986, the Bank of Japan had reversed the tightening of policyeffected following Plaza and until year-end the yen now rose less in total
Figure 2.17 Japan vs. US government bond yields, 1985–6
10yr JGB yield
10yr T-bond yield
12
10
8
6
4
Jan-85 Apr-85 Jul-85 Oct-85 Jan-86 Apr-86 Jul-86 Oct-86

A Brief History of the Modern Yen (1960–87) 61
Figure 2.18 Japan vs. US money market rates, 1985–6
than the DM against a generally weakening dollar. Fear amongst economicpolicy-makers in Tokyo that the tumble of the dollar would send theeconomy into a recession lay behind a further aggressive easing of mone-tary policy that has subsequently been blamed for sowing the seeds of thegreat bubble economy in Japan during the late 1980s. Apparently enhanceddomestic investment opportunity in Japan went along with a slowermomentum of capital exports bringing soon further gains for the yen. Aftersome temporary stability at around 160 to the dollar during late 1986, theyen surged towards 140 in early 1987 (Figure 3.14).
Overall the dollar’s fall against the DM since Plaza had been almost equalto that against the yen, and Washington now agreed, at the so-calledLouvre Accord (February 1987), to help prevent a further decline. There wasthe usual burst of foreign exchange market intervention by the FederalReserve, Bank of Japan, and Bundesbank, but then the Wall Street Crash ofOctober 1987 brought a decline of the dollar to 120 against the yen by theend of 1987. The yen made substantial gains against the DM through thefirst half of 1988 whilst returning to 130–140 against the dollar by thesummer (1988), as the US economy continued upwards despite the Crashand the Japanese economic boom (bubble) was now in full swing. By con-trast there was still lingering pessimism about European economicprospects.
62 The Yo–Yo Yen
In summary, after the golden stability of the early 1980s, the new violentswing (upwards) of the yo–yo yen in two or three years which followed thePlaza Agreement may have had much less to do with Washington thanpopular legend claims. Rather, fading optimism about Reaganomics andthen a sudden outbreak of euphoria about investment opportunities inJapan (which in part may have been stimulated by policy-makers in Tokyoout of fear of currency-led deflation, over-easing monetary policy and evenhelping to stimulate a huge wave of real estate speculation) were pullingthe string of the yo–yo yen.
63
3Who Pulls the String of the Yo–Yo Yen?
Does Washington or Tokyo pull the string of the yo–yo yen? That is theoutstanding question from the history of the years 1971–87 covered inChapter 2. Suppose there had been no buzz of concern from Washingtonabout the size of Japan’s trade surplus, would the yen have pursued a muchmore stable path? The question is even more pertinent to the experience of1988–2000, through the Bubble and into the Lost Decade, to be consideredin the next two chapters.
The search for who pulls the string should start with the origins of thetrade and current account surpluses, which were to become the periodicfocus of currency markets and the apparent catalyst on several occasions tocurrency instability. Was it inevitable that the surpluses would fuel theyo–yo behaviour of the Japanese currency? The discussion of inevitabilityinvolves some counterfactual historical analysis.
As a final point (to this chapter), how do we measure the swings of theyo–yo yen in a three-currency world? Although much of the narrativeabout the yo–yo yen is in terms of the yen–dollar rate, to understand andmeasure the phenomenon we have to distinguish how far the yen ismoving on its own as opposed to simply being carried along by the USdollar or the euro (and previously the DM).
Origins of Japan’s surplus ‘problem’
It is an identity of economic arithmetic that the current account surplus inthe balance of payments equals the excess of domestic savings over invest-ment spending. A country whose residents are big savers and where domes-tic investment opportunity is poor runs a large current account surplusmatched by equal net capital exports. As an extreme illustration take an oilrich nation populated by a small number of sheikhs. Most of the oil rev-enues are saved and invested in foreign assets. The trade surplus is verylarge relative to the size of the economy. A less extreme example is a

64 The Yo–Yo Yen
country whose working population is ageing and saving hard for retire-ment but where domestic outlets for investment do not grow in step. Anexample is Switzerland at the end of the twentieth century, whose currentaccount (and savings surplus) had grown to around 13 per cent of GDP.
Japan in the 1970s started to show symptoms of savings surplus – savingsrunning ahead of domestic investment opportunities. The miracle era ofdouble-digit growth came to a sudden end with the recession of 1974–5.From the 1960s onwards, economists had predicted a gradual rather thansudden fading of the miracle. As we saw in the previous chapter, some con-temporary economists erroneously diagnosed the beginnings of the end ofthe miracle as early as the mid-1960s. But in reality the miracle came to anend with a bubble-and-bust sequence – the Tanaka boom of 1972–3 fol-lowed by the subsequent crash. The wide amplitude of the economicfluctuations in the mid-1970s meant it was some considerable time before afinal verdict could be given on the passing of the economic miracle.
As the miracle faded, investment opportunities contracted. No longerwas there the seemingly boundless scope for profit from chasing the levelsof technology and capital per head found in the advanced industrialeconomies. An indicator of the change in opportunity set was the declinein business investment as a proportion of GDP (Tables 3.1, 3.2, 3.3 and
Table 3.1 Japan savings–investment balance, 1960–72 (% of national income)
1960 1965 1968 1970 1972
Saving (gross)Household 14.2 14.9 15.1 15.1 16.2Corporate 14.6 13.7 17.9 20.0 17.2Government 6.7 6.1 6.5 7.5 6.8
Total saving (S) 35.5 34.7 39.5 42.6 40.2
InvestmentHousehold 4.2 6.0 6.6 6.8 7.3Corporate 24.0 19.0 23.8 26.0 20.1Government 7.5 9.1 8.8 8.6 10.1
Total investment (I) 35.7 34.1 39.2 41.4 37.5
Savings surplus (S-I) –0.2 0.6 0.3 1.2 2.7
Current account (balance of payments) 0.4 1.1 0.8 1.1 2.3
Savings surplus by sectorGovernment –0.8 –3.0 –2.3 –1.1 –3.3Private 0.6 3.6 2.6 2.3 6.0
Household 10.0 8.9 8.5 8.3 8.9Corporate –9.4 –5.3 –5.9 –6.0 –2.9

Who Pulls the String of the Yo–Yo Yen? 65
Table 3.2 Japan savings–investment balance 1974–82 (% of national income)
1974 1975 1978 1980 1982
Saving (gross)Household 20.8 21.6 20.4 18.1 16.4Corporate 10.2 8.1 11.4 11.3 10.9
Government 7.3 4.1 2.3 3.7 3.9Total saving (S) 38.3 33.8 34.1 33.1 31.2
InvestmentHousehold 7.9 7.3 7.2 6.8 5.7Corporate 22.1 17.6 15.1 17.3 15.7Government 9.4 9.5 10.4 10.1 9.1
Total investment (I) 39.4 34.4 32.7 34.2 30.5
Savings surplus (S-I) -1.1 -0.6 1.4 -1.1 0.7
Current account (balance of payments) –0.9 –0.1 1.8 –0.9 0.8
Savings surplus by sectorGovernment –2.1 –5.4 –8.1 –6.4 –5.2Private 1.0 4.8 9.5 5.3 5.9
Household 12.9 14.3 13.2 11.3 10.7Corporate –11.9 –9.5 –3.7 –6.0 –4.8
3.4). At the cyclical peaks of 1962 and 1970, the investment proportionhad reached around 25 per cent. In 1973 the proportion had reached asomewhat lower 23 per cent. But in the late 1970s and early/mid-1980s thepeaks were at 15–16 per cent only. Further ahead, in the speculative frenzyof the Great Bubble, the investment ratio touched 20 per cent (in 1990) butsubsequently fell back to around 15 per cent on average during the LostDecade (1990s). Investment by the household sector (mainly residentialconstruction) also fell as a trend – by around 2 per cent of GDP – betweenthe 1960s and 1990s.
Household savings, however (measured as a percentage of GDP), showedno tendency to move down in step with business investment. Indeedduring the early 1970s the savings rate jumped amidst high inflation andeconomic uncertainty. There was a decline during the late 1970s bringingthe net savings ratio (household savings, after deducting annual deprecia-tion of the capital stock – mainly homes – held by the household sector, asa proportion of GDP) in the first half of the 1980s to around 12 per cent,up from around 10 per cent in the 1960s. Subsequently a dip occurredduring the period of the bubble economy, but in the 1990s the savingsratio steadied at around 9 per cent of GDP, just marginally below the

66 The Yo–Yo Yen
Table 3.3 Japan savings–investment balance 1984–9 (% of national income)
1984 1985 1987 1989
Saving (gross)Household 16.3 15.9 14.4 13.5Corporate 12.1 12.3 13.4 13.0Government 4.5 5.9 6.5 8.4
Total saving (S) 32.9 34.1 34.3 34.9
InvestmentHousehold 5.0 4.9 6.0 6.2Corporate 16.7 17.9 17.3 20.4Government 8.2 7.2 7.3 6.9
Total investment (I) 29.9 30.0 30.6 33.5
Savings surplus (S-I) 3.0 4.1 3.7 1.4
Current account (balance of payments) 3.1 4.0 4.0 2.3
Savings surplus by sectorGovernment –3.7 –1.3 –0.8 1.5Private 6.7 5.4 4.5 –0.1
Household 11.3 11.0 8.4 7.3Corporate –4.6 –5.6 –3.9 –7.4
1960s. The corporate sector savings rate (corporate savings, roughly equiva-lent to retained profits plus depreciation allowances, measured as a propor-tion of GDP) did fall, but only slightly, between the early/mid-1960s andthe 1980s/1990s.
There are several plausible hypotheses (not mutually exclusive) as to whyJapan’s private sector savings remained high despite declining investmentopportunity, and, of course, each explanation varies in importance throughthe three decades.
First, the period of explosive growth meant that employees retiring in the1980s would not have saved sufficiently during their early working years toprovide income near the level of their late working years.
Second, the inflation and recessionary storms of the mid-1970s togetherwith the sudden end of the miracle encouraged some greater caution onthe part of households regarding their spending plans.
Third, high land prices meant that young households had to save hard tobuy living accommodation.
Fourth, there was a bulge in the proportion of middle-age workers pro-viding hard for their retirement against the background of scepticism

Who Pulls the String of the Yo–Yo Yen? 67
regarding the ability of public and private pension funds to meet theircommitments.
Fifth, and most relevant in the late 1990s and beyond, public concernabout huge government deficits and the likelihood of increased taxation inthe future encouraged precautionary saving.
Corresponding to the pattern of private sector savings surpluses and busi-ness investment described, the private sector savings surplus in theJapanese economy rose from around 2 per cent of GDP in the 1960s toalmost 10 per cent in the late 1970s. It fell back to around 5–6 per centthrough the early and mid-1980s, dipping to virtually zero at the peak ofthe bubble economy (1989–90), and then rose back to 9 per cent by theend of the 1990s. These recorded surpluses, however, may understate theunderlying imbalances between private savings and investment, as theywere generated at interest rates that, for much of the period (late 1970s toend of the century), were below foreign rates (especially US). If there hadbeen no exchange risk and international capital perfectly mobile (as underthe gold standard regime prior to the First World War) then Japanese andUS rates would have been much closer together and the private sectorsavings surplus in Japan even larger.
Table 3.4 Japan savings–investment balance, 1990–9 (% of national income)
1990 1993 1997 1999
Saving (gross)Household 12.7 13.8 14.0 14.3Corporate 13.5 14.4 15.1 14.3Government 9.5 6.5 3.1 1.2
Total saving (S) 35.7 34.7 32.2 29.8
InvestmentHousehold 5.6 5.2 4.5 4.5Corporate 21.1 17.0 17.6 15.1Government 7.0 8.3 8.3 8.9
Total investment (I) 33.7 30.5 30.4 28.5
Savings surplus (S-I) 2.0 4.2 1.8 1.3
Current account (balance of payments) 1.5 3.1 2.3 2.7
Savings surplus by sectorGovernment 2.5 –1.8 –5.2 –7.7Private –0.5 6.0 7.0 9.0
Household 7.1 8.6 9.5 9.8Corporate –7.6 –2.6 –2.5 –0.8

68 The Yo–Yo Yen
The implications of the private savings surpluses for the balance of pay-ments depend in part on the position of the public sector. It is the totalsavings surplus, private and public combined, which is equal to the currentaccount surplus. In the late 1970s an aggressive easing of fiscal policy offseta build-up of the private sector savings surplus, so that the current accountsurplus was only small. Again, in the 1990s, a progressively more expan-sionary fiscal policy diluted the impact of a huge private sector savingssurplus on the current account balance. (Public and private sector savingsare not wholly independent of each other. If Ricardian equivalence held,households would increase their savings when budget deficits appeared byenough to service the issues of government debt – including repayment.But in practice only partial Ricardian equivalence has been found in empir-ical studies – and so expansionary fiscal policy would reduce the overallsavings rate in an economy.)
The size of Japan’s overall savings and current account surpluses recordedthrough the 1980s and 1990s was hardly large by historic or contemporarystandards. Expansionary fiscal policy and increasing aversion of Japaneseinvestors to bearing foreign exchange risk (meaning lower than otherwisebond yields and interest rates in Japan) kept a lid on the surpluses. By con-trast, in the twenty years before the First World War the comparativelymature British economy (which had led the industrial revolution) rancurrent account surpluses of around 10 per cent of GDP annually. In the1980s and 90s, Switzerland ran ever larger current account surpluses reach-ing as high as 13–14 per cent of GDP (Figure 3.1). The Swiss currentaccount surpluses corresponded to a bulge in household savings spurred bygenerous fiscal incentives for building up nest-eggs for retirement coupledwith sluggish domestic investment opportunities (Table 3.5).
The Swiss example does have interesting comparisons with Japan. As dis-cussed further in the next chapter, the Swiss economy was subject to a landbubble and burst also in the late 1980s and early 1990s. As in Japan thebursting of the bubble was at first accompanied by a bizarre strengtheningof the national currency and a big fiscal expansion which contributedtowards Switzerland suffering a lost three-quarters decade. But the extent ofthe damage was less in the case of Switzerland – in considerable partbecause the reversal of course in the mid-1990s (the exchange rate fallingand the budget deficit being reduced) which occurred in both countries wassustained (unlike the situation in Japan, as discussed in Chapter 5). TheNetherlands ran a current account surplus of 6–7 per cent of GDP throughmuch of the 1990s, reflecting a high personal savings rate coupled with amuch-improved budgetary situation. In Singapore the current accountsurplus reached almost 30 per cent of GDP at the end of the 1990s.
It is striking that all the examples of large surpluses have gone hand-in-hand with a propensity for domestic residents to invest abroad and for for-eigners to borrow the currency of the given country. British investors

Who Pulls the String of the Yo–Yo Yen? 69
Figure 3.1 Switzerland current account balance vs. real effective exchange rate,1980–2000
Swiss current accountbalance (% GDP)
Swiss franc real effectiveexchange rate (RHS)
14
12
10
8
6
4
2
0
–280 81 82 83 84 85 86 87 88 89 90 91 92 93 94 95 96 97 98 99 00
75
80
85
90
95
100
105
before the First World War played a large part in financing the develop-ment of North and South America. Swiss portfolio investors in the 1980sand 1990s were avid buyers of higher-yielding paper denominated inforeign currency and Swiss corporations were at the forefront of a take-overboom in both the EU and North America. The low interest rate Swiss franchas been popular with international borrowers. In the case of theNetherlands, corporations there have greatly increased their internationalpresence.
The stock of Japanese investment abroad did grow rapidly through the1980s and 1990s. But the yo–yo behaviour of the yen was an impedimentto an even greater outflow of capital. Investors who lost very heavily ontheir acquisition of foreign bonds in the early 1980s as the yen shotupwards in the late part of that decade were reluctant to re-engage in ‘inter-est arbitrage’. Later, the foreign borrowers who ran up yen liabilities as partof the hugely popular carry trade in the years 1995–8 were so sore at thehuge losses inflicted by the yen’s jump of late 1998 that they would surelynot re-enter a similar line of activity for a long time to come. The yo–yoyen, by dampening the force of potentially stabilising international capitalflows, imposed an economic burden on the Japanese economy.
Arguing that the yo–yo yen was costly for Japan is not the same as nos-talgically advocating a return to fixed exchange rates. As a practical matter,

70 The Yo–Yo Yen
Table 3.5 Switzerland savings–investment balance, 1990–7 (% of national income)
1990 1992 1994 1996 1997
Saving (gross)Household1 10.0 11.7 10.1 11.2 13.5Corporate2 11.2 8.1 9.0 8.6 8.5Social assurance 9.8 9.2 8.1 8.2 7.4Government 2.6 0.1 1.0 1.1 1.2
Total saving (S) 33.6 29.1 28.2 29.1 30.6
InvestmentHousehold 9.0 7.5 7.8 7.2 7.1Corporate 14.9 12.2 10.9 10.7 10.3Government 3.8 3.8 3.5 3.0 2.9
Total investment (I) 27.7 23.5 22.2 20.9 20.3
Savings surplus (S-I) 5.9 5.6 6.0 8.2 10.3
Current account (balance of payments) 3.9 6.5 7.0 7.7 9.2
Savings surplus by sectorGovernment –1.2 –3.7 –2.5 –1.9 –1.7Private 7.1 9.3 8.5 10.1 12.0
Household 10.8 13.4 10.4 12.2 13.8Corporate –3.7 –4.1 –1.9 –2.1 –1.8
1 Includes financial intermediaries.2 Non-financial corporations only.
the conditions were never present for an exchange rate treaty to be agreedin Washington and Tokyo. As a matter of principle, normal exchange riskwhere there is no fear of sudden shocks caused by currency policy changesin Washington and Tokyo would not have been a serious impediment tointensive and equilibrating international capital flows. The politics of theyen – both its US and Japanese dimension – not floating exchange rates inthemselves were to blame for the waste of economic resources. The wastetook the form of too low a level of foreign investment and excess invest-ment in domestic public sector projects with more obvious political thaneconomic benefit.
On the US side, Administrations in Washington pressed for fiscal expan-sion as a way of stimulating the Japanese economy, reducing the Japanesesavings and current account surpluses and fostering a stronger yen – thelatter development being clearly welcome to important industrial lobbies.In Tokyo, big spenders in the Liberal Democratic Party (LDP) (the party

Who Pulls the String of the Yo–Yo Yen? 71
which has been in power throughout the modern history of the yen exceptbriefly during 1993–4) could take their cue from Washington in breakingdown opposition to budget deficits from the conservative Ministry ofFinance. Anti-reformers in the LDP (who in some cases were also bigspenders) were quite happy to offer Washington a stronger yen as a way ofdulling the periodic demands for greater access of US firms to Japanesemarkets (especially in finance, insurance and telecommunications).
Japanese manufacturers were tolerant of the bouts of yen strength giventhe possibilities of transplanting production to other cheaper labour Asianeconomies and official help was provided for the move. In the ForeignMinistry and the Ministry of International Trade and Industry (MITI) therewas a strong undercurrent of support for the closer Asian involvement fos-tered thereby as furthering Japan’s long-run geo-political interests.
Big surplus, strong currency myth
An idea that has plagued economic policy debate – both domestic (withinJapan) and internationally – is that the large Japanese current accountsurplus implies that the yen should be a continuous candidate for apprecia-tion. The view is built on seemingly common sense evidence – after all, acurrent account surplus means trade demand for the given country’s cur-rency is greater than supply. In fact the imbalance between savings andinvestment that lies behind the current account surplus also propels capitalexports. Hence, far from there being overall excess demand for the cur-rency, there could be excess supply (if net demand for foreign assets, mea-sured as a flow, rises by more than the trade surplus in the short turn).Indeed, the emergence of a current account surplus due to an autonomousrise in savings relative to investment should normally generate a downwardshift of the exchange rate (the currency of the country or monetary areaunder discussion falls in value relative to other currencies). The extent andnature of exchange rate adjustment depends on the currency regime. In asystem of totally fixed nominal exchange rates, the downward shift wouldbe in real terms only (lower inflation in the country with increased savingsthan in other countries).
To demonstrate these points, consider a sudden sharp rise in the privatesector savings surplus, as occurred in Japan after the bursting of the Tanakabubble economy of 1973, for example, or later in the aftermath of thebubble economy of 1987–9. Investment spending falls sharply from thepeak levels when euphoria was widespread, whilst households, no longerconfident about job security and ever-rising incomes, cut back their spend-ing. Suppose first, for illustration purposes, that the shock occurs in thecontext of a fixed exchange rate system where there is near zero exchangerisk (as would be the case under a well-established gold standard). A rise in

72 The Yo–Yo Yen
the private savings surplus would go along with a fall in domestic demand(or the near-term growth of domestic demand).
A new equilibrium would be reached in which the domestic price levelwould have fallen relative to price levels abroad, whilst interest rates wouldstill be at the international level, which for the purpose of this example isnot affected by events in the country in question (with virtually noexchange risk, capital would be perfectly mobile internationally and inter-est rates would be nearly identical on similar quality assets in differentcountries). The export surplus would rise by the same amount as the shockincrease in the private sector savings surplus. A real depreciation of the cur-rency (a fall in domestic prices relative to foreign, at an unchangednominal exchange rate) would be the immediate force behind the increasein exports and decrease in imports which brings the economy back to itsproductive potential level of output despite the fall in domestic demand.(For illustration purposes, the bubble-bursting occurs only in one country.In practice, several countries may be experiencing at the same time asudden rise in savings – a point we return to in the next chapter when dis-cussing the simultaneous occurrence of US and Japanese asset deflation in1990–2.) The entire shock increase in the savings surplus would flow out ascapital exports (in the new equilibrium). If the price level is sticky down-wards, then adjustment may involve a prolonged recession or depression.
Second, consider a floating exchange rate system, with varying amountsof exchange risk. The shock rise in the private savings surplus would goalong with a fall in the natural rate of interest for the given economy. (Thenatural rate of interest is the level of the interest rate in real terms at which,given present savings propensities and investment opportunity, overalldemand would equal the economy’s productive potential.) The exchangerate of the national currency would fall (probably to a level from whichsome recovery would be expected over the long run), reflecting the declinein the domestic interest rate. Given the existence of trend exchange rateexpectations (of some eventual recovery of the national currency – seebelow) and exchange risk there is considerable scope for interest rates tofall relative to those abroad. Unlike in the previous example, where ineffect a big induced increase in net export demand means that the naturalrate of interest does not change in the long run, here it falls.
For example, where Japanese interest rates fall far below US rates, the gapbetween the two in part matches expectations of a recovery of the yen inthe long run and in part provides a reward to investors and borrowers fortaking the risk of crossing the yen–dollar frontier (Japanese investorsbuying dollar assets or foreigners borrowing yen to finance investmentsoutside Japan). The widening of the rate spread (in favour of foreign cur-rencies) as described goes along with an increased net capital outflow(given the increase in reward for risk) which in turn matches a rise in thecurrent account surplus. The national currency falls to below the pre-shock

Who Pulls the String of the Yo–Yo Yen? 73
level, helping to bring about an increase in the trade surplus. In the newequilibrium the size of the current account surplus (and the savingssurplus) is likely to be smaller than in the gold standard case, in that thefall of the domestic interest rate has mitigated the initial shock rise in thesavings surplus.
If perceptions of exchange risk are minimal (or aversion to exchange riskis low), then the currency could fall substantially, but by less than the realexchange rate depreciation under the hypothetical gold standard regime.As illustration, suppose the shock rise in the savings surplus were around5 per cent of GDP (for example, capital spending intentions falling by 4 percent of GDP, savings rising by 1 per cent of GDP). Interest rates in thegiven country, say Japan, might fall to, say, 3 per cent below those abroad(principally in the USA). The currency (yen) might fall by around 20 percent from the level at the peak of the boom. In the eventual equilibrium‘solution’ the rise in the savings surplus (trimmed by the fall in interestrates) could be around 3 per cent of GDP, and the exchange rate deprecia-tion would be sufficient to bring about (in combination with other adjust-ments) a similar increase in the current account surplus. There would bestrong expectations of the currency (yen) appreciating as a trend over, say,the next ten years – in part due to rising investment income from abroad(on the increasing total of foreign assets) and in part to a return of eco-nomic confidence meaning that investment spending would rise and thepersonal savings rate fall. The investor in our hypothetical example whoforecast a significant recovery of the yen over the next decade could earn asmall risk premium (equal to cumulative gain in interest income lessexchange loss) from being in foreign currency assets rather than domestic.
If exchange rate risk and aversion to bearing that risk is high, then thefall in the currency that accompanies the shock rise in the savings surpluscould be very small. The fall in the domestic interest rate triggers littlecapital outflow. The adjustment to the rise in the savings surplus princi-pally takes the form of declining interest rates. Rather than falling 3 percent as in the previous illustration, interest rates may fall by, say, 6 percent. In the new equilibrium there is only a small increase in the net exportof capital and similarly in the eventual ‘steady state’ savings surplus.Foreign currencies are very attractive in terms of their income advantage,but investors are simply too scared to make bold transfers into them. Inpractice, the adjustment described could be blocked by a central banklacking the courage to make the necessary bold cuts in nominal interestrates (meaning that actual money rates lag far behind the fall in the naturalrate of interest). And by the time it does effect a cumulative large cut theeconomy may already be in a deflationary situation where the price level isfalling. Then it may be impossible for real interest rates to fall far, giventhat nominal interest rates under any conventional monetary regimecannot reach sub-zero levels.

74 The Yo–Yo Yen
In this last case the fall in the savings surplus from its shock high wouldbe limited and the matching current account surplus would remain sub-stantial. Capital exports would be too feeble to absorb the current accountsurplus. In this unstable situation the currency (yen) would jump to a levelwhere speculators were willing to enter the so-called carry trade (borrowinglow interest yen and buying higher interest rate foreign currencies) inanticipation of a subsequent narrowing of the current account surplus (astrade flows respond to the yen jump) relieving the currency shortage. Thisis perhaps the scenario some commentators, particularly in the 1990s, havehad in mind when they argue that a current account surplus has putupward pressure on the yen. During some parts of that decade the equilib-rium rate of interest in Japan might well have been below zero, as we shallsee in the next two chapters, and the aversion to bearing exchange riskwith respect to the yen has been very high.
It is hardly plausible to blame the entirety of the yen’s extraordinarypath, especially during the first half of the 1990s, on the impossibility ofnominal interest rates falling below zero (Figure 3.2). In the early 1990s,the actual level of yen rates was well above zero. They could have been cutaggressively but were not. And why was exchange risk then perceived to beso high (by Japanese investors in foreign assets)? As we shall see, Bank ofJapan officials played no small part in inflaming risk perceptions.
Figure 3.2 US Federal funds rate vs. Japan unsecured overnight call rate, 1991–5

Who Pulls the String of the Yo–Yo Yen? 75
In the narrative of the next two chapters, the yen’s sharp rise from 1990through to early 1995 had much to do with misguided Bank of Japanpolicy – interest rates held too high for too long. If interest rates hadalready been cut to near zero in the second half of 1992 rather than beingheld above contemporary US rates, then the yen might well have fallen inresponse to the jump in Japan’s savings surplus – especially once the USeconomy pulled out of the recessionary or slow growth period of the early1990s. The Bank of Japan Governor himself spoke in favour of a strong yen,seeing this as promoting economic restructuring. And he aired in publicpoorly based opinions about the trade surplus being a reason for the yen togo higher. It is hardly surprising that the yen went into a debilitating (fromthe viewpoint of economy) upward spiral.
What role did Washington play in building up expectations of a strongeryen? As we have already seen, in 1977–8 and 1985–6 (Chapter 2), theCarter Administration and later the second Reagan Administration letmarkets know their preference for a weaker dollar, particularly against theyen. The first Clinton Administration was to act similarly in 1993–4. Butthe power of Washington to talk up the yen should not be exaggerated.Just because the US President and Treasury Secretary speak in favour of astronger yen does not mean that markets adjust to fulfil their hopes. Andan increased risk of economic policy confrontation between Tokyo andWashington does not mean inevitably a stronger yen. In the final analysis,if Washington were to slap tariffs on Japanese imports and the Japaneseeconomy were to flounder further as a result, that could be bad news forthe yen.
Some economic commentators – including Ronald McKinnon andKenichi Ohno (1997) – tell a story steeped in psychology in whichunnerved foreign exchange dealers, for whom the Nixon shock of 1971 andPlaza shock of 1985 are deep in their subconsciousness, bid the yen higheron US trade threats. Japanese holders of dollar assets similarly take frightand rush to repatriate their capital. But the logic behind that chain ofevents has not been written down. Reports in the financial media aboutcontemporary talk in the foreign currency markets during certain episodesof a strongly rising yen (see Chapters 4 and 5 for early 1993 and early 1994examples) do indeed suggest that the Nixon shock of 1971 and the PlazaAccord (1985) continued to haunt participants. They believed thatsomehow Tokyo might engineer a yen revaluation if ultimately necessaryto prevent protectionist action by Washington. But what was the tool thatTokyo policy-makers could pull out of the black bag? Market reports gaveno indication of what the feared tool might be. In principle it could havebeen easier Japanese fiscal policy, or much less plausibly direct action toslow capital exports from Japan or encouraging some withdrawal of capitalby Japanese investors from US markets. The possible existence of such toolscould justify an increase in Japanese risk aversion towards foreign assets at

76 The Yo–Yo Yen
times of tension in economic relations between Tokyo and Washington –capable in itself of bringing about a stronger yen.
In fact, the most persuasive link between US policy and the yen doesindeed involve Japanese fiscal policy. Bigger budget deficits in Japan meantthat more of the private sector savings surplus there would be absorbeddomestically rather than via capital exports, meaning a higher yen – andofficials in both Washington and Tokyo were well aware of that connection(indeed in the so-called Strategic Initiative talks, discussed in Chapter 4, anexplicit demand of the US side was increased public spending). A succes-sion of US Administrations have pressured Tokyo to reflate via fiscal policyrather than monetary policy. Their lecturing on this issue has been musicto the ears of big spenders in the Liberal Democratic Party who wouldotherwise have been constrained by the orthodoxy of the Ministry ofFinance. Yes, in principle Japan could have said no to US demands foreasier fiscal policy and implicitly a stronger yen, but as we have alreadyseen, there was a powerful coalition of interests against such a course (LDPbig spenders, anti-reformers, foreign office pro-Asian officials). And on theUS side, some groups (for example insurers, retailers) may have preferred aharder line being taken by Washington on their behalf, but they could notprevail when many industrial lobbies were quite satisfied with a strongeryen on its own (without changes in competitive practice in the other areasmentioned).
Of course any discussion of the role of fiscal policy in promoting a strongyen should acknowledge the influence of other developments, including con-current shifts in the balance between savings and investment outside Japan.We have already referred to how the US private sector savings surplus wasrising at the same time as the Japanese in the early 1990s (albeit less sharply)(Tables 3.6 and 3.7), so curbing the fall in the equilibrium value of the yen atthat time. The tightening of US fiscal policy in the early years of the ClintonAdministration at the same time as Japanese fiscal policy was being easedhelped to counter fundamental downward pressure on the yen. In the late1990s as Japanese fiscal expansion reached a new crescendo, the euro-areaembarked on a major fiscal contraction as the EMU candidate countriessought to attain the Maastricht targets for budget deficits. Indeed the story ofthe weak euro in 1999 and strong yen could have been, in part, a reflection ofthe EMU-induced rise in euro-area savings surplus (as budget deficits shrank)and aggressive fiscal expansion in Japan (Table 3.8). But before returning tothat topic (in Chapter 5) it is necessary to gain some understanding of how toanalyse the movement of the yen in a tri-polar currency world.
The situation of the yen in currency geography
The yo–yo behaviour of the yen has not occurred in otherwise calm cur-rency markets. Some of the big moves of the yen have been integrally

Who Pulls the String of the Yo–Yo Yen? 77
Table 3.6 US savings–investment balance, 1982–90 (% of national income)
1982 1984 1986 1987 1990
Saving (gross)Household 12.9 12.3 10.3 9.6 9.9Corporate 9.9 10.9 9.7 10.0 9.4Government –1.8 –1.5 –1.8 –0.7 –0.7
Total saving (S) 21.0 21.7 18.2 18.9 18.6
InvestmentHousehold 3.6 5.0 5.5 5.4 4.2Corporate 13.7 15.3 13.1 12.8 12.2Government 3.8 3.9 4.4 4.4 4.2
Total investment (I) 21.1 24.2 23.0 22.6 20.6
Savings surplus (S-I) –0.1 –2.5 –4.8 –3.8 –2.0
Current account (balance of payments) 0.0 –2.5 –3.5 –3.6 –1.3
Savings surplus by sectorGovernment –5.6 –5.4 –6.2 –5.1 –4.9Private 5.5 2.9 1.3 1.3 2.9
Household 9.5 7.5 4.9 4.3 5.9Corporate –4.0 –4.6 –3.6 –3.0 –3.0
related to simultaneous fluctuations of the European currencies against thedollar. Therefore, in tracing the path of the yen, it is important to have areference framework in which its specific turbulence can be disentangledfrom what is happening elsewhere in the exchange markets.
Conceptually the currency world is not round but triangular. The USdollar, the euro (the DM prior to 1999) and the Japanese yen are at thethree corners. Most other currencies are either satellite to the US dollar orthe euro (there are many more dollar satellites than euro satellites) or aresubject to a powerful pull from both currencies (the dollar and euro). Avery small number of currencies (all in Asia) are subject to powerful pullsfrom both the dollar and yen. Thus the dollar, euro, and yen, can bedescribed as currency poles or as possessing polar power.
There are two basic types of exchange rate fluctuation within the USdollar–euro–yen triangle.
The first can be described as solo movement, where one of the currenciesis moving against the other two, which are broadly stable against each other.
The second can be described as axis movement, where two of the curren-cies are at the opposite end of the axis and the third in-between. Thus thethird currency is rising against one and falling against the other currency,

78 The Yo–Yo Yen
Table 3.7 US savings–investment balance 1992–9 (% of national income)
1992 1993 1995 1997 1999
Saving (gross)Household 10.9 9.3 7.8 6.8 5.1Corporate 9.5 9.7 10.5 11.1 10.8Government -2.7 -2.0 -0.1 2.1 4.1
Total saving (S) 17.7 17.0 18.2 20.0 20.0
InvestmentHousehold 3.9 4.1 4.2 4.3 4.7Corporate 11.0 11.5 12.6 13.8 14.1Government 3.8 3.3 3.5 3.4 3.4
Total investment (I) 18.7 18.9 20.3 21.5 22.2
Savings surplus (S-I) –1.0 –1.9 –2.1 –1.5 –2.2
Current account (balance of payments) –0.6 –1.2 –1.4 –1.6 –3.8
Savings surplus by sectorGovernment –6.5 –5.3 –3.6 –1.3 0.7Private 5.5 3.4 1.5 –0.2 –2.9
Household 7.0 5.2 3.6 2.5 0.4Corporate –1.5 –1.8 –2.1 –2.7 –3.3
whilst at the end of the axis the given currency moves in the same direc-tion (albeit by different amounts) against the other two.
Corresponding to these two categories of exchange rate fluctuation thereare six different types of motion possible within the dollar–euro–yen triangle:
• Solo yen. The yen moves unilaterally against the euro and the US dollar,which are broadly stable against each other. For example, the yen may bein a powerful upswing whilst the euro–dollar rate is following a flat trend.
• Dollar–yen axis dominant. The euro moves in an opposite directionagainst the US dollar and yen. The euro is the ‘in-between’ currency. Bycontrast, the US dollar moves in the same direction against the euro andyen (more against the yen than euro), whilst the yen moves in the same(opposite to US dollar) direction against the euro and US dollar (moreagainst the dollar than euro).
• Yen–euro axis dominant. The US dollar moves in an opposite directionagainst the yen and euro. The dollar is the ‘in-between’ currency. Bycontrast, the yen moves in the same direction against the US dollar andeuro (more against the euro than the dollar) whilst the euro moves inthe same (opposite to the yen) direction against the US dollar and yen(more against the yen than the dollar).

Who Pulls the String of the Yo–Yo Yen? 79
Table 3.8 Euro-area savings–investment balance 1991–8 (% of national income)
1991 1993 1995 1997 1998
Saving (gross)Household 12.1 11.5 10.8 9.4 8.8Corporate & Other 9.8 10.6 11.8 11.8 11.8Government 0.0 –1.4 –1.1 0.5 1.4
Total saving (S) 21.9 20.7 21.5 21.7 22.0
InvestmentHousehold 3.9 3.2 3.0 3.6 3.5Corporate 14.3 12.3 12.7 12.1 12.1Government 4.8 4.7 4.5 3.7 3.8
Total investment (I) 23.0 20.2 20.2 19.4 19.4
Savings surplus (S-I) –1.1 0.5 1.3 2.3 2.6
Current account (balance of payments) –1.3 0.5 0.5 1.5 1.1
Savings surplus by sectorGovernment –4.8 –6.1 –5.6 –3.2 –2.4Private 3.7 6.6 6.9 5.5 5.0
Household 8.2 8.3 7.8 5.8 5.3Corporate –4.5 –1.7 –0.9 –0.3 –0.3
• Solo euro. The euro moves unilaterally against the US dollar and yen,which are broadly stable against each other. For example, the euro may bein a sharp downswing whilst the dollar–yen rate is following a flat trend.
• Dollar–euro axis dominant. The yen moves in an opposite directionagainst the US dollar and euro. The yen is the ‘in-between’ currency. Bycontrast, the US dollar moves in the same direction against the euro andyen (more against the euro than the yen), whilst the euro moves in thesame (opposite to the US dollar) direction against the yen and US dollar(more against the dollar than the yen).
• Solo US Dollar. The US dollar moves unilaterally against the euro and yen,which are broadly stable against each other. For example, the US dollarmay be in a powerful upswing, whilst the yen–euro rate is on a flat trend.
It is of course easier to distinguish the six possible types of motion in retro-spect than contemporaneously or in a forecast. Indeed some efficientmarket theorists would argue that classification can only be a historic exer-cise – that from the viewpoint of the present there is no basis for expectingan exchange rate to follow a strong trend (a mild trend in line with interestrate differentials would be consistent with the efficient market hypothesis –but this is likely to be swamped by random fluctuations). Retrospective

80 The Yo–Yo Yen
identification involves examining two sets of exchange rate charts at eachcorner of the exchange rate triangle – the euro/US$ and yen/US$ rates atthe US$ corner, the yen/euro and US$/euro rates at the euro corner, andthe yen/euro and yen/US$ rates at the yen corner.
Identification of each type of motion is made as below, with illustrationsdrawn from a complete set of charts (Figures 3.3 to 3.23) for exchange ratehistory since 1973. The euro is put at one corner of the triangle throughouteven though it came into existence only in January 1999. Before then ournotional euro is an accounting unit equal to a fixed amount of Germanmoney – DM 1.95583 – the rate at which the Deutsche mark was convertedinto euros at the start of EMU:
Solo yen (identified in the charts by line segments with the number one). At theUS$ corner, the yen/US$ rate moves substantially whilst the euro/US$ rateremains broadly flat. At the euro-corner, the yen/euro rate moves substan-tially, whilst the US$/euro rate is broadly flat. At the yen corner, theyen/euro and yen/US$ rates move closely in parallel. For example, in thefirst half of 1998, the yen was falling sharply whilst the DM was broadlystable against the US dollar. Consistent with solo yen motion within theUS dollar–euro–yen triangle at the US$ corner (Fig. 3.22), the yen/dollarrate is rising steeply whilst the euro(DM)/US$ rate is flat; at the euro corner(Fig. 3.21) the yen/euro rate rises sharply whilst the US$/euro rate is flat; atthe yen corner (Fig. 3.23) both the yen/US$ and the yen/euro rates arerising sharply. The economic story behind the solo fall of the yen in early1998 was the deep recession in Japan coupled with widespread concernabout the stability of its banking system and the contraction of many Asianeconomies following the previous autumn’s financial crisis.
Yen–Dollar axis (identified in the charts by line segments with the number two).Dominance of this axis is seen most clearly at the euro corner, where theyen/euro and US$/euro rates move in opposite directions. At the yen corner,both the yen/US$ and yen/euro rates move in the same direction (theyen/US$ rate movement is sharper). At the US$ corner, both the yen/US$and the euro/US$ rates move in the same direction (the yen/US$ movementis sharper than the euro/US$). For example in spring 1996 the dollar wasgenerally strong and the yen generally weak, with the euro in-between. Atthe euro corner (Fig. 3.18), the yen/euro rate is rising, whilst the US$/eurorate is falling; at the US$ corner (Fig. 3.19), both the euro/US$ and yen/US$rates are rising (the yen/US$ rate by more than the euro/US$ rate); at theJapanese yen corner (Fig. 3.20), the yen/US$ and yen/euro rates are rising(the yen/US$ rate by more than the yen/euro rate). The economic storybehind the yen–dollar axis in spring 1996 was the US economy entering astrong upturn coupled with a rising momentum of capital outflow fromJapan (including the growing popularity of the so-called carry tradewhereby borrowers worldwide financed themselves in low-interest rate yen).
Yen–Euro axis (identified in the charts by line segments with the number three).Dominance of this axis is seen most clearly at the US dollar corner, where

81
Figu
re 3
.3Eu
ro c
orn
er, 1
973–
7
0O
vera
ll st
abili
ty*
1S
olo
Yen
2U
SD
–Yen
axi
s do
min
ates
3Y
en–E
uro
axis
dom
inat
es
4S
olo
Eur
o
5U
SD
–Eur
o ax
is d
omin
ates
6S
olo
US
D
Key
to c
urre
ncy
corn
er c
hart
s
* No
tren
d in
an
y of
th
e th
ree
corn
ers
of th
e tr
iang
le.

82
Figu
re 3
.4U
SD c
orn
er, 1
973–
7
0O
vera
ll st
abili
ty*
1S
olo
Yen
2U
SD
–Yen
axi
s do
min
ates
3Y
en–E
uro
axis
dom
inat
es
4S
olo
Eur
o
5U
SD
–Eur
o ax
is d
omin
ates
6S
olo
US
D
Key
to c
urre
ncy
corn
er c
hart
s
* No
tren
d in
an
y of
th
e th
ree
corn
ers
of th
e tr
iang
le.

83
Figu
re 3
.5JP
Y c
orn
er, 1
973–
7
0O
vera
ll st
abili
ty*
1S
olo
Yen
2U
SD
–Yen
axi
s do
min
ates
3Y
en–E
uro
axis
dom
inat
es
4S
olo
Eur
o
5U
SD
–Eur
o ax
is d
omin
ates
6S
olo
US
D
Key
to c
urre
ncy
corn
er c
hart
s
* No
tren
d in
an
y of
th
e th
ree
corn
ers
of th
e tr
iang
le.

84
Figu
re 3
.6Eu
ro c
orn
er, 1
978–
81
0O
vera
ll st
abili
ty*
1S
olo
Yen
2U
SD
–Yen
axi
s do
min
ates
3Y
en–E
uro
axis
dom
inat
es
4S
olo
Eur
o
5U
SD
–Eur
o ax
is d
omin
ates
6S
olo
US
D
Key
to c
urre
ncy
corn
er c
hart
s
* No
tren
d in
an
y of
th
e th
ree
corn
ers
of th
e tr
iang
le.

85
Figu
re 3
.7U
SD c
orn
er, 1
978–
81
0O
vera
ll st
abili
ty*
1S
olo
Yen
2U
SD
–Yen
axi
s do
min
ates
3Y
en–E
uro
axis
dom
inat
es
4S
olo
Eur
o
5U
SD
–Eur
o ax
is d
omin
ates
6S
olo
US
D
Key
to c
urre
ncy
corn
er c
hart
s
* No
tren
d in
an
y of
th
e th
ree
corn
ers
of th
e tr
iang
le.

86
Figu
re 3
.8JP
Y c
orn
er, 1
978–
81
0O
vera
ll st
abili
ty*
1S
olo
Yen
2U
SD
–Yen
axi
s do
min
ates
3Y
en–E
uro
axis
dom
inat
es
4S
olo
Eur
o
5U
SD
–Eur
o ax
is d
omin
ates
6S
olo
US
D
Key
to c
urre
ncy
corn
er c
hart
s
* No
tren
d in
an
y of
th
e th
ree
corn
ers
of th
e tr
iang
le.

87
Figu
re 3
.9Eu
ro c
orn
er, 1
982–
5
0O
vera
ll st
abili
ty*
1S
olo
Yen
2U
SD
–Yen
axi
s do
min
ates
3Y
en–E
uro
axis
dom
inat
es
4S
olo
Eur
o
5U
SD
–Eur
o ax
is d
omin
ates
6S
olo
US
D
Key
to c
urre
ncy
corn
er c
hart
s
* No
tren
d in
an
y of
th
e th
ree
corn
ers
of th
e tr
iang
le.

88
Figu
re 3
.10
USD
co
rner
, 198
2–5
0O
vera
ll st
abili
ty*
1S
olo
Yen
2U
SD
–Yen
axi
s do
min
ates
3Y
en–E
uro
axis
dom
inat
es
4S
olo
Eur
o
5U
SD
–Eur
o ax
is d
omin
ates
6S
olo
US
D
Key
to c
urre
ncy
corn
er c
hart
s
* No
tren
d in
an
y of
th
e th
ree
corn
ers
of th
e tr
iang
le.

89
Figu
re 3
.11
JPY
co
rner
, 198
2–5
0O
vera
ll st
abili
ty*
1S
olo
Yen
2U
SD
–Yen
axi
s do
min
ates
3Y
en–E
uro
axis
dom
inat
es
4S
olo
Eur
o
5U
SD
–Eur
o ax
is d
omin
ates
6S
olo
US
D
Key
to c
urre
ncy
corn
er c
hart
s
* No
tren
d in
an
y of
th
e th
ree
corn
ers
of th
e tr
iang
le.

90
Figu
re 3
.12
Euro
co
rner
, 198
6–90
0O
vera
ll st
abili
ty*
1S
olo
Yen
2U
SD
–Yen
axi
s do
min
ates
3Y
en–E
uro
axis
dom
inat
es
4S
olo
Eur
o
5U
SD
–Eur
o ax
is d
omin
ates
6S
olo
US
D
Key
to c
urre
ncy
corn
er c
hart
s
* No
tren
d in
an
y of
th
e th
ree
corn
ers
of th
e tr
iang
le.

91
Figu
re 3
.13
USD
co
rner
, 198
6–90
0O
vera
ll st
abili
ty*
1S
olo
Yen
2U
SD
–Yen
axi
s do
min
ates
3Y
en–E
uro
axis
dom
inat
es
4S
olo
Eur
o
5U
SD
–Eur
o ax
is d
omin
ates
6S
olo
US
D
Key
to c
urre
ncy
corn
er c
hart
s
* No
tren
d in
an
y of
th
e th
ree
corn
ers
of th
e tr
iang
le.

92
Figu
re 3
.14
JPY
co
rner
, 198
6–90
0O
vera
ll st
abili
ty*
1S
olo
Yen
2U
SD
–Yen
axi
s do
min
ates
3Y
en–E
uro
axis
dom
inat
es
4S
olo
Eur
o
5U
SD
–Eur
o ax
is d
omin
ates
6S
olo
US
D
Key
to c
urre
ncy
corn
er c
hart
s
* No
tren
d in
an
y of
th
e th
ree
corn
ers
of th
e tr
iang
le.

93
Figu
re 3
.15
Euro
co
rner
, 199
1–4
0O
vera
ll st
abili
ty*
1S
olo
Yen
2U
SD
–Yen
axi
s do
min
ates
3Y
en–E
uro
axis
dom
inat
es
4S
olo
Eur
o
5U
SD
–Eur
o ax
is d
omin
ates
6S
olo
US
D
Key
to c
urre
ncy
corn
er c
hart
s
* No
tren
d in
an
y of
th
e th
ree
corn
ers
of th
e tr
iang
le.

94
Figu
re 3
.16
USD
co
rner
, 199
1–4
0O
vera
ll st
abili
ty*
1S
olo
Yen
2U
SD
–Yen
axi
s do
min
ates
3Y
en–E
uro
axis
dom
inat
es
4S
olo
Eur
o
5U
SD
–Eur
o ax
is d
omin
ates
6S
olo
US
D
Key
to c
urre
ncy
corn
er c
hart
s
* No
tren
d in
an
y of
th
e th
ree
corn
ers
of th
e tr
iang
le.

95
Figu
re 3
.17
JPY
co
rner
, 199
1–4
0O
vera
ll st
abili
ty*
1S
olo
Yen
2U
SD
–Yen
axi
s do
min
ates
3Y
en–E
uro
axis
dom
inat
es
4S
olo
Eur
o
5U
SD
–Eur
o ax
is d
omin
ates
6S
olo
US
D
Key
to c
urre
ncy
corn
er c
hart
s
* No
tren
d in
an
y of
th
e th
ree
corn
ers
of th
e tr
iang
le.

96
Figu
re 3
.18
Euro
co
rner
, 199
5–7
0O
vera
ll st
abili
ty*
1S
olo
Yen
2U
SD
–Yen
axi
s do
min
ates
3Y
en–E
uro
axis
dom
inat
es
4S
olo
Eur
o
5U
SD
–Eur
o ax
is d
omin
ates
6S
olo
US
D
Key
to c
urre
ncy
corn
er c
hart
s
* No
tren
d in
an
y of
th
e th
ree
corn
ers
of th
e tr
iang
le.

97
Figu
re 3
.19
USD
co
rner
, 199
5–7
0O
vera
ll st
abili
ty*
1S
olo
Yen
2U
SD
–Yen
axi
s do
min
ates
3Y
en–E
uro
axis
dom
inat
es
4S
olo
Eur
o
5U
SD
–Eur
o ax
is d
omin
ates
6S
olo
US
D
Key
to c
urre
ncy
corn
er c
hart
s
* No
tren
d in
an
y of
th
e th
ree
corn
ers
of th
e tr
iang
le.

98
Figu
re 3
.20
JPY
co
rner
, 199
5–7
0O
vera
ll st
abili
ty*
1S
olo
Yen
2U
SD
–Yen
axi
s do
min
ates
3Y
en–E
uro
axis
dom
inat
es
4S
olo
Eur
o
5U
SD
–Eur
o ax
is d
omin
ates
6S
olo
US
D
Key
to c
urre
ncy
corn
er c
hart
s
* No
tren
d in
an
y of
th
e th
ree
corn
ers
of th
e tr
iang
le.

99
1.4
1.3
1.2
1.1
1.0
0.9
0.8
US
D/E
UR
O(R
HS
)
Figu
re 3
.21
Euro
co
rner
, 199
8–20
01
0O
vera
ll st
abili
ty*
1S
olo
Yen
2U
SD
–Yen
axi
s do
min
ates
3Y
en–E
uro
axis
dom
inat
es
4S
olo
Eur
o
5U
SD
–Eur
o ax
is d
omin
ates
6S
olo
US
D
Key
to c
urre
ncy
corn
er c
hart
s
* No
tren
d in
an
y of
th
e th
ree
corn
ers
of th
e tr
iang
le.

100
Figu
re 3
.22
USD
co
rner
, 199
8–20
01
0O
vera
ll st
abili
ty*
1S
olo
Yen
2U
SD
–Yen
axi
s do
min
ates
3Y
en–E
uro
axis
dom
inat
es
4S
olo
Eur
o
5U
SD
–Eur
o ax
is d
omin
ates
6S
olo
US
D
Key
to c
urre
ncy
corn
er c
hart
s
* No
tren
d in
an
y of
th
e th
ree
corn
ers
of th
e tr
iang
le.

101
Figu
re 3
.23
JPY
co
rner
, 199
8–20
01
JPY
/US
DJP
Y/E
UR
O
160
150
140
130
120
110
100 90 Ja
n 98
Jul 9
8Ja
n 99
Jul 9
9Ja
n 00
Jul 0
0Ja
n 01
Jul 0
1
11
65
22
11
13
66
45
53
32
0O
vera
ll st
abili
ty*
1S
olo
Yen
2U
SD
–Yen
axi
s do
min
ates
3Y
en–E
uro
axis
dom
inat
es
4S
olo
Eur
o
5U
SD
–Eur
o ax
is d
omin
ates
6S
olo
US
D
Key
to c
urre
ncy
corn
er c
hart
s
* No
tren
d in
an
y of
th
e th
ree
corn
ers
of th
e tr
iang
le.

102 The Yo–Yo Yen
the yen/US$ and euro/US$ rates move in opposite directions. At the yencorner, the yen/US$ and yen/euro rates move in the same direction (theyen/euro rate move is sharper than for the yen/US$). At the euro corner,the yen/euro and US$/euro rates move in the same direction (the yen/eurorate move is greater than for the US$/euro). For example, in autumn 2000the yen was generally weak whilst the euro was staging a recovery from along spell of crisis. At the US dollar corner (Fig. 3.22), the euro/US$ rate isfalling whilst the yen/US$ rate is rising; at the euro corner (Fig. 3.21), theyen/euro and US$/euro rates are both rising, the yen by more than the USdollar; at the yen corner (Figure 3.23), the yen/euro and yen/US$ rates areboth rising, the euro rate by more than the dollar rate (of the yen). The eco-nomic story behind the yen–euro axis in late 2000 was the sudden realisa-tion that the US economy had slowed sharply, with a spill-over to the Asianeconomies, coupled to a rising tide of capital outflow from Japan as eco-nomic optimism there faded and the arrival of the Bush Administration inWashington alleviated any fear of the yen becoming a football in trade con-frontation between the world’s top two economies (even before cominginto office, senior Bush officials made clear that Washington would notlecture Tokyo on economic policy).
Solo euro (identified in the charts by line segments with the number four). Atthe US$ corner, the euro/US$ rate moves substantially, whilst the yen/US$rate is broadly flat. At the yen corner, the yen/euro rate moves substan-tially, whilst the yen/US$ rate is broadly flat. At the euro corner, theyen/euro and US$/euro rates move closely in parallel. For example insummer 2000, the euro rebounded then sank deeply again (by more thanthe rebound), whilst the Japanese yen was broadly unchanged against theUS dollar. Consistent with solo euro motion within the US dollar–euro–yentriangle, at the US$ corner (Figure 3.22) the euro/US$ rate is fallingthen rising sharply, whilst the yen/US$ rate is flat; at the yen corner (Figure 3.23), the yen/euro rate rises then falls sharply, whilst at the eurocorner (Figure 3.21) the yen/euro and US$/euro rates move closely in paral-lel (rising and then falling together). The economic story behind the soloride of the euro in summer 2000 was, firstly, expectations of serious mone-tary tightening by the European Central Bank in response to rising inflationrisks and, secondly, disappointment of those expectations.
Dollar–Euro axis (identified in the charts by line segments with the numberfive). Dominance of this axis is seen most clearly at the yen corner, wherethe yen/US$ and yen/euro rates move in opposite directions. At the US$corner, both the euro/US$ and yen/US$ rates move in the same direction(the euro to a greater extent than the yen against the dollar). At the eurocorner, both the US$/euro and yen/euro rates move in the same direction(the US$ to a greater extent than the yen against the euro). For example inwinter 1998/9 (and into) early spring 1999, the dollar was generally strongand the euro generally weak, with the yen in-between. At the yen corner

Who Pulls the String of the Yo–Yo Yen? 103
(Figure 3.23), the yen/US$ rate is rising whilst the yen/euro rate is falling.At the US$ corner (Figure 3.22), the yen/US$ and euro/US$ rates are rising,but the latter by more than the former. At the euro corner (Figure 3.21), theUS$/euro and yen/euro rates are falling, but the US dollar by more than theyen rate of the euro. The economic story behind the dollar–euro axis inearly 1999 was the unexpected booming of the US economy (despite thefinancial crisis of late 1998) and the sudden slowing of European growthtogether with disillusionment regarding European Monetary Union.
Solo US dollar (identified in the charts by line segment six). At the eurocorner, the US$/euro rate moves substantially whilst the yen/euro rate isbroadly flat. At the yen corner, the yen/US$ rate moves substantially whilstthe yen/euro rate is broadly flat. At the US dollar corner, the yen/US$ andeuro/US$ rates move closely in parallel. For example, in early winter 2000/1there was a solo rise of the dollar. At the euro corner (Figure 3.21), theUS$/euro rate falls sharply, whilst the yen/euro rate is broadly flat. At theyen corner (Figure 3.23), the yen/US$ rate rises sharply whilst the yen/eurorate is broadly flat. At the US$ corner (Figure 3.22), the euro/US$ rate andthe yen/US$ rate rise closely in parallel. The economic story behind thesolo rise of the dollar at that time was the unexpectedly strong and rapidtransmission of the US economic slowdown (already recognised in lateautumn 2000) to Europe and Japan.
We can say that during all periods when the yen was moving solo or theyen was at one end of a dominant axis (either the yen–US$ axis or theyen–euro axis) the yen was in the limelight in the currency market-place.All such periods are shaded in grey tones in the currency charts. It was notuntil summer 1976 that the yen first moved into the limelight. But sincethen the yen has ‘enjoyed’ considerable prominence (albeit somewhat lessthan the other two major currencies, the US$ and the euro (DM). Length of
Table 3.9 Solo and axis movement in the US$–euro–yen triangle: how frequent?
Duration (mths)Motion
0 1 2 3 4 5 6
1973–81 9 9 16 24 14 21 151982–90 0 8 29 5 13 33 201991–00* 0 15 21 8 19 37 8Total 9 32 66 37 46 91 43
Episodes1973–81 1 3 4 3 4 4 31982–90 0 3 8 2 3 6 31991–00* 0 7 9 5 7 10 5Total 1 13 21 10 14 20 11

104 The Yo–Yo Yen
Table 3.10 US$, euro and yen: how long has each been inthe limelight?
Duration (mths)Currency
Yen USD euro
1973–81 49 52 591982–90 42 82 511991–00* 44 66 64Total 135 200 174
Episodes1973–81 10 11 111982–90 13 17 111991–00* 21 23 22Total 44 51 44
*Data multiplied by 9/10 to equalise time periods
time and frequency of each major currency in the limelight are summarisedin Tables 3.9 and 3.10.
Over the period 1973–2000 as a whole, the yen has been in the limelightaround 42 per cent of the time (solo yen, yen–dollar axis dominant, oryen–euro(DM) axis dominant). In the decade 1991–2000 the yen wasslightly less in the limelight than in the years 1973–81, but similar to1982–90. Though the 1990s were a time of exceptional yen volatility (as weshall see in the next two chapters), there was plenty happening to theother major currencies. The yen has never been the most in the limelightin any of the sub-periods (1973–81, 1982–90, or 1991–2000) as a whole.
The euro has been in the limelight 54 per cent of the time during thewhole period 1973–2000 (solo euro(DM) , euro(DM)–dollar axis dominant,or yen–euro(DM) axis dominant). It was in the decade of 1991–2000 thatthe euro was most in the limelight, almost as much as the US dollar – hardlysurprising given that the decade started with German unification andended with European Monetary Union. (Note that the percentage of timethat each currency is in the limelight adds up to more than 100 per centbecause two currencies – but not three! – can be in the limelight at thesame time.)
The US dollar has been in the limelight more than the other two curren-cies at almost 60 per cent of the time for the total period 1973–2000. Thatis consistent with the premier position of the US economy and the oftenasymmetric influence of events there on Japan and Europe. It was duringthe years 1982–90 that the dollar was most in the limelight (around 76 per

Who Pulls the String of the Yo–Yo Yen? 105
cent of the time) – hardly surprising given that this period included theGreat Dollar Bubble of 1983–5 and its subsequent bursting.
Around 25 per cent of the time in the limelight for each of the curren-cies during the whole period 1973–2000 has been as a solo-mover – therest of the time has been in combination with another currency withboth at the opposite ends of the dominant axis. But time out of the lime-light corresponds more often to a period of solo motion by one of thetwo other currencies than to axis motion (where each of the other twoare at opposite ends of the axis). As an example, when the dollar is out ofthe limelight, it is more frequently coupled with yen or euro solomotion, rather than dominance of the yen–euro axis. In total, solomotion (by the US dollar, euro, or yen) accounts for just less than 40 percent of the total time (over the years 1973–2000 as a whole). The eurohas been in solo motion for around 16 per cent of the total period, whilethe US dollar has been the solo-star for 13 per cent and the yen foraround 11 per cent.
Amongst the three types of axis dominance, the most common (in termsof cumulative duration over the period 1973–2000 as a whole) is theeuro(DM)–US$ axis (motion 5) (26 per cent of the total time), followed bythe yen–US$ axis (motion 2) (19 per cent). The least common is theeuro(DM)–yen axis (motion 3) (12 per cent). In overall terms, euro(DM)–US$axis dominance is the most common form of any type of motion (solo oraxis) in the US$–euro–yen triangle, followed by yen-US$ axis dominance.Solo motion by either the euro or US dollar, or yen–euro axis dominance areall of about equal total duration (measured over the whole period). The leastcommon type of motion is solo yen.
Many of the episodes of particular types of currency motion are quiteshort-lived. In any historical account it is the long or acute episodes whichare the most interesting to examine. In terms of the history of the yen, forthe years already covered in this volume (1973–88), such episodes includethe following:
Early spring 1977 to late autumn 1977: yen–dollar axis dominant (see Figures3.3, 3.4, and 3.5). The US dollar was generally weak as the CarterAdministration pressed Japan and Europe to take reflationary action, the US current account balance swung into large deficit and the Federal Reserve underestimated the building inflation momentum. The yen wassubject to greater upward pressure than the DM since US criticism ofJapanese policy was particularly sharp, Japanese export growth was par-ticularly strong, and the yen was beginning to encounter strong demand as an international investment (especially from OPEC nations) whilstforeign borrowing of yen remained restricted (as did Japanese capitaloutflows).
Late 1978 to late 1979: yen–euro axis dominant (see Figures 3.6, 3.7 and3.8). This period encompassed the second oil shock (following the Iranian
106 The Yo–Yo Yen
Revolution) and the US imposition of an asset freeze on Iran, which stimu-lated a shift of international funds into the DM from the US dollar. Thejump in world oil prices and increasing risk of US recession went alongwith downward pressure on the yen. Thus the underlying trend was astrong mark and weak yen with the US dollar in between.
Summer and autumn 1980: yen–euro axis dominant (see Figures 3.6, 3.7 and3.8). As the US economy bounced back unexpectedly from the recession ofearly 1980 and the outlook for the Japanese economy improved, the yenrose sharply whilst the DM fell back, and the dollar moved in-between thetwo. Also buoying the yen was a big improvement in Japan’s export perfor-mance (gaining from the steep depreciation over the previous year).
Winter 1981/2 until autumn 1982 (inclusive): yen–dollar axis dominant (seeFigures 3.9, 3.10 and 3.11). This period includes the severe recession of late1981 until third quarter 1982 and the dawning of the subsequent long USeconomic expansion. The dollar–mark rate followed the interest rate lead –with the dollar rising as rate spreads in favour of the dollar widened despitethe progress of recession (US interest rates reached exceptionally high levelsas the Volcker Federal Reserve acted resolutely to squeeze inflation out ofthe system), and then turning downwards (in autumn 1982) as the LatinAmerican debt crisis and falling US inflation triggered Federal Reserveeasing. The yen swung by a greater amplitude than the DM against thedollar – falling sharply as US recession first emerged (mirroring pessimismon Japanese exports and a falling Tokyo equity market) and then risingsharply with recovery prospects (optimism on US exports and a surge offoreign demand for Japanese equities).
Early autumn 1985: Plaza Accord shock: yen–dollar axis dominant (seeFigures 3.9, 3.10 and 3.11). The dollar bubble of the early/mid-1980s started toburst at the beginning of 1985. But at first it was the DM rather than the yenthat led the bounce-back (against the dollar). Then in early autumn came thesudden change in exchange rate policy by the Reagan Administration (awayfrom benign neglect to pushing the dollar down so as to diffuse growingprotectionist pressure in Congress), signalled by the so-called Plaza Accord.Although, in principle, the agreement at Plaza was multilateral between allG-7 Finance Ministers, the focus of US policy was on obtaining an appre-ciation of the yen. That is what happened in the immediate aftermath as theBank of Japan tightened monetary policy to accompany yen purchases (anddollar sales) in the foreign exchange markets.
Spring 1986: yen–dollar axis dominant (see Figures 3.12, 3.13 and 3.14).This was a period of continuing dollar weakness, but unlike that of late1985 and early 1986 when the dollar was declining at an equal pace againstboth the DM and yen, the fall now quickened against the yen (relative tothe DM). The powerful economic expansion in Japan, which was eventu-ally to culminate in the bubble of 1988–90, had already taken root and thiswas reflected in the currency markets.

Who Pulls the String of the Yo–Yo Yen? 107
Early spring 1987: yen solo (see Figures 3.12, 3.13 and 3.14). At the LouvreAccord in early 1987 the G-7 Finance Ministers agreed to stabilise the dollarafter its period of sharp fall in the previous two years. Stabilisation wassomewhat more successful with respect to the DM/US$ rate than theyen/US$ rate against background speculation about the Federal Reservepursuing a somewhat tighter-than-otherwise policy so as to prevent a newdecline of the dollar. The DM had tended to stabilise already in late 1986and early 1987 without G-7 intervention.
The US dollar–euro–yen triangle: why dominant?
There are six main independently floating currencies in the contemporaryworld (ranked in order of country or area economic size) – US dollar, euro,Japanese yen, British pound, Canadian dollar and Swiss franc. Why in thecurrency geography just outlined is the Japanese yen fitted into a trianglewith the US dollar and euro, rather than all six currencies being mapped asa hexagon or as a complex set of intersecting triangles? The common senseanswer is that the dollar, euro, and yen are so much larger in economic sizethan the other three currencies. Geography of trade patterns and financialflows also play a role. These influences can be demonstrated as buttresses ofthe dominant triangle by looking at the British pound and Swiss franc inparticular.
First take the British pound. It makes no sense to consider a quadrilateraljoining the US dollar, euro, yen and pound. The exchange rate between thepound and the US dollar or the pound and the euro is not in anysignificant way affected by events in Japan. And the exchange ratesbetween the non-pound currencies (for example, US$–euro, US$–yen, andyen–euro) are not significantly influenced by events in the UK. It is usefulto join currencies together into a geometric shape only if there is mutualinterdependence between the currencies at each corner.
For example, in the US dollar–euro–yen triangle already described, anygiven exchange rate can be influenced by the currency not forming part ofthat particular pair. Illustratively, the yen–euro rate can be affected by a USshock – for example, an unexpected recession in the US economy oftensends the yen down and the euro up (on the basis of Japan’s especially highexposure to US economic risks). The dollar–euro rate can be influenced by,for example, a change in the direction of Japanese portfolio capital flows.Liquidation of euro-assets by Japanese insurance companies during muchof 1999 and 2000 (scared by growing losses on huge purchases made in late1998 ahead of the launch of the euro) were a factor in the weakness of theeuro against the dollar. The strong demand for dollar assets from Tokyo inearly 2001 helped to limit the weakness of the dollar against the euro inthe face of a surprise downturn of the US economy and aggressive easing of

108 The Yo–Yo Yen
Federal Reserve policy. The yen–US dollar rate can be sensitive to Europeanevents. For example, an economic boom in the euro-area might push theeuro up against the US dollar (as the current of capital flows across theAtlantic moved in the European direction) by more than against theJapanese yen (as Japanese capital flow to Europe was affected to a lesserextent than trans-Atlantic flows by the euro-area boom; a euro-area boommight also boost Japanese export prospects more than US in relation toeconomic size and this would be reflected in an upward move of the yenagainst the dollar).
A triangle formed out of the British pound, euro, and US dollar at each ofits respective corners would not make much economic sense either. Theeuro–US dollar rate is not sensitive to events in the UK. And thoughmotion could be distinguished in analogous fashion to in thedollar–yen–euro triangle, the categories would in most cases not be mean-ingful without redefinition. Some types of motion, though possible in prin-ciple, would not occur in practice. For example, solo US dollar movement(dollar moving whilst pound–euro rate unchanged) would be betterdescribed as the pound being a satellite of the euro. (The dollar is not inpractice moving on its own unless the yen–euro rate is steady also; if,rather, the dollar–yen rate is steady, it is misleading to describe the dollar asmoving unilaterally, given the importance of financial and trade linksbetween Japan and the USA.) Similarly, solo euro movement (euro movingwhilst the dollar–pound rate remains unchanged) would be better describedas the pound being a satellite of the dollar. (The small size of the UKeconomy relative to that of the US or euro-area makes the description‘satellite’ appropriate. By contrast in the case of the yen, for example, whenmoving together with the US dollar, it would be inappropriate to describethe yen as a satellite, given that the Japanese economy is over 30 per centof the size of the US economy.)
The pound can move in a solo fashion (when it fluctuates sharply whilstthe euro–US$ rate is broadly stable). But in practice solo movement is muchrarer for the pound within the ‘pseudo’ exchange rate triangle formed fromthe euro, US dollar, and pound, than for any of the currencies within theeuro–US dollar–yen triangle since the UK is a small open economy highlyinterdependent with the euro-area and the USA (the degree of interdepen-dence with each varies over time – sometimes the UK economy is in asimilar business cycle to that of the USA and at other times to that of theeuro-area). In the late 1990s periods of solo movement for the poundusually corresponded to short-lived bursts of speculation as to whether theUK might become a member of the European Monetary Union.
Axis dominance within the ‘pseudo’ US dollar–euro–pound triangle isfairly frequent with the pound moving between the US dollar and euro (upagainst one and down against the other). It is not very helpful however todescribe this as euro–US dollar axis dominance as it may well be a time

Who Pulls the String of the Yo–Yo Yen? 109
when that same axis is not dominant in the real US dollar–euro–pound tri-angle. The frequency of the pound’s in-between movement (with respect tothe dollar and euro) can be explained by the almost equal importance ofdollar-related economies and the euro-area in the UK’s trade, and thealmost equal degree of interdependence on average over time of the UKeconomy with the euro-area and dollar-related economies (of which themost important, of course, is the US).
Other types of in-between motion within the US dollar–euro–pound tri-angle rarely occur in practice and would not correspond to any economicstory. For example, for the pound to be at an opposite end of a pole to theeuro (with the US dollar ‘in between’) or to the US dollar (with the euro ‘inbetween’) would require a powerful countering of the forces which tend toput the pound in-between. And it is not possible to put forward a plausibleeconomic hypothesis under which the same factor responsible for puttingthe pound at the opposite end of the pole to say the dollar (euro) was alsoresponsible for putting the euro (dollar) in-between. The UK economy istoo small relative to the size of the euro-area or US economy to exertsignificant influence on them (or their currencies).
If the pound were indeed mostly between the dollar and euro then itcould be described as rotating around a dollar–euro axis. And if further thepound tended to be closer in its in-between motion to the dollar than tothe euro (fluctuations against the dollar less than against the euro in theopposite direction) – and periods of satellite behaviour to the dollar were itsnext most usual form of motion (with satellite behaviour to the euro orsolo motion being quite rare) – then it could be described as part of thedollar zone or even as a dollar currency. Membership of the euro-zone canbe defined in analogous fashion (most of the time the pound would beeither in-between the dollar and euro but closer to the euro or satellite tothe euro with hardly any solo-behaviour evident). In practice, during theyears 1995–2000 (see Figure 3.24), the pound could be described as amember of the dollar zone, with most of the period being characterisedeither by the pound behaving as a dollar satellite or moving in-between theeuro and dollar but closer to the dollar than the euro.
Could the yen be described in any sense as rotating around a dollar–euroaxis albeit in a wide orbit or as an outer member of the dollar zone? In theearly and mid-1970s it was just about possible to hypothesise such a geo-graphical position for the yen. But subsequent history has provided strongevidence against the validity of that description. It is true that within theUS dollar–euro–yen triangle the total length of periods of euro–US$ axisdominance (yen between euro and US dollar) since 1973 (to 2000) has beengreater than of yen–US$ axis dominance (euro in between) but only mod-estly so (91 months versus 66 months out a total period of 324 months)(Table 3.9). And the considerable length of the total periods during whichthe US dollar has been in-between the euro and Japanese yen or during

110
Figu
re 3
.24
Ster
lin
g, 1
995–
2001
1S
olo
mov
e by
£
2£
in-b
etw
een
US
D a
nd E
uro
3£
sate
llite
to U
SD
4£
sate
llite
to E
uro

Who Pulls the String of the Yo–Yo Yen? 111
which the yen itself has been in solo motion jars with the description ofthe yen normally rotating around a dollar–euro axis or as an outer memberof the dollar zone.
The same type of distinction can be made between a pseudo and real tri-angle in the case of the Swiss franc–euro–US dollar relationship.Interdependence does not exist between each corner, in the sense thatevents in Switzerland are not, in general, capable of having a significantinfluence on the euro–dollar exchange rate. (Very occasionally there havebeen instances of a Swiss event being the initial trigger to a more generalmove in the currency markets affecting the DM or euro against the USdollar – for example a tightening of monetary policy by the Swiss NationalBank might be seen as the beginning of a general rise of European interestrates, bolstering the DM (or euro) versus the dollar; but these instances areof very short duration, and depend on Swiss events being a lead indicatorof euro-area developments. It is the latter which are crucial to the initialmovement of the euro–US$ rate in response to Swiss news being sustained.)
Solo-movement by the Swiss franc has been roughly as frequent as by theBritish pound (but less than for any of the currencies in the USdollar–euro–yen triangle) (Figure 3.25). This may have something to dowith large investment flows relative to economic size in the case ofSwitzerland and because the Swiss franc has certain unique features as arefuge. On the other hand, the Swiss franc has been between the euro andUS dollar less often than the pound has been. This is because Switzerland’strade with the euro-area is much more concentrated than the UK’s.Correspondingly, the Swiss franc has been a satellite of the euro (or pre-viously the DM) for extended periods (meaning that the Swiss franc andeuro move together against the US dollar).
There have been periods of pseudo Swiss franc–US dollar dominance,with the euro (or DM) between – albeit closer to the Swiss franc than theUS dollar (but never periods of pseudo Swiss franc–euro dominance withthe US dollar between – that would indeed be extraordinary given thestrong economic interdependence between the euro-area and Switzerland).The Swiss franc in such periods can be described as highly geared on theeuro, or in the language of modern finance theory as a high-Beta euro. Forexample at a time when there is a worldwide shift of funds out of thedollar, the Swiss franc might gain a disproportionate amount because newdemand (for the franc) is especially large relative to economic size (in thecase of Switzerland); thus the euro would rise, but the Swiss franc wouldrise even more.
The Swiss franc can be described as rotating around the euro–US$ axisbut in an area close to the euro end. Its exact position changes across dif-ferent episodes – sometimes the franc is between the euro and US dollar (as for example on occasions in 1999–2000 when the euro was underintense downward pressure); at other times the franc can be considered as

112
Figu
re 3
.25
Swis
s fr
anc,
199
5–20
01
* Sw
ings
by
mor
e th
an e
uro
agai
nst
US
D, b
ut n
ot a
n in
depe
nden
t mov
e.
1S
olo
mov
e by
SF
2S
F in
-bet
wee
n U
SD
and
Eur
o
3S
F s
atel
lite
to U
SD
4S
F s
atel
lite
to E
uro
5S
F a
s hi
gh b
eta
Eur
o*

Who Pulls the String of the Yo–Yo Yen? 113
an add-on beyond the euro end of the axis (as when behaving as a high-Beta euro or DM). Sometimes (not often) the Swiss franc is doing its ownthing (solo-movement).
Does this description of the Swiss franc or sterling (in terms of their posi-tion with respect to the euro–dollar axis) have a counterpart in the case ofthe yen–dollar? Can we form pseudo triangles between say the Koreanwon, Japanese yen, and US dollar, or the Singapore dollar, yen and USdollar, or the Taiwan dollar, yen, and US dollar? Unlike the British poundand Swiss franc the currencies of these advanced small economies in Asia(South Korea, Singapore, and Taiwan) are not freely floating. Theirexchange rate behaviour depends heavily on policies followed by theirrespective governments (or central banks). In determining the target bandsfor their exchange rates these authorities do pay some attention to the yen(hence when the yen is weak against the dollar they might lower the dollarbands for their currency). It is possible in the case of the Singapore dollarand Taiwan dollar to map out episodes during recent years of to and fromotion between the US dollar and yen, satellite behaviour with respect tothe dollar (and, rarely, with respect to the yen), and occasional solo-behav-iour (notably during the Asian crisis of late 1997) (Figures 3.26 and 3.27).The Korean won, however, does not fit into any obvious relationship to theyen–dollar axis.

114
Figu
re 3
.26
Sin
gap
ore
do
llar
, 199
2–20
01
1S
olo
mov
e by
SG
D
2S
GD
in b
etw
een
US
D a
nd y
en
3S
GD
sat
ellit
e to
US
D
4S
GD
sat
ellit
e to
yen

115
Figu
re 3
.27
Tai
wan
ese
do
llar
, 199
2–20
01
1S
olo
mov
e by
TW
D
2T
WD
in b
etw
een
US
D a
nd y
en
3T
WD
sat
ellit
e to
US
D
4T
WD
sat
ellit
e to
yen
5T
WD
gea
red
on y
en v
s. U
SD

116
4From Bubble Economy to Yen Bubble(1988–93)
It is quite possible to tell the story of the Japanese economy’s Lost Decade(1990s) as one of high speculative drama. Indeed, when recounted withskill, speculative panics and crashes make popular history, as J.K. Galbraith(1975) and C.P. Kindleberger (1977) found out in their respective volumes‘The Great Crash 1929’ and ‘Manias, Panics and Crashes’. Surely, as the dustsettles on the Lost Decade, an exciting historical narrative in the same spiritwill emerge.
The story would start with the fantastic bubble in the equity and realestate markets during 1987–90, continue with the equity market crash of1990 and the long-drawn-out collapse of real estate prices. But that wouldnot be all. There is the bubble of the yen that at its peak in early 1995 wasat a fantastic level of 80 against the US dollar. In turn, the incredible appre-ciation of the yen was a catalyst to the huge direct investment into Asia byJapanese enterprises, the so-called hollowing out of Japanese industry, andin turn a huge speculative bubble in the Asian host countries.
The inevitable bursting of the yen bubble was a key event leading up tothe Asian crisis of summer 1997, as Japanese direct investment in East andSouth East Asia slowed and profits on exports from there (which hadswollen due in part to the competitive advantage bestowed by the super-expensive yen) shrank. When the Asian bubble (summer 1997) burst theJapanese economy was whiplashed (1997–8) by a sharp decline in exportsjust at a time when its banking system was imploding under the weight ofbad debts accumulated as a consequence of the real estate market slumpand deep depression in the construction sector. The Japanese economy slidinto its second major recession of the Lost Decade.
In this recession, monetary policy was largely ineffective, as the years ofthe super-strong yen (1992–5) had helped turn Japan into a land of fallingprices. Nominal interest rates could not fall below zero, and so real interestrates could not reach the negative level suitable for an economy in depres-sion. The best hope for economic revival came from the exchange rate –the continuing slide of the yen providing a stimulus to the export sector.

From Bubble Economy to Yen Bubble (1988–93) 117
The next speculative shock came in autumn 1998, when there was aglobal liquidity crisis in the wake of Russia’s debt default. US hedge fundswhich had been major players in the so-called carry trade (borrowing yento finance holdings of high interest foreign currency assets, mainly in US dollars) suddenly had to unwind their positions. The yen shot upalmost 20 per cent in twenty-four hours – a bizarre event for the currencyof the second largest economy in the world.
But then, amongst all the gloom, suddenly the skies brightened over theJapanese economy. The fantastic bubble developing in the worldwidemarket in hi-tech equities, led by the National Association of SecuritiesDealers Automated Quotations (NASDAQ), pulled the Tokyo equity marketsharply higher, reflecting Japan’s role as a major manufacturer of hardwarefor the so-called new economy. Indeed, Tokyo equities could even havebeen described as being in a new bubble in 1999. Japanese exports alsoexperienced rising demand from another main beneficiary of the neweconomy boom in the US – the Asian ex-tigers and ex-cubs. When theNASDAQ bubble burst in late 2000 the second Tokyo equity market bubble in a decade burst and the Japanese economy slid into a new downturn.
This last cycle of the Japanese economy – slump of late 1997 and 1998,recovery of 1999 and 2000, and downturn of 2001 – all occurred in thecontext of continuing price deflation, which could have been as much as–2 per cent p.a. if full account is taken of falling prices in the neweconomy. The severe deflation is the clue to one major missing ingredientin the attempt to discount Japan’s Lost Decade as a purely speculative epic.Substantial deflation is the result of extraordinary monetary conditions notnecessarily in the present but at some time in the recent past. And forJapan the monetary origins of the deflation can readily be identified in theperiod 1990–5.
The importance of money in explaining the Lost Decade carries us backto a well-known point made by Milton Friedman in the 1960s. The startingpoint of Friedman’s comment is a quote from J.S. Mill, the famous Scottishpolitical economist of the early nineteenth century: ‘There cannot beintrinsically a more insignificant thing, in the economy of society, thanmoney. It is a machine for doing quickly and commodiously, what wouldbe done, though less quickly and commodiously, without it; and like manyother machines it only exerts a distinct and independent influence of itsown when it gets out of order.’ Friedman then comments ‘But money hasone feature that these other machines do not share. Because it is so perva-sive, when it gets out of order it throws a monkey wrench into the opera-tion of all the other machines. The Great Contraction (USA, 1929–33) isthe most dramatic example, but not the only one.’
If the example had been to hand, Milton Friedman would doubtless havecited the Japanese Lost Decade of the 1990s. And in doing so he would

118 The Yo–Yo Yen
have poured cold water on the various bubble hypotheses, just as he wassceptical of explanations attributing the Great Contraction to the WallStreet Crash of 1929. But before considering the 1990s in greater detail, andin particular the specific contribution of the yo–yo yen, it is useful to set afew markers to the discussion.
First, the Lost Decade was not a disaster on anything like the scale of theGreat Contraction. Indeed in the first half of the decade, the average rate ofincrease in GDP per capita in Japan – at around 1.0 per cent p.a. – wasbroadly similar to the US and euro-area (Figure 4.1). It was in the second halfof the 1990s that Japan seriously under-performed, with GDP per capitarising by 1 per cent p.a., compared to 2 per cent p.a. in the EU, and 3 percent p.a. in the USA (Figure 4.2). The lost decade was a series of lost opportu-nities, not a period of actual economic decline.
Second, in an open economy, when the money machine gets out oforder, so does the currency machine. Specifically, serious errors in monetarypolicy are likely to set the stage for currency instability and an associatedimpairment of mechanisms that usually promote stabilising internationalflows of capital. In the case of Japan, extreme tightness of monetary policyin the early 1990s, coupled with a bizarre surge of the yen so inflamed per-ceptions of exchange risk held by Japanese investors that the huge privatesector savings surplus could not flow smoothly into foreign investments.
Figure 4.1 Japan, US and euro-area GDP per capita (real, normalised), 1990–5
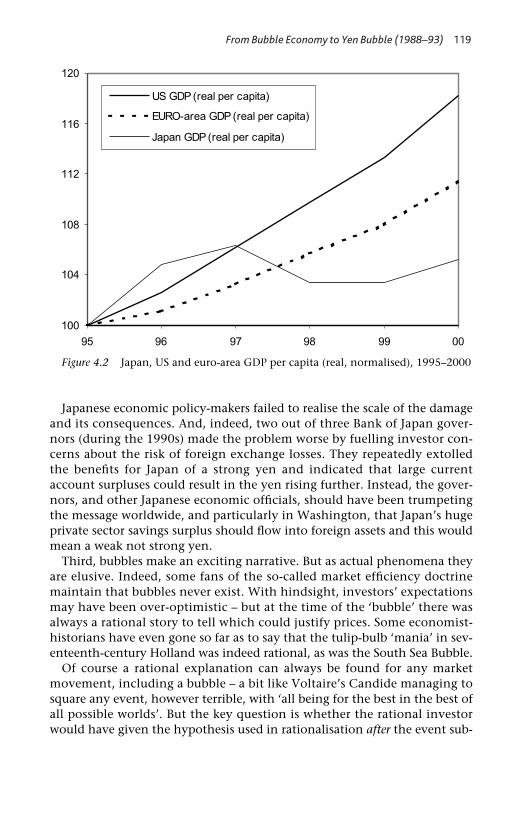
From Bubble Economy to Yen Bubble (1988–93) 119
Figure 4.2 Japan, US and euro-area GDP per capita (real, normalised), 1995–2000
Japanese economic policy-makers failed to realise the scale of the damageand its consequences. And, indeed, two out of three Bank of Japan gover-nors (during the 1990s) made the problem worse by fuelling investor con-cerns about the risk of foreign exchange losses. They repeatedly extolledthe benefits for Japan of a strong yen and indicated that large currentaccount surpluses could result in the yen rising further. Instead, the gover-nors, and other Japanese economic officials, should have been trumpetingthe message worldwide, and particularly in Washington, that Japan’s hugeprivate sector savings surplus should flow into foreign assets and this wouldmean a weak not strong yen.
Third, bubbles make an exciting narrative. But as actual phenomena theyare elusive. Indeed, some fans of the so-called market efficiency doctrinemaintain that bubbles never exist. With hindsight, investors’ expectationsmay have been over-optimistic – but at the time of the ‘bubble’ there wasalways a rational story to tell which could justify prices. Some economist-historians have even gone so far as to say that the tulip-bulb ‘mania’ in sev-enteenth-century Holland was indeed rational, as was the South Sea Bubble.
Of course a rational explanation can always be found for any marketmovement, including a bubble – a bit like Voltaire’s Candide managing tosquare any event, however terrible, with ‘all being for the best in the best ofall possible worlds’. But the key question is whether the rational investorwould have given the hypothesis used in rationalisation after the event sub-

120 The Yo–Yo Yen
stantial significance (indeed approaching certainty) before the event. Forexample, US equity prices in summer 1929, just prior to the Crash, were notexpensive if you believed for certain that the good times of the 1920s wouldcontinue – rapid economic growth and rapid profits growth included,driven by rapid technological change. Similarly, technology shares at theheight of the NASDAQ boom, in early 2000, were not overvalued if youbelieved that the US economic miracle had many more years to run. But inboth cases there were alternative possible scenarios on which a normallycautious investor should surely have put substantial probabilities of occur-rence. Failure of the market to do so implied either a weakness of imagina-tion (inability to assemble from present facts a set of scenarios about thefuture which did indeed span the broad range of future possible realities) orfaulty judgement (faulty estimation of each scenario’s likelihood).
In this chapter, the narrative starts with the Japanese economic boom ofthe late 1980s. This period of Japan’s economic history is now labelled asthe bubble economy. The aim is to trace the links between the bubble and,subsequently, bust in the real-estate and equity markets on the one handand the emerging bubble of the yen on the other. Bank of Japan policy(including statements by its Governor) is a crucial element in the storywhich runs here through to summer 1993. In the next chapter the storycontinues with the bubble of the yen reaching its maximum size in early1995, its subsequent bursting, and the violent fluctuations in the currencymarket which followed during the next half-decade.
Japan’s economic boom, 1988–90: in search of irrational exuberance
In the late 1980s the Japanese economy was in a powerful economicboom (around 6 per cent year-on-year GDP growth through 1988–9).Contemporaries attributed the good times to a number of causes: (i) theeasy monetary policy pursued by the Bank of Japan (which after a fewmonths of higher rates following the Plaza Accord had cut rates sharplyand allowed monetary growth to accelerate as an offset to deflationary pres-sures from the huge jump in the yen); (ii) money and capital market liber-alisation (banks were now free to compete for deposits – meaning theirprofit margins were under pressure and yet at the same time they werelosing their big loan customers to the capital market, and real-estate relatedlending promised to be a cheap and profitable way of expanding theirbalance sheets, and credit growth picked up swiftly); (iii) rapid growth inbusiness investment both in construction and elsewhere in the economywas being fuelled by a low cost of capital in a buoyant equity market;(iv) the ageing of the population and increasing leisure time was inducing abig increase in demand for leisure activities and this presented exciting newinvestment opportunities; and (v) Japanese business management of manu-facturing processes had become the best in the world and increasing capital

From Bubble Economy to Yen Bubble (1988–93) 121
intensity of production was going along with rapid productivity growth.Despite fast economic growth, inflation remained very low, held down inconsiderable part by the huge rise of the yen from 1985–8 so businesseshad no reason to expect an early policy-induced end to boom conditions.
There were a few distant clouds on the horizon, but they might well dis-perse rather than get larger as the economy moved forward. One concernwas the visible amount of speculative activity in real estate and equitymarkets. But this was not the first time that the modern Japanese economywas experiencing a real-estate boom. There had been two episodes of priceexplosion during the miracle years – in 1960–1 and 1973–4 – and then afurther boom in the years around 1980. As regards commercial real estatein the Tokyo area, the nominal price explosion of the late 1980s (measuredcumulatively over the years 1985–90) was smaller than the first (1960–1),comparable to the second (1973–4), and of a larger size than the third(which was dominated by residential real estate). The first explosion wasratified by a subsequent decade of economic miracle. The second explosionwas reversed in real terms by the inflation surge of the mid-1970s. Theexplosion of the late 1980s had a quite different denouement – huge fallsin the price of real estate, rather than economic miracle or high inflation.But that is running ahead of our narrative.
From the viewpoint of the late 1980s, the current boom in Japanese landprices was similar, if not milder, than that which was occurring simultane-ously in the UK or in Scandinavia. Furthermore, there was some basis ineconomic fact for a powerful rise in real-estate prices in Japan at this time.The real-estate boom had started in the greater Tokyo area, particularly incommercial districts, back in 1986 and 1987, a tendency which spread thento residential areas and then to the provinces. The Bank of Japan, in a studypublished in April 1990, put considerable emphasis on the increase in realdemand for land caused by the growing concentration of economic func-tions in the greater Tokyo area (whilst not playing down a variety of specu-lative factors). Commercial rents were rising in line with land prices,indicating the considerable strength of underlying demand for space. Inparticular the hollowing out of the Japanese economy triggered by thehuge appreciation of the yen meant a decrease in the share of industrialproduction and an increased importance for the service sector. This laybehind an increase in demand for commercial space in the big cities. Infact, before the Plaza Accord and the subsequent run-up of the yen,demand for space in Tokyo had been growing rapidly with office space util-isation reaching virtually 100 per cent. The insurance, financial and infor-mation industries were the most aggressive bidders for space.
It was indeed plausible that the real-estate boom would burn itself out. In1988 there was a mini-downturn in Tokyo. Overall price indices for theTokyo real-estate market stalled. In fact there were areas in the suburbs ofTokyo in which land prices after a sharp rise in 1986–7 declined as much as

122 The Yo–Yo Yen
20–30 per cent in 1988. This passing weakness in Tokyo real-estate pricesappeared to be related in part to the Wall Street Crash of October 1987 anda related retrenchment of international financial institutions. It was alsoplausible that the equity market bubble would eventually burst fromwithin. The fantastic valuations could just about be defended by analystswho were 100 per cent certain that the Japanese economy would continueto grow at 6 per cent p.a. with productivity rising at 4–5 per cent p.a. (asrecorded in 1988) (Figure 4.3). But surely there was a substantial likelihoodthat recent strong productivity growth was a cyclical phenomenon – asurge in demand when labour markets are already tight can foster efficiencygains at first until the scope for these are exhausted, after which unit labourcosts rise and profits growth slows. If reality indeed turned out to be worsethan the euphoric consensus would have it, then a big fall would occur inTokyo equity market values.
The idea that speculative bubbles burst of their own accord and thatmonetary policy-makers should largely ignore them, focusing instead onthe overall level of prices for goods and services, has a strong followingamongst monetary economists. Milton Friedman and Anna Schwarz (1963)put forward the doctrine first as one conclusion to their Monetary History ofthe United States. They found that the Federal Reserve of the late 1920stightened monetary conditions excessively out of concern at the amount ofspeculation in the US equity market. In consequence the US economy
–
Figure 4.3 Japan productivity growth, 1985–90

From Bubble Economy to Yen Bubble (1988–93) 123
entered an unusually steep contraction in the third quarter of 1929 – inadvance of the Wall Street Crash.
In the late 1990s, the Federal Reserve under Chairman Greenspan largelyfollowed the advice of Friedman and Schwarz, reformulated in the so-called‘Blinder doctrine’ (ignore the bubble; but when it bursts follow a policy ofaggressive ease as needed to avoid financial crisis). Some critics argue,indeed, that the Greenspan Federal Reserve made the opposite error to theFederal Reserve of the late 1920s. Whilst Alan Greenspan warned of irra-tional exuberance at the beginning of the boom, by the end he and his col-leagues had become cheer-leaders for the new economy. In the late 1980s,the Bank of Japan under Governor Sumita also followed the advice ofFriedman and Schwarz and ignored the bubbles in the land and equitymarkets (tolerance stemmed in part from concern at the huge rise of theyen since the Plaza Accord and the damage that this might inflict on theJapanese economy). Unlike Alan Greenspan, Governor Sumita did notengage in any substantial commentary to either restrain or justify the exu-berance at large. Some window guidance was given to banks with respect toreining back their lending to the property sector, but this was largely cir-cumvented by routing loans via financial subsidiaries. The Bank (operatingin conjunction with the Ministry of Finance, which at that time still had avoice in monetary policy-making) only started to tighten monetary policyin 1989 out of anxiety about incipient inflation pressures.
Before 1989 the inflationary climate was indeed wholly benign, in largepart due to the huge appreciation of the yen through 1985–7, but also tothe surge of productivity in 1988. Even as late as March 1989, there seemedto be no inflation problem, though some concern existed about the possi-ble impact on inflation expectations of a new consumer tax to be intro-duced in April 1989 (and which could push the price level up by as muchas 2 per cent). The Bank of Japan, in a research paper (Special Paper No.174) published in March 1989, described the virtuous circle in the Japaneseeconomy in which rapid growth and price stability were co-existing.Favourable influences cited were the decrease in import costs, a decline inunit labour costs, subdued inflation expectations, and an increase incheaper imports, reflecting structural changes in the economy broughtabout by the appreciation of the yen. Nonetheless, the paper concluded‘pressures will inevitably mount, albeit gradually, which might underminepresent price stability. It is vital to keep a close eye on prices, so that thefoundation of price stability will not be eroded. On the macro-economicpolicy level, the Bank of Japan intends to act promptly and appropriatelyshould it be necessary.’
Inflation did indeed start to rise from spring 1989, but only to a modestextent, especially when the consumption tax effect is excluded (a taxincrease should form no part of core inflation measurement). Measured bythe private consumption deflator, year-on-year inflation in Japan in the

124 The Yo–Yo Yen
final quarter of 1989 (including the consumption tax effect) had increasedto 3 per cent (around 2 per cent without the tax effect?), compared to1.5 per cent at the end of 1988 (Figure 4.4). In 1990–91 the same measureof inflation peaked at just below 3.5 per cent (equivalent to around 3 percent p.a. without a delayed tax effect?). Inflation then fell steeply throughthe recession of 1992/3. An inflation rate reaching around 3 per cent at thepeak of a boom would be acceptable to most central banks following aprice stability target (usually meaning inflation of below 2.5 per cent onaverage over the course of the cycle as a whole). Given the usual lagsbetween monetary policy and its influence on inflation, the Bank of Japancould be criticised for not having tightened policy somewhat sooner (in1988). Earlier monetary tightening would have allowed the Bank to avoidbeing confronted later with the dilemma as to whether it should enter intomonetary overkill (to prevent a wage–price spiral developing) or to sit it outwith a moderate tightening only on the basis of forecasts that inflationwould fall as the economy slowed.
In practice, the Bank of Japan under Governor Sumita did tighten mone-tary policy significantly through 1989, partly in response to the actual risein inflation, and also pre-emptively so as to prevent a further accelerationinto 1990–1. By the time Satoshi Sumita retired in December (1989), callmoney rates had moved up 200bp from the start of the year to around 6per cent. There was a respectable case to be made for arguing that was
–
–
–
Figure 4.4 Japan inflation, 1987–94

From Bubble Economy to Yen Bubble (1988–93) 125
enough, especially as the US economy was slowing sharply (Figure 4.21),and given the considerable possibility that a further deflationary influencecould come at any time from an autonomous bursting of the real-estateand equity market bubbles. True, money supply growth was still rapid, butit had slowed to less than 10 per cent year-on-year (from 12 per cent p.a. inlate 1988) (Figure 4.5). There was also considerable doubt about thesignificance of the data in a period of money market liberalisation (newmoney market certificates which banks could now issue were competingwith other forms of savings outside the monetary aggregates).
Some monetary economists have applied the technical criticism that theso-called Taylor rule suggested considerable further tightening was indeednecessary in 1990 (see McCallum, 1999). But that line of criticism is uncon-vincing. The Taylor rule is not prescriptive. It is an equation that describeshow central banks typically respond (in terms of their setting of short-terminterest rates) to deviations of an economy away from productive potentialand to inflation away from target. There is nothing in the rule about howcentral banks should or do respond to the forming or bursting of assetbubbles or more generally how to take account of possible shifts in thenatural rate of interest (at which savings and investment – including netcapital exports – balance at a level of economic output equal to productivepotential). And application of the rule requires estimates to be made of theeconomy’s productive potential, the average real rate of interest and
–
Figure 4.5 Japan money supply, 1988–94

126 The Yo–Yo Yen
inflation expectations, which in Japan of 1989/90 could hardly be madewith great confidence.
Yasushi Mieno becomes Bank of Japan Governor, December 1989:Makes false diagnosis of yen weakness
At this point a change occurred at the top of the Bank of Japan which wasto prove full of consequence for monetary policy, the yen, and theeconomy. Yasushi Mieno replaced the retiring Satoshi Sumita as Governorof the Bank of Japan. The Economist magazine in a lead article described theoutgoing governor as an ‘urbane Francophile’ who had been an outsider tothe Bank of Japan – a former vice-minister from the Ministry of Finance.The 65-year-old Mieno had joined the Bank in 1947. His father had been abanker in Manchuria before the war from where the family had returnedimpoverished. As a youth he sold soap and lived in a sumo stable – ‘fewjobs are more humbling than serving vats of sukiyaki and playing valet tosumo wrestlers’ – to work his way through high school, then went on tothe elite Tokyo University.
Yasushi Mieno’s career at the Bank of Japan had taken him through theranks and upwards to the positions of head of the personnel department,the general affairs department, and the business bureau, and during theprevious five years he had been deputy governor to Sumita. From 1958 to1960 he had worked in New York. In 1965 he had played a key role withinthe Bank in the rescue of Yamaichi Securities. In the 1970s he had been apersonal aide to Governor Tadashi Sasaki, a Bank of Japan careerist deridedfor buckling under pressure from one of Japan’s most powerful post-warprime ministers, Kakuei Tanaka, and thereby bearing responsibility for theinflation surge of the mid-1970s. After the Plaza Accord he had played animportant technical part in effecting the foreign exchange market interven-tion aimed at driving down the dollar. The Nihon Keizai Shimbun com-mented that the new governor had attended many international meetingsand made friends with overseas financial officials. The newspaper contin-ued, ‘Mieno often goes to art museums, and enjoys shopping with his wifeon holidays. These shopping trips, Mieno’s neighbours say, are Mr. Mienoinspecting consumer prices.’
These inspections would reveal eventually a phenomenon in Japan notseen since the 1920s. As Governor, Yasushi Mieno was to follow policiesthat had as their consequence not just the arresting of inflation but finallydeflation (i.e., falling prices). Looking at the conduct of Japanese monetarypolicy under Bank of Japan Governor Mieno several points stand out.
First, he was a ‘Bank of Japan man’ – determined to wrest more power forhis institution and to decrease any constraints from outside, particularlyfrom the Ministry of Finance.
From Bubble Economy to Yen Bubble (1988–93) 127
Second, there was a complete disdain for policy rules of any sort – whethermoney supply targets or inflation targets. If from the start there had been aninflation target of say 2.5 per cent p.a. (averaged over the business cycle as awhole) and the central bank had set monetary policy so as to achieve thetarget over the medium term (allowing for the normal lags), then policyshould not have been nearly as tight as it was. The march towards deflationwas unannounced, unintended, and unsignposted.
Third, Governor Mieno had a socio-political mission, which clouded hisjudgement about appropriate monetary policies. He saw the speculativefervour that had grabbed Japan in the late 1980s as a disease that had to beeradicated, not least because of its criminal dimensions (the involvement ofthe Japanese underworld). In his view, economic pain was acceptable andindeed an inevitable part of accomplishing that mission.
Fourth, Yasushi Mieno was a strong yen enthusiast – he saw currencystrength as a catalyst to economic reform (cheap imports would help over-come various barriers within the Japanese economy and spur efficiency).And he considered a central part of his mandate to be the almost continu-ous expressing of views on the yen and its appropriate level, even thoughlegally it was the Ministry of Finance, not the Bank of Japan, whichoversaw foreign exchange intervention policy. In analysing equilibriumexchange rates his focus was largely on the current account of the balanceof payments. A large current account surplus for Japan, in his view, meantthat the yen had to be strong. More ‘modern’ ideas about capital flows,driven by divergences between savings rates and investment opportunitiesplaying an important role in exchange rate determination, found no placein his public remarks.
These four characteristics of Yasushi Mieno’s governorship emerge as thevicious circle of monetary error, and destabilising exchange rate fluctua-tions unfolded through the early 1990s. But before starting the narrative,there is the general point to consider of how important any one person canbe in monetary or exchange rate drama. Certainly there have been colour-ful histories (for example, Hetzel, 1998; Wells, 1994) of how Arthur Burns,Chairman of the Federal Reserve during 1970–7, bore much responsibilityfor high inflation in the USA through the 1970s, and of how Paul Volckerrestored stability. But could Burns have overridden strong opposition fromhis colleagues on the FOMC and in Congress? Probably not – responsibilityof the central bank chief must be tempered by the failure of those in pow-erful positions around him or her to articulate concerns and try to steer analternative course. In the case of Yasushi Mieno, here was a man who hadbeen an official all his working life, hardly a great publicist in the image ofArthur Burns. We must assume that Yasushi Mieno’s decisions on mone-tary policy reflected a considerable consensus among senior Bank of Japanofficials at that time and from elsewhere in the economic policy-makingestablishment. There was a ‘failure of the system’ to generate a strong alter-
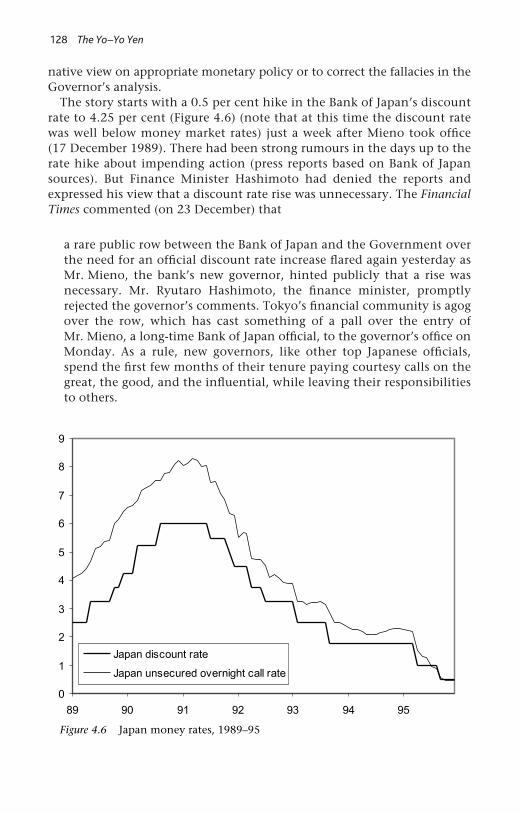
128 The Yo–Yo Yen
native view on appropriate monetary policy or to correct the fallacies in theGovernor’s analysis.
The story starts with a 0.5 per cent hike in the Bank of Japan’s discountrate to 4.25 per cent (Figure 4.6) (note that at this time the discount ratewas well below money market rates) just a week after Mieno took office(17 December 1989). There had been strong rumours in the days up to therate hike about impending action (press reports based on Bank of Japansources). But Finance Minister Hashimoto had denied the reports andexpressed his view that a discount rate rise was unnecessary. The FinancialTimes commented (on 23 December) that
a rare public row between the Bank of Japan and the Government overthe need for an official discount rate increase flared again yesterday as Mr. Mieno, the bank’s new governor, hinted publicly that a rise wasnecessary. Mr. Ryutaro Hashimoto, the finance minister, promptlyrejected the governor’s comments. Tokyo’s financial community is agogover the row, which has cast something of a pall over the entry ofMr. Mieno, a long-time Bank of Japan official, to the governor’s office onMonday. As a rule, new governors, like other top Japanese officials,spend the first few months of their tenure paying courtesy calls on thegreat, the good, and the influential, while leaving their responsibilitiesto others.
Figure 4.6 Japan money rates, 1989–95

From Bubble Economy to Yen Bubble (1988–93) 129
Two significant comments for the future came out of Mieno’s pressbriefings made at the time of the rate hike.
First, referring to the timing of a change in the discount rate, Mienostressed that the Bank of Japan, as the watchdog of prices, must raise therate whenever necessary, by overcoming difficulties including the so-called‘taboos’ (meaning prior agreement with the Minister of Finance). Jijinewswires quoted Mieno as saying, ‘although the government might haveits own convenience, it also understands that a rate hike should be carriedout when needed.’
Second, the new governor expressed the hope that the interest rate hikewould contribute to the correction of the yen’s ‘weakness’ – thus hintingalready at his preference for a ‘hard’ yen. A report in the Nihon KeizaiShimbun on 30 December 1989 went further. ‘According to sources, Mienoand other bank officials are concerned that the weaker yen, rising landprices, and manpower shortages, amongst other factors, will proveinflationary, unless the discount rate is increased. While the Deutsche markhas strengthened against the dollar, the yen has been left behind. Forexample, the yen in inter-bank trading averaged 144 to the dollar inNovember, 17 per cent lower than 123 a year ago (Figures 4.7 and 4.8).’
But how could anyone, unless suffering from severe time myopia, haveassessed the yen as weak in late 1989? After all there had been the headyrise of the yen from the Plaza Accord (autumn 1985) until the Louvre
Figure 4.7 US$ vs. DM and yen, 1987–92

130 The Yo–Yo Yen
Figure 4.8 Yen vs. US$ and DM, 1987–92
Accord (spring 1987), during which time the yen/dollar rate had movedfrom around 240 to 140. Since then the yen had been on a volatile but flattrend – appreciating first to a peak of near 120 in the immediate wake ofthe Wall Street Crash (October 1987) and then falling back, with the DM,through late 1988 and early 1989 as the US dollar was in a solo-rise spurredby the continuing sharp tightening of US monetary policy. In the face ofrising inflation, the Greenspan Federal Reserve acted promptly to reversethe excess monetary creation that had occurred around the time of theWall Street Crash (when the top priority had been to avoid the risk of reces-sion). From spring 1988 to spring 1989 the Federal Funds rate rose by350bp to almost 10 per cent (Figure 4.9). The yen/dollar rate was back tothe Louvre level of around 140.
For the rest of the year (1989), the yen/dollar rate had drifted down onlyslightly against the dollar but had fallen sharply against the mark. Thatmovement – yen down, mark up, and dollar in between – could have beenseen as an early indicator of the US economic slowdown already develop-ing (Figure 4.21) (the basis of this indicator property is described more fullybelow, turning essentially on sensitivity of Japanese economy to US andAsian demand). In any case the particularly sharp rise of the mark (againstboth the yen and the US dollar) had a direct source in the rapid disintegra-tion of the German Democratic Republic (East Germany) as floods ofrefugees poured into West Germany (via Czechoslovakia). In November,

From Bubble Economy to Yen Bubble (1988–93) 131
Figure 4.9 Japan vs. US money rates, 1986–91
the Berlin Wall opened. Foreign exchange markets discounted a sharp risein German interest rates caused by a surge in the demand for capital torebuild the East. It is odd in that context why Yasushi Mieno and hiscolleagues would have been troubled by the rise of the DM and the failureof the yen to keep pace. And they must have been aware of the GreenspanFederal Reserve’s concern, as symptomised by a 200bp drop in FederalFunds rate from its peak level in the spring (Figure 4.9), about the suddenslowing of the US economy.
In fairness, myopic exchange rate vision was not just in evidenceamongst policy-makers in Tokyo. Back in the late summer and autumn(1989), Washington had organised G-7 intervention in the currencymarkets aimed at combating ‘excessive’ strength of the dollar against theyen. But Washington’s myopia with respect to the yen–dollar rate was notan affliction but a cynical pulling down of the shutters. The US Treasurywas not set on determining the long-run equilibrium value of theyen–dollar rate but on aiding the Bush Administration to reach an accom-modation with Congress over trade policy. A stronger yen would helpplacate the mercantilists in Congress.
In March 1989, the Bush Administration, under tremendous pressurefrom Congress, had branded Japan an unfair trader suitable for retaliatoryaction under the Super 301 provision in the Trade Bill passed the previousyear (August 1988). In June 1989 Washington and Tokyo had agreed to

132 The Yo–Yo Yen
start so-called Strategic Initiative negotiations aimed at averting action. Theidea was to agree on a package of economic reform measures in Japan thatwould placate Congress and allow the Bush Administration to cross Japanoff the 301 list before the deadline for sanctions (spring 1990).
One key area where US negotiators achieved success was the demandthat Japan raise its public investment spending – the aim being to reduce theoverall savings surplus and hence the current account surplus, with a strongeryen being a part of that solution. In the final agreement signed in June1990 one of Tokyo’s commitments was to 430 trillion yen of public worksspending over the next ten years, an increase from 6.7 to 9 per cent of GDP.
Unlike their counterparts at the US Treasury, economists at theInternational Monetary Fund were able to take a longer-term view onexchange rates. The spring 1990 World Economic Outlook stated that itwould be inappropriate for Japan to adopt financial and fiscal policiesaimed (via yen appreciation) at reducing its trade surplus. The world(according to the IMF) was running out of sources of capital to finance theeconomic development of Eastern Europe and developing nations.Therefore Japan’s role as a capital supplier was becoming essential. This wasa rare example of the IMF distancing itself from the view that Japan’scurrent account surplus was a bad thing. Even so, two criticisms can bemade of the IMF’s view.
First, as a matter of fact, Japan in 1989 was running its smallest currentaccount surplus for years as the bubble economy sucked in imports at avoracious rate. Second, the appropriate balance between savings and invest-ment in Japan should hardly be decided on the basis of so-called globalneed. That is the language of a command economy. Rather the balanceshould be an equilibrium outcome influenced by market forces reflectingthe array of savings rates and investment opportunities throughout theglobal economy.
Nonetheless the IMF had put down a marker. A Japanese current accountsurplus was not bad in itself. Why did Governor Mieno fail to take any cuefrom the IMF ? A cynical view is that he was a puppet of powerful anti-reformers in the Japanese business and political world. The best way ofdeflecting US pressure for reform was to push the yen higher. Then theBush Administration could settle for less reform and still reach agreementwith Congress on not applying sanctions. (Reform was of course multifac-eted, involving greater opportunities for US exporters to Japan and alsoopening up the Japanese business world to increased foreign participation,particularly in the financial and insurance industries. A strong yen wouldplease US exporters, and US industry faced with Japanese competition, butit would do little to advance the aims of US enterprises faced with regula-tory or other types of barriers to selling services in Japan often by openingup subsidiaries there or buying up Japanese companies.) There is no evid-ence, however, for Yasushi Mieno being an active participant in such an

From Bubble Economy to Yen Bubble (1988–93) 133
anti-reform strategy. Indeed, quite the opposite: he spoke in favour ofeconomic reform (as we shall see below). At most, anti-reformers within theeconomic policy-making establishment would have been quite happy withhis hard yen leanings.
Was there any basis other than myopia (concentrating on the 20 per centfall of the yen over the previous year rather than its more than 100 per centrise from 1985 to end 1987) or faulty analysis (arguing that the yen shouldrise just because Japan had a trade surplus, rather than taking account ofthe balance between savings and investment in the economy and the pres-sure of capital outflow) for Mieno to have considered the yen to be under-valued in late 1988? There were two possible strands of argument, albeitunconvincing ones.
First, suppose the rate of return to capital (or, equivalently, the amountof investment opportunity) in Japan had really increased in the late 1980sand the rate of personal savings had really fallen (as justified by new opti-mism about the long-run outlook for the Japanese economy). Then theamount of surplus savings and momentum of capital outflows would havediminished from the norm in the first half of the 1980s, especially if invest-ment opportunity elsewhere, especially in the USA, had shrunk (dis-illusionment with Reaganomics). That would go along with a rise in theequilibrium value of the yen (although it is far from obvious that the newequilibrium would be higher than the reference range around 140, whichformed part of the Louvre Accord).
In his public remarks, however, Governor Mieno gave no indication thathe believed in a new Japanese economic miracle. Quite the contrary: hespoke of excessive speculation and unjustified euphoria. His drive to pushup interest rates to extraordinarily high levels was never justified (in public)by a view that these were indeed appropriate to the new long-rundynamism of the Japanese economy but rather that they were necessary toburst once and for all a dangerous speculative bubble.
A second justification for seeing the yen as undervalued in late 1989 wasthat capital outflows were at an unsustainable high level, driven by thesame speculative craze as other forms of so-called ‘zai-tech’ (making largeprofit from financial investment). The huge wealth gains created by theland and equity market bubbles had made Japanese investors unusuallywilling to assume foreign exchange risk in the pursuit of high returns.Governor Mieno may well have been sympathetic to this view based incommon sense. But there was a flaw.
Yes, if the bubble burst, there might be less speculation in foreign assets.But the fall in interest rates that would accompany the bulge in the privatesector savings surplus (a crash should be a catalyst to higher personalsavings and lower business investment as households and corporationsretrenched) would surely mean a greater momentum of capital outflow inthe long run even if the recent speculative element burnt out. Overall, a

134 The Yo–Yo Yen
bursting of the speculative bubbles might bring less of a fall in the yen thanwould have occurred if there had been no zai-tech in foreign investments –but most probably there would still be a fall.
Tokyo equity market crash 1990 brings only brief fall of yen
The Crash was not far off. In the first quarter of 1990, the Tokyo equitymarket slumped by 25 per cent from its peak level of end-1989 (Figure4.10). After a brief ‘dead cat bounce’ the market was down by 40 per centfrom its peak by late 1990. The real-estate market slump is more difficult tochart than the equity market slump given the lack of ‘real time’ data.Official indices of land prices lag far behind market reality. Moreover thefirst indication of real-estate market slump is usually a collapse of liquidityas would-be sellers are reluctant to cut prices to the new market-clearinglevel. Nonetheless, there is strong reason to believe that the real-estatemarket had already entered a downturn in the first half of 1990.
Real-estate companies and construction companies were at the forefrontof the equity market slump, suggesting that a turnaround in the landmarket had already been recognised. The prices of golf club membershipswere widely regarded as the best quoted indicator of the real-estate marketand these had already peaked in February 1990 (and fell by over 40 per centin the next eighteen months). In January 1990, the Nikkei News Bulletin was
Figure 4.10 Japan vs. US equity markets, 1987–93

From Bubble Economy to Yen Bubble (1988–93) 135
publishing survey evidence that suggested that the peak of the Tokyo landmarket had long passed. For example, on 9 January 1990, Nikkei newsreported that ‘land prices in Tokyo and Kanagawa Prefecture which shot upin 1987 have passed their peak and fell during 1989, according to a realestate information company related to Misawa Homes Co.’. By late 1990the evidence of a land market downturn was undeniable. The Ministry ofConstruction reported falling resale prices of homes in Tokyo, Osaka andNagoya. A plunge in the number of real-estate transactions taking placewas putting realtors out of business at a record pace – the highest levelsince the recession of 1974–5. Already in early 1990 US credit-ratingagencies had begun to downgrade Japanese banks, citing their over-exposure to ‘the grossly inflated Japanese commercial real estate market’.
As we discussed in the previous chapter, a sharp decline in asset marketsbrings downward pressure on the national currency. This occurs via a risein the households savings rate (as wealth gains no longer fuel consumerexuberance) and a fall in the business investment rate (as corporations loseaccess to cheap capital and profit prospects dwindle). The implied rise inthe private sector savings surplus means greater capital exports. A newequilibrium is eventually reached with a higher current account surplus,higher private sector savings surplus, higher capital exports, lower interestrates, and a lower exchange rate (devaluation).
Of course this equilibrium situation can take a considerable time to emerge,especially if there is no nucleus of market participants that are fully aware ofthe likely change in the savings–investment balance and its likely implicationfor currency values. In fact there was a sharp initial response of the yen to theasset market crash, as it fell in the first quarter of 1990 to almost 160 againstthe dollar (from around 145 at end-1989 and near 120 at the start of 1989)and to almost 95 against the DM (from around 90 at end-1989 and near 70 atthe start of 1989). In real effective exchange rate terms the yen was now backdown to a level barely 10 per cent above that of the 1980–4 period and mostof the post-Plaza appreciation had melted away (see Figure 2.1).
This pattern of exchange rate decline following the bursting of assetmarket bubbles was indeed observed, albeit over a longer time-span, inother advanced industrialised economies in the late 1980s and early 1990s,with the interesting exception of Switzerland. Two examples that stand outare the UK and Finland. Feverish real-estate speculation occurred in bothcountries in the late 1980s. In the aftermath of the bubbles bursting both the British and Finnish currencies fell sharply (Figures 4.11 and 4.12). (Sterling’s decline was delayed until the UK’s exit from the ExchangeRate Mechanism (ERM) of the European Monetary System (EMS) in autumn1992.) The sharp rise in the current account surplus and fall in theexchange rate played key roles in short-circuiting a threatening pro-cess of deflation (Figure 4.13). But that did not occur in Switzerland orJapan.

136 The Yo–Yo Yen
Figure 4.11 Finnish mark real effective exchange rate, 1985–95
Figure 4.12 British pound real effective exchange rate, 1988–95

From Bubble Economy to Yen Bubble (1988–93) 137
–
–
–
Figure 4.13 Japan, UK and Finland current account balances (% of GDP), 1987-95
In Switzerland, the tremendous real-estate boom at the turn of thedecade (1989/91) coupled with booming exports to Germany followingunification brought the economy into a near bubble-state. The bursting ofthe bubble did bring a sharp fall of the Swiss franc in late 1991 and early1992 but then it rose sharply over a 3-year period until mid-1995 (Figure4.14). Amidst turmoil in the European Monetary System during late 1992and 1993 the Swiss franc was in demand as a safe-haven and it rebounded.
Then as the likelihood of European Monetary Union increased, despitethe break-up of the fixed-exchange rate mechanism (ERM) in mid-1993, theSwiss franc enjoyed inflows from, particularly, German retail investorsanxious about the eventual disappearance of the DM. Furthermore, like theBank of Japan, the Swiss National Bank was guilty of monetary overkillduring the late stages of the bubble and beyond into the early stages ofrecession, although the inflation run-up in Switzerland had been moreserious (Figures 4.15 and 4.16), justifying in part the severe course taken.
Through the early 1990s the Swiss budget deficit, like the Japanese gov-ernment deficit, grew rapidly (Figure 4.17) as the government sought toreflate the economy – and this provided underpinning for the currency(because the rising private sector savings surplus was absorbed mostlydomestically rather than via capital exports). From the early mid-1990s,

138 The Yo–Yo Yen
Figure 4.14 Switzerland real effective exchange rate, 1988–2001
CHF real effective exchange rate
CHF/DM (RHS)
105
100
95
90
85
8088 89 90 91 92 93 94 95 96 97 98 99 00 01
0.95
0.90
0.85
0.80
0.75
0.70
Figure 4.15 Switzerland inflation, 1988–2000
Switzerland GDP deflator (YoY)
Switzerland CPI (YoY)
8
6
4
2
0
– 288 89 90 91 92 93 94 95 96 97 98 99 00 01

From Bubble Economy to Yen Bubble (1988–93) 139
Figure 4.16 Switzerland yield curve, 1988–2001
0
2
4
6
8
10
88 89 90 91 92 93 94 95 96 97 98 99 00 01
3mth Euro-CHF rate
10yr CHF swap rate
–5
0
5
10
15
87 88 89 90 91 92 93 94 95 96 97 98 99 00
Current account balance (% GDP)General government balance (% GDP)
Figure 4.17 Switzerland current account surplus vs. general government balance,1987–2000

140 The Yo–Yo Yen
however, Switzerland, unlike Japan, embarked on a major fiscal con-solidation, and indeed fiscal conservatism became constitutionallyenshrined.
The overall scale of the monetary and exchange rate ‘deviations’ was inany case less for Switzerland than Japan (the Swiss franc in real effectiveexchange rate terms rose by only 20 per cent from its trough in 1990 to itspeak in mid-1995) and the Swiss economy did not have to contend with asecond big currency appreciation late in the 1990s. The mechanisms forrecycling Switzerland’s private sector savings surplus into foreign assetsworked well in contrast to the grave impairment which became evident inJapan during the late 1990s. Doubtless the robustness of capital outflowfrom Switzerland could be attributed in part to the launch of the euro andthe associated general weakness of European currencies (including theSwiss franc).
In Japan, the promising yen weakness of early 1990 soon proved to be afalse dawn to post-bubble adjustment of the economy. First, in early spring(1990), there was a rebound of the yen against both the US dollar and DM– a solo-rise which took the yen back to the low 150s against the dollar and90 against the DM (see Figures 4.18, 4.19 and 4.20). Then as the DM swungup against the dollar on the news of German unification the yen founditself in-between, rising to around 145 against the dollar and falling to 95against the DM. Finally, through the summer and autumn, the yen pushedahead with the dollar the weakest currency in the dominant USdollar–DM–yen triangle and the yen the strongest, with the DM in-between(yen–US$ axis holding sway, in the terminology of Chapter 3).
By autumn 1990 the yen was back to near 130 against the dollar and 85to the DM. In real effective terms the yen had appreciated to around itsLouvre Accord level. In the last quarter of 1990 there was a brief fall of theyen – mostly against the DM but also against the dollar – on news of the USeconomy falling into recession. That move was a typical currency marketresponse to the onset of US recession. It is justified by US interest ratesfalling relative to European rates and by the expectation that the Japaneseeconomy would be the hardest hit because of its large exports to the USAand Asian countries (themselves highly dependent on the US economy).But by December there was a reversal with the yen recovering to near 130against the dollar and somewhat less against the DM. This movement waspartly due to the approaching Gulf War, in which Japan, unlike Europe andthe USA, was a non-combatant, but still vulnerable to an interruption of oilsupplies.
How can we explain the overall strength of the yen in 1990 despite thebursting of its equity and real-estate market bubbles? One important factorwas the ferocious monetary squeeze imposed by the Bank of Japan underGovernor Mieno. The collapse in the asset markets and evident slowdownin the economy (the Japanese leading indicators had been declining in step

141
Figu
re 4
.18
USD
–DM
–yen
tri
angl
e –
US
do
llar
co
rner
, 198
7–92
1S
olo
Yen
2U
SD
–Yen
axi
s do
min
ates
3Y
en–E
uro
axis
dom
inat
es
4S
olo
Eur
o
5U
SD
–Eur
o ax
is d
omin
ates
6S
olo
US
D

142
Figu
re 4
.19
USD
–DM
–yen
tri
angl
e –
DM
co
rner
, 198
7–92
1S
olo
Yen
2U
SD
–Yen
axi
s do
min
ates
3Y
en–E
uro
axis
dom
inat
es
4S
olo
Eur
o
5U
SD
–Eur
o ax
is d
omin
ates
6S
olo
US
D
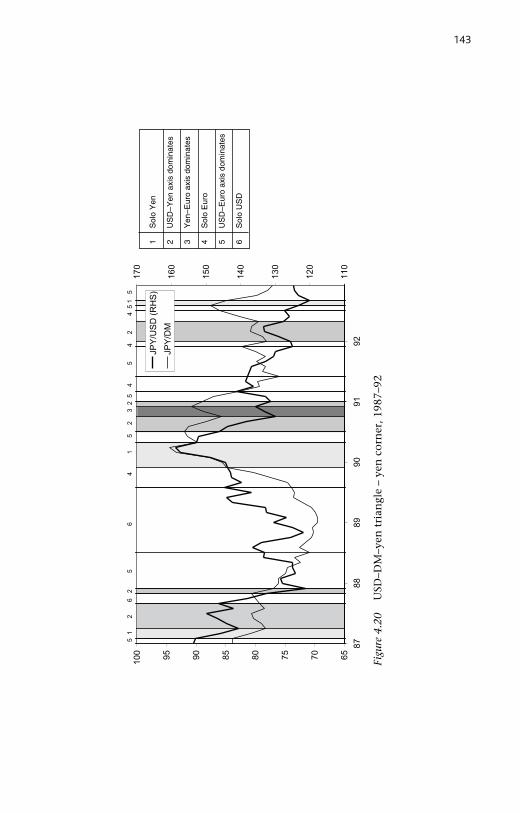
143
Figu
re 4
.20
USD
–DM
–yen
tri
angl
e –
yen
co
rner
, 198
7–92
1S
olo
Yen
2U
SD
–Yen
axi
s do
min
ates
3Y
en–E
uro
axis
dom
inat
es
4S
olo
Eur
o
5U
SD
–Eur
o ax
is d
omin
ates
6S
olo
US
D

144 The Yo–Yo Yen 144
86 87 88 89 90 91 92
–8
–4
0
4
8
12
Japan leading indicator (OECD, YoY)US leading indicator (OECD, YoY)
Figure 4.21 Japan vs. US leading indicators, 1986–92
with those in the USA ever since spring 1989 – see Figure 4.21) did notdeter Mieno from pursuing his mission of smothering the bubble economy.He was not yet convinced that it was dead. Moreover, current inflation wasstill above 3 per cent, and he was unready to follow a policy based on aforecast fall of inflation. By contrast the Greenspan Federal Reserve was fol-lowing a highly contra-cyclical policy. Whereas the Federal Funds rate hadfallen from 8 to 6.5 per cent over the year as a whole (1990), the Japaneseovernight call rate had risen from around 6.5 to 8 per cent (see Figure 4.9).
There is also a more subtle explanation for yen strength in 1990. Theemergence of an enlarged private sector savings surplus following thebursting of asset market bubbles and its influence on the exchange rate isnot an overnight affair. There are many lags and possible short-circuits inthe process.
First, it is not entirely clear that the bubble has burst – big equity marketbounce-backs are possible and data in the land market is very hard to comeby in a timely fashion.
Second, the revision of savings and investment plans does not take placeimmediately (albeit that on some occasions changes have occurred withremarkable speed).
Third, even without a central bank governor following an anti-speculative crusade, the fall of market interest rates may lag considerably

From Bubble Economy to Yen Bubble (1988–93) 145
behind the decline in the so-called natural rate of interest (at which theeconomy is in overall equilibrium given the raised savings surplus).
Fourth, there might be a general misalignment of exchange rate expecta-tions. (For example, investors may believe that a dollar rate of between 120and 140 is consistent with a Japanese economy in external and internalequilibrium, but, in reality, the true range could be 180–220. Then the yenmight eventually come under downward pressure and exchange rate expec-tations adjust in line as non-speculative capital exports exceeded consistentlythe trade surplus. But it is also possible that a prolonged period of exchangerate turbulence would affect the equilibrium outcome by inflaming Japaneseinvestors’ perceptions of foreign currency risk.)
In 1990 all four points contributed to the overall resilience and, indeed,strength of the yen. Bank of Japan Governor Mieno was the best-knownsceptic regarding the bursting of the land market bubble. In most settingsthe central bank governor holds some sway over market opinion – unlesshe has lost all credibility and become a point of ridicule. That was not theunfortunate situation for Yasushi Mieno in 1990 (although two years later apowerful LDP politician was calling for his head to be delivered on a plate).
Indeed, developments in the Japanese bond market during that year(with yields on a sharply rising trend until the autumn – see Figure 4.22)highlight that Governor Mieno was far from alone in failing to see that abig rise in the private sector savings surplus lay ahead, which eventually
Figure 4.22 Japan 10-year JGB yield vs. overnight call rate, 1990–5

146 The Yo–Yo Yen
called for a much lower exchange and interest rate level. But economic his-torians can criticise Governor Mieno for having a role in pushing marketexpectations away from the equilibrium level (by continually favouring astrong yen and emphasising the necessity of a long haul to completelyovercome speculation in the land markets).
If, not withstanding Governor Mieno’s views, bond markets had beenmore efficient in terms of assessing the direction of the economy andtrends in equilibrium interest rates, the yen might have fallen (overall) in1990 regardless of the increase in short-term rates driven by GovernorMieno. In principle, and in practice, investors or borrowers are moreinfluenced by long-term than by short-term interest rate differentials intheir decision as to whether to switch between currencies. After all, a short-term rate differential is likely to be swamped by any significant exchangerate move. If, in our example, yen bond yields had fallen to reflect theupcoming huge private sector savings surplus, capital outflow from Japanwould have been stronger at this stage and the yen weaker. Instead, bondyields shot upwards in sympathy with short-term rates – illustrating thatmany investors believed that rates could remain high for a very long timeto come, hardly consistent with a ballooning of the private sector savingssurplus in a post-bubble economy. As an illustration, 10-year yields onJapanese government bonds shot up from 5.5 per cent at the start of 1990to 7.5 per cent by the autumn, before falling back (Figure 4.22). That rise inyields was consistent with a view that Governor Mieno had adjustedmoney market rates up to a high natural level appropriate to an ongoingsuper-strong Japanese economy, as opposed to the view that he was punc-turing a bubble economy with temporarily high rates (which would fallsharply as a huge savings surplus re-emerged).
Indeed to many contemporary observers in late 1990 it was the USeconomy rather than the Japanese that was suffering the consequences of apunctured bubble (Figure 4.23). The simmering Savings and Loans crisishad combined with a severe downturn in several regional real-estatemarkets to threaten a banking crisis. In late 1990 rumours were flying thatsome of the largest US banks and other US financial institutions were inmajor trouble. A credit crunch was visible to all. If economic logic pointedto countries in a post-bubble phase requiring low interest rates and a weakexchange rate to offset a rising private sector savings surplus, then the USdollar was a more obvious case study than the yen at this point. Of course afar-sighted analyst would have pointed out that the rise in the US savingssurplus was likely to be much smaller (relative to economic size) than inJapan, and that the bubble bursting in Tokyo was many times greater thanthe headline-grabbing real-estate market declines in various US metropoli-tan areas. There had already been an unmatched (in the USA) precipitousfall of the US Japanese equity market. But such analysis was not themoving force in the currency markets of 1990.

From Bubble Economy to Yen Bubble (1988–93) 147
Figure 4.23 Japan, US and (West) Germany real GDP, 1990–4
In the early months of 1991 the gloom surrounding the US economysuddenly lifted as the Washington-led allies repelled the Iraqi invasion ofKuwait and indicators suggested that the recession was over. The dollar rosefrom around 130 to 140 against the yen – but that move was modest com-pared to a much larger rise against the DM. Indeed by the second quarter(of 1991) the yen had levelled out at around 135, barely changed from late1990, whilst the DM was still much weaker (than at the end of 1990)against the dollar. There was nothing strange about the yen moving closelywith the dollar against the DM at a cyclical turning point. (As alreadydescribed, this pattern stems from the importance to the Japanese economyof exports to the USA and Asia. In addition foreign capital inflows into theTokyo equity market tend to be correlated with US cyclical indicators –albeit that this time there was little sign yet of a revival of foreign interest.)
What was strange was the failure of the yen to fall with the dollar – andby more – in the second half of 1991 when confidence evaporated in a USupturn and the DM bounded ahead (Figure 4.19). Instead, the yen movedvirtually in line with the rising DM despite the Bundesbank continuing totighten monetary policy to fight the inflationary pressures created byunification (political union of East and West Germany had occurred theprevious autumn). Whereas short-term German interest rates rose from 9 to10 per cent in the second half of 1991, Japanese and US overnight ratesboth fell by around 200bp (Figure 4.24). By year-end the yen was at around
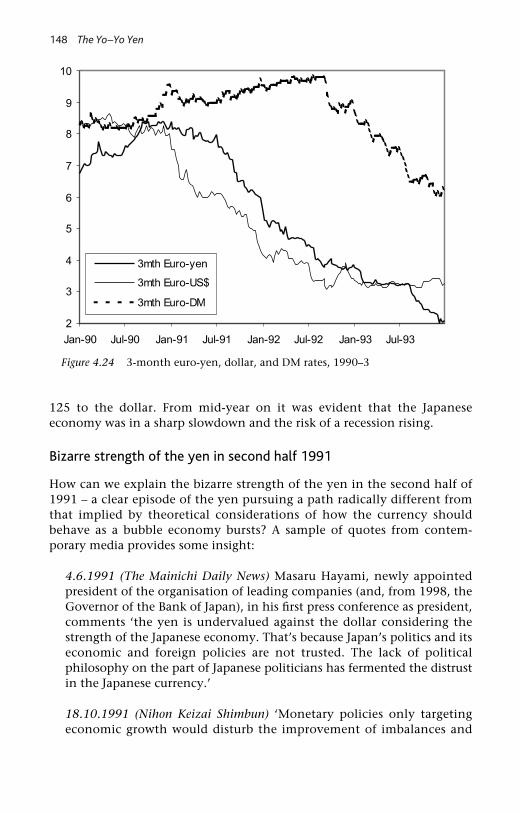
148 The Yo–Yo Yen
Figure 4.24 3-month euro-yen, dollar, and DM rates, 1990–3
125 to the dollar. From mid-year on it was evident that the Japaneseeconomy was in a sharp slowdown and the risk of a recession rising.
Bizarre strength of the yen in second half 1991
How can we explain the bizarre strength of the yen in the second half of1991 – a clear episode of the yen pursuing a path radically different fromthat implied by theoretical considerations of how the currency shouldbehave as a bubble economy bursts? A sample of quotes from contem-porary media provides some insight:
4.6.1991 (The Mainichi Daily News) Masaru Hayami, newly appointedpresident of the organisation of leading companies (and, from 1998, theGovernor of the Bank of Japan), in his first press conference as president,comments ‘the yen is undervalued against the dollar considering thestrength of the Japanese economy. That’s because Japan’s politics and itseconomic and foreign policies are not trusted. The lack of politicalphilosophy on the part of Japanese politicians has fermented the distrustin the Japanese currency.’
18.10.1991 (Nihon Keizai Shimbun) ‘Monetary policies only targetingeconomic growth would disturb the improvement of imbalances and

From Bubble Economy to Yen Bubble (1988–93) 149
cause the yen to depreciate’, Mieno said. Earlier in the day, Miyazawa,who was expected to become prime minister early the following month,hinted that the Bank of Japan needed to reduce interest rates again soon.Asked about Miyazawa’s remarks, Mieno said ‘I listen to the views ofothers, but the Bank of Japan will decide its policy as its own.’
22.11.1991 (Nihon Keizai Shimbun) Bank of Japan Governor Mieno rulesout a further discount rate cut as a way of rectifying Japan’s growingexternal trade surplus. Temporary (in particular the German unificationboom) rather than structural factors were responsible for almost all ofthe $40bn p.a. widening of the trade surplus in the first half of the fiscalyear (April to September 1991).
27.11.1991 (Reuters) Reports on a speech by Bank of Japan GovernorYasushi Mieno say that Japan needs to make an effort to ensure that theyen will be steady to firmer in the long-term. Japan’s economic growthis likely to slow moderately for now, but is unlikely to decline sharply.Japan should continue to open its markets to cope with its growingcurrent account surplus, but it should not adopt policies that will tooeasily stimulate domestic demand, which would endanger price stability(he said). In this context ‘Japan needs to make an effort to ensure asteady to relatively firmer yen in the long term.’ Japan’s current accountsurplus is growing but it is largely accounted for by temporary factors.
3.12.1991 (Reuters News) According to a pooling of six forecasts on theeconomy, ‘the slowdown that started in 1990Q4 should carry throughuntil the middle of 1992 before easier money has an effect. GDP growthin 1992/3 (fiscal year) should be down to 3 per cent from 3.8 per centexpected this year.’ Many of the forecasts were bullish on the yen, par-tially due to expectations of a higher trade surplus.
4.12.1991 (Reuters News) Japan’s resurgent current account surplus isincreasing pressure on financial authorities to take action by strengthen-ing the yen. The Finance Ministry has announced that the surplus inOctober more than doubled from a year earlier. Salomon Brothers (Asia)Ltd. forecasts that Japan’s current account surplus will continue to swell,reaching $80bn this fiscal year ending March 1992, more than double1990’s total. And the surplus will top $100bn next year.
16.12.1991 (Reuters News) Japan’s economy is now slowing, but this ispart of an unavoidable process of heading towards more balancedgrowth from a period of excessively high growth in the past, Bank ofJapan Governor Mieno said today. But the economy was unlikely tosuffer a major downturn. ‘The economy still retains its underlying

150 The Yo–Yo Yen
strength.’ Mieno said corporate capital investment, a primary engine ofeconomic expansion, was expected to remain strong.
18.12.1991 (Reuters News) Talk of a ‘mini-Plaza’ pact refuses to die com-pletely. Currency dealers sold the dollar ahead of an October meeting offinancial leaders from the Group of Seven (G7) nations in Bangkok onspeculation, later proved wrong, that a mini-Plaza accord would bestruck. The prospect of US President George Bush meeting JapanesePrime Minister Miyazawa in Tokyo in early January has sparked specula-tion that the two could publicly agree that a stronger yen is desirable.‘Bush will come to Japan and the focus will be on Japan’s economy,especially the huge trade surplus’, said Fuji Research Institute chief econ-omist Masaru Takagi. ‘Bush and top Japanese officials will agree on ahigher yen against the dollar.’ Japanese officials have been talking of astronger yen. ‘There is talk by both US Treasury and Japanese officials ofthe desirability for the dollar to ease further to the 120 yen level’, formerUS Federal Reserve Board vice chairman Manuel Johnson said in aspeech in Tokyo on Friday. Bank of Japan Governor Mieno lent thereports credibility by commenting in an interview ‘the yen rate shouldreflect fundamentals, Japan needs to make a greater effort to stabilise theyen in the direction of a firm tone.’
Several key points emerge from these quotes.First, the Bank of Japan Governor and many economic commentators
were far too optimistic – failing to perceive the risks of a severe recession,which indeed was to become reality in the following year. This false opti-mism and the failure to realise that a sea-change in the balance betweensavings and investment in the economy was occurring were, undoubtedly,factors keeping interest rates above their natural level and promoting yenstrength.
Second, the model of exchange rate determination used by the Bank ofJapan Governor and by many market practitioners was simplistic andwrong. They had no doubt that the sharp rise of the trade surplus, whichbecame apparent in the second half of 1991 (Figure 4.25), should mean astronger yen. They were blithely unaware of the argument that the risingtrade surplus was merely a reflection of weakening investment and risingsavings and that this should be accompanied by lower interest rates,increased capital exports and a weaker yen.
Third, the clear messages from the Bank of Japan Governor that astronger yen was to be expected and similar signals from G-7 meetings hadan impact on market sentiment. Whereas capital exports would normallyaccelerate markedly as the savings surplus increases, the continual harpingby officials on the need for yen appreciation must have acted as an impedi-ment. Enlightened high-up economic policy-makers should have been
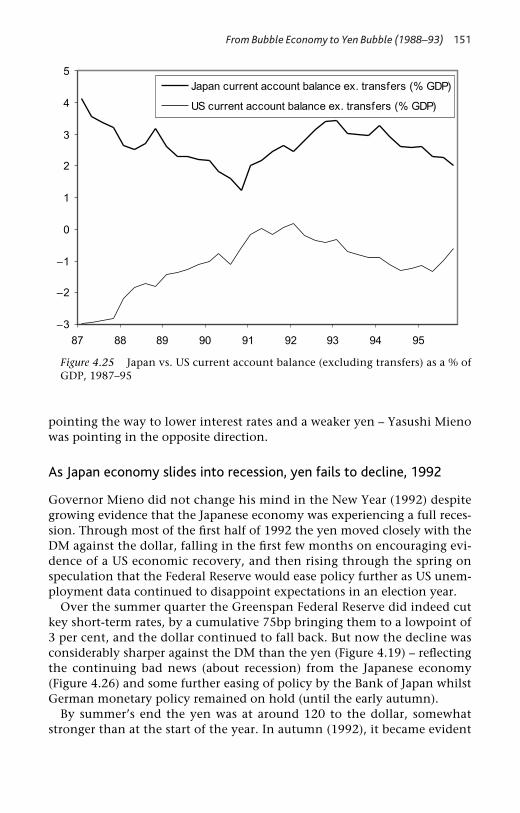
From Bubble Economy to Yen Bubble (1988–93) 151
–
–
–
Figure 4.25 Japan vs. US current account balance (excluding transfers) as a % ofGDP, 1987–95
pointing the way to lower interest rates and a weaker yen – Yasushi Mienowas pointing in the opposite direction.
As Japan economy slides into recession, yen fails to decline, 1992
Governor Mieno did not change his mind in the New Year (1992) despitegrowing evidence that the Japanese economy was experiencing a full reces-sion. Through most of the first half of 1992 the yen moved closely with theDM against the dollar, falling in the first few months on encouraging evi-dence of a US economic recovery, and then rising through the spring onspeculation that the Federal Reserve would ease policy further as US unem-ployment data continued to disappoint expectations in an election year.
Over the summer quarter the Greenspan Federal Reserve did indeed cutkey short-term rates, by a cumulative 75bp bringing them to a lowpoint of3 per cent, and the dollar continued to fall back. But now the decline wasconsiderably sharper against the DM than the yen (Figure 4.19) – reflectingthe continuing bad news (about recession) from the Japanese economy(Figure 4.26) and some further easing of policy by the Bank of Japan whilstGerman monetary policy remained on hold (until the early autumn).
By summer’s end the yen was at around 120 to the dollar, somewhatstronger than at the start of the year. In autumn (1992), it became evident
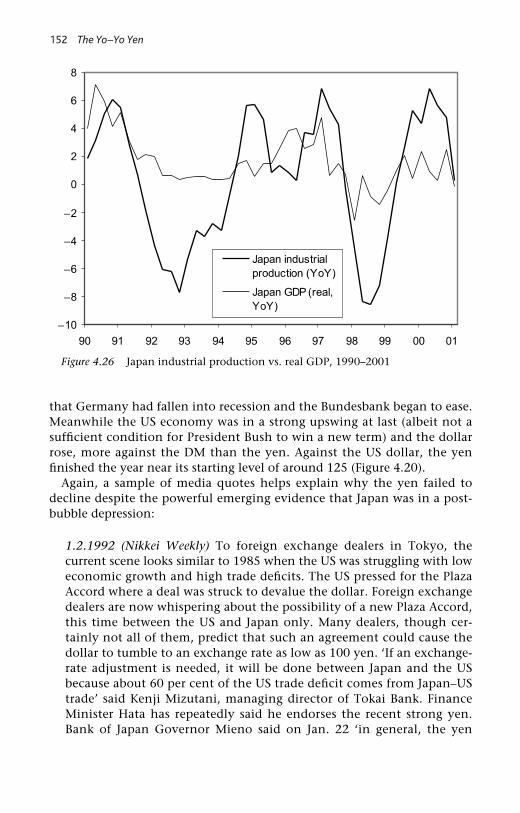
152 The Yo–Yo Yen
–
–
–
–
–
Figure 4.26 Japan industrial production vs. real GDP, 1990–2001
that Germany had fallen into recession and the Bundesbank began to ease.Meanwhile the US economy was in a strong upswing at last (albeit not asufficient condition for President Bush to win a new term) and the dollarrose, more against the DM than the yen. Against the US dollar, the yenfinished the year near its starting level of around 125 (Figure 4.20).
Again, a sample of media quotes helps explain why the yen failed todecline despite the powerful emerging evidence that Japan was in a post-bubble depression:
1.2.1992 (Nikkei Weekly) To foreign exchange dealers in Tokyo, thecurrent scene looks similar to 1985 when the US was struggling with loweconomic growth and high trade deficits. The US pressed for the PlazaAccord where a deal was struck to devalue the dollar. Foreign exchangedealers are now whispering about the possibility of a new Plaza Accord,this time between the US and Japan only. Many dealers, though cer-tainly not all of them, predict that such an agreement could cause thedollar to tumble to an exchange rate as low as 100 yen. ‘If an exchange-rate adjustment is needed, it will be done between Japan and the USbecause about 60 per cent of the US trade deficit comes from Japan–UStrade’ said Kenji Mizutani, managing director of Tokai Bank. FinanceMinister Hata has repeatedly said he endorses the recent strong yen.Bank of Japan Governor Mieno said on Jan. 22 ‘in general, the yen

From Bubble Economy to Yen Bubble (1988–93) 153
should be stabilised at high levels if commodity prices and the tradebalance are considered.’ On January 17, the Federal Reserve Bank of NewYork intervened in the market by selling the dollar at 127.15–20 yen.That surprised most dealers because no central bank had ever intervenedat a level below 130, dealers said.
28.2.1992 (Nihon Keizai Shimbun) A top Finance Ministry official criti-cised as ‘rude’ and lacking in ‘common sense’ remarks by ShinKanemaru, deputy president of the leading Liberal Democratic Party,that the PM should sack Bank of Japan Governor Mieno if he opposes animmediate further cut in the discount rate.
14.3.1992 (Nihon Keizai Shimbun) Kanemaru reiterated his appeal thatthe official discount rate be cut. He said that although some people saythe economy will bottom out soon, an economic free fall ‘into an abyss’cannot be ruled out.
27.3.1992 (Reuters News) While Mieno has won praise for his attack onasset inflation, a sharp slowdown in the real economy now has criticscharging that his too cautious easing of credit is prolonging the slump.GDP shrank in the October-December 1991 quarter. ‘Ultimately Mieno,or the central bank as a whole, overestimated the inflationary pressures’said one Japanese bank economist. Last month, LDP baron ShinKanemaru suggested the discount rate be cut even if it meant firingMieno. There was also a very different view. ‘I think he’s done a brilliantjob,’ said the chief economist at Salomon Brothers Asia. ‘He was facingan economy in 1989 that was essentially a powder key ready to blow up.I think he deflated the bubble in an extremely cautious but clear andsteady-handed fashion.’
24.4.1992 (JIJI Press) Bank of Japan Governor Mieno said he expects thatthe Japanese economy will pick up in the middle of the year.
27.4.1992 (JIJI Press) Bank of Japan Governor Mieno and FinanceMinister Hata welcomed the yen’s rise against the dollar in the wake ofSunday’s G-7 meeting. A statement issued after the meeting said‘exchange markets have been generally stable in recent months, thoughthey noted that the decline of the yen since the last meeting (inJanuary) was not contributing to the adjustment process.’
28.4.1992 (JIJI Press) Bank of Japan Governor Mieno rebuffed a call forquick domestic demand stimulation, warning that short-term economicmeasures would spawn inflation.

154 The Yo–Yo Yen
29.4.1992 (Reuters News) None of the G-7 nations demanded when theymet in Washington last weekend that Japan take any monetary steps tostimulate its economy, Bank of Japan Governor Mieno said. Mieno saidthis week’s appreciation of the yen against the dollar is natural given theeffect of the G-7 communiqué which mentioned that the decline of theyen since the previous G-7 meeting in January was not contributing tothe adjustment process. A stronger yen will help reduce Japan’s massivecurrent account balance of payments surplus.
21.6.1992 (The Daily Yomiuri) Masaru Hayami, chairman of the JapanAssociation of Corporate Executives, warned that a further cut in theofficial discount rate would further aggravate the nation’s economy.Government and business leaders should remember the negative impacton the economy of the cut in the official discount rate to an historic lowof 2.5 per cent in 1987. There are no short-term solutions for problemscaused by the bursting of the bubble economy.
23.6.1992 (Reuters News) Japan must seek to stabilise the yen with a firmtone in the currency market to correct external imbalances, Bank ofJapan Governor Mieno said.
26.6.1992 (JIJI Press Newswire) The yen’s uptrend in currency marketswill likely continue for now as the Japanese and US governments appearto tolerate a stronger yen against the dollar, a former New York FederalReserve official, Scott Pardee, said.
27.6.1992 (Nihon Keizai Shimbun) The Ministry of Finance will be underintense political pressure in the coming few weeks to fiscally stimulateJapan’s sagging economy. Top LDP politicians convinced PM Miyazawathat the government should hammer out the outline of a supplementarybudget before he leaves (June 30) for the G-7 Summit in Munich. Partysources said it would amount to 3–5 trillion yen.
8.7.1992 (Reuters News) Mieno says Japan’s prices remain stable althoughservices prices are still relatively high. But price stability alone will notallow the Bank of Japan to ease credit, he said. ‘We will manage monetarypolicy by taking into account not only prices but other factors as well.’
16.9.1992 (Reuters News) A stable and firm yen is desirable to help correctJapan’s current account surplus, Bank of Japan Governor Mieno said.Japan’s severe economic adjustment is seen continuing for a while, butmay be nearing a bottom. The Bank of Japan will closely watch theeffects of past monetary and fiscal policy steps on the economy, he said.
From Bubble Economy to Yen Bubble (1988–93) 155
3.10.1992 (The Nikkei Weekly) For an economy in the middle of a reces-sion, exports are one of the few sources of growth. In the April to Junequarter, domestic demand actually shrank slightly, and it was externaldemand that allowed GDP to grow at an annual 1.1 per cent annualrate. ‘The yen’s current level is acceptable’, said Yuji Tanahashi, viceminister of the MITI, when the yen rate briefly broke the 120 yen to thedollar last week. Bank of Japan Governor Mieno who used to call for‘stability on the side of a stronger yen’ now merely acknowledges that astronger yen is ‘desirable from a long term view.’
8.10.1992 (Nihon Keizai Shimbun) Masaru Hayami, chairman of the JapanAssociation of Corporate Executives (Doyukai) said the yen’s current rateof about 120 to the US dollar is bearable for Japanese industries. It is nota rate we can complain about, considering Japan’s looming trade surplus.
31.10.1992 (The Economist) Americans grumble loudly about their creditcrunch. It is trivial compared with what faces Japan. Yet Bank of JapanGovernor Mieno continues to claim that anaemic monetary growth willnot hold back economic recovery. Federal Reserve Chairman Greenspannoted in a speech in Tokyo earlier this month that ‘Japan-based risk,largely through inter-bank transactions’ is American banks’ largestcountry exposure.
These press clippings reveal a new theme as well as continuing severalold ones. The new theme is the formation of an unholy alliance betweenWashington (assiduously avoiding criticism of Japanese monetary policyand instead pressing for aggressive fiscal expansion as a way of both stimu-lating the Japanese economy and fostering a stronger yen together withlower trade surplus) and big spenders in the Liberal Democratic Party(LDP). The old themes are, first, the attachment of Bank of Japan GovernorMieno to a strong yen and his failure to realise the seriousness of the eco-nomic downturn already afflicting Japan. Second, there is the continuingapparent ignorance of Governor Mieno, and of other key policy-makers,concerning the equilibrium exchange rate implications of a post-bubblesurge in the national savings and current account surpluses. Instead theymade and accepted simple and erroneous assertions that a larger currentaccount surplus meant currency strength.
Third, international economic officials who should have known better –whether in Washington (IMF) or Paris (OECD) – failed to provide any alter-native framework for market analysis (for example, writing articles on whya rising savings surplus and current account surplus should indeed meanyen weakness). Instead, G-7 meetings were sources of communiqués thatserved only to make Japanese investors even more risk averse with respectto assuming foreign currency risk, and so impeding the adjustment of the

156 The Yo–Yo Yen
Japanese economy to post-bubble realities. Japanese investors may indeedhave been inclined towards healthy scepticism towards G-7 statements oncurrencies or of Washington’s power to influence exchange rates. But eventhe most sceptical might well be influenced by the dominant viewexpressed in contemporary economic commentaries, whether official orprivate, that larger current account surpluses meant the yen could onlyrise. The contrarian opinion had no airing, and inaccurate histories of thePlaza Accord circulated without correction. As we saw in Chapter 2, thesurge of the yen from summer 1985 to 1987 had much more to do withchanged investment outlooks on both sides of the Pacific (the end of theReagan boom and big new investment opportunities in Japan) than anyexchange of words in the Plaza Hotel.
US ‘economic diplomacy’ drives up the yen, early 1993
If words from Washington were important at any times during the run-upof the yen to its bubble peak in spring 1995 it was surely most evident inthe early few months of 1993 as the new Clinton Administration drew upits agenda for international economic diplomacy, particularly vis-à-visJapan. The other main instance of the yen being driven up by talk inWashington during the climb to its bubble peak was in early 1994 – to bediscussed in the next chapter. In the first four months (of 1993) the yenrose from around 125 against the dollar to below 110, whilst the DM/dollarrate was broadly flat (see Figures 4.18, 4.19 and 4.20). This was against thebackground of various blatant hints from the new Administration that theyen should rise and that Japan’s current account surplus was at an unac-ceptably high level. As already pointed out (Chapter 3), neo-mercantilistpolicy thrusts from Washington do not have an inevitable upwardinfluence on the yen. Investors could fear that protectionist threats, ifcarried out, would seriously damage the Japanese economy and yen devalu-ation might be essential to any subsequent recovery.
The lesson of history so far, however, from the Nixon shock (1971) to thePlaza Accord (1985), was that somehow the yen could be engineeredupwards as part of a package solution to trade frictions. The methodologywas not well spelt out but presumably would involve some combination offiscal ease and inflammation of exchange risk perceptions (so as to decreasethe momentum of capital exports). Inflammation would have its source invarious hazy elements – speculation on a Plaza II, the Bank of JapanGovernor broadcasting a simplistic and erroneous theory linking trade sur-pluses and inexorable currency appreciation, and perhaps ‘voluntary guid-ance’ to Japanese investment institutions concerning their rate of foreignasset acquisition. None of these elements were robust but their possiblepresence could raise the anxiety level of Japanese investors concerning pos-sible exchange loss on foreign assets.

From Bubble Economy to Yen Bubble (1988–93) 157
The lesson was soon being re-taught in practice. The new US TreasurySecretary, Lloyd Bentsen, let it be known that he wanted a stronger yen.Bentsen had been one of the Senate sponsors (in 1985) of the most notori-ously protectionist legislation in the 1980s (albeit not signed into law) –the so-called Gephardt Amendment (which would have required Japan andother countries with which Japan had large deficits to reduce those deficitsby 10 per cent per annum under threat of sanction). In mid-FebruaryBentsen announced at a press conference that he would ‘like to see astronger yen’. As discussions developed in following weeks betweenWashington and Tokyo it became clear that the Clinton Administrationwas intent on starting a new round of negotiations on opening up Japanesemarkets. This time the approach was to be results orientated – specifictargets for growth in US access. Laura D’Andrea Tyson, the new head of theCouncil of Economic Advisers, was the author of an anti-free-trade tomeentitled ‘Who’s Bashing Whom?’. As a mid-April summit loomed betweenPrime Minister Miyazawa and President Clinton, policy-makers in Tokyoscurried to put together a giant fiscal reflation package to help take the heatout of trade frictions. The following quote illustrates the effort:
14.04.1993 (Reuters News) PM Miyazawa is packing a jumbo $117bneconomic stimulus package for his first summit with the new US president – one he hopes to sell as a plan to trim Japan’s trade surplus.In the US, the Clinton administration is preparing to talk tough ontrade. ‘The Prime Minister is aware of Clinton’s tough stance and is mulling all possible measures to reduce the trade imbalance’ said a Japanese government official working on preparations for theMiyazawa–Clinton meeting. Miyazawa’s aides have approved a 13 trillion yen package they hope will pump new life into an economyfacing its worst crisis of the post war era.
At the Summit, Japan agreed to the opening of talks, and by July pro-posals for detailed negotiations had been drawn up – forming the so-called‘Framework Talks’ which continued through until spring 1995. Theimplicit stick was the option of reinstating the Super 301 provision of theUS trade law, which would allow direct action against Japanese exports (infact Super 301 was reintroduced in March 1994, as the framework talks hita road-block). Furthermore President Clinton was not unwilling to passcomment on the currency markets as a negotiating tactic. On 16 April, at anews conference following his talks with PM Miyazawa, the new Presidentdropped a clanger – ‘I think there are three or four things working todaywhich may give us more results. Number one, the appreciation of theJapanese yen.’ The remark sent currency dealers pushing down the dollar to a global post-war low of 112 to the yen in New York trading (113 theprevious day).

158 The Yo–Yo Yen
What role was the Bank of Japan playing during this crisis time for theyen (crisis in the sense that the currency was rising unilaterally and threat-ening to prolong the recession)? In fairness, under intense pressure frompoliticians and business, Governor Mieno had cut the discount rate by75bp to 2.5 per cent on 4 February – matching its previous record lowbetween 1987 and 1989. Money market rates in Japan were now at around3 per cent and had thereby fallen to the same level as in the USA for thefirst time since 1990 (see Figures 4.9 and 4.22). The various forms ofpressure on Governor Mieno are illustrated by the following quote:
6.2.1993 (Reuters) The interesting point is why it took the central bank(Bank of Japan) so long to cut rates. The conventional explanation is thatthe central bank held off to increase pressure on the finance ministry to easefiscal policy. Another explanation is that Governor Mieno has been pur-suing a political agenda – to reform dirty-money politics in a countryincreasingly marred by scandal and policy-making paralysis. As com-panies’ earnings fall, so too do their political contributions. If that istrue, it could explain the unprecedented public campaign against Mr. Mieno in the past few weeks. The Japanese press reported that afinance ministry ‘old-boy’ network was out to get rid of Mr. Mieno. Then apress article blamed Mr. Mieno’s older brother, who works for theNorinchukin agricultural co-operative, for the build-up in Norinchukinloans to housing-loan companies which today hover near insolvency.
An interesting point from this report (albeit ‘unsourced’) is the notionthat the Bank of Japan had been keeping monetary policy overly tight so asto increase pressure on the Ministry of Finance to break with orthodoxyand sanction fiscal pump-priming by the government. But why shouldGovernor Mieno have been striving for fiscal reflation rather than firstusing all the available monetary policy levers? The best explanation is thatGovernor Mieno had no belief in the power of monetary policy to deliverany further meaningful stimulus and he was trying to act as a catalyst ofmacro-economic policy development in the most effective way he saw tolift Japan out of recession. The conspiratorial type explanation, for whichthere is no hard evidence, is that Governor Mieno realised that aggressivemonetary expansion could mean a weaker yen, which he inherently dis-liked, and would work against any narrowing of the trade surplus. (It isclear from public comments that Governor Mieno implicitly accepted neo-mercantilist type arguments that Japan’s current account surplus wouldhave to fall a long way to achieve a better international equilibrium.)
It is likely that the new fiscal stimulus programme that the Miyazawagovernment delivered to President Clinton in mid-April (1993) played a role in the yen’s overall advance – an interesting instance of neo-mercantilist pressure in Washington pushing up the yen via the fiscal lever.

From Bubble Economy to Yen Bubble (1988–93) 159
Indeed, Leonard Schoppa (1997) writes that ‘Treasury Department officialswere pressurising the Japanese to adopt bigger and better fiscal stimuluspackages from Day One of the Clinton Administration.’ Ten-year yields onJapanese government bonds (JGBs) spiked up to 5 per cent from 4 per centin spring 1993 (Figures 4.27) as concerns grew about the looming hugefinancing needs of the public sector (some optimism about the Japaneseeconomy emerging into a business recovery also played a role). By contrast,ten-year T-bond yields were not moving at this time, even though theClinton Administration had consummated a deal (in February) with theGreenspan Federal Reserve whereby a cut in the budget deficit would berewarded with patience on monetary policy (Figure 4.27). (From spring1993 and into the summer there was a steep fall in both US and Japanesegovernment bond yields – in the USA this was primarily in response tocyclical data indicating the strong expansion of second half 1992 had givenway to a lull in growth, whilst the Japanese fall reflected anxiety that theyen’s jump would ruin recovery prospects and create deflation.)
Some commentators have claimed that the yen surge of early 1993 had more to do with US fiscal tightening than with the ClintonAdministration’s talking up of the yen, pressing Japan to ease fiscal policy,and threats of trade action. But why then was the dollar flat against the DMat this time? (see Figures 4.18, 4.19 and 4.20). It is not convincing to retortthat the DM was held back by recession in Germany; the recession’s arrival
Figure 4.27 10-year JGB yields vs. 10-year T-bond yields 1991–5

160 The Yo–Yo Yen
– and degree of severity – had been fully digested by markets in the lastquarter of 1992 and there was little new information. Leading indicators ofthe business cycle were picking up in Japan (Figure 4.28) – a few monthsahead of a similar turn-up in Germany (Figure 4.29). But the jump of theyen can hardly be attributed to such fragile evidence.
The yen in real effective exchange rate terms had now (spring 1993)reached a level some 10 per cent above its previous peak in early 1988 (seeFigure 2.1). Yet the hard currency enthusiasts at the Bank of Japan andoutside were hardly daunted. Masaru Hayami wrote the following com-ments in the Nikkei Weekly (5 April 1993):
The yen’s recent surge against the dollar, following a Feb. 20 commentmade by the US Treasury Secretary Bentsen, may have adverse economiceffects in the short term. Historically, though, the strengthening of theyen has had a positive outcome in the long run. Whenever the yensurges, the deleterious effect on exporters and others is mentioned. Butthe yen’s appreciation has never destroyed Japanese industry. Rather ithas helped by prompting companies to streamline operations andresults in lower prices for imported materials, including fuel, whichgreatly benefits Japanese industry.
Streamlining involves up-front costs but pays off before long. By doingso, Japanese companies have emerged in a more competitive position
–
–
Figure 4.28 Japan vs. US leading indicators, 1992–8

From Bubble Economy to Yen Bubble (1988–93) 161
–
–
Figure 4.29 Japan, US and euro-area real GDP 1989–2001
each time the yen has surged relative to the dollar. A review of Japaneseeconomic developments in the past two decades points to the fact thatwithout the yen’s appreciation as a regulator of the Japanese economy,Japan could not have gained the distinction of being the nation amongthe advanced countries with the most stable consumer prices, the fastestreal economic growth and the second largest GNP. It goes withoutsaying that the rise in the yen’s value has eventually worked in favour ofthe Japanese nation, companies and consumers. There’s reason toexpect, as in the past, a stronger yen will benefit Japan’s economy.
Before joining a trading firm in 1981, I witnessed changes in theyen–dollar relationship for 34 years as a member of the Bank of Japan[he joined at the same time as Mieno]. The yen has risen against thedollar at an average pace of 5 per cent since the floating exchange ratestarted in 1973. Whilst the yen’s value has tripled to the dollar over thepast two decades, Japan’s nominal gross national product grew 5.5times. During the same period, real GNP increased at an average annualrate of 4.4 per cent, the fastest rate of growth among industrialisednations. In the last 5 years in particular, Japan saw its real GNP grow atalmost 5 per cent a year. In comparison, the US economy expanded atan annual average rate of 2.5 per cent over the past 20 years while theEuropean Community grew at an average 2.8 per cent a year. This showsthat the stronger yen has not hindered Japanese economic growth but
162 The Yo–Yo Yen
enhanced Japanese industrial competitiveness by prompting industry torestructure.
The future Bank of Japan Governor and then head of an important feder-ation of employers was telling the world, and his Japanese audience in par-ticular, not to expect any fall-back of the yen. Indeed monetarypolicy-makers probably think its present high value is a good thing. Criticscould argue that Hayami was totally ignoring a big new phenomenon – thehollowing out of Japanese industry in response to the yen’s surge as busi-nesses decided to shift production to Asia. Hollowing out would be at thelong-run cost of employment and income growth in Japan (but not of cor-porate profits potential). But the voices of the critics were not loud orinfluential. Even in the summer (1993) when the yen was briefly in sight ofthe 100 level against the dollar, Governor Mieno stated ‘the central bankwill not alter its current monetary policy even though the rapid apprecia-tion of the yen is excessive and may harm the Japanese economy’ (NikkeiNews Bulletin, 18 August 1993).
But by summer 1993, the Clinton Administration had backed away fromits policy of talking up the yen, amidst signs that an incipient Japanese eco-nomic recovery was aborting. On 2 July, US Treasury Secretary Bentsenremarked that ‘he was not hoping for a further appreciation of the yen’(then at 107 to the dollar) (Nikkei News Bulletin). He stressed in a joint inter-view with the Nihon Keizai Shimbun, Wall Street Journal, and Handelsblatt,that too great a fluctuation in the currency was destabilising for theJapanese economy. The eventual further cut in the Bank of Japan’s dis-count rate in late September 1993 by 75bp (to 1.75 per cent), bringingmoney market rates below 2.5 per cent (Figure 4.22), received warm applausefrom Lloyd Bentsen – indicating that monetary ease was acceptable toWashington even though it could mean a weaker yen. Indeed, in late 1993the yen did fall back somewhat against both the DM and US dollar.
How would the Japanese economy have differed in the 1990s if Bank ofJapan Governor Mieno had cut the discount rate to 1.75 per cent by autumn1991 (rather than two years later), and had spent the subsequent two yearseducating international opinion as to why a weak yen was essential for theJapanese economy to return to prosperity (as opposed to preaching the dead-end virtues of a strong yen and smaller current account surpluses)? There is asaying that judgement nourishes the dead – and so it may be in the case ofjudging monetary policy-makers with respect to the casualties of severedeflation. Even without reaching a conclusion at this stage of the narrativewe can surely support the preliminary verdict that money in the years 1990–3had indeed become a monkey-wrench in the Japanese economic machine.

163
5Yen Opportunity Gained and Lost(1993–2000)
By summer 1993, the Japanese economy had proceeded far down thewrong road since its asset market bubbles had burst. Overly tight monetarypolicies, wrong currency signals from the policy control tower (especiallythe Bank of Japan Governor) and a new profligacy in public expenditurehad all played a role in the misdirection of the economy. True, the Bank ofJapan had at last brought interest rates down to a historic lowpoint (officialdiscount rate (ODR) at 2.5 per cent) in early 1993, and in the autumn(1993) was to reduce rates further (ODR down to 1.75 per cent), but thatwas far short of the aggressive ease required (ODR at 0.25 per cent coupledwith massive open market operations designed to step up the pace of mon-etary expansion) to reverse the errors of the previous two years. And theyen was at a stiflingly high level (except as perceived by those policy-makers in Tokyo or Washington who assessed equilibrium exchange ratesin terms of their consistency with the single aim of extinguishing theJapanese trade surplus). Although each separate move of the yen over thepreceding 3–4 years could be rationalised according to some plausible story,the totality of the moves had resulted in an acute misalignment. The yen,which had been at 160 against the dollar after the first slump in the equitymarket (spring 1990), was now at almost 100 (Figure 5.1) .
The tormenting rise of the yen was to continue a further two years.When the turn came, it was abrupt – one of the four almost equally violentdownturns in the history of the yo–yo yen (the other three being summer1978 to 1980, spring 1988 to early 1990; and autumn 2000 to early 2002)when measured in effective terms (against a basket of trade partners’ cur-rencies) and the most violent when measured bilaterally against the USdollar. Between summer 1995 and early 1997 the yen fell by around 30 percent in real effective exchange rate terms (Figure 2.1), to near 130 againstthe dollar. That was where the effective fall stopped, and indeed threatenedto reverse sharply in the wake of new meddling in the currency markets byboth Tokyo and Washington. But then the Asian crisis of summer 1997followed by Japan’s own financial system crisis brought a further big

164 The Yo–Yo Yen
Figure 5.1 Yen vs. US dollar and DM, 1993–8
decline of the yen against the dollar (and a somewhat lesser decline againstthe DM) to near 150 yen/dollar in summer 1998 (at that point the yen’sreal effective exchange rate was no lower than in early 1997 owing to thesharp decline of several key Asian currencies) compared to the peak of 80 inspring 1995 (Figure 5.2).
At that depreciated level of the yen in summer 1998 there was cause forrare optimism about Japan’s economic prospects. At last industrialexporters – the main potential engine of growth in Japan whose level ofefficiency ranks with the best elsewhere – could pull ahead and take upsome of the slack from the shrinkage of old inefficient Japan. Maybe evensome of the hollowing out of the mid-1990s, where big chunks of Japaneseindustry had been relocated abroad under the influence of the super-strongyen, would go into reverse. These hopes never materialised. In fact theywere dashed finally in just one day.
On 12 October 1998 the yen jumped by over 20 per cent in 24 hours.This shock from the currency markets gravely impaired the mechanisms forrecycling Japan’s huge private sector savings surplus into foreign assets. Asimultaneous further explosion in the budget deficit took up the slack(private sector excess savings flowing into government paper). Meanwhileat the Bank of Japan there was a reincarnation of the ‘hard currency,central bank independence at all cost’ spirit in the person of the newlyappointed Governor, Masaru Hayami. By summer 2000, the yen was back

Yen Opportunity Gained and Lost (1993–2000) 165
Figure 5.2 US dollar vs. yen and DM, 1993–8
to 100. That incredible story of opportunity gained and lost is the subjectof the present chapter.
The story starts in summer 1993, as the Japanese economy has just beenexposed to the powerful unilateral appreciation of the yen during the firsteight months of the year, bringing it to new peaks against the dollar andDM (near 100 and 60 respectively). Japan has its first government in almost40 years made up of parties other than the hitherto dominant LDP (LiberalDemocratic Party). Critical negotiations are in progress with the ClintonAdministration where Washington’s aim is to obtain measurable results interms of greater foreign access (particularly US) to Japanese markets. On theground, the Japanese press is full of accounts describing the scramble ofJapanese industry to relocate outside the country in cheaper-cost centres inAsia. For example:
11.1.1994 (The Yomiuri Shimbun) ‘The yen’s exchange rate against thedollar briefly approached 100 yen last year. Japanese manufacturers,doubly hit by the bubble’s burst and the yen’s appreciation, stepped upproduction overseas, particularly in China. This trend will not bereversed even if the yen depreciates in value. But it poses a new problem:the hollowing out of Japan’s manufacturing industry base. Newspapershave almost every day last year carried such headlines as ‘NEC to producepersonal computers in Hong Kong’, ‘Ricoh to form joint ventures with

166 The Yo–Yo Yen
Chinese and Hong Kong firms to produce fax machines’, and ‘MitsubishiMotors setting up joint venture in Vietnam.’ New waves of investment inAsia surged last year. Direct investment in China resembled a stampede.91 per cent of companies polled by the Japanese Machinery ExportersAssociation said that hollowing out would occur if the transfers of indus-trial plants continued to progress at the current rate.’
Hollowing-out of Japanese industry was the way in which the majormanufacturers in particular could preserve profits and thereby bear thesuper-strong yen. But the resulting squeeze on domestic employmentopportunity was bound to increase domestic opposition to economicreform (in the direction of deregulation). The unanswered question forUS–Japan relations was how much steam the higher yen would take out ofprotectionist pressure (from US industrial lobbies) in Congress and theClinton Administration thereby allowing an economic settlement to bereached with little reform. A test was not far away. A stand-off came inearly 1994. Ahead of a mid-February summit between Japan PM Hosokawaand President Clinton, Tokyo had delivered its by-now-customary sweet-ener in the form of a fiscal package, this time containing around $50bn ofincome-tax cuts and $65bn increases in public spending. Washington hadbeen demanding the tax cuts but expressed dissatisfaction that they werebeing presented as ‘one-off’ (effective for one year only). At the actualsummit, the mood was bad as Tokyo refused to make concessions towardsthe Clinton Administration’s demands for measurable targets on trade. Themeeting broke up without agreement.
Brief unilateral rise of the yen, early 1994
The failed Clinton–Hosokawa summit was the catalyst to a sharp unilateralrise of the yen (against both the dollar and the DM). Immediately followingnews of the summit break-up, the yen rose 6 per cent to around 101 againstthe dollar. It settled in following days at around 103, still making a gain ofaround 8 per cent since the start of the year. Reports in the financial mediasurrounding these events make it clear that the yen’s surge was a direct con-sequence of the new crisis in Japan–US trade relations, heightened furtherby reports (proved correct in early March) that the Clinton Administrationwould reinstate Super 301 (a provision of the 1988 US Omnibus Trade Actwhich would allow Washington to impose trade sanctions within a year onJapan if agreement now reached). But what was the story in the mind ofmany investors (including currency dealers) which justified this response ofthe yen? Some hints come in the following quotes:
14.2.1994 (Reuters News) Clinton has refused to rule out a possible all-out trade war with Japan. Despite denials by US officials that the White
Yen Opportunity Gained and Lost (1993–2000) 167
House has plans for a campaign to promote a stronger yen, many tradersinterpreted Clinton’s statements as indicating such tactics would beused. One analyst said he thinks the US will adopt a policy of ‘malevo-lent neglect’ with respect to the dollar yen and that he expects the dollarto push below 100 yen sooner rather than later.
1.3.1994 (Reuters News) US Trade Representative Mickey Cantor said (intestimony to a Senate Appropriations Committee) the ClintonAdministration saw no risk of Japan pulling out of US money marketsdue to bilateral trade friction. ‘Their stake is so large’ that there is no riskof them pulling back if trade tensions worsened. He said the US TreasuryDepartment had analysed the risk and found it to be non-existent.
In broad terms the rationale for the yen rising in the wake of the failedtrade talks included, first, fear that in an economic war between Japan andthe USA, Japanese investors might pull funds out of the USA (perhaps outof vague fear that these could be at risk from hostile action, including taxchanges; or perhaps under the influence of behind-the-scenes pressure fromthe Ministry of Finance which might view a yen spurt as a price worthpaying to inflict damage on US markets – for example a sharp fall in WallStreet – and thereby soften the US Administration into backing down fromits hard line, at which stage the yen would fall back and Japanese capitaloutflows resume). Second, there was a concern that the US authoritieswould somehow push up the yen so as to punish Japan, and in inflictingharm on its economy it would force Tokyo into submission.
The suggested rationale was at best weak. Despite the rhetoric and atti-tudes of some US negotiators, Japan and the USA were not remotely near asituation of economic war. Indeed, on the same day the Clinton–Hosokawasummit failed in February, the two leaders announced that they had agreedthey would cooperate in efforts to force the North Koreans to accept IAEA(International Atomic Energy Agency) inspections of their nuclear sites.Schoppa (1997) cites a state department official exclaiming that comparedwith the strategic issues at stake in North Korea the economic issues atstake in the Framework Talks were peanuts. Japanese policy-makersremained confident throughout that security leverage would not bebrought to bear on economic conflicts, and their confidence was borne outby the so-called ‘Nye initiative’ in autumn 1994 (when Assistant Secretaryof Defence Nye embarked on a campaign to repair what he and others inthe US political-security establishment perceived to be an erosion in thebilateral security relationship). Given that confidence, why would theJapanese authorities even think of stimulating a withdrawal of Japanesecapital from Wall Street?
And speculation that Washington would drive the yen up to force Tokyointo submission had no basis in reality. The Federal Reserve was not going

168 The Yo–Yo Yen
to oblige by cutting interest rates – indeed Chairman Greenspan was simul-taneously embarking on a sharp tightening of monetary policy. Massivesterilised intervention by the US Treasury (buying yen and selling dollars)was implausible, given the historical record of US intervention only beingsmall scale and in coordination with G-7 initiatives; there had never beforebeen controversial intervention – to push a currency in the opposite direc-tion to that perceived as equilibrium by the country of issue. Moreover,even sterilised intervention on a huge scale would have dubious effective-ness. And so all that remained was talk. US officials might talk the yen up.
In fact there was a disciplined refusal to talk – with the exception ofPresident Clinton who on several occasions, then and later, could notrestrain himself from expressing satisfaction whenever the yen jumped (forexample, in early July 1994, when the dollar had fallen to a new low of 96to the yen, President Clinton declared that it ‘is not the US’s problem butJapan’s trade surplus which has caused the dollar’s decline’). A potentialwelcome, however, from the president for a market-driven appreciation didnot provide much of a basis in itself for that appreciation taking place.
In sum, the flurry of the yen in response to the upset in trade negotia-tions in early 1994 was no more than that – a superficial movement drivenby fairly incoherent economic rumour-mongering. The only firm linksbetween Washington’s trade strategy and the yen were the same as thosealready discussed and evident in early 1993 – the likelihood of Tokyo pur-suing aggressive fiscal expansion and thereby soaking up more of thedomestic private savings surplus rather than it flowing out into foreignassets, and an increased aversion towards bearing foreign exchange risk byJapanese investors (based on concern that trade frictions could mean astronger yen even though there was no well-specified model as to how thiswould occur – just a feeling of unease). Perhaps all the rhetoric surroundingthe failed summit had made Japanese investors somewhat uneasier than inrecent months, but that mood could change for no very good reason.
Governor Mieno’s defiant exit
In fact, talk by Japanese officials themselves continued to play a greater rolein causing Japanese investor unease than any comments out ofWashington – greater because such comments indicated action or lack ofaction. Critically, support for a strong yen from the Bank of JapanGovernor meant that he would hardly be recommending aggressive mone-tary ease towards lowering it in value.
At the end of 1993 there had briefly been speculation in the market-placethat the Bank of Japan would ease policy. The Shinseito party, a member ofthe seven-party (excluding the LDP) government coalition had called for adecrease in the discount rate to 0.5 per cent from its current 1.75 per cent.

Yen Opportunity Gained and Lost (1993–2000) 169
But early 1994 did not bring any good news on monetary policy. The mosteffective tool towards cooling the yen currency market – an aggressiveeasing of monetary policy – remained locked up. Even later in the yearwhen the yen had risen further to around 95 against the dollar, GovernorMieno continued to trumpet a model of exchange rate determination basedon current account balances as the dominant factor, and thereby claim thatthe central bank was powerless to prevent appreciation, as the followingquote demonstrates:
2.11.1994 (Reuters News) Japan’s central bank chief kept his cool in theface of the yen’s relentless rise, telling businessmen that there is noquick fix. Touring cities in western Japan, Governor Mieno called for along-term prescription for the strong yen; cut the nation’s huge currentaccount surplus. ‘When the dollar was moving at above 100 yen, itsimpact on the economy was neutral, but recent moves have madecareful watching necessary.’ … ‘It is not possible to avoid the yen’s risetemporarily as it is closely based on the imbalance between savings andinvestment’ he said. ‘Americans spend faster than they save, whichcauses budget and trade deficits and keeps foreign investors away fromdollar holdings. Japanese tend to save more than they spend, holdinghuge capital reserves at home.’ … ‘In the long run, Japan’s currentaccount surplus must be cut back as this always becomes a factor for theyen’s rise.’ Nonetheless Osaka business leaders lambasted Mieno. Achairman of a medium-size enterprise making heavy machinery com-plained ‘I am very worried about the pace of the manufacturing sector’shollowing out because once manufacturing moves overseas it won’tcome back.’ Another businessman asked ‘are we going to start payingour salaries in dollars if the current high yen does not stop? Are wegoing to pay our taxes in dollars too?’
The comments of Yasushi Mieno, barely two months before the end ofhis term as Governor, reveal as great a misunderstanding as ever concern-ing the relationship between the large private sector savings surplus, thecurrent account surplus, and the exchange rate. Yes, a large sector savingssurplus means an equally large current account surplus. But if interest ratesfall to an equilibrium level which reflects the high savings rate, and themechanisms for channelling excess private savings into foreign assets areworking well, then the currency should be lower than in the time of thebubble economy when savings were lower and investment spending ateuphoric levels (and the current account surplus smaller than in theearly/mid-1990s). If indeed the government could engineer a lower savingsand current account surplus – whether by direct measures to stimulate con-sumer spending or by a powerful expansion of the budget deficit – thatwould mean a higher, not lower, value of the yen in equilibrium.

170 The Yo–Yo Yen
Currency markets are understandably more sensitive to wrong-headedand confused economic doctrines exposed by central bankers than academ-ically respected views about an eventual equilibrium that might nevercome about. And so it was with the yen through the Mieno years. It is opento doubt, however, whether Governor Mieno had anything new to say thatcould influence markets by late 1994. And his comment just one day beforeretiring that ‘it must be noted that the Japanese economy can benefit froma stronger yen in the long run’ (Nikkei News Bulletin, 16 December) washardly a new opinion. By that stage – and indeed ever since the spring(1994) – the yen had moved out of centre-stage in the currency markets.The period between March 1994 and February 1995 was one of dominanceby the DM–US dollar axis, with the dollar falling, the DM rising, andthe yen in-between (albeit nearer the rising DM than the falling dollar)(Figures 5.3, 5.4 and 5.5).
An unexpectedly early and strong recovery of the German economy fromthe recession of late 1992 and 1993 was the fundamental force behind DMstrength. Though the Federal Reserve was sharply tightening monetarypolicy, US bond yields did not rise relative to Bund yields (Figure 5.6).Dollar fixed-rates had already discounted considerable monetary tighteningwell in advance and so they rose only moderately.
Indeed, by late 1994, long-maturity dollar fixed rates were beginning todiscount a slowdown of the US economy (the shape of the yield curve is arecognised leading indicator in business cycle analysis, with a flattening ofthe curve typically preceding a turning point in the cycle from fast to slowgrowth or even recession). DM fixed-rates had jumped on first indicationsof economic recovery early in 1994 and then rose in step with dollar fixed-rates (Figure 5.7). (It is the differential between long-term fixed-rates whichis the interest rate variable of most influence on the DM (euro)–dollarexchange rate.) US hedge funds were reported to be large buyers ofEuropean bonds and equities.
US investors had also been huge buyers of Japanese equities especially inthe first half of 1994 (when the total foreign inflow into Tokyo equities(which were rising briefly – see Figure 5.8), reached almost $100bn p.a.) onincreasing evidence that an economic recovery was indeed taking root inJapan after the setbacks of the previous year (the jump of the yen in thefirst half of 1993 had delayed the cyclical turnaround) (see Figure 4.28).Thus it is possible to explain at least part – and even most – of the spurt ofthe yen in early 1994 as due to that influx of foreign funds rather than justdark fears about US–Japan economic conflict. And, indeed, through thespring and summer there had been a calming of the rhetoric. In May (1994)talks had restarted between Washington and Tokyo, and by Septemberagreement was reached covering all issues except autos and auto parts, bothsides claiming victory. Schoppa (1997) argues that the victory lay withTokyo, in that the agreement ‘simply fell short of what the USA needed in

171
Figu
re 5
.3D
M c
orn
er, 1
993–
8
1S
olo
Yen
2U
SD
–Yen
axi
s do
min
ates
3Y
en–D
M a
xis
dom
inat
es
4S
olo
DM
5U
SD
–DM
axi
s do
min
ates
6S
olo
US
D

172
Figu
re 5
.4U
S d
oll
ar c
orn
er, 1
993–
8
1S
olo
Yen
2U
SD
–Yen
axi
s do
min
ates
3Y
en–D
M a
xis
dom
inat
es
4S
olo
DM
5U
SD
–DM
axi
s do
min
ates
6S
olo
US
D

173
Figu
re 5
.5Y
en c
orn
er, 1
993–
8
1S
olo
Yen
2U
SD
–Yen
axi
s do
min
ates
3Y
en–D
M a
xis
dom
inat
es
4S
olo
DM
5U
SD
–DM
axi
s do
min
ates
6S
olo
US
D

174 The Yo–Yo Yen
–
–
Figure 5.6 10-year yield spreads, T-bond over JGB and Bund, 1993–5
Figure 5.7 10-year JGB, T-bond and Bund yields, 1994–7

Yen Opportunity Gained and Lost (1993–2000) 175
Figure 5.8 Japan equity market vs. 10-year JGB yields, 1993–2001
order to hold Japan accountable’. In October Washington initiated Section301 proceedings against Japan charging that Japanese government regula-tion of the auto parts after-market discriminated against foreign parts-makers – a less inflammatory proceeding than ‘naming Japan’, butnonetheless with a deadline attached for retaliatory action of April 1995.
Yen rises to the sky, early 1995
It is difficult to find any trace of the final stage trade negotiations over theensuing eight months on the currency markets (until a final deal was con-cluded at end-June 1995). There were so many other relevant events whichcould explain the end-lap rise of the yen from around 95 to the dollar inlate 1994 to its peak of 80 in the following April (1995). Moreover the factthat the rise of the yen was matched by the DM over the period as a whole(late 1994 to mid-1995) – albeit that there were sub-periods when the yenwas rising faster than the DM, and conversely – suggests that trade negotia-tions were not a key influence. Surprisingly some events, which were laterto prove positive for the dollar, had no immediate impact on currencymarkets. These included key changes amongst senior economic policy-makers in both Tokyo and Washington.
First, in early December (1994), Lloyd Bentsen announced his intentionto resign as US Treasury Secretary, and Robert Rubin was designated as his

176 The Yo–Yo Yen
successor. The transition from a Treasury Secretary from Texas, widelyregarded as sympathetic to a cheap dollar (he had made no explicit pro-devaluation remark since the early days of the Administration, but asrecently as October his comment that the USA had no intention of inter-vening in the currency markets even though the dollar was then flounder-ing received the blame for a subsequent drop), to a Wall Street star (formervice-chairman of Goldman Sachs), renowned for his understanding offinancial markets, could be good news for the dollar. Back in June, in hisposition as White House economic adviser, Rubin had made a public state-ment that the Administration was not pursing a weak dollar policy.
Yet the immediate commentaries in the Japanese press were not encour-aging. The Nihon Keizai Shimbun, for example, reported (December 7), ‘thegovernment is worried that the Treasury changeover could have some neg-ative effects because Japan can no longer count on the support of aninfluential moderate cabinet member such as Bentsen’. Other commentssuggested that the Clinton Administration was in disarray (following thesetback for the Democrats in the Congressional elections of November1994) and this could harden Japan’s negotiating strategy, meaning a possi-ble new crisis in Washington–Tokyo relations as in February 1994 (whichbrought a blip in the yen). As against that consideration, there were wide-spread rumours of the US negotiating team being in disarray and of theimminent departure of chief trade representative Mickey Kantor.
Second, in mid-December, the Japanese government had announced thatYasuo Matsushita, a former Sakukara Bank chairman and vice-finance min-ister (a top bureaucratic position in the Finance Ministry), was to succeedMieno (with effect from 18 December). As a former Ministry of Financeofficial, Matsushita was expected to be less zealous about promoting Bank ofJapan independence. As a banker he was likely to be more understanding ofthe growing problems within that industry stemming from the rising totalof non-performing loans made originally during the years of the bubbleeconomy. Indeed there was evidence of a more accommodative monetarystance under the new Bank of Japan Governor already by year-end.
Back in autumn 1994 Mieno had not discouraged incipient speculationon an early rise of rates as economic recovery continued. The Nihon KeizaiShimbun, on 1 November 1994, reported his approval of the recent rise inlong-term interest rates, which had brought 10-year JGB yields to around4.75 per cent from barely 3 per cent at the start of the year (see Figure 5.8),saying that interest rates must be compatible with business conditions.Mieno’s evaluation of the fixed-rate market was of course open to question.With inflation non-existent – indeed the present situation was one ofdeflation (see Figure 5.9) – the real yield on government bonds was almost5 per cent, an incredibly high level for an economy just beginning to pullout of a severe post-bubble depression with a structurally high privatesector savings surplus. In so far as market-participants took note of Mieno’s

Yen Opportunity Gained and Lost (1993–2000) 177
–
–
Figure 5.9 Japan private consumption deflator, 1985–2001
opinion, he helped to push fixed-rates, not just the yen, in an oppositedirection to that consistent with overall equilibrium of the economy.
The new Governor took the first opportunity of an interview(27 December) to distance himself from the view of his predecessor: ‘tomake this move towards economic recovery more certain, we will maintainthe present policy stance … the cost of holding non-performing loans willincrease if interest rates go up’. His comment was a contradiction of a viewexpressed a few days earlier by the chief economist at Salomon BrothersAsia Ltd: ‘the Bank of Japan is likely to maintain its recent policy of gradu-ally allowing call rates to edge upward. The overnight call rate is likely torise from the current level of 2.25 per cent to about 2.75 per cent in thespring, with a 50-point basis point hike of the official discount rate possibleat the start of the new fiscal year’ (Nikkei Weekly, 19 December 1994). Thatwas a very bad forecast. As we shall see, call rates were down to 1.25 percent by spring 1995 and 0.5 per cent by summer 1995 (Figure 5.10). But tobe fair to Salomon’s economist, he was not to know that another steep fallof the dollar lay ahead, that the Mexico crisis was on the point of erupting(peso devalued, 21 December), and that Japan was about to suffer its worstearthquake disaster since 1923.
The immediate impact of the Mexico shock, coupled with gathering evi-dence of a sharp slowdown of the US economy (see Figure 4.28), on cur-rency markets was to bring about a weaker dollar most of all against the

178 The Yo–Yo Yen
0.0
0.5
1.0
1.5
2.0
2.5
3.0
3.5
4.0
4.5
Japan discount rateJapan unsecured overnight call rate
93 94 95 96 97
Figure 5.10 Japan official discount rate vs. overnight call rate, 1993–7
DM. From mid-December until end-February the dollar fell from DM/$1.58to 1.46 and from yen/$100 to 97 (see Figures 5.3, 5.4 and 5.5). Some esti-mates circulating put the negative effect of the Mexico crisis on US eco-nomic growth in 1995 at as much as two percentage points. Europe andAsia should not be directly sensitive to events in Mexico. Arguably the indi-rect effect – via the induced slowdown in the US – should be greater onAsia than Europe, justifying a stronger DM than yen. Outside the G-3 trian-gle, currencies of the G-7 countries which had less than top credit-rating –the Canadian dollar and the Italian lira – were sold heavily as investorsworldwide scurried into supposed safe-havens.
Japan itself was hardly a safe-haven. Its banking system was increasinglyunder the spotlight, and indeed many of the press commentaries on theappointment of Matsushita as Bank of Japan Governor had stressed thatone main job would be ‘sorting out’ the festering bad debt problem. ButJapan is a huge creditor nation and though foreigners may have beenseeking to lighten up on their holdings on some Japanese assets, Japaneseinvestors themselves would have been liquidating perceived high-riskforeign assets especially with the end of the financial year 31 (March)looming. And the immediate question in the currency market followingthe devastating earthquake which struck Kobe on 17 January 1995, was towhat extent Japanese investors might pull funds out of the USA in particu-lar to fund reconstruction – the mechanism for the pull-out being higher

Yen Opportunity Gained and Lost (1993–2000) 179
yields in Japan (reflecting increased demand for capital) drawing somefunds back from foreign assets. Immediate estimates of the amount ofcapital required for reconstruction ranged between 2 and 3 per cent ofJapanese GDP (spread over, say two years, meaning 1–1.5 per cent of GDPeach year).
The question of how earthquake risk should affect the yen and yen inter-est rates had of course been raised by some analysts well before the Kobeearthquake. But the uncertainties associated with any estimates either as topotential damage and its influence on the eventual equilibrium path of theJapanese economy or as to the probability of earthquake itself were so greatthat it would be difficult to demonstrate any influence of such questioningon market valuations. (The normal type of scare article on earthquake risknoted that in the past 200 years for which there were records, a seriousearthquake had struck Tokyo at fairly regular intervals of around 70 years,suggesting a high risk of a new such quake in the near future, in that thelast one was in 1923. The confidence, however, attached to any such esti-mates based on a very small historical sample and given the notoriouslypoor predictive power of geologists, had to be very low.) In principle, earth-quake would fuel demand for capital and reduce present savings (as con-sumers in the stricken areas would deplete savings to maintainconsumption) and so the equilibrium rate of interest would rise. This mightwell justify a jump in the value of the yen – although a possible counter-consideration could be a downward revision in estimates of where the yenshould be in the far distant future. In principle, the run-down of foreignassets – or smaller rate of accumulation of foreign assets – during the periodof reconstruction would mean less investment income from abroad overthe long-run. But higher interest rates in the interval could well justifypaying a higher spot price for the yen, even though its rate might be even-tually lower than if the earthquake had not occurred.
That higher price (for the yen) would not come about if there were con-siderable aversion towards assuming exchange risk (meaning net flows ofadditional capital into Japan would only take place if there weresignificantly higher returns on yen assets, net of prospective exchange ratechanges, than previously) and if the earthquake itself produced a surge indemand for imports or fall in exports due to supply constraints. Underthose circumstances, the currency could come under substantial downwardpressure. That had been the case in the Great Tokyo Earthquake of 1923(see Chapter 1). This time the overall magnitude of damage (relative to thesize of the economy) had been much less and Japan was much more inte-grated into world capital markets (meaning capital flows triggered by ratespreads would be greater, although restrained by exchange risk aversion).And although dislocation to Japan’s main port city would mean loss ofexports, there was not a prospective big shortage of materials (for example,cut wood for house building) as in 1923.
180 The Yo–Yo Yen
Another potential negative influence on the yen would come from anyunfavourable reassessment about the state of the Japanese political oreconomic system. And in the aftermath of the quake there was wide-spread criticism of Japanese public institutions – failures of the emer-gency services and exposure of bureaucratic inefficiencies. But none ofthis could be described as fundamentally new information. It could beargued that investor consciousness had been kindled about the poten-tially much larger disaster which could occur if Tokyo were struck byearthquake, but what that meant for the yen was unclear. Perhaps moreinvestors and borrowers could come round to the view that long-terminterest rates in yen should include an earthquake premium (reflectingthe possibility that at some time before maturity of the particular instru-ment considered there would be a jump in interest rates due to a surge indemand for capital caused by a disastrous quake) – but more than a fewbasis points seemed hardly justifiable and maybe it was already includedin present rates!
In fact the main market impact of the Kobe quake was on Tokyo equities,which plunged amidst increasing estimates of earthquake damage, the neg-ative effect on corporate profits and feared upward movement of bondyields. Any sober assessment, however, concerning the influence of thequake on bond yields, would have suggested only a small effect. A decreasein the net savings surplus by, say, 1 per cent of GDP for each of two yearswas very small compared to the huge increase in the private sector savingssurplus following the collapse of the bubble economy. And as discussedabove, Japanese fixed-rates were already extraordinarily high in late 1994.
In fact the next major move – and very soon – of Japanese fixed-rates wassharply down, as the falling dollar and US slowdown spread pessimismabout the economic outlook and speculation grew about an easing of mon-etary policy. That speculation was encouraged by the sharp rise of the yen,which occurred between the start of March and mid-April, bringing the yenfrom 95 to 80 against the dollar. During the same period, the dollar’s fallagainst the DM was much less – from 1.45 to 1.35 – meaning that the pre-vious long episode (since spring 1994) of dominance of the G-3 triangle bythe DM–dollar axis had given way to a brief episode of dominance by theyen–dollar axis (see Figures 5.11 and 5.12).
This jump of the yen to its all-time high had no direct link to trade nego-tiations between Washington and Tokyo. But Japanese investors – andforeign exchange dealers – were evidently in a state of alert for any short-run impact of a blow-up in talks to resolve the automobile dispute ahead ofthe deadline (May) after which Washington would announce Super 301penalties if no agreement reached. The flurry of the yen in early 1994 was awarning to be cautious. A clumsy remark by Federal Reserve GovernorLindsey on a visit to Tokyo in early March 1995 does seem to have beenthe catalyst to the yen re-entering the limelight in the G-3 currency

Yen Opportunity Gained and Lost (1993–2000) 181
Figure 5.11 Yen vs. US dollar and DM, February–April 1995
Figure 5.12 US dollar vs. yen and DM, February–April 1995

182 The Yo–Yo Yen
markets, in that a highly nervous audience could deduce that the FederalReserve was now in a pact with the Administration to lower the dollar.
Specifically, on 1 March in an interview with JIJI Press, Lawrence Lindseysaid that the dollar’s weakness against the yen is ‘not at a critical level yet’.According to JIJI Press Newswire (2 March 1995) he said that the upwardpressure on the yen might continue as neither Japan’s trade surplus nor the US trade deficit was likely to narrow sizeably. Lindsey also commentedon the weakness of the dollar against the DM, attributing this to themarket’s perception that the USA probably ‘is close to the end of a cycle of interest rate increases while Europe is probably at the beginning of that cycle’. Indeed the week before in Congressional testimony FederalReserve Chairman Greenspan had hinted that rate hikes had come to anend.
The comment that jarred with the markets was ‘yen not at a critical levelyet’. The rest was irrelevant – including the governor’s trumpeting of anerroneous hypothesis that so long as a country runs a current accountsurplus its currency will rise (Japanese audiences were used to the samehypothesis having been aired by ex-Governor Mieno). Critical for what?For the Japanese economy? But Lindsey was hardly likely to be the bestjudge of that. For US monetary policy? Presumably that is what Lindseywas referring to. The most plausible interpretation of the remark was thatthe dollar’s fall in itself was not yet serious enough to influence FederalReserve policy. Perhaps the disproportionate effect of Lindsey’s remarks onthe yen simply reflected the fact that Japanese investors had been hopingfor Federal Reserve action to bolster the dollar and were now disappointed,whereas investors elsewhere in the world had entertained no such expecta-tions. So with the end of the financial year approaching, Japanese investorsand corporations rushed for cover.
There was also the more sinister interpretation which could haveinfluenced highly nervous opinion in Tokyo – that the Federal Reserve wasfollowing a policy of benign neglect towards the dollar so as to give theAdministration a helping hand in its trade strategy. But in more sobermood Tokyo investors would surely have questioned whether the FederalReserve was about to break with its long history of largely ignoring the cur-rency markets and eschewing deals with the White House which wouldjeopardise its independence. And even if Alan Greenspan were inclined tomake an exception in this case, why would the policy shift have a biggerimpact on the yen than on the DM versus the dollar? They might also haveasked whether Lindsey’s views were really indicative of what was in MrGreenspan’s agenda.
But these were not sober times in the currency markets. The dollar wasplummeting towards record lows. The opposite side of the bubble yen wasdollar blues. Any investor who had believed that fundamental economicforces should produce a weak yen following the burst of the bubble

Yen Opportunity Gained and Lost (1993–2000) 183
economy and acted on that belief would have lost a huge amount by now.Could he have the boldness to add to his dollar positions now or would hisbad fortune have destroyed his confidence in his own ability to understandcurrency markets? In the short run, institutional investors had the end ofthe financial year to consider – they had to hedge large open positions indollars so as to protect their profits from the possibility of more erosion inthe next few weeks. And here was Governor Lindsey warning that the yencould rise further! Add to that the fact that currency bubbles normallyinclude an important element of panic-driven liability rearrangement byinternational borrowers (seeking to repay loans in the currency that isrising strongly so as to limit their losses). Specifically in Asia the yen hadbeen used widely as a borrower currency, especially by governments.
There were reports now of Asian governments, or their central banks,building up yen reserves. Not all of this was as a hedge against yen-denom-inated debts outstanding. There was speculation that some Asian centralbanks had decided to reduce the share of the dollar and increase the shareof the yen in their reserves as part of a long-run investment strategy. Somecommentators heralded a serious erosion of the dollar’s traditional reserverole in Asia. In general any market story about portfolio shifts by centralbanks has been of transient significance only – whether central banksdumping sterling in 1976, dollars in 1978–9, or again in 1995. If sterilisedofficial intervention in the foreign exchange markets to the extent of tensor even hundreds of billions of dollars is generally viewed as ineffective,why should portfolio shifts by central bank investors have any greaterimpact? But spring 1995 was not a time of calm reflection in the currencymarket-place. And a barrage of soothing comments – and action – by US officials following Governor Lindsey’s interview had virtually noimpact.
Indeed, almost immediately the US Treasury participated in joint inter-vention in support of the dollar and on 7 March Rubin issued a statement:‘a strong dollar is in the US national interest’. President Clinton statedalmost simultaneously, ‘You know, one of the things I’ve learned is thatanything I say on this subject is wrong; so the Treasury Department istaking appropriate action today, and I don’t think I should say anythingelse. (Reuters, 7 March 1995). On 8 March, in Congressional testimony,Chairman Greenspan said that the weakness of the dollar against othermajor currencies is both ‘unwelcome and troublesome and adds to poten-tial inflation pressures’.
None of these three statements could be described as forceful. Investorslong stung by the falling dollar could be understandably sceptical of com-ments from the new Treasury Secretary and the latest clever opaque state-ment from Federal Reserve Chairman Greenspan which suggested anattempt to encourage expectations of a possible rate rise without in anyway preparing to deliver one.

184 The Yo–Yo Yen
The market mood in Japan was one of alarm. Currency bubbles, unlikeequity or real-estate bubbles, can be driven by cold fear rather thaneuphoric optimism. At the opposite end to one currency reaching the skycan be another currency plummeting to the depths. This was true of theweak dollar versus the strong yen and DM in 1994–5, the strong dollarversus the super-weak DM in early 1985, or of the extraordinarily strongSwiss franc in autumn 1978 versus the weak dollar. A currency bubble can be driven at least in part by euphoric optimism – for example the US dollar at its peak of around 3.40 to the DM in early 1985 reflected inpart huge optimism about Reaganomics and in part extreme pessi-mism about German economic and political prospects. But there was certainly no economic euphoria to match the bubble of the yen in early1995.
Indeed, there was only gloom about the Japanese economy as the yenreached its all-time high just below 80 against the dollar in mid-April. Thefollowing press quotes give a sampling of the pessimism at large and themood in the yen currency markets:
9.3.1995 (Los Angeles Times) A sense of crisis swept Japan yesterday asthe dollar fell to yet another post-World War Two low of 88.75 yen. NECCorp. Chairman Sekimoto declared that not only is there a real dangerto recovery in Japan but that we could be witnessing the beginnings of acrisis that could engulf the entire world economy. But Prime MinisterMurayami said unilateral action by Japan would be insufficient and MITIMinister Hashimoto indicated that an interest rate cut is unlikely.
21.3.1995 (Business Times Singapore) The continuing decline of the USdollar has revived the idea of a yen bloc in Asia. But while there are signsof a switch from dollars to yen in Asia’s holdings of foreign exchangereserves, the region remains ambivalent.
27.3.1995 (Nikkei Weekly) The dramatic decline in the value of the dollaragainst the yen over the past few weeks is probably due not to just onefactor but to a confluence of circumstances. At the same time, it is clearthat this is a dollar problem and not a yen one. … An immediate causefor the dollar’s drop to below 90 yen may have been comments byFederal Reserve Governor LaWare where he said that the Fed isn’tworried about the inflationary pressure of a weaker dollar as this will be offset by higher US productivity … While companies are grumbling,certainly travelling consumers are not.
7.4.1995 (Reuters News Service) With the world’s top central banks seem-ingly stumped by the slide in the dollar, there is little left to stop the UScurrency from falling to one record low after another, Tokyo dealers say.

Yen Opportunity Gained and Lost (1993–2000) 185
Despite Wednesday’s concerted intervention by Japanese, US andGerman central banks to bolster the dollar, the currency still spiralleddown a succession of global lows this week to touch 83.65. People in themarket are now convinced that any short-term policy measures cannothalt the dollar’s decline. One chief dealer said what the dollar needs (torecover) is a reduction in the US–Japan trade imbalance through greaterde-regulation of the Japanese economy and a trimming of the US budgetdeficit. The inveterate need for Japanese exporters to convert their over-seas earnings into yen is chronically dragging down the dollar. On topof that, the Bank of Japan’s dollar-buying intervention has been over-whelmed by dollar-selling from Asian central banks and Japanese lifeinsurance firms conducting hedging strategies to protect the value oftheir assets. These are not speculative sales but aimed at hedging againstany further falls in the dollar.
9.4.1995 (JIJI Press Newswire) The dollar is expected to remain underselling pressure this week, due to speculative action by US based fundoperators and the build-up of yen reserves by some Asian central banks.Given the Bank of Japan’s failure so far to cut its official discount rateand futile co-ordinated currency market intervention by the Japanese,US, and German central banks last Wednesday, many market playersappear to believe there is no effective way to stop the yen’s surge for themoment a foreign bank official said.
10.4.1995 (Nikkei Weekly) ‘Although certain Asian central banks havebeen converting their funds from dollars to yen for some time now,China and Indonesia have recently joined the selling party’ a seniorforeign exchange manager of a Japanese bank said. A dealer at a Swissbank in Tokyo said, ‘when you consider the Bank of Japan’s currentmonetary policy and the political inaction, there is simply no singlecompelling reason to believe the dollar will re-bound’. Market partici-pants became increasingly bearish about the dollar during the week afterthe Bank of Japan continued to distance itself from growing public callsfor a cut in its official discount rate. A forex manager at a German bankcommented that the Bank of Japan had missed its best chance to impactthe market by lowering the rate.
The last two quotes indicate that a factor in the run-up of the yen was dis-appointment that the Bank of Japan had failed so far to take monetaryaction to diffuse the growing bubble. By contrast the Bundesbank hadalready cut rates at the beginning of the month – and its earlier move was afactor in why the yen had raced ahead of the mark. Eventually in mid-March the Bank of Japan did bend to pressure and cut its official discountrate by 75bp to 1 per cent. Conditions were coming into place for the yen

186 The Yo–Yo Yen
to turn down. But there was still widespread scepticism, as the followingquote reveals:
13.4.1995 (Reuters News Service) Rubin has repeatedly professed his desirefor a strong dollar, but the United States has so far shied away fromtaking tough action to make that a reality. Washington instead seemscontent to let Tokyo stew under the pressure from the strong yen –hopeful that will prod the Japanese government into attacking its bigtrade surplus. Japanese corporations are likely to respond to the yen’slatest surge by moving more production facilities offshore to the rest ofAsia. Analysts said that should enhance Tokyo’s economic clout in theregion, albeit at the expense of jobs in Japan. Asian nations likeIndonesia are suffering because much of their debt is denominated inyen. In response some have begun diversifying their foreign currencyholdings by selling off dollars to buy yen, raising questions about thegreenback’s ultimate ability to retain its role as the world’s key reservecurrency.
The yen’s almost unilateral decline, autumn 1995
In fact the dollar was almost at its nadir and the yen almost at its peak.From 12 to 19 April there was a last plunge of the dollar against both theyen and the DM bringing it to all-time lows of around 80 yen/dollar and1.35 DM/$ respectively. During May, June, and early July the yen/dollarrate oscillated around the mid-80s and the mark/dollar rate at around 1.40.At a G-10 meeting in Washington in late April a joint communiqué hadexpressed the concern that exchange rates had gone beyond the leveljustified by underlying economic conditions. High-level trade talksresumed between Japan and the USA in early May, but Rubin reiteratedrecent statements in favour of a strong dollar and that Washington wouldnot use the currency as an instrument of trade policy. In early June a boutof coordinated central bank intervention in support of the dollar began tobring about a change in market perception of the US Administration’sstance on the dollar – even though the 28 June deadline when US punitivetariffs against 13 Japanese luxury cars was to come into effect if no tradeagreement had been reached, lay just ahead. After a mid-June meetingbetween the Japanese Finance Minister Masayoshi Takemura and the USTreasury Minister Robert Rubin a communiqué spoke of exchange ratesbeing out of synchrony with the fundamentals.
News of an agreement at end-June on the trade dispute brought noimmediate significant change in the currency markets – consistent with thehypothesis that this issue had not been a direct influence on the yen inrecent months. Either markets believed Treasury Secretary Rubin that thedollar was not to be used as a trade tool, or they had expected agreement

Yen Opportunity Gained and Lost (1993–2000) 187
anyhow, or they had judged that even if Washington intended to use thedollar–yen rate as a trade tool they could not – US power to manipulatecurrencies was just bluff. It was in late July that a sudden downturnoccurred in the yen. There had been reports of growing concern inWashington about the fragile state of Japanese banks. This backed a newperception in the market-place that the USA saw Japanese recovery as thenew priority in its international economic policy and that trade concernshad receded. There were rumours that Eisuki Sakakibara, appointed in lateMay as head of the Ministry of Finance’s International Financial Bureau atend-June, had concluded a reverse Plaza agreement whereby the dollarwould be pushed higher. Although Sakakibara had a reputation as a toughnegotiator, and in his book ‘Beyond Capitalism’ had extolled Japan’s distinc-tive non-capitalist market economy, he was well received by his US oppo-site numbers. With a doctorate from the University of Michigan,negotiators in Washington saw him as a diplomat who ‘acts, thinks, andresponds like them’ (Reuters, 26 May 1995).
Then in early August (1995) came a package of deregulation measures inTokyo to promote capital exports whose announcement was coupled witha bout of joint US–Japanese intervention in the dollar–yen market. The yenwas now through 90 against the dollar and was also down against the DM.The Bank of Japan eased monetary policy and by early autumn the dis-count rate and call money market rates were down to 0.5 per cent (seeFigure 5.10). By late autumn 1995 the yen had crossed through the 100level against the dollar, whilst continuing to depreciate also against theDM. The DM–dollar rate was still floundering in the low 1.40s (albeit upfrom the lowpoint in the mid-1.30s) (see Figures 5.1 and 5.2). How can weexplain this striking turnround of the yen? The deregulation measures inthemselves were hardly substantial (scrapping limits on insurers’ participa-tion in syndicated loans and on their foreign currency loans to overseasborrowers). Probably much more important were the cuts in money rates,with the call rate falling initially by 25bp to 1 per cent in the summer andthen by a further 50bp in early September in the midst of a worseningbanking crisis as described below. Long-maturity fixed rates had also fallensharply since the start of the year – with 10-year JGB yields at 3 per cent bylate summer (compared to 4.5 per cent at the start of the year, see Figure5.8). The long-term rates, however, were still high in real terms (withinflation at zero or negative), and US dollar long-term rates had fallen asmuch, and indeed were to fall even further in late 1995 whilst Japaneserates remained on a plateau (see Figure 5.7).
There were also other factors pushing the yen down which could haveplayed at least as important a part as the shift in monetary policy. One waspsychological – notoriously difficult to measure but nonetheless potentiallyimportant. When the yen was at its bubble-peak of 80 against the dollarthere were many investors who could see that this was unsustainable in the

188 The Yo–Yo Yen
long run, except in way-out scenarios to which they could attach only asmall probability. Even the academic high-priest of the neo-mercantilists inWashington, Fred Bergsten (head of the Institute of InternationalEconomics and formerly senior international economic adviser in theCarter Administration), who had typically wide media coverage in Japan,said enough was enough in late April – ‘any further decline in the dollarshould not take place against the yen’ (Reuters, 26 April 1995). How couldthe Japanese economy, with its fragile economic recovery which hadstarted the previous year, and with increasingly evident strains in itsbanking system, bear a further powerful deflationary shock emanating fromthe currency markets? Something had to give.
In the wild currency markets of spring 1995, who had the courage tobuck the trend? Not many – other than small bank clients buying up stocksof dollar banknotes. Once the turn came, however, and there were orches-trated moves in Tokyo and Washington, these investors who had beensceptical of the yen’s strength were emboldened by each other’s behaviour(as evidenced by the falling yen) to move out of the yen into foreign assets(mainly dollars). More technically, the level of risk premium which theseinvestors required to justify the accumulation of foreign assets most proba-bly fell, given that there was no longer the danger (however imprecise orimplausible) of Washington talking up the yen or of senior officials inTokyo having the same effect. In practical terms the big security housescaught a popular mood in large-scale advertising to promote their foreigncurrency bond funds. The following quote illustrates the point:
4.10.1995 (Nihon Keizai Shimbun) Italy’s Treasury Ministry will issue2 billion of dollars worth or Eurobonds maturing in 2001, targetingJapanese investors. The move comes in response to growing interest inforeign bonds among Japanese individual investors. Foreign bondsbecame more attractive after Japanese interest rates fell to record lows.
A second factor driving down the yen was the growing crisis of confidencein Japan’s banks. Already at the end of July a credit union Cosmo ShinyoKumiai suffered a dramatic run on its deposits and was ordered to stopoperations. Then there was the insolvency of Hyogo Bank (a regional bank)and Kizu Credit Union in early September. Alongside was the question ofthe ailing Jusen (specialised housing loan firms), which were heavilyindebted to the banks and to politically well-connected agricultural bodies.Then in late September came news of the huge losses connected with fraud-ulent trading at Daiwa Bank’s New York branch. Ominously the so-calledJapan premium emerged in the international deposit market (last seen inthe aftermath of the 1979 oil shock). Even leading Japanese banks had topay as much as three-eighths of a percentage point over LIBOR (LondonInter-Bank Offered Rate) for funds borrowed in the interbank market. With

Yen Opportunity Gained and Lost (1993–2000) 189
no natural deposit base of their own in dollars, Japanese banks were tradi-tionally huge borrowers in the interbank market to finance their interna-tional lending and also their trade credit business (an exceptionally largeshare of Japanese exports and imports were denominated and financed indollars).
The growing liquidity problem of Japanese banks in internationalmarkets raised the likelihood of the Bank of Japan having to use largeamounts of its international reserves to provide emergency funding (re-financing the withdrawal of dollar credits by foreign banks). The Japaneseauthorities could have a straight prudential reason for huge dollar pur-chases in the foreign exchange markets – to bolster their reserves to providea backstop for the banking system. On top, some Japanese banks mightdraw on their capital reserves in yen (selling equity holdings for example)to fund the withdrawal of foreign bank credits in dollars. These points werewell understood in the markets, as the following quote reveals:
16.9.1995 (Business Times, Singapore) Japan’s Ministry of Finance has indi-cated it stands ready to provide US dollar liquidity to banks if needed …The source of such funds would be from Japan’s official reserves whichhave been greatly supplemented in recent weeks by aggressive Bank ofJapan intervention in foreign exchange markets. … Market intelligencesuggests that the Ministry of Finance has already been increasing dollardeposits with Japanese banks of late in order to ensure their liquidity.
Strong dollar, 1996
Near the end of 1995 the Japanese government had introduced legislationwhich provided for a partially publicly funded resolution of the Jusen crisisand this was eventually approved by the Diet in spring 1996. The simmer-ing problems of the Japanese banking system remained a background nega-tive factor for the yen, though not strong enough until autumn 1997 tobring a further unilateral depreciation (against both the US dollar and DM).In fact from late autumn 1995 until end-winter 1995/6 there was a unilat-eral rise of the dollar against both the DM and the yen, taking theDM/dollar and yen/dollar rates to around 1.50 and 105 respectively (seeFigures 5.3, 5.4 and 5.5), driven most probably by important evidence ofthe US economy having entered a powerful new upswing after the near-growth-recession conditions of the first half of 1995. The Germaneconomy, by contrast, had been slowing down since mid-summer.
Ten-year US T-bond yields having fallen to 5.75 per cent in late 1995were up to 7 per cent by spring 1996 (Figure 5.13) and the US equitymarket was surging ahead. The USA had become the magnet of interna-tional funds and the dollar rose in line to acknowledge that new fact. Thedollar continued to move up through spring 1996 albeit at less even rates

190 The Yo–Yo Yen
Figure 5.13 10-year JGB vs. T-bond yields, 1996–9
against the other two major currencies (a spurt against one being followedby a spurt against the other), reaching almost 110 against the yen and 1.55against the DM by early summer. Thus the yen continued to fall against thedollar despite encouraging evidence that the Japanese economy had at lastentered a strong recovery phase. In fact, in 1996 Japan tied with the USAfor the place of fastest growing G-7 nation (Figures 5.14 and 5.15).
But there were considerable doubts about the sustainability of the recov-ery – in particular how much spending was being simply brought forwardahead of a rise of the sales tax from 3 to 5 per cent scheduled for 1 April1997. Moreover long-maturity Japanese government bond yields had con-tinued to fall – touching almost 2.5 per cent for 10-year maturities by thesummer, indicative of a growing view that rates would remain low for avery long time – and this was a new stimulus to capital outflow from Japan,as evidenced by the following quote:
31.10.1996 (Market News Service) Encouraged by the dollar’s rise againstthe yen and disconcerted by minuscule returns on local bonds, Japaneseinstitutional investors have overcome their aversion to overseas bondrisks, say managers who warn that continuation of this trend dependson continued dollar–yen strength. International markets for at least ayear have been expecting to see a ‘wall of money’ coming from Japan aslife insurers and other financial institutions shook off their reticence to

Yen Opportunity Gained and Lost (1993–2000) 191
–
–
–
Figure 5.14 Japan, US and Germany real GDP growth, 1993–7
Figure 5.15 Real GDP: Japan, US and euro-area, 1995–2000

192 The Yo–Yo Yen
take on foreign currency risk and reversed the repatriation into yen seenin the early 1990s. Now the Japanese institutions have concluded theycan’t afford to stay home. … The dollar’s firmer footing at higher levelswith the endorsement of US Treasury Secretary Rubin and Japaneseofficials has almost guaranteed domestic institutions that they caninvest overseas and be fairly comfortable. … Many Japanese investorsregret not having made the move into foreign assets sooner.
Through summer and early autumn 1996 the yen had continued toweaken against the dollar, and also now against the DM, albeit to a lesserextent. In terms of our currency geography this was a period of the G-3 cur-rency triangle being dominated by the yen–dollar axis (see Figures 5.3, 5.4and 5.5). The most likely, though non-provable, reason for the yen outpac-ing the DM in its fall against the dollar at that time was the rising momen-tum of capital outflow from Japan, as described above. By the time of theUS mid-term elections of November 1996, the yen was at around 115 to thedollar. Over the turn of the year the DM–dollar axis took over as dominantin the G-3 currency markets, with the dollar continuing to rise but now bymore against the DM than the yen. This coincided with gathering specula-tion that the Federal Reserve was about to tighten monetary policy – thefirst tightening since rates were brought down in 1995. Then from Februaryto April 1997 the yen led the fall against the dollar, reaching a low of 127.
There was a new factor to explain the yen’s decline. In late 1996 the gov-ernment of Ryutaro Hashimoto (Prime Minister since January of that year)had indicated that fiscal policy was to be tightened substantially in thenext fiscal year (starting in March 1997). This had been the catalyst to afurther decline in government bond yields (and helped to dampen expecta-tions of a subsequent rise despite continuing economic recovery), and asUS bond yields continued to rise on the back of the booming US economy(and speculation on Federal Reserve tightening) the yield spread in favourof 10-year T-bonds over JGBs reached a record 450bp (see Figures 5.13 and5.16). The tighter fiscal policy in Japan had been foreshadowed back inSeptember 1996 when the Hashimoto government rejected calls for a sup-plementary budget, maintaining that the economy was strong enough tomove forward without new fiscal injection. Then in early December (1996)the government confirmed its plan to end the 2-year provisional incometax-cuts (drafted in spring 1994). And already the 2 per cent increase insales tax was looming (effective April 1997). The government endorsed amedium-term programme of reducing the budget deficit to 3 per cent ofGDP by 2005 and called for a major cutback in public works spending. Theoverall plan was agreed on 20 December (1996) and in fiscal year 1997–8the general government deficit was to fall by 1.3 per cent of GDP.
In principle when major fiscal consolidation occurs, such as in Japanunder PM Hashimoto, there is likely to be downward pressure on thenational currency (in this case the yen). If reduced government deficits are

Yen Opportunity Gained and Lost (1993–2000) 193
Jan 96 Jul 96 Jan 97 Jul 97 Jan 98 Jul 98 Jan 99 Jul 99 Jan 00 Jul 002.0
2.5
3.0
3.5
4.0
4.5
5.0
10yr yield spread(T-bond over JGB)
Figure 5.16 10-year bond spread (T-bond over JGB), 1996–2000
not matched by a spontaneous fall in the private sector savings surplus (anunlikely scenario which corresponds to so-called perfect Ricardian equiva-lence), then in the new equilibrium the overall savings surplus (public andprivate combined) rises, the natural interest rate falls, and the exchange ratefalls. If the process is not to short-circuit and involve a painful period of eco-nomic disequilibrium, the central bank must not stand in the way of marketinterest rates falling to the new equilibrium level. Benign fiscal deflations,following this theoretical model, occurred in a number of OECD nationsduring the 1990s, including the USA, Italy, UK, and Canada. Indeed, as wesaw in Chapter 2, Japan went through a benign fiscal deflation in the early1980s. But Hashimoto’s efforts were doomed, albeit that markets made apromising start (bond yields down and currency down).
There were two vital preconditions of success for Japanese fiscal consoli-dation in 1997. First, the Bank of Japan would have to take the new bud-getary policy seriously into account in the conduct of monetary policy.With money rates already at near zero, that meant giving a clear commit-ment to hold rates there for a long time, until satisfied that private demandwas rising vigorously enough to offset fiscal deflation. Second, Japanese andUS officials would have to avoid studiously doing or saying anything whichmight inflame risk aversion amongst Japanese investors with respect tobuying foreign assets. If their new-found confidence in investing abroadwas to evaporate, Japan could be confronted with a deflationary jump inthe yen occurring at the same time as fiscal deflation.

194 The Yo–Yo Yen
In sum, success would depend on the Hashimoto government pursuing aclearly mapped out strategy embracing monetary and exchange rate policy.On top, the strategy would have to be explained clearly and persuasivelyboth inside and outside Japan. In fact none of this happened. Washington,Bank of Japan officials, and the Hashimoto government itself, all playedkey roles in sabotaging the policy of fiscal consolidation.
Yen shock of spring 1997 and its after-effect
Following a tamer-than-widely-expected 25bp rise of Federal Funds rate on27 March, US Treasury Secretary Rubin started to qualify his strong dollarpolicy. He was quoted as saying (Reuters, 27 March) ‘a strong dollar is in USinterests and the dollar has been strong for quite some time now’. The astuteobserver could not but notice the beginning of a shift. Was Secretary Rubinconcerned, as some commentators argued, that a further decline of the yenwould add to the woes of the Japanese banking system (the yen value oftheir balance sheets would rise, given the substantial share of dollar assetsand liabilities, increasing thereby their need for capital to meet BIS (Bankfor International Settlements) ratios?). Certainly there had been growinganxiety about Japanese banks’ health in recent months (and this may wellhave been a contributory factor in the weakness of the yen). It was notclear, though, that Secretary Rubin would embrace that concern. After all,the best scenario for Japanese banks was the return of economic prosperity,and if yen depreciation was an essential route to that end, then immediateaccounting-type concerns should be overlooked.
Implicitly Rubin had accepted that argument in favouring a depreciationof the yen in summer 1995. But the yen had now fallen far already. Reportsfrom Washington were ominous, even though in 1997 Japan’s currentaccount surplus was the lowest since the peak of the Bubble Economy.There seemed little prospect that the mercantilists in Washington wouldaccept the argument that Japanese fiscal consolidation should be accompa-nied by a higher current account surplus in the medium term. But howmuch influence did the mercantilists have with Secretary Rubin?
At end-March, just before a visit of Treasury Secretary Rubin to Tokyo,there was a disturbing remark from his deputy Lawrence Summers. On 28March, the deputy said “we have been expressing concern for some timeabout the dangerous possibility that the Japanese current account surpluscould expand substantially” (Business Times, Singapore, 28 March 1997).
On 1 April came further bad news on the banks. Nippon Credit Bank(17th largest bank) announced the abandonment of its international opera-tions and contraction of its domestic ones. And Hokkaido Takushoku, thesmallest of the 10 top commercial banks announced its merger withHokkaido Bank, its cross-town rival in Sapporo. Both moves were seen as

Yen Opportunity Gained and Lost (1993–2000) 195
only sweeping huge bad loan problems under the carpet. On 21 April, FredBergsten weighed in: ‘if the yen were to fall further sharply, it could reallyhave a further devastating effect on the financial system’. The neo-mercantilists had a new argument to justify US action to drive the yenhigher. But below the new clothing, the old arguments could be found, asBergsten continued: ‘the weak yen means trouble on the internationalfront because it will lead to a bigger Japanese current account surplus. If thedollar stays above 120 yen, the surplus will jump to record levels in a yearor two. … the long-run equilibrium level is 100 yen to the dollar” (ReutersNews Service, 21 April 1997). Bergsten argued that intervention would bemore effective if it were backed up by easier Japanese fiscal policy, whichwe have already pinpointed as being the main tool of mercantilist efforts topush the yen up.
Then came a barrage of commentaries from the G-7 finance ministersmeeting at the end of April. In its summary of 29 April, Market News Servicemade the following points. The G-7 finance minister and central bankheads had called for avoiding excessively volatile exchange rates andexchange rate movements that could widen trade imbalances, withoutmaking specific mention of the yen–dollar rate (which was nonethelessimplied). US Treasury Secretary Rubin did not back away in separate com-ments from his recent statements of concern about the Japanese yen’s fallagainst the dollar. Rubin said he would be watching what measures Japantook to stimulate domestic demand and curb growth in its trade surplus,and suggested that more steps would be demanded of that nation if it failedto achieve its pledged objective of a strong domestic demand-led growthand the avoidance of a significant increase in its current account surplus.Japanese Finance Minister Mitsuzuka reiterated the need to avoid exchangerates that would increase external imbalances and said there was a full con-currence of views between the US and Japanese authorities on the concernsover recent developments of the yen rate. Finally, Bank of Japan GovernorMatsushita hinted at a tightening of monetary policy when he commentedthat there was concern about prices, mentioning that preliminary data sug-gested that the increase in sales tax had not been accompanied by anyweakening of demand. Nonetheless, Matsushita reiterated his deter-mination to maintain the current low interest rate policy, saying thepriority of the Bank of Japan would remain making domestic economicrecovery solid.
What a bombshell! It was now absolutely clear that the Hashimoto gov-ernment had failed to realise that a continued cheap yen and enlargedtrade surplus was crucial to its fiscal consolidation efforts, let alone try toconvince its G-7 partners of that point. And without any case being madeby Japan, the mercantilists in Washington were back in the driving seat.Indeed there was a mood of hostility in Washington towards Japanese fiscaldeflation – as if Tokyo were revoking on an undertaking to keep its current

196 The Yo–Yo Yen
account surplus within politically acceptable bounds by running largebudget deficits.
Still, cynics in the market-place could dismiss all the G-7 related talk ashot air. What could Washington actually do to drive the yen up? There wasno sign that the Hashimoto government would reverse course on fiscaldeflation. The Bank of Japan Governor’s opaque remark about inflation waswell hedged and did not imply monetary tightening was anywhere on thehorizon. And surely Japanese investors would not be scared about goinginto foreign assets just because the mercantilists had barked? But was thereany bite? If, in fact, international investors became scared by the mercan-tilist talk in Washington, the dollar would fall not just against the yen butalso the DM (albeit by less). A general fall of the dollar, however, couldincrease US inflation risks and thereby endanger the apparently emergingUS economic miracle – surely not a danger to which Secretary Rubin wouldbe blind?
Indeed in the first week following the G-7 meeting there was little marketmovement. Then came a clanger from Tokyo, not Washington. In the mostvirulent open-mouth currency intervention yet, Eisuke Sakakibara, widelycredited for having engineered together with Secretary Rubin the yen’sdevaluation of late summer 1995, said (JIJI Press Newswire Report, 8 May)that the dollar could fall to 103 yen given past examples of yen–dollar ratemoves. The method of getting the yen up was still obscure, but the sourceof the remark was enough to make Japanese investors who had recentlyshed some of their risk aversion with respect to foreign assets think twice.How important the remark was in itself is not provable because by coinci-dence several other developments were occurring capable of puttingupward pressure on the yen against the dollar.
In a speech on 8 May, Federal Reserve Chairman Greenspan hinted that nofurther tightening of monetary policy was necessary (refuting thereby a wide-spread view that the 25bp hike of Fed funds rate in March was the start of aseries of moves). Then on 11 May, a report in a Tokyo daily quoted anunnamed Bank of Japan official as saying the low-interest-rate policy wouldsoon end (Figure 5.17) (Investor’s Business Daily, 12 May 1997), which sent10-year JGB yields 10bp higher in the day. Rumours of monetary tighteninghad caused a gradual climb in JGB yields ever since they touched bottom on7 April. Thus whereas US T-bond yields had been falling (on speculationabout a let-up in Fed tightening), JGB yields had been rising – a convergencewhich should help the yen recover (see Figure 5.18). The yen, which hadbeen at 124 on 7 May, was at 119 on 11 May. A US Administration officialadded fuel to the fire by saying that the US Treasury would be comfortablewith a dollar/yen rate between 110 and 115 (Reuters News Service, 12 May1997).
Japanese officials helped by reiterating that latest anecdotal evidencesuggested fiscal deflation was not dampening overall demand (implying

Yen Opportunity Gained and Lost (1993–2000) 197
5.67
5.69
5.71
5.73
5.75
5.77
5.79
5.81
0.52
0.53
0.54
0.55
0.56
0.57
0.58
0.59
1-Apr-97 15-Apr-97 29-Apr-97 13-May-97 27-May-97
3mth Euro-$Japan 3mth CDs (RHS)
Figure 5.17 3-month Japan CD rate vs. 3-month euro-dollar, April–May 1997
1-Apr-97 15-Apr-97 29-Apr-97 13-May-97 27-May-97
2.0
2.2
2.4
2.6
2.8
3.0
6.6
6.7
6.8
7.0
6.9
7.1
10yr JGB yield10yr T-bond yield (RHS)
Figure 5.18 10-year JGB vs. T-bond yields, April–May 1997

198 The Yo–Yo Yen
thereby that interest rates could rise). Following a G-10 central bankersmeeting on 12 May, Bundesbank President Tietmeyer commented, ‘we hada new assessment of the Japanese economy (from the Bank of Japan repre-sentative at the meeting); fears that fiscal drag could have a big negativeimpact seemed to be less now than before’ (Reuters News Service, 12 May1997). Market News carried a report the same day: ‘A Japanese official saidthe discount rate has been held down much longer than anyone had aright to expect … the Japanese economy has been underestimated. Recentdata shows we can go through this period of fiscal consolidation withoutdamaging expansion. People begin to realise that we shouldn’t be so pes-simistic about our economy.’
All cannot be blamed on officials. The Japanese bond and money marketswere alight with broker forecasts of uninterrupted economic strength andrising interest rates (see Figures 5.17 and 5.18). At the beginning of Aprilthe yield on the benchmark bond had been as low as 2.07 per cent. Now itwas at 2.6 per cent. The Senior Economist at Yamaichi Research Institute ofSecurities and Economics said (Reuters, 12 May 1997), ‘We have started toconsider the possibility of an official rate hike in July. The effects of the risein the consumption tax are fading away and the central bank’s Tankanquarterly business survey, released in July, may come out with a positiveforecast.’
By 15 May, the yen was at 114 (Figures 15.19 and 5.20). A senior LDPofficial was quoted as hinting at higher rates (South China Morning Post,16 May 1997): ‘As we undertake reforms, there will be complaints from thosehurt by low rates and interest rates of a certain level will be demanded.’Goldman Sachs said it was changing its forecasts for the dollar on the basisthat Japanese rates would rise by the fourth quarter. An influentialWashington newsletter cited Secretary Rubin as seeking a cheaper dollarof around 115 yen. There was also increasing readjustment of dollar holdingsof Japanese investors, ‘who have been behind much of the yen’s pastweakness’.
Then on 21 May the yen touched 112 on a shock media report (JIJI PressNewswire, 21 May 1997) that Senior Deputy Bank of Japan GovernorToshihiko Fukui indicated the central bank’s readiness to raise the discountrate. ‘The report dealt a telling blow to the bond market first and pushedJapan’s long-term interest rates higher, which in turn ignited a welter ofdollar selling in the foreign exchange markets’. In an interview with LeMonde on 23 May, Eisuke Sakakibara said that a rise of 50bp in the Bank ofJapan’s discount rate should be expected in the coming year, although hequalified the remark by saying that he did not think the Bank of Japanwould act before it was sure of a solid economic upturn.
Thus the yen had risen by around 12 per cent in less than two weeksagainst the US dollar and by virtually the same amount against the DM.Flatterers of Treasury Secretary Rubin could say he had successfully pulled

Yen Opportunity Gained and Lost (1993–2000) 199
1-Apr-97 15-Apr-97 29-Apr-97 13-May-97 27-May-97
112
116
120
124
128
1.60
1.65
1.70
1.75
1.80
Yen/USDDM/USD (RHS)
Figure 5.19 US$ vs. Yen and DM, April–May 1997
112
114
116
118
120
122
124
126
128
67
68
69
70
71
72
73
74
75
1-Apr-97 15-Apr-97 29-Apr-97 13-May-97 27-May-97
Yen/USDYen/DM (RHS)
Figure 5.20 Yen vs. US$ and DM, April–May 1997
200 The Yo–Yo Yen
off a unilateral rise of the yen without the unpleasant side-effect of under-mining the so-called strong dollar policy. But many points remain uncleareven well after the dust has settled on this exceptional happening in thecurrency markets.
Was Japan’s Ministry of Finance orchestrating the interest rate commentsthat played such a powerful part in pushing the yen higher on its own? Orwas it just coincidental that Bank of Japan officials were changing theirminds about the direction of rates at the same time as a yen offensive wasin process? And how real was the conversion of view at the Bank of Japan?Had Governor Matsushita really become convinced of the need for higherrates – or did he simply acquiesce in pressure to comply with the yen policyand permitted his deputy to broadcast a strong view which was not hisown? Why was opinion in the Japanese government bond markets sogullible – did participants really believe that economic fundamentals hadchanged so much in a few weeks to justify such a spike in long-maturityyields? Should they not have remained very concerned that fiscal consoli-dation could dampen seriously overall demand? And did no seniorJapanese official argue even in private that Tokyo should say no toWashington’s demand for a revaluation of the yen? After all there was astrong and internationally respectable case for saying that fiscal consolida-tion should take place now and should be accompanied by easy money anda cheap yen. What did ‘Mr. Yen’ (Eisuke Sakakibara) or any of his col-leagues fear from saying no?
Was this a rare example of the yo–yo yen string indeed being pulled byWashington, albeit with the compliance of Tokyo? Possibly. But the pullwas not strong and could not be sustained for long in the face of econ-omic fundamentals that were pulling the yen in the opposite direction.Indeed, there is a cynical interpretation that can be given to the eventsdescribed.
The Clinton Administration was irritated by its lack of real progress inopening up Japanese markets despite the long-drawn-out Framework Talks,and now Tokyo seemed to be getting away with a yen devaluation. It hadremained quiet, however, until after the mid-term Congressional elections(November 1996), so as not to suggest in public that its strategy for dealingwith Japan had failed. After the elections, Clinton officials began to take astronger line again, probably implying the threat of new trade action (start-ing with the normal round of sectoral talks).
Tokyo officials had no stomach for a new round of negotiations whichmight bring a new harmful upward spiral of the yen (there was not muchlogic behind this connection, but nonetheless the history of the yen bubblecoinciding with the Framework Talks had made them fearful that there wassome connection via market psychology). Maybe it would be best to offerWashington a pre-emptive rise of the yen. But how could this be pulledoff? The Bank of Japan held the key – a hint of monetary tightening could

Yen Opportunity Gained and Lost (1993–2000) 201
do the trick. Governor Matsushita, an ex-Ministry of Finance official, mightbe compliant. The collection of statements by government officials suggest-ing rates could rise and then corroborated by Matsushita’s deputy, smackedof a ‘conspiracy’.
Cynics could say that it was all short-term tactics and GovernorMatsushita had no real intent of sanctioning a tightening of monetarypolicy any time soon. The bond markets and currency markets, however,fell for the trick and Washington was satisfied. By the summer the yencould be down again (if indeed no monetary tightening could be justified),but Tokyo could say to Washington that everything possible had beendone. In any case by that time the Clinton Administration could havemoved on to other topics in its international economic agenda and Japanhave shifted out of the limelight.
The cynical interpretation has considerable plausibility and if true wouldsuggest that Eisuke Sakakibara exercised considerable diplomatic skills indealings with both Washington with other key officials in Tokyo. He was askilful communicator to markets. Nonetheless, the sudden large jump inthe yen that was engineered had damaging consequences, and both theClinton Administration and the Hashimoto government bear respons-ibility. The yen jump triggered an immediate reversal of important volumesof hedge fund lending to the ASEAN countries. Hedge funds had beenengaged in the carry trade of borrowing yen and lending into the highinterest currencies of the Asian ‘cubs’ which were pegged to the dollar,gaining both from a wide interest rate differential and from the fall of theyen. On the turn of the yen they rushed for the exits, setting the stage forgrowing financial strains in these Asian economies which were in the midstof fantastic real-estate and equity market bubbles. (In fact, the reversal ofcarry trades probably played a key role in the violence of the yen’s upturn.)A more forward looking international economics team in Washingtonmight have been addressing the question of inevitable post-bubble adjust-ment in these countries and how to cushion the bursting of the bubbles(perhaps by pre-emptive devaluations or floats) rather than setting off atrigger to their bursting.
As regards the Hashimoto government, and Eisuke Sakakibara in particu-lar, they paid too little attention to the harmful impact of a yen spike,however short, on the vital mechanisms for recycling Japan’s savingssurplus to the world outside. The damage done to those mechanisms surelyexceeded the small risk – allowing for bluff – of the Clinton Administrationreopening trade talks. And in any case, even if Washington did follow thatroute, Tokyo could have learnt from the experience of 1993–5 that resoluteaction would be necessary to prevent the yen being used as a trade tool. Forexample, the Japanese government could have stated explicitly that fiscalconsolidation, itself deflationary, should be offset by a stimulus from yendepreciation. There was indeed evidence to support that view from a

202 The Yo–Yo Yen
number of fiscal consolidations in the OECD area during the previous 20years. The Japanese government could have given substance to its view bysetting an agressive target for the expansion of its foreign exchange reservesover the medium term, and issuing public instructions to the Bank of Japanto buy foreign currencies continuously for that purpose. Instead, a yenspike was engineered that rocked the recently found confidence of Japaneseinvestors to buy foreign assets. And the enlarged risk premium that theywould require in future so as to justify further accumulation of foreigninvestments meant that the Japanese economy was in danger of falling intoa deflationary trap.
For example, what would occur if the economy lurched into a new reces-sion and the private sector savings surplus ballooned? With interest ratesalready near zero, the equilibrium outcome would be for a prompt and sus-tained fall in the exchange rate accompanying a big increase in capitalexports (and the current account surplus). Whether market forces wouldbring about that outcome depended on the willingness of Japaneseinvestors to buy foreign assets and of foreign borrowers to increase liabili-ties in yen. The extent of that willingness would soon be put to the test.The possibility of a deflationary trap became a real danger within months,not years.
From Asian crisis to yen lowpoint of summer 1998
The combination of the Asian crises of summer/autumn 1997, the laggeddeflationary impact of the yen’s jump in the spring (1997), and a new cropof bank and security house failures in Japan (including HokkaidoTakushoku Bank and Yamaichi Securities), paved the way to a sharp down-turn of the Japanese economy from late 1997 (led by falling exports to Asiaand plummeting business investment). During early summer 1997 themain event in currency markets had been the news that Italy would almostcertainly be a founding member of European Monetary Union (to belaunched on 1 January 1999) which triggered a sharp fall of the DM againstthe dollar (from around 1.70 to 1.80 DM/$), with the yen finding itself in-between (rising against the DM, falling against the dollar). Then as theAsian crisis began to unfold (starting with the devaluation of the Thai bahton 2 July 1997) the yen was at first steady at around 120 to the dollar(through late summer and early autumn) whilst the DM rebounded (toaround DM/$1.70). The initial consensus view in currency markets was thatEurope would be least impacted by the Asian shock. That view alreadybegan to shift in late 1997 as estimates of the exposure of European banksand the European economies to Asia ratcheted upwards and as the reces-sionary trends and financial woes in Japan became increasingly evident.The yen again entered the limelight of the G-3 currency markets fallingalmost without break from to a level of 145 against the dollar in summer
Yen Opportunity Gained and Lost (1993–2000) 203
1998 whilst the DM/$ rate was flat at around 1.80 (having risen there from1.70 in a brief late-year correction in 1997)(see Figures 5.3, 5.4 and 5.5).
What drove that sharp and persistent decline of the yen? As Japan’srecession deepened it is quite likely that some investors gradually cameround to the view (encouraged in that process by evidence from the marketthat other investors were thinking similarly) that economic equilibriumcould be reached only at a much lower level of the currency than what hadbeen seen in recent years. Anyhow, given the sharp fall in the currencies ofseveral Asian trade partners, the yen had to fall itself just to maintain aconstant overall effective exchange rate. With the Japanese financial systemtottering, surely at last the mercantilists in Washington would be silencedas the aim of Japanese economic recovery took precedence over other con-siderations. A cheaper yen was surely essential to that recovery. But it isimpossible to demonstrate how deep or wide was that shift in view.
Japanese investors themselves were not at the forefront or even in themainstream of this opinion change. They were either still too shell-shockedby the events of spring 1997 (when the abrupt rise of the yen had inflictedsudden large losses on their foreign investments) or in financially too weaka position to take bold new positions in foreign assets. There were impor-tant capital outflows stemming from Japanese borrowers in distress repayingforeign creditors (unwilling to extend their loans). In particular, Japanesebanks were repaying credits from foreign banks out of their own capital. (Inaddition, some banks received life-support dollar deposits from the Bank ofJapan for the purpose of repayment, but this set of transactions did notimply a net capital outflow.) But these repayment-related flows were forcedrather than driven by calculation of expected exchange rate gain.
It was in the so-called carry trade – non-Japanese borrowers willing totake on yen liabilities to fund non-yen assets – which was now surging,that expectations of a weaker yen were rampant. Borrowers’ willingness toact in this way would have been influenced in many cases by some notionof the equilibrium value of the yen having fallen far below what was seenin the recent past. In other cases, bandwagon effects might have beenimportant together with the immediate speculative appeal of substantialincome gains from borrowing a falling currency at virtually zero interestcost. The fact that Japan’s again growing current account surplus (the coun-terpart to the rise in the savings surplus which accompanied recession)might be flowing out in the form of highly speculative foreign borrowingof yen, rather than long-run foreign investment by Japanese savers, was apoint of vulnerability.
In the market-place – and amongst international monetary officialsincluding those at the Bank for International Settlements – there was someunease about the huge volume of carry trade in the yen and the possibilitythat this could unwind suddenly. The unease was all the greater because ofthe huge imprecision of any estimates. The hedge funds were one group of

204 The Yo–Yo Yen
big players and potentially the most fickle. They were hardly ‘in there’ forthe long haul (meaning a decision that the yen should represent asignificant share of their liabilities for a long time ahead). Other carrytraders – for example, corporate borrowers throughout the world – mightbe less volatile in their behaviour, but who could know? A sudden changein direction for the yen coupled perhaps with international liquidity prob-lems could bring a mass scramble out of positions, threatening grave insta-bility in the currency markets. And there were three events in particularthrough spring and summer 1998 that pointed to a possible yen reversalahead even though they did not cause any immediate flurry.
First, in March 1998, Bank of Japan Governor Matsushita had resigned,taking responsibility for a bribery scandal involving a senior officialcharged with leaking sensitive information to banks in return for lavishentertainment. Prime Minister Hashimoto appointed in his place MasaruHayami, ‘known as a proponent of a strong yen’ (Reuters New Service,20 March 1998) and ‘renowned for his bluntness’ (The Japan Times,30 March 1998). The 72-year-old governor took office barely a week beforethe new Bank of Japan Law came into effect aimed at increasing the centralbank’s independence from the government and its accountability to theDiet. It was ominous when Governor Hayami used the first opportunity(Nikkei Weekly, 23 March 1998) to attack the policy of ultra-low interestrates (‘Japan’s prolonged ultra-easy monetary policy has had negativeeffects on the private sector’) and to wish for a stronger yen (‘A strong yendoes not go against the national interest’). And there were warnings, bothin the Japanese media and international media:
17.3.1998 (Nihon Keizai Shimbun) One area of concern is that Hayamihas been quoted in the past as making repeated statements arguing thata strong yen is positive for Japan. He is the author of a 1995 bookanalysing the foreign exchange market, titled ‘The Day the Yen WinsRespect’ (not translated into English, the book argued for a bigger inter-national reserve role for the yen). A senior economist at Dai-Ichi LifeResearch Institute said he hoped Hayami would not get carried away byany attachment to a strong yen.
6.4.1998 (Wall Street Journal) Masaru Hayami, the new governor of theBank of Japan, is a devout Christian who believes central bankers shouldact as the ‘conscience of Japan’s economy’, and his conscience bothershim because Japan’s flat growth and weak yen are posing a threat to Asiaand the rest of the world. In his first interview since becoming governorhe said that the weak yen is eroding the buying power of Japan’s busi-nesses and consumers. The resulting fall in demand could prolongrecovery for the region’s troubled economies. ‘A stable and strong yen iswell within our national interests.’
Yen Opportunity Gained and Lost (1993–2000) 205
Second, in mid-June 1998, there had been a bout of joint US–Japaneseintervention in an albeit unsuccessful attempt to push the yen higher. Theintervention had been timed to precede a visit by President Clinton toBeijing – and was regarded as a pre-Summit present to China which hadbeen complaining about the harm to its economy from a cheap yen andhow it might be forced into a devaluation of its own currency which couldset off a further round of currency depreciation in Asia. Many economiccommentators were sceptical of the Chinese concerns, seeing these asreflecting a political relations strategy – after all, there was little direct com-petition between Chinese and Japanese goods in export markets andJapanese direct investment in China was likely to continue falling in anycase from its peak levels of the early and mid-1990s given its disappointingprofits record to date. Nonetheless, Washington was again expressing irrita-tion with the cheap yen.
Third, at end-July Prime Minister Hashimoto had resigned following abad outcome for his party in the Upper House elections, and he had beensucceeded by Keizo Obuchi, who had won the LDP leadership election on apromise of bold fiscal reflation. Indeed Obuchi had appointed the agedKiichi Miyazawa, an old-fashioned Keynesian (and ex-prime minister), ashis finance minister. Whilst campaigning (for leadership election) Obuchihad pledged to implement a permanent income tax cut of 6 trillion yenand to pass a 10 trillion yen supplementary economic stimulus package.The new prime minister promptly had announced his intention to intro-duce legislation to suspend the law providing for gradually falling fiscaldeficits over the medium term (introduced by the Hashimoto government).Fiscal reflation meant – everything else the same – a stronger yen.
Shock (autumn 1998), mini-bubble (summer 1999 to summer 2000),and their aftermath (to winter 2000/01)
Despite these warning signs the violence of the yen reversal, when it came,could hardly have been predicted. The outbreak of the international liquid-ity crisis of autumn 1998 following Russia’s debt default at first went alongwith a modest weakening of the dollar against both the yen and the DM.According to the dominant market view, the US economy was most at riskfrom the knock-on effect on emerging market economies. The US equitymarket plunged. There was speculation on an early easing of US monetarypolicy. Indeed on 29 September came a first 25bp cut in the Fed funds rate.By the beginning of October the US dollar was down to 135 against the yenand 1.65 against the DM from 145 and 1.80 back in late August (Figure 5.5).
One factor helping to restrain the rise of the yen was an easing of mone-tary policy by the Bank of Japan in early September (call rates fell from 0.50per cent to 0.25 per cent) and an associated plunge in 10-year Japanese gov-

206 The Yo–Yo Yen
ernment bond yields, which fell below 1 per cent. The collapse of LongTerm Capital Management (LTCM), the ‘Rolls Royce of the hedge fundindustry’, in late September, had no immediate substantial impact on theyen. In the first few days of October the outlook for the US economy con-tinued to darken amidst reports of a growing credit squeeze. Then – almostout of the blue (nothing should ever be a total surprise to alert market-par-ticipants continuously revising their probabilistic view of the future) – thedollar plunged by almost 20 per cent (from high to low point) against theyen in a 24-hour period from Wednesday 7 October to Thursday 8 October,bringing the yen/dollar rate to an intraday low of 111. During the sameperiod the dollar fell by barely 3 per cent against the DM (see Figure 5.21).
The immediate cause of the yen’s surge was reputed to be hedge funds,faced with liquidity pressures, bailing out of their carry-trade positions.Why did this happen on 7–8 October rather than 6 October or 9 October?The ultimate reason may have more to do with the micro-positions of thehedge funds involved. But relevant macro-economic news which couldhave caused them to throw in the towel included news that the Obuchigovernment had introduced legislation into the Diet which would provideimportant support for the Japanese banking system, and a speech fromFederal Reserve Chairman Greenspan indicating alarm over deterioratingeconomic prospects and foreshadowing a substantial easing of US mone-tary policy. If there was ever a case of so-called disorderly foreign exchange
Figure 5.21 US dollar vs. Yen and DM, October 1998

Yen Opportunity Gained and Lost (1993–2000) 207
markets which would have justified stabilising action from central banksthis must surely have been it. And the complete failure of any such actionto materialise left Japanese investors even more risk averse with respect toforeign assets than before and the carry-traders who had been playing amajor role in exporting Japan’s current account surplus during the recentpast traumatised. The prospects for a smooth recycling of Japan’s massiveprivate sector savings surplus were bleaker than ever before.
How was there such a dramatic case of currency market failure? The fol-lowing quotes provide some insights:
8.10.1998 (Reuters News Service) US Treasury Secretary Rubin declined tocomment on the recent plunge of the US dollar against the Japaneseyen. ‘This is not the time I can do it. I’m late.’
8.10.1998 (FWN Financial News) President Clinton said today theJapanese yen had become ‘too weak’ versus the US dollar and there aresome benefits to a stronger yen versus the dollar. ‘It led, for example, tobreathtaking increases in imports of Japanese steel, which hurt a lot ofour people, our industry and our workers, who were clearly competitiveinternationally.’
Anyone who thought the Bank of Japan would help stabilise the situationwere soon to be disappointed:
10.10.1998 (Nihon Keizai Shimbun) The yen’s sudden surge against thedollar, coupled with the decline in Japanese stocks, is fuelling sentimentwithin the Bank of Japan that an additional easing of monetary policyis needed.
15.10.1998 (Nihon Keizai Shimbun) Hayami said that at Tuesday’s policy-making board meeting, the large majority decided it wasn’t appropriateto take further monetary action now, as effects from last month’s easingwould require some more time to emerge on economic activities.
11.12.1998 (Nihon Keizai Shimbun) Markets pushed the dollar down to115 yen today. The selling was accelerated by comments from Bank ofJapan Governor Hayami, who said current exchange rate levels aren’tabnormal.
Ultimately, of course, the shock rise of the yen in early October 1998would have gone into reverse if it had been driven only by the liquidityproblems of hedge funds. But there was a lot more which had changed.
First, Japanese investors in foreign currencies and foreign borrowers ofyen had raised their assessments of its potential volatility, and so they

208 The Yo–Yo Yen
would require more return in the form of future depreciation to justifycrossing the currency frontier (meaning that the yen would have to bemore obviously expensive in the present).
Second, the new Governor of the Bank of Japan had declared his enthusi-asm for a strong yen – quashing doubts that his views may have changed.
Third, outflows of capital via the banking sector had been stemmed as aconsequence of the big new support package, which included not just pro-visions for public fund injection but widespread government guarantees forsmall and medium sized borrowers.
Fourth, in early November the Obuchi government had presented to theDiet the most ambitious programme yet of fiscal reflation.
Indeed this fourth fact, together with a belated realisation that the Bankof Japan was adamantly against supporting the bond market (which maywell not have been effective, even if tried), had caused long-maturity JGByields to double almost at a stroke to around 2 per cent in mid-December1998 (Figures 5.22 and 5.23), which was a further drag on the outflow ofcapital from Japan.
Conspiracy theorists saw the handiwork of Governor Hayami and EisukeSakakibara behind the abrupt rise of government bond yields (to which onecatalyst may have been the announcement that the Trust Fund Bureau wasto scale back purchases of government bonds). The idea was that higheryields would be necessary if the yen were to stand a chance of competing as
Figure 5.22 Japan yield curve, 1995–2001

Yen Opportunity Gained and Lost (1993–2000) 209
Figure 5.23 10-year JGB yield vs. 3-month CDs, June 1998–March 1999
a reserve currency in the new monetary era about to dawn in Europe (thelaunch of the euro).
The euro started existence at the opposite end of the pole to the USdollar. For the first half of 1999 the euro was falling, the US dollar rising,and the Japanese yen in-between. Thus the yen fell from around 115against the dollar to near 120 by late spring, whilst rising from 130 to 125against the euro (Figures 5.24, 5.25 and 5.26). Dollar strength correspondedto dissipating pessimism about the US economy, whilst euro weakness cor-responded to disappointing economic performance and growing misgivingsin the market-place about the European Central Bank.
There followed one of the most remarkable upswings of the yo–yo yen.From mid-year (1999) to late autumn the yen soared to almost 100 againstthe US dollar and 100 against the euro. The upturn was driven by a suddenblossoming of optimism about the Japanese economy. The bubble in theUS new economy proved a powerful lever in helping to pull Japan out of itsrecession. Exports bounded ahead to the US new economy and to Asiancountries themselves feeding the US bubble with soaring exports of neweconomy merchandise. Business investment turned up strongly rather thancontinuing its widely predicted long fall. And foreign investors piled in tothe bubble new economy stocks in the Tokyo equity market, many ofwhich were essentially high-geared plays on NASDAQ, and into oldeconomy stocks too. Many European institutional investors were simulta-

210
Figu
re 5
.24
Euro
cu
rren
cy c
orn
er, 1
999–
2001
1S
olo
Yen
2U
SD
–Yen
axi
s do
min
ates
3Y
en–E
uro
axis
dom
inat
es
4S
olo
Eur
o
5U
SD
–Eur
o ax
is d
omin
ates
6S
olo
US
D

211
Figu
re 5
.25
USD
cu
rren
cy c
orn
er, 1
999–
2001
1S
olo
Yen
2U
SD
–Yen
axi
s do
min
ates
3Y
en–E
uro
axis
dom
inat
es
4S
olo
Eur
o
5U
SD
–Eur
o ax
is d
omin
ates
6S
olo
US
D

212
Figu
re 5
.26
Yen
cu
rren
cy c
orn
er, 1
999–
2001
100
90
110
120
130
140
150
160
52
13
21
64
53
62
31
5
Jan
99Ju
l 99
Jan
00Ju
l 00
Jan
01Ju
l 01
JPY
/US
DJP
Y/E
UR
O
1S
olo
Yen
2U
SD
–Yen
axi
s do
min
ates
3Y
en–E
uro
axis
dom
inat
es
4S
olo
Eur
o
5U
SD
–Eur
o ax
is d
omin
ates
6S
olo
US
D

Yen Opportunity Gained and Lost (1993–2000) 213
neously piling into the Japanese government bond market, frightened thatthey might underperform their peers if the yen remained under-weighted(compared to the standard bond indices) as in recent years.
In fact, the yen currency markets had become largely one-way markets.In addition to the huge commercial demand for yen corresponding to thecurrent account surplus, there was huge investor demand. Japaneseinvestors who might once upon a time have taken advantage of a strongeryen to buy foreign assets were still suffering from shock, and preferred thesafety for example of postal savings accounts offering near the long-termbond yield (equivalent to around 3 per cent in real terms when accountwas taken of the falling price level) and a put option (they could demandredemption after a short period if yields rose). Japanese, unlike European,investors, were sceptical of bubble-type equity markets, whether on WallStreet or in Tokyo. Indeed Japanese corporate and bank investors were pru-dently taking advantage of the huge foreign demand for Tokyo equities andtheir high prices to offload their interlocking shareholdings and so buildingup liquidity.
If the Ministry of Finance had not been selling huge quantities of yen fordollars (via the Bank of Japan) it is possible that the yen would have had torise considerably further before Japanese investors in foreign assets andsome carry-traders were catapulted back into action. Indeed it was an opensecret that the Ministry of Finance was highly concerned about therebound of the yen, not least because it viewed a continuing external stim-ulus as essential to the Japanese economy returning to prosperity in theface of large potential deflationary influences (including eventual fiscalconsolidation and accelerated clean-up of the banking system). But trans-lating its concern into powerful action would require the cooperation ofthe Bank of Japan. Sterilised foreign exchange intervention was widelyviewed in the markets as ineffective. The key to successful intervention wasfor the Bank of Japan to finance the official purchases of dollars by moneycreation. But Masaru Hayami would not oblige, even though the Ministryof Finance had an unusual ally – the new US Treasury Secretary, LarrySummers – in the debate. Why was Governor Hayami so uncooperative?The evidence of public remarks suggests several explanations.
First, Hayami saw as one of his missions the building up of central bankindependence, granted only recently as a legal possibility. If the Bank ofJapan agreed to monetise the purchase of foreign exchange as dictated bythe Ministry of Finance its independence could suffer.
Second, there were theorists within the Bank of Japan who provided arespectable handle on which to hang the independence argument.Sterilised intervention involved the simultaneous actions of the Ministry ofFinance buying foreign currency and issuing T-bills and the Bank of Japanexpanding the monetary base by the identical amount via buying thosesame T-bills. But with interest rates already at zero (the call money rate was

214 The Yo–Yo Yen
cut in February 1999), expanding the monetary base would have little orno macro-economic impact. Banks would simply end up holding moreexcess reserves. The Ministry of Finance could run foreign exchange policywithout any help from the Bank of Japan.
Third, Hayami was not convinced that a stronger yen was such a badthing for the Japanese economy.
There were strong potential counter-arguments to Governor Hayami’spoints but these did not emerge clearly in public and foreign exchangemarkets were dominated by the view – in fact correct – that the Bank ofJapan would not budge.
Independence could have been preserved by the Bank of Japan setting atarget for monetary base expansion and specifying that a given percentage(of the increase in base) would take the form of foreign currency purchases.
The argument that monetary base expansion would be ineffective withrates at zero has never been resolved in any practical historical instance.Several US economists wrote confidently in newspaper articles about someblack box mechanism which transforms excess reserves into aggregatedemand. They might be wrong. But was there any harm from at leastexperimenting? In any case monetary financing of foreign reserve acquisi-tion might well impress currency markets more than Ministry of Financefunding, in that the latter is subject to limits which can be expanded only by legislative consent, whilst the former is a matter only of agree-ment between the central bank and the government (what proportion ofmonetary base expansion should be matched by foreign currencies?).
Finally, the argument that a strong yen was good for the Japaneseeconomy was directly opposed to the view which was very belatedly begin-ning to gain ground both in Washington and in various supranationalorganisations (for example the OECD in Paris) that Japan’s huge privatesector savings surplus should indeed be matched by current account sur-pluses and capital exports, meaning a cheap currency, rather than wastefulpublic works projects.
Governor Hayami did not budge, but the world about him did. The crashof NASDAQ in 2000 followed by the descent of the Japanese economy intorecession brought the yo–yo yen under a new downward pull. Fromautumn 2000 when the US economic downturn from the long boombecame apparent until spring 2001 when the extent of the Japanese down-turn became evident, the yen fell by around 15–20 per cent against the euro and US dollar (Figure 5.26). That was only a modest reversal of theoverall climb between autumn 1998 and late 1999. But there were someencouraging pointers to important rethinking about the problems of the yo–yo yen, both in the market-places and in the corridors of monetarypower. What to do about the yo–yo yen is the subject of the next chapter.

215
6What To Do About the Yo–Yo Yen?
Previous chapters have given an account of the people and forces whichhave pulled the strings of the yo–yo yen. The relative importance of peopleas against forces is of course a perennial issue in historical analysis –whether in the arena of international relations (would the First World Warhave taken place if Archduke Ferdinand had not made his provocative visitto Sarajevo?) or of monetary affairs (would the Great Inflation of the 1970shave occurred if Arthur Burns had not secured his appointment as FederalReserve Chairman by ‘indicating’ to President Nixon that he would end thetight money policy then in force and concentrate on reviving the economyin time for the upcoming elections?). In the case of Japan’s Lost Decade ofthe 1990s, one ‘people question’ is whether the economy would have beenmore prosperous if someone less attached than Yasushi Mieno or MasaruHayami to a strong yen for its own sake, less zealous about wrenching inde-pendence from government, and more understanding of the surplussavings ‘problem’, had been appointed as head of its central bank.
Earlier in this book (see Chapter 4) the view was put forward that itwould surely be wrong to blame all or even most on personalities. In thearea of monetary and exchange rate policy-making there are conventionalwisdoms which come to dominate thinking. It would be rare for an uncon-ventional and even contrarian spirit to find himself or herself appointed aschief bureaucrat responsible for monetary policy. Rather, if a given set ofpolicy-makers contrive to get a monkey-wrench into the monetarymachine, there should be a search for how the framework of policy-makingcould be improved to prevent the same type or a newly imaginable type ofaccident occurring again. That – rather than the laying of blame againstindividuals – is the true challenge of the experience to date of the yo–yoyen, particularly during its most violent episodes in the 1990s. The specificquestions in search of an answer can be summarised as follows.
Can we say from the history of the yo–yo yen that an improved set ofpolicy-rules and institutions, implying new constraints on policy-makerswho can pull on its string and new macro-checks designed to reduce the

216 The Yo–Yo Yen
violence of its motion, would have led to a better outcome for the Japaneseeconomy? Do we have reason to believe that these improvements shouldhelp restore Japanese prosperity in the future? Finally, are there flaws innational or international monetary orders revealed by the history of theyo–yo yen which should be addressed for the sake not just of Japan but forthe prosperity of the whole world?
There is of course a possible sceptical response to these questions. Whatis so bad, after all, about the yo–yo? The yen has been the most volatilecorner of the dominant currency triangle (linking first the US dollar, yen,and DM, and subsequently the US dollar, yen and euro) only in the 1990s.In the 1980s it was the US dollar. And surely it was to be expected, giventhe instabilities in the Japanese financial system and the violence of thecyclical fluctuations in the Japanese economy through the bubble yearsand into the subsequent post-bubble period, that the yen would be particu-larly volatile.
The sceptic could continue further. It is true that the effective exchangerate of the yen (which is weighted by the currencies of Japan’s trading part-ners) has been substantially more volatile than that of the dollar or euro.But that is a consequence of economic geography. The US and the euro-area have each as important trade partners several countries whose curren-cies are related closely to their own (for example, many of the Asian andLatin American currencies are dollar-linked, and the Canadian dollar orMexican peso move more closely with the US dollar than the euro; whilstthe Swiss franc, Swedish and Danish kroners, several central Europeanmonies, and to some extent the British pound have links to the euro). Bycontrast, the Japanese yen is on its own. Though violent fluctuations of theyen have usually pulled certain other Asian currencies (in particular, theSingapore dollar, Taiwan dollar, and South Korean won) alongside eventu-ally, the lags in adjustment have been long, and the extent of the eventualco-motion highly variable. And two key neighbouring currencies – those ofChina and Hong Kong – remain pegged to the US dollar.
Such scepticism, however, hardly forms a convincing case against actionon the yo–yo yen. Geography does matter. A given percentage fluctuationof the dollar against the yen means more to the Japanese economy thanthe same move of the dollar against the euro means for the euro-areaeconomy – precisely because the yen is on its own (rather than with acluster of satellites around it). Volatility of their own currency against theother two currencies in the dominant triangle is a more important concernfor Japanese than for US or euro-area economic policy-makers. And there islittle prospect of currency geography changing – in particular of Asian cur-rencies and the yen moving more closely together. Not only are there polit-ical obstacles to the furtherance of co-motion, but the degree of economicinterdependence is far short of that which existed within today’s euro-areain the decade before monetary union.

What To Do About the Yo–Yo Yen? 217
If a new framework were successful in curbing violent swings of the yen,that would be in itself good news for the Japanese economy (‘in itself’means so long as the method of taming the yen does not impose morecosts than the benefits of risk reduction). But volatility is not the only issuein considering what to do about the yo–yo yen. Other issues include thetotal misalignment of the yen which occurred during the 1990s – its failureto reach and remain at the competitive level which would have fitted aneconomy with a sudden bulge in its private sector savings surplus. In turn,the misalignment of the yen and its episodes of extreme overvaluationfuelled a deflationary process which monetary policy-makers had alreadyset off and then lacked the confidence to attack boldly.
One factor in the failure of the yen to fall to a competitive level was theinflammation of risk aversion on the part of Japanese investors (withrespect to foreign assets) caused by violent throws of the yo–yo. Thatinflammation had a detrimental effect on equilibrating capital flowsbetween Japan and the rest of the world. Huge fluctuations in the yen andextreme risk aversion in effect insulated Japan from the internationalcapital market. Rates of return could remain much lower in Japan thanelsewhere without an exodus of capital occurring. The persistence of a lowdomestic cost of capital allowed a range of inefficient economic activity topersist and, as we shall see below, added to the burden of demographicadjustment. The expensive average level of the yen – and in particular theepisodes when it reached dizzy heights – was a catalyst to a hollowing outof manufacturing industry. Yet manufacturing is where Japan’s compara-tive advantage lies. If manufacturing industry had been able to take advan-tage of a competitively priced yen, then it might have absorbed labourbeing shed from the inefficient services sectors of the economy subject toliberalisation. Instead, the bleak condition of manufacturing was a deter-rent to bold reform elsewhere.
Why not turn the clock back to a fixed yen–dollar rate?
One approach to the problem of the yen is to stop the yo–yo – in effect toturn the clock back to an era of fixed exchange rates. That idea formed thecentre-piece of proposals put forward a few years ago by McKinnon andOhno (1997). These authors set out proposals for a monetary accordbetween Japan and the USA, including ‘new rules of the game for thesteady state’. The first rule is a target zone for the yen-dollar exchange ratewith a margin of fluctuation of 5 per cent either side of a central rate basedon purchasing power parity derived from wholesale price levels. (Someyears after confidence in the accord is established, narrow the band ofexchange variation.) Second, neither the Bank of Japan nor Federal Reserveis to fully sterilise intervention in the foreign exchange markets, and the

218 The Yo–Yo Yen
US Treasury should build up large reserves in Japanese yen. Third, bothcentral banks are to pursue policies of credit expansion aimed at anchoringthe price level of tradable goods (as measured by the WPI in Japan or thePPI in the USA). Fourth, in the case of a speculative attack that wouldrequire very sharp increases in short-term interest rates to defend theexchange rate, the bands of permitted exchange rate fluctuation are to besuspended temporarily but the traditional yen–dollar exchange rate parityis to be restored as soon as possible. And crucial to the success of the pactwould be the conclusion of a new US–Japan Compact for Commerce andTrade in which Japan would commit itself to a comprehensive programmeof economic liberalisation in return for which the USA would unequivo-cally abandon any commercial use of exchange rate policy.
The idea, however, of a US–Japan monetary accord along these lines hasdeep flaws. Why would Washington sacrifice any independence in mone-tary policy and embark on potentially large-scale foreign exchange marketintervention which is widely disliked in Congress, the Federal Reserve, andthe Treasury? The supposed carrot is Tokyo finally saying yes to a catalogueof demands for liberalising the Japanese economy (and incidentally provid-ing big new opportunities for US business there). But why wouldWashington have full trust in yes meaning yes – the ability of Tokyo todeliver on its promises? If there were indeed a breach, would currencymarkets not immediately question whether the days of the monetary accorditself might be limited? Would it not be better just to wait until the climateinside Japan changed in favour of economic reform – and desist from dealsoffering the carrot of an exchange rate pact? And if the climate did notchange, the standard of living in Japan would be the main casualty. US busi-ness has many international opportunities for expansion outside Japan!
The flaws were not all on the side of US perceptions. Tokyo, by tyingitself into a monetary accord as described, would increase its vulnerabilityto a new shock from Washington. Suppose, for example, in the context of aUS recession, Washington demanded that Tokyo embark on further fiscalreflation and accelerate economic reform, with the veiled threat that failureto comply would mean the end of the monetary accord. Massive outflowsof ‘hot money’ from dollars into yen could lead to an immediate suspen-sion of the exchange rate bands and in some circumstances create mone-tary instability in Japan (not a near-term problem, given the persistentdeflation; anything that increases monetary expansion would be goodnews). If serious about preserving the pact, Tokyo might have to becomesubservient to Washington in the setting of fiscal and structural economicpolicy. Monetary policy, in any case, would be subservient, as the Bank ofJapan’s ability to pursue an independent course would be constrained bythe exchange rate limits. In so far as there was indeed confidence in thepact lasting, Japanese interest rates would be tied closely to US rates(although the margins of permitted exchange rate fluctuation would make

What To Do About the Yo–Yo Yen? 219
scope for differentials to open up between interest rates on the two curren-cies). An abrupt rise of Japanese rates to near US levels could inflict largeadjustment costs on the Japanese economy (bankruptcy of many marginalfirms who have been surviving on the life-support machine of zero interestrates; big losses in the financial sector as government bonds would collapsein price) – and so there would have to be a long period of time betweenagreement to a monetary pact and its implementation.
There are questions concerned with the parity to be agreed. A centralobservation through earlier chapters has been that the yen did not fall toreflect the huge private sector savings surplus that emerged following theend of the bubble economy. A big expansion of the fiscal deficit played arole in the misalignment. In any medium-term profile for the Japaneseeconomy, the fiscal deficit has to fall. The wholesale price level in Japan in,say, 2000 reflected the highly valued and misaligned yen. A reflection ofserious disequilibrium should not be the basis of calculating the new parity.Rather, the assumption should be that parity would be well below theaverage level of the 1990s, implying that Japanese wholesale prices wouldrise substantially. Moreover, given the deflationary trap into which theJapanese economy had fallen by the end of the 1990s, and the question-mark as to whether conventional monetary policy could create an exitfrom that trap, there was a basis for arguing that a big yen devaluation wasrequired simply as a last-resort unconventional monetary instrumentcapable of diffusing deflationary expectations. But how could Washingtonand Tokyo agree on the use of such a tool, and would not Washingtonargue anyhow that there should be provision for the yen to rise once thedeflation crisis was over, rather than Japan stealing long-run unjustifiablecompetitive advantage? Would Washington and Tokyo not have to consultwith other Asian countries whose economies would be highly sensitive toany big realignment of the yen? The need for such multilateral consulta-tion would in itself be inhibiting to the whole plan.
In sum, the McKinnon–Ohno proposals are not promising as seen fromthe early 2000s as a method of tackling the yo–yo yen. That does not meanan emergency fix should be ruled out in all circumstances. At various stagesin the history of the yo–yo yen recounted in earlier chapters an emergencyfix might have been an attractive option. For example when the yen wasspiralling up on its own in spring 1993, the Japanese government couldhave announced that the absolute ceiling for the yen against the dollarwould be 120 and ordered the Bank of Japan to sell unlimited amounts ofyen at that level. Once market-participants believed in the existence of theceiling, and if indeed Japanese interest rates were below US rates, then theyen would sink to well below the ceiling (meaning a yen/dollar rate in the130s, say). The same prescription could have been applied in summer orautumn 1999, when large-scale sterilised intervention on its own waslargely ineffective.

220 The Yo–Yo Yen
Another situation in which an emergency ceiling could have been intro-duced is that of 2001, when a view had gained widespread acceptance inTokyo and Washington that yen devaluation was the only tool left whichcould end deflation now that interest rates were already at zero and therewas no further scope for fiscal reflation – indeed a start on fiscal consolida-tion was already on the agenda. In this climate, Tokyo might haveannounced that the yen was to be devalued and that a ceiling of 140 wouldapply to the yen against the dollar ‘over the medium term, until deflationis ended’. Once the ceiling was believed, the yen might have settled, say, inthe 150s (in that investors would want compensation in the form of, prob-ably, yen appreciation to compensate for lower interest income than ondollars).
The nearest historical example to the tactic described was the Swiss gov-ernment’s introduction of an emergency ceiling for the franc against theDM of 0.80 (francs/DM) in autumn 1978 to burst a bubble of its currencywhich threatened to transform it into a ‘collector’s item’. The success of theemergency ceiling does depend on the notion of unlimited amount of thenational currency potentially for sale, and that requires the cooperation ofthe central bank in the form of undertaking not to sterilise funds createdfor the purpose of intervention. That cooperation has not in general beenforthcoming from the Bank of Japan.
The emergency ceiling is by definition short-lived. The government doesnot announce for how long it will be kept (though hinting for some con-siderable time) nor does it promise to warn markets of its demise. There arenot complex international discussions leading up to its imposition. It is atool to be used only rarely – otherwise the government involved risks beingaccused of currency manipulation.
A new framework for the floating yen
If the float of the yen is not to be stopped, what answer is there to theproblems of its behaviour revealed to date? The proposal here is for a com-pletely free float within the context of a new framework for Japanesemacro-economic policy. Specifically:
1. There is to be no government intervention in the currency markets(meaning official operations outside those required for governmenttransactions) except as required to fulfil targets for foreign exchangereserve accumulation and monetary base detailed below or in an emer-gency situation of liquidity crisis (these concepts are detailed below).
2. Government and central bank officials are not to express opinions onthe level of the exchange rate or in which direction they hope it willmove. (This prohibition would not stand in the way of research

What To Do About the Yo–Yo Yen? 221
branches of the government or central bank publishing papers on cur-rency markets or seeking to educate the public regarding the economicsof exchange rate determination – see below.) In effect, there is to be no‘open mouth’ currency policy.
3. Japanese officials are not to be active participants in G-7 discussionsabout currencies given their country’s commitment to a free float. Thatdoes not mean Japan would refuse to explain or consider internationalcriticism of its policies as regards capital exports, foreign exchangereserve accumulation, and (when in force) use of foreign currenciesacquisition towards expanding the domestic monetary base.
4. The Japanese government (including the Ministry of Finance) wouldrun educational programmes (including publications, talks, and semi-nars) both for its own officials and for outsiders on ‘currency econom-ics’, seeking to increase in particular, understanding of the concepts ofprivate sector savings surplus and how equilibrium is reached betweensavings and investment (including net export of capital). Students ofthe programme are to be warned of various common fallacies, includ-ing simplistic links between the current account balance and the levelof the exchange rate.
5. The government is to publish a medium-term target (over the next fewyears) for the level of foreign exchange reserves and also its expectedrate of acquisition of reserves over the coming quarter. Net transactionsto achieve the target are to be publicised on the day they occur.Justifications for the chosen medium-term target are to be publicised infull. (For example, need for an increased contingency reserve againstforeign creditors reducing positions with Japanese banks; or buildingup foreign assets in anticipation of bulging pension liabilities and inview of high risk aversion towards foreign assets amongst the investingpublic; or exceptionally as part of a package of measures to enddeflation when a situation of deflation alert has been declared by thegovernment, as below.)
6. If the authorities responsible for monitoring the currency marketsdetermine that a situation of severe illiquidity has developed (otherwisedescribed as disorderly market), then an emergency release or additionshould be made to the foreign exchange reserves, with no change inthe medium-term target. (In the example of October 1998, the authori-ties would have determined that massive attempted closing of positionsby hedge funds had created a disorderly market, and would have sanc-tioned, say, an emergency increase in foreign exchange reserves of upto $30bn over the next week. These decisions may not have been takenuntil late in the day, but some exchange market participations,knowing that such contingency arrangements existed, would havebeen willing to go short in the yen in anticipation of them coming intoeffect, and so the jump in the yen would have been much less.)

222 The Yo–Yo Yen
7. Constitutional limits on budgetary policy would be introduced (and ifnot possible, the next best thing would be legislation setting out a clearprofile of falling budget deficits and automatic corrective action if theseare overrun) with the long-run aim of budget balance enshrined. Theselimits would be unbreachable even under pressure from outside. (Justas Japan cannot be asked to participate in most types of internationalmilitary operation because of pacifist provisions in its constitution, soWashington would not be able to demand that Japan take reflationaryfiscal action.)
8. There is to be no tolerance of deflation. The normal situation is to becore inflation of between zero and 3 per cent. In a situation of actual orthreatened deflation, various emergency provisions which can overrideusual divisions of responsibility between the central banks and govern-ment take effect. (These are detailed below.)
9. The Bank of Japan Law is to be modified. It is to be clear under thenew law that the central bank and its Governor have no responsibil-ity for currency policy either directly or indirectly (via pronounce-ments of officials). The Governor’s appointment is to be made subjectto more effective scrutiny by the Diet. His term of office should belimited to 3 years, with reappointment subject to approval in theDiet, where the relevant committee would be asked to publish areport rating his performance to date. The BoJ must set out clearly atthe start of each year medium-term targets for money supply andmonetary base growth consistent with the inflation target. TheGovernor must explain these targets to the relevant Diet Committeeand be subject to questioning concerning their derivation, imple-mentation, and failure (where applicable) to meet. Serious andrepeated failure to meet the targets can be grounds for the Diet tovote for the dismissal of the Governor before the end of his term. If asituation of deflation alert comes into existence (to be determined bythe government on the basis of published yardsticks, including recentbehaviour of various price indices and possibly leading indicators),then provisions of central bank independence are suspended asdetailed in (10) below.
10. In a situation of deflation alert, the government can itself determinethe target for monetary base expansion to be followed by the BoJ andstipulate further that it be achieved by purchasing foreign currenciesup to a stipulated amount. The foreign currencies bought would beincluded as part of the foreign exchange reserves and count towardsmeeting the target for these (which may be increased to take account ofthe deflationary situation). In a situation of severe deflation which hasnot responded to full use of conventional tools, including acceleratedgrowth of foreign exchange reserves and foreign currency use towardsmeeting the monetary base growth target, the government can take all
What To Do About the Yo–Yo Yen? 223
powers necessary to implement an emergency regime of negative inter-est rates (to be described below).
11. The government is to be responsible for promoting a capital exportpolicy. The idea behind this is that huge past volatility of the yen andinflamed risk aversion are seriously impeding the flow of capital out ofJapan into much higher yielding assets abroad and a serious misalloca-tion of capital is thereby coming about. Moreover, an increase in themomentum of capital outflow would help raise the equilibrium level ofreal interest rates in Japan and so reduce the risk of the economyfalling into a painful deflationary trap out of which even zero interestrates might not provide an escape. Explicit tax breaks should be givenon foreign portfolio investment (and all tax disincentives to capitaloutflow scrapped). All public sector managers of pension funds wouldbe ordered to raise the share of foreign assets in their portfolios accord-ing to an ambitious formula. The capital export policy would be subjectto continuing review – so that if risk aversion were determined to havefallen, some of the incentives could be gradually withdrawn.
Emergency provision for negative interest rate regime
The idea of removing the zero barrier to interest rates in a situation of severedeflation has a long history – in fact Keynes in his ‘General Theory’ attributesan original proposal to an Argentinian economist writing in Switzerland atthe beginning of the twentieth century. The normal barrier to rates fallingbelow zero is of course the existence of banknotes. If the central bank wereto cut key money rates into significantly negative territory then holders ofbank deposits would withdraw large volumes of funds, preferring to holdthem at no interest in safe-boxes or under the mattress rather than at nega-tive interest rates. On top of the deflation problem would be superimposed abanking crisis. All proposals to pierce the barrier involve some method ofimposing a cost on the holding of banknotes. Each method is more or lessclumsy (for example, banknotes with magnetic strips on the back whichregister the payment of stamp tax at say monthly intervals) and can be dis-missed readily by sceptics as impractical. Why make changes to the mostbasic element in circulating money when the deflation problem may well betemporary? In any case, there are other ways of combating deflation, evenwhen rates are already at zero and can be cut no further – for examplemassive expansion of the monetary base, devaluation, or simply sprayingbanknotes from helicopters. Why not try these first?
In fact, there is not much empirical evidence as to whether monetarypolicy on its own is capable of wrenching an economy out of a severedeflation (which in itself must be due to serious previous errors in mone-tary policy). In general, large explicit devaluations of the national currency

224 The Yo–Yo Yen
have been the way out of past deflations – including the Japanese deflationof the 1920s (yen devalued end-1930), the US deflation of the early 1930s(dollar devalued 1933–4), or the European deflations of the 1930s (goldbloc currencies devalued 1936). There is no actual example from the twen-tieth century of massive monetary base expansion in peacetime takingplace with rates already at zero without an explicit devaluation alongside.Hence the laboratory of history does not provide evidence for or againstthe hypothesis that monetary policy on its own is capable of endingdeflation. A first-time success is of course possible. Several commentatorshave suggested that Japan could indeed be this first case. But their opti-mism on monetary policy is based on belief in so-called ‘black box mecha-nisms’ familiar to monetary economists. (Milton Friedman was aproponent of the view that the specifics of how changes in the moneysupply affect the economy are unknown in some respects but what mattersare the predictable relationships derived from past history.)
It seems that the optimists on the power of monetary policy to enddeflation, despite rates already at zero and without any explicit policy ofdevaluation alongside, have in mind various asset-price effects and perhapssome hypothetical ‘revulsion’ amongst the public against amassing notesrather than spending them. Specifically, vast open market operations mightbe successful in pushing up bond and equity prices, and this in itself wouldhelp stimulate demand in the economy. Cynics retort that if bond marketseven suspect that the new aggression in monetary policy might be success-ful, prices would fall there, as long-term rates began to discount the end ofdeflation. And there are too many legal and other complications in the wayof the central bank making large purchases in the equity market, which inany case would be of dubious impact. It is difficult to imagine why pur-chases which at most would be a tiny percentage of the total stock of equi-ties should have a big price impact. But suppose they did, would there bemuch of a wealth effect on spending? Even if some optimists were to admitdoubt about asset price effects they might be more hopeful about ‘revul-sion’ effects.
Specifically, as the central bank pumped up the monetary base with vastopen market operations, the banks would find themselves with huge excessreserves. As money market rates were at zero and most likely their capitalpositions weak they would not respond by stepping up their lending tocommercial or household borrowers (in fact, if the equilibrium rate ofinterest is indeed negative, but actual rates cannot get there because of thezero barrier, there might be no new borrowers out there in any case).Instead, they might cut their deposit rates to effectively somewhat negativelevels by imposing new charges – and so they could derive some profit fromthe slim margin between deposit rates and the zero rate on reserves. Somedepositors would pull their funds out and hold them in banknotes underthese circumstances, and this withdrawal would mean that excess reserves

What To Do About the Yo–Yo Yen? 225
in the banking system drained out. Households finding themselves withrising piles of banknotes could decide that it would be better to spend someof them on consumer durables. Such revulsion is indeed possible – thathouseholds were quite happy to accumulate bank deposits at zero rates butonce rates fall slightly below zero and their money holdings shift in somedegree into banknote hoards they are driven to spend. But there is no firmbasis for hope. Indeed, the danger of a systemic banking crisis might wellincrease. A long period of zero money market rates would seriously under-mine bank profitability as one of the main sources of earnings – the marginbetween rates paid to retail depositors and wholesale money rates – yieldedonly a trickle.
It is the possibility of failure for monetary expansion as described, andthe potential inability to devalue the national currency by a large amount(perhaps because other major economies are also in recession) that justifiesa monetary framework having provision for crisis measures in a severedeflation which would permit interest rates to fall to substantial sub-zerolevels. The potential package of measures would be there for all to see andthat in itself might help dampen the extent of deflationary expectations,even though there may be doubts as to whether the government of the daywould decide to implement them and receive the necessary legislativeapproval. Implementation would not mean any let-up of efforts to achievethe aggressive targets for monetary base expansion and foreign exchangereserve accumulation as already described.
The package could be presented as a ‘currency reform plan’ (the ideashere were published in articles by the author of this book in the NihonKeizai Shimbun, 23 December 1998 and in the Nikkei Weekly, 11 January1999). The government would announce that at a given date, say five yearshence, all then-existing yen banknotes would have to be converted intonew yen notes, where the rate of conversion would be less than 1 for 1 –say 100 old yen equals 90 new yen. From the coming of the plan into oper-ation until the conversion at the end, the normal one-to-one link betweenbanknotes and bank deposits would be suspended, and there would be afree market in banknotes against bank deposits (indeed in the pre-FederalReserve history of the USA there were various episodes of precisely this typeof arrangement – banknotes trading at variable discounts against bankdeposits). Thus banknotes would depreciate at a rate of around 2 per centp.a. versus bank deposits over the illustrative 5-year period.
Rather than a free market, the authorities could fix a gradually depreciat-ing exchange rate between banknotes and deposits (with its agent, theBank of Japan, willing to transact at these rates), where the fixing occurredeach month. For example, suppose the 5-year period started on 1 January2003. In the first month an exchange rate would be set of 100.17 bank-notes = 100 deposit. Thus investors paying in yen banknotes to their bankwould get slightly less than the full nominal equivalent amount as a

226 The Yo–Yo Yen
deposit. Conversely, depositors pulling out banknotes from their bankaccounts would get slightly more than the full nominal amount. Bankswould charge a small fee on banknote transactions, making it impossiblefor customers to arbitrage by paying banknotes in at the end of a monthand take them out at the beginning of the next month. At the level of retailtransactions in goods and services, sellers would charge a premium (risinggradually as conversion day approached) if payment was to be made inbanknotes (rather than by cheque or credit card).
During the lifetime of the currency reform plan money market ratescould fall as low as –2 per cent p.a. without any move being triggered offunds out of banks into banknote hoards. In practice the central bankmight guide money rates to a somewhat higher level (say, –11⁄2 per cent) sothat banks could earn a profit margin on small deposit business (the inter-est rate on small deposits would be at, say, –2 per cent). The Bank of Japanwould pay negative interest on deposits placed with it (almost all bankreserves), with the rate of negative interest being set as equal to the rate ofdepreciation fixed for banknotes versus bank deposits. And under the emer-gency powers which the Minister of Finance would have in a seriousdeflationary crisis (described in the previous section), he or she could orderthat the official discount rate be lowered towards –2 per cent p.a. (not rightup against that limit given that discount rate is normally somewhat abovemarket rates). The case for the currency reform plan is that substantiallysub-zero interest rates would foster a strong economic recovery from whichall would ultimately gain. The stimulus would come from several variouspossible sources.
First, there would be the incentive for households to bring forward con-sumption (although in principle the income effect might dominate –meaning that they would save more to make up for negative income if theyare trying to build up a given size nest-egg for their retirement). Second, alower cost of capital should favour corporate investment. Third, therewould be relief for highly levered borrowers in the form of an effectivewrite-down of their debts (through the application of negative interest).Fourth, bank profitability should improve, reducing the risk of financialsystem meltdown under deflationary pressure. Fifth, the yen would fallsharply against foreign currencies at the start of the plan (more accurately,as soon as the plan became a likely scenario), given the widened rate spreadbetween the yen and other monies (and, indeed, the dollar might replacethe yen in some areas of the Japanese black or grey economy, given theprospect of an eventual conversion which might not be on an anonymousbasis). There would be a widespread expectation of yen appreciationthrough the lifetime of the plan, as the period of negative rates left to gobecame shorter and shorter.
Of course if deflation came to an end and a strong economic recovery gotunder way, say, half-way through the 5-year period, then money market

What To Do About the Yo–Yo Yen? 227
rates (and the official discount rate) could again rise above zero (but themain provisions would remain in effect as regards notes depreciatingagainst bank deposits and reserves at the Bank of Japan paying negativeinterest). And no doubt if a government ever had to sell this plan to theirelectorate, it would stress that fact. Another piece of packaging which couldhelp obtain popular backing would be re-denomination. Specifically, theconversion of old yen into new yen banknotes in 5 years’ time would bejoined with the introduction of a new heavyweight yen. Thus a conversionrate of 100 old equals 1 new yen would apply to all assets and liabilities(including bonds, bank loans and deposits) except for banknotes, for which110 old yen would equal 1 new yen. Special help could be given to retiredpersons highly dependent on interest income from savings. In any casetheir plight would be mitigated by the possibility of investing in foreigncurrency deposits or in long-term bonds (long-term fixed rates wouldreflect the likely return of economic prosperity and end of deflation,hastened by the currency reform).
Such are the apparent complexities of currency reform that it is evidentlythe weapon of last resort against deflation. First there should be the histori-cal experiment of bold monetary base expansion in the hope that a black-box mechanism does indeed exist. Only if that mechanism is found out (bytrial) not to exist, and a big explicit devaluation of the yen (perhaps accom-plished via monetary base expansion taking the form of huge central bankpurchases of foreign currencies) proves impossible or ineffective, should thecurrency reform be implemented.
The new yen order – an improvement?
Would the blueprint for a freely floating yen, together with its emergencyprovisions, have meant Japan would not have gone through a lost decade,and does it hold out a better prospect of economic prosperity in the presentdecade? Any new constitutional arrangement draws on experience whichmay not be fully relevant to future conditions. The Federal Reserve Systemwas constructed with the aim of overcoming the shortfalls of the previousmonetary regime without a central bank (in particular the periodic bankingcrises and emergency suspensions of banknote convertibility). The designincluded no system of monetary rules for the new age of US monetaryhegemony which was about to dawn and was organisationally flawed(rivalry between the New York Federal Reserve and the Board inWashington). The Bretton Woods International Monetary System wasdesigned in the light of the currency chaos of the 1920s and 30s and thediagnosis that large international capital flows were usually a source of dis-equilibrium rather than a benign feature of a well-integrated globaleconomy. The whole concentration of the Bretton Woods System on thenotion of balance of payments equilibrium (meaning current account and

228 The Yo–Yo Yen
net direct investment flows summing to zero, but excluding financial orspeculative flows) became an anachronism, and there was a design flaw in that the issuer (the USA) of the numeraire currency (the dollar) could unleash inflation. The blueprints of the European Central Bank drew in part on the perceived inadequacies of the soft money central banks in Europe during the 1970s and 80s in comparison with theBundesbank. Central bank independence combined with strict inflationand monetary targets were central tenets of the new order. But early experience of the new monetary union revealed some unforeseen flaws.
Even so, every new framework is not doomed to failure. Indeed all threeexamples above have been widely interpreted as improvements on whatwent immediately before, even if imperfect and, in the case of BrettonWoods, of revealed short life. Although the designers did not and could notpossess perfect foresight, they did provide for some flexibility and the possi-bility of institutional evolution. And the new arrangements did indeedusher in a period of prosperity during which the old problems were at leastdormant. Is that likely to be the case with the blueprint here built largelyout of the experience of the yo–yo yen in the 1990s? A first point is todemonstrate that the blueprint would have been more conducive to eco-nomic prosperity in the recent past than the policy-making order that actu-ally existed. Demonstration involves an exercise in counterfactual history.Second, given the situation in which the Japanese economy finds itselfearly in the first decade of the twenty-first century, would adopting thenew framework improve the long-term outlook? Third, what are thepotential flaws in the framework and can improvements be made flexiblywithout seriously lessening the constitutional constraints on policy-makers?
As regards its operation in a counterfactual re-run of the past decade, theoutcome would have been favourable (compared to reality) in several ways.Governor Mieno would not have been able to preach in favour of a strongyen. He could not have ignored the decline in money supply growth. Andhe might well not have won reappointment at the end of his first threeyears (1992). The explosion of budget deficits from the early to mid-1990son just could not have taken place. Japanese investors in foreign assetscould have ignored talk of Washington threatening to devalue the dollaragainst the yen if Tokyo did not deliver what was asked on trade. Capitaloutflow from Japan would have been much stronger. Japanese govern-ments, no longer able to placate Washington with bigger and bigger budgetpackages and yen appreciation, might actually have had to make muchlarger moves towards undertaking economic reforms. The notoriousSakakibara–Rubin deal to push up the yen in spring 1997 in defiance of thelogic of budget tightening could not have taken place. Masaru Hayami, ifhe had been approved as Governor by the Diet in 1998, would soon have

What To Do About the Yo–Yo Yen? 229
encountered firm constraints on his power. The independence of his insti-tution would have been suspended as a state of deflation alert was declaredby the government.
All that is with the benefit of hindsight. But would implementation nowof the new framework seriously help Japan enter a long period of economicprosperity? There are some potentially powerful weapons in the frameworkusable towards ending deflation and steering Japan back to an equilibriumeconomic path (along which capital exports would boom, the yen find acheap level, and a growing export sector accommodate big structuralreform in the service sector) from which it strayed in the early 1990s andby a growing distance (as a trend). It is not likely, though, that policy couldbe run on a virtual basis (the possibility of a weapon being used having abig impact on the economy via expectations, without the relevant weaponbeing used). Not just market participants but also business decision-makersand households would need much convincing that anything had reallychanged after a decade of multiple policy failure.
Moreover, the influence of the new framework on relations betweenTokyo and Washington would be an area of potential uncertainty. Wouldthe Japanese government succeed in persuading the USA of the advantagesfor both countries? Or would there be a period of new friction? On balance,Tokyo would have a good case to make – that the new framework shouldbe successful and is fully consistent with economic liberalism both in Japanand globally. But the personality and skill of the diplomats matter. Aneffective way of demonstrating good faith (against the charge that the newframework was a disguise for old-type beggar-your-neighbour policies ofdevaluation) would be to adopt simultaneously a programme of economicliberalisation – offering important new business opportunities in Japan toforeign companies.
It is from within Japan itself rather than from outside that possible flawswould most probably emerge. The Bank of Japan itself is likely to be lessthan enthusiastic about a new order which takes away some of its previousindependence. This would be a first time that a major central bank hadwon treasured independence from government and then lost it, at least tosome degree. Would the Bank pursue a strategy of rearguard actions andless than full cooperation with the anti-deflation policy, and so risk afurther curtailment of independence which would damage the balance ofpower within the economic policy-making establishment? Or could thecentral bank under the new regime gain in status and preserve the impor-tant degrees of freedom (from government control) which remain? TheBank of Japan could gain popularity via cooperating with government inpolicy-making that proves to be successful.
A grey area in which understanding rather than friction would be desir-able between the central bank and government is where to aim for withinthe broad target for inflation. That would not be an immediate problem,

230 The Yo–Yo Yen
given the starting point of deflation. But once deflation is overcome,should monetary policy aim for inflation near the bottom or top of thetarget range? Ideally, that should be a decision taken by the central bank,with due caution to the dangers of running an economy too close to thezero inflation limit (in that bold anti-cyclical policy might become infeasi-ble given the zero barrier to money rates) but also aware of the risks ofsteering too near the top (in that a blip could force sudden tightening inmonetary policy or else serious loss of credibility). In fact the optimum rateof inflation at which to aim within the target range may vary over time.Clumsiness – or worse, incoherence – in explaining to the markets where inthe target range the central bank is steering inflation (within the targetrange) could emerge as a possible flaw in the hypothetical arrangements.
The demographic challenge – a reason for action on the yen?
Would action on the yo–yo yen as described so far in this chapter help theprocess of adjustment in the Japanese economy to demographic change?Japan stands out – together with Italy and Germany – as having a bulgingshare of its population which is aged over 65. That situation dates backalready to the mid-1990s and continues into the second decade of thepresent century. After that the rate of bulge decreases in these three coun-tries, whilst it accelerates in some other major economies. Moreover thethree countries mentioned face big declines ahead in their total populationand particularly in their labour forces. Germany, however, is expected toexperience (allow) a big increase in the rate of immigration. And bothItalian and German demographic change is occurring in the context of anintegrated economic and monetary area which includes several countrieswith quite dissimilar demographics. By contrast, the assumption is thatJapan will not become an immigration society in the foreseeable future andthat there will be no economic or monetary union formed in Asia.
Before discussing how the yo–yo yen might have worsened the economicproblems associated with ‘unfavourable’ demographics, and how the blue-print put forward could represent an improvement, it is important to putthe ageing discussion in perspective. An ageing economy – meaning arising proportion of old people in the total population – is not a bad thing.Ageing is the result of some combination of falling fertility and rising lifeexpectancy. It is true that ageing may be a drag on the growth of GDP percapita – if indeed the share of the working population in the total is falling.But during their working life the expectation of those now retired was thattheir income would fall in old age. At the level of the economy as a wholeresources may well have to shift towards provision of health care and per-sonal care (of the aged) but there is no reason to assume that privatemarket mechanisms or public choice (via the government sector) shouldfail to achieve this.
What To Do About the Yo–Yo Yen? 231
More problematic, at the level of the macro-economy, can be the substan-tial fluctuations (over a long period of time) in the balance between savingsand investment which the ageing process generates. As we have seen inearlier chapters, shifts in the desired level of savings relative to investmentcan be the source of economic disequilibrium if flows of internationalcapital are inelastic (with respect to interest rate differentials), the naturalreal rate of interest is negative but inflation is very low or negative (meaningthat nominal rates would have to fall to a sub-zero level to produce negativereal rates), and the size of the current account surplus is a direct influenceon exchange rate expectations (as when there is conflict between the USAand Japan on trade). Towards understanding the relation between demo-graphics and the savings–investment balance, let us consider first whatwould happen in an economy where all provision for old age occurred inthe private sector, with no public provision of pensions. A character-istic of the demographics in this hypothetical economy chosen for exami-nation is a bulge in the proportion of the population in the last twodecades before retirement, the result in part of a long-gone period ofbaby-boom.
The bulge would bring a rise in the savings rate, as the pre-retirementgeneration of workers sought to provide themselves with capital whichthey could live off (income and capital drawdown) once their labourincome fell or came to an end. In the context of a closed economy the risein the savings rate would go along with a rise in the investment rate, araised capital–output ratio, and most probably a fall in the average rate ofreturn to capital. The increase in the capital output ratio (meaning, incrude terms, more capital equipment per worker) should boost the level ofmarginal labour productivity in the economy, translating into higher-than-otherwise real wages. In turn, those higher wages facilitate the building-upof a given size nest-egg for retirement. Then, as the baby-boom cohortbegins to move into retirement, the savings rate gradually falls, as the fast-growing population of retired workers draws on their previous savings. Thisprocess may go along with some decline in the capital–output ratio,meaning smaller increases or an actual fall in real wage rates (as marginallabour productivity is adversely affected) and a rise in the rate of return tocapital. If the labour force, however, is declining in size at the same time asthe retirement population is bulging, the capital–output ratio might beunaffected or even rise (meaning no downward and perhaps upward pres-sure on real wages). In both cases the rundown of the capital stock in theeconomy (compared to what it otherwise would have been) allows overallconsumption (including that of both present workers and the retired popu-lation) to rise relative to overall economic output (real GDP).
Switching the context to an open economy, the key issue is whetherdemographic change is occurring at different rates in different countries (ormore importantly currency areas) and being accompanied by distinct pat-
232 The Yo–Yo Yen
terns of evolution in the savings–investment balance. If, for example, thebulge in the pre-retirement population is occurring in the given country Aahead of other major economies, then it may well go into savings surpluswhilst the others go into savings deficit (investment in excess of savings).Capital exports from A recycle its savings surplus to the other economies.Compared to the closed economy case discussed above, the rise in thecapital–output ratio will be less and there will be a smaller correspondingincrease in real wage-rates. Instead, provision for retirement is made tosome extent by a build-up of foreign assets. (The extent to which foreignassets substitute for a rise in the capital–output ratio depends on the degreeof risk aversion towards foreign assets. If risk aversion is very low, there is ahigh degree of substitution, and conversely.)
It could be argued from a national perspective that it is better if provisionfor retirement occurs through a build-up of domestic capital stock thanforeign investments, because in the former case there is the bonus of realwage gain which facilitates saving and this might more than offset theadvantage of extra rate of return on foreign assets. This argument is notrestricted to the issue of ageing. It has reared its head in discussions ofwhether there should be tax incentives to domestic rather than foreigninvestment. The standard response is that capital should be allowed to seekthe highest return available, within or outside the national frontiers.Attempts to promote domestic at the expense of foreign investment have had little proven success and can simply fuel inefficient increase inthe domestic capital stock. Moreover such attempts smack of beggar-your-neighbour policies – if all countries gave incentives for capital to remain at home no one country’s efforts would achieve much andoverall there would be a less efficient allocation of capital internation-ally (there would be less outward and inward investment for each country).
A more sophisticated concern about the ageing economy A building upforeign investments (in aggregate) is what happens once it proceeds intothe next demographic stage. There it is the population of retired personswhich is bulging and the growth in the pre-retirement age group slowsdown or even becomes negative. The fall in the aggregate savings pro-pensity of economy A would go along with a contraction in its currentaccount surplus and slowdown of capital exports. Eventually the currentaccount and savings balance might even go into deficit and net capitalexports give way to net imports (whether this happens depends of courseon what is occurring simultaneously to the demographic profile in othercountries). In principle, this evolution should go along with a gradual realappreciation of economy A’s currency. That appreciation tendency wouldcurtail to some degree the cumulative returns from foreign assets andprolong the period of low returns on domestic assets (expectations of cur-rency appreciation are normally reflected in domestic rates being low by

What To Do About the Yo–Yo Yen? 233
international comparison) despite the diminishing savings surplus. But allof this is knowable in advance – during the period of large savings surplus –and does not imply that the build-up in foreign assets was inefficient.
Another concern relates to possible irrationalities in foreign investment.Suppose economy A’s ageing population built up portfolios of high-riskforeign bonds with low levels of diversification and these subsequentlymostly go bad. A response is that irrationality could apply as much todomestic as to foreign investment. A more general point is that in practiceno economy leaves provision for old age entirely to individuals but takesover some social guarantee function, normally via the public provision ofpensions up to a certain limit – much higher in some countries than others.Public pension provision usually occurs in some degree on a pay-as-you-gobasis (PAYG). In the case of an economy with a cohort of baby-boomersmoving towards retirement, the existence of a PAYG system means some-what lower national savings than otherwise (nonetheless possibly high byinternational comparison) during the period when the pre-retirement popu-lation bulges. When later the retired population bulges, the turnaround insavings (the fall in the national savings rate) could be as great as in the fullyself-care system if indeed the public sector simply issues extra debt to copewith its unfunded pension payments. But given that there has not been asmuch build-up of domestic or foreign capital stock the bulge in pensionpayments is accompanied by a lower average capital–output ratio, meaningwage-rates are lower. Thus unfunded pensions impose some burden on theworking population – causing intergenerational inequity – even in the caseof no rise in the social security tax burden (as would happen if taxes wereraised to keep the PAYG system in the black).
Let us shift attention from hypothetical economy A to Japan through the1990s and into the first decades of the twenty-first century. What deduc-tions can we make (from the hypothetical to the actual)? First, the wildfluctuations of the yo–yo yen and the high degree of risk aversion withrespect to foreign assets which that engendered most likely held back theextent of foreign asset accumulation and raised domestic asset accumula-tion. That was inefficient. Second, the rapid growth of public investmentduring the 1990s, itself stemming from efforts to contain the currentaccount surplus and underpin a higher valued yen as sought byWashington, meant that the pre-retirement savings bulge at the level of themacro-economy was funnelled in considerable part into low or negativeyielding projects. Hence when the retired population bulges there will beless cushion in the form of an elevated level of efficient capital stock whichcan be drawn down.
Japan in the first decade of the twenty-first century is already approach-ing the early stages of the demographic phase where the retired populationis growing rapidly whilst the pre-retirement population of 40- and 50-year-olds is growing at a slower pace. Hence the demographic influence on the

234 The Yo–Yo Yen
savings rate could already be turning negative. But that is far from certain.It might be that today’s middle-aged population, seeing the weak state ofthe public finances, has little confidence in the present level of publicpension provision being maintained and they might be concerned at muchhigher health charges over their retired lifetime. The retired populationmay be the source of less dissaving than widely assumed. Yes, there will bethe age-related deterioration in the public finances (due to PAYG systembeing unfunded) – itself a downward influence on national savings. But atthe level of private savings retired persons in aggregate might do little morethan consume income (including the gains in purchasing power of mone-tary assets attributable to deflation) on accumulated capital rather thandepleting that capital. Influences pointing in that direction are, reputedly,strong bequest motivation, a high degree of uncertainty as to possible out-goings in old age and considerable aversion to finding oneself dependenton public welfare or financial support from children. And even if theoverall savings rate does fall, there is the distinct possibility of a fall in theinvestment rate related to a shrinking of the labour force. Thus the savingssurplus might well actually rise.
In sum, the demographic influence on Japan’s savings surplus mightremain positive for some considerable period ahead. In that case, thebenefits of promoting a lowering of risk aversion with respect to foreignassets and reduction in wasteful public investment such as would occurunder the implementation of the proposed framework for monetary andexchange rate policy, would be as described already. And even if the demo-graphic influence is already – or about to – impart a contractionaryinfluence on the domestic savings surplus, that will probably be more thanoffset by an inevitable tightening in fiscal policy (meaning less public dis-saving) which would occur under almost any scenario (even without thenew framework being introduced). Japan’s overall savings rate (public andprivate sectors combined) is likely to be growing, and fostering a flow intoforeign assets should be economically efficient.
But what would happen well into the next demographic phase, albeit along time off, if indeed by then Japan’s overall savings rate were to befalling faster than the investment rate, meaning downward pressure onthe savings surplus and current account surplus, and upward pressure onthe yen? New policy issues at that stage might include, first, educating themarkets about the meaning of the ‘deterioration’ in the current account ofthe balance of payments (not indicative of Japan losing competitiveness,but of consumption – including that by the retired population – rising rela-tive to output) so as to avoid a counter-to-equilibrium tendency fall of theyen. Second, there would be sense in a reassessment of measures to makethe yen appealing as an international investment currency. If variousrestrictions or lack of competitiveness in the Tokyo market-place meantthat there would be a disproportionate liquidation of foreign assets by

What To Do About the Yo–Yo Yen? 235
Japanese investors compared to foreign buying of Japanese assets so asproduce a given net capital inflow, that would be sub-optimal.
In making any long-run projection, however, about demographicinfluences, extreme caution is advisable. Projections of population growthand age structure become less and less reliable the further out we look. Theamount of immigration, fertility rates, life expectancy, age of retirement,extent of post-retirement age working, degree of participation in the labourforce – are prominent examples of the variables which enter the analysis.Demographic trends are at their least uncertain over the short andmedium-term future. But over that time span other changes in the econ-omy are likely to prove more important than demographic trends indetermining outcomes – real and financial (including the exchange rate).
The yo–yo yen and global economic prosperity
Generations of economics students – and indeed students in many relatedtopics – have been taught that a great depression such as occurred in theUSA and several other large industrialised economies in the inter-war period(1919–39) could never happen again. International economic cooperationand treaties ruled out the type of devastating nationalistic policies whichwere followed then, both as regards trade and finance. The Keynesian revo-lution has occurred, and though it had been much deprecated since, a broadmajority of economists still believed that a bold fiscal expansion wascapable of countering recession. And central bankers had surely learnt someimportant lessons that would avoid the blundering policies which werepursued by the Federal Reserve both in the late stages of the 1920s boomand into the subsequent slump. All that was conventional wisdom.
The experience of Japan, and of the yo–yo yen in particular, has chal-lenged that wisdom, even though it must be said that the Lost Decadebares nothing of the severity of the depressions in the inter-war period.International economic cooperation concerning the problems of theJapanese economy has been deeply flawed. Highly expansionaryKeynesian-type fiscal policies brought an alarming deterioration in Japan’spublic finances and helped to channel a huge private sector savings surplusinto pork-barrel negative yielding projects rather than high yielding foreignassets. They could not end deflation. And central bankers in the world’ssecond largest economy seemed to have no more skill in navigatingthrough a period of general euphoria followed by post-bubble bluesthan US monetary policy-makers in the late 1920s and early 1930s.Contemporary monetary critics judged that incompetence played a role.But the issue remains unresolved – once an economy sinks into a deflation-ary process, can conventional monetary policy tools, however boldlyapplied, bring a turnaround unaided by either exchange rate policy or cur-rency reform?
236 The Yo–Yo Yen
Let us look at each of these issues in turn. What international economiccooperation has there been concerning the Great Deflation which tookhold in the world’s number-two economy during the 1990s and the violentswings in its currency? In practice, the main form of cooperation has beena policy dialogue, at times highly confrontational, between Washingtonand Tokyo. Cooperation is here a false name. A nation-state, even theworld’s largest, in pursuing its international economic policy, cannot beexpected to be purely altruistic. Washington’s guiding interest in theJapanese economy has been self-interest. If that meant pulling the Japaneseeconomy out of a deflationary spiral it would coincide with Japan’s inter-ests. But there have been other key items in Washington’s Japan agenda –such as reducing the bilateral trade surplus and holding down the overallcurrent account surplus – which have smacked of neo-mercantilism.Washington was quite prepared to press Tokyo into the biggest experimentof Keynesian economics whilst remaining mum about the potential formonetary reflation simply because fiscal reflation promised a higher yenand smaller Japanese trade surplus. A key US interest in Japanese economicaffairs was the potential exposure of the US financial system to a Japanesebanking crisis. Hence Washington tended to put large emphasis on ‘curingthe banking problem’ as a priority of Japanese economic policy. US officialsdid not warm to the view that the banking problem was a result, ratherthan a principal cause, of deflation and disappointing overall economicperformance, and that a solution should be left to the play of market forcesoperating under a new framework for monetary and currency policy. Nosenior economic policy adviser in Washington of the 1990s could hope togain from advancing the view that Japan should be allowed to run hugecurrent account surpluses reflecting its private sector savings surplus andthat the yen should be much weaker.
Outside the area of high-level negotiations, there has been constructiveinterchange of views between economic officials on both sides of thePacific. The Federal Reserve has hosted academic seminars on key topics ofinterest to Japan (and also of potential future interest to the USA) includinghow to conduct monetary policy when the zero bound to nominal interestrates becomes an effective constraint. Individual Federal Reserve bankshave published insightful papers about the failings of Japanese monetarypolicy and faults in the Japanese banking system. Such academic inter-change, however, does not in itself mean that policy-makers swerve fromtheir favoured path. What has been missing is an international voice of anyauthority, to which both Washington and Tokyo would take heed (withoutnecessarily obeying!), issuing at times strong views, about optimum eco-nomic policies from a world perspective.
In principle the IMF or OECD could have taken the lead. But at no pointin 1990–1 did they sound the alarm about Japanese monetary policy beingovertight, and subsequently their strong preference was for fiscal reflation.
What To Do About the Yo–Yo Yen? 237
Other than one isolated instance in 1990 when there was concern aboutglobal capital shortage in the wake of German unification, the IMF neveradvanced the view that a large Japanese current account surplus was abenign development – the natural counterpart to a huge private sectorsavings surplus. Instead, the IMF seemed at times like a mouthpiece of theUS Treasury, preaching the need for fiscal reflation to contain the size ofthe current account surplus. Though one function of the IMF is to surveycurrency markets, that institution never articulated the view that the yenhad become seriously overvalued in the aftermath of the Japanese assetmarket bubble bursting and that the world economy needed a yen nearer200 than 100 to the dollar. In the worst case of disorderly markets betweenmajor currencies – the 20-per-cent-plus appreciation of the yen in one day(October 1998) – the IMF head indeed uttered some concern, but there wasno serious follow-up.
The sceptic would argue that there cannot be an international voice asdescribed. The IMF and OECD are not think-tanks. They are highly politicalorganisations run by people who are appointed not for independence ofview but for other qualities (including the right nationality). Anyhow, evenacademic think-tanks can be blind to the obvious and swayed by what iscurrently popular. It would be wrong to blame any supranational organisa-tion for the failures of the Japanese economy. Rather we should just acceptthat economic policies are designed and run by national governments. Thewise prince, where he exists, might take advantage of consultations withthe best international economists at think-tanks in Washington or else-where. And he may be lucky – one of the many candidate advisers mightactually have thought of the best policy from both a national and an inter-national perspective. But how often does that lucky event occur, where thewise prince searches and finds the best advice? The sceptic might indeed becorrect. But then it is time to unlearn one of the textbook lessons abouthow the world economy is better off than in the inter-war period. The peri-odic discussions at G-7 summits on exchange rate levels, sometimes findingexpression in subsequent communiqués and flurries of official interventionin currency markets, should end once and for all.
What about the next lesson – the power of fiscal policy to lift aneconomy out of recession? The powerful doses of fiscal reflation in Japanthrough the 1990s can be linked to the cyclical revivals of 1996–7 and1999–2000. And so the argument that fiscal policy is indeed a safety-valveagainst a 1930s-type slump cannot be rejected in the light of Japaneseexperience. Nonetheless, the Lost Decade does add a new perspective onthe potential long-run costs of pump-priming measures. Rather thanJapan’s huge private sector savings surplus flowing out into high-yieldingforeign assets, it was channelled to a large extent into negative yieldingpublic investment projects. Surely Japan would now be more prosperous ifmonetary policy had been successful in lifting the economy out of reces-
238 The Yo–Yo Yen
sion on its own? The counterfactual historian could indeed argue that ifmonetary tightening had come to an end already in late 1989, and the sub-sequent easing had been much bolder, then Japan would have entered anew era of prosperity by the mid-1990s. Further, he could claim that theJapanese experience of the early 1990s teaches an old lesson – monetarypolicy is too important to be left to central bankers exercising discretionaryjudgement. Rather there should be a system of rules and the centralbankers’ jobs should depend on abiding by those rules.
Should we be less confident in the light of recent Japanese history aboutthe power of monetary policy to end a deflationary spiral (which is likely tostem from serious prior mistakes in monetary policy)? Some monetaryeconomists claim that the Federal Reserve could have single-handedlyended the deflation of the early 1930s by pursuing aggressive open-marketoperations and thereby preventing a decline in the money supply. Indeed,Milton Friedman in his renowned monetary history attributes some successto a brief episode of monetary expansionism in spring 1932 which was ter-minated prematurely. Pessimists retort that conventional monetary policymight be ineffective in these deflationary situations where the equilibriumreal rate of interest is most probably already highly negative, the bankingsystem crippled (insufficient capital to support an increase in lending), andindividuals have no inclination to spend the growing mountains of cashwhich replaced other less liquid or higher risk assets in their portfolios. Inthat situation a large currency devaluation might be successful in endingdeflation. If that were not feasible, or was unsuccessful, the ultimateweapon would be currency reform permitting interest rates to fall wellbelow zero. There is no guarantee of success for even that final step. Theend of deflation might have to wait for an autonomous rise in the equilib-rium (natural) rate of interest well into positive territory such as would beproduced by an improvement in the rate of return to investment, a fall inhouseholds’ propensity to save, or a decline in aversion to exchange risk(meaning an increased momentum of capital exports).
Japanese experience so far does not answer this final question. Byautumn 2001, bold expansion of the monetary base had not yet occurred.If it does occur – before some other event intervenes, such as a big fall inthe yen or a big improvement in the investment outlook – then we willhave a first-time test of the power of monetary policy on its own to enddeflation. If the test is performed under ideal conditions (meaning otherinfluences not coming to bear during the potentially long lag between themonetary impulse and its effect on the economy) then the result – positiveor negative – would be of considerable consequence for policy-making. Anegative result (meaning little effect from aggressive monetary base expan-sion) would mean that some combination of devaluation and negativeinterest rates – both requiring the suspension of the normal monetaryregime – has to be part of the contingency plan to counter deflation which

What To Do About the Yo–Yo Yen? 239
should be on the shelf of any competent central bank. A positive resultwould be reassuring, and incidentally reduce estimates of the potentialcosts of deflationary errors in monetary policy.
We must remember, however, that the history of paper monies (asagainst monies convertible into gold or silver) floating freely against eachother in global markets is short. One observation of a phenomenon is notthe basis for a firm prediction about the future. And so it is for the phe-nomenon of the yo–yo yen itself. After the violent fluctuations and grossmisalignments of the Lost Decade the yen may indeed settle into a periodof calm around a level appropriate to an economy with a huge privatesector savings surplus. In the meantime, the experience has been humblingto all involved – enthusiasts of floating exchange rates who believed thatprices (in the currency markets) would continuously reflect a sober andlong-term view of economic fundamentals, currency analysts who thoughtthat they could predict future trends, central bankers who preached thatindependence from politicians would usher in a new prosperous era ofprice stability and who viewed the hardness of their money as a virilitysymbol, hedge fund managers who thought they understood the dynamicsof currency markets, and senior economic officials who had faith inprogress of the policy-making process. Long ago King Solomon wrote thatafter pride comes the fall. Optimistic interpreters of the history of theyo–yo yen must believe that after the fall comes new wisdom – bothamongst policy-makers, those to whom they are responsible, and amongstthose who make decisions in the market-place.

240
Bibliography
Adams, T.F.M., A Financial History of Modern Japan, Research Books, Tokyo, 1964.Alexander, Arthur J., Japan’s Economy in the Twentieth Century, JEI Report, 21 January
2000, Japan Economic Institute, Washington. Alexander, Arthur J., What Happened to Japan’s Economy in the 1990s?, JEI Report,
14 July 2000, Japan Economic Institute, Washington. Allinson, Gary D., The Columbia Guide to Modern Japanese History, Columbia
University Press, New York, 1999.Bank for International Settlements, ‘Exploring Aggregate Asset Price Fluctuations
Across Countries’ (C.E.V. Borio and N. Kennedy and S.D. Prouse), Economic Papers,No. 40, 1994.
Bank of Finland Bulletin, ‘Asset Prices and Monetary Policy’, May 1998, vol. 72, no.5, pp. 3–7.
Bank of Japan, Recent Price Developments in Japan, Special Paper No. 198, March 1989.Bank of Japan, The Process of Decision-Making and Implementation of Monetary Policy in
Japan, Special Paper No. 198, March 1991.Bank of Japan, The Recent Rise in Japan’s Land Prices: Its Background and Implications,
Special Paper No. 193, Dec. 1990.Bank of Japan, Measurement Errors in Japanese Consumer Price Index (Shigenori
Shiraatsuka), IMES Discussion Paper Series, September 1999.Bank of Japan, Institute for Monetary and Economic Studies, ‘Further Monetary
Easing Policies under the Non-Negativity Constraints of Nominal Interest Rates’(Nobuyuki Oda and Kunio Okina), Research Papers, vol. 19, February 2001.
Bank of Japan, Institute for Monetary and Economic Studies, ‘The Zero Bound in anOpen Economy: A Foolproof Way of Escaping from a Liquidity Trap’ (LarsE.O. Svensson), Research Papers, vol. 19, February 2001.
Bayoumi, Tamim and Charles Collyns, Post-Bubble Blues: How Japan Responded toAsset Price Collapse, IMF Publications, 2000.
Bierman, Harold, The Great Myths of 1929 and the Lessons to be Learned, GreenwoodPress, New York, 1991.
Brown, Brendan, The Dollar–Mark Axis, Macmillan, London, 1978.Brown, Brendan, The Flight of International Capital, 1931–86, Routledge, London, 1987.Brown, Brendan, Monetary Chaos in Europe, 1914–31, Routledge, London, 1987. Brown, Brendan, Economists and Financial Markets, Routledge, London, 1997.Cline, William R., Predicting External Imbalances for the US and Japan, Institute for
International Economics, Washington, 1995.Connors, Lesley, The Emperor’s Advisor: Saionji Kinmochi and Pre-War Japanese Politics,
Croom Helm, London, 1987.Dillon, Gadis, J., ‘The Role of Accounting in the Stock Market Crash of 1929’,
University of Kentucky Research Monograph No. 96, 1984.Federal Reserve Bank of New York, ‘Intermediate Targets and Indicators for Monetary
Policy: A Critical Survey’ (Symposium), 1990.Flood, Robert P. and Robert J. Hodrick, ‘On Testing for Speculative Bubbles’, Journal
of Economic Perspectives, vol. 4, no. 2, Spring 1990, pp. 85–101.Friedman, Milton, The Optimum Quantity of Money, Macmillan, London, 1969.

Bibliography 241
Friedman, Milton and Anna Schwartz, A Monetary History of the United States,Princeton University Press, 1963.
Galati, Gabriele, ‘The Dollar–Mark Axis’, BIS Research Paper (unpublished), 2000.Galbraith, J.K., The Great Crash 1929, Penguin Books, London, 1975. Goodfriend, Marvin, ‘Overcoming the Zero Bound on Interest Rate Policy’, Federal
Reserve Bank of Richmond, Working Paper, December 1999.Gordon, Robert J. (ed.), ‘The American Business Cycle: Continuity and Change’,
National Bureau of Economic Research, 1986.Hatch, Walter and Kozo Yamamura, Asia in Japan’s Embrace, Cambridge University
Press, 1996.Hetzel, Robert J., ‘Arthur Burns and Inflation’, Federal Reserve Bank of Richmond
Economic Quarterly, vol. 84, no. 1, Winter 1998.Hetzel, Robert J., ‘Japanese Monetary Policy: A Quantity Theory Perspective’,
Federal Reserve Bank of Richmond Economic Quarterly, vol. 85, no. 1, Winter 1999,pp. 1–26.
Howe, Christopher, (ed.), China And Japan, Clarendon Paperbacks, Oxford, 1996.IMF Occasional Paper, Ageing Populations and Public Pension Schemes (K. Chand and
Albert Jaeger), No. 147, Dec. 1996. IMF Working Paper, ‘Real Estate Price Inflation, Monetary Policy, and Expectations
in the United States and Japan’, (Samiei Hossein and Gary Schinasi), WorkingPaper, 1994.
Inouye, Junnosuke, Problems of the Japanese Exchange 1914–26, Macmillan,London, 1931.
Jackson, Karl D. (ed.), Asian Contagion: The Consequences of A Financial Crisis,Westview Press, Colorado, 1999.
Katz, Richard, Japan – The System that Soured, M.E. Sharpe Publishers, New York, 1998.Kerbo, Harold R., Modern Japan, McGraw-Hill, 1998.Kielman, Nico and Harri Cruijsen (eds), National Population Forecasting in
Industrialized Countries, Swets and Zeitlinger, Amsterdam, 1998.Kindleberger, Charles P., Manias, Panics and Crashes, Macmillan, London, 1977. Kosai, Yutake, The Era of High-Speed Growth: Notes on the Postwar Japanese Economy,
University of Tokyo Press, Tokyo, 1983.Krugman, Paul, Exchange Rate Instability, MIT Press, Cambridge, 1989.Kwan, C.H., ‘Deepening Asia-Japan Economic Interdependence: The Impact of
the Yen’s Appreciation’, Discussion Paper prepared for the World Bank, April1997.
Lincoln, Edward J., Troubled Times: US–Japan Trade Relations in the 1990s, BrookingsInstitution Press, Washington, 1999.
Maddison, Angus, Monitoring the World Economy 1820–1992, OECD, DevelopmentCentre Studies Publication, 1995.
McCallum, Bennet T., ‘Recent Developments in the Analysis of Monetary PolicyRules’, Federal Reserve Bank of St. Louis Review, Nov/Dec 1999, pp. 2–10.
McKinnon, Ronald I. and Kenichi Ohno, Dollar And Yen: Resolving Economic ConflictBetween the United States and Japan, MIT Press, Cambridge, 1997.
McKinsey Global Institute, Why the Japanese Economy Is Not Growing: Microbarriers toProductivity Growth, Washington, July, 2000.
Mikitani, Ryoichi and Adam S. Posen (eds), Japan’s Financial Crisis and Its Parallelsto US Experience, Institute of International Economic Affairs, Washington, 2000.
Mikuni, Akio, Japan: The Road to Recovery, Group of Thirty Occasional Paper 55,Washington, 1998.

242 Bibliography
Monthly Labor Review, US Department of Labor, ‘International Comparisons of LaborProductivity and Per Capita Income’ (Bart van Ark and Robert H. McGuckin), July1999.
Morishima, Michio, Why Has Japan Succeeded?, Cambridge University Press, 1982.Nakamura, Takafusa, The Postwar Japanese Economy: Its Development And Structure,
University of Tokyo Press, Tokyo, 1981. OECD, Maintaining Prosperity in an Ageing Economic Society, OECD Publications, 1998.OECD, Pensions, Savings and Capital Flows (Helmut Reisen), OECD Publications, 2000.OECD Economics Department, ‘The Macro-Economic Implications of Ageing in a
Global Context’ (David Turner, Claude Giorno, Alain de Serres, Ann Vourch andPeter Richardson), Working Paper No. 193, March 1998.
OECD Economics Department, ‘The Tax System in Japan: A Need forComprehensive Reform’ (Thomas Dalsgoord and Masaaki Kawagoe), WorkingPaper No. 231, Feb. 2000.
OECD Economics Department, ‘New Issues in Public Debt Management:Government Surpluses In Several OECD Countries, the Common Currency inEurope, and Rapidly Rising Debt in Japan’ (Paul Mylonas, Sebastian Schich,Thorstinn Thorgeirsson and Gert Wehinger), Working Paper No. 239, April 2000.
Ohkura, Takehiko and Hiroshi Shimbo, ‘Tokugawa Monetary Policy in theEighteenth and Nineteenth Centuries’, in Smitka (1998) (see below), pp. 241–60.
Okina, Kunio, ‘Monetary Policy under Zero Inflation’, IMES Discussion Paper Series,July 1999, Institute for Monetary and Economic Studies, Bank of Japan.
Patrick, Hugh and Henry Rogovsky (eds), Asia’s New Giant, The BrookingsInstitution, Washington, 1976.
Pavird, Anna, The Tulip, Bloomsbury Publishing, London, 1999.Posen, Adam S., Restoring Japan’s Economic Growth, Institute for International
Economics, Washington, 1998.Reifschneider, David and John C. Williams, ‘Three Lessons for Monetary Policy in a
Low Inflation Era’, Federal Reserve Board Research Paper, September 1999.Schiller, Robert J., Irrational Exuberance, Broadway Books, New York, 2001. Schoppa, Leonard J., Bargaining with Japan: What American Pressure Can and Cannot
Do, Columbia University Press, 1997. Sheffrin, Steven M., Rational Expectations, Cambridge University Press, 1983.Siegel, Jeremy J., Stocks for the Long Run, Irwin Publishing, 1994.Smitka, Michael (ed.), The Japanese Economy in the Tokugawa Era, 1600–1868, Garland
Publishing, New York, 1998.Takayama, Noriyuki, The Morning After in Japan: Its Declining Population, Too Generous
Pensions, and a Weakened Economy, Maruzen Co. Ltd, Tokyo, 1998. Temin, Peter, Did Monetary Forces Cause the Great Depression?, W.W. Norton and Co.,
New York, 1976.Ueda, Kazuo, ‘Causes of Japanese Banking Instability in the 1990s’, Research Paper,
July 1999.United Nations, ‘Demographic Ageing and the Reform of the Pensions System in the
ECE Region’, Economic Survey of Europe, 1999, no. 3, pp. 45–115.United Nations, World Population Prospects: The 1998 Revisions, volumes 1 and 2,
United Nations Publications, 1999.Wells, Wyatt C. ‘Economist in an Uncertain World: Arthur Burns and the Federal
Reserve 1970–78’, Columbia University Press, New York, 1994.White, Eugene N., ‘The Stock Market Boom and Crash of 1929 Revisited’, Journal of
Economic Perspectives, vol. 4, no. 2, Spring 1990, pp. 67–83.

Bibliography 243
Wood, Christopher, The Bubble Economy, Atlantic Monthly Press, New York, 1992.Woodward, Bob, Maestro: Greenspan’s Fed and the American Boom, Simon and
Schuster, New York, 2000.Yamamura, Kozo (ed.), The Economic Emergence of Modern Japan, Cambridge
University Press, 1982.Yeager, Leland B., International Monetary Relations; Theory and History, Harper and
Row, New York, 1966.

Ageing population, effect onsavings rate, 64; see alsodemographic challenge inJapan, Switzerland
Ansei-Man’en, monetary reforms of1859/60, 5–10; fixing ofexchange rate 7; see alsohyperinflation
Asian bubble economies, 116; yenbubble as catalyst to, 116; seealso Asian currency crisis
Asian central banks, their repayingof yen loans and adding to yenreserves during yen bubble,1995, 183–5
Asian currency crisis, role ofbursting of yen bubble in, 116;summer and autumn 1997,202–4; see also under yen
Axis movement, examples of, 105;see also currency triangles
Bank of Japan: founded 1882, 14;stems appreciation of yenduring World War I, 18;response to bursting of bubblein 1920, 21; conduct ofmonetary policy in 1960s,36–8; fatal (for Bretton WoodsSystem) tightening ofmonetary policy in September1969, 36; gross errors inmonetary policy following yenrevaluation, 1971–2, 41–3;tightens monetary policy inautumn 1973, 45; adopts aquasi-monetarist policy in late1970s, 53; re-lending offoreign exchange reserves toJapanese banks in 1978, 54;bizarre tightening of policyfollowing Plaza Accord 60;view of inflation risks in early1989, 123; its study of real
estate market, 1990, 121;misguided views on yen in1990s, 75, 118–19; itsinflaming of exchange riskperceptions in 1990s, 74; cutsdiscount rate to 1.75% inSummer 1993, 163; its role inundermining Hashimoto fiscalconsolidation and sparkingyen rise, Spring 1997, 196–8;bribery scandal, 1998, 204;new Bank of Japan Law comesinto effect, March 1998, 204;refuses to undertakeunsterilised intervention inforeign exchange markets,1999, 213; some sacrifice ofindependence a necessarycomponent of economicpolicy reform in Japan? 229;see also Bank of JapanGovernors, monetary policy,zero rate policy
Bank of Japan Governors, seeHayami, Inouye, Matsushita,Mieno, Sasaki, Sumita
Banking crisis in Japan, in 1920safter bursting of wartimebubble economy, 21; crisis ofSpring 1927, 25; parallelsbetween currency implicationsof in 1920s and 1990s, 25; UScredit agencies begin todowngrade Japanese banks,early 1990, 135; Greenspanconcerned about Japanesebanks, 1992, 155; GovernorMatsushita’s task of sortingout the banks, 1994, 178; asfactor in the bursting of yenbubble, summer 1995, 189;why negative for the yen,1995, 189; weak capitalposition of Japanese banks
244
Index

used as argument by Rubinand US mercantilists forhalting yen depreciation inSpring 1997, 194; bank failuresin Autumn 1997, 202; Obuchigovernment providesemergency help to banks,Autumn 1998, 206; hasWashington’s Japanese policybeen over-focused on bankingsituation? 236; see also Jusencrisis
Bentsen, Lloyd initiatesprotectionist legislation, 1984,59; appointed Treasurysecretary 1993, 157; expresseswish for a stronger yen in early1993, 157; a mercantilist, 157;resignation, 175
Bergsten, Fred as academic high-priest of neo-mercantilists inWashington, 188; calls foreasier Japanese fiscal policy,Spring 1997, 195–6
Big surplus strong currency myth,71–6; see also Mieno
Blinder doctrine, 123; see alsobubble markets
Bretton Woods system alreadydisintegrating in Spring 1971,38; could Japan have salvageda fixed yen–dollar rate inAugust 1971?, 40; re-interpretation of its demise,39–41; role of Bank of Japan inits demise, 37
British pound as frequent dollarsatellite, 108; see also currencygeography
Bubble economy in Japan, post-bubble depression of 1882–5,14; wartime bubble economybreaks in 1920, 21;comparison of currency policyfollowing First World Warbubble economy and 1987–90bubble economy, Tanakabubble 1972–4, 44; end ofTanaka bubble, 64, 71; earlystages of Great Bubble
1987–90, 61; was the PlazaAccord a catalyst to the1987–90 bubble economy?, 61;behaviour of savings rateduring, 65; how exchangerates normally adjust to end ofbubble, 71–4, 135; why didyen not follow normaldownward path followingbursting of 1987–90 bubble?,135–6; rapid growth ofproductivity during, 122–3; seealso Asian bubble economies,bubble markets, Japanese realestate market bubble, MiltonFriedman
Bubble markets, do they really everexists?, 119–22; currencyimplications of their bursting,135; do they burst of theirown accord?, 122; shouldmonetary policy take theminto account?, 122; see alsoAsian bubble economies,Japanese real estate marketbubble, NASDAQ bubble,Tokyo equity market bubble,yen bubble, US dollar bubble
Bundesbank, tough anti-inflationpolicy in 1973, 45; PresidentTietmeyer reveals that Bank ofJapan considers tighter policyin Spring 1997, 198
Burns, Arthur overturns USmonetary policy in 1970,36–7; role in Nixon’s re-election campaign, 43;opposition to closing goldwindow in 1971 41; view ofdollar devaluation in 1973, 44;attack on inflation in 1974, 46;prediction of recovery, 1975,49; eases policy ahead of 1976elections and thereby breaksunofficial yen-dollar peg, 49;concern at weak dollar in1977, 51; fails in re-appointment bid, 1978, 51
Bush Administration (1988–92),presses Japan to raise public
Index 245

Bush Administration cont.spending, 132; trade conflictwith Japan, 131; see alsoMercantilism in Washington
Business cycles in post-war Japan Jimmu boom, 1956–7, 33; Iwato boom 1959–61, 33; cyclicalpeak of 1952, 65; recession of1961–2, 34; recession of 1965,35; boom of 1966–70, 35, 65;recession of 1970–1, 43;recovery from recession of1974–5, 47; recession of1992–3, 151; recovery in 1994,170; encouraging evidence ofrecovery, 1996, 190; recessionof 1997–8, 202; see also bubbleeconomy in Japan, Japaneseeconomy
Camp David meeting on dollar,August 1971, 39; see alsoBretton Woods System, Tanakabubble, US dollar devaluation
Cantor, Mickey, 167; sees no riskof trade war causing Japaneseinvestor to pull out of US, 167
Capital export policy in Japan,during First World War, 16;Ministry of Finance pursues inearly 1980s, 57; EisukeSakakibara seeks to stimulatecapital exports towardsbursting yen bubble, Summer1995, 187; recommended as apermanent part of a new policyframework for Japan, 223
Carry trade in yen, 201; briefturnaround in, Spring 1997 asone trigger to Asian crisis, 201;rapid growth of, 1996–8,202–3; Bank for InternationalSettlements gives guesstimateof total size in 1998, 203;implodes following Russia’sdebt default, Summer 1998,206; see also hedge funds
Carter Administration, concern atrapidly rising Japanese exports,51–2; presses Japan to ease
fiscal but not monetary policy,53–4; dollar defense package,November 1978, 55
Cassel, Gustav, estimates yen-overvaluation, 1922, 20
China, attitude of towards yendevaluation, 205
Chinese currency, appreciationduring World War One, 18;sharp decline of in early 1920s,22; use of as speculationvehicle in yen, 1926, 25
Clinton Administration, preparespolicy towards Japan, early1993, 156; mercantilistcabinet, 157; from Day Onepresses Japan to adopt easierfiscal policy, 159; backs awayfrom policy of talking up theyen, Summer 1993, 162; wastalking up the yen an emptypolicy? 167; presses forstronger yen, Spring 1997,201; was the threat of newtrade talks with Japan inSpring 1977 bluff?, 201; seealso Framework Talks,Mercantilism in Washington
Clinton, Bill, welcomesappreciation of the yen inSpring 1993, 157; in July 1994blames dollar’s decline onJapan’s trade surplus, 168;refuses to make commentduring yen bubble, March1995, 183; his visit to Beijingin Summer 1998 as catalyst tobrief yen recovery, 205;welcomes the 20% jump of theyen in one day, October 1998,207; see also ClintonAdministration
Clinton–Hosokawa summit, Spring1994, 166; discusses NorthKorea nuclear threat, 167; itsfailure as source of brief yensurge, 167, 170; see also Nyeinitiative, Framework Talks
Clinton–Miyazawa Summit, April1993, 157
246 Index

Consumption tax in Japan,introduced 1989, 123; its effecton inflation 1989, 123;increase in 1997, 192–4
Counterfactual historical analysis,could the Shogunate haveavoided devaluation andhyperinflation despite USpressure?, 8–9; what if Japanhad allowed the yen to floatfreely in World War One?, 19;suppose the yen had beenallowed to float down freely orbeen devalued after the 1920Crash?, 21; What if the yenhad been on the gold standardat time of Tokyo earthquake?,24; Would the yen have risenas much if no mercantilist‘buzz’ from Washington?, 63;would Japan’s savings surplushave been even larger underfixed exchange rate?, 67; whatif Arthur Burns hadmaintained tight moneythroughout 1970? and couldJapan have saved the fixedyen–dollar rate in 1971?, 35,40–1; how Japanese economywould have performed undergold standard in 1990s, 71–2;would Japanese real estatemarket bubble of 1987–90have burst without Bank ofJapan action?, 124–5; What ifGovernor Mieno had cut thediscount rate to 1.75% alreadyin Autumn 1991? 162; What ifJapan had said no to USpressure for a stronger yen inSpring 1997?, 201; Wouldthere have been a Lost Decadein Japan if two out of threeBank of Japan Governorsduring that period were nothard yen enthusiasts?, 215;How would Japanese economyhave performed in 1990sunder a proposed ‘neweconomic constitution’?, 229
Crash, see equity market crashCurrency bubbles, reflections on,
184; dollar bubble of 1985,184; Swiss franc bubble of1978, 220; see also yen bubble,Swiss franc
Currency geography, 76–107;currencies in the limelight,105; different types ofcurrency motion defined,77–79; fitting in the Britishpound, 107–8; frequency ofdifferent types of currencymotion, 103; how todistinguish different types ofcurrency motion, 80–107;polar power defined, 77;satellites defined, 77; six mainindependently floatingcurrencies, 107; triangularnature, 77; why yen shouldnot be described as rotatingaround dollar–euro axis, 107;see also dollar zone, dollar–yenaxis, dollar–euro axis, eurozone, solo yen movement, soloeuro movement, solo US dollarmovement, yen–euro axis
Currency markets, sensitivity toconfused economic doctrineexposed by central bankers,170; their slowness torecognise shift in savingssurplus and its implication forexchange rates, 135, 144; seealso Finland’s real estatemarket bubble of late 1980s,Japanese real estate marketbubble, market bubble of late1990s, Swiss real estate, UKreal estate market bubble oflate 1980s, yen
Currency poles, see currencygeography
Currency satellite, defined, 77;British pound as frequentsatellite of US dollar, 108;Swiss franc as frequent satelliteof Euro, 11; see also currencygeography
Index 247

Currency triangles, axis movementwithin defined, 77; solomovement within defined, 77;examples of different types ofcurrency motion within,104–7; why is the USdollar–euro–yen triangledominant?, 107–115; pseudotriangles, 108–9; see alsocurrency geography
Deflation in Japan, in 1882–5, 13;in the 1920s, 22–4; emergenceof in 1990s, 116; responsibilityfor 1990s deflation, 162; seealso Deflation trap
Deflation trap, increasing risk of in1997, 202; theoreticalconsiderations, 74, 116
Demographic challenge in Japan,231–5; see also ageingpopulations
Deutsche mark, floats in Spring1971, 38–9, more independentthan the yen of the dollar inthe early 1970s, 38
Dodge, Joseph, 27Doge Line; see Dodge PlanDodge Plan, 5; balanced budget
doctrine, 28; Fixing of yenparity in 1949, 5, 28–9;economic constitution beginsto weaken in mid-60s, 35
Dollar–euro axis dominance,defined, 79; illustrativeidentification, 102; see alsocurrency geography
Dollar–mark axis, its dominance ofcurrency markets in much of1994, 170
Dollar–yen axis dominance,defined 78; illustrativeidentification, 80; see alsocurrency geography
Earthquake risk in Japan, 57, 179;its influence on market prices,180; see also Kobe earthquake,Tokyo earthquake
Economic miracle in Japan, 30, 33;the early 1930s a forerunnerof, land speculation during,120–1; end of the miracle, 48;premature diagnose of end inmid-1960s, 64; was the miraclealready over in 1970?, 52;failure of IMF to recognise itsend, 52; Tanaka bubble andbust delays recognisation ofend, 64; see also Japaneseeconomy
Equity market crash in Tokyo,1920, 21; in Tokyo 1990, 116,134–5; in New York, 1929, 26,118, 123; in New York, 1987,61, 122, 130; see also Tokyoequity market bubble
Europessimism, 56Euro zone, defined, 109Exchange Investigation
Committee, 1918, 18Exchange restrictions in Japan,
introduced 1932, 27; shouldrestrictions have been lifted inlate 1960s? 35–6, 40; ashandicap in mid 1970s, 49;gradual dismantling of in late1970s, 54; lifting of mostremaining, 1980, 57; furtherderegulation, 1995, 187; seealso capital exports
Exchange risk aversion, its role inyen’s behavior, 73; aggravatedby folklore of Nixon and Plazashocks, 156; diminishes duringTokyo equity market bubble1988–90, 133; as factor in yenbubble, 1995, 188; increasedsubstantially by yen spike ofSpring 1997, 202; inflamedgenerally by Bank of Japan, 74,119; fuelled by 20% jump ofyen in one day, October 1998,207–8; see also Plaza Accord
Feudal banknotes, replacement of13
Finland’s real estate bubble of late1980s, currency implications
248 Index

compared with Japanese case,135
First World War, Japan’s boomduring 15–16, 21; Japanesecurrency policy during, 15–19;see also Neutral currencies
Fiscal policy in Japan, should ithave been tightened in late1960s? 35; the Tanaka-ledfiscal expansion, 1972–3, 42–3;tightened in mid-1970s, 46;eased under US/IMF pressurein late 1970s, 52, 54; boldconsolidation in early 1980s,57; why Washingtoncontinuously pressed foreasing of, 70–1, 75–7 its role indriving yen higher in 1990s,76; Bush Administrationpresses fiscal easing on Japan,1989–90, 132; IMF’s view of in1990, 132; intense politicalpressure in Japan for easing of,1992, 154; fiscal stimulusoffered as present to newClinton Administration, April1993, 158; from Day OneClinton Administration pressfor easing of, 159; tightenedby Hashimoto government in1996–7, 192–3; biggest fiscalexpansion ever, introduced byObuchi Government inAutumn 1998, 208; see alsoDodge Plan, Hashimoto fiscalconsolidation 1996–7,International Monetary Fund,Strategic Initiativenegotiations with Japan
Fixing of yen parity in 1948; seeyen, Dodge Plan
Fixing the yen–dollar rate, anoption now to turn the clockback? 217–20
Floating yen, first era of, 1912–32,19–27; a new framework for?220–3; see also free float
Foreign Ministry of Japan, favorscloser Asian involvement, 71
Framework Talks, initiated Spring1993, 157; toughness of USstance limited by broaderconsiderations, 167;breakdown in March 1994,166; resumed in May 1994,170; substantial agreement onall issues except autos,September 1994, 170;Washington initiates Section301 proceedings against Japan,October 1994, 175; May 1995deadline for Section 301sanctions approaches, 180,186; was the deadline aninfluence on the yen? 186;final agreement reached, June1995, 186; see alsoClinton–Hosokawa summit,Clinton–Miyazama summit,Mercantilism in Washington
France, as co-defender with Japanin Autumn 1971 ofinternational monetary statusquo 41–2
Free float, as option for yen duringFirst World War, 19; a newframework for?, 220; see alsofloating yen
Friedman, Milton, his quoting ofJ.S. Mill, 117; his explanationof Lost Decade 117; his view ofUS monetary policy in USbubble economy of late 1920s
Fukui, Toshihiko, his role insparking yen surge andsabotaging Hashimoto fiscalconsolidation, Spring 1997,198
G-7 currency statements, followingPlaza Accord, 1985, 61; fan riskaversion of Japanese investorsin 1992, 155; push for higheryen, 1992, 154; undermineHashimoto fiscal consolidationby calling for stronger yen inSpring 1997, 195
G-7 intervention, to push up theyen in Summer and Autumn
Index 249
G-7 currency statements cont.1989, 131; pushes yen inperverse direction as bubbleeconomy bursts 1991–2, 150,153; during yen bubble, Spring1995, 183; towards burstingthe bubble, Summer 1995,186; to bolster the yen in June1998, 205; see also G-7 currencystatements, sterilisedintervention in currencymarkets
Genoa Conference, 1922, 20Gephardt Amendment, 1985, 59German recession, in 1993, 159; its
influence on the yen in early1993, 159; recovery from asource of dollar weakness in1994, 170
German unification boom, 147; itsinfluence on the yen, 130, 147
Gold standard, Japan’s first attemptto adopt, 1871, adoption of,1897, Japan’s first break with in1917, 15; early return torejected in 1919, 19; and Genoaconference 1922, 20; return toconsidered in 1923 and 1926,23, 25; return to, January 1930,26; abandonment of, December1931, 26; how Japaneseeconomy would haveperformed under in 1990s,71–2
Golden period, for exportingJapan’s savings surplus, 58, 62;see also Reagan Administration
Golf club memberships, prices ofas real estate market indicatorin Japan, 134
Greenspan, Alan, his tightening ofmonetary policy, Spring 1988to Spring 1989, 130; easemonetary policy from Spring1989, 131; his concern aboutJapanese banks in 1992, 155;eases policy in Summer 1992despite economic recovery,151; tightening of policy in1994, 167; hints that
tightening now over, February1995, 182; follows benignneglect towards dollar in early1995, 182; makes comment onweak dollar, March 1995, 183;becomes cheer leader forbubble economy in US duringlate 1990s, 123
Gulf War, 147
Hashimoto fiscal consolidation1996–7, 192–4; its role inbringing down yen fixed-ratesand the yen in 1996 and early1997, 192–3; comparison withfiscal consolidations elsewherein the OECD area and theirinfluence on markets 192–3;essential conditions for success193–4; sabotaged bycombination of USmercantilist pressures,domestic political opposition,lack of understanding amongstkey Japanese policy-makersconcerning needed monetaryand currency policyaccompaniments, and failureof Japanese economicdiplomacy 193–7
Hashimoto, Ryutaro, opposition toMieno’s rate hike, December1989, 128; becomes PrimeMinister, January 1996, 192;his tightening of fiscal policy1996–7, 192–3; resigns asprime minister in July 1998,205; see also Hashimoto fiscalconsolidation, 1996–7
Hayami, Masaru, claims that yen isundervalued in early 1991,148; warns against easingmonetary policy in 1992, 154;sees yen’s appreciation in 1992as liveable with, 155l; his April1993 article in Nikkei Weeklyon why a super-strong yen isbenign for Japanese economy,160–2; his support for hardcurrency and central bank
250 Index

independent at all costs, 164,213; appointed as Governor ofBank of Japan, March 1998,204; negative marketcomments on hisappointment, 204; attacksultra-low interest rates at firstopportunity, 204; refuses toease monetary policyfollowing yen shock ofOctober 1998, 207; conspiracytheorists speculate aboutHayami–Sakakibara plot topush up JGB yields in late1998, 208; favours greaterreserve role for yen, 204, 208;refuses to undertakeunsterilised interventiontowards fighting yenappreciation in 1999, 213;final verdict on responsibilityfor Lost Decade, 215
Hayata, Ikeda, 30; as long-timeprime minister duringeconomic miracle, 30
Hedge funds, as big buyers ofEuropean equities and bondsin 1994, 170; role in yen carry-trade, 201; pull out of carrytrade in Autumn 1998, 206
Hollowing out, of Japaneseindustry by strong yen, 71,116, 162, 164–6, 169, 184,186, 217; favourable attitudetowards of Foreign Ministryand MITI, 71
Hong Kong trade dollar, 10Hyperinflation, in 1860s following
monetary reform, 6; inaftermath of World War Two,27
Inflation in Japan, in early yearsfollowing Meiji restoration,13; in the early and mid-1890s,15; during the First World War,16; during World War Two, 27;in the 1960s, 37–8; shouldJapan have tolerated higherinflation in late 1960s?, 35;
during and after the Tanakabubble 1972–4, 44; falls belowUS inflation from 1978onwards, 52–3; disappears inlate mid-1980s, 123; re-appearsat end of 1980s, 123; see alsoCommission on inflation, 1893
Inouye, Junnosoke, as Governor ofBank of Japan and FinanceMinister during First WorldWar and afterwards, 15; hisrole in return to Gold Standard1930, 26; assassinated 27
International Monetary Fund(IMF), Japan becomes Article 8member 1963, 30; calls forJapan and Germany to easefiscal policy, Spring 1978, 52;failure to recognise end ofJapanese economic miracle,53; recognises benefits forworld economy of Japan’scurrent account surplus in1990, 132; fails to warn of yendisequilibrium in 1992, 155; areview of its failures as Japandescended into deflation, 237;as occasional mouthpiece ofUS Treasury, 237
Iranian revolution, 1978, itsimplications for the yen, 55
Irrational exuberance, in Japan inlate 1980s, 120–6
Japanese economy, stage ofdevelopment in 1914, 19;growth of, 1860–1940, 20;rapid expansion 1931–6, 26;smaller than Brazil in 1953,33; overtakes Germany in1966, 33; miracle years andbusiness cycles 1953–63, 33;consumer durables industriesboom in late 1960s, 35; asAsia’s new giant, 33; dualityin, 29; end of the miracle, 48;see also business cycles in post-war Japan, Lost Decade,Operation Scale Down
Index 251

Japanese export booms, duringFirst World War, 15–16; in late1960s, 35; in late mid-1970s,47; in early 1980s, 56
Japanese foreign exchange marketintervention, during WorldWar One and aftermath 18–25;in Spring and Summer 1971,40; to prevent slide of yen inSummer 1973, 46; in late1970s, 55; in 1999, 213
Japanese government bond (JGB)market, its failure to recogniserise in the savings surplus andits meaning after the bubbleeconomy burst, 145; yieldsspike in Spring 1993 onpressure from Washington toease Japanese fiscal policy,159; at extraordinarily highreal level in late 1994, 176;sharp fall of yields in 1995,187; continuing fall of yieldsduring 1996 as factor inweakening yen, 190; yields risein Spring 1997 on Bank ofJapan inspired rumors ofimminent monetarytightening, 196–8; misreadsthe economy in 1997, 198;yields plunge to new low inAutumn 1998, 205
Japanese real estate market bubble,1987–90, 116; comparisonwith earlier real estate bubblesin Japan, 121; comparisonwith real estate bubbleselsewhere, 121–2, 135–6;emergence of, 121–2; a mini-break 1988, 121; how would ithave burst without Bank ofJapan action, 122; was thepeak in early 1990? 134–5; realestate and constructioncompanies in forefront ofequity market crash, 1990,134; why did its bursting notbring a currency devaluationas elsewhere?, 135–6, 140; seealso golf club memberships
Kanemaru, Shin his attack onmonetary policies of Mieno,145, 153
Kobe earthquake, January 1995,178; its influence on the yen,178–9
Korean War, 29
Liberal Democratic Party,leadership election, 1972, 42;anti-reformers and big-spenders in, 71; brief fall frompower in early mid-1990s, 165;does badly in July 1998 UpperHouse elections, 205; see alsoShin Kanemaru, Kakuei Tanaka
Lindsey, Lawrence, clumsy remarkis catalyst to yen surge, March1995, 180, 182–3
Liquidity crisis, global, 1998, 117;see also Russian debt default
Lost Decade, of Japanese economy116; telling the story of116–17; monetary diagnosisof, 117; compared to GreatContraction in US, 118;contemporary comparisons,119; sheds new light onKeynesian policies, 237
Louvre Accord of 1987, 30, 61,129
Matsukata, Masayoshi, appointedFinance Minister 13; as PrimeMinister, 15; see also Deflation,Gold Standard, monetaryorthodoxy in Japan
Matsushita, Yasuo, appointed asGovernor of Bank of Japan,December 1994, 176; distancehimself from Mieno at firstopportunity, 177; job ofsorting out the bankingsystem, 178; not directlyresponsible for underminingHashimoto fiscalconsolidation, 195; forced toresign, March 1998, 204
Meiji restoration, 10; livingstandards in the first 40 yearsfollowing, 20
252 Index

Mercantilism in Washington, in1970–71, 39–41; under CarterAdministration, 1976–8, 52–3;growth of during 1st ReaganAdministration, 58–9; influenceon Japanese fiscal policy, 70,159; influence on yen, 63, 75,156, 166–7; BushAdministration brands Japan asunfair trader, March 1989, 131;toughness of trade negotiationslimited by wider considerationsin US–Japan relations?, 167;how Washington mercantilistsundermined Hashimoto fiscalconsolidation in 1997, 194–5; afinal review, 236; see alsoBentsen, Bergsten, BushAdministration, CarterAdministration, ClintonAdministration, Clinton–Miyazawa summit, FrameworkTalks, Gephardt Amendment,Hashimoto fiscal consolidation,Summers, MOSS talks, StrategicInitiative negotiations withJapan, Unholy alliance betweenLDP big spenders andWashington mercantilists,Yen–dollar talks, Washington
Mexican silver dollars, 7, 10Mexico crisis, 1995, 177; its impact
on currency markets, 178Mieno, Yasushi, becomes Governor
of Bank of Japan, 1989, 126;career at the Bank of Japan,126; disdain of monetary rules,127; an enthusiast of a strongyen, 127; his socio-politicalmission, 127; as Bank of Japanman, 126; enjoys shoppingtrips, 126; contrasted withArthur Burns, 127; makes falsediagnosis of yen weakness in1989, 129–34; his abrupttightening of policy inDecember 1989, 128–9; hisdislike of speculation, 133; hismission to burst the bubbleeconomy, 144; failure to
recognise rise in savingssurplus as bubble economyburst and its exchange rateimplications, 145; his influenceon currency market opinion,145; uses erroneous model ofexchange rate determination,150, 155–6; in second half of1991 underestimates theseriousness of post-bubbleeconomic downturn, 149;favors a stronger yen even aseconomy enters post-bubblerecession, 150–4; his policiesattacked by LDP boss ShinKanemaru in early 1992, 153;over-optimistic on economy inearly 1992, 153; still concernedabout inflation in 1992, 153–4;delays easing monetary policyso as to force easing of fiscalpolicy in early 1993, 158;preliminary judgement onresponsibility for Japanesedeflation, 162; his defiant exit– still blames strong yen oncurrent account surplus,168–75; faces strong criticismfrom business leaders, 1994,169; succeeded by YasuoMatsushita, 176; approves ofrise in long-term interest ratesin 1994, 176; final view on hisresponsibility for Lost Decade,215
Mill, J.S., quote from by MiltonFriedman, 117
Miller, William, appointed asFederal Reserve Chairman1978, 51
Ministry of Trade and Industry(MITI), favours closer Asianinvolvement, 71
Miyazawa, Kiichi testimony to Dietin July 1987 concerningcontents of Plaza Accord, 59;Obuchi appoints as FinanceMinister, Summer 1998, 205
Monetary orthodoxy in Japan, itsintermittent appearance, 15
Index 253

Monetary policy, what accountshould it take of bubblemarkets?, 123; The risk ofmoney rates falling too slowlyonce bubble economy bursts,144–5; see also Bank of Japan,Bank of Japan Governors,Blinder doctrine, bubblemarkets, money marketexpectations, Taylor rule
Money market expectations inJapan, of monetary tighteningin early 1995, 177
MOSS Talks 1985, 59
NASDAQ bubble, 120Negative interest rate regime, how
this could be implemented aspart of an anti-deflationstrategy in Japan, 223–7
Neutral currencies, their behaviorduring First World War, 17
Nixon re-election campaign 1972,43; influence on dollar, 39–41;coincides with Tanaka electioncampaign, 43; see also Burns
Nixon shock of August 1971,38–40; a recurrent factor inJapanese risk aversion toforeign currency assets in thesubsequent three decades, 51,75, 156; low risk of a repeat inearly 1980s, 56; see alsoBretton Woods, US dollardevaluations
Nye initiative, autumn 1994, 167;a factor limiting toughness ofClinton Administration intrade negotiations with Japan?167
Obuchi, Keizo, becomes primeminister, summer 1998, 205;his plans for massive fiscalreflation a catalyst to yenappreciation, 205, 208
OECD, Japan becomes member of,1964, 30
Oil shock, in 1973, 44, 46; in1978–9, 55
Operation Scale Down, 48Osaka, use of silver coin in before
Meiji currency reforms, 6,10;business leaders in lambastMieno, 169
Plan for re-building theArchipelago, 42; abandoned,146
Plaza Accord, 5, 129; takesunjustified blame for Japaneselosses on foreign investments,59; run-up to, 58–9; an emptyagreement?, 60; changes inJapanese monetary policyimmediately following, 60;contents of agreementrevealed in Diet in 1987, 59;speculation on a mini-Plaza,December 1991 and early1992, 150, 152; fans riskaversion of Japanese investorstowards foreign currency assetseven many years later, 156;rumors of reverse Plaza,summer 1995, 187; see alsoMiyazawa
Post-bubble depression, see BubbleEconomy
Purchasing power parity,calculation of in 1922, 20; in1948, 28
Reagan Administration, goldenperiod in early years forrecycling Japan’s savingssurplus, 58; rising protectionistpressure in Congress during,58–9; see also MOSS talks,Plaza Accord, Yen-dollar talks
Reaganomics, 56; fading optimismin as cause of dollar’s fall, 62;see also US business cycles
Real estate market, landspeculation during Tanakabubble 1972–4, 44; see alsoJapanese real estate marketbubble, 1987–90
Rubin, Robert, appointed as USTreasury Secretary, December
254 Index

1994, 175; Japanese press reactnegatively to appointment asTreasury Secretary, 176;announces strong dollar in USinterest, March 1995, 183;statements during the yenbubble, 186; presses forstronger yen in Spring 1997,194–5; sides with mercantilistsin 1997, 194; declines tocomment on 20% jump in oneday of the yen, October 1998,207
Russia debt default, 1998 reactionof currency markets to, 205–6;see also liquidity crisis, 1998
Sakakibara, Eisuke, appointed as‘Mr. Yen’, May 1995, 187; rolein bursting yen bubble 1995,187; joins with Rubin inpushing yen higher, Spring1997, 195–6; forecastsmonetary tightening in 1997,198
Sasaki, Tadashi, as Bank of JapanGovernor during Tanakabubble, 126
Savings-investment balance, itsrelationship to the balance ofpayments, 48, 63, 135; takestime for markets and policy-makers to recognise shifts in,144, 150; how influenced bydemographics, 231–2; see alsobig surplus strong currencymyth
Savings rate in Japan, its behaviorduring 1970s, 65; why stayshigh after recession of mid-1970s, 66–7; see also savingssurplus in Japan
Savings surplus in Japan, lack of inlate 1960s, 35; emerges in mid1970s 48, 64–5; why savingssurplus in late 1970s could notflow easily into foreign assets,55; golden period of recyclinginto capital exports (in early1980s), 59; why stays large, 66;
path of private sector surplusthrough 1980s and 1990s, 67;historical and contemporarycomparisons with othercountries having large savingssurplus, 68; implications ofsurplus for the yen, 71–5; fallof the savings surplus duringthe bubble economy years1987–90, 132; rise in surplusafter bubble economy bursts,135; failure of the Bank ofJapan and of the markets(currency and bonds) torecognise the jump in savingssurplus following the end ofbubble economy, 145; areduction in the surplusfollowing earthquake, 180;mechanisms for recyclingsurplus to rest of the worldbecome seriously impaired inlate 1990s, 213; view thatJapanese saving surplus shouldbe exported gets belatedrecognition at OECD andinfiltrates Washington,2000–1, 214; see also bigsurplus strong currency myth,earthquake risk, Japanesegovernment bond (JGB)market, savings rate in Japan,Switzerland, trade surplusproblem, Yasushi Mieno
Scandinavian real estate marketbubble, comparison withJapan’s, 121; currencydevaluation follows itsbursting, 135; see also realestate market bubble in Japan
Silk exports, in 1850s, 6; how priceaffected by 1859–60 monetaryreforms, 8; influence on yenduring 1920s, 20; slump ofduring Great Depression in US,26
Silver standard, Japan’s longmarch from silver to gold,10–15; Yen exchange rateunder, 12
Index 255

Singapore dollar, fitting intocurrency geography, 113
Smithsonian Agreement, 41Solo euro movement, defined, 79;
illustrative identification, 102;see also currency geography
Solo movement; see currencytriangles
Solo US dollar movement, defined79; illustrative identification,102; see also currencygeography
Solo yen movement, defined 78;illustrative identification, 80;first example of, 1979, 50; seealso currency geography
South Korean won, fitting intocurrency geography, 113
Sterilised intervention in currencymarkets, ineffectiveness of,183, 213; Bank of Japan refusesto unsterilise, 1999, 113
Strategic Initiative negotiationswith Japan 1989–90, 131–2; seealso Bush Administration
Sumita Satoshi, ignores bubblemarkets in conduct ofmonetary policy, 123; tightensmonetary policy in 1989, 124;retires 126; an urbanefrancophile 126; comparison ofhis policy during bubble withthat of Alan Greenspan, 123
Summers, Lawrence, as USTreasury Under-Secretaryexpresses concern aboutlikelihood of rise in Japanesecurrent account surplus,Spring 1997, 194; as TreasurySecretary presses for Bank ofJapan monetary easing inAutumn 1999, 213
Swiss franc, fitting into currencygeography, 111; bubble of,1978, and its relation to yen,51; fails to decline as realestate bubble bursts in early1990s, 135; how the Swissgovernment burst the bubbleof the franc in 1978, 220
Swiss National Bank (SNB), guiltyof monetary overkill in early1990s, 137
Swiss real estate market bubble oflate 1980s, currencyimplications compared withJapanese case, 135, 137, 140
Switzerland, as safe haven duringWorld War One, 17; its hugesavings surplus andcomparisons with Japan, 64,68, 135; fiscal reflationfollowing burst of real estatebubble, 137; see also Swiss realestate bubble in late 1980s
Taiwan dollar, fitting into currencygeography, 113
Tanaka bubble, see bubbleeconomy in Japan, real estatemarket
Tanaka, Kakuei, extravagantreelection campaign 1972,42–3
Taylor rule, why unhelpful injudging Japanese monetarypolicy, 125
Tokugawa regime, its fall, 5;Monetary system under, 5–6,13
Tokyo earthquake 1923, 23;behaviour of yen after, 24–5
Tokyo equities, surge in foreignbuying of during first half of1994, 170; react to Kobeearthquake, 180; see alsoTokyo equity market bubble,equity market crash
Tokyo equity market bubble1987–90, 116; optimisticrationalisations of, 122; brieffall of the yen as bubble bursts,134; yen falls during last stageof bubble, 130–2; real estateand construction companiesfall hardest in subsequentcrash, 134; see also Zai-tech
Trade surplus problem (Japanese),origins of, 63–71; mistakenanalyses of implications for
256 Index

yen, 71–6; during First WorldWar, 16; emerges in late 1960s,35; lack of savings surplus tomatch trade surplus in late1960s, 35; in 1972, 41; during1976–8 52–4; re-appears inearly 1980s, 56, 169; re-emerges after bubble economybursts, 149; potential problemin Spring 1997?, 194–8; seealso big surplus strongcurrency myth, Mieno
Trade war, in 1930s, 27; Clintonwarns of, 166; fears ofinfluence yen in 1994–5, 165
UK real estate bubble of late 1980s,currency implicationscompared with Japanese case,135
UK real estate market bubble, inlate 1980s compared to Japan,121; see also real estate marketbubble in Japan
Unholy alliance between LDP bigspenders and Washingtonmercantilists, analysis of, 3,70–1, 76; first example of,1977–8, 53; its emergence in1990s, 155; see also fiscalpolicy in Japan
US business cycles, recession of1969–70, 36–7; recession of1974–5, 47; recovery in 1975,49; recession of 1980, 56;recession of 1981–2, 56;Reaganomics boom gets underway, 56; end of Reaganomicsboom, 59; recession of 1990–1,146
US dollar devaluations, in 1971–3,38–45
US dollar bubble, 1983–5, 105US real estate mini-bubble and
burst, 1989–92, 146;implications of for dollar, 146
US Savings and Loans crisis, 146
Volcker, Paul, votes withmercantilists at Camp David,
August 1971, 39; his anti-inflation policy copied fromthe Bundesbank, 45; unleashesmonetary shock, 1979, 56;effects of his monetary policyon the yen, 56
Washington, any real power toinfluence yen?, 75
Watergate affair, 46
Yamaichi Securities, bankruptcy of,34
Yen, its launch in 1871, 10; fixingof gold parity in 1897, 15;fixing exchange rate in 1949,28; over-valuation of followingFirst World War, 20; sharp fallafter Tokyo earthquake, 24;collapse, 1931–2, 27; fixing ofexchange rate in 1949, 28;thirteen phases of motion,1960–2000, 31–2; realappreciation of in early 1960s,33–4; real appreciation comesto a halt in second half of1960s, 35–6; coming of end offixed exchange rate withdollar, 1969–71, 35–41; couldJapan have salvaged fixedexchange rate with dollar inyears 1969–71?, 35–41; dollardevaluation and then return toyen–dollar stability, 1971–6,38–50; unofficial peg to thedollar, 1974–6,47; yo-yo yen isborn, 1977–80, 50–6; solo risein early 1977, 50; peaks in1978 well before Swiss franc,51; golden stability of duringearly 1980s, 62; almost threeyears of stability against thedollar before Plaza, 56; soarsagainst dollars, 1985–8, 59–62;behavior of during late stagesof 1987–90 bubble economyand in its immediateaftermath, 128–36, 140;bizarre surge of in early 1990s,118, 135–6, 148–51; a view on
Index 257

Yen cont.equilibrium exchange rate inearly 1990s, 145; bizarrestrength in second half of1991, 148–50; fails to declinedespite Japanese recession in1992, 151–2; driven up byWashington’s economicdiplomacy in 1993, 155; roleof US fiscal policy in 1993 yensurge, 159; brief yen surge inearly 1994, 166–8; doesWashington have any realpower over the yen rate?, 167;moves out of limelight fromSpring 1994 to beginning of1995, 170; rises to the sky,Spring 1995, 175–86; big fallfrom Summer 1995 to early1997, 189–94; yen shock (surge)in Spring 1997 and its after-effect, 194–202; from Asiancrisis to yen lowpoint ofSummer 1998, 202–5; jumps by20% in one day, October 1998,206–7; strong rise in Summerand Autumn 1999 related toNASDAQ bubble, 209; yencurrency market becomes one-way, 1999, 213; most volatile ofmajor currencies in 1990s, 33;see also Bretton Woods System,carry trade in yen,counterfactual historicalanalysis, currency geography,Dodge Plan, dollar–yen axis,earthquake risk, exchangerestrictions, exchange riskaversion, fixing the yen–dollarrate, floating yen, free float, G-7intervention, Germanunification boom, GoldStandard, purchasing powerparity, Silver Standard, soloyen movement, Tokyo equitymarket bubble, yendevaluation, yo-yo yen,yen–euro axis, yen shock ofOctober 1998, yen spike ofSpring 1997
Yen bubble 1995, 116; role inAsian crisis, 116, 175–94;Federal Reserve GovernorLindsey’s remarks as catalystto, 180–3; benign neglect ofGreenspan Federal Reserve,180; role of Kobe earthquakein, 178–9; influence of tradetalks on, 182, 185–6; talk ofAsian central banks shiftingreserves into yen, 183; Asianborrowers repay yen loans,183; state of market opinionduring, 184–5; the bursting ofin Summer and Autumn 1995,186–9; role of EisukeSakakibara in the burstingprocess, 187; risk aversionduring 188; growingconfidence crisis in Japanesebanks as factor in bursting of ,189; see also Greenspan,Clinton, currency bubbles,Framework Talks
Yen devaluation, from 1885 to1887, 13; from 1891 to 1894,14; as exit from post-bubbledepression of 1882–5, 14; in1931, 27; as possible means forextricating Japanese economyfrom deflation at the start ofthe 21st century?, 219
Yen shock, its 20% jump in oneday, October 1998, 205–9
Yen spike of Spring 1997, itsharmful influence on themechanisms for recyclingJapan’s savings surplus to therest of the world, 201–2
Yen–Dollar Talks 1983–4, 58Yen–euro axis dominance, defined,
78; illustrative identification,80; see also currency geographyYo–yo yen, is born, 1977–80,50–5; small throw of in early1980s, 56; violent upwardswing following Plaza, 62; asimpediment to capital exportsfrom Japan, 69; were its stringspulled by Washington in early
258 Index

1997?, 200; bad for theJapanese economy?, 216–7;lessons for the globaleconomy, 235
Zaibatsu, formation of, 13
Zai-tech, in Japan’s bubble markets1987–90, 133; as contributorto capital exports, 133
Zero rate policy, adopted inFebruary 1999 by Bank ofJapan, 214
Index 259