Embed Size (px)
Citation preview
The XMM slew survey:The XMM slew survey:status and futurestatus and future
Richard Saxton, Andrew Read, Richard Saxton, Andrew Read, Michael Freyberg, Bruno Altieri Michael Freyberg, Bruno Altieri

OverviewOverview 390 slew datasets in archive390 slew datasets in archive PN, MOS-1/2 exposures in Medium filter with the observing mode PN, MOS-1/2 exposures in Medium filter with the observing mode
set to that of previous pointed observationset to that of previous pointed observation Average slew length is 70 degreesAverage slew length is 70 degrees Data available for slews > 30 minsData available for slews > 30 mins Closed slew, open slew, closed slew. Open slew speed = 90 Closed slew, open slew, closed slew. Open slew speed = 90
degrees / hour, i.e. on-source time ~14 secsdegrees / hour, i.e. on-source time ~14 secs Area covered to date ~8000 degArea covered to date ~8000 deg2 2 (~20% of sky)(~20% of sky)
CAL or science ?CAL or science ?
We could use the time usefully for closed-cal observations (MOS needs more exposure time as CAL source gets weaker)
Only 14 secs on-source exposure time
Bright stars may cause false detections due to optical loading
Earlier surveys may have already done the science, e.g. ROSAT
High background may hide sources
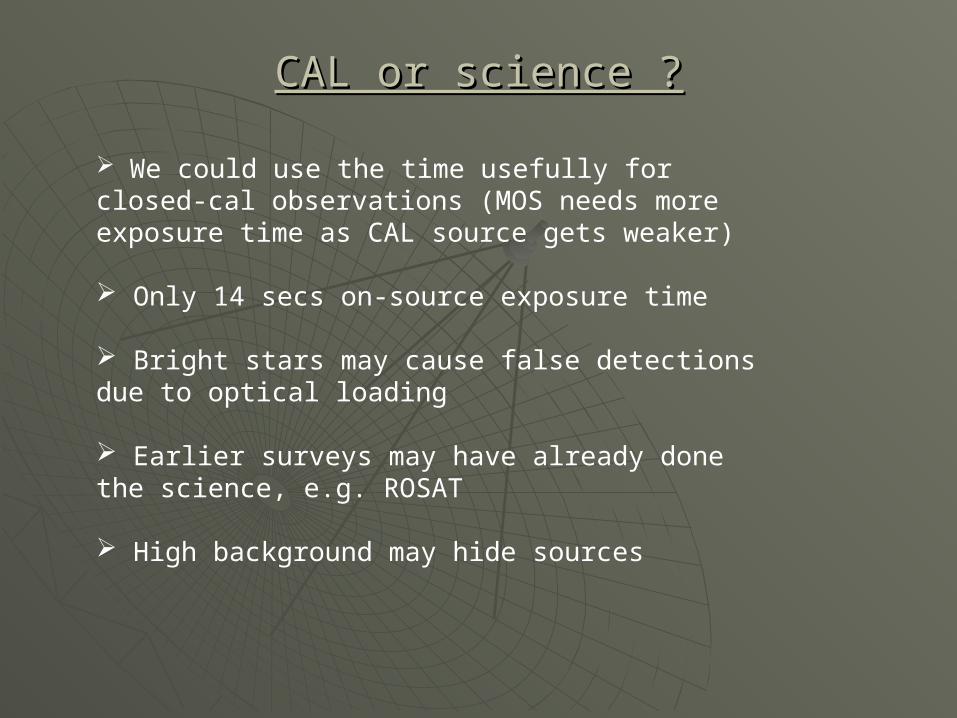
Rosat limit = 5x10-13 (92% of sky)EMSS = 5x10-14 – 3x10-12 (2% 0f sky) (0.3-4)HEAO-1 survey = 6x10-12 – 3.6x10⁻¹¹ (all-sky)Exosat slew survey = 5x10-11 (n% of sky)RXTE ASM = 7x10⁻¹⁰ (2-10)
Flux limits
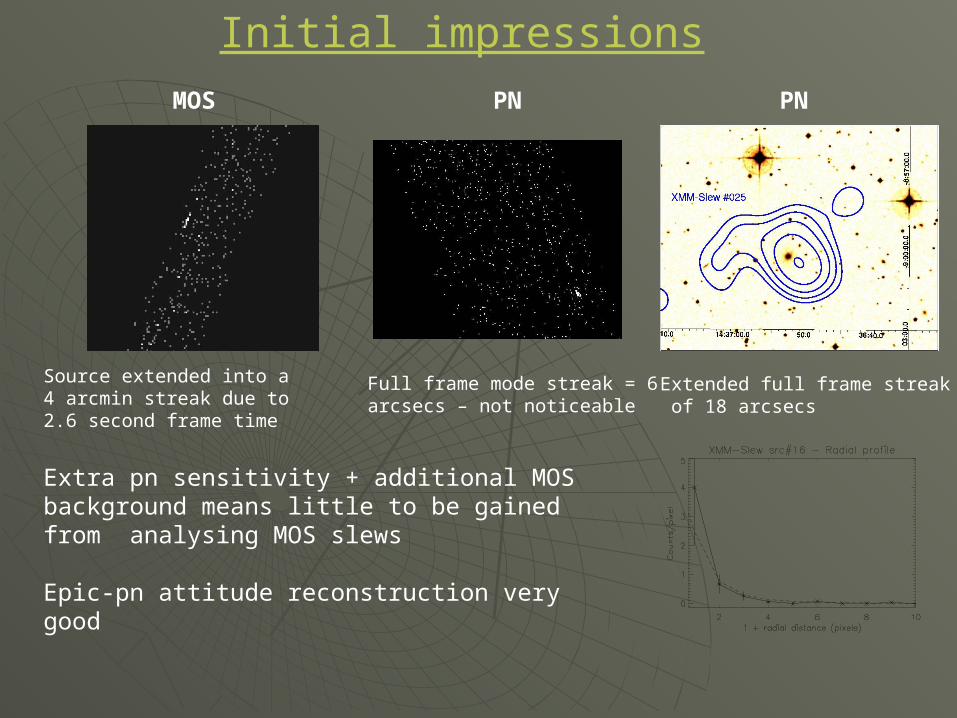
Initial impressions
Source extended into a 4 arcmin streak due to 2.6 second frame time
Full frame mode streak = 6 arcsecs – not noticeable
Extra pn sensitivity + additional MOS background means little to be gained from analysing MOS slews
Epic-pn attitude reconstruction very good
MOS PN PN
Extended full frame streak of 18 arcsecs
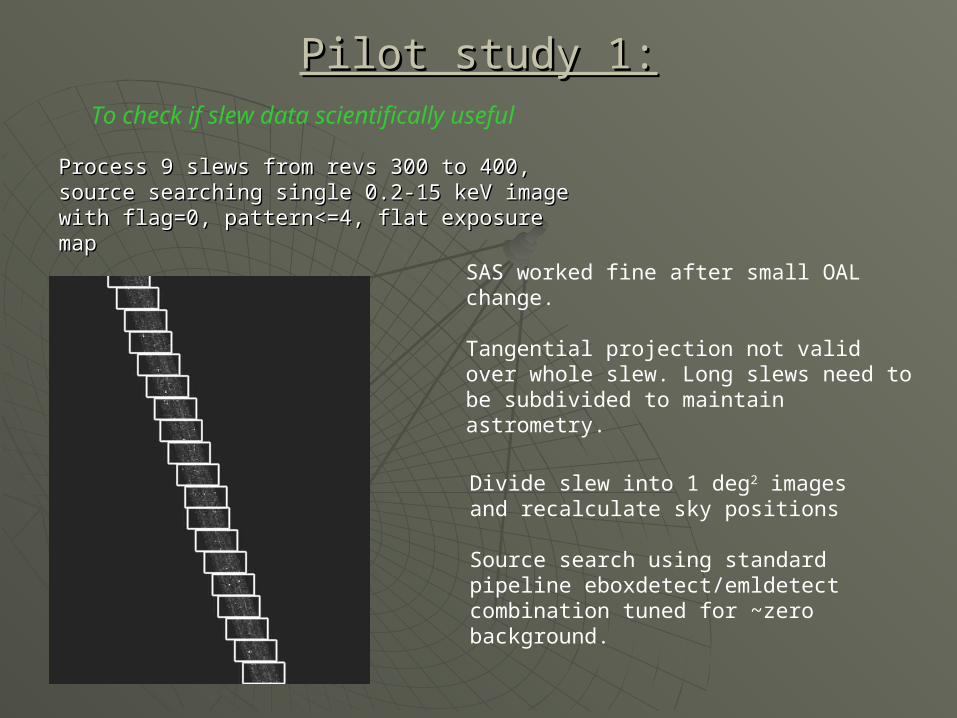
Pilot study 1:Pilot study 1:
SAS worked fine after small OAL change.
Tangential projection not valid over whole slew. Long slews need to be subdivided to maintain astrometry.
Divide slew into 1 deg2 imagesand recalculate sky positions
Source search using standard pipeline eboxdetect/emldetect combination tuned for ~zero background.
Process 9 slews from revs 300 to 400, source Process 9 slews from revs 300 to 400, source searching single 0.2-15 keV image with flag=0, searching single 0.2-15 keV image with flag=0, pattern<=4, flat exposure mappattern<=4, flat exposure map
To check if slew data scientifically useful
Pilot 1 SUMMARY
Source searched images from 9 pn slews and found 139 sources down to det_ml=10, ~0.5 source/deg2
All 139 sources eyeballed and look ok, i.e. no obvious false detections due to background effects.
Minimum number of counts = 6 giving detection limits of F0.2–
2 = 1.5x10⁻¹², F2-10 = 2.2x10⁻¹² ergs s-1 cm-2
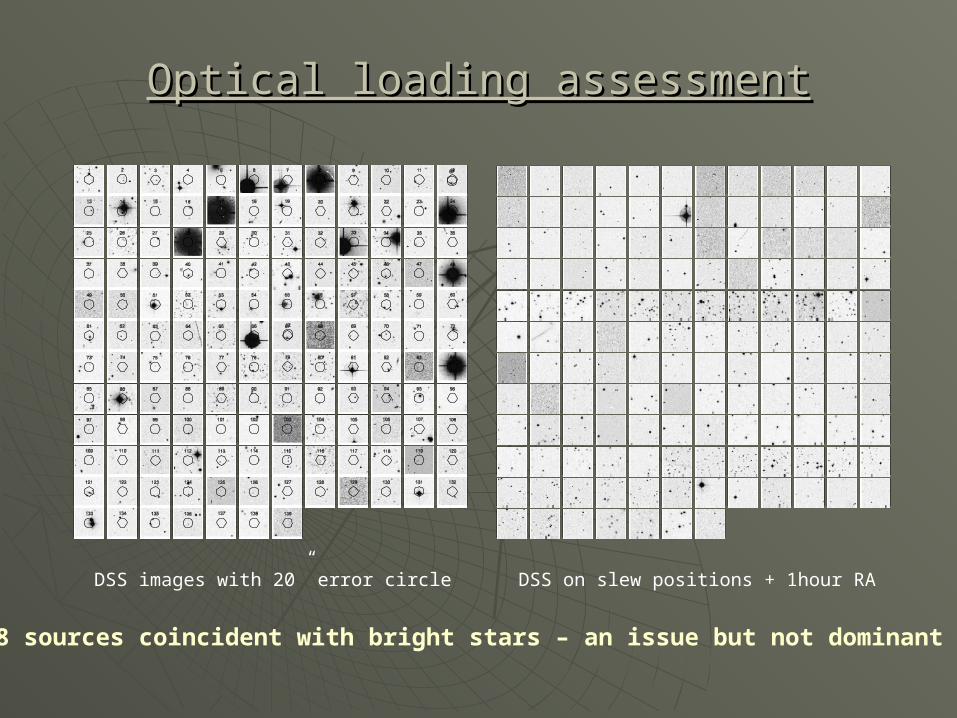
Optical loading assessmentOptical loading assessment
18 sources coincident with bright stars – an issue but not dominant
DSS images with 20” error circle DSS on slew positions + 1hour RA
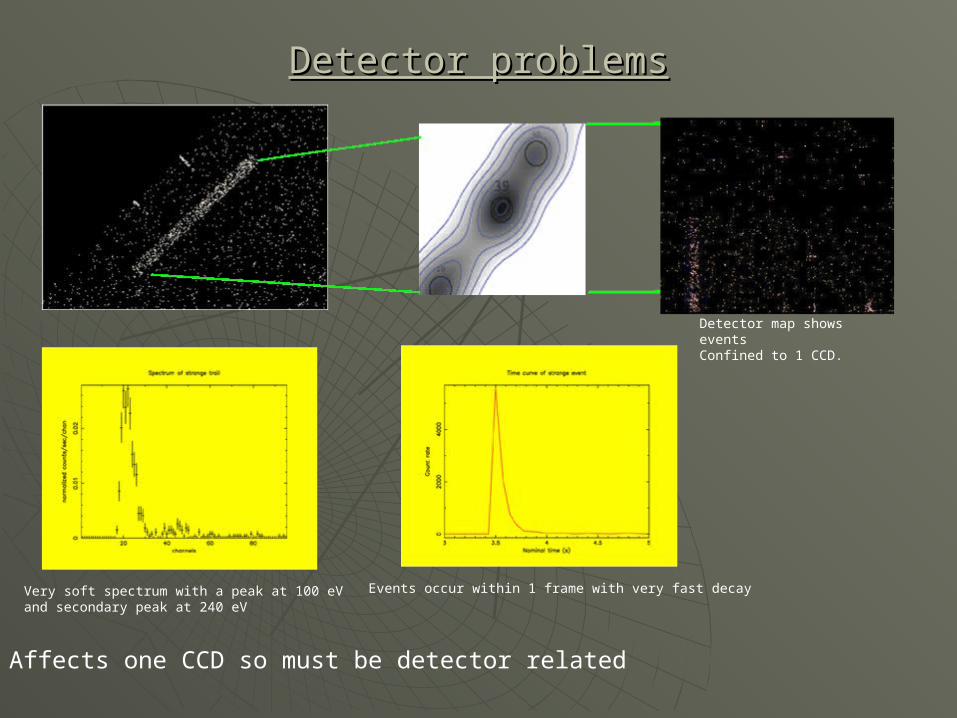
Detector problemsDetector problems
Affects one CCD so must be detector related
Very soft spectrum with a peak at 100 eVand secondary peak at 240 eV
Events occur within 1 frame with very fast decay
Detector map shows eventsConfined to 1 CCD.
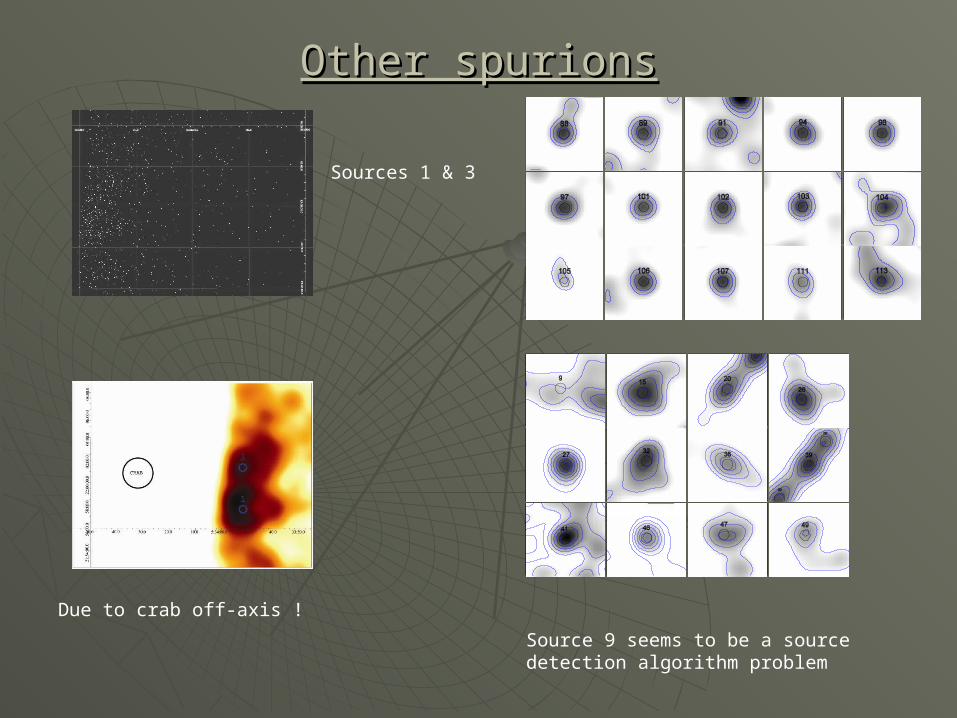
Other spurionsOther spurions
Source 9 seems to be a source detection algorithm problem
Due to crab off-axis !
Sources 1 & 3
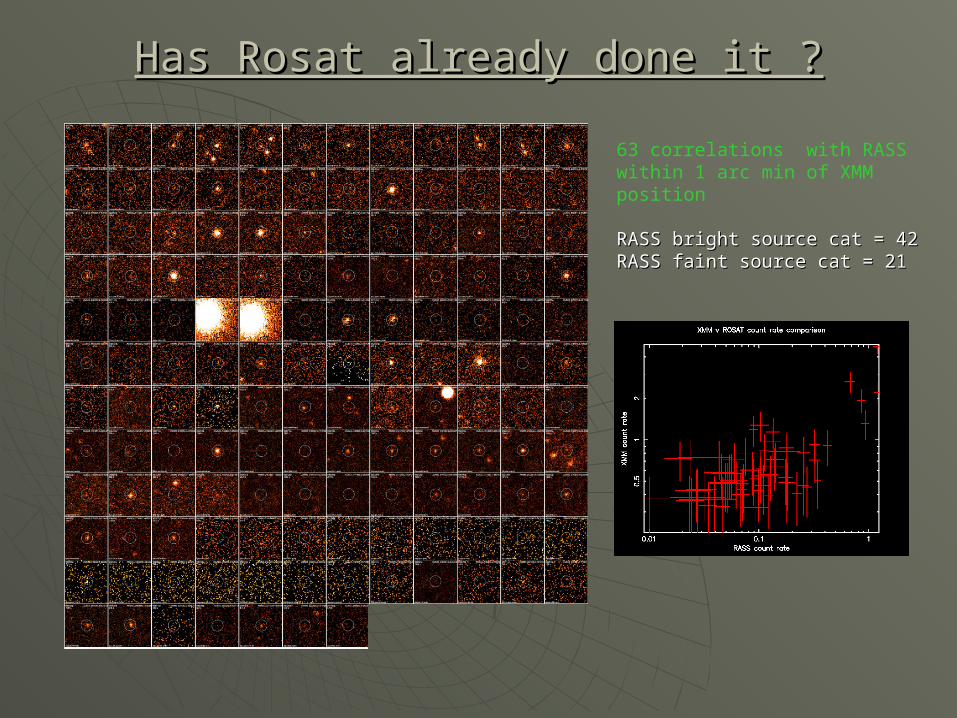
Has Rosat already done it ?Has Rosat already done it ?
63 correlations with RASSwithin 1 arc min of XMM position
RASS bright source cat = 42 RASS bright source cat = 42 RASS faint source cat = 21RASS faint source cat = 21
IdentificationsIdentificationsTotal sources = 139Total sources = 139ROSAT survey IDs = 63ROSAT survey IDs = 6310 bright stars, non-RASS sources10 bright stars, non-RASS sources9 detector flashes9 detector flashes2 crab off-axis 2 crab off-axis 1 other spurious1 other spurious8 sources with NED counterparts but consistent with null 8 sources with NED counterparts but consistent with null
hypothesishypothesis1 source observed twice in separate slews1 source observed twice in separate slews2 sources seen in ROSAT pointed obs. and not in RASS (14 not 2 sources seen in ROSAT pointed obs. and not in RASS (14 not
seen in either).seen in either).
~50 unidentified~50 unidentified
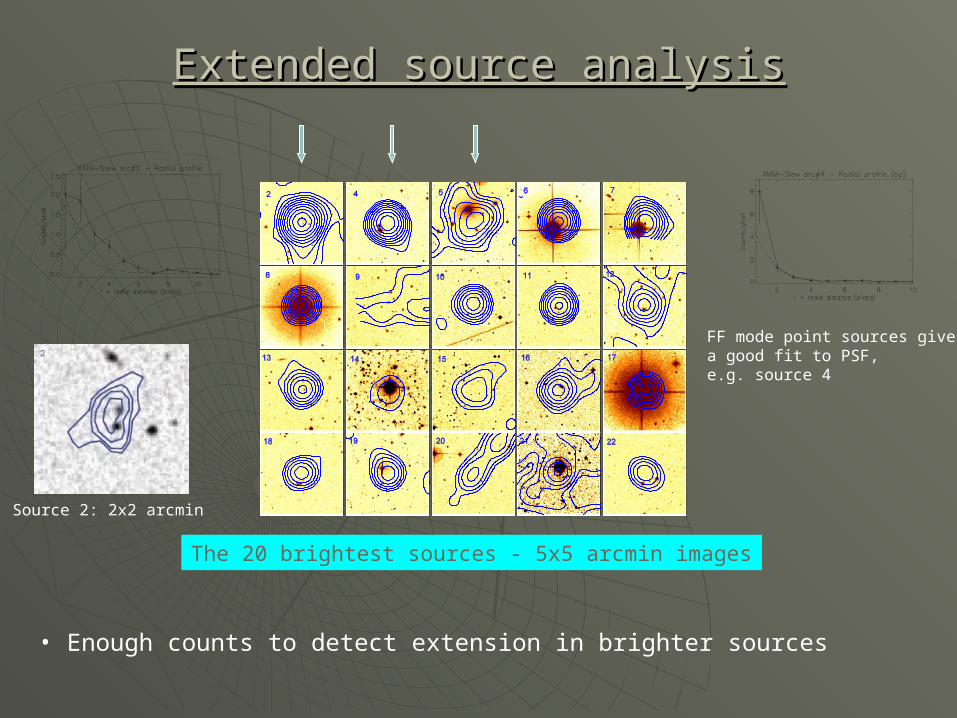
Extended source analysisExtended source analysis
Source 2: 2x2 arcmin
FF mode point sources give a good fit to PSF, e.g. source 4
The 20 brightest sources - 5x5 arcmin images
• Enough counts to detect extension in brighter sources
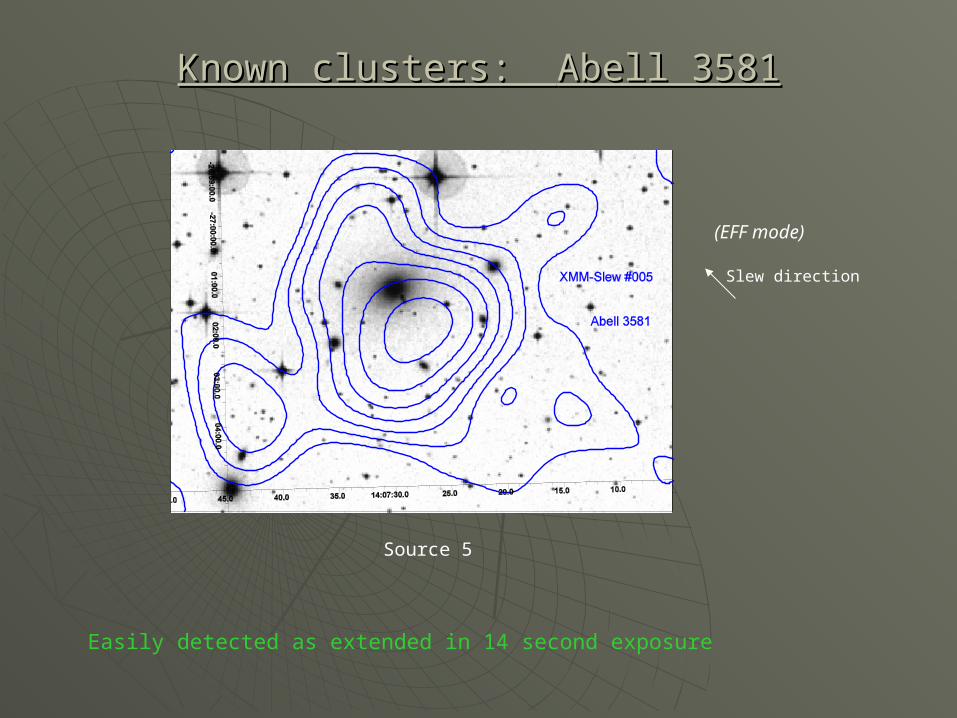
Known clusters: Known clusters: Abell 3581Abell 3581
Source 5
Easily detected as extended in 14 second exposure
(EFF mode)
Slew direction
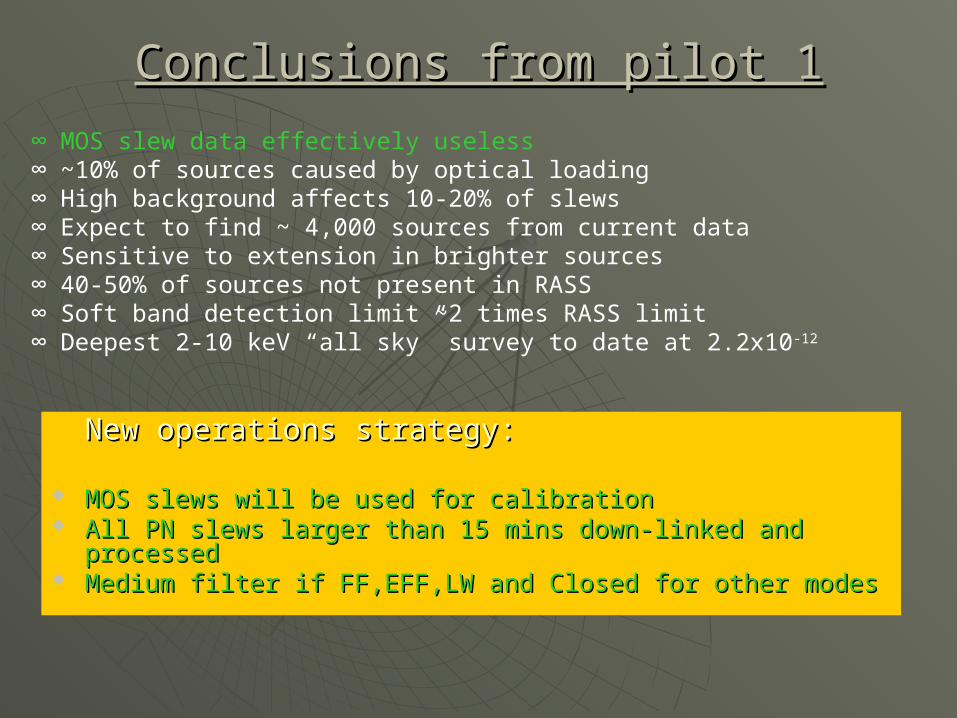
Conclusions from pilot 1Conclusions from pilot 1∞ MOS slew data effectively useless∞ ~10% of sources caused by optical loading∞ High background affects 10-20% of slews∞ Expect to find ~ 4,000 sources from current data∞ Sensitive to extension in brighter sources∞ 40-50% of sources not present in RASS∞ Soft band detection limit ~2 times RASS limit∞ Deepest 2-10 keV “all sky” survey to date at 2.2x10⁻¹²
New operations strategy:New operations strategy:
MOS slews will be used for calibrationMOS slews will be used for calibration All PN slews larger than 15 mins down-linked and processedAll PN slews larger than 15 mins down-linked and processed Medium filter if FF,EFF,LW and Closed for other modesMedium filter if FF,EFF,LW and Closed for other modes
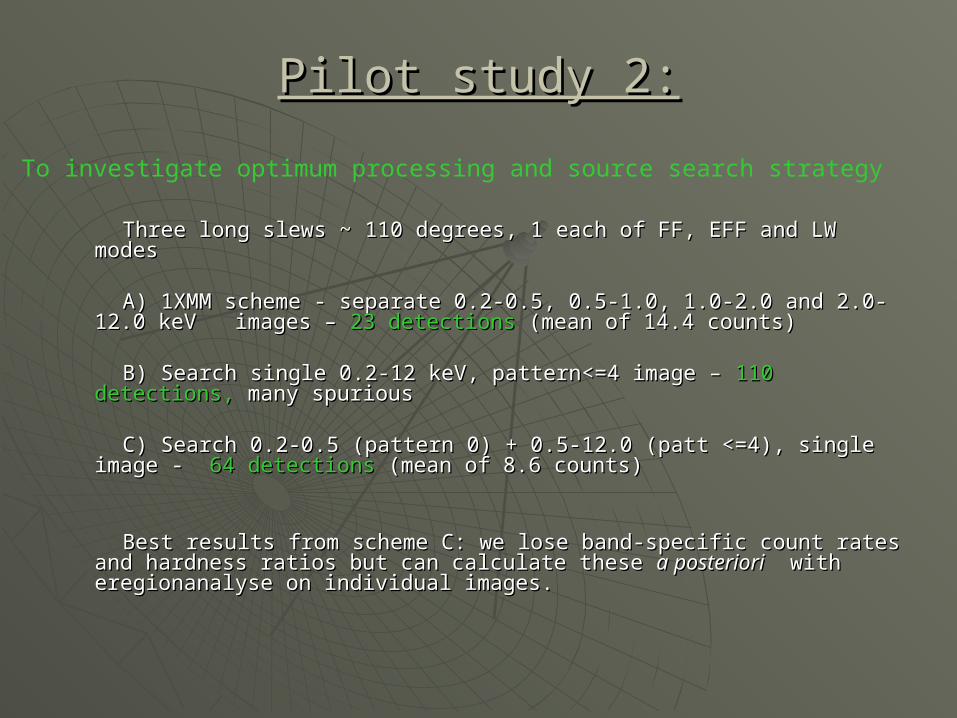
Pilot study 2:Pilot study 2:
Three long slews ~ 110 degrees, 1 each of FF, EFF and LW modesThree long slews ~ 110 degrees, 1 each of FF, EFF and LW modes
A) 1XMM scheme - separate 0.2-0.5, 0.5-1.0, 1.0-2.0 and 2.0-12.0 keV A) 1XMM scheme - separate 0.2-0.5, 0.5-1.0, 1.0-2.0 and 2.0-12.0 keV images – images – 23 detections23 detections (mean of 14.4 counts) (mean of 14.4 counts)
B) Search single 0.2-12 keV, pattern<=4 image – B) Search single 0.2-12 keV, pattern<=4 image – 110 detections, 110 detections, many many spuriousspurious
C) Search 0.2-0.5 (pattern 0) + 0.5-12.0 (patt <=4), single image - C) Search 0.2-0.5 (pattern 0) + 0.5-12.0 (patt <=4), single image - 64 64 detectionsdetections (mean of 8.6 counts) (mean of 8.6 counts)
Best results from scheme C: we lose band-specific count rates and Best results from scheme C: we lose band-specific count rates and hardness ratios but can calculate these hardness ratios but can calculate these a posterioria posteriori with eregionanalyse with eregionanalyse on individual images.on individual images.
To investigate optimum processing and source search strategy
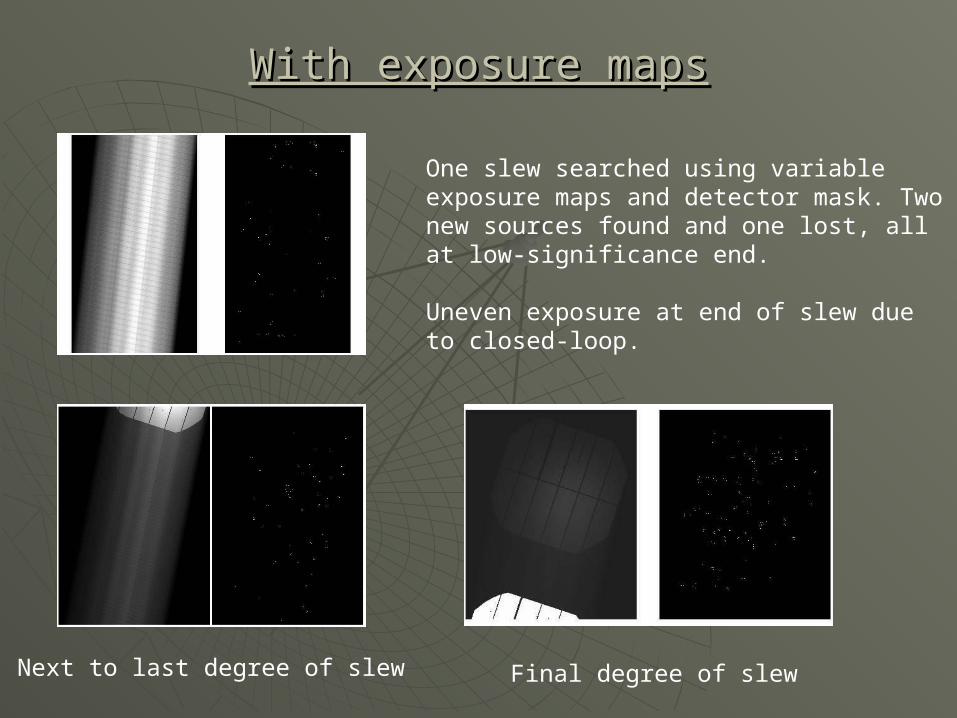
With exposure mapsWith exposure maps
One slew searched using variable exposure maps and detector mask. Two new sources found and one lost, all at low-significance end.
Uneven exposure at end of slew due to closed-loop.
Next to last degree of slew Final degree of slew
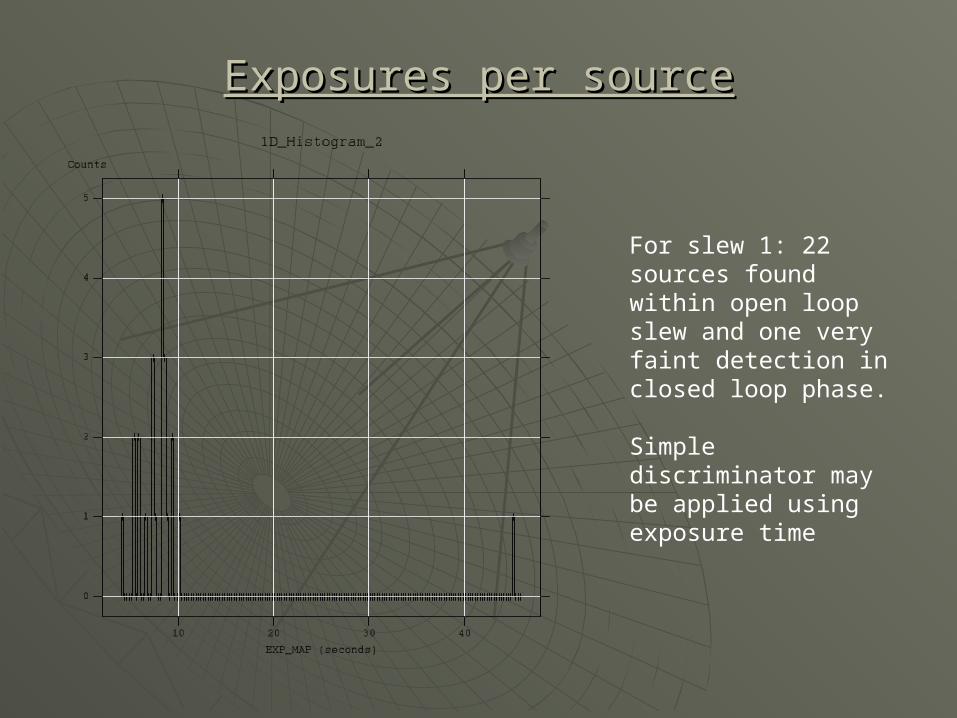
Exposures per sourceExposures per source
For slew 1: 22 sources found within open loop slew and one very faint detection in closed loop phase.
Simple discriminator may be applied using exposure time
Conclusions from pilot 2Conclusions from pilot 2
∞ Source density again ~0.5 / deg^2Source density again ~0.5 / deg^2∞ Use 0.2-0.5 (patt=0) + 0.5-12.0 keV (patt<=4) image∞ Use exposure maps and detector masks∞ Find individual band count rates after source search∞ Only use FF, EFF and LW mode data∞ For uniform survey ignore sources with exp>11 secs
ProcessingProcessing scheme scheme
Processing of slew data (MJF) Processing of slew data (MJF) Creation of images, exposure maps (Pili,RDS)Creation of images, exposure maps (Pili,RDS) Source search 0.2-12 keV image (AMR)Source search 0.2-12 keV image (AMR) Make catalogue of detections (Pili)Make catalogue of detections (Pili) Make DSS images for each detection (AMR)Make DSS images for each detection (AMR) Check for and flag spurions (Pili, MJF)Check for and flag spurions (Pili, MJF) Check for and flag optical loading due to bright stars (Pili, AMR) Check for and flag optical loading due to bright stars (Pili, AMR) Find hardness ratios from individual band images (RDS, Pili)Find hardness ratios from individual band images (RDS, Pili) Make clean catalogue of sources (Pili)Make clean catalogue of sources (Pili) Cross-correlate with Rosat (MJF)Cross-correlate with Rosat (MJF) Cross-correlate with other catalogues (?)Cross-correlate with other catalogues (?)
Analyse extensions (UCM trainee, AMR)Analyse extensions (UCM trainee, AMR) Co-add slews and re-search (?)Co-add slews and re-search (?) Optical follow-up, piggy-back on XID program (??)Optical follow-up, piggy-back on XID program (??)

ScheduleSchedule
Initial processing of slew dataInitial processing of slew data (finished)(finished) Creation of images, source searching, rejection of spurious sourcesCreation of images, source searching, rejection of spurious sources (Feb to (Feb to
May)May) Cross correlation with ROSAT, other catalogues, DSS, SDSS etc.Cross correlation with ROSAT, other catalogues, DSS, SDSS etc. (May to (May to
July)July) Creation of final catalogue for ingestion into XSACreation of final catalogue for ingestion into XSA (Aug to Sep) (Aug to Sep) Ingestion into XSAIngestion into XSA (end of September) (end of September)
Investigate extended sources Investigate extended sources (begin May)(begin May) Search co-added slews Search co-added slews (?)(?)