Embed Size (px)
Citation preview
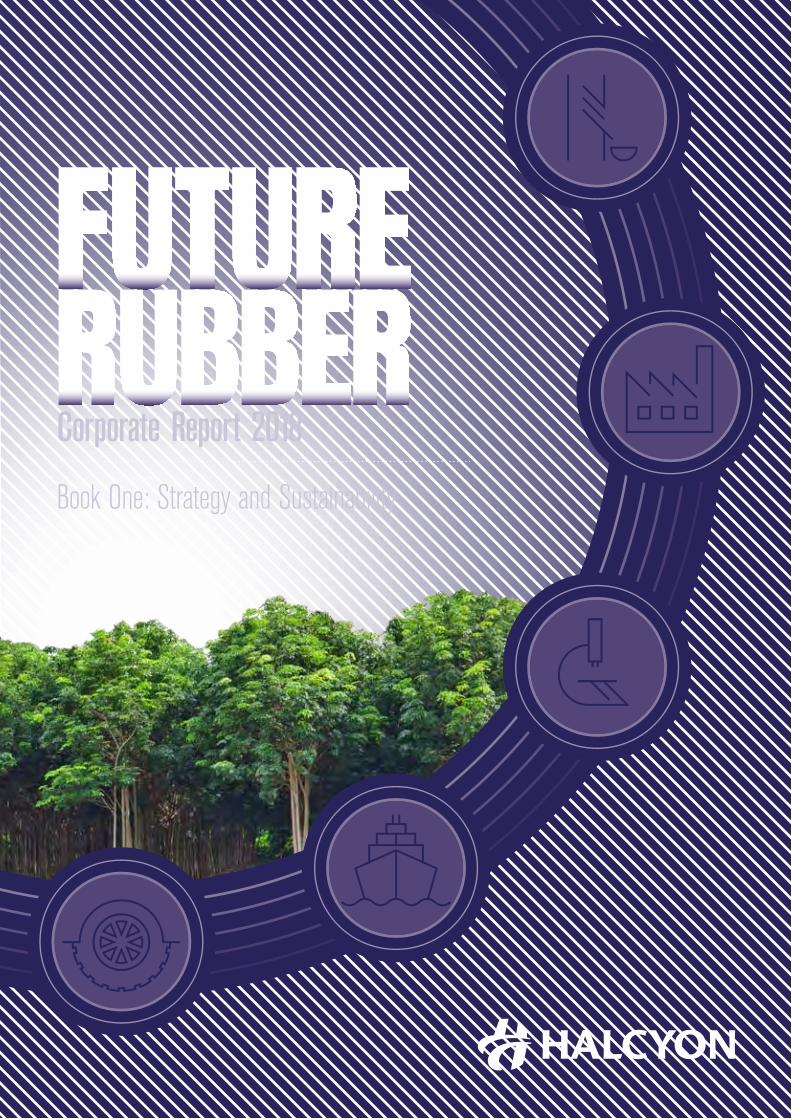
Book One: Strategy and Sustainability
Corporate Report 2018
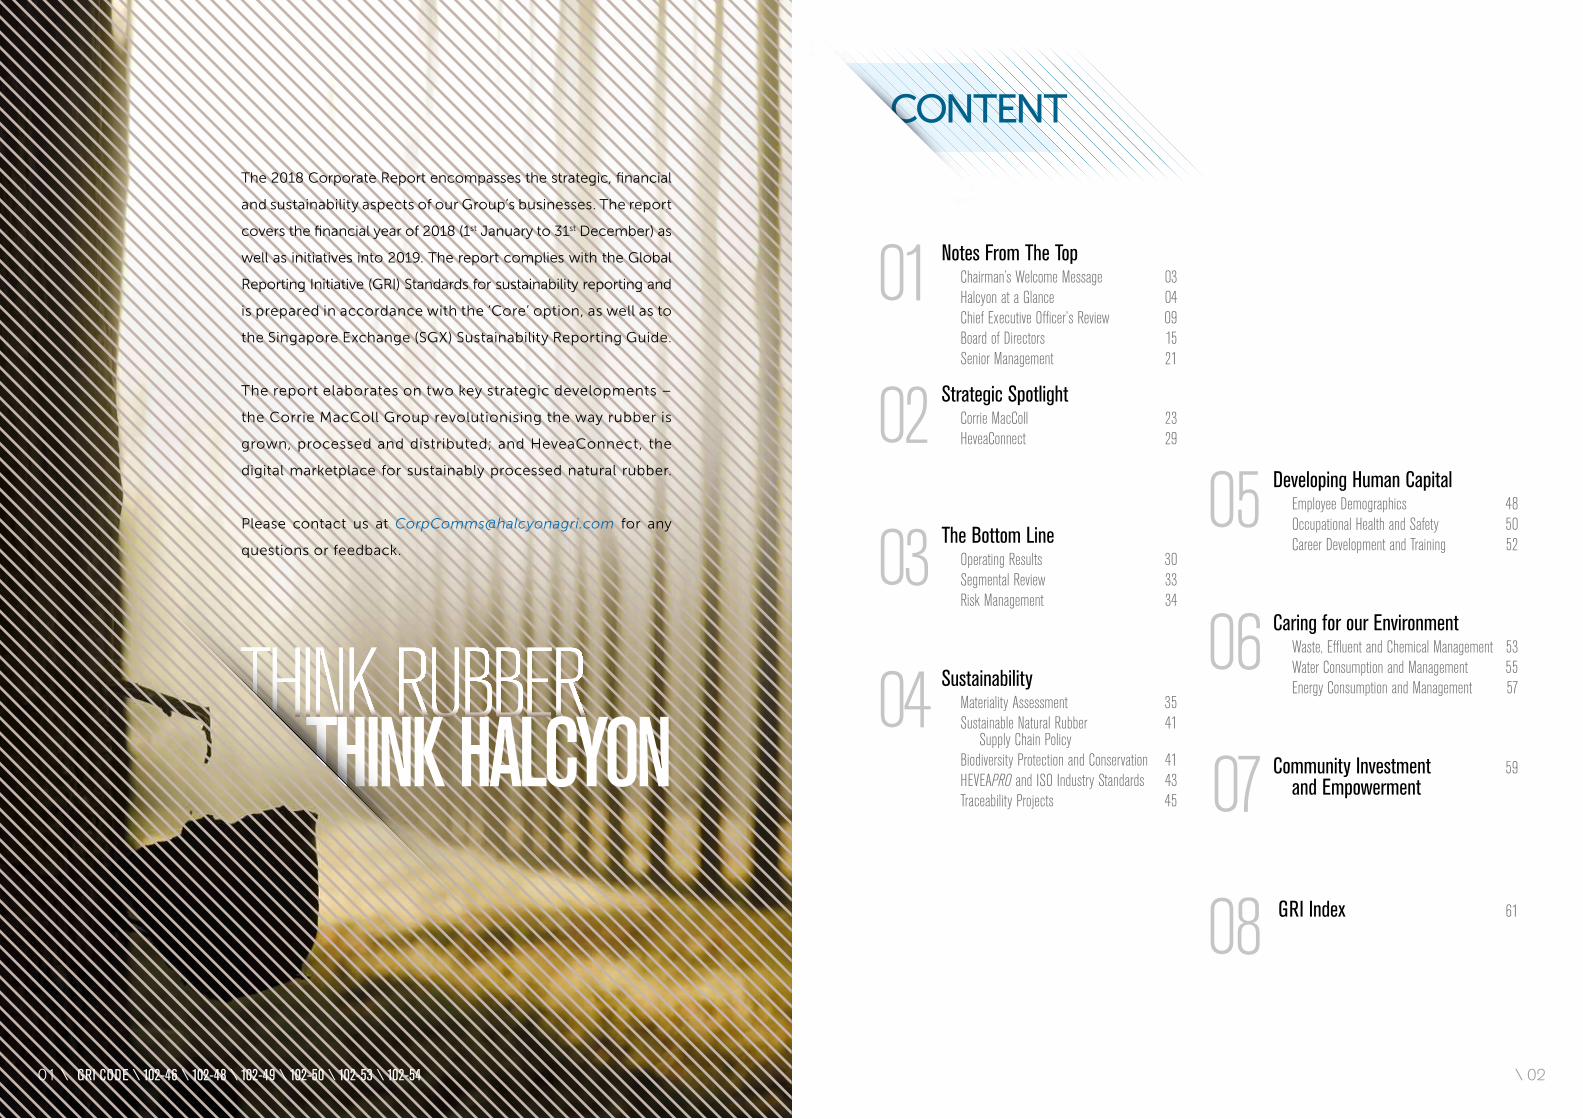
The 2018 Corporate Report encompasses the strategic, financial
and sustainability aspects of our Group’s businesses. The report
covers the financial year of 2018 (1st January to 31st December) as
well as initiatives into 2019. The report complies with the Global
Reporting Initiative (GRI) Standards for sustainability reporting and
is prepared in accordance with the ‘Core’ option, as well as to
the Singapore Exchange (SGX) Sustainability Reporting Guide.
The report elaborates on two key strategic developments –
the Corrie MacColl Group revolutionising the way rubber is
grown, processed and distributed; and HeveaConnect, the
digital marketplace for sustainably processed natural rubber.
Please contact us at [email protected] for any
questions or feedback.
GRI CODE \ 102-46 \ 102-48 \ 102-49 \ 102-50 \ 102-53 \ 102-54
CONTENT
01
02
03
04
Notes From The TopChairman’s Welcome Message 03Halcyon at a Glance 04Chief Executive Officer’s Review 09Board of Directors 15Senior Management 21
Strategic SpotlightCorrie MacColl 23
HeveaConnect 29
The Bottom LineOperating Results 30Segmental Review 33Risk Management 34
SustainabilityMateriality Assessment 35Sustainable Natural Rubber 41 Supply Chain PolicyBiodiversity Protection and Conservation 41
HEVEAPRO and ISO Industry Standards 43Traceability Projects 45
05
06
07
08
Developing Human CapitalEmployee Demographics 48Occupational Health and Safety 50Career Development and Training 52
Caring for our EnvironmentWaste, Effluent and Chemical Management 53Water Consumption and Management 55Energy Consumption and Management 57
Community Investment 59and Empowerment
GRI Index 61
\ 0201 \
Dear Shareholders
Welcome to the 2018 Corporate Report of Halcyon
Agri Corporation Limited. The report covers an overview
of the Group’s operations, financials and sustainability
practices. The management team has gone to great
lengths to produce a document that is both informative
and educational. We realise that many aspects of Halcyon
Agri’s global business are complex and therefore not easy
to understand, and I am personally amazed by just how
many products contain natural rubber and how many
such applications we supply. It fascinates me to think
that we supply the raw material for 60 million catheters
and over 200 million vehicle tyres!
2018 was a challenging year and one where Halcyon Agri
is probably better measured by its intrinsic progress than
by its financial performance. Rubber prices remained
below break-even levels for most of the year, and in
most origins, farmers struggled to supply the material
we required. A notable exception was Thailand, where
processors – our subsidiary Teck Bee Hang included –
enjoyed positive margins for most of the year.
Looking ahead, I am confident that Halcyon Agri’s
initiative to decommoditise natural rubber and redesign
its price determination mechanism will bear fruit.
This non-substitutable product is both a vital ingredient
to the mobility sector, and very challenging to produce.
Most industrial raw materials are subject to significant
degrees of substitution risk, or are abundantly available,
and therefore suitable for price discovery via a futures
exchange. In the case of natural rubber, a tropical
crop with tight geographical boundaries, six years to
first cash flow, and labour intensive harvesting, pricing
should be determined on a cost-plus basis, and not via
futures markets.
In closing, I would like to thank Halcyon’s management
and staff, my fellow board members, as well as all
stakeholders of Halcyon Agri. I greatly appreciate your
loyalty, dedication and strong contribution.
Liu Hongsheng
LIU HONGSHENG
Chairman
Headquartered in Singapore, we have sales offices, warehouses, terminals, laboratories, factories, plantations and a wide distribution network across the world
OUR BUSINESS AT A GLANCE
Market Share of Natural Rubber Supplied to Worldwide Tyre
Production
11%
Standard Indonesian RubberMarket Share
Indonesia supplies 21% of the world’s Natural Rubber
15%
Natural Rubber and LatexMarket Share
10%
Locations
Dedicated Employees17,000+
100+
Production Facilities38
Production Capacity1.6 Million mT
Sales Volume1.4 Million mT
CHAIRMAN’S WELCOME MESSAGE
All figures above are based on Halcyon’s analysis of sales and customer information and IRSG data.GRI CODE \ 102-14 GRI CODE \ 102-7 \ 0403 \
SINRIOHALCYON RUBBER COMPANY
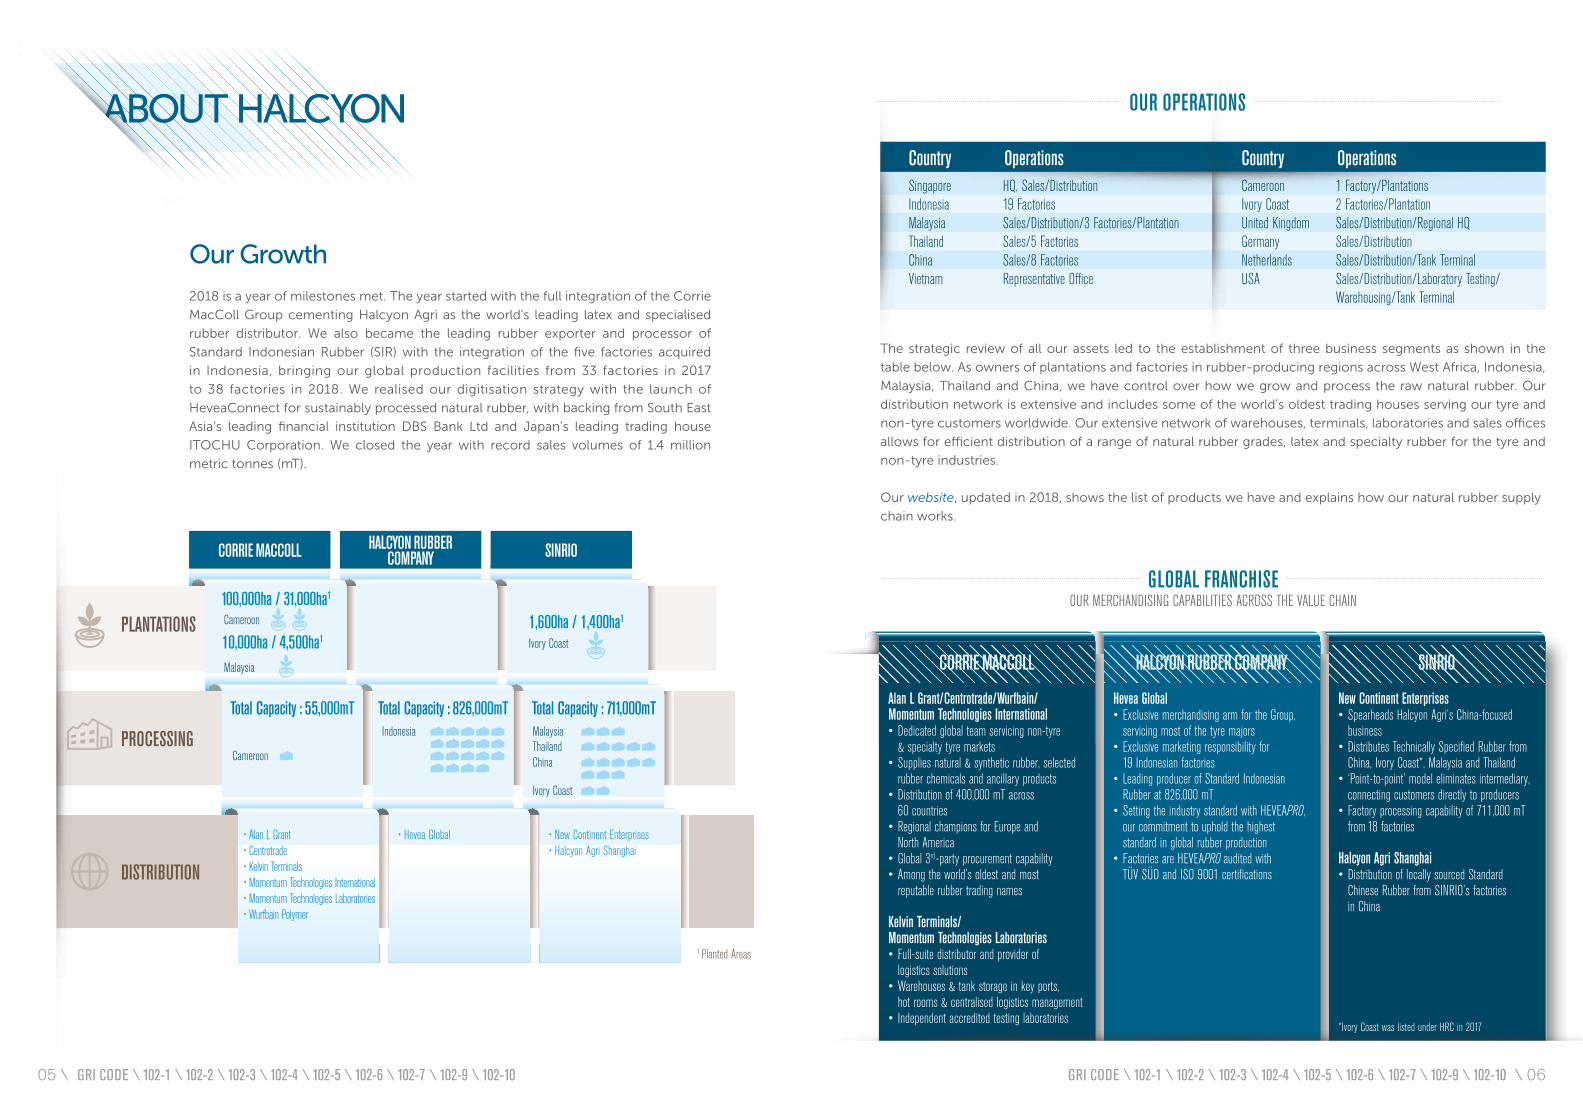
New Continent Enterprises• Spearheads Halcyon Agri’s China-focused business• Distributes Technically Specified Rubber from China, Ivory Coast*, Malaysia and Thailand• ‘Point-to-point’ model eliminates intermediary, connecting customers directly to producers• Factory processing capability of 711,000 mT from 18 factories
Halcyon Agri Shanghai• Distribution of locally sourced Standard Chinese Rubber from SINRIO’s factories in China
CORRIE MACCOLL
Alan L Grant/Centrotrade/Wurfbain/ Momentum Technologies International• Dedicated global team servicing non-tyre & specialty tyre markets• Supplies natural & synthetic rubber, selected rubber chemicals and ancillary products• Distribution of 400,000 mT across 60 countries• Regional champions for Europe and North America• Global 3rd-party procurement capability• Among the world’s oldest and most reputable rubber trading names
Kelvin Terminals/ Momentum Technologies Laboratories • Full-suite distributor and provider of logistics solutions• Warehouses & tank storage in key ports, hot rooms & centralised logistics management• Independent accredited testing laboratories
Country OperationsSingapore HQ, Sales/DistributionIndonesia 19 FactoriesMalaysia Sales/Distribution/3 Factories/PlantationThailand Sales/5 FactoriesChina Sales/8 FactoriesVietnam Representative Office
Country OperationsCameroon 1 Factory/PlantationsIvory Coast 2 Factories/PlantationUnited Kingdom Sales/Distribution/Regional HQGermany Sales/DistributionNetherlands Sales/Distribution/Tank TerminalUSA Sales/Distribution/Laboratory Testing/ Warehousing/Tank Terminal
GLOBAL FRANCHISEOUR MERCHANDISING CAPABILITIES ACROSS THE VALUE CHAIN
The strategic review of all our assets led to the establishment of three business segments as shown in the
table below. As owners of plantations and factories in rubber-producing regions across West Africa, Indonesia,
Malaysia, Thailand and China, we have control over how we grow and process the raw natural rubber. Our
distribution network is extensive and includes some of the world’s oldest trading houses serving our tyre and
non-tyre customers worldwide. Our extensive network of warehouses, terminals, laboratories and sales offices
allows for efficient distribution of a range of natural rubber grades, latex and specialty rubber for the tyre and
non-tyre industries.
Our website, updated in 2018, shows the list of products we have and explains how our natural rubber supply
chain works.
SINRIOCORRIE MACCOLL HALCYON RUBBERCOMPANY
10,000ha / 4,500ha1
100,000ha / 31,000ha1
1,600ha / 1,400ha1PLANTATIONS
Malaysia
PROCESSING
Total Capacity : 55,000mT Total Capacity : 826,000mT Total Capacity : 711,000mT
Cameroon
Indonesia
Ivory Coast
MalaysiaThailandChina
• Hevea Global
DISTRIBUTION
1 Planted AreasGLOBAL MARKETPLACEGLOBAL MARKETPLACE CHINA
• Alan L Grant • Centrotrade • Kelvin Terminals• Momentum Technologies International• Momentum Technologies Laboratories• Wurfbain Polymer
• New Continent Enterprises• Halcyon Agri Shanghai
Ivory Coast
Cameroon
Hevea Global• Exclusive merchandising arm for the Group, servicing most of the tyre majors• Exclusive marketing responsibility for 19 Indonesian factories• Leading producer of Standard Indonesian Rubber at 826,000 mT• Setting the industry standard with HEVEAPRO, our commitment to uphold the highest standard in global rubber production• Factories are HEVEAPRO audited with TÜV SÜD and ISO 9001 certifications
ABOUT HALCYON
Our Growth
2018 is a year of milestones met. The year started with the full integration of the Corrie
MacColl Group cementing Halcyon Agri as the world’s leading latex and specialised
rubber distributor. We also became the leading rubber exporter and processor of
Standard Indonesian Rubber (SIR) with the integration of the five factories acquired
in Indonesia, bringing our global production facilities from 33 factories in 2017
to 38 factories in 2018. We realised our digitisation strategy with the launch of
HeveaConnect for sustainably processed natural rubber, with backing from South East
Asia’s leading financial institution DBS Bank Ltd and Japan’s leading trading house
ITOCHU Corporation. We closed the year with record sales volumes of 1.4 million
metric tonnes (mT).
OUR OPERATIONS
*Ivory Coast was listed under HRC in 2017
GRI CODE \ 102-1 \ 102-2 \ 102-3 \ 102-4 \ 102-5 \ 102-6 \ 102-7 \ 102-9 \ 102-10 GRI CODE \ 102-1 \ 102-2 \ 102-3 \ 102-4 \ 102-5 \ 102-6 \ 102-7 \ 102-9 \ 102-1005 \ \ 06
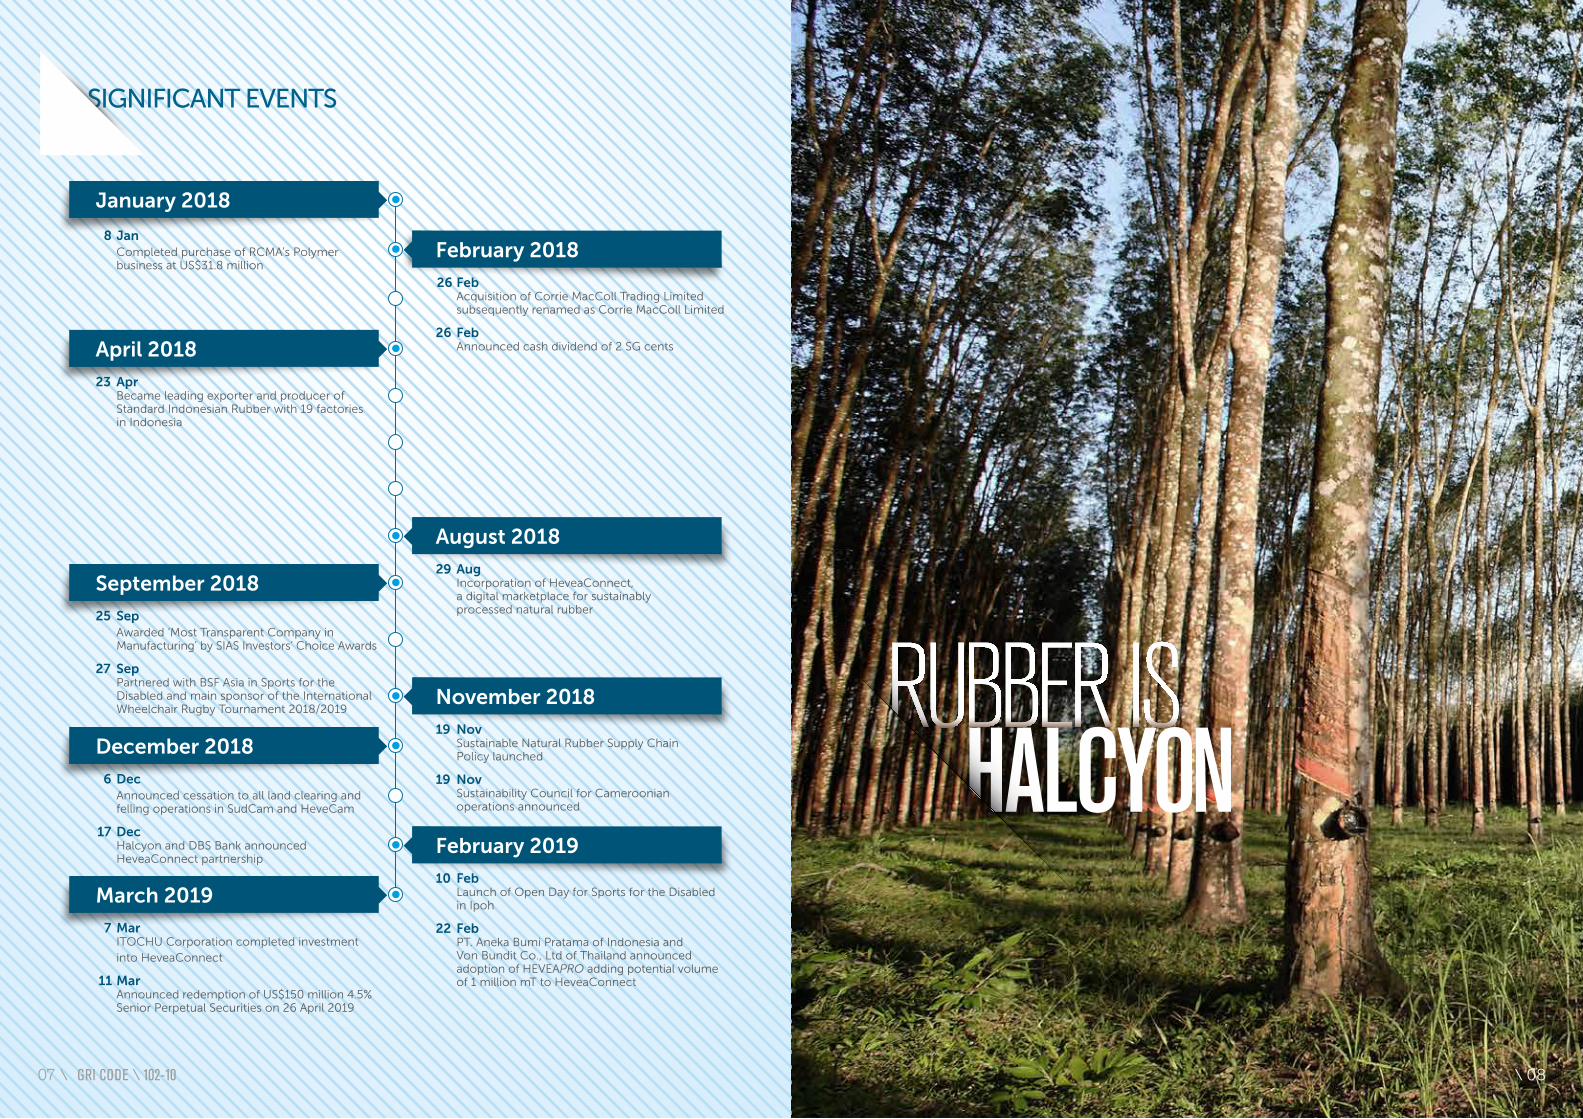
March 2019
7 Mar ITOCHU Corporation completed investment into HeveaConnect
11 Mar Announced redemption of US$150 million 4.5% Senior Perpetual Securities on 26 April 2019
September 2018
25 Sep Awarded ‘Most Transparent Company in Manufacturing’ by SIAS Investors’ Choice Awards
27 Sep Partnered with BSF Asia in Sports for the Disabled and main sponsor of the International Wheelchair Rugby Tournament 2018/2019
December 2018
6 Dec Announced cessation to all land clearing and felling operations in SudCam and HeveCam
17 Dec Halcyon and DBS Bank announced HeveaConnect partnership
November 2018
19 Nov Sustainable Natural Rubber Supply Chain Policy launched
19 Nov Sustainability Council for Cameroonian operations announced
February 2019
10 Feb Launch of Open Day for Sports for the Disabled in Ipoh
22 Feb PT. Aneka Bumi Pratama of Indonesia and Von Bundit Co., Ltd of Thailand announced adoption of HEVEAPRO adding potential volume of 1 million mT to HeveaConnect
August 2018
29 Aug Incorporation of HeveaConnect, a digital marketplace for sustainably processed natural rubber
February 2018
26 Feb Acquisition of Corrie MacColl Trading Limited subsequently renamed as Corrie MacColl Limited
26 Feb Announced cash dividend of 2 SG cents
SIGNIFICANT EVENTS
January 2018
8 Jan Completed purchase of RCMA’s Polymer business at US$31.8 million
April 2018
23 Apr Became leading exporter and producer of Standard Indonesian Rubber with 19 factories in Indonesia
GRI CODE \ 102-10 \ 0807 \
CHIEF EXECUTIVE OFFICER’S REVIEW
At the end of 2018, Halcyon Agri Corporation Limited was 8 years and 8 months old.
Looking back, we acquired our first two factories in 2011, and the immediate focus thereafter was on
synchronising the processing operations with our risk-averse marketing model, and, that being done, listing
the company on SGX in February 2013. Following that, we expanded our operations both geographically
and along the value chain. By the end of 2015, we owned 14 factories, our first greenfield rubber plantation
project, and the beginnings of a global distribution network. In our second big growth push, 2016 saw us
embark on our most ambitious project to date, the acquisition of Sinochem’s global natural rubber business,
which included the privatisation of GMG Global Ltd. In 2018, we rounded off our Indonesian portfolio with
the acquisition of another five factories, and made a final addition to our global distribution business –
by now the world’s leading - towards the end of that year.
Halcyon Agri now owns and operates 38 factories, employs over 17,000 people in 35 countries and owns
plantations covering more than 100,000 hectares (of which 40,000 are planted). In 2018 we became the
biggest supplier of dry rubber and latex globally, with an aggregate delivered volume of 1,432,335 mT.
Taking stock, it seems that 2018 was an important year not just for our group, but also for many facets of
the global economy and perhaps even for civil society. Several geopolitical and societal developments
strike me as being of particular significance:
1. The U.S. will not cede its position as the world’s leading economy to China without a fight
2. Income inequality within developed economies is producing irrational outcomes at the ballot, and
the ever-widening wealth gap between frontier and developed economies has unleashed migratory
forces that potentially threaten the World Order
3. Climate change is upon us regardless if politicians and world leaders are prepared to acknowledge or
to deal with it
The ongoing tariff dispute between the U.S. and China is a testament to the first point. While there is
much political posturing, the strategic rationale for the tariff conflict may well lie in two ideological
and systemic differences.
Firstly, most post-war U.S. administrations have engaged in global interventionist policies, while China has
continued to pursue its policy of ‘non-interference in the domestic affairs of other countries’. Secondly, the
American conviction is that government stays out of the business arena, while state-owned enterprises in
China account for 30%-40% of Chinese Gross Domestic Product (GDP).
Several decades of pursuing these policies have resulted in imbalances that endanger the friendly
coexistence of the two most successful political and macroeconomic systems since World War II.
In an apparent paradox, the U.S. can lay claim to the world’s most thriving economy on one hand, and the
most indebted government on the other. The National Debt is due, in no small part, to the U.S. providing
global security and military support services in the name of upholding the democratic order. In current day,
the United States government has become the world’s largest debtor, relying on the world’s largest
creditor and its principal lender, China, to provide continuously increasing amounts of funding. Hindsight
suggests that this was a tenable situation so long as the American economy was much bigger than the
Chinese economy in absolute terms, but the last two years have seen increased friction between the world’s
leading economic superpowers.
The key driver of the American economy has always been innovation and creativity, both of which require
robust safeguarding of intellectual property (IP) to deliver a sustained competitive advantage. At the point
in time where China’s GDP is threatening to eclipse that of the U.S., Chinese infringement of American
IP has become the battle-cry for a critical mission: defend the economic status quo, with all else up for
renegotiation. Adding further pressure to the American economic outlook, Chinese state-owned enterprises
(SOE) have been on a global acquisition spree, cleverly navigating the laissez-faire capital markets of the
West to gain control of strategically important technologies, raw materials and market access.
The inevitable American response, such as the imposition of trade tariffs, more stringent CFIUS intervention
in SOE-driven mergers and acquisitions, and intensified U.S. efforts to denuclearise the Korean peninsula,
has increased global volatility and taken over the centrestage of global newswires.
Much has been written about income inequality, not only within the U.S. and Europe, but also between
regional neighbours such as the European border states and the Middle East North Africa (MENA) region. A
deep sense of disillusionment seems to have taken hold of large parts of the developed world, leading to
irrational outcomes at the ballot box and, as seen recently in France, demonstrations and street protests. The
migratory forces originating from the MENA region into Europe are a source of much anxiety for large tracts
of the European Union (EU) population, and threaten the prevailing mindset of tolerance and acceptance.
As to my third point on climate change: At the 2018 World Economic Forum (WEF) in Davos, Sir David
Attenborough, famed broadcaster and natural historian, warned that human activity has brought about the
end of climatic stability. To quote: “If people can truly understand what is at stake, I believe they will give
permission for business and governments to get on with the practical solutions. Get it right, and humans
can create a world with clean air and water, unlimited energy and sustainable fish stocks, but only if decisive
action is taken now.” A WEF survey taken just prior to the event showed that environmental threats are
now the biggest danger to the global economy i.
How do these developments impact Halcyon Agri and the global market for natural rubber?
The outlined shifts in geopolitical agendas and voter consciences may well bring to an end this current
era of Globalisation. Instead, key indicators point towards a resurgence in national security awareness, for
instance of the high risk of a supply disruption for a raw material of significant economic importance, such
as natural rubber. In September 2017, the European Commission identified natural rubber as a critical raw
material for the European Unionii.
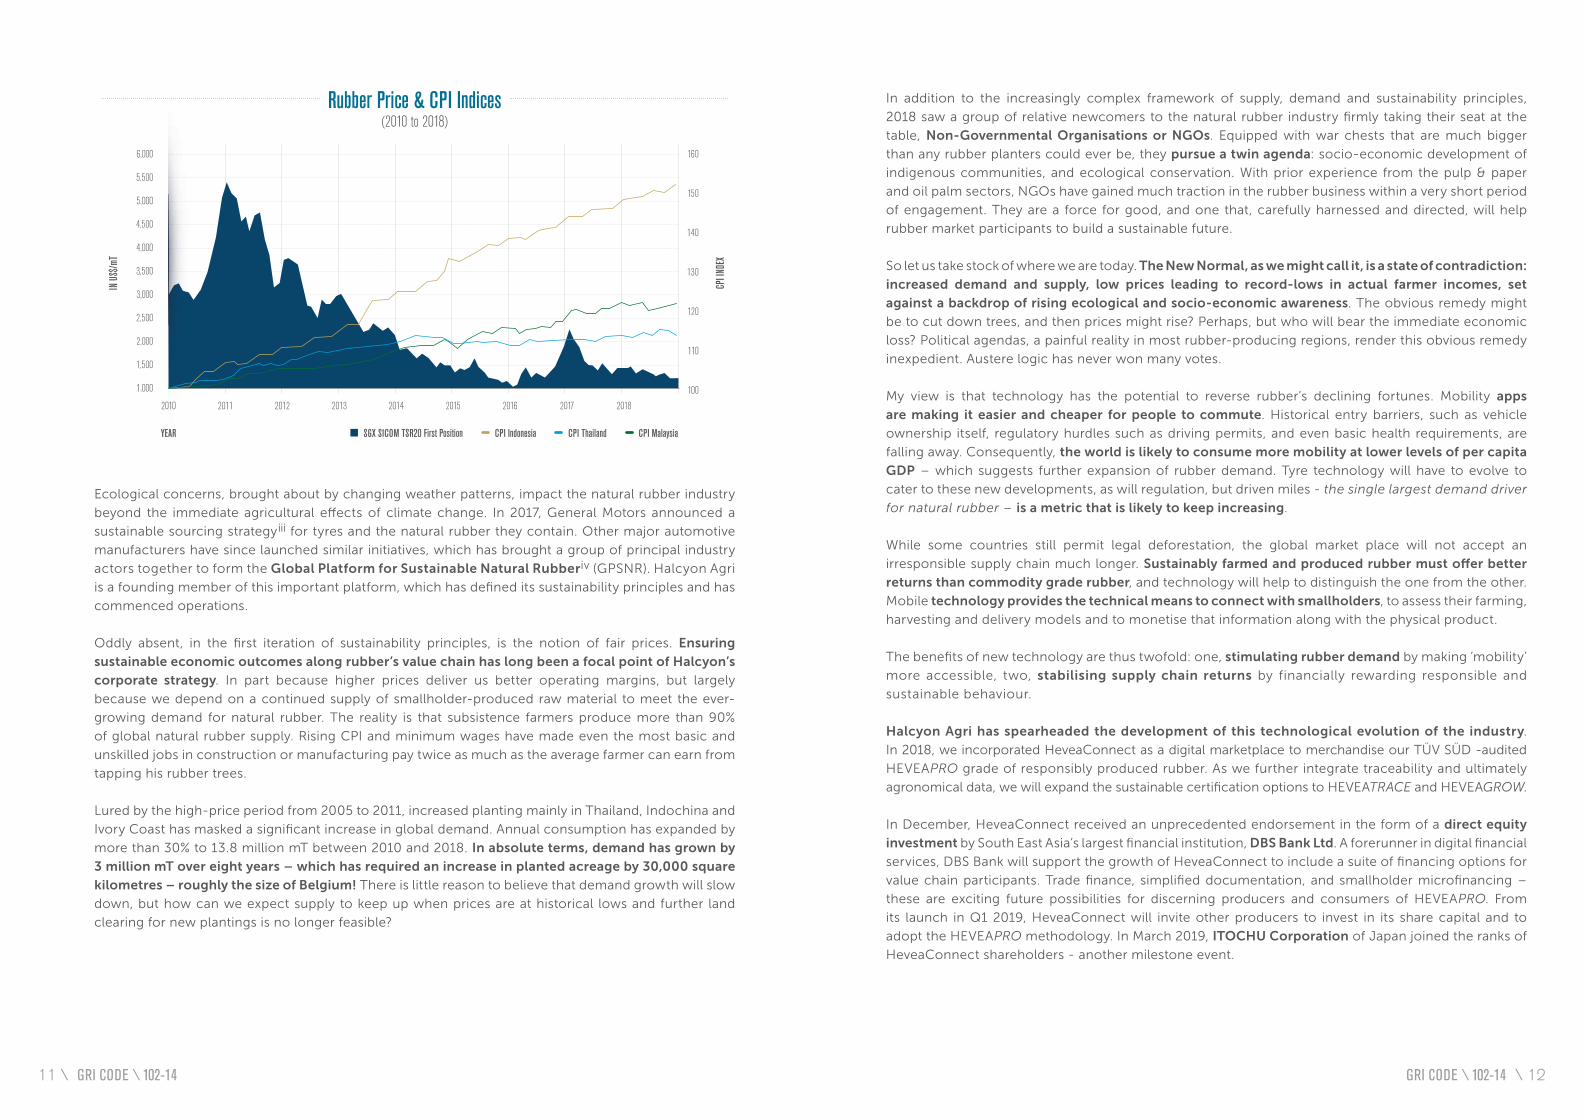
Furthermore, an inconvenient, but very real truth is that the technology and low-interest-rate driven
economic cycle of the last 10 years has failed to deliver a sustainable price environment for key crops
such as natural rubber. While global asset prices and capital market pricing benchmarks have doubled,
even trebled, rubber prices have tumbled. Farmers who planted rubber trees during the high-price period
of 2005-2011, have had to realise that this has been a poor investment, thus far. Without exception, all
origins of natural rubber have experienced significant consumer price inflation (CPI) over the last 10
years, which has caused labour costs to more than double in Indonesia, for example. This is in stark contrast
to the FOB price of natural rubber, which remains locked 40% below the 10-year average price!
By Robert Meyer
GRI CODE \ 102-14 GRI CODE \ 102-1409 \ \ 10
6,000
5,500
5,000
4,500
4,000
3,500
3,000
2,500
2,000
1,500
1,000
160
150
140
130
120
110
100
2010 2014
YEAR
IN U
S$/m
T
CPI I
NDEX
2012 20162011 20152013 2017 2018
SGX SICOM TSR20 First Position CPI Indonesia CPI Thailand CPI Malaysia
Rubber Price & CPI Indices(2010 to 2018)
In addition to the increasingly complex framework of supply, demand and sustainability principles,
2018 saw a group of relative newcomers to the natural rubber industry firmly taking their seat at the
table, Non-Governmental Organisations or NGOs. Equipped with war chests that are much bigger
than any rubber planters could ever be, they pursue a twin agenda: socio-economic development of
indigenous communities, and ecological conservation. With prior experience from the pulp & paper
and oil palm sectors, NGOs have gained much traction in the rubber business within a very short period
of engagement. They are a force for good, and one that, carefully harnessed and directed, will help
rubber market participants to build a sustainable future.
So let us take stock of where we are today. The New Normal, as we might call it, is a state of contradiction:
increased demand and supply, low prices leading to record-lows in actual farmer incomes, set
against a backdrop of rising ecological and socio-economic awareness. The obvious remedy might
be to cut down trees, and then prices might rise? Perhaps, but who will bear the immediate economic
loss? Political agendas, a painful reality in most rubber-producing regions, render this obvious remedy
inexpedient. Austere logic has never won many votes.
My view is that technology has the potential to reverse rubber’s declining fortunes. Mobility apps
are making it easier and cheaper for people to commute. Historical entry barriers, such as vehicle
ownership itself, regulatory hurdles such as driving permits, and even basic health requirements, are
falling away. Consequently, the world is likely to consume more mobility at lower levels of per capita
GDP – which suggests further expansion of rubber demand. Tyre technology will have to evolve to
cater to these new developments, as will regulation, but driven miles - the single largest demand driver
for natural rubber – is a metric that is likely to keep increasing.
While some countries still permit legal deforestation, the global market place will not accept an
irresponsible supply chain much longer. Sustainably farmed and produced rubber must offer better
returns than commodity grade rubber, and technology will help to distinguish the one from the other.
Mobile technology provides the technical means to connect with smallholders, to assess their farming,
harvesting and delivery models and to monetise that information along with the physical product.
The benefits of new technology are thus twofold: one, stimulating rubber demand by making ‘mobility’
more accessible, two, stabilising supply chain returns by financially rewarding responsible and
sustainable behaviour.
Halcyon Agri has spearheaded the development of this technological evolution of the industry.
In 2018, we incorporated HeveaConnect as a digital marketplace to merchandise our TÜV SÜD -audited
HEVEAPRO grade of responsibly produced rubber. As we further integrate traceability and ultimately
agronomical data, we will expand the sustainable certification options to HEVEATRACE and HEVEAGROW.
In December, HeveaConnect received an unprecedented endorsement in the form of a direct equity
investment by South East Asia’s largest financial institution, DBS Bank Ltd. A forerunner in digital financial
services, DBS Bank will support the growth of HeveaConnect to include a suite of financing options for
value chain participants. Trade finance, simplified documentation, and smallholder microfinancing –
these are exciting future possibilities for discerning producers and consumers of HEVEAPRO. From
its launch in Q1 2019, HeveaConnect will invite other producers to invest in its share capital and to
adopt the HEVEAPRO methodology. In March 2019, ITOCHU Corporation of Japan joined the ranks of
HeveaConnect shareholders - another milestone event.
Ecological concerns, brought about by changing weather patterns, impact the natural rubber industry
beyond the immediate agricultural effects of climate change. In 2017, General Motors announced a
sustainable sourcing strategyiii for tyres and the natural rubber they contain. Other major automotive
manufacturers have since launched similar initiatives, which has brought a group of principal industry
actors together to form the Global Platform for Sustainable Natural Rubberiv (GPSNR). Halcyon Agri
is a founding member of this important platform, which has defined its sustainability principles and has
commenced operations.
Oddly absent, in the first iteration of sustainability principles, is the notion of fair prices. Ensuring
sustainable economic outcomes along rubber’s value chain has long been a focal point of Halcyon’s
corporate strategy. In part because higher prices deliver us better operating margins, but largely
because we depend on a continued supply of smallholder-produced raw material to meet the ever-
growing demand for natural rubber. The reality is that subsistence farmers produce more than 90%
of global natural rubber supply. Rising CPI and minimum wages have made even the most basic and
unskilled jobs in construction or manufacturing pay twice as much as the average farmer can earn from
tapping his rubber trees.
Lured by the high-price period from 2005 to 2011, increased planting mainly in Thailand, Indochina and
Ivory Coast has masked a significant increase in global demand. Annual consumption has expanded by
more than 30% to 13.8 million mT between 2010 and 2018. In absolute terms, demand has grown by
3 million mT over eight years – which has required an increase in planted acreage by 30,000 square
kilometres – roughly the size of Belgium! There is little reason to believe that demand growth will slow
down, but how can we expect supply to keep up when prices are at historical lows and further land
clearing for new plantings is no longer feasible?
GRI CODE \ 102-14 GRI CODE \ 102-1411 \ \ 12
This pressure on the rubber futures markets has caused problems in traditional origins, where production
costs tend to be higher. Compounded by the distorting effects of misguided policy responses, the
persistent low prices are now having an adverse impact on the replanting of old rubber trees in
Indonesia, Malaysia and Southern Thailand. Public perception is that natural rubber is an oversupplied
commodity, when, in effect, this is not the case. There may well be too much NTO rubber, but supply
from traditional, homologated origins is increasingly tight.
To conclude, Halcyon Agri is prepared for the challenges that lie ahead. Our HeveaConnect initiative
is both timely and necessary. By opening the HEVEAPRO, HEVEATRACE and HEVEAGROW sustainability
standards to third-party producers, we have equipped the natural rubber market with a tool to
differentiate pricing and reward responsible behaviour. The vast majority of our assets are strategically
well placed and will provide us with dependable income as we decouple from the pricing vagaries
of the futures markets. Finally, we have a clear and actionable plan to delever our balance sheet and
unlock significant amounts of trapped value for our shareholders.
At this point, I would like to thank all members of the Halcyon Agri family for their hard work and
dedication. My sincere appreciation extends to our esteemed Board Members, our Joint-venture Partners,
our bankers and all other external stakeholders for their unwavering support. 2018 was a disappointing
year financially, but I can assure you that the best is yet to come.
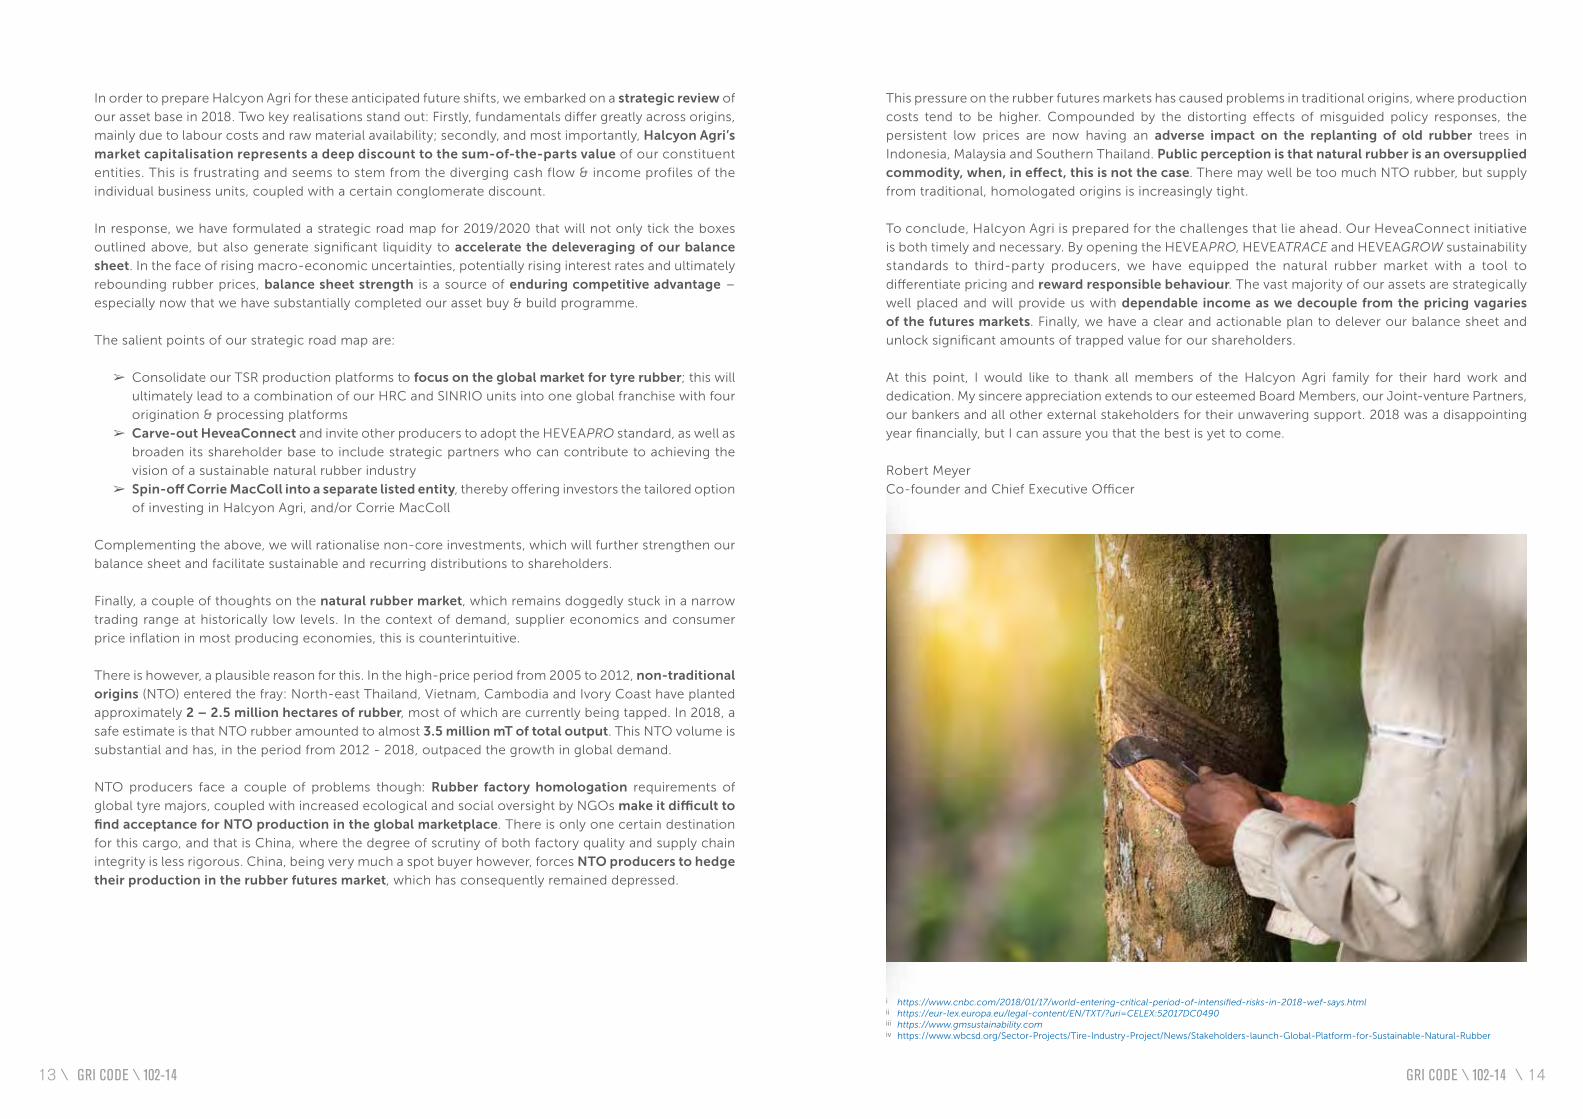
Robert Meyer
Co-founder and Chief Executive Officer
In order to prepare Halcyon Agri for these anticipated future shifts, we embarked on a strategic review of
our asset base in 2018. Two key realisations stand out: Firstly, fundamentals differ greatly across origins,
mainly due to labour costs and raw material availability; secondly, and most importantly, Halcyon Agri’s
market capitalisation represents a deep discount to the sum-of-the-parts value of our constituent
entities. This is frustrating and seems to stem from the diverging cash flow & income profiles of the
individual business units, coupled with a certain conglomerate discount.
In response, we have formulated a strategic road map for 2019/2020 that will not only tick the boxes
outlined above, but also generate significant liquidity to accelerate the deleveraging of our balance
sheet. In the face of rising macro-economic uncertainties, potentially rising interest rates and ultimately
rebounding rubber prices, balance sheet strength is a source of enduring competitive advantage –
especially now that we have substantially completed our asset buy & build programme.
The salient points of our strategic road map are:
➢ Consolidate our TSR production platforms to focus on the global market for tyre rubber; this will
ultimately lead to a combination of our HRC and SINRIO units into one global franchise with four
origination & processing platforms
➢ Carve-out HeveaConnect and invite other producers to adopt the HEVEAPRO standard, as well as
broaden its shareholder base to include strategic partners who can contribute to achieving the
vision of a sustainable natural rubber industry
➢ Spin-off Corrie MacColl into a separate listed entity, thereby offering investors the tailored option
of investing in Halcyon Agri, and/or Corrie MacColl
Complementing the above, we will rationalise non-core investments, which will further strengthen our
balance sheet and facilitate sustainable and recurring distributions to shareholders.
Finally, a couple of thoughts on the natural rubber market, which remains doggedly stuck in a narrow
trading range at historically low levels. In the context of demand, supplier economics and consumer
price inflation in most producing economies, this is counterintuitive.
There is however, a plausible reason for this. In the high-price period from 2005 to 2012, non-traditional
origins (NTO) entered the fray: North-east Thailand, Vietnam, Cambodia and Ivory Coast have planted
approximately 2 – 2.5 million hectares of rubber, most of which are currently being tapped. In 2018, a
safe estimate is that NTO rubber amounted to almost 3.5 million mT of total output. This NTO volume is
substantial and has, in the period from 2012 - 2018, outpaced the growth in global demand.
NTO producers face a couple of problems though: Rubber factory homologation requirements of
global tyre majors, coupled with increased ecological and social oversight by NGOs make it difficult to
find acceptance for NTO production in the global marketplace. There is only one certain destination
for this cargo, and that is China, where the degree of scrutiny of both factory quality and supply chain
integrity is less rigorous. China, being very much a spot buyer however, forces NTO producers to hedge
their production in the rubber futures market, which has consequently remained depressed.
GRI CODE \ 102-14 GRI CODE \ 102-14
i https://www.cnbc.com/2018/01/17/world-entering-critical-period-of-intensified-risks-in-2018-wef-says.htmlii https://eur-lex.europa.eu/legal-content/EN/TXT/?uri=CELEX:52017DC0490iii https://www.gmsustainability.comiv https://www.wbcsd.org/Sector-Projects/Tire-Industry-Project/News/Stakeholders-launch-Global-Platform-for-Sustainable-Natural-Rubber
13 \ \ 14
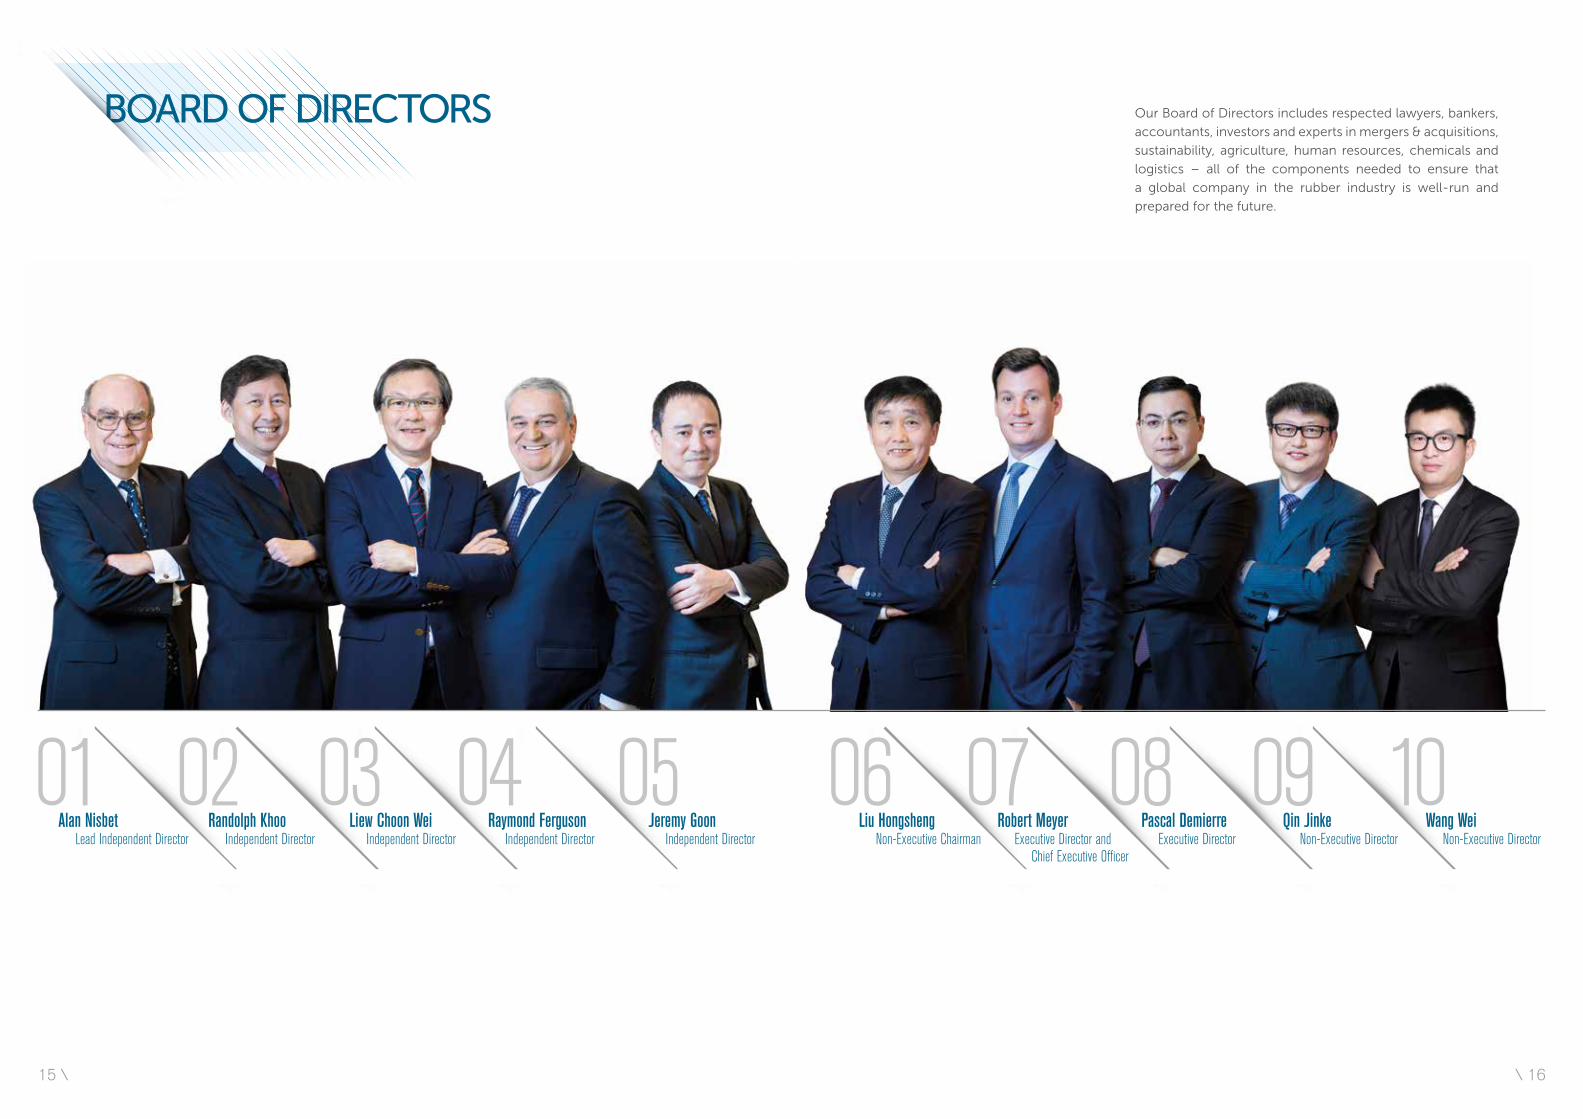
BOARD OF DIRECTORS
01Alan Nisbet Lead Independent Director
03Liew Choon Wei Independent Director
02Randolph Khoo Independent Director
05Jeremy Goon Independent Director
04Raymond Ferguson Independent Director
Our Board of Directors includes respected lawyers, bankers,
accountants, investors and experts in mergers & acquisitions,
sustainability, agriculture, human resources, chemicals and
logistics – all of the components needed to ensure that
a global company in the rubber industry is well-run and
prepared for the future.
07Robert Meyer Executive Director and Chief Executive Officer
09Qin Jinke Non-Executive Director
10Wang Wei Non-Executive Director
06Liu Hongsheng Non-Executive Chairman
08Pascal Demierre Executive Director
15 \ \ 16
Alan Nisbet Lead Independent Director01Mr Alan Nisbet is a highly experienced accountant and serves as Lead Independent Director and Chairman of
the Audit Committee. He joined the Board in 2013 and is also in the Remuneration, Nominating, and Strategy &
Investment Committees. His other current roles include:
• Principal at Kanni Advisory, a consultancy firm
• Independent Director and Chairman of the Audit Committee of Ascendas Property Trustee Pte Ltd (the Trustee-Manager of
Ascendas India Trust)
• Independent Director and a member of the Audit Committee and Remuneration Committee at KrisEnergy Limited
• Independent Director of Keppel REIT Management Limited (the Manager of Keppel REIT)
• Independent Director and Chairman of the Audit Committee at Standard Chartered Bank (Singapore) Limited
Mr Nisbet was a member of the Institute of Singapore Chartered Accountants until his retirement. He graduated
with a Diploma of Business Studies (Accounting) from the Caulfield Institute of Technology, Melbourne, Australia.
Randolph Khoo Independent Director02One of Singapore’s foremost lawyers, Mr Randolph Khoo is Independent Director and Chairman of the
Nominating Committee. He joined the Board in 2013 and is also part of the Audit and Remuneration Committees.
He is currently the Deputy Managing Director for Dispute Resolution at Drew & Napier LLC and also heads the
disputes practices of its China, India and International Trade Desks and Private Client Services Group. His other
current roles include:
• Advocate and Solicitor of the Supreme Court Singapore, a Notary Public and a Commissioner for Oaths
• Panel Arbitrator, Singapore Institute of Arbitrators and Law Society of Singapore Arbitration Scheme
• Panel Arbitrator, Shanghai Arbitration Commission, Shanghai International Economic and Trade Arbitration Commission
and Shenzhen Court of International Arbitration
• Panel Arbitrator, Kuala Lumpur Regional Centre for Arbitration and the Malaysian Institute of Arbitrators
• Panel Arbitrator, Chinese Arbitration Association, Taipei
• Panel Arbitrator, Institute of Modern Arbitration of the Russian Federation
• Panel Arbitrator (Foreign National), Indian Council of Arbitration
• Fellow of arbitral institutes of Singapore, Malaysia, Hong Kong, the UK, India and New Zealand
• Member of the International Bar Association, Society of International Law (Singapore), Law Society of Singapore and the
Singapore Academy of Law
Mr Khoo graduated with a Bachelor of Law from the National University of Singapore with various academic prizes.
Liew Choon Wei Independent Director03Mr Liew Choon Wei is Independent Director and Chairman of the Remuneration Committee. He was appointed
to the Board in 2014 and also sits on the Audit and Nominating Committees. He joined Ernst & Young LLP in
Singapore in 1979 and was Audit Partner for its largest real estate, commodities, banking, media, hospitality and
retail clients before retiring in 2013. His current roles include:
• Independent Director at Frasers Hospitality Asset Management Pte Ltd (manager of Frasers Hospitality Real Estate Investment
Trust) and Frasers Hospitality Trust Management Pte Ltd (trustee-manager of Frasers Hospitality Business Trust)
• Independent Director, Chairman of the Audit Committee and Nominating Committee and member of the Remuneration
Committee of F J Benjamin Holdings Ltd
• Independent Director at The Hour Glass Limited, Chairman of its Audit Committee and member of the Nominating and
Remuneration Committees
• Fellow Chartered Accountant of the Institute of Singapore Chartered Accountants
Raymond Ferguson Independent Director04An international banker with more than 20 years of senior management experience, Mr Raymond Ferguson is
Independent Director and Co-Chairman of the Strategy and Investment Committee. He joined the Board in
2016. He is also Founder and Chief Executive at Caber Partners Pte Ltd, a Singapore licensed fund manager,
Chairman of Singapore Life Pte Ltd, a Singapore life insurance company, Chairman of Youtap Ltd, a global mobile
payments firm, and a Non-Executive Director of LenndoEFl, an alternative data credit scoring, identity verification
and insights company. He is also Chairman of HeveaConnect Pte. Ltd., a digital marketplace for sustainable
natural rubber.
He previously served as:
• Regional Chief Executive Officer, Southeast Asia at Standard Chartered Bank
• Chief Executive Officer at Standard Chartered Bank (Singapore) Limited
• Chairman and Director of several Standard Chartered Bank’s subsidiary boards
• Executive Vice President and Group Chief Officer at Arab Banking Corporation, B.S.C.
Mr Ferguson is also:
• Associate of the Chartered Institute of Bankers in Scotland
• Distinguished Fellow of the Institute of Banking and Finance Singapore
• Member of the Singapore Institute of Directors
• Advisor, Singapore Institute for International Affairs
Mr Ferguson holds a master’s degree in Business Administration from Henley Management College and Brunel University.
17 \ \ 18
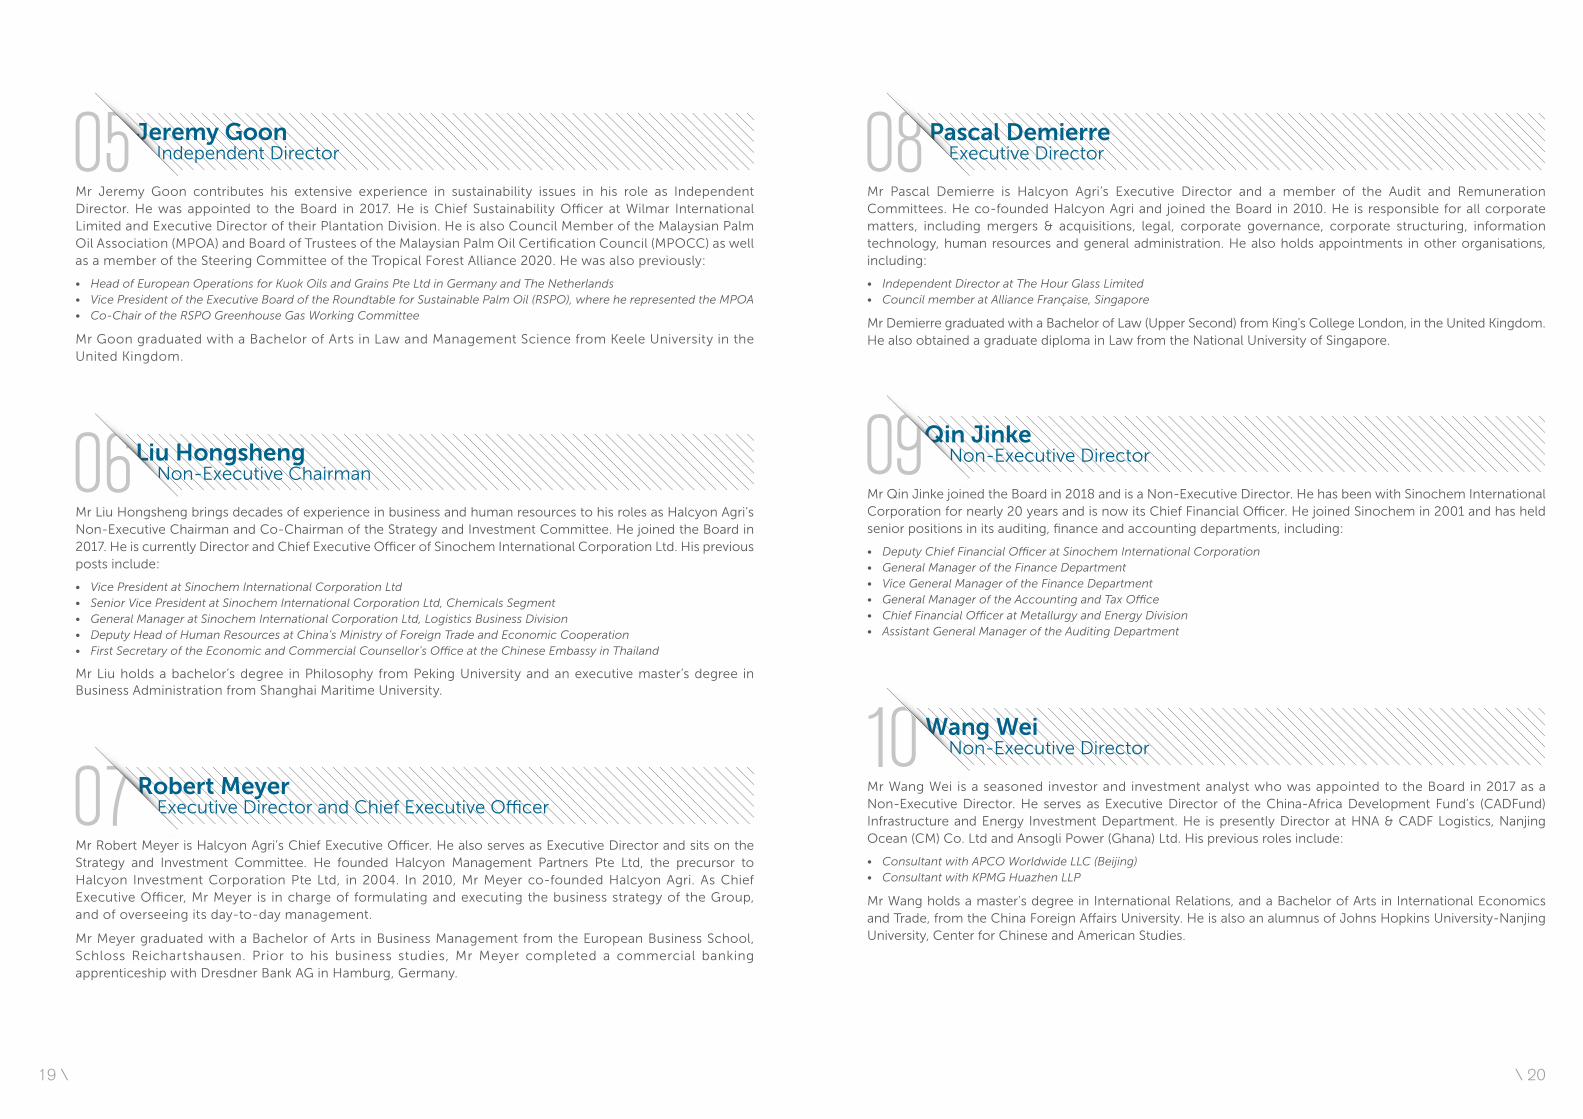
Jeremy Goon Independent Director05Mr Jeremy Goon contributes his extensive experience in sustainability issues in his role as Independent Director. He was appointed to the Board in 2017. He is Chief Sustainability Officer at Wilmar International Limited and Executive Director of their Plantation Division. He is also Council Member of the Malaysian Palm Oil Association (MPOA) and Board of Trustees of the Malaysian Palm Oil Certification Council (MPOCC) as well as a member of the Steering Committee of the Tropical Forest Alliance 2020. He was also previously:
• Head of European Operations for Kuok Oils and Grains Pte Ltd in Germany and The Netherlands• Vice President of the Executive Board of the Roundtable for Sustainable Palm Oil (RSPO), where he represented the MPOA• Co-Chair of the RSPO Greenhouse Gas Working Committee
Mr Goon graduated with a Bachelor of Arts in Law and Management Science from Keele University in the United Kingdom.
Liu Hongsheng Non-Executive Chairman06Mr Liu Hongsheng brings decades of experience in business and human resources to his roles as Halcyon Agri’s Non-Executive Chairman and Co-Chairman of the Strategy and Investment Committee. He joined the Board in 2017. He is currently Director and Chief Executive Officer of Sinochem International Corporation Ltd. His previous posts include:
• Vice President at Sinochem International Corporation Ltd• Senior Vice President at Sinochem International Corporation Ltd, Chemicals Segment• General Manager at Sinochem International Corporation Ltd, Logistics Business Division• Deputy Head of Human Resources at China’s Ministry of Foreign Trade and Economic Cooperation• First Secretary of the Economic and Commercial Counsellor’s Office at the Chinese Embassy in Thailand
Mr Liu holds a bachelor’s degree in Philosophy from Peking University and an executive master’s degree in Business Administration from Shanghai Maritime University.
Robert Meyer Executive Director and Chief Executive Officer07Mr Robert Meyer is Halcyon Agri’s Chief Executive Officer. He also serves as Executive Director and sits on the Strategy and Investment Committee. He founded Halcyon Management Partners Pte Ltd, the precursor to Halcyon Investment Corporation Pte Ltd, in 2004. In 2010, Mr Meyer co-founded Halcyon Agri. As Chief Executive Officer, Mr Meyer is in charge of formulating and executing the business strategy of the Group, and of overseeing its day-to-day management.
Mr Meyer graduated with a Bachelor of Arts in Business Management from the European Business School, Schloss Reichartshausen. Prior to his business studies, Mr Meyer completed a commercial banking apprenticeship with Dresdner Bank AG in Hamburg, Germany.
Pascal Demierre Executive Director08Mr Pascal Demierre is Halcyon Agri’s Executive Director and a member of the Audit and Remuneration Committees. He co-founded Halcyon Agri and joined the Board in 2010. He is responsible for all corporate matters, including mergers & acquisitions, legal, corporate governance, corporate structuring, information technology, human resources and general administration. He also holds appointments in other organisations, including:
• Independent Director at The Hour Glass Limited• Council member at Alliance Française, Singapore
Mr Demierre graduated with a Bachelor of Law (Upper Second) from King’s College London, in the United Kingdom. He also obtained a graduate diploma in Law from the National University of Singapore.
Qin Jinke Non-Executive Director09Mr Qin Jinke joined the Board in 2018 and is a Non-Executive Director. He has been with Sinochem International Corporation for nearly 20 years and is now its Chief Financial Officer. He joined Sinochem in 2001 and has held senior positions in its auditing, finance and accounting departments, including:
• Deputy Chief Financial Officer at Sinochem International Corporation• General Manager of the Finance Department• Vice General Manager of the Finance Department• General Manager of the Accounting and Tax Office• Chief Financial Officer at Metallurgy and Energy Division• Assistant General Manager of the Auditing Department
Wang Wei Non-Executive Director10Mr Wang Wei is a seasoned investor and investment analyst who was appointed to the Board in 2017 as a Non-Executive Director. He serves as Executive Director of the China-Africa Development Fund’s (CADFund) Infrastructure and Energy Investment Department. He is presently Director at HNA & CADF Logistics, Nanjing Ocean (CM) Co. Ltd and Ansogli Power (Ghana) Ltd. His previous roles include:
• Consultant with APCO Worldwide LLC (Beijing)• Consultant with KPMG Huazhen LLP
Mr Wang holds a master’s degree in International Relations, and a Bachelor of Arts in International Economics and Trade, from the China Foreign Affairs University. He is also an alumnus of Johns Hopkins University-Nanjing University, Center for Chinese and American Studies.
19 \ \ 20
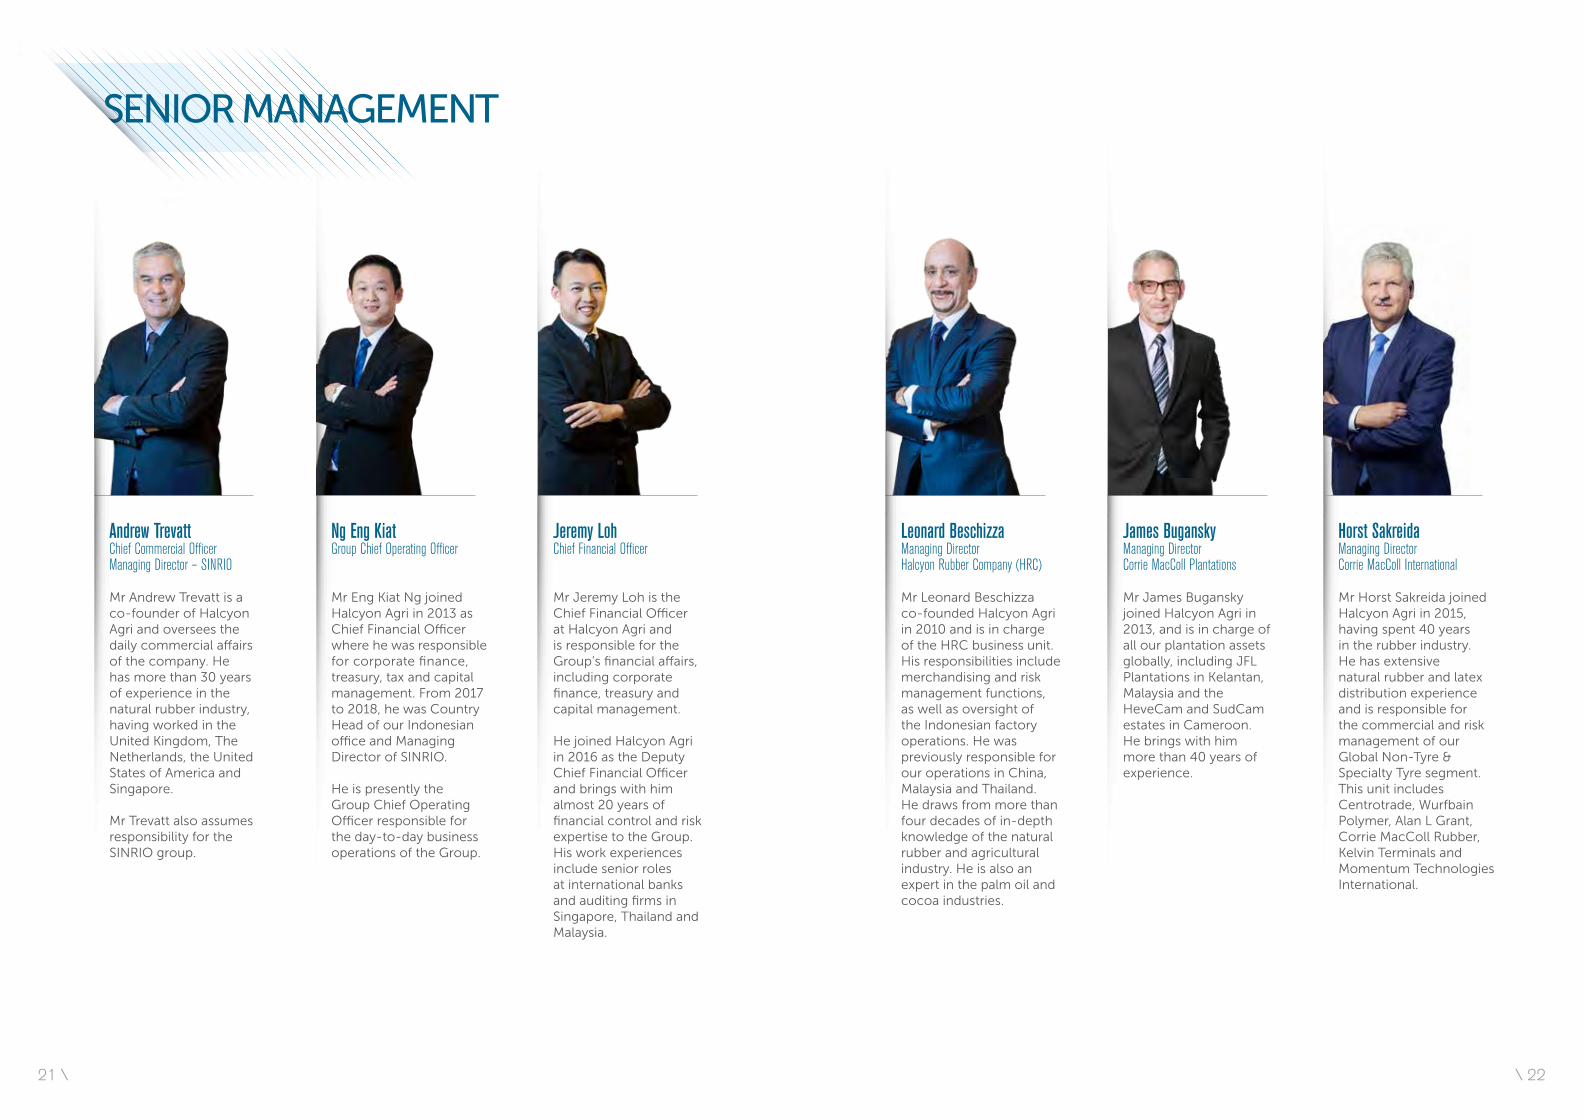
Andrew TrevattChief Commercial OfficerManaging Director – SINRIO
Mr Andrew Trevatt is a co-founder of Halcyon Agri and oversees the daily commercial affairs of the company. He has more than 30 years of experience in the natural rubber industry, having worked in the United Kingdom, The Netherlands, the United States of America and Singapore.
Mr Trevatt also assumes responsibility for the SINRIO group.
Ng Eng KiatGroup Chief Operating Officer
Mr Eng Kiat Ng joined Halcyon Agri in 2013 as Chief Financial Officer where he was responsible for corporate finance, treasury, tax and capital management. From 2017 to 2018, he was Country Head of our Indonesian office and Managing Director of SINRIO.
He is presently the Group Chief Operating Officer responsible for the day-to-day business operations of the Group.
Jeremy LohChief Financial Officer
Mr Jeremy Loh is the Chief Financial Officer at Halcyon Agri and is responsible for the Group’s financial affairs, including corporate finance, treasury and capital management.
He joined Halcyon Agri in 2016 as the Deputy Chief Financial Officer and brings with him almost 20 years of financial control and risk expertise to the Group. His work experiences include senior roles at international banks and auditing firms in Singapore, Thailand and Malaysia.
Horst SakreidaManaging DirectorCorrie MacColl International
Mr Horst Sakreida joined Halcyon Agri in 2015, having spent 40 years in the rubber industry. He has extensive natural rubber and latex distribution experience and is responsible for the commercial and risk management of our Global Non-Tyre & Specialty Tyre segment. This unit includes Centrotrade, Wurfbain Polymer, Alan L Grant, Corrie MacColl Rubber, Kelvin Terminals and Momentum Technologies International.
James BuganskyManaging Director Corrie MacColl Plantations
Mr James Bugansky joined Halcyon Agri in 2013, and is in charge of all our plantation assets globally, including JFL Plantations in Kelantan, Malaysia and the HeveCam and SudCam estates in Cameroon. He brings with him more than 40 years of experience.
Leonard BeschizzaManaging Director Halcyon Rubber Company (HRC)
Mr Leonard Beschizza co-founded Halcyon Agri in 2010 and is in charge of the HRC business unit. His responsibilities include merchandising and risk management functions, as well as oversight of the Indonesian factory operations. He was previously responsible for our operations in China, Malaysia and Thailand. He draws from more than four decades of in-depth knowledge of the natural rubber and agricultural industry. He is also an expert in the palm oil and cocoa industries.
SENIOR MANAGEMENT
21 \ \ 22
PLANTATIONS
REGIONALCHAMPION
NORTH AMERICA
REGIONALCHAMPION
SPECIALISED GLOBALTECHNICAL MARKETING
EUROPE NORTH AMERICA GLOBALCORRIE MACCOLL PLANTATIONSSYNTHETIC RUBBERNATURAL RUBBER & LATEX
LOGISTICSDISTRIBUTION LABORATORIES
Polymer
STRATEGIC SPOTLIGHT Corrie MacColl
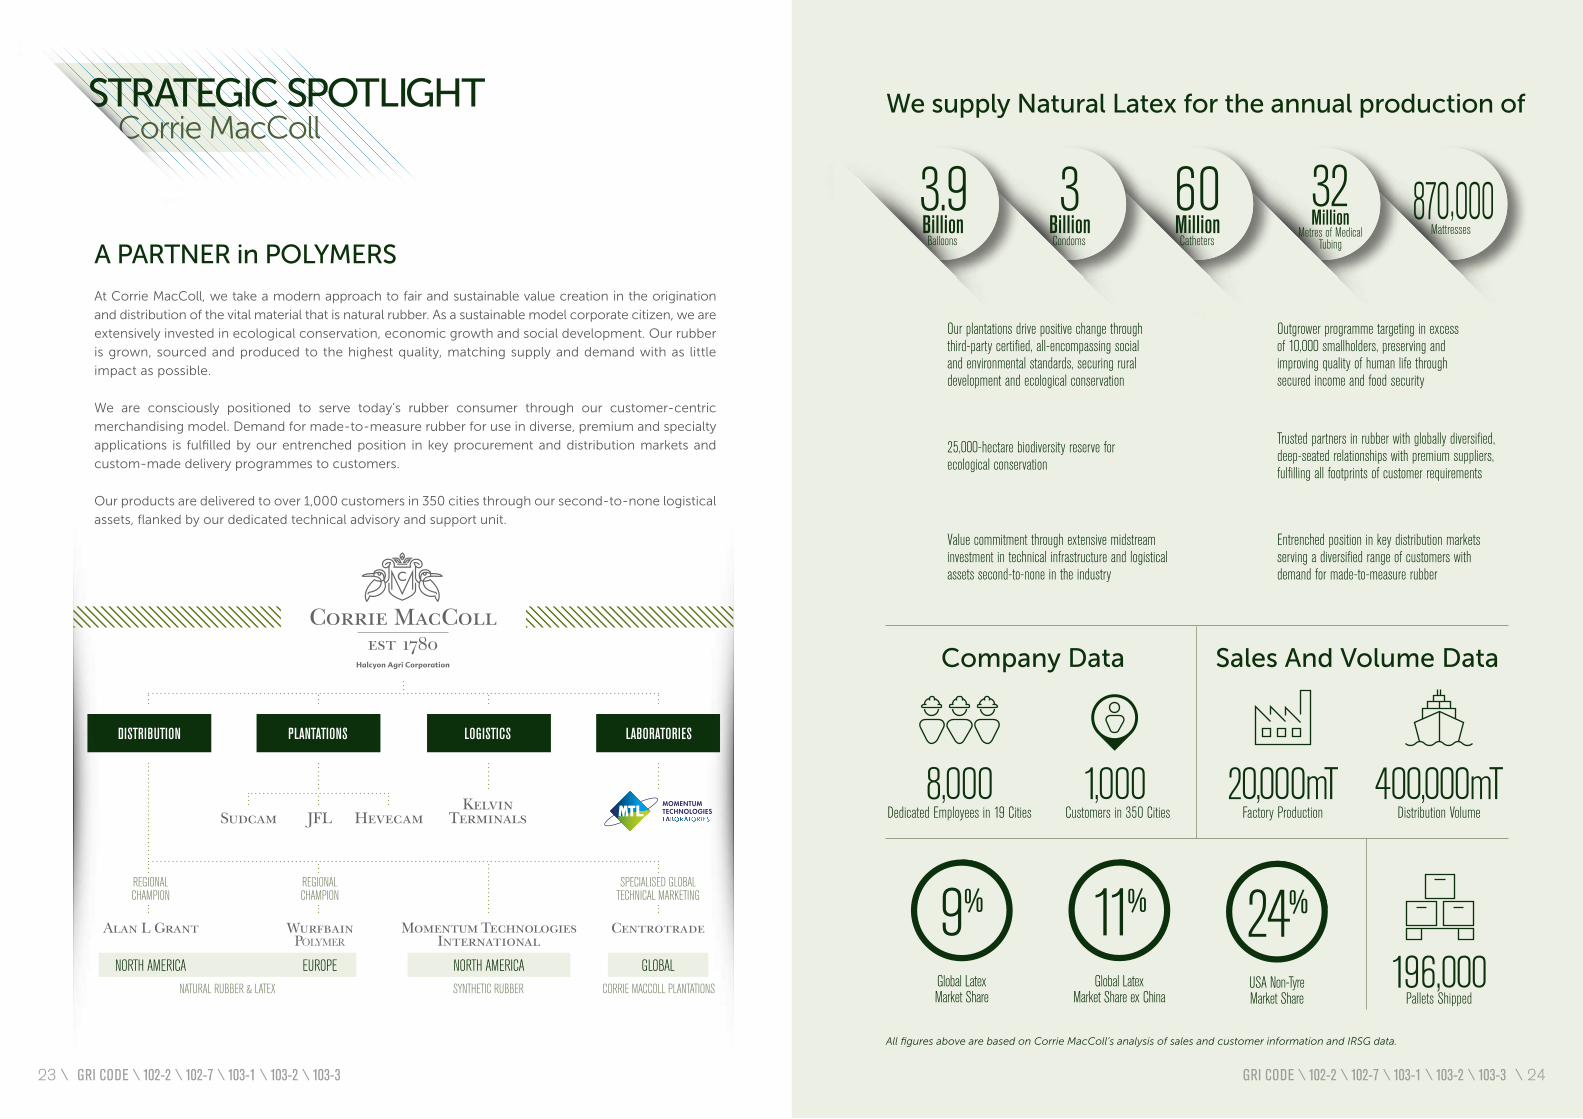
A PARTNER in POLYMERS
At Corrie MacColl, we take a modern approach to fair and sustainable value creation in the origination
and distribution of the vital material that is natural rubber. As a sustainable model corporate citizen, we are
extensively invested in ecological conservation, economic growth and social development. Our rubber
is grown, sourced and produced to the highest quality, matching supply and demand with as little
impact as possible.
We are consciously positioned to serve today’s rubber consumer through our customer-centric
merchandising model. Demand for made-to-measure rubber for use in diverse, premium and specialty
applications is fulfilled by our entrenched position in key procurement and distribution markets and
custom-made delivery programmes to customers.
Our products are delivered to over 1,000 customers in 350 cities through our second-to-none logistical
assets, flanked by our dedicated technical advisory and support unit.
We supply Natural Latex for the annual production of
All figures above are based on Corrie MacColl’s analysis of sales and customer information and IRSG data.
Global LatexMarket Share
9%
Global LatexMarket Share ex China
11%
USA Non-TyreMarket Share
24%
Outgrower programme targeting in excess of 10,000 smallholders, preserving and improving quality of human life through secured income and food security
Trusted partners in rubber with globally diversified, deep-seated relationships with premium suppliers, fulfilling all footprints of customer requirements
Entrenched position in key distribution markets serving a diversified range of customers with demand for made-to-measure rubber
Our plantations drive positive change through third-party certified, all-encompassing social and environmental standards, securing ruraldevelopment and ecological conservation
Value commitment through extensive midstream investment in technical infrastructure and logistical assets second-to-none in the industry
25,000-hectare biodiversity reserve for ecological conservation
870,000Mattresses
32Million
Metres of MedicalTubing
3.9 Billion
Balloons
3 Billion Condoms
60 Million Catheters
Sales And Volume Data
400,000mTDistribution Volume
20,000mTFactory Production
Company Data
1,000 Customers in 350 Cities
8,000Dedicated Employees in 19 Cities
GRI CODE \ 102-2 \ 102-7 \ 103-1 \ 103-2 \ 103-3 GRI CODE \ 102-2 \ 102-7 \ 103-1 \ 103-2 \ 103-3
196,000Pallets Shipped
23 \ \ 24
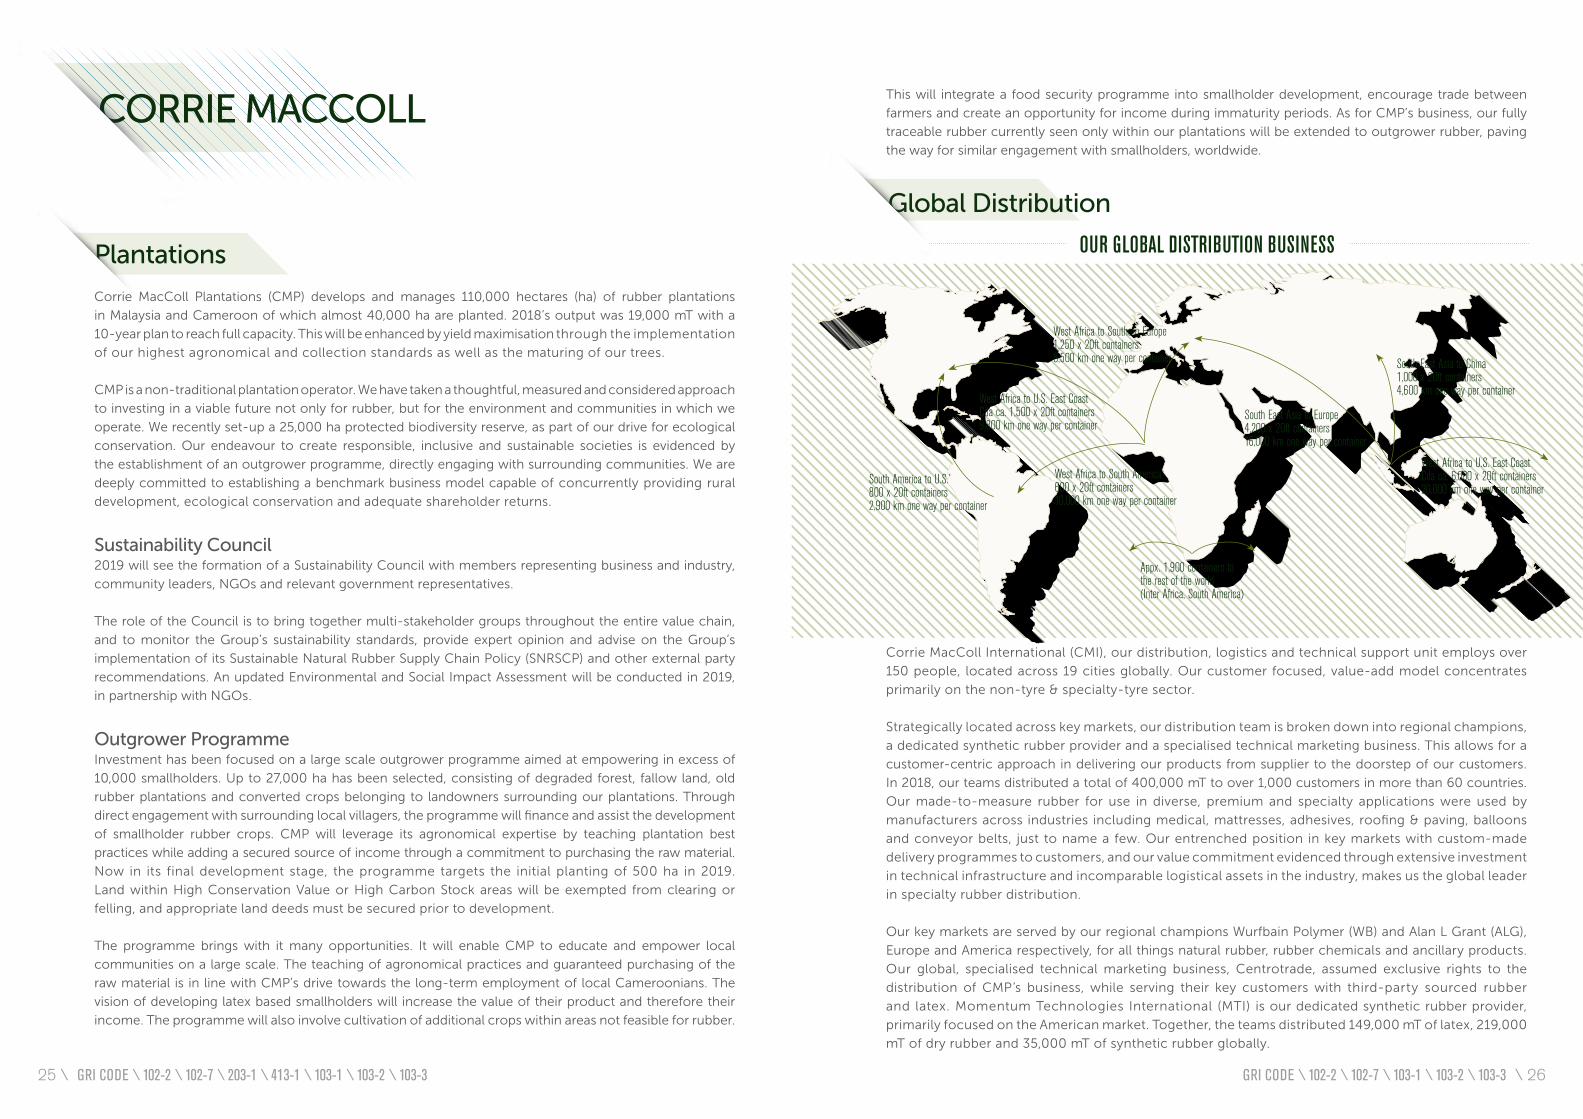
Appx. 1,900 containers tothe rest of the world(Inter Africa, South America)
South America to U.S.800 x 20ft containers2,900 km one way per container
South East Asia to Europe4,200 x 20ft containers16,000 km one way per container
West Africa to South America600 x 20ft containers10,000 km one way per container
West Africa to U.S. East CoastCda ca. 1,500 x 20ft containers9,800 km one way per container
West Africa to Southern Europe1,250 x 20ft containers8,500 km one way per container South East Asia to China
1,000 x 20ft containers4,600 km one way per container
West Africa to U.S. East CoastCda ca. 6,000 x 20ft containers20,000 km one way per container
OUR GLOBAL DISTRIBUTION BUSINESS
CORRIE MACCOLL
Plantations
Corrie MacColl Plantations (CMP) develops and manages 110,000 hectares (ha) of rubber plantations
in Malaysia and Cameroon of which almost 40,000 ha are planted. 2018’s output was 19,000 mT with a
10-year plan to reach full capacity. This will be enhanced by yield maximisation through the implementation
of our highest agronomical and collection standards as well as the maturing of our trees.
CMP is a non-traditional plantation operator. We have taken a thoughtful, measured and considered approach
to investing in a viable future not only for rubber, but for the environment and communities in which we
operate. We recently set-up a 25,000 ha protected biodiversity reserve, as part of our drive for ecological
conservation. Our endeavour to create responsible, inclusive and sustainable societies is evidenced by
the establishment of an outgrower programme, directly engaging with surrounding communities. We are
deeply committed to establishing a benchmark business model capable of concurrently providing rural
development, ecological conservation and adequate shareholder returns.
Sustainability Council2019 will see the formation of a Sustainability Council with members representing business and industry,
community leaders, NGOs and relevant government representatives.
The role of the Council is to bring together multi-stakeholder groups throughout the entire value chain,
and to monitor the Group’s sustainability standards, provide expert opinion and advise on the Group’s
implementation of its Sustainable Natural Rubber Supply Chain Policy (SNRSCP) and other external party
recommendations. An updated Environmental and Social Impact Assessment will be conducted in 2019,
in partnership with NGOs.
Outgrower ProgrammeInvestment has been focused on a large scale outgrower programme aimed at empowering in excess of
10,000 smallholders. Up to 27,000 ha has been selected, consisting of degraded forest, fallow land, old
rubber plantations and converted crops belonging to landowners surrounding our plantations. Through
direct engagement with surrounding local villagers, the programme will finance and assist the development
of smallholder rubber crops. CMP will leverage its agronomical expertise by teaching plantation best
practices while adding a secured source of income through a commitment to purchasing the raw material.
Now in its final development stage, the programme targets the initial planting of 500 ha in 2019.
Land within High Conservation Value or High Carbon Stock areas will be exempted from clearing or
felling, and appropriate land deeds must be secured prior to development.
The programme brings with it many opportunities. It will enable CMP to educate and empower local
communities on a large scale. The teaching of agronomical practices and guaranteed purchasing of the
raw material is in line with CMP’s drive towards the long-term employment of local Cameroonians. The
vision of developing latex based smallholders will increase the value of their product and therefore their
income. The programme will also involve cultivation of additional crops within areas not feasible for rubber.
This will integrate a food security programme into smallholder development, encourage trade between
farmers and create an opportunity for income during immaturity periods. As for CMP’s business, our fully
traceable rubber currently seen only within our plantations will be extended to outgrower rubber, paving
the way for similar engagement with smallholders, worldwide.
Global Distribution
Corrie MacColl International (CMI), our distribution, logistics and technical support unit employs over
150 people, located across 19 cities globally. Our customer focused, value-add model concentrates
primarily on the non-tyre & specialty-tyre sector.
Strategically located across key markets, our distribution team is broken down into regional champions,
a dedicated synthetic rubber provider and a specialised technical marketing business. This allows for a
customer-centric approach in delivering our products from supplier to the doorstep of our customers.
In 2018, our teams distributed a total of 400,000 mT to over 1,000 customers in more than 60 countries.
Our made-to-measure rubber for use in diverse, premium and specialty applications were used by
manufacturers across industries including medical, mattresses, adhesives, roofing & paving, balloons
and conveyor belts, just to name a few. Our entrenched position in key markets with custom-made
delivery programmes to customers, and our value commitment evidenced through extensive investment
in technical infrastructure and incomparable logistical assets in the industry, makes us the global leader
in specialty rubber distribution.
Our key markets are served by our regional champions Wurfbain Polymer (WB) and Alan L Grant (ALG),
Europe and America respectively, for all things natural rubber, rubber chemicals and ancillary products.
Our global, specialised technical marketing business, Centrotrade, assumed exclusive rights to the
distribution of CMP’s business, while serving their key customers with third-party sourced rubber
and latex. Momentum Technologies International (MTI) is our dedicated synthetic rubber provider,
primarily focused on the American market. Together, the teams distributed 149,000 mT of latex, 219,000
mT of dry rubber and 35,000 mT of synthetic rubber globally.
GRI CODE \ 102-2 \ 102-7 \ 203-1 \ 413-1 \ 103-1 \ 103-2 \ 103-3 GRI CODE \ 102-2 \ 102-7 \ 103-1 \ 103-2 \ 103-325 \ \ 26
In 2018, CMI accounted for over 20,000 container deliveries. Our centrally managed logistics department
oversees product transfer from point of origination to customer delivery. In our target markets,
we have a suite of network services to meet the diverse requirements of our clients.
Kelvin Terminals, our natural and synthetic latex storage terminal located in the Terneuzen, Netherlands, is
Europe’s leading tank installation, with capacity to hold up to 6,500 mT. Our strategic positioning means
just-in-time delivery to the Benelux Union in under 24 hours, and the remainder of Europe in under
72 hours.
Our American latex customers are served by three latex terminals strategically located in Baltimore
(1,900 mT), Norfolk (1,200 mT) and Savannah (2,300 mT). To support our dry rubber distribution, we
operate a dedicated warehouse in Richmond, Virgina with 2,600 mT capacity and a 150 mT hot room
used to bring any rubber delivered during winter months, back to optimum temperature.
The last addition to our support services is Momentum Technologies Laboratories (MTL). This year, US$1
million was committed to expanding the existing synthetic rubber facility in Akron through an investment in
a natural rubber and latex laboratory. With our dedicated and centralised technical advisory and support unit,
the state-of-the-art facility has the capabilities to formulate, design and test rubber, provide certification
of analysis as well as custom mix compounds. Being third-party accredited by A2LA allows for peace of
mind and confidence for customers and stakeholders that all results are held to a higher standard and kept
in complete confidence. Having the laboratory is key to supporting the full gamut of technical services for
our partners.
Solar Power ProjectKelvin Terminals is currently undergoing a capacity expansion of 50% and refurbishment of the office
and laboratory complex. At the same time, the terminal is taking the opportunity to dramatically reduce its
carbon footprint through investment in photo-voltaic solar panels to generate its own electricity, and also
in air-source heat pumps to cut its dependence on diesel as the main source of heating for both the latex
storage tanks and the site office and laboratory complex.
126 solar panels are being installed on the roof of the new tank hall, with a predicted output capacity
of 51,000 kWh per annum. On completion of the project in early 2019, the terminal will be capable of
producing close to 100% of the electrical energy required to power all site operations. At the same time
the existing diesel oil fuelled boiler, which provides heat to maintain the temperature of the latex in the
terminal, will be replaced by a series of air-source heat pumps. Powered by our renewable solar energy,
these will completely eliminate our dependence on fossil fuels in Terneuzen. In terms of carbon footprint,
our emissions in 2019 are forecast to be reduced by 93% from 2017 and 2018 levels. As we increase our
imports from certified CO₂-neutral latex sources, our next target is to be able to maintain that carbon-
neutrality on delivery from our tank facilities, or even on a delivered customer basis.
Europe and America saw large volumes of 127,000 mT and 125,000 mT respectively. Across both
markets, our latex distribution saw a commanding market share, what we put down to our deep-
seated relationships with premium suppliers. In Asia, the majority of rubber delivered into the non-tyre
& specialty-tyre sector is purchased direct from suppliers. We delivered a total of 77,000 mT of which
the majority was latex (60,000 mT) and concentrated mainly in the China and Malaysia markets. Other
key destinations include Turkey, South Africa and South America, notably Brazil.
Logistics, Technical & Laboratories
GRI CODE \ 102-2 \ 102-7 \ 103-1 \ 103-2 \ 103-3 GRI CODE \ 102-2 \ 102-7 \ 103-1 \ 103-2 \ 103-327 \ \ 28
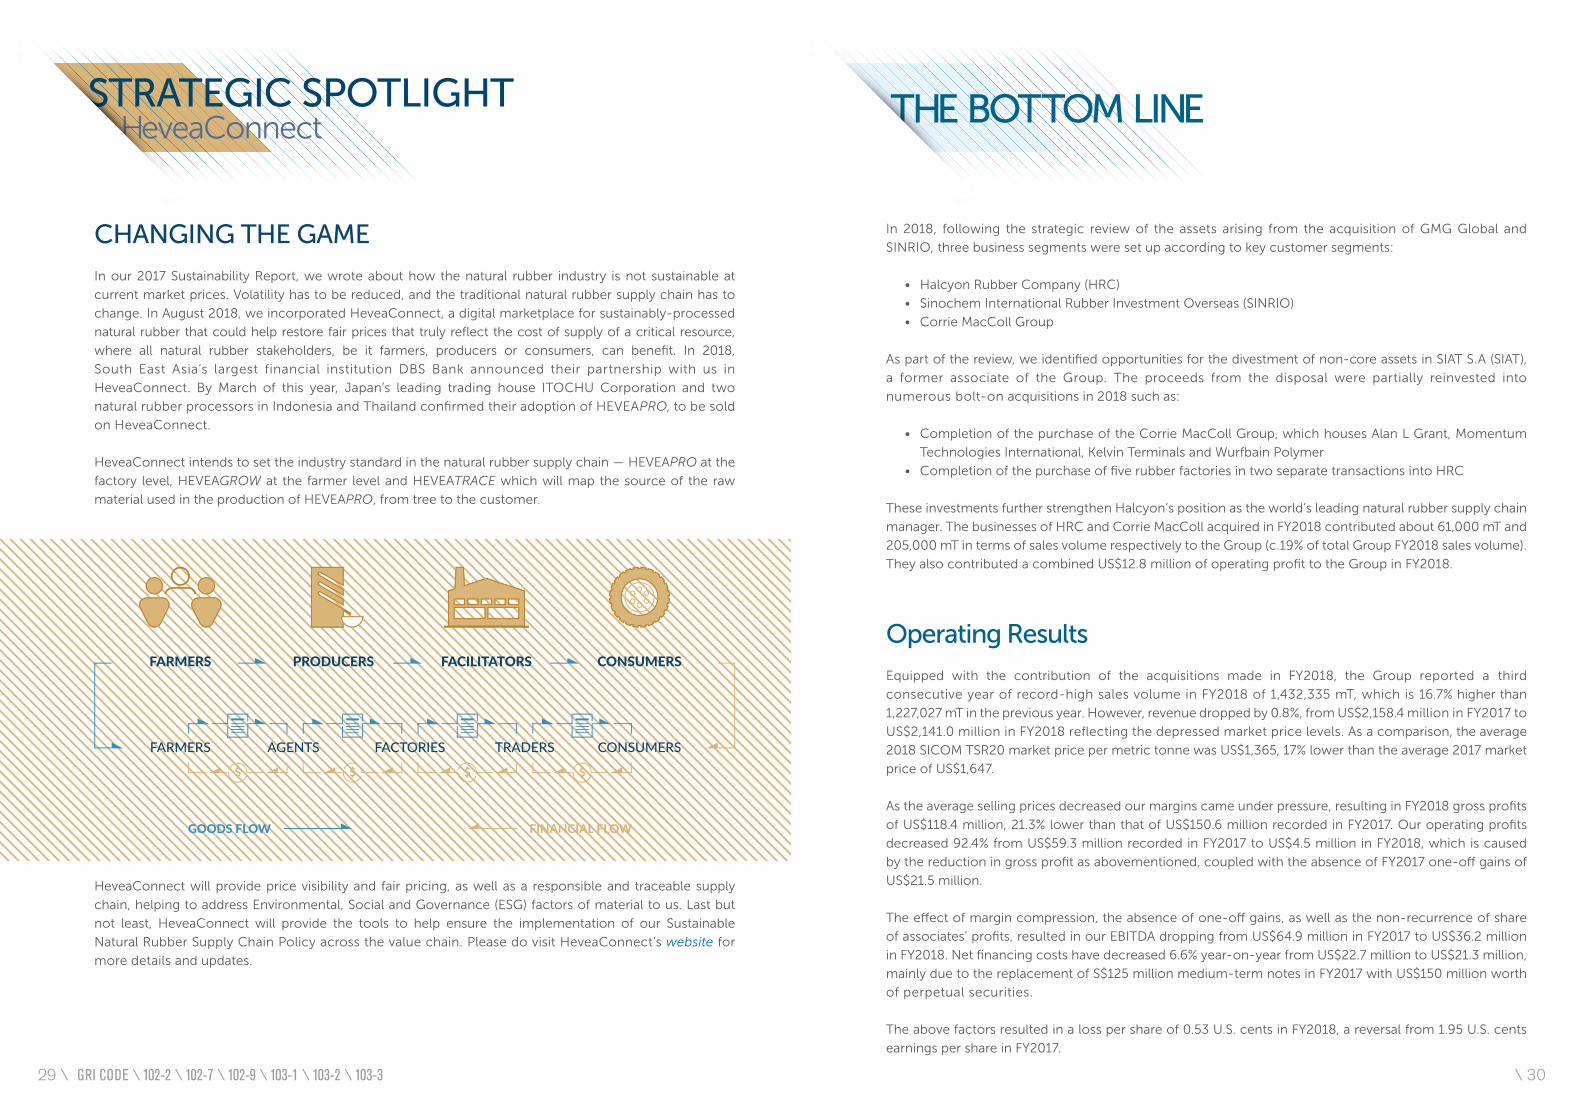
CHANGING THE GAME
In our 2017 Sustainability Report, we wrote about how the natural rubber industry is not sustainable at
current market prices. Volatility has to be reduced, and the traditional natural rubber supply chain has to
change. In August 2018, we incorporated HeveaConnect, a digital marketplace for sustainably-processed
natural rubber that could help restore fair prices that truly reflect the cost of supply of a critical resource,
where all natural rubber stakeholders, be it farmers, producers or consumers, can benefit. In 2018,
South East Asia’s largest financial institution DBS Bank announced their partnership with us in
HeveaConnect. By March of this year, Japan’s leading trading house ITOCHU Corporation and two
natural rubber processors in Indonesia and Thailand confirmed their adoption of HEVEAPRO, to be sold
on HeveaConnect.
HeveaConnect intends to set the industry standard in the natural rubber supply chain — HEVEAPRO at the
factory level, HEVEAGROW at the farmer level and HEVEATRACE which will map the source of the raw
material used in the production of HEVEAPRO, from tree to the customer.
STRATEGIC SPOTLIGHT HeveaConnect
HeveaConnect will provide price visibility and fair pricing, as well as a responsible and traceable supply
chain, helping to address Environmental, Social and Governance (ESG) factors of material to us. Last but
not least, HeveaConnect will provide the tools to help ensure the implementation of our Sustainable
Natural Rubber Supply Chain Policy across the value chain. Please do visit HeveaConnect’s website for
more details and updates.
THE BOTTOM LINE
In 2018, following the strategic review of the assets arising from the acquisition of GMG Global and
SINRIO, three business segments were set up according to key customer segments:
• Halcyon Rubber Company (HRC)
• Sinochem International Rubber Investment Overseas (SINRIO)
• Corrie MacColl Group
As part of the review, we identified opportunities for the divestment of non-core assets in SIAT S.A (SIAT),
a former associate of the Group. The proceeds from the disposal were partially reinvested into
numerous bolt-on acquisitions in 2018 such as:
• Completion of the purchase of the Corrie MacColl Group, which houses Alan L Grant, Momentum
Technologies International, Kelvin Terminals and Wurfbain Polymer
• Completion of the purchase of five rubber factories in two separate transactions into HRC
These investments further strengthen Halcyon’s position as the world’s leading natural rubber supply chain
manager. The businesses of HRC and Corrie MacColl acquired in FY2018 contributed about 61,000 mT and
205,000 mT in terms of sales volume respectively to the Group (c.19% of total Group FY2018 sales volume).
They also contributed a combined US$12.8 million of operating profit to the Group in FY2018.
Operating Results
Equipped with the contribution of the acquisitions made in FY2018, the Group reported a third
consecutive year of record-high sales volume in FY2018 of 1,432,335 mT, which is 16.7% higher than
1,227,027 mT in the previous year. However, revenue dropped by 0.8%, from US$2,158.4 million in FY2017 to
US$2,141.0 million in FY2018 reflecting the depressed market price levels. As a comparison, the average
2018 SICOM TSR20 market price per metric tonne was US$1,365, 17% lower than the average 2017 market
price of US$1,647.
As the average selling prices decreased our margins came under pressure, resulting in FY2018 gross profits
of US$118.4 million, 21.3% lower than that of US$150.6 million recorded in FY2017. Our operating profits
decreased 92.4% from US$59.3 million recorded in FY2017 to US$4.5 million in FY2018, which is caused
by the reduction in gross profit as abovementioned, coupled with the absence of FY2017 one-off gains of
US$21.5 million.
The effect of margin compression, the absence of one-off gains, as well as the non-recurrence of share
of associates’ profits, resulted in our EBITDA dropping from US$64.9 million in FY2017 to US$36.2 million
in FY2018. Net financing costs have decreased 6.6% year-on-year from US$22.7 million to US$21.3 million,
mainly due to the replacement of S$125 million medium-term notes in FY2017 with US$150 million worth
of perpetual securities.
The above factors resulted in a loss per share of 0.53 U.S. cents in FY2018, a reversal from 1.95 U.S. cents
earnings per share in FY2017.
GRI CODE \ 102-2 \ 102-7 \ 102-9 \ 103-1 \ 103-2 \ 103-329 \ \ 30
1 Working capital employed for the Group is defined as the sum of operational trade and other receivables, net derivative assets, pledged deposits and inventories, netted off against trade and other payables. In Dec-18, loan receivable from third-party has been reclassified from non-core assets.
2 Operational long term assets of the Group are defined as intangible assets, property, plant and equipment, plantation and biological assets, other non-current assets, net off against non-current liabilities. In Dec-18, plantation assets and Property, Plant & Equipment (PPE) in Malaysia have been reclassified from non-core assets.
3 Cash and cash equivalents as stated in the cash flow statement.
4 Non-core assets as at Dec-18 include investment properties only. As at Dec-17, non-core assets include investment properties, loan receivable from third-party and plantation assets & PPE located in Malaysia.
(US$ million) 31-Dec-18 31-Dec-17
Working capital employed 1 539.4 427.7
Working capital loans 520.4 207.6
% Efficiency of Working Capital Funding 96.5% 48.5%
Operational long term assets 2 938.7 718.1
Term loans 391.6 403.0
% Fixed Asset Gearing 41.7% 56.1%
Cash and cash equivalents 3 122.9 153.4
Non-core assets 4 46.8 144.5
Total Equity (excluding Perpetual Securities) 587.2 684.5
Perpetual Securities 148.7 148.7
Total Equity (including Perpetual Securities) 735.9 833.2
Balance Sheet
Our net assets have reduced from US$833.2 million in 2017 to US$735.9 million in 2018 mainly due to the
following factors:
• Strengthening of U.S. Dollars vs local currency resulting in foreign currency translation losses
• Distribution of a final and a special dividend of SG cents 0.01 each as well as distributions to
holders of perpetual securities
• Full year loss in FY2018
The Group has a stable funding base where financing tenors are matched, cash balances are unencumbered
and fixed assets are sustainably financed.
The table below summarises management’s assessment of the Group’s capital structure:
The increase in efficiency of working capital funding was due to a lower working capital loan balance
in Dec-17, as disposal proceeds from divestitures were used to temporarily free up headroom for debt
facilities, to be redrawn later on to fund working capital of new investments of the Group.
Fixed asset gearing has reduced from Dec-17 to Dec-18, representing the Group’s commitment to
continue to finance investments in longer-gestation projects through equity.
The Group continues to explore options to deleverage, including listing of the Corrie MacColl Group on
the London Stock Exchange.
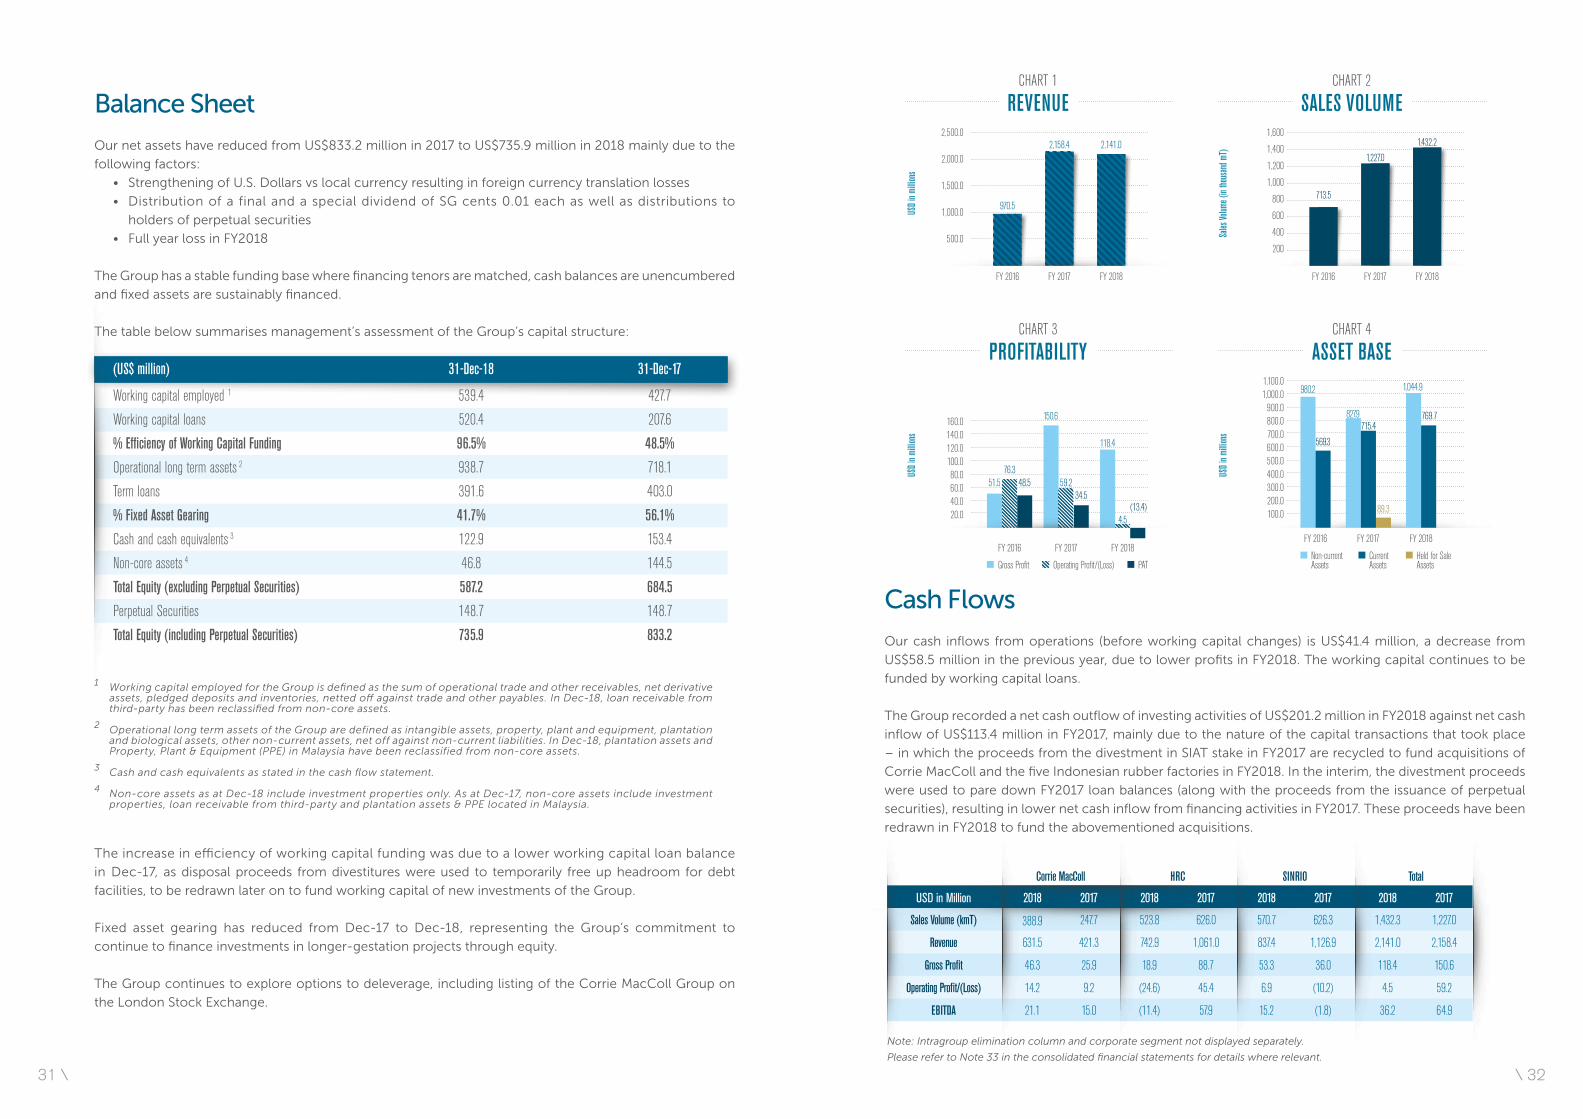
CHART 1
REVENUE
2,158.4
USD i
n milli
ons
970.5
FY 2016 FY 2017
2,141.0
FY 2018
2,500.0
2,000.0
1,500.0
1,000.0
500.0
CHART 2
SALES VOLUME
1,227.0
Sales
Volum
e (in
thous
and m
T)
713.5
FY 2016 FY 2017
1,432.2
FY 2018
1,600
1,400
1,200
1,000
800
600
400
200
CHART 3
PROFITABILITY
51.5
150.6
118.4
76.359.248.5
34.5
USD i
n milli
ons
FY 2017FY 2016 FY 2018
160.0140.0120.0100.080.060.040.020.0 4.5
(13.4)
Gross Profit Operating Profit/(Loss) PAT
CHART 4
ASSET BASE980.2
827.9
569.3
769.7
1,100.01,000.0900.0800.0700.0600.0500.0400.0300.0200.0100.0
USD i
n milli
ons
FY 2017FY 2016 FY 2018
715.4
89.3
1,044.9
Non-current Assets
CurrentAssets
Held for SaleAssets
Corrie MacColl HRC SINRIO Total
USD in Million 2018 2017 2018 2017 2018 2017 2018 2017
Sales Volume (kmT) 388.9 247.7 523.8 626.0 570.7 626.3 1,432.3 1,227.0
Revenue 631.5 421.3 742.9 1,061.0 837.4 1,126.9 2,141.0 2,158.4
Gross Profit 46.3 25.9 18.9 88.7 53.3 36.0 118.4 150.6
Operating Profit/(Loss) 14.2 9.2 (24.6) 45.4 6.9 (10.2) 4.5 59.2
EBITDA 21.1 15.0 (11.4) 57.9 15.2 (1.8) 36.2 64.9
Note: Intragroup elimination column and corporate segment not displayed separately.
Please refer to Note 33 in the consolidated financial statements for details where relevant.
Cash Flows
Our cash inflows from operations (before working capital changes) is US$41.4 million, a decrease from
US$58.5 million in the previous year, due to lower profits in FY2018. The working capital continues to be
funded by working capital loans.
The Group recorded a net cash outflow of investing activities of US$201.2 million in FY2018 against net cash
inflow of US$113.4 million in FY2017, mainly due to the nature of the capital transactions that took place
– in which the proceeds from the divestment in SIAT stake in FY2017 are recycled to fund acquisitions of
Corrie MacColl and the five Indonesian rubber factories in FY2018. In the interim, the divestment proceeds
were used to pare down FY2017 loan balances (along with the proceeds from the issuance of perpetual
securities), resulting in lower net cash inflow from financing activities in FY2017. These proceeds have been
redrawn in FY2018 to fund the abovementioned acquisitions.
31 \ \ 32
EBITDA Corrie MacColl US$ 21.1m HRC US$ (11.4)m SINRIO US$ 15.2m
Gross Profit Corrie MacColl US$ 46.3m HRC US$ 18.9m SINRIO US$ 53.3m
Total Equity Corrie MacColl US$ 429.0m HRC US$ 63.4m SINRIO US$ 140.7m
Revenue Corrie MacColl US$ 631.5m HRC US$ 742.9m SINRIO US$ 837.4m
Total Assets Corrie MacColl US$ 1008.3m HRC US$ 614.5m SINRIO US$ 368.0m
Sales Volume Corrie MacColl 388.9 k mT HRC 523.8 k mT SINRIO 570.7 k mT
Operating Return on Assets Corrie MacColl 1.4% HRC (4.0%) SINRIO 1.9%
Operating Return on Total Equity Corrie MacColl 3.3% HRC (38.8%) SINRIO 4.9%
Operating Profit/(Loss) Corrie MacColl US$ 14.2m HRC US$ (24.6)m SINRIO US$ 6.9m
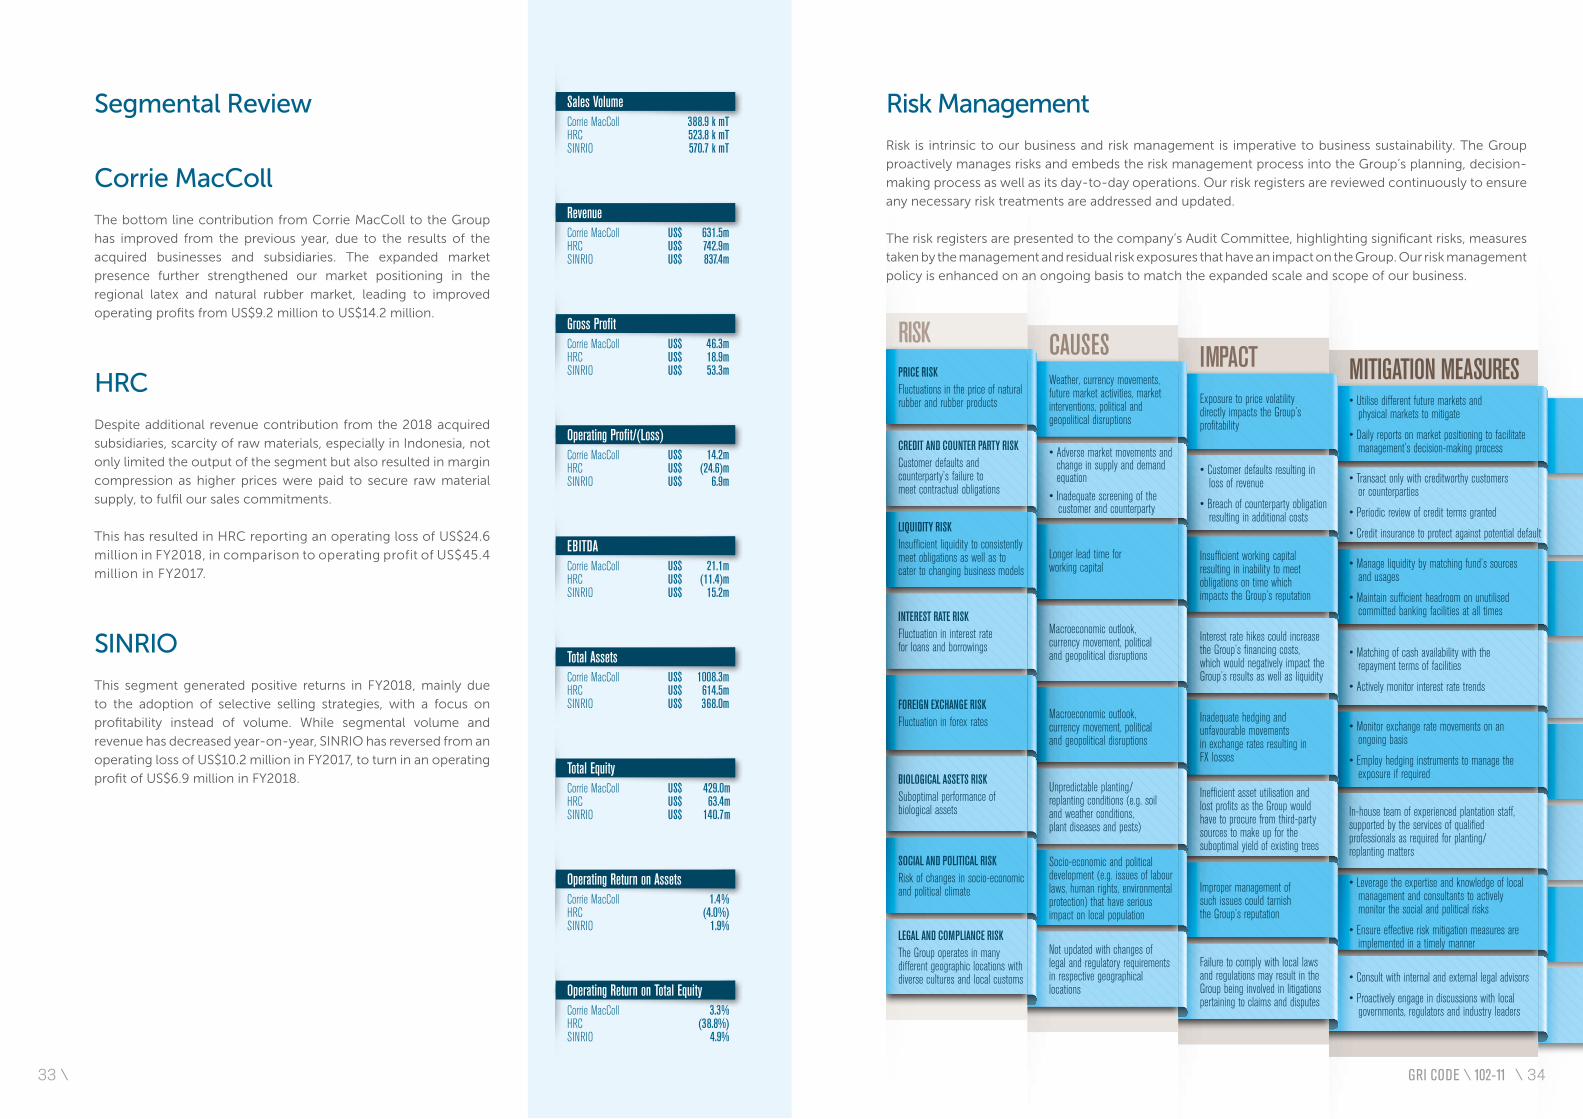
MITIGATION MEASURES
• Transact only with creditworthy customers or counterparties
• Periodic review of credit terms granted
• Credit insurance to protect against potential default
• Manage liquidity by matching fund’s sources and usages
• Maintain sufficient headroom on unutilised committed banking facilities at all times
• Utilise different future markets and physical markets to mitigate
• Daily reports on market positioning to facilitate management’s decision-making process
• Matching of cash availability with the repayment terms of facilities
• Actively monitor interest rate trends
• Monitor exchange rate movements on an ongoing basis
• Employ hedging instruments to manage the exposure if required
In-house team of experienced plantation staff, supported by the services of qualified professionals as required for planting/replanting matters
• Leverage the expertise and knowledge of local management and consultants to actively monitor the social and political risks
• Ensure effective risk mitigation measures are implemented in a timely manner
• Consult with internal and external legal advisors
• Proactively engage in discussions with local governments, regulators and industry leaders
IMPACT
• Customer defaults resulting in loss of revenue
• Breach of counterparty obligation resulting in additional costs
Insufficient working capital resulting in inability to meet obligations on time which impacts the Group’s reputation
Interest rate hikes could increase the Group’s financing costs, which would negatively impact the Group’s results as well as liquidity
Inadequate hedging and unfavourable movements in exchange rates resulting in FX losses
Inefficient asset utilisation and lost profits as the Group would have to procure from third-party sources to make up for the suboptimal yield of existing trees
Improper management of such issues could tarnish the Group’s reputation
Failure to comply with local laws and regulations may result in the Group being involved in litigations pertaining to claims and disputes
Exposure to price volatility directly impacts the Group’s profitability
CAUSES
• Adverse market movements and change in supply and demand equation• Inadequate screening of the customer and counterparty
Longer lead time for working capital
Macroeconomic outlook, currency movement, political and geopolitical disruptions
Macroeconomic outlook, currency movement, political and geopolitical disruptions
Unpredictable planting/replanting conditions (e.g. soil and weather conditions, plant diseases and pests)
Socio-economic and political development (e.g. issues of labour laws, human rights, environmental protection) that have serious impact on local population
Not updated with changes of legal and regulatory requirements in respective geographical locations
Weather, currency movements, future market activities, market interventions, political and geopolitical disruptions
CREDIT AND COUNTER PARTY RISKCustomer defaults and counterparty’s failure to meet contractual obligations
LIQUIDITY RISKInsufficient liquidity to consistently meet obligations as well as tocater to changing business models
INTEREST RATE RISKFluctuation in interest rate for loans and borrowings
FOREIGN EXCHANGE RISKFluctuation in forex rates
BIOLOGICAL ASSETS RISKSuboptimal performance of biological assets
SOCIAL AND POLITICAL RISKRisk of changes in socio-economic and political climate
LEGAL AND COMPLIANCE RISKThe Group operates in many different geographic locations with diverse cultures and local customs
PRICE RISKFluctuations in the price of natural rubber and rubber products
RISK
Segmental Review
Corrie MacColl
The bottom line contribution from Corrie MacColl to the Group
has improved from the previous year, due to the results of the
acquired businesses and subsidiaries. The expanded market
presence further strengthened our market positioning in the
regional latex and natural rubber market, leading to improved
operating profits from US$9.2 million to US$14.2 million.
HRC
Despite additional revenue contribution from the 2018 acquired
subsidiaries, scarcity of raw materials, especially in Indonesia, not
only limited the output of the segment but also resulted in margin
compression as higher prices were paid to secure raw material
supply, to fulfil our sales commitments.
This has resulted in HRC reporting an operating loss of US$24.6
million in FY2018, in comparison to operating profit of US$45.4
million in FY2017.
SINRIO
This segment generated positive returns in FY2018, mainly due
to the adoption of selective selling strategies, with a focus on
profitability instead of volume. While segmental volume and
revenue has decreased year-on-year, SINRIO has reversed from an
operating loss of US$10.2 million in FY2017, to turn in an operating
profit of US$6.9 million in FY2018.
Risk Management
Risk is intrinsic to our business and risk management is imperative to business sustainability. The Group
proactively manages risks and embeds the risk management process into the Group’s planning, decision-
making process as well as its day-to-day operations. Our risk registers are reviewed continuously to ensure
any necessary risk treatments are addressed and updated.
The risk registers are presented to the company’s Audit Committee, highlighting significant risks, measures
taken by the management and residual risk exposures that have an impact on the Group. Our risk management
policy is enhanced on an ongoing basis to match the expanded scale and scope of our business.
GRI CODE \ 102-1133 \ \ 34
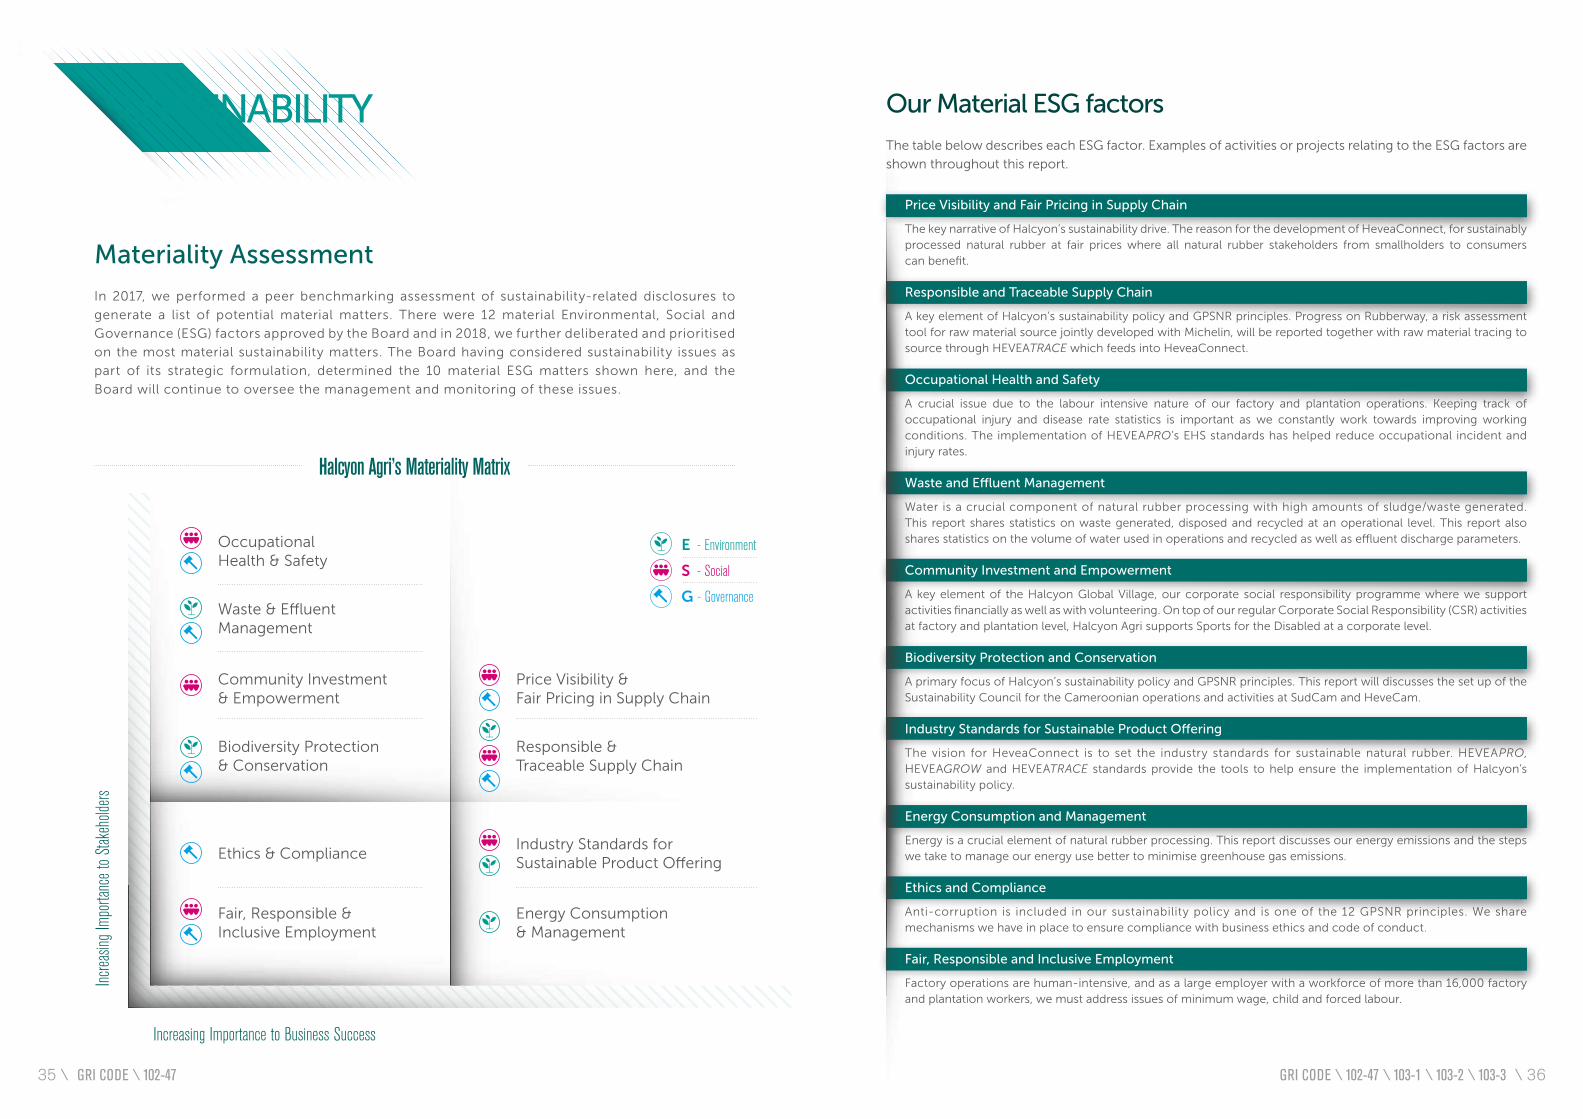
E - Environment
G - Governance
S - Social
Halcyon Agri’s Materiality Matrix
Occupational Health & Safety
Waste & Effluent Management
Community Investment & Empowerment
Biodiversity Protection & Conservation
Ethics & Compliance
Fair, Responsible & Inclusive Employment
Increa
sing I
mport
ance
to S
takeh
olders
Increasing Importance to Business Success
Price Visibility & Fair Pricing in Supply Chain
Responsible & Traceable Supply Chain
Industry Standards for Sustainable Product Offering
Energy Consumption& Management
Price Visibility and Fair Pricing in Supply Chain
The key narrative of Halcyon’s sustainability drive. The reason for the development of HeveaConnect, for sustainably processed natural rubber at fair prices where all natural rubber stakeholders from smallholders to consumers can benefit.
Responsible and Traceable Supply Chain
A key element of Halcyon’s sustainability policy and GPSNR principles. Progress on Rubberway, a risk assessment tool for raw material source jointly developed with Michelin, will be reported together with raw material tracing to source through HEVEATRACE which feeds into HeveaConnect.
Occupational Health and Safety
A crucial issue due to the labour intensive nature of our factory and plantation operations. Keeping track of occupational injury and disease rate statistics is important as we constantly work towards improving working conditions. The implementation of HEVEAPRO’s EHS standards has helped reduce occupational incident and injury rates.
Waste and Effluent Management
Water is a crucial component of natural rubber processing with high amounts of sludge/waste generated. This report shares statistics on waste generated, disposed and recycled at an operational level. This report also shares statistics on the volume of water used in operations and recycled as well as effluent discharge parameters.
Community Investment and Empowerment
A key element of the Halcyon Global Village, our corporate social responsibility programme where we support activities financially as well as with volunteering. On top of our regular Corporate Social Responsibility (CSR) activities at factory and plantation level, Halcyon Agri supports Sports for the Disabled at a corporate level.
Biodiversity Protection and Conservation
A primary focus of Halcyon’s sustainability policy and GPSNR principles. This report will discusses the set up of the Sustainability Council for the Cameroonian operations and activities at SudCam and HeveCam.
Industry Standards for Sustainable Product Offering
The vision for HeveaConnect is to set the industry standards for sustainable natural rubber. HEVEAPRO, HEVEAGROW and HEVEATRACE standards provide the tools to help ensure the implementation of Halcyon’s sustainability policy.
Energy Consumption and Management
Energy is a crucial element of natural rubber processing. This report discusses our energy emissions and the steps we take to manage our energy use better to minimise greenhouse gas emissions.
Ethics and Compliance
Anti-corruption is included in our sustainability policy and is one of the 12 GPSNR principles. We share mechanisms we have in place to ensure compliance with business ethics and code of conduct.
Fair, Responsible and Inclusive Employment
Factory operations are human-intensive, and as a large employer with a workforce of more than 16,000 factory and plantation workers, we must address issues of minimum wage, child and forced labour.
Our Material ESG factors
The table below describes each ESG factor. Examples of activities or projects relating to the ESG factors are
shown throughout this report.
SUSTAINABILITY
Materiality Assessment
In 2017, we performed a peer benchmarking assessment of sustainability-related disclosures to
generate a list of potential material matters. There were 12 material Environmental, Social and
Governance (ESG) factors approved by the Board and in 2018, we further deliberated and prioritised
on the most material sustainability matters. The Board having considered sustainability issues as
part of its strategic formulation, determined the 10 material ESG matters shown here, and the
Board will continue to oversee the management and monitoring of these issues.
GRI CODE \ 102-47 GRI CODE \ 102-47 \ 103-1 \ 103-2 \ 103-335 \ \ 36
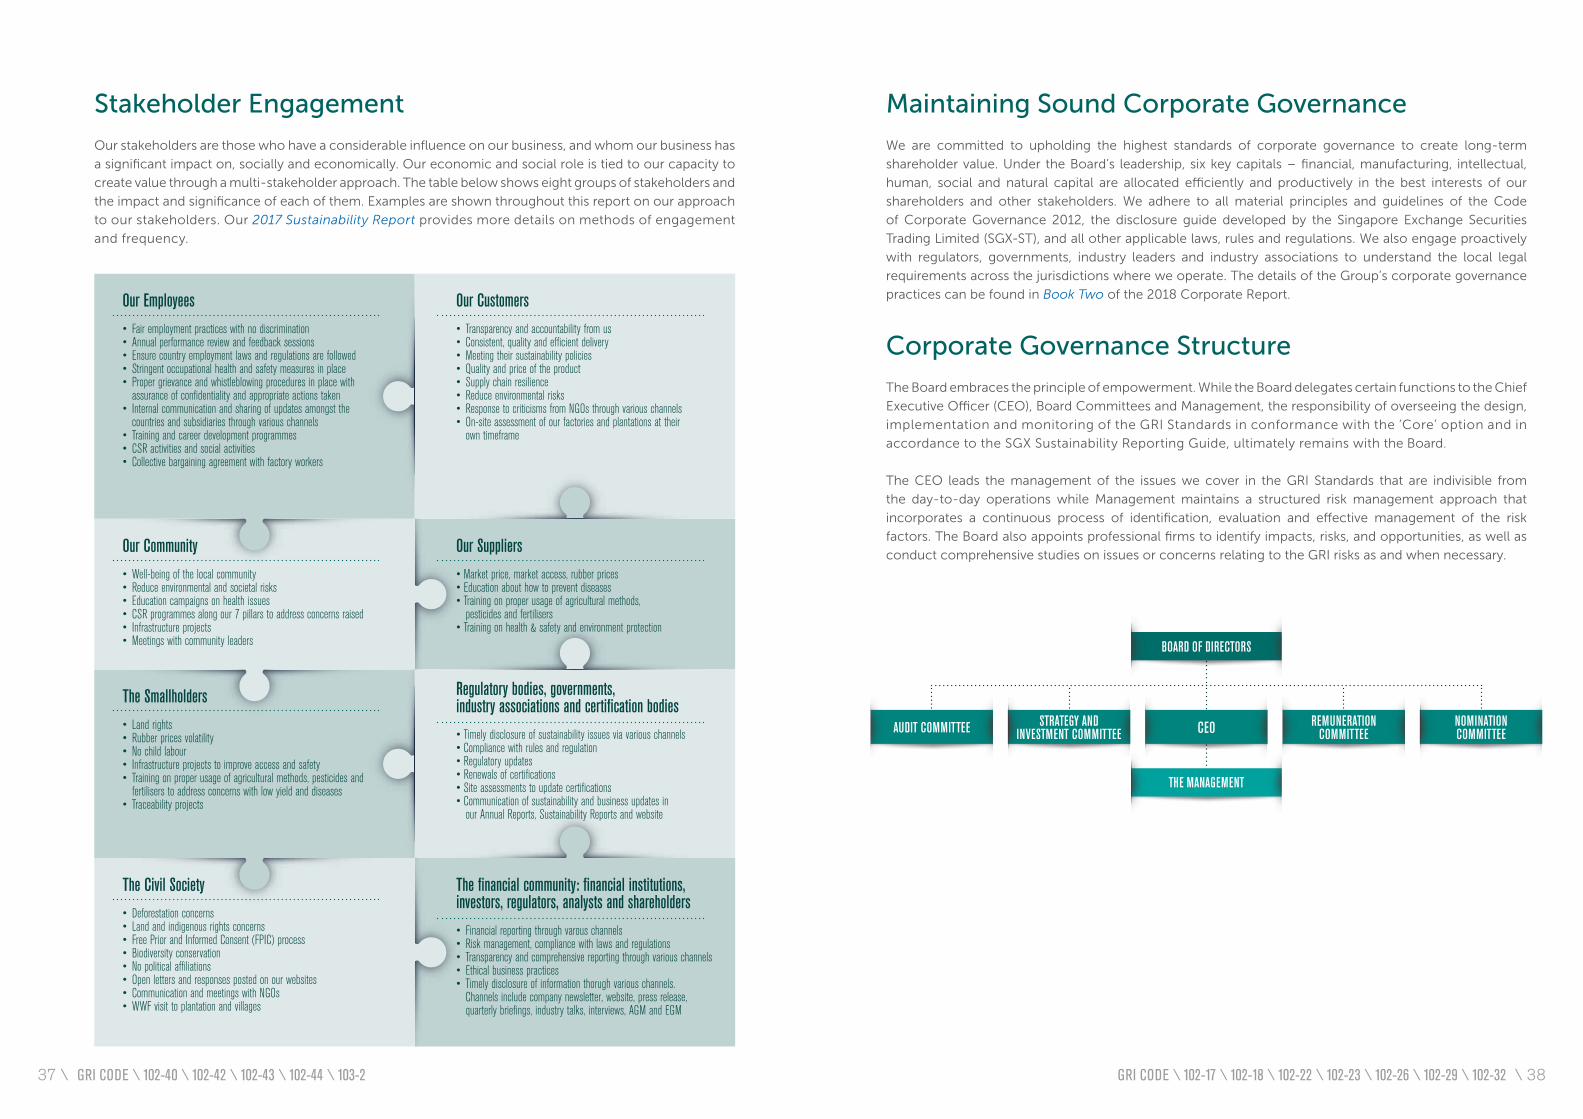
Our Employees • Fair employment practices with no discrimination • Annual performance review and feedback sessions• Ensure country employment laws and regulations are followed• Stringent occupational health and safety measures in place • Proper grievance and whistleblowing procedures in place with assurance of confidentiality and appropriate actions taken• Internal communication and sharing of updates amongst the countries and subsidiaries through various channels• Training and career development programmes • CSR activities and social activities• Collective bargaining agreement with factory workers
The Smallholders
• Land rights• Rubber prices volatility • No child labour• Infrastructure projects to improve access and safety • Training on proper usage of agricultural methods, pesticides and fertilisers to address concerns with low yield and diseases• Traceability projects
Regulatory bodies, governments, industry associations and certification bodies• Timely disclosure of sustainability issues via various channels• Compliance with rules and regulation• Regulatory updates• Renewals of certifications• Site assessments to update certifications• Communication of sustainability and business updates in our Annual Reports, Sustainability Reports and website
The financial community: financial institutions, investors, regulators, analysts and shareholders• Financial reporting through varous channels • Risk management, compliance with laws and regulations• Transparency and comprehensive reporting through various channels• Ethical business practices• Timely disclosure of information thorugh various channels. Channels include company newsletter, website, press release, quarterly briefings, industry talks, interviews, AGM and EGM
Our Customers• Transparency and accountability from us • Consistent, quality and efficient delivery • Meeting their sustainability policies • Quality and price of the product• Supply chain resilience• Reduce environmental risks• Response to criticisms from NGOs through various channels • On-site assessment of our factories and plantations at their own timeframe
Our Community• Well-being of the local community• Reduce environmental and societal risks• Education campaigns on health issues• CSR programmes along our 7 pillars to address concerns raised • Infrastructure projects • Meetings with community leaders
Our Suppliers• Market price, market access, rubber prices • Education about how to prevent diseases• Training on proper usage of agricultural methods, pesticides and fertilisers• Training on health & safety and environment protection
The Civil Society• Deforestation concerns• Land and indigenous rights concerns• Free Prior and Informed Consent (FPIC) process• Biodiversity conservation • No political affiliations• Open letters and responses posted on our websites • Communication and meetings with NGOs • WWF visit to plantation and villages
BOARD OF DIRECTORS
THE MANAGEMENT
REMUNERATION COMMITTEECEO NOMINATION
COMMITTEEAUDIT COMMITTEE STRATEGY ANDINVESTMENT COMMITTEE
Stakeholder Engagement
Our stakeholders are those who have a considerable influence on our business, and whom our business has
a significant impact on, socially and economically. Our economic and social role is tied to our capacity to
create value through a multi-stakeholder approach. The table below shows eight groups of stakeholders and
the impact and significance of each of them. Examples are shown throughout this report on our approach
to our stakeholders. Our 2017 Sustainability Report provides more details on methods of engagement
and frequency.
Maintaining Sound Corporate Governance
We are committed to upholding the highest standards of corporate governance to create long-term
shareholder value. Under the Board’s leadership, six key capitals – financial, manufacturing, intellectual,
human, social and natural capital are allocated efficiently and productively in the best interests of our
shareholders and other stakeholders. We adhere to all material principles and guidelines of the Code
of Corporate Governance 2012, the disclosure guide developed by the Singapore Exchange Securities
Trading Limited (SGX-ST), and all other applicable laws, rules and regulations. We also engage proactively
with regulators, governments, industry leaders and industry associations to understand the local legal
requirements across the jurisdictions where we operate. The details of the Group’s corporate governance
practices can be found in Book Two of the 2018 Corporate Report.
Corporate Governance Structure
The Board embraces the principle of empowerment. While the Board delegates certain functions to the Chief
Executive Officer (CEO), Board Committees and Management, the responsibility of overseeing the design,
implementation and monitoring of the GRI Standards in conformance with the ‘Core’ option and in
accordance to the SGX Sustainability Reporting Guide, ultimately remains with the Board.
The CEO leads the management of the issues we cover in the GRI Standards that are indivisible from
the day-to-day operations while Management maintains a structured risk management approach that
incorporates a continuous process of identification, evaluation and effective management of the risk
factors. The Board also appoints professional firms to identify impacts, risks, and opportunities, as well as
conduct comprehensive studies on issues or concerns relating to the GRI risks as and when necessary.
GRI CODE \ 102-40 \ 102-42 \ 102-43 \ 102-44 \ 103-2 GRI CODE \ 102-17 \ 102-18 \ 102-22 \ 102-23 \ 102-26 \ 102-29 \ 102-3237 \ \ 38
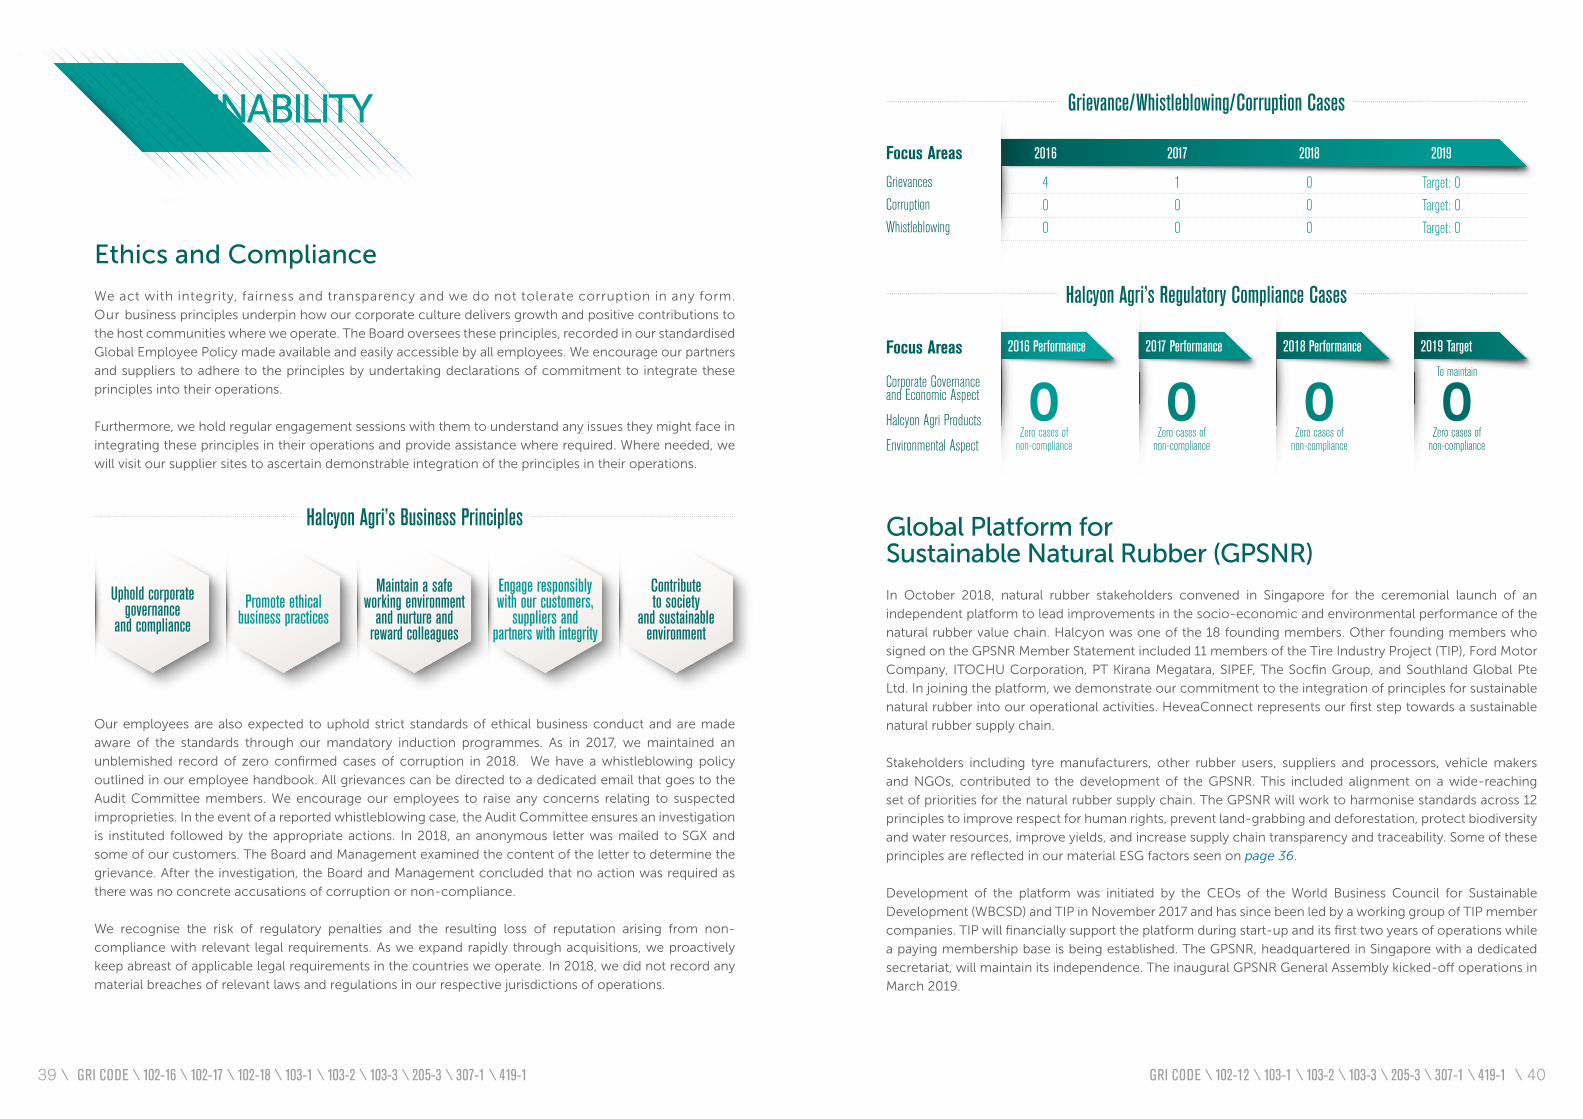
Uphold corporate governance
and compliancePromote ethical
business practices
Maintain a safeworking environment
and nurture andreward colleagues
Engage responsiblywith our customers,
suppliers andpartners with integrity
Contributeto society
and sustainableenvironment
Halcyon Agri’s Business Principles
2016 2017 2018 2019
4 1 0 Target: 0
0 0 0 Target: 0
0 0 0 Target: 0
Focus Areas
Grievances
Corruption
Whistleblowing
Grievance/Whistleblowing/Corruption Cases
2017 Performance
0Zero cases of
non-compliance
2019 Target
0Zero cases of
non-compliance
To maintain
2018 Performance
0Zero cases of
non-compliance
2016 Performance
0Zero cases of
non-compliance
Focus Areas
Corporate Governanceand Economic Aspect
Halcyon Agri Products
Environmental Aspect
Halcyon Agri’s Regulatory Compliance Cases
Ethics and Compliance
We act with integrity, fairness and transparency and we do not tolerate corruption in any form.
Our business principles underpin how our corporate culture delivers growth and positive contributions to
the host communities where we operate. The Board oversees these principles, recorded in our standardised
Global Employee Policy made available and easily accessible by all employees. We encourage our partners
and suppliers to adhere to the principles by undertaking declarations of commitment to integrate these
principles into their operations.
Furthermore, we hold regular engagement sessions with them to understand any issues they might face in
integrating these principles in their operations and provide assistance where required. Where needed, we
will visit our supplier sites to ascertain demonstrable integration of the principles in their operations.
SUSTAINABILITY
Our employees are also expected to uphold strict standards of ethical business conduct and are made
aware of the standards through our mandatory induction programmes. As in 2017, we maintained an
unblemished record of zero confirmed cases of corruption in 2018. We have a whistleblowing policy
outlined in our employee handbook. All grievances can be directed to a dedicated email that goes to the
Audit Committee members. We encourage our employees to raise any concerns relating to suspected
improprieties. In the event of a reported whistleblowing case, the Audit Committee ensures an investigation
is instituted followed by the appropriate actions. In 2018, an anonymous letter was mailed to SGX and
some of our customers. The Board and Management examined the content of the letter to determine the
grievance. After the investigation, the Board and Management concluded that no action was required as
there was no concrete accusations of corruption or non-compliance.
We recognise the risk of regulatory penalties and the resulting loss of reputation arising from non-
compliance with relevant legal requirements. As we expand rapidly through acquisitions, we proactively
keep abreast of applicable legal requirements in the countries we operate. In 2018, we did not record any
material breaches of relevant laws and regulations in our respective jurisdictions of operations.
Global Platform forSustainable Natural Rubber (GPSNR)
In October 2018, natural rubber stakeholders convened in Singapore for the ceremonial launch of an
independent platform to lead improvements in the socio-economic and environmental performance of the
natural rubber value chain. Halcyon was one of the 18 founding members. Other founding members who
signed on the GPSNR Member Statement included 11 members of the Tire Industry Project (TIP), Ford Motor
Company, ITOCHU Corporation, PT Kirana Megatara, SIPEF, The Socfin Group, and Southland Global Pte
Ltd. In joining the platform, we demonstrate our commitment to the integration of principles for sustainable
natural rubber into our operational activities. HeveaConnect represents our first step towards a sustainable
natural rubber supply chain.
Stakeholders including tyre manufacturers, other rubber users, suppliers and processors, vehicle makers
and NGOs, contributed to the development of the GPSNR. This included alignment on a wide-reaching
set of priorities for the natural rubber supply chain. The GPSNR will work to harmonise standards across 12
principles to improve respect for human rights, prevent land-grabbing and deforestation, protect biodiversity
and water resources, improve yields, and increase supply chain transparency and traceability. Some of these
principles are reflected in our material ESG factors seen on page 36.
Development of the platform was initiated by the CEOs of the World Business Council for Sustainable
Development (WBCSD) and TIP in November 2017 and has since been led by a working group of TIP member
companies. TIP will financially support the platform during start-up and its first two years of operations while
a paying membership base is being established. The GPSNR, headquartered in Singapore with a dedicated
secretariat, will maintain its independence. The inaugural GPSNR General Assembly kicked-off operations in
March 2019.
GRI CODE \ 102-16 \ 102-17 \ 102-18 \ 103-1 \ 103-2 \ 103-3 \ 205-3 \ 307-1 \ 419-1 GRI CODE \ 102-12 \ 103-1 \ 103-2 \ 103-3 \ 205-3 \ 307-1 \ 419-139 \ \ 40
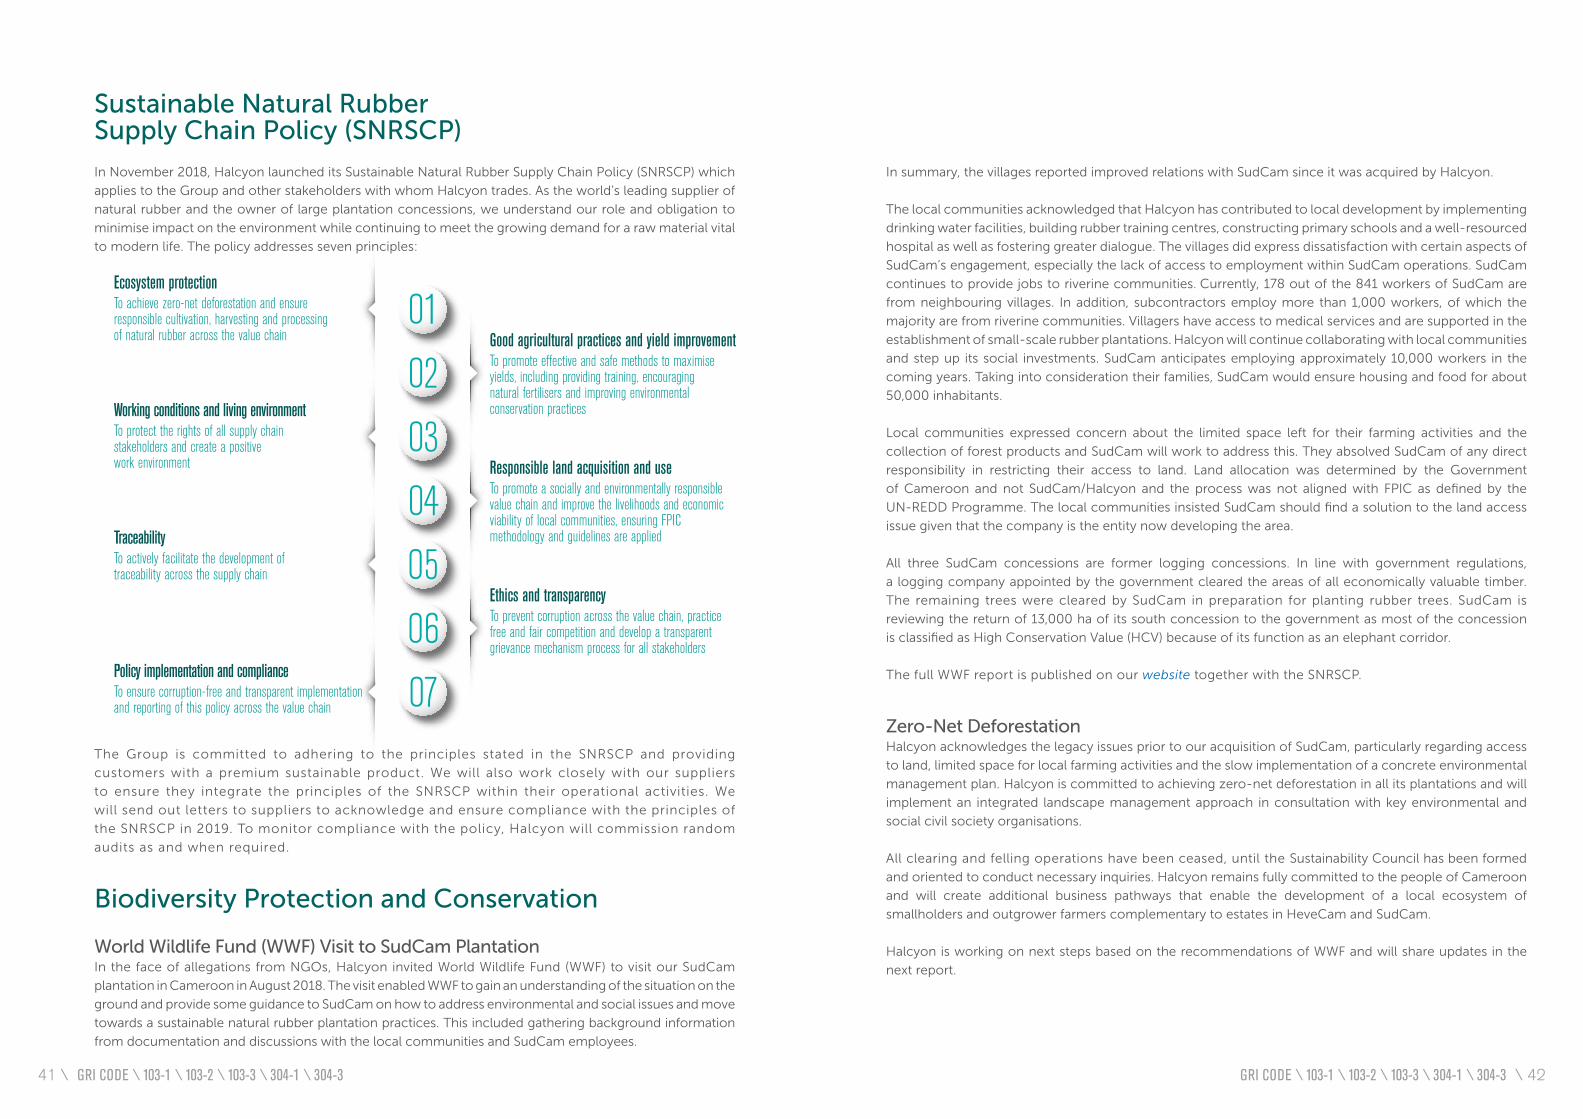
Ecosystem protectionTo achieve zero-net deforestation and ensure responsible cultivation, harvesting and processing of natural rubber across the value chain Good agricultural practices and yield improvement
To promote effective and safe methods to maximise yields, including providing training, encouraging natural fertilisers and improving environmental conservation practices
Responsible land acquisition and useTo promote a socially and environmentally responsible value chain and improve the livelihoods and economic viability of local communities, ensuring FPIC methodology and guidelines are applied
Ethics and transparencyTo prevent corruption across the value chain, practice free and fair competition and develop a transparent grievance mechanism process for all stakeholders
Policy implementation and complianceTo ensure corruption-free and transparent implementation and reporting of this policy across the value chain
TraceabilityTo actively facilitate the development of traceability across the supply chain
Working conditions and living environmentTo protect the rights of all supply chain stakeholders and create a positive work environment
01
02
03
04
05
06
07The Group is committed to adhering to the principles stated in the SNRSCP and providing
customers with a premium sustainable product. We will also work closely with our suppliers
to ensure they integrate the principles of the SNRSCP within their operational activities. We
will send out letters to suppliers to acknowledge and ensure compliance with the principles of
the SNRSCP in 2019. To monitor compliance with the policy, Halcyon will commission random
audits as and when required.
Biodiversity Protection and Conservation
World Wildlife Fund (WWF) Visit to SudCam PlantationIn the face of allegations from NGOs, Halcyon invited World Wildlife Fund (WWF) to visit our SudCam
plantation in Cameroon in August 2018. The visit enabled WWF to gain an understanding of the situation on the
ground and provide some guidance to SudCam on how to address environmental and social issues and move
towards a sustainable natural rubber plantation practices. This included gathering background information
from documentation and discussions with the local communities and SudCam employees.
Sustainable Natural Rubber Supply Chain Policy (SNRSCP)
In November 2018, Halcyon launched its Sustainable Natural Rubber Supply Chain Policy (SNRSCP) which
applies to the Group and other stakeholders with whom Halcyon trades. As the world’s leading supplier of
natural rubber and the owner of large plantation concessions, we understand our role and obligation to
minimise impact on the environment while continuing to meet the growing demand for a raw material vital
to modern life. The policy addresses seven principles:
In summary, the villages reported improved relations with SudCam since it was acquired by Halcyon.
The local communities acknowledged that Halcyon has contributed to local development by implementing
drinking water facilities, building rubber training centres, constructing primary schools and a well-resourced
hospital as well as fostering greater dialogue. The villages did express dissatisfaction with certain aspects of
SudCam’s engagement, especially the lack of access to employment within SudCam operations. SudCam
continues to provide jobs to riverine communities. Currently, 178 out of the 841 workers of SudCam are
from neighbouring villages. In addition, subcontractors employ more than 1,000 workers, of which the
majority are from riverine communities. Villagers have access to medical services and are supported in the
establishment of small-scale rubber plantations. Halcyon will continue collaborating with local communities
and step up its social investments. SudCam anticipates employing approximately 10,000 workers in the
coming years. Taking into consideration their families, SudCam would ensure housing and food for about
50,000 inhabitants.
Local communities expressed concern about the limited space left for their farming activities and the
collection of forest products and SudCam will work to address this. They absolved SudCam of any direct
responsibility in restricting their access to land. Land allocation was determined by the Government
of Cameroon and not SudCam/Halcyon and the process was not aligned with FPIC as defined by the
UN-REDD Programme. The local communities insisted SudCam should find a solution to the land access
issue given that the company is the entity now developing the area.
All three SudCam concessions are former logging concessions. In line with government regulations,
a logging company appointed by the government cleared the areas of all economically valuable timber.
The remaining trees were cleared by SudCam in preparation for planting rubber trees. SudCam is
reviewing the return of 13,000 ha of its south concession to the government as most of the concession
is classified as High Conservation Value (HCV) because of its function as an elephant corridor.
The full WWF report is published on our website together with the SNRSCP.
Zero-Net DeforestationHalcyon acknowledges the legacy issues prior to our acquisition of SudCam, particularly regarding access
to land, limited space for local farming activities and the slow implementation of a concrete environmental
management plan. Halcyon is committed to achieving zero-net deforestation in all its plantations and will
implement an integrated landscape management approach in consultation with key environmental and
social civil society organisations.
All clearing and felling operations have been ceased, until the Sustainability Council has been formed
and oriented to conduct necessary inquiries. Halcyon remains fully committed to the people of Cameroon
and will create additional business pathways that enable the development of a local ecosystem of
smallholders and outgrower farmers complementary to estates in HeveCam and SudCam.
Halcyon is working on next steps based on the recommendations of WWF and will share updates in the
next report.
GRI CODE \ 103-1 \ 103-2 \ 103-3 \ 304-1 \ 304-3 GRI CODE \ 103-1 \ 103-2 \ 103-3 \ 304-1 \ 304-341 \ \ 42
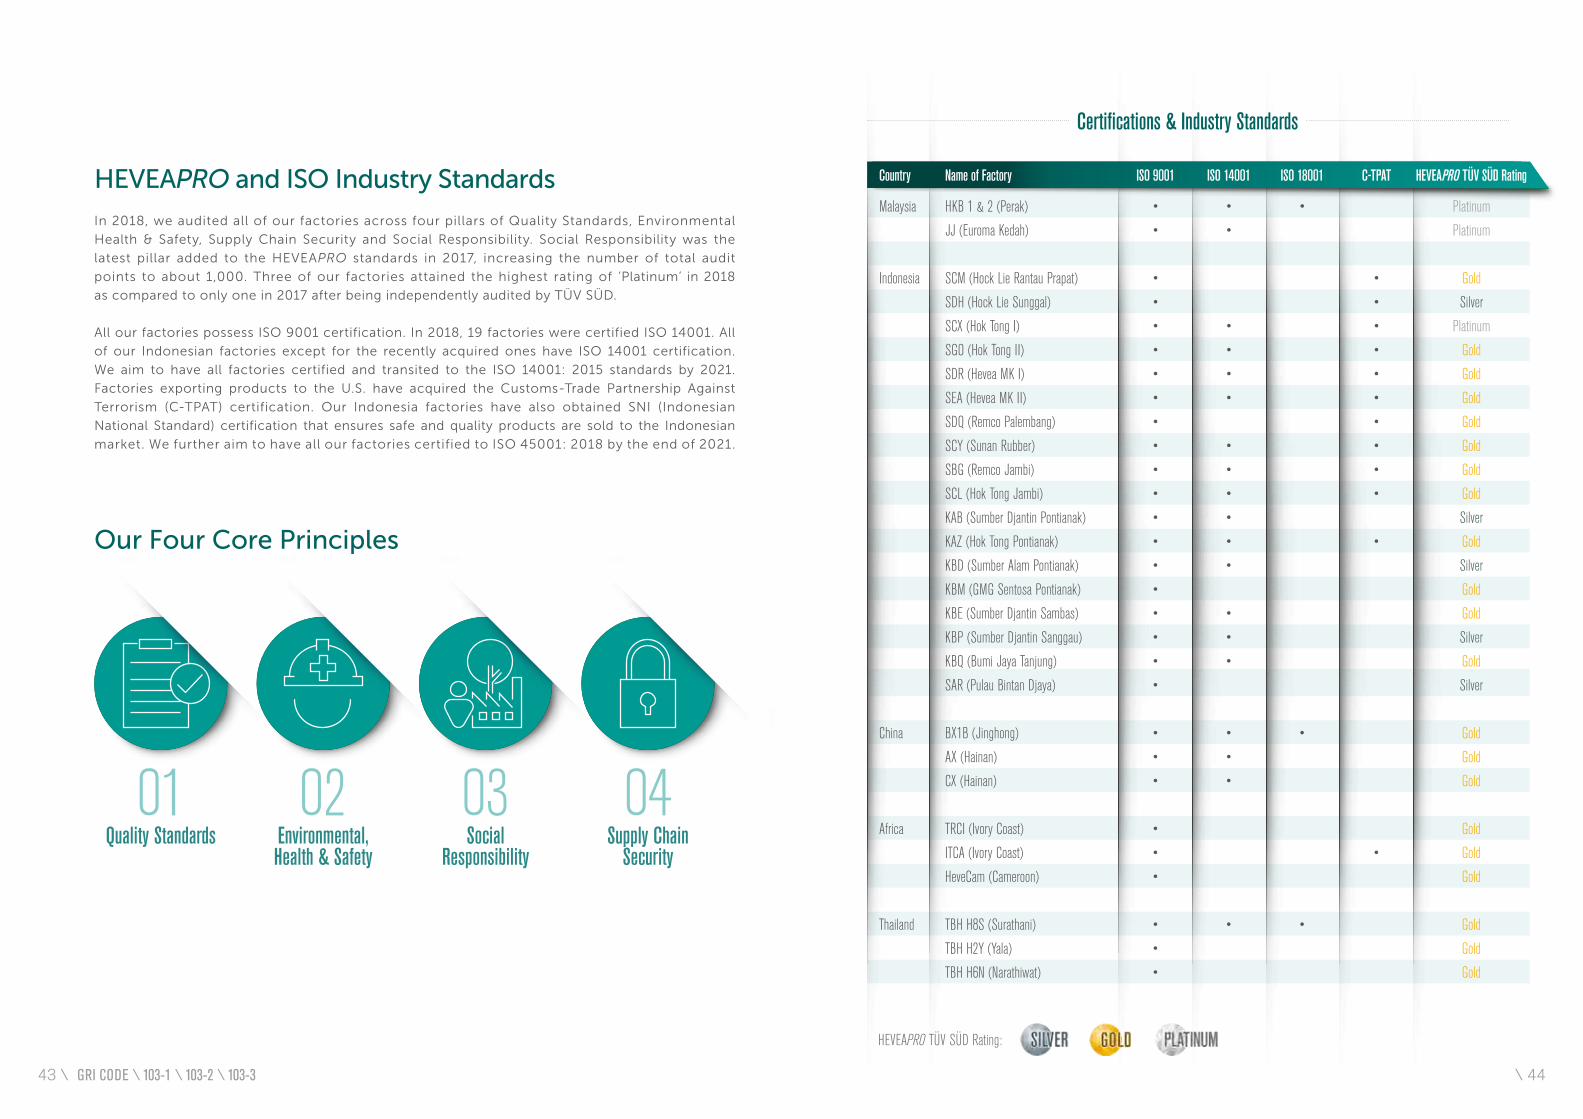
Malaysia HKB 1 & 2 (Perak) • • • Platinum
JJ (Euroma Kedah) • • Platinum
Indonesia SCM (Hock Lie Rantau Prapat) • • Gold
SDH (Hock Lie Sunggal) • • Silver
SCX (Hok Tong I) • • • Platinum
SGO (Hok Tong II) • • • Gold
SDR (Hevea MK I) • • • Gold
SEA (Hevea MK II) • • • Gold
SDQ (Remco Palembang) • • Gold
SCY (Sunan Rubber) • • • Gold
SBG (Remco Jambi) • • • Gold
SCL (Hok Tong Jambi) • • • Gold
KAB (Sumber Djantin Pontianak) • • Silver
KAZ (Hok Tong Pontianak) • • • Gold
KBD (Sumber Alam Pontianak) • • Silver
KBM (GMG Sentosa Pontianak) • Gold
KBE (Sumber Djantin Sambas) • • Gold
KBP (Sumber Djantin Sanggau) • • Silver
KBQ (Bumi Jaya Tanjung) • • Gold
SAR (Pulau Bintan Djaya) • Silver
China BX1B (Jinghong) • • • Gold
AX (Hainan) • • Gold
CX (Hainan) • • Gold
Africa TRCI (Ivory Coast) • Gold
ITCA (Ivory Coast) • • Gold
HeveCam (Cameroon) • Gold
Thailand TBH H8S (Surathani) • • • Gold
TBH H2Y (Yala) • Gold
TBH H6N (Narathiwat) • Gold
Country Name of Factory ISO 9001 ISO 14001 ISO 18001 C-TPAT HEVEAPRO TÜV SÜD Rating
Certifications & Industry Standards
01Quality Standards
02Environmental,Health & Safety
03Social
Responsibility
04Supply Chain
Security
Our Four Core Principles
HEVEAPRO and ISO Industry Standards
In 2018, we audited all of our factories across four pillars of Quality Standards, Environmental
Health & Safety, Supply Chain Security and Social Responsibility. Social Responsibility was the
latest pillar added to the HEVEAPRO standards in 2017, increasing the number of total audit
points to about 1,000. Three of our factories attained the highest rating of ‘Platinum’ in 2018
as compared to only one in 2017 after being independently audited by TÜV SÜD.
All our factories possess ISO 9001 certification. In 2018, 19 factories were certified ISO 14001. All
of our Indonesian factories except for the recently acquired ones have ISO 14001 certification.
We aim to have all factories certified and transited to the ISO 14001: 2015 standards by 2021.
Factories exporting products to the U.S. have acquired the Customs-Trade Partnership Against
Terrorism (C-TPAT) certification. Our Indonesia factories have also obtained SNI (Indonesian
National Standard) certification that ensures safe and quality products are sold to the Indonesian
market. We further aim to have all our factories certified to ISO 45001: 2018 by the end of 2021.
HEVEAPRO TÜV SÜD Rating:
GRI CODE \ 103-1 \ 103-2 \ 103-343 \ \ 44
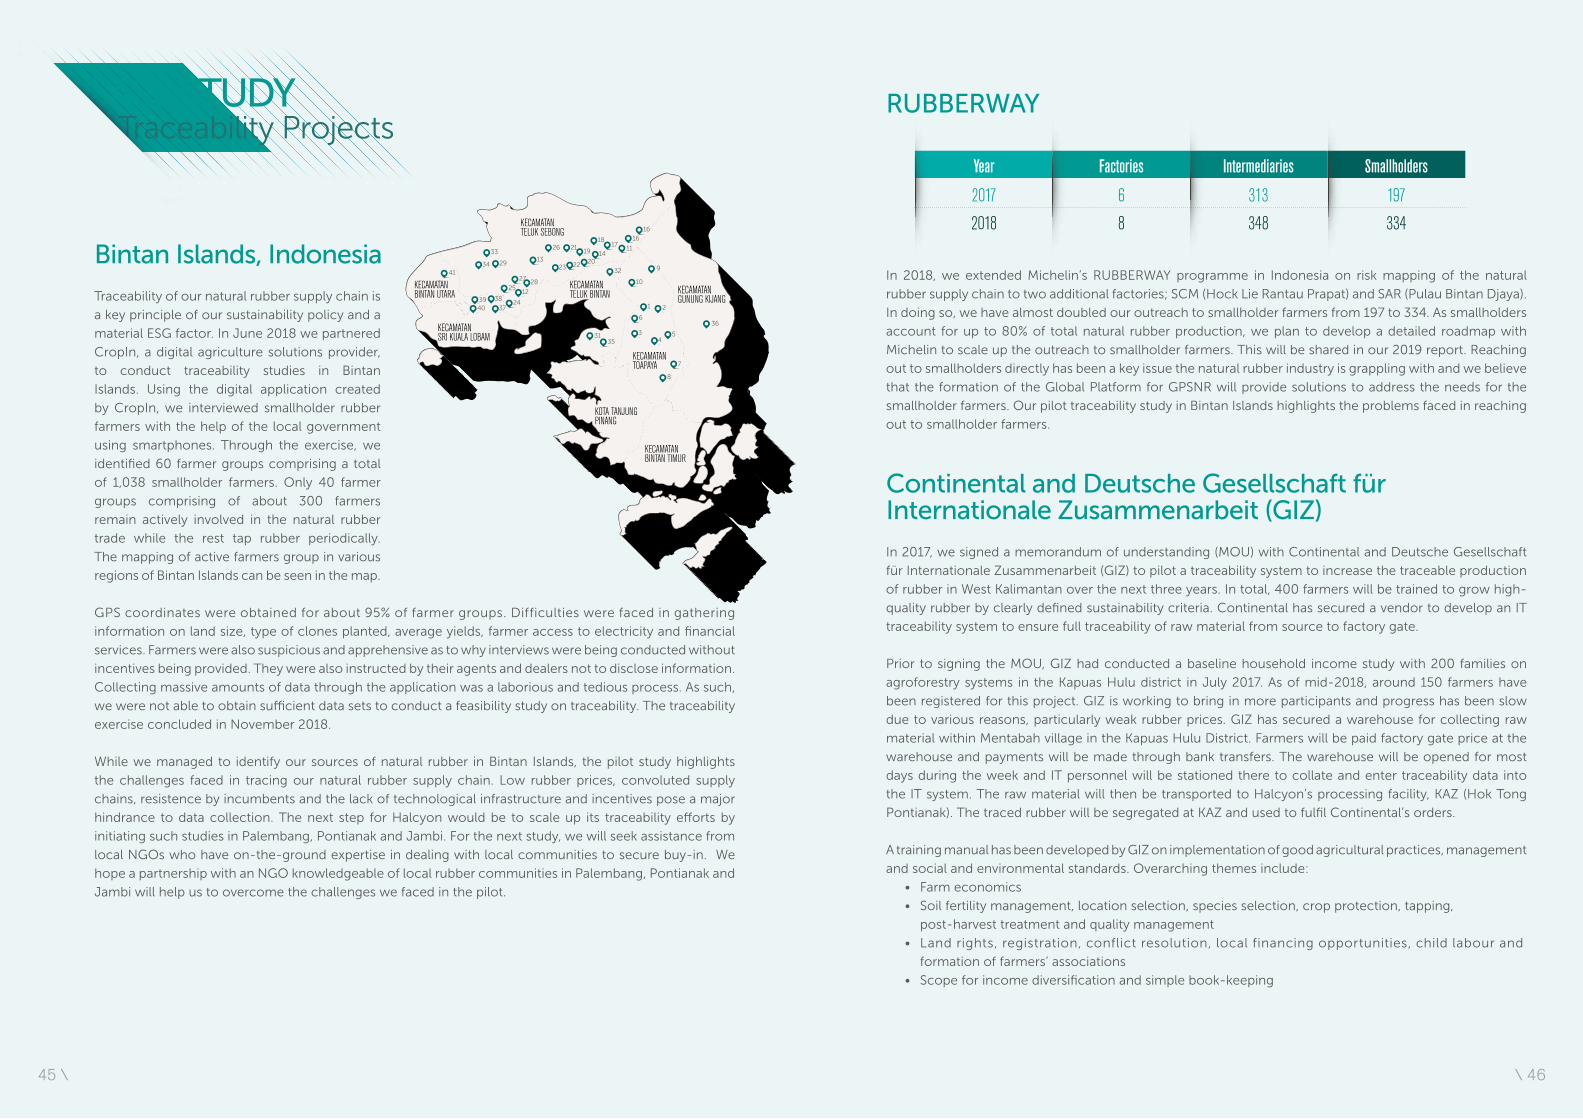
KECAMATANBINTAN UTARA
34
33
2913
26 2119
22 2014
1817
11
1616
9
10
1 2
36
54
3
6
35 31
8
7
3223
27
2528
12
2437
383940
41
KECAMATANSRI KUALA LOBAM
KECAMATANTELUK SEBONG
KECAMATANTELUK BINTAN KECAMATAN
GUNUNG KIJANG
KECAMATANBINTAN TIMUR
KECAMATANTOAPAYA
KOTA TANJUNG PINANG
Year
2017
2018
Factories
6
8
Intermediaries
313
348
Smallholders
197
334
CASE STUDY Traceability Projects
Bintan Islands, Indonesia
Traceability of our natural rubber supply chain is
a key principle of our sustainability policy and a
material ESG factor. In June 2018 we partnered
CropIn, a digital agriculture solutions provider,
to conduct traceability studies in Bintan
Islands. Using the digital application created
by CropIn, we interviewed smallholder rubber
farmers with the help of the local government
using smartphones. Through the exercise, we
identified 60 farmer groups comprising a total
of 1,038 smallholder farmers. Only 40 farmer
groups comprising of about 300 farmers
remain actively involved in the natural rubber
trade while the rest tap rubber periodically.
The mapping of active farmers group in various
regions of Bintan Islands can be seen in the map.
GPS coordinates were obtained for about 95% of farmer groups. Difficulties were faced in gathering
information on land size, type of clones planted, average yields, farmer access to electricity and financial
services. Farmers were also suspicious and apprehensive as to why interviews were being conducted without
incentives being provided. They were also instructed by their agents and dealers not to disclose information.
Collecting massive amounts of data through the application was a laborious and tedious process. As such,
we were not able to obtain sufficient data sets to conduct a feasibility study on traceability. The traceability
exercise concluded in November 2018.
While we managed to identify our sources of natural rubber in Bintan Islands, the pilot study highlights
the challenges faced in tracing our natural rubber supply chain. Low rubber prices, convoluted supply
chains, resistence by incumbents and the lack of technological infrastructure and incentives pose a major
hindrance to data collection. The next step for Halcyon would be to scale up its traceability efforts by
initiating such studies in Palembang, Pontianak and Jambi. For the next study, we will seek assistance from
local NGOs who have on-the-ground expertise in dealing with local communities to secure buy-in. We
hope a partnership with an NGO knowledgeable of local rubber communities in Palembang, Pontianak and
Jambi will help us to overcome the challenges we faced in the pilot.
RUBBERWAY
In 2018, we extended Michelin’s RUBBERWAY programme in Indonesia on risk mapping of the natural
rubber supply chain to two additional factories; SCM (Hock Lie Rantau Prapat) and SAR (Pulau Bintan Djaya).
In doing so, we have almost doubled our outreach to smallholder farmers from 197 to 334. As smallholders
account for up to 80% of total natural rubber production, we plan to develop a detailed roadmap with
Michelin to scale up the outreach to smallholder farmers. This will be shared in our 2019 report. Reaching
out to smallholders directly has been a key issue the natural rubber industry is grappling with and we believe
that the formation of the Global Platform for GPSNR will provide solutions to address the needs for the
smallholder farmers. Our pilot traceability study in Bintan Islands highlights the problems faced in reaching
out to smallholder farmers.
Continental and Deutsche Gesellschaft für Internationale Zusammenarbeit (GIZ)
In 2017, we signed a memorandum of understanding (MOU) with Continental and Deutsche Gesellschaft
für Internationale Zusammenarbeit (GIZ) to pilot a traceability system to increase the traceable production
of rubber in West Kalimantan over the next three years. In total, 400 farmers will be trained to grow high-
quality rubber by clearly defined sustainability criteria. Continental has secured a vendor to develop an IT
traceability system to ensure full traceability of raw material from source to factory gate.
Prior to signing the MOU, GIZ had conducted a baseline household income study with 200 families on
agroforestry systems in the Kapuas Hulu district in July 2017. As of mid-2018, around 150 farmers have
been registered for this project. GIZ is working to bring in more participants and progress has been slow
due to various reasons, particularly weak rubber prices. GIZ has secured a warehouse for collecting raw
material within Mentabah village in the Kapuas Hulu District. Farmers will be paid factory gate price at the
warehouse and payments will be made through bank transfers. The warehouse will be opened for most
days during the week and IT personnel will be stationed there to collate and enter traceability data into
the IT system. The raw material will then be transported to Halcyon’s processing facility, KAZ (Hok Tong
Pontianak). The traced rubber will be segregated at KAZ and used to fulfil Continental’s orders.
A training manual has been developed by GIZ on implementation of good agricultural practices, management
and social and environmental standards. Overarching themes include:
• Farm economics
• Soil fertility management, location selection, species selection, crop protection, tapping,
post-harvest treatment and quality management
• Land rights, registration, conflict resolution, local financing opportunities, child labour and
formation of farmers’ associations
• Scope for income diversification and simple book-keeping
45 \ \ 46
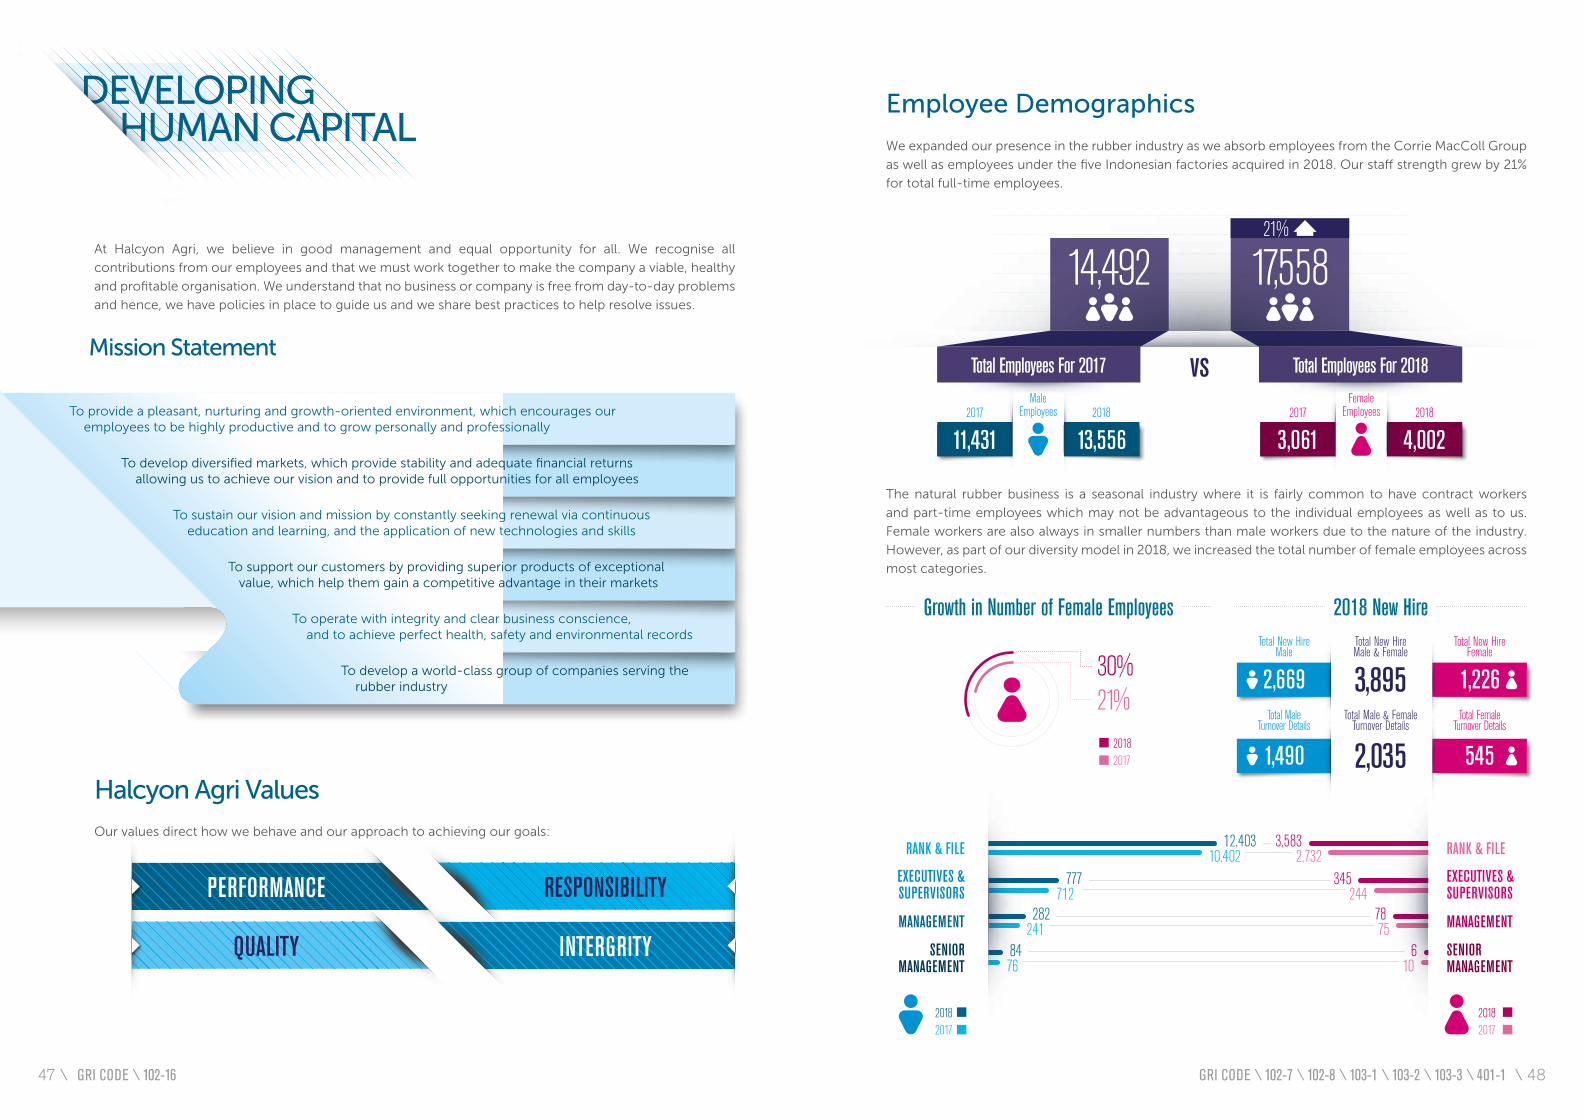
DEVELOPING HUMAN CAPITAL
At Halcyon Agri, we believe in good management and equal opportunity for all. We recognise all
contributions from our employees and that we must work together to make the company a viable, healthy
and profitable organisation. We understand that no business or company is free from day-to-day problems
and hence, we have policies in place to guide us and we share best practices to help resolve issues.
To develop a world-class group of companies serving the rubber industry
To operate with integrity and clear business conscience, and to achieve perfect health, safety and environmental records
To support our customers by providing superior products of exceptional value, which help them gain a competitive advantage in their markets
To sustain our vision and mission by constantly seeking renewal via continuous education and learning, and the application of new technologies and skills
To develop diversified markets, which provide stability and adequate financial returns allowing us to achieve our vision and to provide full opportunities for all employees
To provide a pleasant, nurturing and growth-oriented environment, which encourages our employees to be highly productive and to grow personally and professionally
Mission Statement
Halcyon Agri Values
Our values direct how we behave and our approach to achieving our goals:
PERFORMANCE
QUALITY INTERGRITY
RESPONSIBILITY
GRI CODE \ 102-16
vs2017
3,061 2018
4,002
FemaleEmployees2017
11,431 2018
13,556
MaleEmployees
Total Employees For 2018Total Employees For 2017
14,492 17,55821%
Employee Demographics We expanded our presence in the rubber industry as we absorb employees from the Corrie MacColl Group
as well as employees under the five Indonesian factories acquired in 2018. Our staff strength grew by 21%
for total full-time employees.
The natural rubber business is a seasonal industry where it is fairly common to have contract workers
and part-time employees which may not be advantageous to the individual employees as well as to us.
Female workers are also always in smaller numbers than male workers due to the nature of the industry.
However, as part of our diversity model in 2018, we increased the total number of female employees across
most categories.
20182017
21%30%
Growth in Number of Female Employees 2018 New Hire
1,490
Total MaleTurnover Details
2,669
Total New HireMale
Total Male & FemaleTurnover Details
2,035
Total New HireFemale
1,226Total Female
Turnover Details
545
Total New Hire Male & Female
3,895
GRI CODE \ 102-7 \ 102-8 \ 103-1 \ 103-2 \ 103-3 \ 401-1
10,40212,403
2,7323,583
712777
244345
7684
241282
7578
106
RANK & FILE
EXECUTIVES &SUPERVISORS
SENIORMANAGEMENT
MANAGEMENT
RANK & FILE
EXECUTIVES &SUPERVISORS
SENIORMANAGEMENT
MANAGEMENT
20182017
20182017
47 \ \ 48
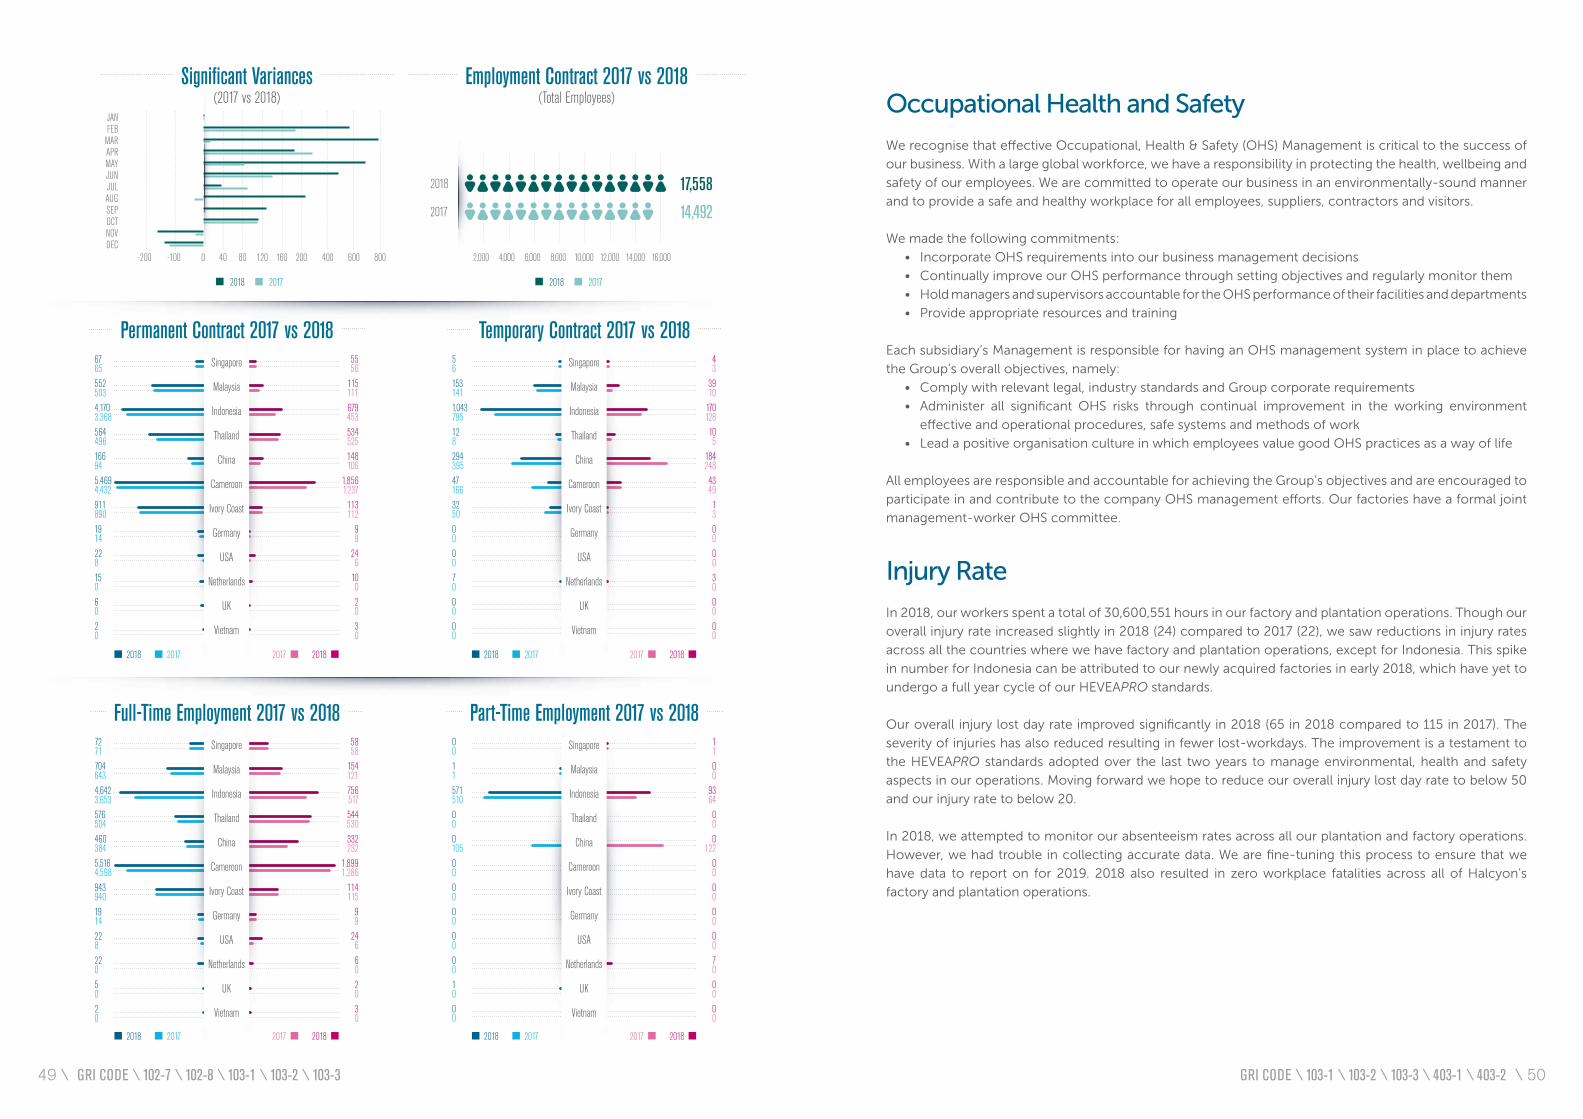
Significant Variances(2017 vs 2018)
20172018
-200 -100 0 40 40080 600120 160 800200
JANFEBMARAPR
SEP
MAY
OCT
JUN
NOV
JUL
DEC
AUG
Employment Contract 2017 vs 2018(Total Employees)
2017 14,492
2018 17,558
2,000 4,000 6,000 8,000 10,000 12,000 14,000 16,000
20172018
Permanent Contract 2017 vs 20185556
115111679453534525148106
1,8561,237113112
99
246
1002030
67655525034,1703,368564496166945,4694,43291189019142281506020
Singapore
Malaysia
Indonesia
Thailand
China
Cameroon
Ivory Coast
Germany
USA
Netherlands
UK
Vietnam
2017 201820172018
Temporary Contract 2017 vs 201843
3910
170128105
1842484349130000300000
561531411,0437951282943954716632500000700000
Singapore
Malaysia
Indonesia
Thailand
China
Cameroon
Ivory Coast
Germany
USA
Netherlands
UK
Vietnam
2017 201820172018
Full-Time Employment 2017 vs 20185858
154121756517544530332232
1,8991,286
114115
99
246602030
72717046434,6423,6535765044603845,5164,59894394019142282205020
Singapore
Malaysia
Indonesia
Thailand
China
Cameroon
Ivory Coast
Germany
USA
Netherlands
UK
Vietnam
2017 201820172018
Part-Time Employment 2017 vs 20181100
9364000
12200000000700000
001157151000010500000000001000
Singapore
Malaysia
Indonesia
Thailand
China
Cameroon
Ivory Coast
Germany
USA
Netherlands
UK
Vietnam
2017 201820172018
Occupational Health and Safety
We recognise that effective Occupational, Health & Safety (OHS) Management is critical to the success of
our business. With a large global workforce, we have a responsibility in protecting the health, wellbeing and
safety of our employees. We are committed to operate our business in an environmentally-sound manner
and to provide a safe and healthy workplace for all employees, suppliers, contractors and visitors.
We made the following commitments:
• Incorporate OHS requirements into our business management decisions
• Continually improve our OHS performance through setting objectives and regularly monitor them
• Hold managers and supervisors accountable for the OHS performance of their facilities and departments
• Provide appropriate resources and training
Each subsidiary’s Management is responsible for having an OHS management system in place to achieve
the Group’s overall objectives, namely:
• Comply with relevant legal, industry standards and Group corporate requirements
• Administer all significant OHS risks through continual improvement in the working environment
effective and operational procedures, safe systems and methods of work
• Lead a positive organisation culture in which employees value good OHS practices as a way of life
All employees are responsible and accountable for achieving the Group’s objectives and are encouraged to
participate in and contribute to the company OHS management efforts. Our factories have a formal joint
management-worker OHS committee.
Injury Rate
In 2018, our workers spent a total of 30,600,551 hours in our factory and plantation operations. Though our
overall injury rate increased slightly in 2018 (24) compared to 2017 (22), we saw reductions in injury rates
across all the countries where we have factory and plantation operations, except for Indonesia. This spike
in number for Indonesia can be attributed to our newly acquired factories in early 2018, which have yet to
undergo a full year cycle of our HEVEAPRO standards.
Our overall injury lost day rate improved significantly in 2018 (65 in 2018 compared to 115 in 2017). The
severity of injuries has also reduced resulting in fewer lost-workdays. The improvement is a testament to
the HEVEAPRO standards adopted over the last two years to manage environmental, health and safety
aspects in our operations. Moving forward we hope to reduce our overall injury lost day rate to below 50
and our injury rate to below 20.
In 2018, we attempted to monitor our absenteeism rates across all our plantation and factory operations.
However, we had trouble in collecting accurate data. We are fine-tuning this process to ensure that we
have data to report on for 2019. 2018 also resulted in zero workplace fatalities across all of Halcyon’s
factory and plantation operations.
GRI CODE \ 102-7 \ 102-8 \ 103-1 \ 103-2 \ 103-3 GRI CODE \ 103-1 \ 103-2 \ 103-3 \ 403-1 \ 403-249 \ \ 50
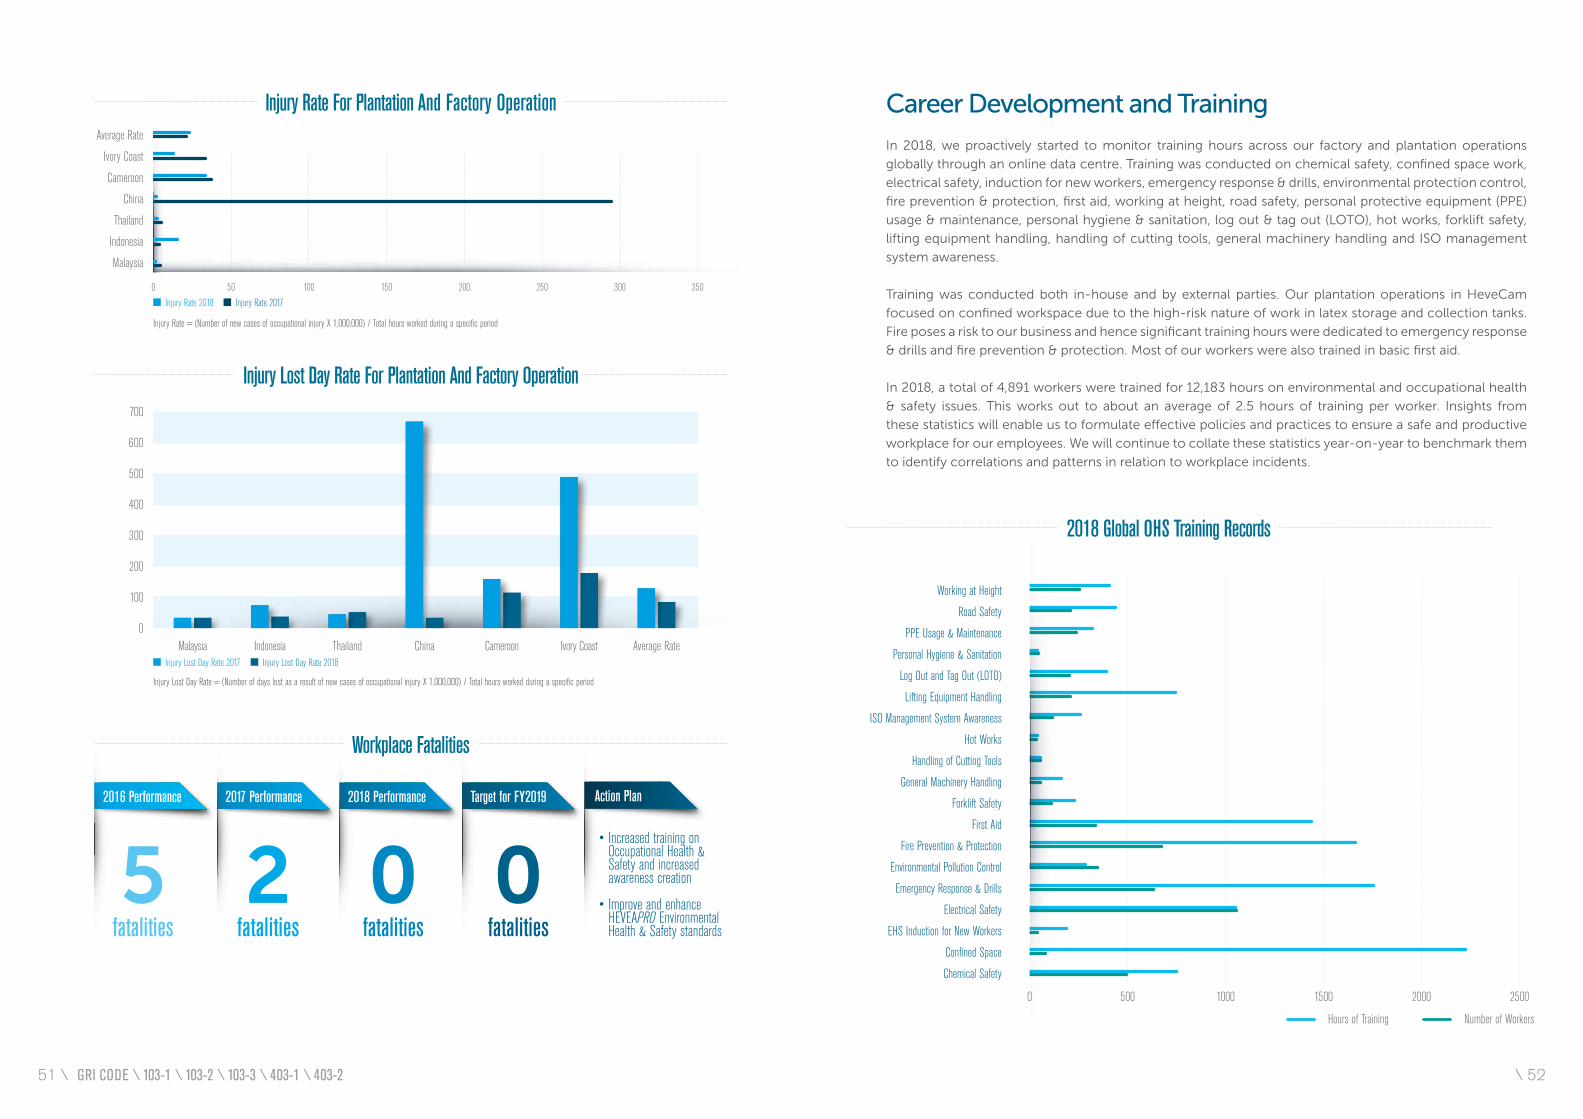
Action Plan
• Increased training on Occupational Health & Safety and increased awareness creation
• Improve and enhance HEVEAPRO Environmental Health & Safety standards
Target for FY2019
0fatalities
2018 Performance
0fatalities
2017 Performance
2fatalities
2016 Performance
5fatalities
Workplace Fatalities
Injury Lost Day Rate For Plantation And Factory Operation700
600
500
400
300
200
100
0Malaysia Indonesia Thailand China Cameroon Ivory Coast Average Rate
Injury Lost Day Rate 2017 Injury Lost Day Rate 2018
Injury Lost Day Rate = (Number of days lost as a result of new cases of occupational injury X 1,000,000) / Total hours worked during a specific period
Injury Rate For Plantation And Factory Operation
0 50 100 150 200 250 300 350
Average Rate
Ivory Coast
Cameroon
China
Thailand
Indonesia
Malaysia
Injury Rate 2018 Injury Rate 2017
Injury Rate = (Number of new cases of occupational injury X 1,000,000) / Total hours worked during a specific period
Career Development and Training
In 2018, we proactively started to monitor training hours across our factory and plantation operations
globally through an online data centre. Training was conducted on chemical safety, confined space work,
electrical safety, induction for new workers, emergency response & drills, environmental protection control,
fire prevention & protection, first aid, working at height, road safety, personal protective equipment (PPE)
usage & maintenance, personal hygiene & sanitation, log out & tag out (LOTO), hot works, forklift safety,
lifting equipment handling, handling of cutting tools, general machinery handling and ISO management
system awareness.
Training was conducted both in-house and by external parties. Our plantation operations in HeveCam
focused on confined workspace due to the high-risk nature of work in latex storage and collection tanks.
Fire poses a risk to our business and hence significant training hours were dedicated to emergency response
& drills and fire prevention & protection. Most of our workers were also trained in basic first aid.
In 2018, a total of 4,891 workers were trained for 12,183 hours on environmental and occupational health
& safety issues. This works out to about an average of 2.5 hours of training per worker. Insights from
these statistics will enable us to formulate effective policies and practices to ensure a safe and productive
workplace for our employees. We will continue to collate these statistics year-on-year to benchmark them
to identify correlations and patterns in relation to workplace incidents.
0 500 1000 1500 2000 2500
Working at Height
Road Safety
PPE Usage & Maintenance
Personal Hygiene & Sanitation
Log Out and Tag Out (LOTO)
Lifting Equipment Handling
ISO Management System Awareness
Hot Works
Handling of Cutting Tools
General Machinery Handling
Forklift Safety
First Aid
Fire Prevention & Protection
Environmental Pollution Control
Emergency Response & Drills
Electrical Safety
EHS Induction for New Workers
Confined Space
Chemical Safety
Hours of Training Number of Workers
2018 Global OHS Training Records
GRI CODE \ 103-1 \ 103-2 \ 103-3 \ 403-1 \ 403-251 \ \ 52
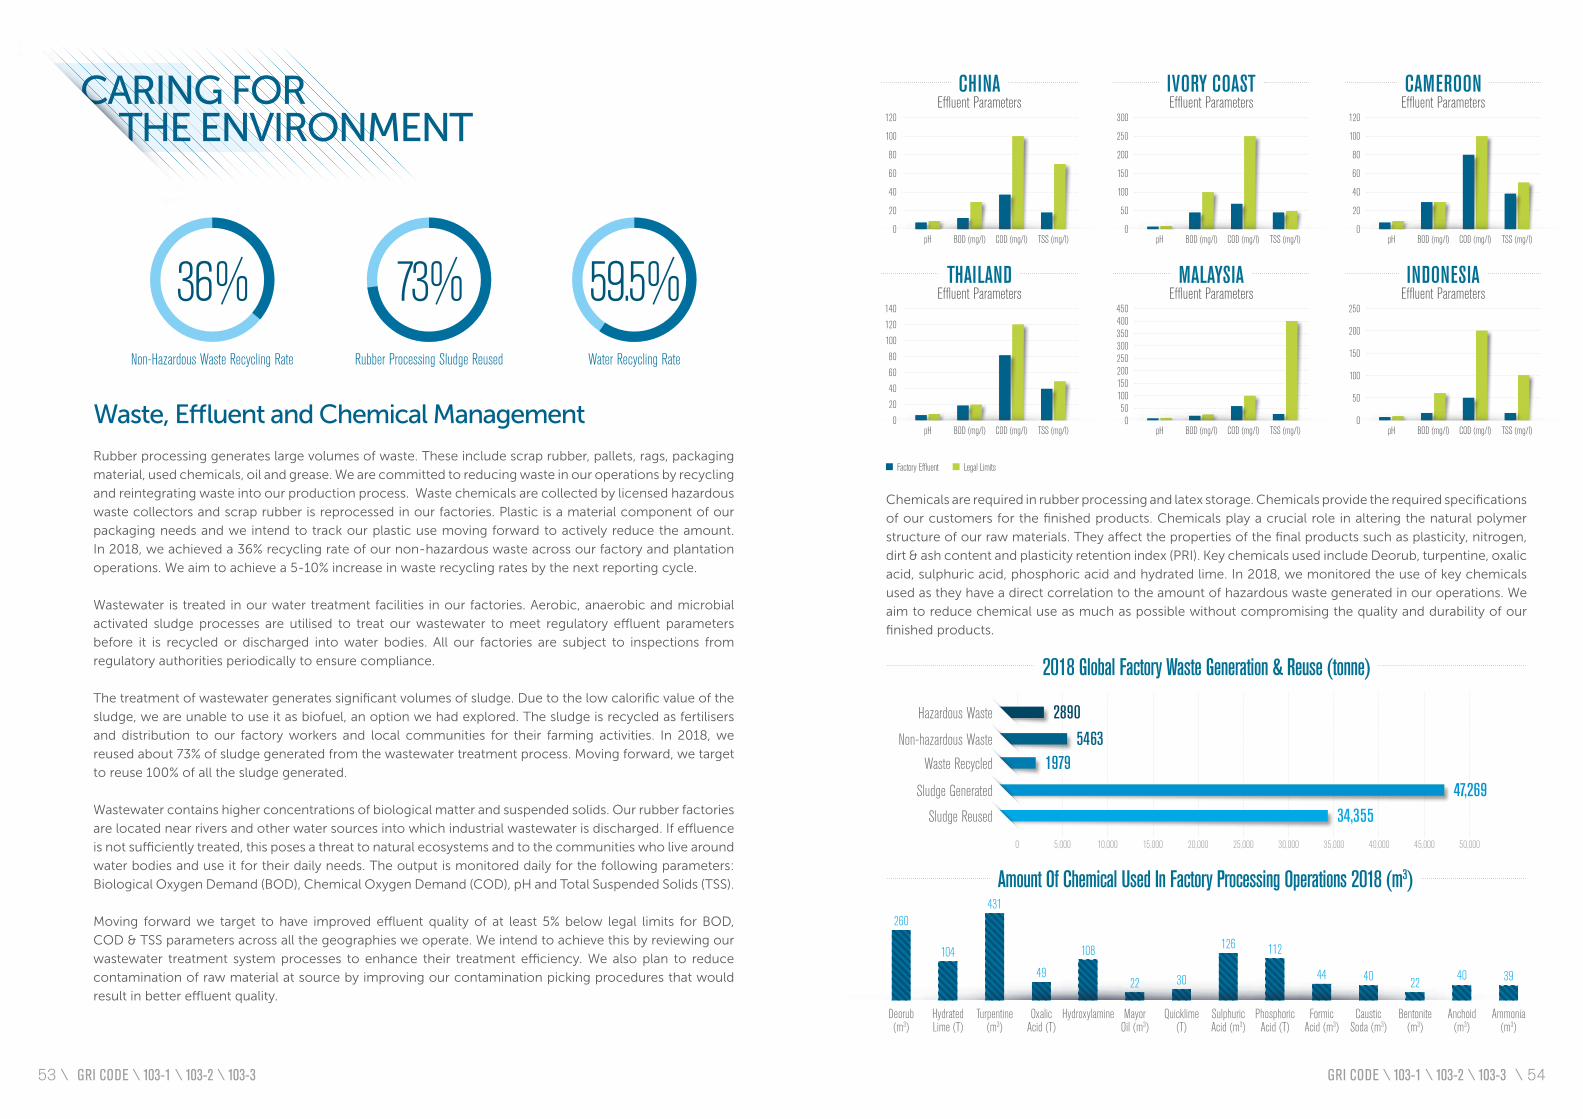
CHINAEffluent Parameters
pH COD (mg/l)BOD (mg/l) TSS (mg/l)
120
100
80
60
40
20
0
CAMEROONEffluent Parameters
pH COD (mg/l)BOD (mg/l) TSS (mg/l)
120
100
80
60
40
20
0
INDONESIAEffluent Parameters
pH COD (mg/l)BOD (mg/l) TSS (mg/l)
250
200
150
100
50
0
THAILANDEffluent Parameters
pH COD (mg/l)BOD (mg/l) TSS (mg/l)
140
120
100
80
60
40
20
0
IVORY COASTEffluent Parameters
pH COD (mg/l)BOD (mg/l) TSS (mg/l)
300
250
200
150
100
50
0
MALAYSIAEffluent Parameters
pH COD (mg/l)BOD (mg/l) TSS (mg/l)
450400350300250200150100500
Factory Effluent Legal Limits
2018 Global Factory Waste Generation & Reuse (tonne)
0 20,0005,000 25,00010,000 30,000 40,00015,000 35,000 45,000 50,000
Hazardous Waste 2890Non-hazardous Waste 5463
Waste Recycled 1979
Sludge Generated 47,269Sludge Reused 34,355
Amount Of Chemical Used In Factory Processing Operations 2018 (m3)
Deorub(m3)
260
HydratedLime (T)
104
Turpentine(m3)
431
SulphuricAcid (m3)
126
Hydroxylamine
108
PhosphoricAcid (T)
112
OxalicAcid (T)
49
FormicAcid (m3)
44
CausticSoda (m3)
40
Bentonite(m3)
22
Anchoid(m3)
40
Ammonia(m3)
39
MayorOil (m3)
22
Quicklime(T)
30
Waste, Effluent and Chemical Management
Rubber processing generates large volumes of waste. These include scrap rubber, pallets, rags, packaging
material, used chemicals, oil and grease. We are committed to reducing waste in our operations by recycling
and reintegrating waste into our production process. Waste chemicals are collected by licensed hazardous
waste collectors and scrap rubber is reprocessed in our factories. Plastic is a material component of our
packaging needs and we intend to track our plastic use moving forward to actively reduce the amount.
In 2018, we achieved a 36% recycling rate of our non-hazardous waste across our factory and plantation
operations. We aim to achieve a 5-10% increase in waste recycling rates by the next reporting cycle.
Wastewater is treated in our water treatment facilities in our factories. Aerobic, anaerobic and microbial
activated sludge processes are utilised to treat our wastewater to meet regulatory effluent parameters
before it is recycled or discharged into water bodies. All our factories are subject to inspections from
regulatory authorities periodically to ensure compliance.
The treatment of wastewater generates significant volumes of sludge. Due to the low calorific value of the
sludge, we are unable to use it as biofuel, an option we had explored. The sludge is recycled as fertilisers
and distribution to our factory workers and local communities for their farming activities. In 2018, we
reused about 73% of sludge generated from the wastewater treatment process. Moving forward, we target
to reuse 100% of all the sludge generated.
Wastewater contains higher concentrations of biological matter and suspended solids. Our rubber factories
are located near rivers and other water sources into which industrial wastewater is discharged. If effluence
is not sufficiently treated, this poses a threat to natural ecosystems and to the communities who live around
water bodies and use it for their daily needs. The output is monitored daily for the following parameters:
Biological Oxygen Demand (BOD), Chemical Oxygen Demand (COD), pH and Total Suspended Solids (TSS).
Moving forward we target to have improved effluent quality of at least 5% below legal limits for BOD,
COD & TSS parameters across all the geographies we operate. We intend to achieve this by reviewing our
wastewater treatment system processes to enhance their treatment efficiency. We also plan to reduce
contamination of raw material at source by improving our contamination picking procedures that would
result in better effluent quality.
CARING FOR THE ENVIRONMENT
Water Recycling Rate
59.5%Rubber Processing Sludge Reused
73%Non-Hazardous Waste Recycling Rate
36%
Chemicals are required in rubber processing and latex storage. Chemicals provide the required specifications
of our customers for the finished products. Chemicals play a crucial role in altering the natural polymer
structure of our raw materials. They affect the properties of the final products such as plasticity, nitrogen,
dirt & ash content and plasticity retention index (PRI). Key chemicals used include Deorub, turpentine, oxalic
acid, sulphuric acid, phosphoric acid and hydrated lime. In 2018, we monitored the use of key chemicals
used as they have a direct correlation to the amount of hazardous waste generated in our operations. We
aim to reduce chemical use as much as possible without compromising the quality and durability of our
finished products.
GRI CODE \ 103-1 \ 103-2 \ 103-3 GRI CODE \ 103-1 \ 103-2 \ 103-353 \ \ 54
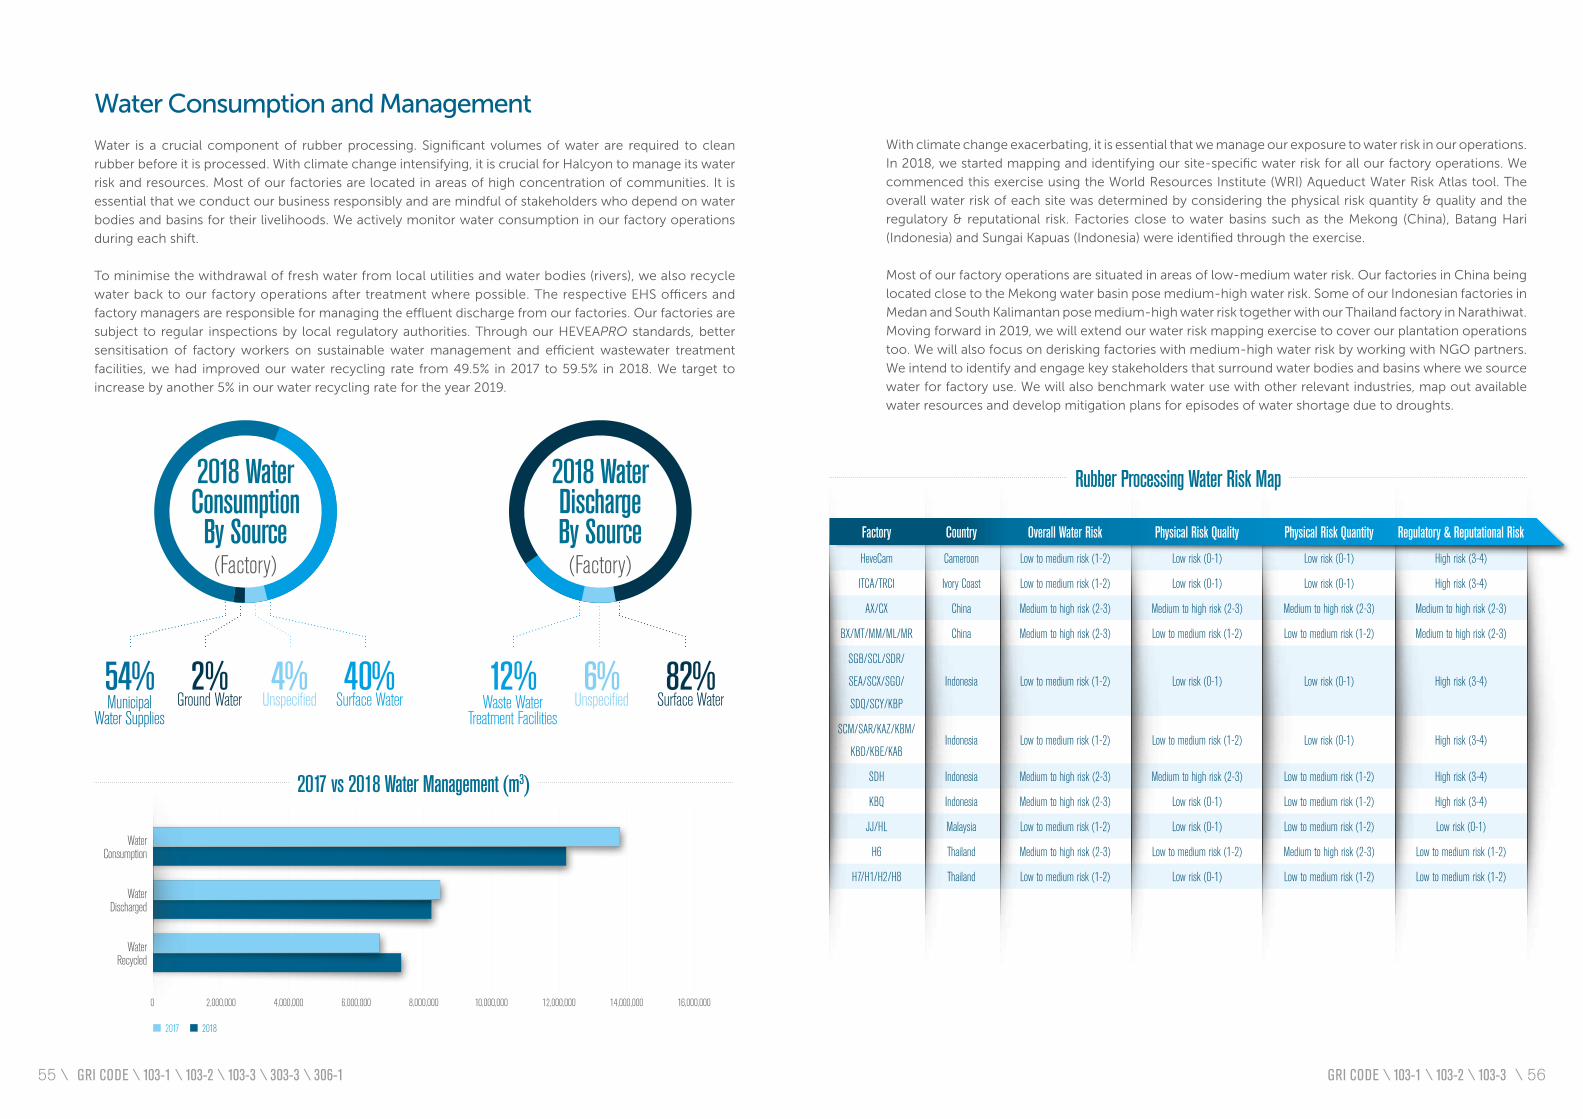
2018 WaterDischargeBy Source(Factory)
82%Surface Water
12%Waste Water
Treatment Facilities
6% Unspecified
2018 WaterConsumptionBy Source(Factory)
40%Surface Water
54%Municipal
Water Supplies
2%Ground Water
4% Unspecified
2017 vs 2018 Water Management (m3)
WaterConsumption
Water Recycled
Water Discharged
16,000,0002,000,0000 6,000,000 12,000,0004,000,000 10,000,0008,000,000 14,000,000
2017 2018
HeveCam Cameroon Low to medium risk (1-2) Low risk (0-1) Low risk (0-1) High risk (3-4)
ITCA/TRCI Ivory Coast Low to medium risk (1-2) Low risk (0-1) Low risk (0-1) High risk (3-4)
AX/CX China Medium to high risk (2-3) Medium to high risk (2-3) Medium to high risk (2-3) Medium to high risk (2-3)
BX/MT/MM/ML/MR China Medium to high risk (2-3) Low to medium risk (1-2) Low to medium risk (1-2) Medium to high risk (2-3)
SGB/SCL/SDR/
SEA/SCX/SGO/
SDQ/SCY/KBP
Indonesia Low to medium risk (1-2) Low risk (0-1) Low risk (0-1) High risk (3-4)
SCM/SAR/KAZ/KBM/
KBD/KBE/KABIndonesia Low to medium risk (1-2) Low to medium risk (1-2) Low risk (0-1) High risk (3-4)
SDH Indonesia Medium to high risk (2-3) Medium to high risk (2-3) Low to medium risk (1-2) High risk (3-4)
KBQ Indonesia Medium to high risk (2-3) Low risk (0-1) Low to medium risk (1-2) High risk (3-4)
JJ/HL Malaysia Low to medium risk (1-2) Low risk (0-1) Low to medium risk (1-2) Low risk (0-1)
H6 Thailand Medium to high risk (2-3) Low to medium risk (1-2) Medium to high risk (2-3) Low to medium risk (1-2)
H7/H1/H2/H8 Thailand Low to medium risk (1-2) Low risk (0-1) Low to medium risk (1-2) Low to medium risk (1-2)
Factory Country Overall Water Risk Physical Risk Quality Physical Risk Quantity Regulatory & Reputational Risk
Rubber Processing Water Risk Map
Water Consumption and Management
Water is a crucial component of rubber processing. Significant volumes of water are required to clean
rubber before it is processed. With climate change intensifying, it is crucial for Halcyon to manage its water
risk and resources. Most of our factories are located in areas of high concentration of communities. It is
essential that we conduct our business responsibly and are mindful of stakeholders who depend on water
bodies and basins for their livelihoods. We actively monitor water consumption in our factory operations
during each shift.
To minimise the withdrawal of fresh water from local utilities and water bodies (rivers), we also recycle
water back to our factory operations after treatment where possible. The respective EHS officers and
factory managers are responsible for managing the effluent discharge from our factories. Our factories are
subject to regular inspections by local regulatory authorities. Through our HEVEAPRO standards, better
sensitisation of factory workers on sustainable water management and efficient wastewater treatment
facilities, we had improved our water recycling rate from 49.5% in 2017 to 59.5% in 2018. We target to
increase by another 5% in our water recycling rate for the year 2019.
With climate change exacerbating, it is essential that we manage our exposure to water risk in our operations.
In 2018, we started mapping and identifying our site-specific water risk for all our factory operations. We
commenced this exercise using the World Resources Institute (WRI) Aqueduct Water Risk Atlas tool. The
overall water risk of each site was determined by considering the physical risk quantity & quality and the
regulatory & reputational risk. Factories close to water basins such as the Mekong (China), Batang Hari
(Indonesia) and Sungai Kapuas (Indonesia) were identified through the exercise.
Most of our factory operations are situated in areas of low-medium water risk. Our factories in China being
located close to the Mekong water basin pose medium-high water risk. Some of our Indonesian factories in
Medan and South Kalimantan pose medium-high water risk together with our Thailand factory in Narathiwat.
Moving forward in 2019, we will extend our water risk mapping exercise to cover our plantation operations
too. We will also focus on derisking factories with medium-high water risk by working with NGO partners.
We intend to identify and engage key stakeholders that surround water bodies and basins where we source
water for factory use. We will also benchmark water use with other relevant industries, map out available
water resources and develop mitigation plans for episodes of water shortage due to droughts.
GRI CODE \ 103-1 \ 103-2 \ 103-3 \ 303-3 \ 306-1 GRI CODE \ 103-1 \ 103-2 \ 103-355 \ \ 56
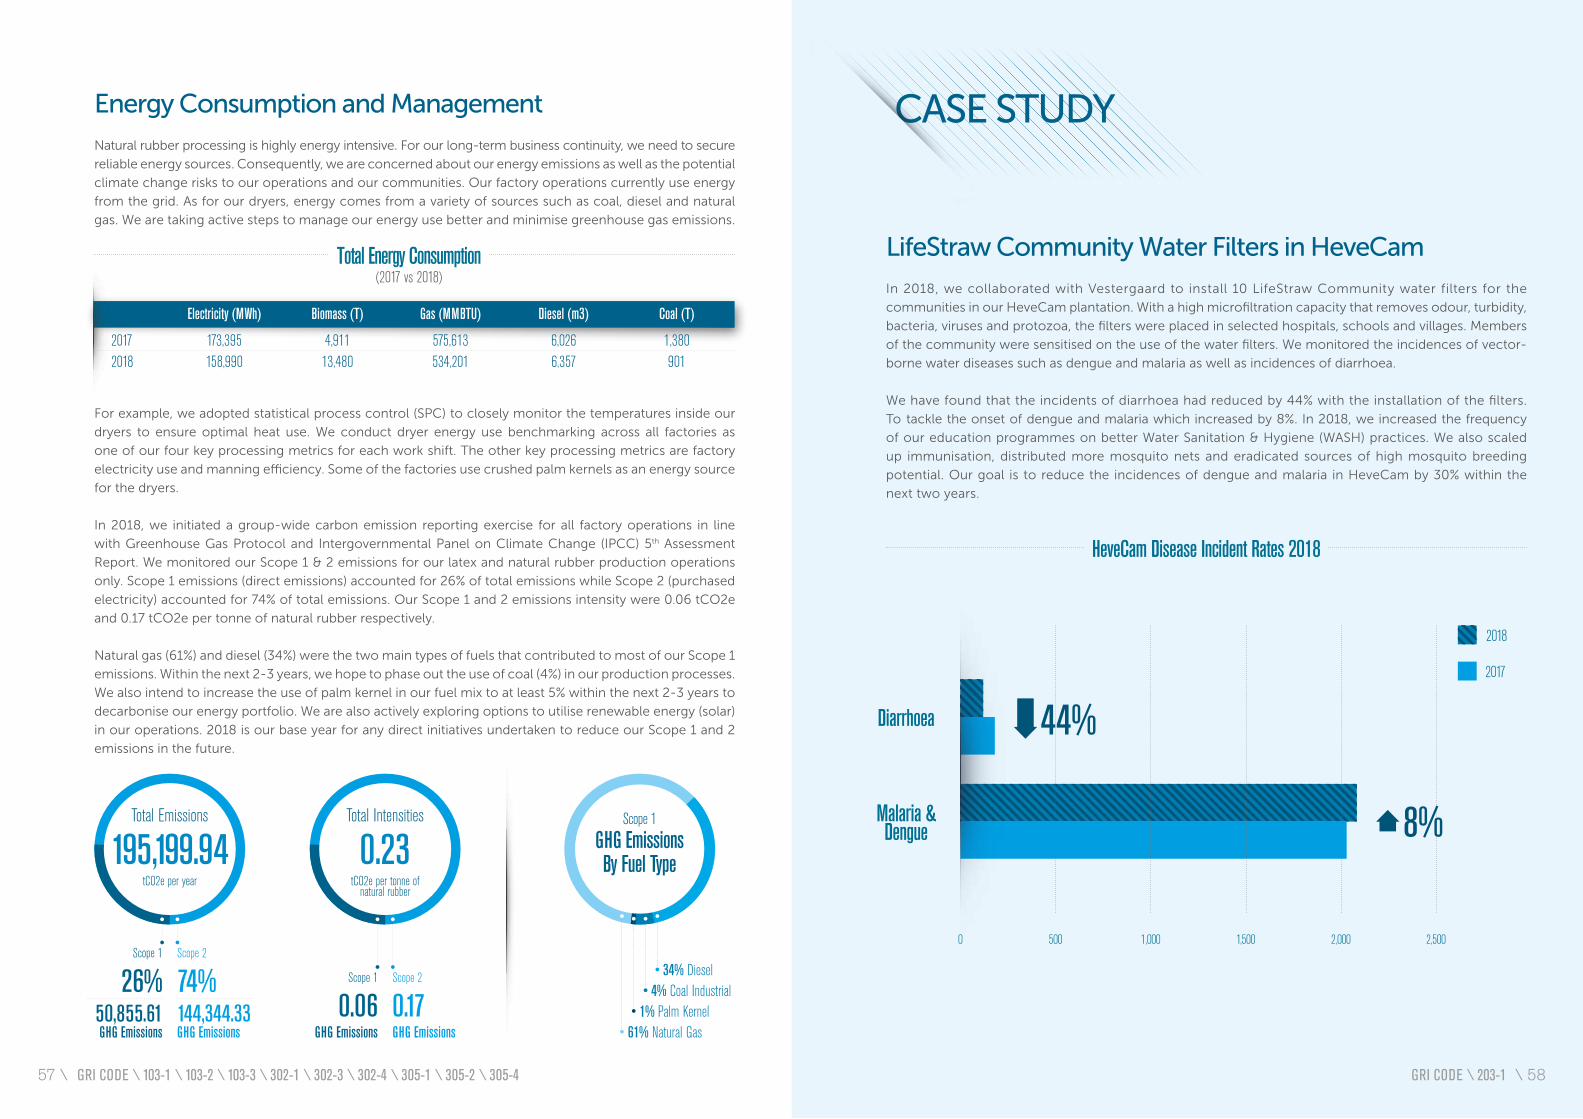
Scope 1 GHG EmissionsBy Fuel Type
61% Natural Gas1% Palm Kernel
4% Coal Industrial34% Diesel
144,344.33GHG Emissions
50,855.61 GHG Emissions
Scope 2
74%Scope 1
26%
Total Emissions
195,199.94tCO2e per year
GHG EmissionsGHG Emissions
Scope 2
0.17Scope 1
0.06
Total Intensities
0.23tCO2e per tonne of
natural rubber
HeveCam Disease Incident Rates 2018
Diarrhoea
Malaria & Dengue
0 1,000 2,000500 1,500 2,500
2018
2017
44%
8%
Total Energy Consumption(2017 vs 2018)
Electricity (MWh) Biomass (T) Gas (MMBTU) Diesel (m3) Coal (T)
2017 173,395 4,911 575,613 6,026 1,380 2018 158,990 13,480 534,201 6,357 901
Energy Consumption and Management
Natural rubber processing is highly energy intensive. For our long-term business continuity, we need to secure
reliable energy sources. Consequently, we are concerned about our energy emissions as well as the potential
climate change risks to our operations and our communities. Our factory operations currently use energy
from the grid. As for our dryers, energy comes from a variety of sources such as coal, diesel and natural
gas. We are taking active steps to manage our energy use better and minimise greenhouse gas emissions.
For example, we adopted statistical process control (SPC) to closely monitor the temperatures inside our
dryers to ensure optimal heat use. We conduct dryer energy use benchmarking across all factories as
one of our four key processing metrics for each work shift. The other key processing metrics are factory
electricity use and manning efficiency. Some of the factories use crushed palm kernels as an energy source
for the dryers.
In 2018, we initiated a group-wide carbon emission reporting exercise for all factory operations in line
with Greenhouse Gas Protocol and Intergovernmental Panel on Climate Change (IPCC) 5th Assessment
Report. We monitored our Scope 1 & 2 emissions for our latex and natural rubber production operations
only. Scope 1 emissions (direct emissions) accounted for 26% of total emissions while Scope 2 (purchased
electricity) accounted for 74% of total emissions. Our Scope 1 and 2 emissions intensity were 0.06 tCO2e
and 0.17 tCO2e per tonne of natural rubber respectively.
Natural gas (61%) and diesel (34%) were the two main types of fuels that contributed to most of our Scope 1
emissions. Within the next 2-3 years, we hope to phase out the use of coal (4%) in our production processes.
We also intend to increase the use of palm kernel in our fuel mix to at least 5% within the next 2-3 years to
decarbonise our energy portfolio. We are also actively exploring options to utilise renewable energy (solar)
in our operations. 2018 is our base year for any direct initiatives undertaken to reduce our Scope 1 and 2
emissions in the future.
CASE STUDY
LifeStraw Community Water Filters in HeveCam
In 2018, we collaborated with Vestergaard to install 10 LifeStraw Community water filters for the
communities in our HeveCam plantation. With a high microfiltration capacity that removes odour, turbidity,
bacteria, viruses and protozoa, the filters were placed in selected hospitals, schools and villages. Members
of the community were sensitised on the use of the water filters. We monitored the incidences of vector-
borne water diseases such as dengue and malaria as well as incidences of diarrhoea.
We have found that the incidents of diarrhoea had reduced by 44% with the installation of the filters.
To tackle the onset of dengue and malaria which increased by 8%. In 2018, we increased the frequency
of our education programmes on better Water Sanitation & Hygiene (WASH) practices. We also scaled
up immunisation, distributed more mosquito nets and eradicated sources of high mosquito breeding
potential. Our goal is to reduce the incidences of dengue and malaria in HeveCam by 30% within the
next two years.
GRI CODE \ 103-1 \ 103-2 \ 103-3 \ 302-1 \ 302-3 \ 302-4 \ 305-1 \ 305-2 \ 305-4 GRI CODE \ 203-157 \ \ 58
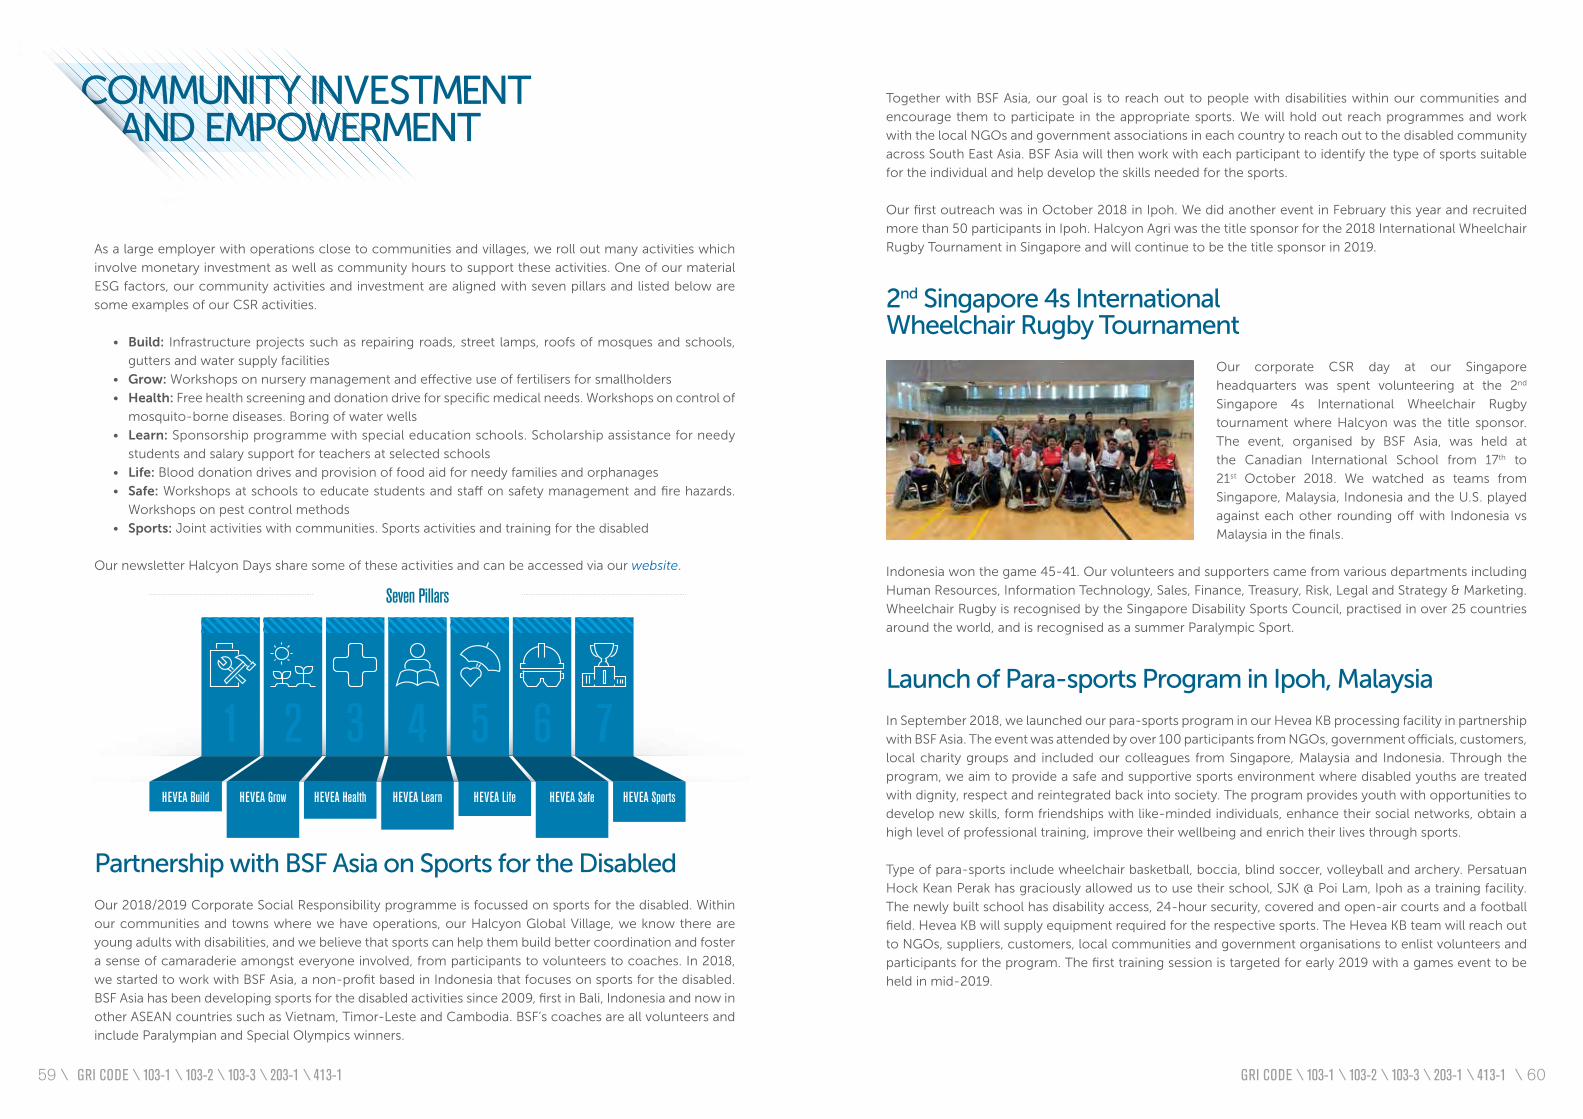
Seven Pillars
1HEVEA Build
3HEVEA Health
5HEVEA Life
2HEVEA Grow
4HEVEA Learn
6HEVEA Safe
7HEVEA Sports
As a large employer with operations close to communities and villages, we roll out many activities which
involve monetary investment as well as community hours to support these activities. One of our material
ESG factors, our community activities and investment are aligned with seven pillars and listed below are
some examples of our CSR activities.
• Build: Infrastructure projects such as repairing roads, street lamps, roofs of mosques and schools,
gutters and water supply facilities
• Grow: Workshops on nursery management and effective use of fertilisers for smallholders
• Health: Free health screening and donation drive for specific medical needs. Workshops on control of
mosquito-borne diseases. Boring of water wells
• Learn: Sponsorship programme with special education schools. Scholarship assistance for needy
students and salary support for teachers at selected schools
• Life: Blood donation drives and provision of food aid for needy families and orphanages
• Safe: Workshops at schools to educate students and staff on safety management and fire hazards.
Workshops on pest control methods
• Sports: Joint activities with communities. Sports activities and training for the disabled
Our newsletter Halcyon Days share some of these activities and can be accessed via our website.
COMMUNITY INVESTMENT AND EMPOWERMENT
Partnership with BSF Asia on Sports for the Disabled
Our 2018/2019 Corporate Social Responsibility programme is focussed on sports for the disabled. Within
our communities and towns where we have operations, our Halcyon Global Village, we know there are
young adults with disabilities, and we believe that sports can help them build better coordination and foster
a sense of camaraderie amongst everyone involved, from participants to volunteers to coaches. In 2018,
we started to work with BSF Asia, a non-profit based in Indonesia that focuses on sports for the disabled.
BSF Asia has been developing sports for the disabled activities since 2009, first in Bali, Indonesia and now in
other ASEAN countries such as Vietnam, Timor-Leste and Cambodia. BSF’s coaches are all volunteers and
include Paralympian and Special Olympics winners.
Together with BSF Asia, our goal is to reach out to people with disabilities within our communities and
encourage them to participate in the appropriate sports. We will hold out reach programmes and work
with the local NGOs and government associations in each country to reach out to the disabled community
across South East Asia. BSF Asia will then work with each participant to identify the type of sports suitable
for the individual and help develop the skills needed for the sports.
Our first outreach was in October 2018 in Ipoh. We did another event in February this year and recruited
more than 50 participants in Ipoh. Halcyon Agri was the title sponsor for the 2018 International Wheelchair
Rugby Tournament in Singapore and will continue to be the title sponsor in 2019.
2nd Singapore 4s International Wheelchair Rugby Tournament
Our corporate CSR day at our Singapore
headquarters was spent volunteering at the 2nd
Singapore 4s International Wheelchair Rugby
tournament where Halcyon was the title sponsor.
The event, organised by BSF Asia, was held at
the Canadian International School from 17th to
21st October 2018. We watched as teams from
Singapore, Malaysia, Indonesia and the U.S. played
against each other rounding off with Indonesia vs
Malaysia in the finals.
Indonesia won the game 45-41. Our volunteers and supporters came from various departments including
Human Resources, Information Technology, Sales, Finance, Treasury, Risk, Legal and Strategy & Marketing.
Wheelchair Rugby is recognised by the Singapore Disability Sports Council, practised in over 25 countries
around the world, and is recognised as a summer Paralympic Sport.
Launch of Para-sports Program in Ipoh, Malaysia
In September 2018, we launched our para-sports program in our Hevea KB processing facility in partnership
with BSF Asia. The event was attended by over 100 participants from NGOs, government officials, customers,
local charity groups and included our colleagues from Singapore, Malaysia and Indonesia. Through the
program, we aim to provide a safe and supportive sports environment where disabled youths are treated
with dignity, respect and reintegrated back into society. The program provides youth with opportunities to
develop new skills, form friendships with like-minded individuals, enhance their social networks, obtain a
high level of professional training, improve their wellbeing and enrich their lives through sports.
Type of para-sports include wheelchair basketball, boccia, blind soccer, volleyball and archery. Persatuan
Hock Kean Perak has graciously allowed us to use their school, SJK @ Poi Lam, Ipoh as a training facility.
The newly built school has disability access, 24-hour security, covered and open-air courts and a football
field. Hevea KB will supply equipment required for the respective sports. The Hevea KB team will reach out
to NGOs, suppliers, customers, local communities and government organisations to enlist volunteers and
participants for the program. The first training session is targeted for early 2019 with a games event to be
held in mid-2019.
GRI CODE \ 103-1 \ 103-2 \ 103-3 \ 203-1 \ 413-1 GRI CODE \ 103-1 \ 103-2 \ 103-3 \ 203-1 \ 413-159 \ \ 60
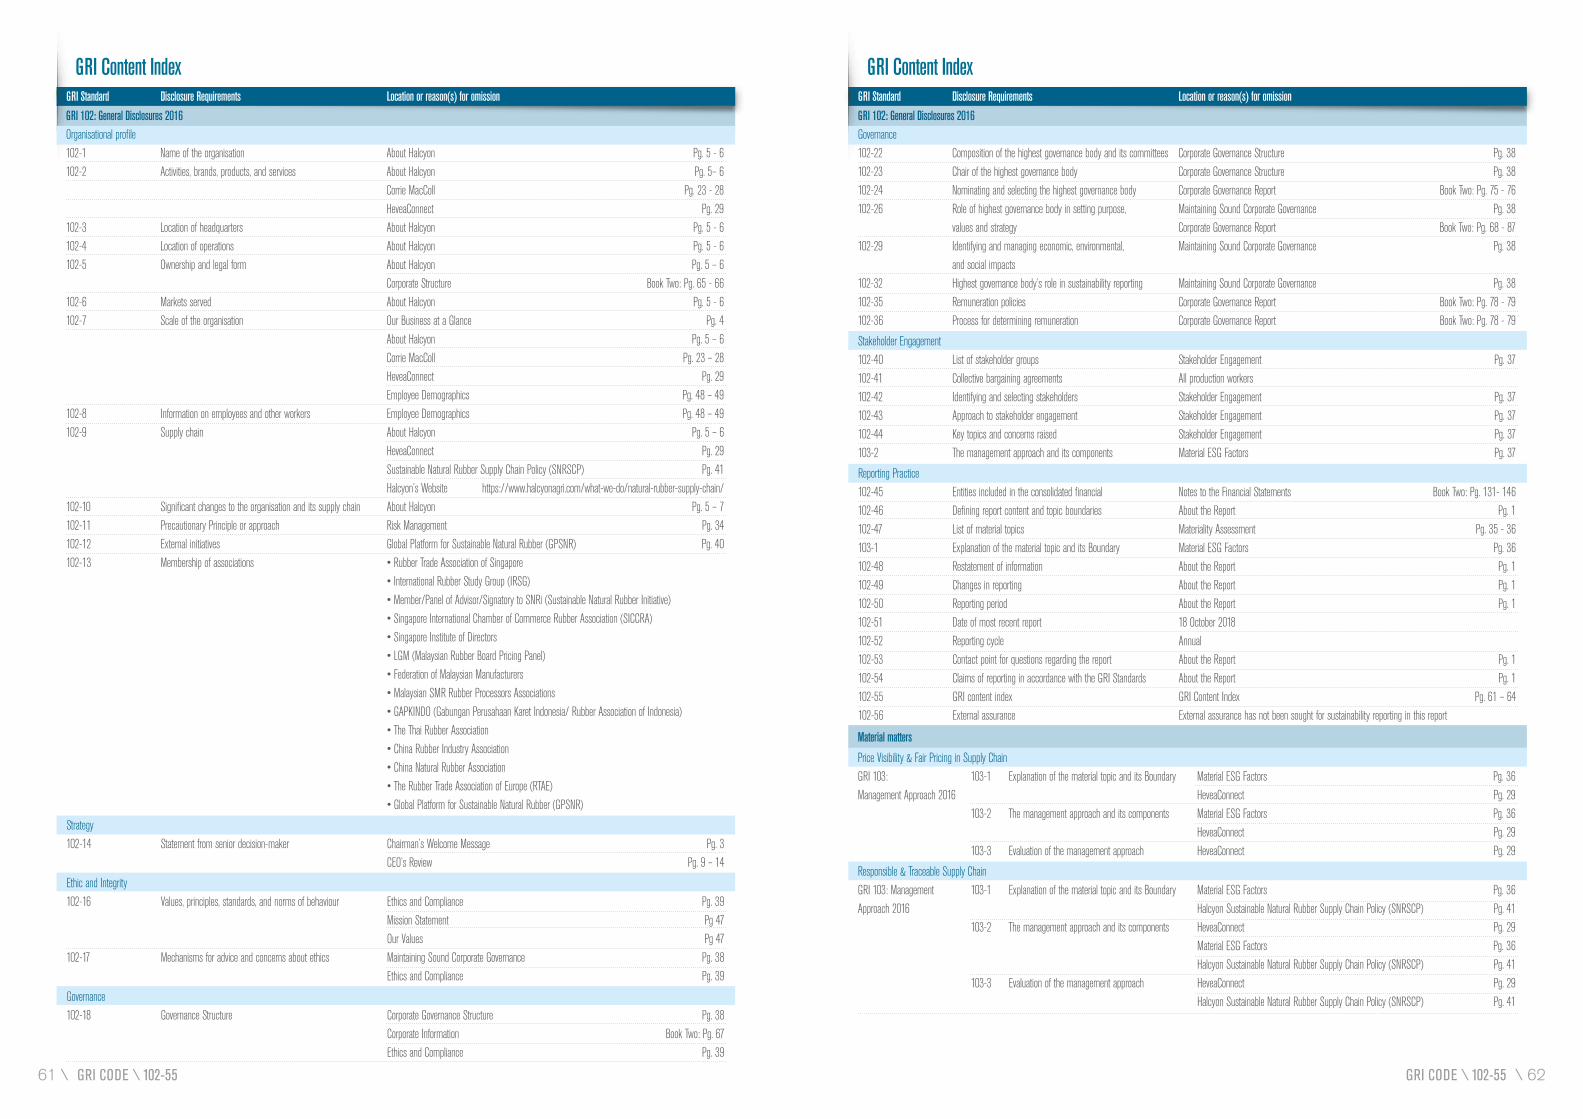
GRI Content IndexGRI Standard Disclosure Requirements Location or reason(s) for omission
GRI Content IndexGRI Standard Disclosure Requirements Location or reason(s) for omission
Material matters
Price Visibility & Fair Pricing in Supply ChainGRI 103: 103-1 Explanation of the material topic and its Boundary Material ESG Factors Pg. 36Management Approach 2016 HeveaConnect Pg. 29 103-2 The management approach and its components Material ESG Factors Pg. 36 HeveaConnect Pg. 29 103-3 Evaluation of the management approach HeveaConnect Pg. 29
Responsible & Traceable Supply ChainGRI 103: Management 103-1 Explanation of the material topic and its Boundary Material ESG Factors Pg. 36 Approach 2016 Halcyon Sustainable Natural Rubber Supply Chain Policy (SNRSCP) Pg. 41 103-2 The management approach and its components HeveaConnect Pg. 29 Material ESG Factors Pg. 36 Halcyon Sustainable Natural Rubber Supply Chain Policy (SNRSCP) Pg. 41 103-3 Evaluation of the management approach HeveaConnect Pg. 29 Halcyon Sustainable Natural Rubber Supply Chain Policy (SNRSCP) Pg. 41
GRI 102: General Disclosures 2016Governance102-22 Composition of the highest governance body and its committees Corporate Governance Structure Pg. 38102-23 Chair of the highest governance body Corporate Governance Structure Pg. 38102-24 Nominating and selecting the highest governance body Corporate Governance Report Book Two: Pg. 75 - 76 102-26 Role of highest governance body in setting purpose, Maintaining Sound Corporate Governance Pg. 38 values and strategy Corporate Governance Report Book Two: Pg. 68 - 87102-29 Identifying and managing economic, environmental, Maintaining Sound Corporate Governance Pg. 38 and social impacts102-32 Highest governance body’s role in sustainability reporting Maintaining Sound Corporate Governance Pg. 38102-35 Remuneration policies Corporate Governance Report Book Two: Pg. 78 - 79102-36 Process for determining remuneration Corporate Governance Report Book Two: Pg. 78 - 79
Stakeholder Engagement102-40 List of stakeholder groups Stakeholder Engagement Pg. 37102-41 Collective bargaining agreements All production workers 102-42 Identifying and selecting stakeholders Stakeholder Engagement Pg. 37102-43 Approach to stakeholder engagement Stakeholder Engagement Pg. 37102-44 Key topics and concerns raised Stakeholder Engagement Pg. 37103-2 The management approach and its components Material ESG Factors Pg. 37
Reporting Practice102-45 Entities included in the consolidated financial Notes to the Financial Statements Book Two: Pg. 131- 146102-46 Defining report content and topic boundaries About the Report Pg. 1 102-47 List of material topics Materiality Assessment Pg. 35 - 36103-1 Explanation of the material topic and its Boundary Material ESG Factors Pg. 36102-48 Restatement of information About the Report Pg. 1102-49 Changes in reporting About the Report Pg. 1102-50 Reporting period About the Report Pg. 1102-51 Date of most recent report 18 October 2018102-52 Reporting cycle Annual102-53 Contact point for questions regarding the report About the Report Pg. 1102-54 Claims of reporting in accordance with the GRI Standards About the Report Pg. 1102-55 GRI content index GRI Content Index Pg. 61 – 64102-56 External assurance External assurance has not been sought for sustainability reporting in this report
GRI 102: General Disclosures 2016Organisational profile102-1 Name of the organisation About Halcyon Pg. 5 - 6102-2 Activities, brands, products, and services About Halcyon Pg. 5– 6 Corrie MacColl Pg. 23 - 28 HeveaConnect Pg. 29102-3 Location of headquarters About Halcyon Pg. 5 - 6102-4 Location of operations About Halcyon Pg. 5 - 6102-5 Ownership and legal form About Halcyon Pg. 5 – 6 Corporate Structure Book Two: Pg. 65 - 66102-6 Markets served About Halcyon Pg. 5 - 6102-7 Scale of the organisation Our Business at a Glance Pg. 4 About Halcyon Pg. 5 – 6 Corrie MacColl Pg. 23 – 28 HeveaConnect Pg. 29 Employee Demographics Pg. 48 – 49102-8 Information on employees and other workers Employee Demographics Pg. 48 – 49102-9 Supply chain About Halcyon Pg. 5 – 6 HeveaConnect Pg. 29 Sustainable Natural Rubber Supply Chain Policy (SNRSCP) Pg. 41 Halcyon’s Website https://www.halcyonagri.com/what-we-do/natural-rubber-supply-chain/102-10 Significant changes to the organisation and its supply chain About Halcyon Pg. 5 – 7102-11 Precautionary Principle or approach Risk Management Pg. 34 102-12 External initiatives Global Platform for Sustainable Natural Rubber (GPSNR) Pg. 40102-13 Membership of associations • Rubber Trade Association of Singapore • International Rubber Study Group (IRSG) • Member/Panel of Advisor/Signatory to SNRi (Sustainable Natural Rubber Initiative) • Singapore International Chamber of Commerce Rubber Association (SICCRA) • Singapore Institute of Directors • LGM (Malaysian Rubber Board Pricing Panel) • Federation of Malaysian Manufacturers • Malaysian SMR Rubber Processors Associations • GAPKINDO (Gabungan Perusahaan Karet Indonesia/ Rubber Association of Indonesia) • The Thai Rubber Association • China Rubber Industry Association • China Natural Rubber Association • The Rubber Trade Association of Europe (RTAE) • Global Platform for Sustainable Natural Rubber (GPSNR)
Strategy102-14 Statement from senior decision-maker Chairman’s Welcome Message Pg. 3 CEO’s Review Pg. 9 – 14
Ethic and Integrity102-16 Values, principles, standards, and norms of behaviour Ethics and Compliance Pg. 39 Mission Statement Pg 47 Our Values Pg 47102-17 Mechanisms for advice and concerns about ethics Maintaining Sound Corporate Governance Pg. 38 Ethics and Compliance Pg. 39
Governance102-18 Governance Structure Corporate Governance Structure Pg. 38 Corporate Information Book Two: Pg. 67 Ethics and Compliance Pg. 39
GRI CODE \ 102-55 GRI CODE \ 102-5561 \ \ 62
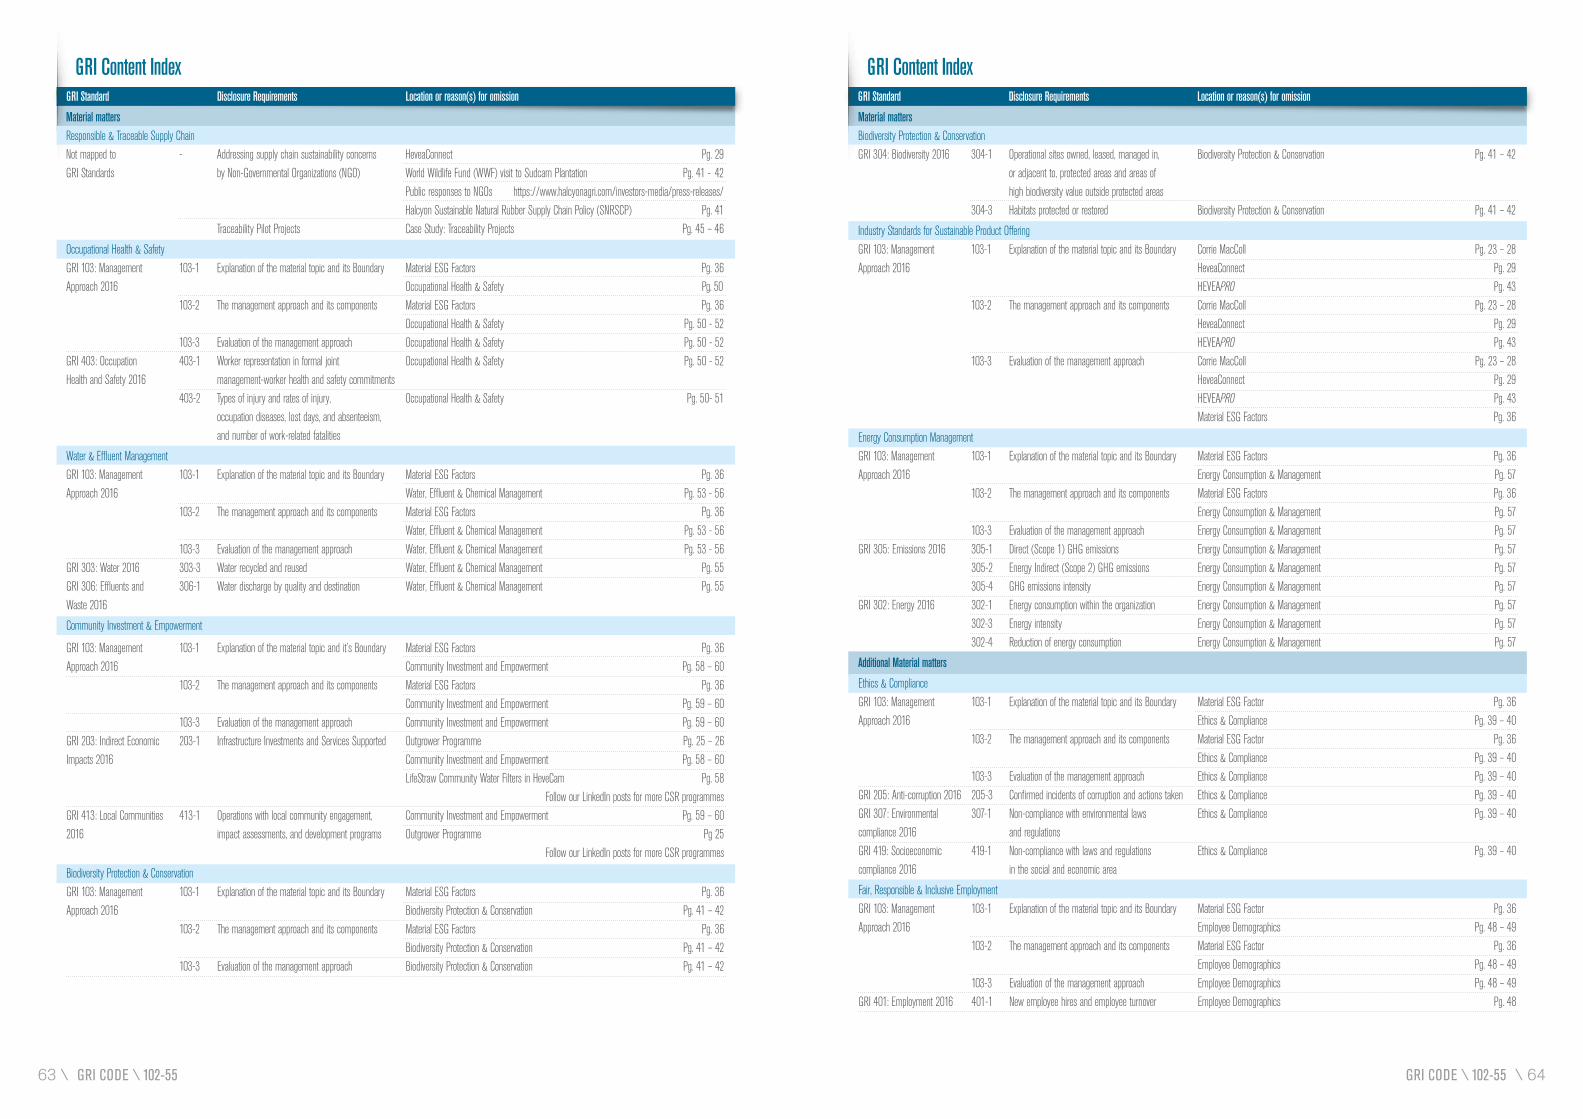
GRI Content IndexGRI Standard Disclosure Requirements Location or reason(s) for omission
GRI Content IndexGRI Standard Disclosure Requirements Location or reason(s) for omission
Material mattersResponsible & Traceable Supply ChainNot mapped to - Addressing supply chain sustainability concerns HeveaConnect Pg. 29GRI Standards by Non-Governmental Organizations (NGO) World Wildlife Fund (WWF) visit to Sudcam Plantation Pg. 41 - 42 Public responses to NGOs https://www.halcyonagri.com/investors-media/press-releases/ Halcyon Sustainable Natural Rubber Supply Chain Policy (SNRSCP) Pg. 41 Traceability Pilot Projects Case Study: Traceability Projects Pg. 45 – 46
Occupational Health & SafetyGRI 103: Management 103-1 Explanation of the material topic and its Boundary Material ESG Factors Pg. 36 Approach 2016 Occupational Health & Safety Pg. 50 103-2 The management approach and its components Material ESG Factors Pg. 36 Occupational Health & Safety Pg. 50 - 52 103-3 Evaluation of the management approach Occupational Health & Safety Pg. 50 - 52GRI 403: Occupation 403-1 Worker representation in formal joint Occupational Health & Safety Pg. 50 - 52Health and Safety 2016 management-worker health and safety commitments 403-2 Types of injury and rates of injury, Occupational Health & Safety Pg. 50- 51 occupation diseases, lost days, and absenteeism, and number of work-related fatalities
Water & Effluent ManagementGRI 103: Management 103-1 Explanation of the material topic and its Boundary Material ESG Factors Pg. 36Approach 2016 Water, Effluent & Chemical Management Pg. 53 - 56 103-2 The management approach and its components Material ESG Factors Pg. 36 Water, Effluent & Chemical Management Pg. 53 - 56 103-3 Evaluation of the management approach Water, Effluent & Chemical Management Pg. 53 - 56GRI 303: Water 2016 303-3 Water recycled and reused Water, Effluent & Chemical Management Pg. 55GRI 306: Effluents and 306-1 Water discharge by quality and destination Water, Effluent & Chemical Management Pg. 55 Waste 2016
Community Investment & Empowerment
GRI 103: Management 103-1 Explanation of the material topic and it’s Boundary Material ESG Factors Pg. 36Approach 2016 Community Investment and Empowerment Pg. 58 – 60 103-2 The management approach and its components Material ESG Factors Pg. 36 Community Investment and Empowerment Pg. 59 – 60 103-3 Evaluation of the management approach Community Investment and Empowerment Pg. 59 – 60GRI 203: Indirect Economic 203-1 Infrastructure Investments and Services Supported Outgrower Programme Pg. 25 – 26Impacts 2016 Community Investment and Empowerment Pg. 58 – 60 LifeStraw Community Water Filters in HeveCam Pg. 58 Follow our LinkedIn posts for more CSR programmesGRI 413: Local Communities 413-1 Operations with local community engagement, Community Investment and Empowerment Pg. 59 – 602016 impact assessments, and development programs Outgrower Programme Pg 25 Follow our LinkedIn posts for more CSR programmes
Biodiversity Protection & ConservationGRI 103: Management 103-1 Explanation of the material topic and its Boundary Material ESG Factors Pg. 36Approach 2016 Biodiversity Protection & Conservation Pg. 41 – 42 103-2 The management approach and its components Material ESG Factors Pg. 36 Biodiversity Protection & Conservation Pg. 41 – 42 103-3 Evaluation of the management approach Biodiversity Protection & Conservation Pg. 41 – 42
Material mattersBiodiversity Protection & ConservationGRI 304: Biodiversity 2016 304-1 Operational sites owned, leased, managed in, Biodiversity Protection & Conservation Pg. 41 – 42 or adjacent to, protected areas and areas of high biodiversity value outside protected areas 304-3 Habitats protected or restored Biodiversity Protection & Conservation Pg. 41 – 42
Industry Standards for Sustainable Product OfferingGRI 103: Management 103-1 Explanation of the material topic and its Boundary Corrie MacColl Pg. 23 – 28Approach 2016 HeveaConnect Pg. 29 HEVEAPRO Pg. 43 103-2 The management approach and its components Corrie MacColl Pg. 23 – 28 HeveaConnect Pg. 29 HEVEAPRO Pg. 43 103-3 Evaluation of the management approach Corrie MacColl Pg. 23 – 28 HeveaConnect Pg. 29 HEVEAPRO Pg. 43 Material ESG Factors Pg. 36
Energy Consumption ManagementGRI 103: Management 103-1 Explanation of the material topic and its Boundary Material ESG Factors Pg. 36Approach 2016 Energy Consumption & Management Pg. 57 103-2 The management approach and its components Material ESG Factors Pg. 36 Energy Consumption & Management Pg. 57 103-3 Evaluation of the management approach Energy Consumption & Management Pg. 57GRI 305: Emissions 2016 305-1 Direct (Scope 1) GHG emissions Energy Consumption & Management Pg. 57 305-2 Energy Indirect (Scope 2) GHG emissions Energy Consumption & Management Pg. 57 305-4 GHG emissions intensity Energy Consumption & Management Pg. 57GRI 302: Energy 2016 302-1 Energy consumption within the organization Energy Consumption & Management Pg. 57 302-3 Energy intensity Energy Consumption & Management Pg. 57 302-4 Reduction of energy consumption Energy Consumption & Management Pg. 57
Additional Material matters
Ethics & ComplianceGRI 103: Management 103-1 Explanation of the material topic and its Boundary Material ESG Factor Pg. 36Approach 2016 Ethics & Compliance Pg. 39 – 40 103-2 The management approach and its components Material ESG Factor Pg. 36 Ethics & Compliance Pg. 39 – 40 103-3 Evaluation of the management approach Ethics & Compliance Pg. 39 – 40GRI 205: Anti-corruption 2016 205-3 Confirmed incidents of corruption and actions taken Ethics & Compliance Pg. 39 – 40GRI 307: Environmental 307-1 Non-compliance with environmental laws Ethics & Compliance Pg. 39 – 40compliance 2016 and regulationsGRI 419: Socioeconomic 419-1 Non-compliance with laws and regulations Ethics & Compliance Pg. 39 – 40compliance 2016 in the social and economic area
Fair, Responsible & Inclusive Employment GRI 103: Management 103-1 Explanation of the material topic and its Boundary Material ESG Factor Pg. 36Approach 2016 Employee Demographics Pg. 48 – 49 103-2 The management approach and its components Material ESG Factor Pg. 36 Employee Demographics Pg. 48 – 49 103-3 Evaluation of the management approach Employee Demographics Pg. 48 – 49GRI 401: Employment 2016 401-1 New employee hires and employee turnover Employee Demographics Pg. 48
GRI CODE \ 102-55 GRI CODE \ 102-5563 \ \ 64

Halcyon Agri Corporation Limited180 Clemenceau Avenue#05-02 Haw Par CentreSingapore 239922
www.halcyonagri.com
Corporate Report 2018Book Two: Corporate Governance and Financial Reports
Contents
Corporate Structure and Information 6565 > Corporate Structure67 > Corporate Information
Corporate Governance Report 6868 > Corporate Governance Report
Financial Contents 8888 > Audited Financial Statements
Statisics of Shareholdings 179179 > Statistics of Shareholdings
Annual General Meeting 181181 > Notice of Annual General Meeting
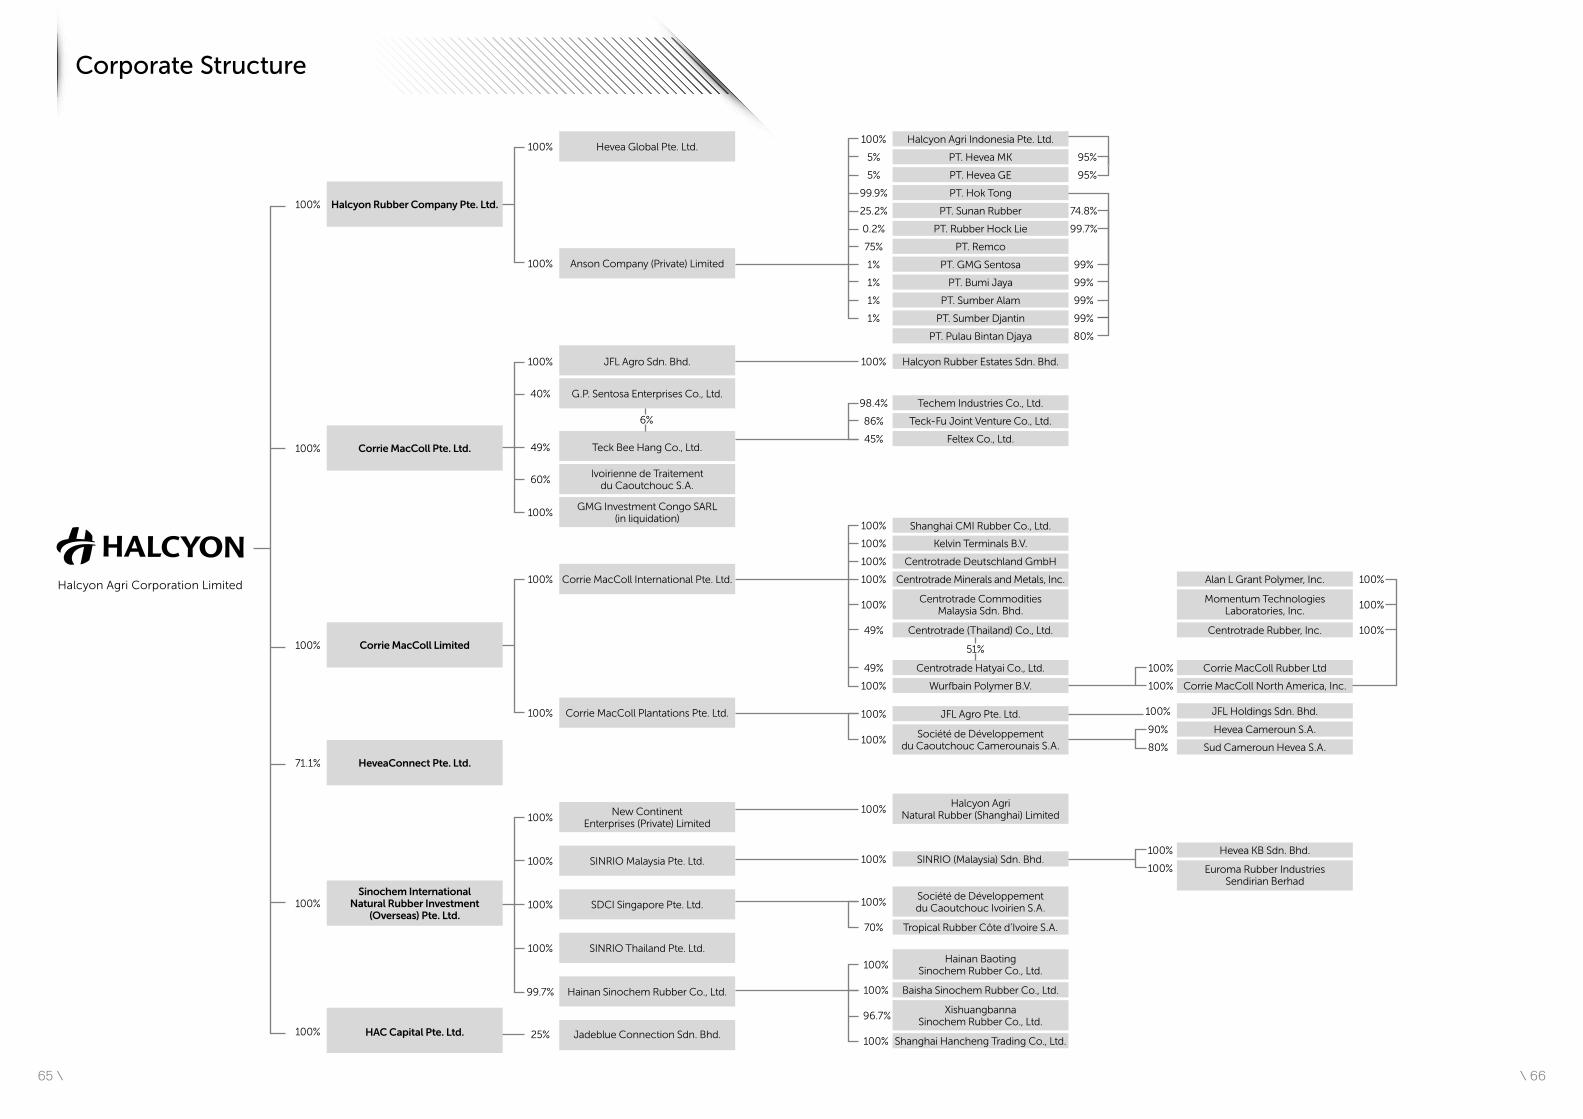
65 \ \ 66
Halcyon Agri Corporation Limited
Halcyon Rubber Company Pte. Ltd.100%
Corrie MacColl Pte. Ltd.100%
Corrie MacColl Limited100%
HeveaConnect Pte. Ltd.71.1%
Sinochem International Natural Rubber Investment
(Overseas) Pte. Ltd.100%
HAC Capital Pte. Ltd.100%
Hevea Global Pte. Ltd.100%
Anson Company (Private) Limited100%
Corrie MacColl International Pte. Ltd.100%
Shanghai CMI Rubber Co., Ltd.100%
Kelvin Terminals B.V.100%
Corrie MacColl Rubber Ltd100%
Corrie MacColl North America, Inc.100%
Alan L Grant Polymer, Inc. 100%
Centrotrade Rubber, Inc. 100%
Corrie MacColl Plantations Pte. Ltd.100% JFL Agro Pte. Ltd.100% JFL Holdings Sdn. Bhd.100%
SINRIO Malaysia Pte. Ltd.100% SINRIO (Malaysia) Sdn. Bhd.100%Hevea KB Sdn. Bhd.100%
Euroma Rubber Industries Sendirian Berhad
100%
SDCI Singapore Pte. Ltd.100%
Tropical Rubber Côte d’Ivoire S.A.70%
SINRIO Thailand Pte. Ltd.100%
Hainan Sinochem Rubber Co., Ltd.99.7%
Hevea Cameroun S.A.90%
Sud Cameroun Hevea S.A.80%
Jadeblue Connection Sdn. Bhd.25%
JFL Agro Sdn. Bhd.100% Halcyon Rubber Estates Sdn. Bhd.100%
GMG Investment Congo SARL (in liquidation)
100%
Ivoirienne de Traitement du Caoutchouc S.A.
60%
New Continent Enterprises (Private) Limited
100%Halcyon Agri
Natural Rubber (Shanghai) Limited100%
Société de Développement du Caoutchouc Ivoirien S.A.
100%
Baisha Sinochem Rubber Co., Ltd.100%
Shanghai Hancheng Trading Co., Ltd.100%
Hainan Baoting Sinochem Rubber Co., Ltd.
100%
Xishuangbanna Sinochem Rubber Co., Ltd.
96.7%
Momentum Technologies Laboratories, Inc.
100%
Société de Développement du Caoutchouc Camerounais S.A.
100%
Teck Bee Hang Co., Ltd.49%
Techem Industries Co., Ltd.98.4%
Teck-Fu Joint Venture Co., Ltd.86%
Feltex Co., Ltd.45%
G.P. Sentosa Enterprises Co., Ltd.40%
6%
Centrotrade Deutschland GmbH100%
Centrotrade Minerals and Metals, Inc.100%
Wurfbain Polymer B.V.100%
Centrotrade Hatyai Co., Ltd.49%
Centrotrade Commodities Malaysia Sdn. Bhd.
100%
Centrotrade (Thailand) Co., Ltd.49%
51%
Halcyon Agri Indonesia Pte. Ltd.100%
PT. Hevea MK5% 95%
PT. Hevea GE5% 95%
PT. Hok Tong99.9%
PT. Remco75%
PT. Sunan Rubber25.2% 74.8%
PT. Rubber Hock Lie0.2% 99.7%
PT. GMG Sentosa1% 99%
PT. Bumi Jaya1% 99%
PT. Sumber Alam1% 99%
PT. Sumber Djantin1% 99%
PT. Pulau Bintan Djaya 80%
Corporate Structure
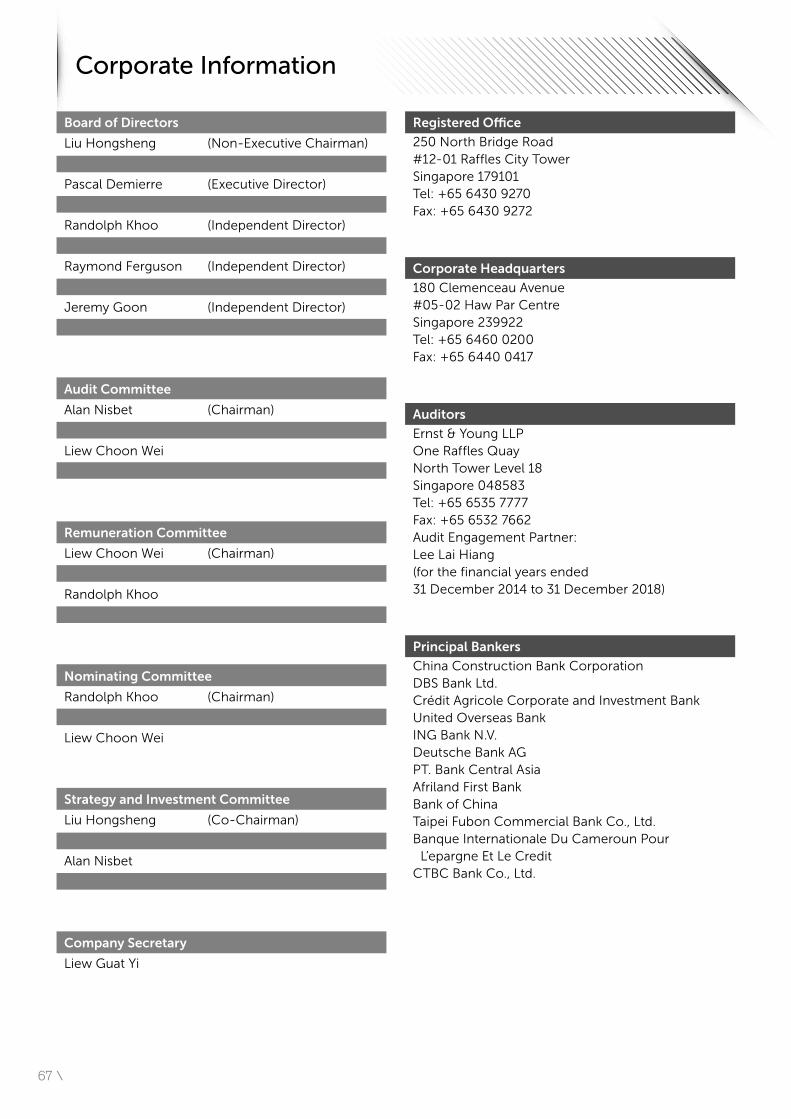
67 \
Board of Directors
Liu Hongsheng (Non-Executive Chairman)
Robert Meyer (Executive Director and CEO)
Pascal Demierre (Executive Director)
Alan Nisbet (Lead Independent Director)
Randolph Khoo (Independent Director)
Liew Choon Wei (Independent Director)
Raymond Ferguson (Independent Director)
Wang Wei (Non-Executive Director)
Jeremy Goon (Independent Director)
Qin Jinke (Non-Executive Director)
Audit Committee
Alan Nisbet (Chairman)
Randolph Khoo
Liew Choon Wei
Pascal Demierre
Remuneration Committee
Liew Choon Wei (Chairman)
Alan Nisbet
Randolph Khoo
Pascal Demierre
Nominating Committee
Randolph Khoo (Chairman)
Alan Nisbet
Liew Choon Wei
Strategy and Investment Committee
Liu Hongsheng (Co-Chairman)
Raymond Ferguson (Co-Chairman)
Alan Nisbet
Robert Meyer
Company Secretary
Liew Guat Yi
Registered Office
250 North Bridge Road #12-01 Raffles City Tower Singapore 179101 Tel: +65 6430 9270 Fax: +65 6430 9272
Corporate Headquarters
180 Clemenceau Avenue #05-02 Haw Par Centre Singapore 239922 Tel: +65 6460 0200 Fax: +65 6440 0417
Auditors
Ernst & Young LLP One Raffles Quay North Tower Level 18 Singapore 048583 Tel: +65 6535 7777 Fax: +65 6532 7662 Audit Engagement Partner: Lee Lai Hiang (for the financial years ended 31 December 2014 to 31 December 2018)
Principal Bankers
China Construction Bank CorporationDBS Bank Ltd.Crédit Agricole Corporate and Investment BankUnited Overseas BankING Bank N.V.Deutsche Bank AGPT. Bank Central AsiaAfriland First BankBank of ChinaTaipei Fubon Commercial Bank Co., Ltd.Banque Internationale Du Cameroun Pour
L’epargne Et Le CreditCTBC Bank Co., Ltd.
Corporate Information
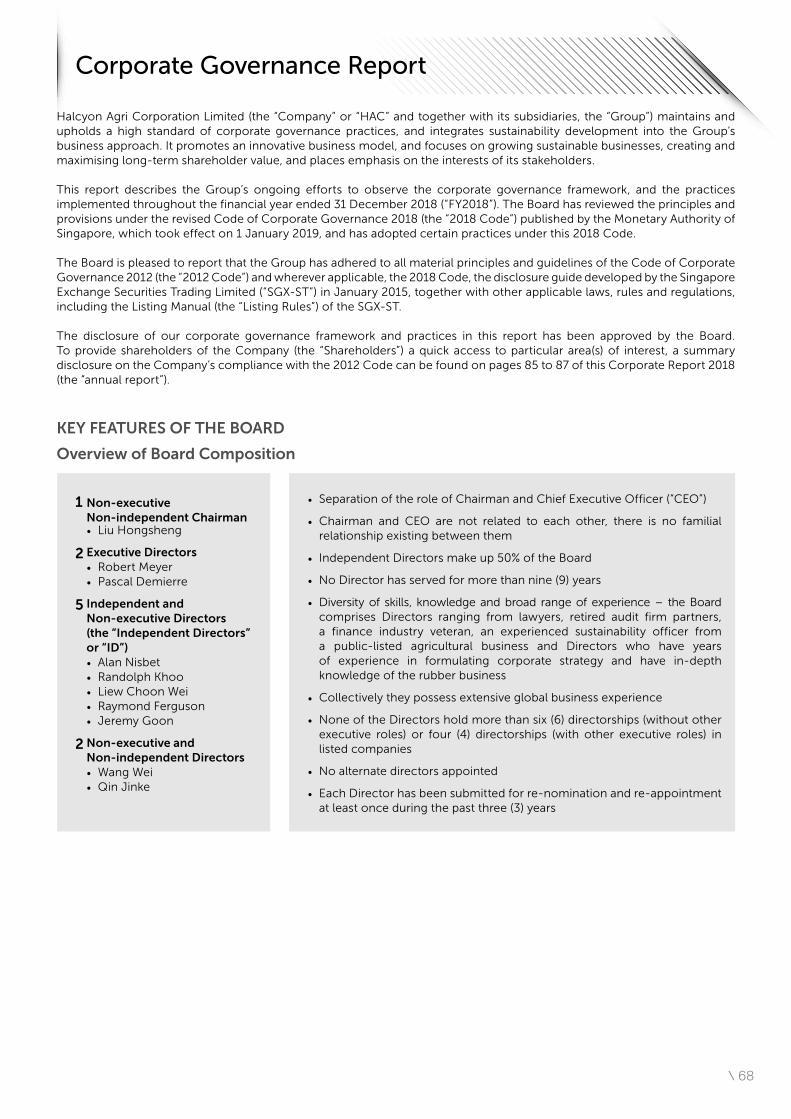
\ 68
Halcyon Agri Corporation Limited (the “Company” or “HAC” and together with its subsidiaries, the “Group”) maintains and upholds a high standard of corporate governance practices, and integrates sustainability development into the Group’s business approach. It promotes an innovative business model, and focuses on growing sustainable businesses, creating and maximising long-term shareholder value, and places emphasis on the interests of its stakeholders.
This report describes the Group’s ongoing efforts to observe the corporate governance framework, and the practices implemented throughout the financial year ended 31 December 2018 (“FY2018”). The Board has reviewed the principles and provisions under the revised Code of Corporate Governance 2018 (the “2018 Code”) published by the Monetary Authority of Singapore, which took effect on 1 January 2019, and has adopted certain practices under this 2018 Code.
The Board is pleased to report that the Group has adhered to all material principles and guidelines of the Code of Corporate Governance 2012 (the “2012 Code”) and wherever applicable, the 2018 Code, the disclosure guide developed by the Singapore Exchange Securities Trading Limited (“SGX-ST”) in January 2015, together with other applicable laws, rules and regulations, including the Listing Manual (the “Listing Rules”) of the SGX-ST.
The disclosure of our corporate governance framework and practices in this report has been approved by the Board. To provide shareholders of the Company (the “Shareholders”) a quick access to particular area(s) of interest, a summary disclosure on the Company’s compliance with the 2012 Code can be found on pages 85 to 87 of this Corporate Report 2018 (the “annual report”).
KEY FEATURES OF THE BOARD
Overview of Board Composition
1 Non-executive Non-independent Chairman • Liu Hongsheng
2 Executive Directors • Robert Meyer • Pascal Demierre
5 Independent and Non-executive Directors (the “Independent Directors” or “ID”) • Alan Nisbet • Randolph Khoo • Liew Choon Wei • Raymond Ferguson • Jeremy Goon
2 Non-executive and Non-independent Directors • Wang Wei • Qin Jinke
• Separation of the role of Chairman and Chief Executive Officer (“CEO”)
• Chairman and CEO are not related to each other, there is no familial relationship existing between them
• Independent Directors make up 50% of the Board
• No Director has served for more than nine (9) years
• Diversity of skills, knowledge and broad range of experience – the Board comprises Directors ranging from lawyers, retired audit firm partners, a finance industry veteran, an experienced sustainability officer from a public-listed agricultural business and Directors who have years of experience in formulating corporate strategy and have in-depth knowledge of the rubber business
• Collectively they possess extensive global business experience
• None of the Directors hold more than six (6) directorships (without other executive roles) or four (4) directorships (with other executive roles) in listed companies
• No alternate directors appointed
• Each Director has been submitted for re-nomination and re-appointment at least once during the past three (3) years
Corporate Governance Report
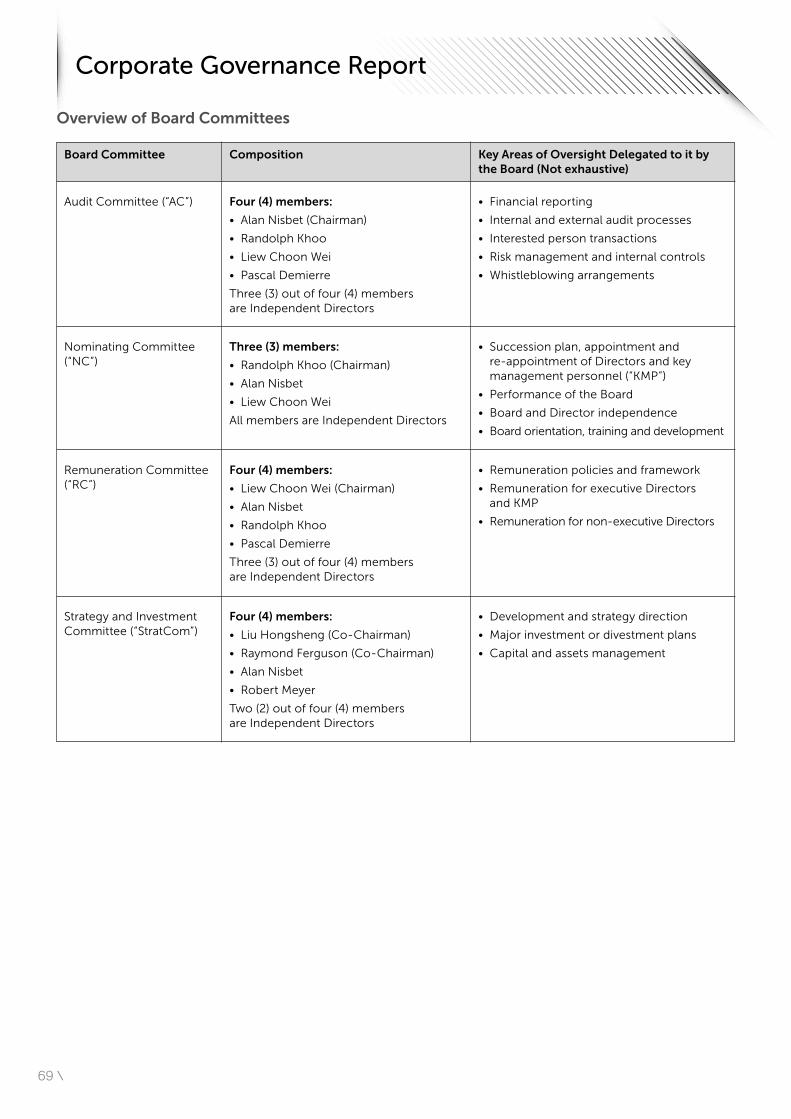
69 \
Overview of Board Committees
Board Committee
Audit Committee (“AC”)
Nominating Committee (“NC”)
Remuneration Committee (“RC”)
Strategy and Investment Committee (“StratCom”)
Composition
Four (4) members:
• Alan Nisbet (Chairman)
• Randolph Khoo
• Liew Choon Wei
• Pascal Demierre
Three (3) out of four (4) members are Independent Directors
Three (3) members:
• Randolph Khoo (Chairman)
• Alan Nisbet
• Liew Choon Wei
All members are Independent Directors
Four (4) members:
• Liew Choon Wei (Chairman)
• Alan Nisbet
• Randolph Khoo
• Pascal Demierre
Three (3) out of four (4) members are Independent Directors
Four (4) members:
• Liu Hongsheng (Co-Chairman)
• Raymond Ferguson (Co-Chairman)
• Alan Nisbet
• Robert Meyer
Two (2) out of four (4) members are Independent Directors
Key Areas of Oversight Delegated to it by the Board (Not exhaustive)
• Financial reporting
• Internal and external audit processes
• Interested person transactions
• Risk management and internal controls
• Whistleblowing arrangements
• Succession plan, appointment and re-appointment of Directors and key management personnel (“KMP”)
• Performance of the Board
• Board and Director independence
• Board orientation, training and development
• Remuneration policies and framework
• Remuneration for executive Directors and KMP
• Remuneration for non-executive Directors
• Development and strategy direction
• Major investment or divestment plans
• Capital and assets management
Corporate Governance Report
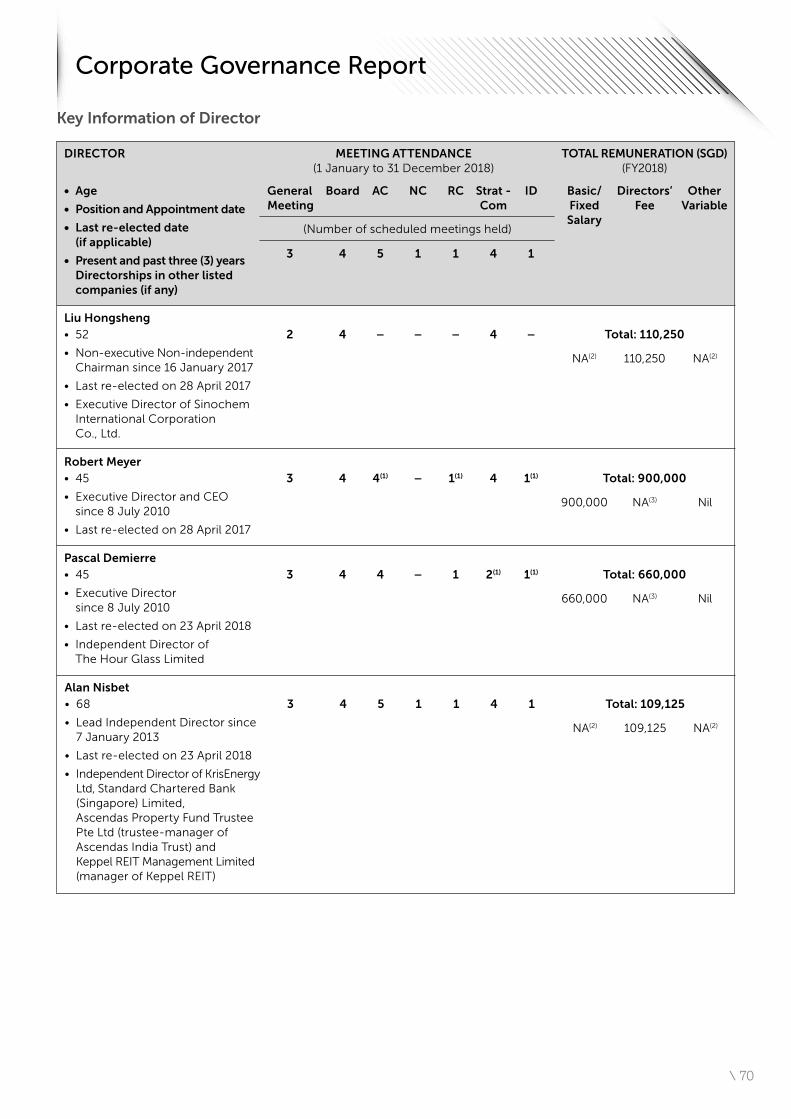
\ 70
Key Information of Director
DIRECTOR
Liu Hongsheng
Robert Meyer
Pascal Demierre
• Age
• Position and Appointment date
• Last re-elected date (if applicable)
• Present and past three (3) years Directorships in other listed companies (if any)
• 52
• Non-executive Non-independent Chairman since 16 January 2017
• Last re-elected on 28 April 2017
• Executive Director of Sinochem International Corporation Co., Ltd.
• 45
• Executive Director and CEO since 8 July 2010
• Last re-elected on 28 April 2017
• 45
• Executive Director since 8 July 2010
• Last re-elected on 23 April 2018
• Independent Director of The Hour Glass Limited
Total: 110,250
Total: 900,000
Total: 660,000
TOTAL REMUNERATION (SGD) (FY2018)
Basic/ Fixed Salary
NA(2)
900,000
660,000
Other Variable
NA(2)
Nil
Nil
Directors’ Fee
110,250
NA(3)
NA(3)
MEETING ATTENDANCE (1 January to 31 December 2018)
3 4 5 1 1 4 1
General Board AC NC RC Strat - ID Meeting Com
(Number of scheduled meetings held)
2 4 – – – 4 –
3 4 4(1) – 1(1) 4 1(1)
3 4 4 – 1 2(1) 1(1)
Alan Nisbet• 68
• Lead Independent Director since 7 January 2013
• Last re-elected on 23 April 2018
• Independent Director of KrisEnergy Ltd, Standard Chartered Bank (Singapore) Limited, Ascendas Property Fund Trustee Pte Ltd (trustee-manager of Ascendas India Trust) and Keppel REIT Management Limited (manager of Keppel REIT)
Total: 109,125
NA(2) NA(2)109,125
3 4 5 1 1 4 1
Corporate Governance Report
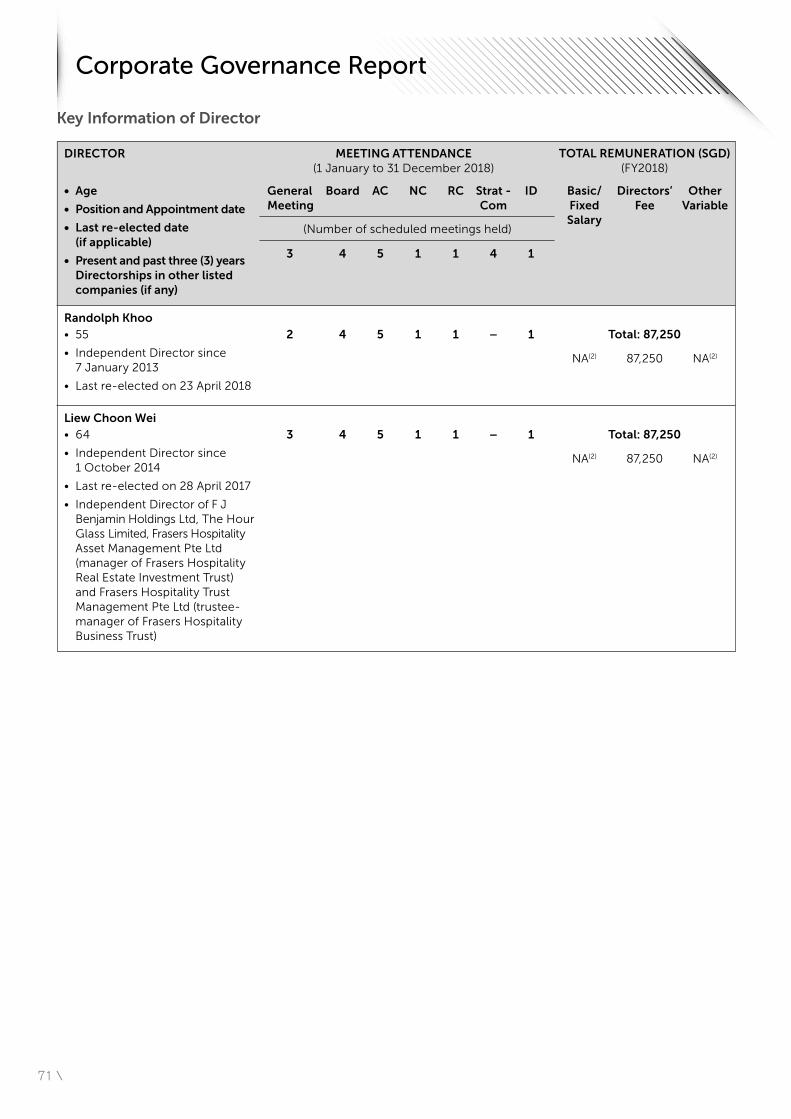
71 \
Key Information of Director
DIRECTOR
Randolph Khoo
Liew Choon Wei
• Age
• Position and Appointment date
• Last re-elected date (if applicable)
• Present and past three (3) years Directorships in other listed companies (if any)
• 55
• Independent Director since 7 January 2013
• Last re-elected on 23 April 2018
• 64
• Independent Director since 1 October 2014
• Last re-elected on 28 April 2017
• Independent Director of F J Benjamin Holdings Ltd, The Hour Glass Limited, Frasers Hospitality Asset Management Pte Ltd (manager of Frasers Hospitality Real Estate Investment Trust) and Frasers Hospitality Trust Management Pte Ltd (trustee-manager of Frasers Hospitality Business Trust)
Total: 87,250
Total: 87,250
TOTAL REMUNERATION (SGD) (FY2018)
Basic/ Fixed Salary
NA(2)
NA(2)
Other Variable
NA(2)
NA(2)
Directors’ Fee
87,250
87,250
MEETING ATTENDANCE (1 January to 31 December 2018)
3 4 5 1 1 4 1
General Board AC NC RC Strat - ID Meeting Com
(Number of scheduled meetings held)
2 4 5 1 1 – 1
3 4 5 1 1 – 1
Corporate Governance Report
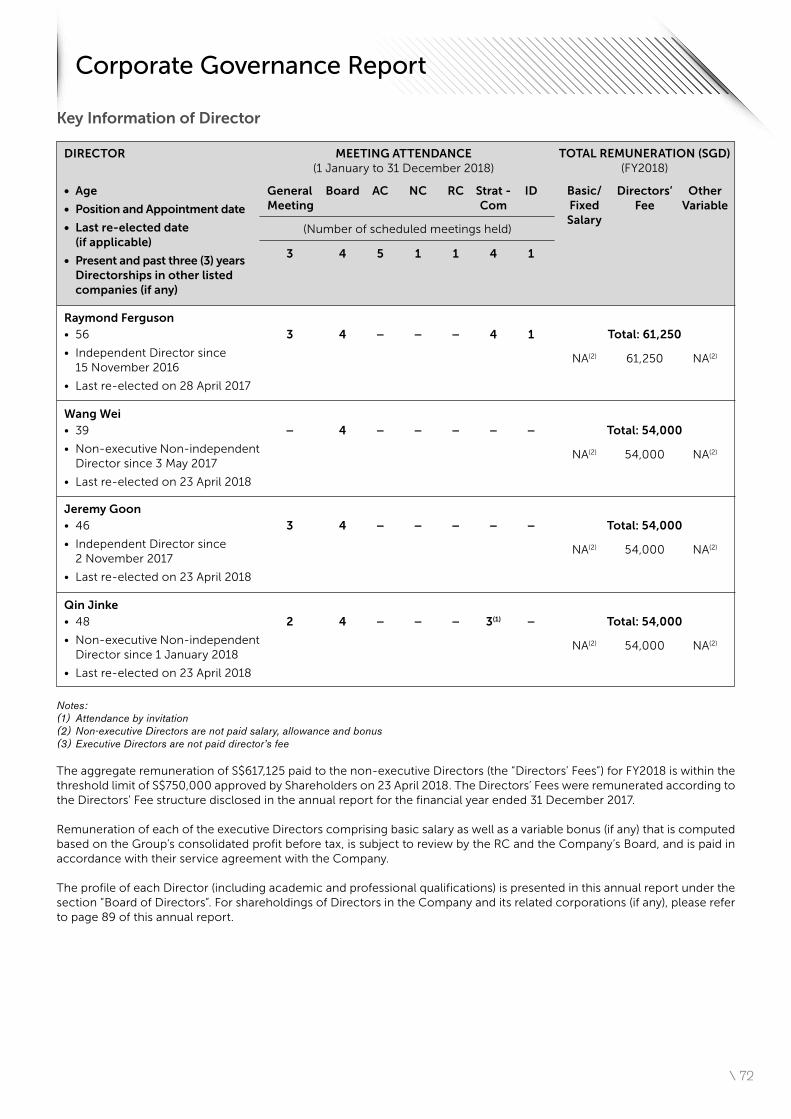
\ 72
Key Information of Director
Notes:(1) Attendance by invitation(2) Non-executive Directors are not paid salary, allowance and bonus(3) Executive Directors are not paid director’s fee
The aggregate remuneration of S$617,125 paid to the non-executive Directors (the “Directors’ Fees”) for FY2018 is within the threshold limit of S$750,000 approved by Shareholders on 23 April 2018. The Directors’ Fees were remunerated according to the Directors’ Fee structure disclosed in the annual report for the financial year ended 31 December 2017.
Remuneration of each of the executive Directors comprising basic salary as well as a variable bonus (if any) that is computed based on the Group’s consolidated profit before tax, is subject to review by the RC and the Company’s Board, and is paid in accordance with their service agreement with the Company.
The profile of each Director (including academic and professional qualifications) is presented in this annual report under the section “Board of Directors”. For shareholdings of Directors in the Company and its related corporations (if any), please refer to page 89 of this annual report.
DIRECTOR
Raymond Ferguson
Wang Wei
Jeremy Goon
• Age
• Position and Appointment date
• Last re-elected date (if applicable)
• Present and past three (3) years Directorships in other listed companies (if any)
• 56
• Independent Director since 15 November 2016
• Last re-elected on 28 April 2017
• 39
• Non-executive Non-independent Director since 3 May 2017
• Last re-elected on 23 April 2018
• 46
• Independent Director since 2 November 2017
• Last re-elected on 23 April 2018
Total: 61,250
Total: 54,000
Total: 54,000
TOTAL REMUNERATION (SGD) (FY2018)
Basic/ Fixed Salary
NA(2)
NA(2)
NA(2)
Other Variable
NA(2)
NA(2)
NA(2)
Directors’ Fee
61,250
54,000
54,000
– 4 – – – – –
3 4 – – – – –
Qin Jinke• 48
• Non-executive Non-independent Director since 1 January 2018
• Last re-elected on 23 April 2018
Total: 54,000
NA(2) NA(2)54,000
2 4 – – – 3(1) –
MEETING ATTENDANCE (1 January to 31 December 2018)
3 4 5 1 1 4 1
General Board AC NC RC Strat - ID Meeting Com
(Number of scheduled meetings held)
3 4 – – – 4 1
Corporate Governance Report
73 \
BOARD MATTERSThe Company is committed to conduct its business with integrity, fairness and transparency and will not tolerate any acts, attempted acts, or assistance with any form of bribery or corruption whether direct or indirect. The Company’s Board is effective, comprises professionals with a broad range of experience and industry expertise, who discharge their duties and responsibilities at all times as fiduciaries in the interests of the Company. The Board embraces value creation, innovation, sustainability and ethical business practices, and has embedded them in setting the strategic directions of the Company.
The Board’s Conduct of AffairsDuties of the Board. The principal functions of the Board are to:
(a) establish corporate values and ethical standards of conduct for the Group;
(b) oversee the business performance and affairs of the Group and provide entrepreneurial leadership;
(c) set strategic direction for the Group, maintain the policy and decision making framework in which the strategy is implemented;
(d) establish and maintain a sound risk management framework and adequate internal controls, setting risk appetite to achieve an appropriate balance between risk and the Group’s performance;
(e) supervise, monitor and review the function and performance of the Group’s management and ensure that necessary financial and human resources are in place for the Company to meet its objectives;
(f) review and approve annual budgets, financial plans, major acquisitions and divestment plans, funding and investment proposals;
(g) ensure transparency and accountability to key stakeholder group including compliance with relevant laws and regulations as well as the financial reporting standards;
(h) review and approve the appointment of Directors and KMP; and
(i) instil an ethical corporate culture and promote sustainable development.
Delegation of Authority. The Board capitalises on the expertise of Independent Directors and benefits from delegating certain functions and authority of the Board to the four (4) board committees, namely, the AC, NC, RC and StratCom (collectively the “Board Committees”). Each Board Committee functions within clearly defined formalised terms of reference (“TOR”) which have been approved by the Board. While these Board Committees are tasked with certain responsibilities, all major decision-making remains the ultimate responsibility of the Board as a whole. Except for a co-chairman of StratCom who is not an independent Director, all other Board Committees are led by an Independent Director, to encourage independent oversight and enable the Board to discharge its obligations
more effectively. Detailed functions and involvement of the Board Committees are described on pages 75 to 83 of this annual report.
To ensure the changes to the requirements under the Listing Manual and the provisions of the 2018 Code are fully captured and reflected in the Board Committees’ TOR, the NC, RC and AC reviewed and proposed certain amendments to their TOR. The updated TOR have been approved by the Board and adopted by the respective Board Committees with effect from 28 February 2019.
The Board embraces the principle of empowerment - that governance and management are more effective and efficient when they are separated. The day-to-day management, operation and administration of the Group are led by the executive Directors and the senior management of the Group (collectively, the “Management”). The Management collaborates closely with the non-executive Directors and provide insights on the Group’s operations. They are accountable to the Board for their performance in pursuing the long-term success of the Group.
The Board has in place, a written Policy on Board Delegation of Authority (the “Delegation Policy”) which set out the framework and mechanisms by which the Board delegates specific standing powers and limits of authority to specified positions, to provide clear directions to Management on matters that must be approved by the Board. The Delegation Policy is aimed at balancing the need for empowering and devolving decision-making to appropriate levels for operational efficiency and ensuring that proper systems of control are in place. Material transactions, including but not limited to the matters set out below, are reserved for the Board’s decision and approval:
(a) overall Group business and budget strategies;
(b) capital expenditures, investments or divestments exceeding certain material thresholds;
(c) all capital-related matters including capital issuance and redemption;
(d) significant policies governing the operations of the Company;
(e) corporate strategic development and restructuring;
(f) material interested person transactions which fall within the meaning of the Listing Rules; and
(g) risk management strategies.
All material transactions are reserved for the Board’s decision as a whole, without any individual or group of individuals exercising any considerable concentration of power or influence, or being allowed to dominate the Board’s decision making.
Board Meetings. Four (4) meetings were scheduled and held at regular intervals in FY2018 to review, among others, the Group’s financial performance, annual budget, corporate strategy, business plans, potential acquisitions, risk management policies, executive remuneration and significant operational matters. Besides the scheduled Board meetings, the Board meets on an ad-hoc basis, when required, to discuss and receive updates from Management on the development of corporate actions that took place during the year.
Corporate Governance Report
\ 74
The Chairman oversees the setting of Board meeting agendas and Directors are encouraged to propose any topic that is deemed appropriate to be discussed. Draft meeting agendas are circulated to the Chairmen of the Board and Board Committees in advance for comments, to ensure that all material topics are attended to.
To ensure meetings are held with maximum Director participation, all Board meetings are planned and scheduled in advance after consultation with Directors. In addition, Directors who are not able to be present physically in the Board meetings may participate in the Board and Board Committee meetings by telephonic conference, as permitted under the Company’s Constitution (the “Constitution”). The Constitution also provides that the Board may make decisions and grant approval by way of written resolutions. A list of written resolutions approved by the Board and Board Committees is compiled and circulated during Board and Board Committee meetings.
As guided under 2018 Code, the Board has approved and adopted a written Policy on Director’s Conflicts of Interest to complement the Company’s existing corporate governance practice, and serves to guide the Directors in recognising and handling conflict situations. In the event any member of the Board or Board Committees has an interest in a matter being deliberated upon by the Directors, he will recuse himself from discussions and abstain from participating in the approval process involving the issue of conflict.
In line with the Company’s commitment to promote sustainable business practices, conservation of the environment and technological advancement, the Board has done away with voluminous hard-copy Board papers since 2014 and continues to employ board portal technologies to facilitate meeting proceedings. All materials for Board and Board Committees meetings are provided in a timely manner and uploaded onto the encrypted, secure board portal, which is readily accessible on Directors’ tablet devices, laptops or desktop computers. The board portal enhances effectiveness in the boardroom and helps to improve information flow to and amongst Board members.
The record of Directors’ attendance at the Board and Board Committee meetings for FY2018 is set out on pages 70 to 72 of this annual report.
Board Access to Information. Complete documents and adequate information relating to meeting agenda items, including background and explanatory notes, financial statements, budgets, forecasts and progress reports of the Group’s business operations and internal audit reports are circulated at least one week prior to each Board and/or Board Committee meeting through the board portal, to allow sufficient time for Directors to comprehensively understand the issues to be deliberated upon and make informed decisions thereon. Senior management personnel who can provide additional insights into the matters at hand, if required, will be invited to attend the meetings to address queries from the Directors. Monthly analysis of the Group’s performance and financial position, overview of the market environment, summary of corporate and treasury activities are provided to the Board, to provide insights on the Group’s operations and ensure that Directors are fully cognisant of the decisions and actions of Management. All information requested by the Director is provided in a timely manner.
Directors have direct access to Management and each member of the Board may request for information regarding the Group that is required for the discharge of his duties and responsibilities. The Directors also have separate and independent access to the Company Secretary at all times. The Company Secretary or her colleague attends all Board and Board Committees meetings to ensure that Board procedures are followed and that the applicable rules and regulations are complied with. The Company Secretary advises the Board on corporate and administrative matters, facilitates Director’s orientation and professional development, and ensures good information flow within the Board and Board Committees, and between Management and the Independent Directors. The appointment and removal of the Company Secretary are subject to the approval of the Board as a whole.
Where necessary, a Director may also seek independent legal and other professional advice concerning any aspect of the Group’s operations or undertakings at the Company’s expense.
Board Composition and BalanceBoard Composition. The Board presently consists of ten (10) members: a non-executive non-independent Chairman, two (2) executive Directors, five (5) Independent Directors and two (2) non-executive non-independent Directors. A majority of the Board comprise Directors with no management or business relationship with the Company. The requirement of the 2012 Code that mandates independent directors constituting at least 50% of the board of directors for companies where, amongst others, the Chairman of the Board is not an independent director, is met. There is a strong and independent element on the Board, with the Independent Directors constructively challenge and assist in developing proposals on strategies. The Board continued to function effectively during the year and was able to exercise objective judgement on corporate affairs independently.
The Company views diversity at the Board level as an essential element in supporting the attainment of its strategic objectives and its sustainable development. In accordance with the 2018 Code, the Board has documented its practices toward diversity under a Policy on Board Diversity (the “Diversity Policy”). The Diversity Policy promotes the inclusion of different perspectives and ideas, endorses the principle that diverse Board should include and make good use of differences between the Directors in terms of professional experience, skills, knowledge, length of service, industry discipline, cultural and educational background, gender, age, ethnicity and other relevant factors. The Board recognises the potential benefits of gender diversity in the boardroom and welcomes female directors on board. Where the candidates for appointment as director are relatively equivalent in their levels of required skills and experience, the Board is committed to advancing female candidates, in order to achieve gender diversity and add a broader perspective on the Board.
Taking into account the scope and nature of the Group’s operations as well as its strategic direction, and having regard to the Diversity Policy, the Company and the Board are satisfied that the Board is of an appropriate size for effective decision-making, has a well-diversified Board with right mix of expertise and collectively possesses the necessary core competencies in diverse areas including accounting, finance,
Corporate Governance Report
75 \
law, sustainability development, business and management, strategic planning and global business experience, for the Board to effectively discharge its duties.
The Board has considered the recommendation of the 2018 Code which stipulates that the independent directors to make up a majority of the Board where the Chairman is not independent director. Based on the feedback and comments received through the annual board performance evaluation for the current and preceding years, and with reference to the common board size of six (6) directors for Singapore-listed companies1, the Board concluded that the current board composition (board size of ten (10) members with 50% of independent directors and 80% of non-executive directors) has high degree of independence and with the right structure to enable the Board to function at optimum levels. Correspondingly, the Board will not increase its size or appoint an additional independent director at the near future.
Chairman and Chief Executive OfficerSeparation of the Role of Chairman and the CEO. There is a clear division of responsibilities between the leadership of the Board and the executive responsible for managing the Company’s business. The roles of Chairman and the post of CEO are held by separate persons, to ensure a degree of checks and balance. The Chairman and CEO are not related to each other in any manner. The two (2) key roles have fundamentally disparate responsibilities and functions, but complement each other in the overall objective of creating value for Shareholders, and play vital roles in providing the Group with strong leadership and vision.
As the Chairman of the Board, Mr Liu Hongsheng leads and ensures the effectiveness of all general meetings and Board meetings. He is responsible for promoting culture of openness and debate of the Board, steering productive and comprehensive discussions between members of the Board and Management on strategic, business and other issues pertinent to the Group, as well as ensuring effective communication with Shareholders and other stakeholders. The Chairman takes a leading role in the Company’s drive to achieve and maintain a high standard of corporate governance with the support of the Board, Management and Company Secretary.
Mr Robert Meyer, the CEO since 2013, has developed the Group’s business to become a leading natural rubber industry operator with activities that span the globe. He possesses in-depth industry knowledge, understands the current market, and has the foresight to support the formulation of the Group’s strategic direction, including the initiative to transition the global natural rubber industry, which is heavily reliant on traditional paper-based processes, into a unified digital marketplace. Assisted by the management team, the CEO make decisions in all matters affecting the operations, performance and strategy of the Group’s businesses, with the exception of those matters reserved for the Board or specifically delegated by the Board to the Board committees. He oversees the day-to-day management, leads and implements all major initiatives (such as expansion related strategies, acquisitions and capital investments of the Group), and plays an instrumental role in the sustainable development and growth of the Group’s business.
Lead Independent Director. Mr Alan Nisbet has been the Lead Independent Director since 2013 and continues to avail himself to address Shareholders’ concerns and acts as a counter-balance in the decision-making process. The Lead Independent Director plays an additional facilitative role within the Board and provides a channel to non-executive directors for confidential discussion on any concerns and to resolve conflicts of interest as and when necessary. He convenes and chairs meetings with Independent Directors without the involvement of the Management, at least once a year, to aid and facilitate provision of well-balanced viewpoints to the Board, in order to enhance the capacity of the Board for independent decision making. The Board believes that meetings between the Independent Directors who do not hold executive positions in the Group will encourage and promote greater openness in reviewing the performance of Management. Any recommendations or suggestions arising from the Independent Directors’ discussions will be communicated to the Management.
The roles, duties and responsibilities of the Chairman, CEO, Lead Independent Director and Directors of difference classes (executive, non-executive and independent director) are detailed under a Memorandum on Director’s Duties and Responsibilities which has been distributed to each Director upon his appointment, and accessible in the board portal.
Board Membership and Performance EvaluationThe NC comprises three (3) members and is chaired by Mr Randolph Khoo since its inception in 2013. All members of the NC (including the chairman) are Independent Directors. The Lead Independent Director, Mr Nisbet, is also a member of the NC. The NC makes as well as reviews recommendations to the Board on all nominations for appointments and re-appointments to the Board, the appointment of KMP, the training and development programmes for the Board, and is responsible for the annual evaluation of Board performance.
The NC functions within clearly written terms of reference approved by the Board and its principal activities are as follows:
Board Appointment and Composition. The Board regularly and continually review its structure, size and composition to identify the balance of skills, knowledge and experience required for the Board to discharge its responsibilities effectively. Where appropriate, or if circumstances suggest that additional skills or experience is required and that a replacement and/or new appointment is beneficial to the Board, the NC will propose a new appointment or review and evaluate the competencies of candidates proposed by the Management. The NC has a formal and written guide to conduct due diligence checks to assess the suitability of a candidate for appointment as a Director of the Company. To ensure that the Company has the opportunity to benefit from all available talent, the evaluation of potential new director is made based on meritocracy, and candidates will be considered against objective criteria, having due regard for the benefits of diversity on the Board, the ability of prospective candidates to contribute to discussions, deliberations and activities of the Board as well as the balance of Independent Directors on the Board.
1The Singapore Directorship Report 2018 published by Singapore Institute of Directors indicates that 78.3% of Singapore-listed companies having seven (7) directors or less, and the most common size to be six (6) directors.
Corporate Governance Report
\ 76
In its review of proposal for appointment or re-appointment of each Director as well as KMP, NC will take into consideration the composition and progressive renewal of the Board, as well as each Director’s competencies, principal commitment, contribution and performance (including attendance to the meeting, preparedness, participation and candour). Such appointment or re-appointment which has been recommended by the NC will be deliberated by the Board as a whole, and the appointment are reserved for the Board’s decision. The Constitution also spells out the procedures for the appointment of new Directors, along with the re-election and removal of Directors.
The NC is also tasked to recommend and review succession plans for the Company’s Directors and senior management, in particular for the Chairman, the CEO and the KMP, taking into account the challenges and opportunities facing the Group and the skills and experience needed in the future. The Company integrates executive development programs into CEO and KMP succession planning, and builds talent internally through training, so that the best internal candidates are identified early and flagged at the Board level. Where necessary or appropriate, the NC may tap on its networks and/or engage external professional headhunters to assist with identifying and shortlisting candidates. The NC can also approach relevant institutions such as the Singapore Institute of Directors, professional organisations or business federations to source for suitable candidates.
Review of Board Independence. The NC reviews and determines whether a Director is independent on an annual basis, and as and when circumstances require. Each of the Independent Directors has submitted a declaration form confirming that he is to be considered as independent under the requirements of Rule 210(5)(d) of the Listing manual as well as the provisions set out in the 2018 Code. Taking into consideration the declarations submitted by the Independent Directors, as well as the length that the Director has served on the Board, the NC has determined that each of the Independent Directors is independent in conduct, character and judgement, and has no relationship with the Company, its related corporations, its substantial shareholders or its officers, and there has been no element that could interfere, or be reasonably perceived to interfere, with the exercise of the Director’s independent business judgment in the best interests of the Group. It was also noted that none of the members of the Board have served for a continuous period of nine (9) years or more, and none of them or their family members was employed by, or received significant payment from or provided material services to the Group, in FY2018 or in any of the past three (3) financial years.
Board Orientation, Training and Development. The NC oversees and makes recommendations to the Board for training and professional development programs available to Directors, as well as induction for newly appointed Directors. The Board has adopted a set of best practice for Director’s training and development and have integrated this into its existing induction policy.
The Policy on Induction, Training and Development for Directors (the “Training Policy”) serves (i) to assist the new Director who is appointed to the Board for the first time to gain an understanding of his or her roles, duties, obligations and responsibilities as a Director of the Company, as well as the framework within which the Group operates; and
(ii) to encourage all Directors regularly review his or her training and professional development needs, to ensure the Directors have appropriate competencies to effectively fulfill their responsibilities to the Company and its Shareholders as well as stakeholders.
The induction programme is tailored for each new Director (depending on his or her requirements, skills, qualifications and experience) and will, as a mandatory requirement, request the new Director who has no prior experience as a director of a listed company to attend the Listed Entity Director (LED) Programme organised by the Singapore Institute of Directors with the support of the SGX-ST, to familiarise himself or herself with the roles and responsibilities of a director of a public listed company. A formal letter of appointment setting out the duties and obligations of a Director and the time commitment required, as well as information about the Group, its operations, business, practices and governance systems, is also issued to each newly appointed Director.
To ensure each Director fulfils the needed and desired competencies, and keep abreast of changes to the regulatory environment, Directors are encouraged to attend courses which are relevant to the Directors in discharging their roles and responsibilities, at the Company’s expense. The list of available seminars and courses is circulated to Directors through the board portal. Reading materials in connection with professional developments and applicable regulatory updates or amendments to relevant laws, rules and regulations are also disseminated to Directors through the board portal. Comprehensive and useful information covering the duties and obligations of a Director, terms of reference of Board Committees, Group’s business activities, strategic directions, policies and key areas of operations of the Group, are also provided in the resource centre under the board portal, and is accessible to all Directors. All Directors would be offered the opportunity to visit the Group’s major operational sites and meet with any of the senior executives of the Group.
The CEO and Management regularly update the Board and provide insights on business and strategic developments at meetings. The Group’s external auditors, Ernst & Young LLP, regularly brief the AC members on changes to and new developments of accounting and reporting standards and/or regulatory environment.
Commitment to the Board. Directors of the Company are required to notify the Board of any new appointment of directorships to listed companies or other executive commitments, for the Board or NC to consider and to evaluate whether such Director is able to commit the time to adequately carried out his duties as a Director of the Company.
To ensure that each Director is able to devote sufficient time and attention to carrying out his role in accordance with his duties, the Board has determined that the maximum number of listed company board representations each Director of the Company is allowed to hold is as follows:
(a) directorships without other executive roles – Six (6) (b) directorships with other executive roles – Four (4)
Rotation and Re-election of Directors. At each annual general meeting (“AGM”), Directors constitutes not less than one-third of the Board are required to retire from office by rotation, and a Director shall submit himself for re-nomination and re-election at regular intervals of at least
Corporate Governance Report
77 \
once every three (3) years. These requirements are clearly stated in the Company’s Constitution and each member of the Board has submitted himself for re-nomination and re-appointment at least once, during the past three (3) years.
Mr Liu, Mr Meyer, Mr Liew Choon Wei and Mr Raymond Ferguson, being Directors who have been longest in office since their last election, have submitted themselves for re-nomination and re-election. Each of them has abstained himself from making any recommendation and/or participating in any deliberation in respect of the assessment of his own re-election as the Directors. At the recommendation of the NC and with the approval of the Board, resolutions for the re-appointment of Mr Liu, Mr Meyer, Mr Liew and Mr Ferguson as Directors of the Company will be tabled at the forthcoming AGM for Shareholders’ approval.
The NC has reviewed and noted that Mr Liew and Mr Ferguson, being Independent Directors, do not have any relationship as described under Rule 210(5)(d) of the Listing Manual, no immediate family relationships with the other Directors, the Company or its substantial shareholders, and they will be considered independent for the purposes of Rule 704(7) of the Listing Rules (where applicable).
Each of the Directors subject to re-election at the forthcoming AGM, will, upon re-appointment as a Director, hold the same office in the Board and Board Committees immediately held before his re-appointment.
Board Performance Evaluation. The NC decides how the Board’s performance may be evaluated and continues to take charge of the annual assessment of the effectiveness of the Board as a whole and of each Board Committee, as well as the contribution of the Chairman and each Director to the effectiveness of the Board. The performance of the Board and Board Committee is assessed by the NC on its overall effectiveness in accomplishing its goals and discharging its responsibilities based upon the following criteria:
(a) Board size and composition;
(b) Board governance processes;
(c) Board information and accountability;
(d) Board’s performance in relation to discharging its principal functions;
(e) where practical, financial references which include return on capital employed, return on equity, debt/equity ratio, dividend pay-out ratio, economic value added, earnings per share, and total shareholder return (i.e. dividend plus share price increase over the year); and
(f) Board Committee performance, qualification and effectiveness in relation to discharging their responsibilities set out in their respective terms of reference.
The evaluation of Chairman aims to assess his leadership, commitment as well as his relationship with Board members, whereas the individual directors are evaluated based on his
dedication and understanding of role, preparedness and participation in the meetings, as well as quality of inputs to matters deliberated by the Board.
A formal evaluation questionnaire was tabulated and circulated to all Directors via the board portal, for Directors to rate and provide feedback on the performance of the Board, the Board Committees, the Chairman and each Director for FY2018. The assessment provides insights into the functioning of the Board, whilst identifying areas that might need strengthening and development. Directors are invited to provide their views and suggestions for any specific areas where improvements may be made to improve Board effectiveness. Each Director is also requested to complete an assessment of each Director’s contributions, including himself, to the effectiveness of the Board, on anonymous basis.
The findings of the Board evaluation (including feedback and comments received from the Directors) are analysed and discussed by the NC, in consultation with the Chairman of the Board to identify areas for improvement and any training required to further enhance the effectiveness of the Board. The Board will then review feedback from the NC collectively and will decide and agree on action plans.
Following the review for FY2018, the NC and the Board are satisfied that the Chairman as well as each Director has contributed to the overall effectiveness of the Board and demonstrates commitment to his roles on the Board, and that the Board and Board Committees operate effectively and have met their respective performance objectives. Notwithstanding that certain Directors have multiple board representations, these multiple directorships are not in conflict with the interests of the Company, and are within the maximum number of listed company board representations each Director of the Company is allowed to hold. No external facilitator was used in the evaluation process.
Strategy and Investment CommitteeThe StratCom consists of four (4) members, co-chaired by the Board’s Chairman, Mr Liu and an Independent Director, Mr Ferguson. StratCom’s governing processes, duties and responsibilities have been documented under written TOR approved by the Board. StratCom supports the Board in the following areas:
(a) defining and monitoring the Company’s strategic direction;
(b) reviewing and evaluating significant capital deployment and asset management; and
(c) working with the Management to oversee and review significant strategic decisions as well as major investment or divestment plans.
Four (4) StratCom meetings were held in FY2018 to review the Group’s prospects and long-term development strategic planning.
Corporate Governance Report
\ 78
REMUNERATION MATTERSThe Company’s remuneration policy seeks to drive business strategy and create long-term shareholder value by attracting and motivating employees who are committed to long-term career growth with the Company. The RC ensures that the remuneration strategy is in line with the Group’s business strategy, objectives and values, taking into account the long-term sustainability of the Group’s business as well as the long-term interests of Shareholders, investors and other stakeholders. Reviewing and making recommendations to the Board on the framework of remuneration for the Board and KMP as well as the specific packages for each Director and the KMP, are the key functions of the RC. When recommending performance-related remuneration for senior management, the RC aims to ensure the level and structure of remuneration are appropriate and proportionate to the sustained performance and value creation of the Group, taking into account the strategic objectives of the Group.
Remuneration CommitteeThe RC is chaired by an Independent Director, Mr Liew, and comprises Mr Nisbet, Mr Khoo and Mr Demierre. The RC is of the view that an executive Director would have a better understanding of each senior executive’s role and job scope, and that including Mr Demierre, an executive Director, on the RC is valuable in ensuring that the remuneration packages are commensurate with the job duties and responsibilities of senior executives. Retaining an RC member who is also in an executive position will not lead to a conflict of interest or impede the independence of the RC as no Director or member of the RC is allowed to participate in the deliberation, and has to abstain from voting on any resolution, relating to his own remuneration or that of employees related to him. RC’s TOR specify that independent directors shall make up at least 75% of the RC members whenever its members comprise an executive Director.
The key responsibilities and authorities of the RC are as follows:
Developing Group Remuneration Policies. The RC is responsible for recommending the terms of the Group’s long-term incentive plans, severance policies and for agreeing individual remuneration packages for the Board members and KMP. In respect of long-term incentive schemes (if any, including share schemes as may be implemented), the RC is responsible for considering whether Directors should be eligible for benefits under such long-term incentive schemes. Any recommendation of the RC will be submitted to the Board for consideration and approval. The Board is ultimately accountable for all remuneration decisions.
The RC ensures that the remuneration and incentive framework, policies and practices are appropriate to attract, retain and motivate Directors to provide good stewardship of the Company and KMP to successfully manage the Company for the long term. The RC considers all aspects of remuneration (including directors’ fees, salaries, allowances, bonuses, options, share-based incentives and awards, benefits in kind and severance packages) and aims
to be fair and avoid rewarding poor performance. It also reviews the Company’s obligations arising in the event of termination of the executive Directors’ and KMP’s contract of service, to ensure that such contracts of service contain fair and reasonable termination clauses which are not overly generous. It may from time to time, and where necessary or required, seek advice from external consultants in framing its remuneration policy and determining the level and mix of remuneration for Directors and KMP.
The Company has engaged Mercer (Singapore) Pte Ltd (“Mercer”), an independent professional firm to review the setting of key performance indicators for the Company’s senior management for FY2018. Save for the aforementioned assignment, Mercer does not have any other relationship with the Company and its independence and objectivity are not affected.
Where applicable, the RC will also review annually the remuneration of employees related to the Directors, the CEO and substantial shareholders to ensure that their remuneration packages are in line with the staff remuneration guidelines and commensurate with their respective job scopes and level of responsibilities. The RC will also review and approve bonuses, pay increases and/or promotions for these employees, if any.
Other than the service contracts for the CEO and the Executive Director, the Company currently does not impose contractual provisions to reclaim incentive components of remuneration paid in prior years in the service agreements or employment agreements of the KMP. Notwithstanding this, the Company is not precluded from exercising the right to reclaim such incentives in exceptional circumstances including for example, misstatement of financial results or of misconduct resulting in financial loss to the Group.
Agreeing the Level and Mix of Remuneration. The key considerations of the RC in recommending the level and mix of remuneration are:
(a) to link rewards with performance and offer appropriate remuneration and employment conditions to build, motivate and retain Directors, KMP and talent;
(b) to align the interests of Directors and KMP with the interests of Shareholders and other stakeholders;
(c) risk policies of the Company, such that the remuneration is symmetric with risk outcome and sensitive to the time horizon of risk, and
(d) country-specific practices including the pay and employment conditions within the industry.
Remuneration framework as well as specific remuneration packages for each Director and KMP, including the CEO, are reviewed and discussed in the RC meeting. When it recommends the remuneration package to the Board, the RC take into consideration the aforementioned factors, the strategic direction of the Group and industry practice, and benchmarks the remuneration package against relevant industry players to ensure that it is adequate and appropriate to draw in and motivate high-performing executives. Specific remuneration packages for each Director and KMP in respect of FY2018 have been approved by the Board.
Corporate Governance Report
79 \
Position
Chairman
Member
Board
100,000
50,000
Audit Committee
37,500
12,500
Nominating Committee
Basic Fee per annum (SGD)
12,500
6,250
Remuneration Committee
12,500
6,250
Strategy and Investment Committee
6,250
3,125
Board and Board
Committees
1,000 for each day of
attending any Board or Board
Committee meeting
Attendance Fee (SGD)
The Company submits the quantum of Directors’ Fees of each financial year, which is to be paid quarterly in arrears, to Shareholders for approval at its AGM. Shareholders’ approval will be sought at the forthcoming AGM of the Company on 23 April 2019 in respect of the proposed payment of Directors’ Fees of up to S$750,000 (payable quarterly in arrears) for FY2019. The executive Directors are remunerated under their respective service contracts and will not be paid a director’s fee. The remuneration of each individual Director for FY2018 is explicitly disclosed on a named basis, on pages 70 to 72 of this annual report.
Remuneration of KMP. In conjunction with the expansion of the Group’s operations, the Group has created the position of Chief Operating Officer in the course of FY2018. Mr Ng Eng Kiat (former Chief Financial Officer) was nominated and appointed to head the Group’s operations. With the addition of this new position, the Company has three (3) KMP (who are not Directors or the CEO) for FY2018. Disclosure of their remuneration pursuant to the 2018 Code is as follows:
Note: (1) Remuneration Bands are as follows: Band 1: From S$250,000 up to S$500,000 Band 2: From S$500,001 up to S$750,000 (2) Designation in FY2018
The total remuneration paid to the three (3) KMP (who are not Directors or the CEO) for FY2018 was approximately S$1,536,000, and has been approved by the Board.
Summary of RC Observations for FY2018. The Group’s remuneration policies are appropriate, effective, meet the commercial requirements to remain competitive, are sensitive to the time horizon of risk and allow flexibility in response to prevailing circumstances, and align with the long-term interest of the Group. Currently, there are no employee share schemes provided by the Company or the Group, and the Company does not have any long-term incentive plans. None of the Directors and KMP received any termination, retirement and post-employment benefits. All Directors and the KMP are remunerated on an earned basis. The remuneration packages for Directors and KMP for FY2018 are commensurate with their contributions, taking into consideration the scope of work, performance, potential and responsibilities of these individuals. Remuneration packages for each KMP is principally based on the achievement of the objectives of his functions as set up in the KPI prepared by Mercer and agreed by each individual. Qualitative evaluation, such as vocational competence, responsibility at work and activity in the workplace, as well as the quality of work in relation to the demands and goals of duties, has also been used to evaluate and assess Management’s performance in FY2018. The Board is of the view that the current level and structure of remuneration aligns with the long-term interests and risk management policy of the Company and it is satisfied that the Directors and Management devoted the necessary time and energy to fulfilling their commitments, and have met the aforementioned performance conditions in FY2018. There is no employee in the Group who is a substantial shareholder of the Company or immediate family member of a Director or the CEO or substantial shareholders.
Name
Andrew Trevatt
Ng Eng Kiat
Loh Jui Hau
Position
Chief Commercial Officer
Chief Operating Officer and Managing Director - SINRIO (2)
Chief Financial Officer
Salary (%)
92.3
92.3
91.7
Allowance/ Benefit (%)
–
–
–
Variable Bonus(%)
7.7 Band 2
7.7
8.3
Band 2
Band 1
Remuneration Band(1)
Remuneration of Non-executive Directors. Directors’ Fees which comprise a basic fee and attendance fees, are reviewed annually by the RC to benchmark such fees against the amounts paid by other listed companies of similar size. No changes were proposed to the Directors’ Fees structure, and the Directors’ Fees structure for the financial year ending 31 December 2019 (“FY2019”) remains the same as FY2018, and is as follows:
Corporate Governance Report
\ 80
ACCOUNTABILITY AND AUDITThe Board is accountable and answerable to the Shareholders for all aspects of the Company. It endeavours to ensure that Shareholders are furnished with timely information, full disclosure of material information and aims to present a balanced and understandable assessment of the Company’s performance, position and prospects to the Shareholders. The Board is responsible for the governance of risks and ensuring that effective system of risk management and internal controls is in place. Its function relating to overseeing both internal and external audits is delegated to the AC.
AccountabilityThe Company’s financial results are prepared and presented in compliance with statutory requirements including applicable accounting standards and Listing Rules. The AC reviews, deliberates the Company’s quarterly and full-year financial results, before submission to the Board for approval. The Company’s quarterly and full year financial results are provided to Shareholders and published on the SGX-ST within the timeline stipulated under the Listing Rules, after they are approved by the Board.
The Management provides monthly reports covering operational performance, financial results, market environment, corporate and business development and other relevant information to the Board, to assist the Board to make a balanced and informed assessment of the Company’s performance, position and prospects. Such regular updates and timely reports allow the Board to monitor the Group’s performance as well as Management’s performance relating to the goals and objectives set by the Board.
Risk Management and Internal ControlsThe Board as a whole is responsible for the governance of risk and determines the nature and extent of the significant risks which the Company is willing to take in achieving its strategic objection and value creation. It provides oversight in the design, implementation and monitoring of the risk management framework and the system of internal controls. The Board also ensures that Management puts in place action plans to mitigate the risks identified, and undertake remedial actions to rectify control lapses. It devotes significant attention to maintaining an effective system of risk management and internal controls, to safeguard the interest of the Company and its Shareholder, and ensure that risks are managed in the best interests of the Group. The principal risks facing the Company are described under the section Risk Management on page 34 of this annual report.
In assessing the effectiveness of the Group’s internal controls, the Board focuses on identifying control gaps in the business process, areas for improvement and areas where controls can be strengthened. This process assists in ensuring that primary key objectives are met, material assets are properly safeguarded, fraud or errors in the accounting records are prevented or detected, accounting records are accurate and complete, and reliable financial information is prepared in compliance with applicable internal policies, laws and regulations.
The Company has a dedicated team which is responsible for developing, monitoring and maintaining risk management controls and reporting any key issues to Management. A risk management committee (“RMC”) formed by the Management which comprises the CEO, Chief Operating Officer, Chief Commercial Officer and Chief Financial Officer is responsible to assess and determine the nature and extent of the financial risks which the Company is allowed to take. Under the initiative of RMC, a Group Risk Management Policy which imposed appropriate measures and limits to control commercial risk exposures has been approved by the Board and adopted by the Group, and be reviewed regularly to ensure it is symmetric with market environment and Group’s operations.
The internal controls practice of each of the Group’s departments or functions is reviewed annually or when circumstances warrant the review process, such as during the integration process after completion of an acquisition, to enhance and standard operating procedures and ensure the newly acquired business is fully compliant with the Group’s policies and procedures. The Management has identified certain control lapses in the procurement process in the Ivory Coast’s operations, and that the procurement system had since been improved and tighter controls are in force.
Internal AuditNexia TS Risk Advisory Pte Ltd (“Nexia”) has been the Group’s internal auditor since May 2013. The Board believes that outsourcing the internal audit function to a professional firm is beneficial as the professional service provider has a broad range of expertise, resources, advanced degrees and technological specialisation to undertake the internal audit of the Group, especially for the Group’s business which has global presence.
To ensure that the review on internal controls is conducted effectively, Nexia’s primary reporting line is to the AC, and it is granted unfettered access to all the Company’s documents, records, properties and personnel. It reviews, then evaluates and tests the effectiveness of the internal controls on material business process including financial, operational, compliance and information technology controls that are in place in each of the Group’s key operating units. The primary functions of the internal audit function are to:
(a) assess the relevant risks related to the Group’s business operations and evaluate if an adequate system of internal controls is in place to protect the funds and assets of the Group;
(b) assess if operations of the business processes under review are conducted efficiently and effectively and to ensure control procedures are complied with; and
(c) identify and recommend improvement to internal control procedures, where required.
Nexia reports to the AC on all matters concerning internal controls including any issue identified in the course of internal audit as well as the administration and implementation of the Group’s internal policies and procedures.
Corporate Governance Report
81 \
Audit CommitteeThe AC is chaired by the Lead Independent Director, Mr Nisbet, and comprises Mr Liew, Mr Khoo and Mr Demierre. The members of the AC are professionals who have extensive experience in senior management positions, including two (2) retired audit partners from Big-four accounting firms with extensive accounting and financial management expertise, a reputable lawyer from a well-known law firm, as well as an Executive Director who knows the business and contributes to a constructive relationship between Management and the AC. The AC members are therefore appropriately qualified to discharge their responsibilities. None of the AC members were previous partners or directors of the Company’s external audit firm within the last two (2) years and none of the AC members hold any financial interest in such external audit firm.
The main responsibility and objective of the AC is to assist the Board in fulfilling its financial and other oversight responsibilities by serving as an independent and objective party to oversee, monitor and appraise the integrity of the Company’s financial reporting process, the internal controls and risk management systems as well as the audits processes. Significant findings in the course of its reviews are reported to the Board.
Pursuant to the written TOR endorsed by the Board, AC has the following key functions:
(a) oversight of financial reporting, monitor integrity of the Group’s financial statements and any public financial reporting;
(b) review and evaluate with internal and external auditors, scope of the audits and reporting obligation, the adequacy and effectiveness of the internal controls (including financial, operational, compliance and information technology controls) and risk management systems;
(c) review and consider the appointment or re-appointment of the external and internal auditors and matters relating to their resignation or dismissal thereof;
(d) report to the Board at least annually on the effectiveness and adequacy of the Company’s risk management and internal control systems, including financial, operational, compliance and information technology controls;
(e) review interested person transactions (within the definition of the Listing Rules) involving the Group in accordance with the Listing Rules;
(f) review and approve future hedging policy, instruments used for hedging and foreign exchange policy and practice of the Group;
(g) review whistleblowing investigations within the Group and ensure appropriate follow-up actions, if any; and
(h) generally undertake such other functions and duties as may be required by the Listing Rules.
To ensure it could discharge its functions properly, AC has the explicit authority to investigate any matters within its terms of reference and has full access to and the cooperation of Management. The AC has full discretion to invite any Director or executive officer to attend an AC meeting to answer questions which the AC may have. It also has direct access
to the Company’s external auditors and is conferred the authority to source external resources including obtaining legal or other professional advice and services. It may commission an independent audit on internal controls and risk management for its assurance, or where it is not satisfied with the systems of internal controls and risk management.
The AC performed, among others, the following core duties and activities in FY2018:
Financial Reporting. The AC safeguards the integrity in financial reporting and ensures such reporting is in compliance with the requirements of the Singapore Financial Reporting Standards. It reviews the quarterly and full year financial results and related announcements, and oversees significant financial reporting issues and assessments, in particular, reviews the Group’s application and consistency of financial and accounting policies, judgments and practices. The AC, when satisfied that the financial results and related announcements meet statutory requirements, would submit and recommend the release of the financial results and related announcements to the Board. Any significant issues and judgement that AC considered in relation to the financial statements and the actions to address such concerns will also be reported to the Board.
External and Internal Audits. AC reviews the overall scope of external and internal audits prior to each audit process, to ensure material areas are covered and sufficient attention is paid to higher risk areas.
The scope and results of auditing by the Company’s external auditors, Ernst & Young LLP (“EY”), its cost effectiveness, as well as its independence and objectivity are reviewed by the AC annually. EY keeps the AC abreast of changes to accounting standards and presents to the AC, any issues which have direct impact on the Group’s financial statements.
During the course of review of the Company’s financial statements for FY2018, the AC has discussed each of the key audit matters (“KAMs”) with the Management as well as EY. The AC has assessed and considered the Management’s approach, methodology and assumptions applied to each of the KAMs, and was satisfied with the appropriateness of the analyses performed by the Management. The AC agrees and concurs with the basis and conclusions included in EY’s report with respect to the KAMs. For more information on the KAMs, please refer to pages 91 and 92 of this annual report.
Internal audits are performed accordingly to the audit plan and scope agreed between Nexia and the AC. Nexia presented the internal audit reports, which compile the detailed findings relevant to the Group’s key operating units which it had reviewed, to the AC during quarterly meetings. Any material non-compliance or failure in internal controls, recommendations for improvements and remedial actions taken by Management are reported to the AC. If action plans to mitigate the risks are required, the AC would instruct and ensure that Management undertakes follow-up actions.
The AC reviews the adequacy, effectiveness, independence and scope of the internal audit function annually, including the internal audit plans, activities, budget for internal audit and organisational structure of Nexia. It believes that the internal audit conducted by Nexia for FY2018 attained professional standards, including those promulgated by The Institute of Internal Auditors. The AC is satisfied that the internal audit
Corporate Governance Report
\ 82
function has adequate resources given that there is a team of eight (8) members assigned to the Company’s internal audits, led by Ms Pamela Chan who has 12 years of relevant experience, and Nexia has appropriate standing within the Group during FY2018, and that the quantum of fee paid or payable to Nexia should not put its objectivity at risk.
The AC (excluding Mr Demierre) meets with the internal and external auditors without the presence of Management at least once a year, to obtain feedback on the competency and adequacy of the finance function and to ascertain if there are any material weaknesses or control deficiencies in the Group’s financial reporting and operational systems. Mr Demierre, being an Executive Director, has been excluded from the aforesaid meeting(s) to ensure that the AC remains a platform for external and internal auditors to provide their independent opinions without the influence of Management. This safeguard is essential to ensure that the presence of an Executive Director on the AC will not lead to any conflict of interest or impede the independence of the AC.
Governance of Risk. The AC is tasked to assist the Board to oversee Management in the design, implementation and monitoring of the internal controls and risk management systems. This includes identifying weaknesses and recommending areas for improvement and additional risk mitigations, where necessary. The Management reviews the conditions of the industry and any factors or events that may affect the Group’s operations, and presented its observation of the potential risks to the AC during quarterly meetings. Any material changes to the key risks areas are also reported to the AC as soon as they are identified. AC has reviewed the up-to-date risk register, the implementation and execution of standard operating procedures, as well as remedial actions recommended by the internal auditor and implemented by Management. The AC reports annually to the Board, its view on the effectiveness and adequacy of the Group’s internal controls (including financial, operational, compliance and information technology controls) and risk management systems.
Whistleblowing Framework. The Group has in place and has published on its website, a channel to raise concerns about any suspected improprieties. Its Whistleblowing Policy provides employees and third-parties a direct channel to the AC for the raising of concerns about any improprieties in matters of financial reporting, or other aspects in confidence and in good faith, without fear of reprisal. All whistleblowing matters come under the purview of the AC, to ensure independent investigation of such matters and for appropriate follow-up action. The Whistleblowing Policy and its effectiveness will be reviewed by the AC periodically, with any recommendations regarding updates or amendments being made to the Board as required.
Interested Person Transactions (“IPT”). The AC reviews IPTs (if any) at its quarterly meetings and annually with the Company’s external auditors, to ensure that established procedures for monitoring the IPTs have been complied with. The AC is satisfied that the guidelines and review procedures established to review IPTs have been complied with in FY2018. Further information relating to the IPTs during FY2018 is provided under the section “Interested Person Transactions”.
Summary of the Board and AC’s Observations for FY2018 The Board is of the view that the AC comprises members with requisite qualifications and sufficient financial management expertise to discharge the AC’s functions competently. It has received assurances from the CEO and CFO that for FY2018:
(a) the Group’s financial records have been properly maintained and the financial statements give a true and fair view of the Group’s operations and finances; and
(b) considering the weakness in the procurement process of the Ivory Coast’s operations has been rectified, the Group’s risk management and internal controls systems are adequate and effective in addressing the financial, operational, compliance and information technology risks of the Group.
With the assurances from the CEO together with the CFO, and following its assessment on the following:
(a) the reviews of the reports of Nexia;
(b) internal controls established and maintained by the Group;
(c) actions taken by the Management according to internal auditor’s recommendations;
(d) remedial actions taken by the Management to rectify the control lapses identified and to enhance the procurement process in the Ivory Coast; and
(e) reports from EY,
the Board, with the concurrence of the AC, is of the opinion that the Group’s present risk management and internal controls systems are adequate and effective in addressing the financial, operational, compliance and information technology risks of the Group. However, the Board notes that the risk management and internal controls provide reasonable, but not absolute, assurance against material misstatements of loss, and include the safeguarding of assets, the maintenance of proper accounting records, the reliability of financial information, compliance with appropriate legislation, regulation and best practice, and the identification and containment of business risk. The Board also notes that all internal control systems contain inherent limitations and no system of internal controls can provide absolute assurance against the occurrence of material errors, poor judgement in decision-making, human error losses, fraud or other irregularities.
The AC and the Board are satisfied that the aggregate amount of audit fees paid and/or payable to EY in connection with the audit as well as non-audit services for FY2018 is appropriate. Having considered the relevant provisions under the applicable regulations, the cooperation extended by the Management and the fact that the non-audit services were provided by a separate team from EY and that the non-audit fees comprise less than 30% of the total fees paid and/or payable to EY, AC is of the view that the independence or objectivity of EY is not impaired. For details of fees paid and/or payable to EY in respect of audit and non-audit services, please refer to Note 8 of the Notes to the Financial Statements on page 122 of this annual report. Taking into consideration all relevant factors (with reference to the audit quality
Corporate Governance Report
83 \
indicators as published by the Accounting and Regulatory Authority) including the adequacy of resources, experience of supervisory and professional staff to be assigned to the audit process, the quality of work carried out by EY, the size and complexity of the Group, its businesses and operations, AC has recommended that EY be re-appointed as the Company’s external auditors for FY2019. The appointment of external auditors of the Group complies with Rules 712 and 715 of the Listing Rules. Pursuant to Rule 713 of the Listing Manual, a successor audit partner-in-charge has been identified for FY2019 in place of Ms Lee Lai Hiang, who has been the audit partner for five (5) consecutive audits.
SHAREHOLDER RIGHTS AND RESPONSIBILITIES
Shareholder RightsThe Company’s corporate governance practices promote fair and equitable treatment of all Shareholders. Shareholders, as the owners of the Company, are entitled to attend and vote at general meetings, to a share of the Company’s profits and all other rights pursuant to The Companies Act (Chapter 50) of Singapore (the “Companies Act”) as well as the provisions of the Company’s Constitution. All the applicable provisions under The Companies (Amendment) Act 2014 and The Companies (Amendment) Act 2017 concerning the shareholders’ rights, including the multiple proxies regime, have been incorporated into the Company’s Constitution.
The Company recognises that effective communication with investors assists the creation and maintenance of an informed market, and enhances corporate governance by encouraging a culture of transparency in relation to its corporate activities and proposals. It has in place an Investor Relations Policy which allows for an ongoing exchange of views so as to actively engage and promote regular, effective and fair communication with Shareholders. The Company employs various platforms, including briefing for analysts after the release of its quarterly financial results, to effectively engage the Shareholders and the investment community, with an emphasis on timely, accurate, fair and transparent disclosure of information.
Disclosure of Information. The Company gives Shareholders a balanced and understandable assessment of its performance, position and prospects. It is the policy of the Board that all Shareholders are informed in a comprehensive and timely manner on all major or material developments that have an impact on the Group. To facilitate Shareholders’ rights and to ensure fair communication with the Shareholders, all information about the Company’s new initiatives which would be likely to materially affect the price or value of the Company’s shares are promptly disseminated to Shareholders through the following platforms:
(a) SGXnet announcements and news release;
(b) Annual Report and notice of general meetings issued to all Shareholders;
(c) press releases on major developments of the Group;
(d) the Company’s general meeting; and
(e) the corporate website (http://www.halcyonagri.com) maintained by the Company that allows all stakeholders to stay informed of material updates in a timely manner.
Apart from statutory announcements, the Company also produces presentation materials and a newsletter – Halcyon Days – which publishes the Group’s achievements, updates to business operations, important dates and recapitulate any big announcements periodically. Halcyon Days is available on the Company website and the latest version is made available to Shareholders at the Company’s general meeting. Materials relating to financial results, press releases, annual reports and the Group profile and various other investor-related information on the Group are also available on the Company’s website.
Dividend Policy. The Company currently does not have a fixed dividend policy, to allow greater flexibility on the capital management. It continually reviews strategic options to enhance shareholders value, including potential acquisitions or realisation of assets. Any of such strategic actions would affect the allocation of fund. The Company recorded a net loss and consequently did not declare any dividends in respect of FY2018, and will review and/or determine its dividend policy at an appropriate time.
Conduct of Shareholder MeetingsGeneral meetings remain the Company’s principal forum for dialogue with Shareholders. The Board supports and encourages active shareholder participation at general meetings. The participation of Shareholders was encouraging and Shareholders actively communicated their views in the general meetings which were held in FY2018.
The Company’s general meetings provide an opportune forum for Shareholders to meet the Board and senior management and to interact with them. The Directors and Management actively engage Shareholders before and after general meetings, to understand the view of Shareholders, to gather inputs and address their concerns. General meetings are attended by all Directors whenever possible, and would normally be chaired by the Chairman of the Board. Chairmen of the Board Committees are also available at the meetings to answer any questions relating to the operations of the Board Committees. The Company’s external auditors are also present to address Shareholders’ queries about the conduct of audit and the preparation and content of the auditors’ report.
Updates on the Company’s performance and position are presented to the Shareholders in the general meetings, and such presentation materials are made available on the SGX-ST and the Company’s website prior to the meetings, for the benefit of the Shareholders.
Shareholders are properly informed of the meeting schedule and the agenda of meeting at least 14 or 21 days (as the case may be) prior to the date appointed for the general meeting. The notice of general meeting issued to all Shareholders is advertised in newspapers and disseminated through SGXnet, as well as published on the Company’s website.
Rules (including the appointment of proxy(ies) and voting procedures) that govern the attendance for general meetings are clearly set out in the notice of general meeting as well as the proxy form. Pursuant to the Constitution, every Shareholder is entitled to attend and vote at the general meetings of the Company and is allowed to appoint not more than two (2) proxies to vote on his/her behalf at the
Corporate Governance Report
\ 84
general meetings during his/her absence. Notwithstanding, specified intermediaries such as CPF, banks and capital market services license holders which provide custodial services are allowed to appoint multiple proxies.
Sufficient and necessary information required for Shareholders to make informed decisions is provided or accompanied by the notice convening each general meeting. At general meetings, each distinct issue is proposed as a separate resolution and Shareholders are given the right to express their views and exercise their voting rights on each resolution to be debated and decided upon. The Company has mandated poll voting since 2014. The polling agent appointed by the Company will explain the rules and tabulation procedures used for poll voting at the Company’s general meetings, before the polling starts. At each general meeting, an independent scrutineer is appointed to count and validate the votes prior to declaration of poll results by the Chairman. Details on voting outcomes including the number of votes cast for and against each resolution together with the respective percentages are announced in the general meeting, and to the public through SGXnet in accordance with the format prescribed under the Listing Rules.
The proceedings of general meetings, including significant comments or queries from Shareholders relating to the agenda of the meeting, and responses from the Board and Management are properly recorded. Minutes of general meetings are available to Shareholders upon request.
Stakeholder Engagement. Ethical and ecologically sustainable business practices are fundamental to the Company’s strategy for long-term growth. The Board remains committed to working with stakeholders and engages them at all levels including customers, competitors, industry associations, employees, regulators, and suppliers. The Company adopts an inclusive approach by considering and balancing the needs and interests of material stakeholders, as part of its overall responsibility to ensure that the best interests of the Company are served. It has arrangements in place to identify and engage with the material stakeholders groups. Other information on the Group’s engagement with stakeholders is set out in page 37 of this annual report.
One of the Company’s major initiatives with the objective of connecting material stakeholders in the rubber industry, is the launch of HeveaConnect, a digital marketplace for all natural rubber stakeholders which supports the Company’s commitment towards a more sustainable rubber industry. HeveaConnect aims to promote greater price transparency in the natural rubber market, and serves as an all-inclusive platform for farmers, producers, tyre manufacturers, as well as facilitators such as financial institutions, logistics and warehousing suppliers. Its goal is to be the leading digital marketplace for sustainable natural rubber and a trading platform, which embraces supply chain transparency.
DEALING IN SECURITIESThe Company observes and complies with Rule 1207(19) of the Listing Rules on dealings in securities and issues quarterly notices to its Directors, officers and employees on the restrictions in dealing in the Company’s securities during the period commencing two (2) weeks before the announcement of the Company’s financial results for each of the first three
quarters of its financial year, and one (1) month before the announcement of the Company’s full-year financial results, and ending on the date of the announcement of the relevant results. Notices prohibiting dealing in Company securities will also be sent to the Group’s Directors, officers and employees as and when circumstances are deemed appropriate, such as when a discussion relating to an acquisition is expected to take a long period of time before it achieves certainty.
Directors, officers and employees are reminded periodically not to trade in the Company’s securities at any time while in possession of unpublished price sensitive information, and to refrain from dealing in the Company’s securities on short-term considerations. They are also advised to be mindful of the laws on insider-trading at all times even when dealing in securities within the permitted trading period.
INTERESTED PERSON TRANSACTIONS The Group does not have a general mandate from Shareholders for IPTs. The assessment of IPTs is under the purview of the AC, to ensure that any transaction to be entered into with interested persons (as defined in the Listing Rules) will be assessed independently, and that the transaction is carried out on normal commercial terms and are not prejudicial to the interests of the Company or its minority Shareholders.
Any contract to be made with an interested person will not be proceeded with unless the pricing is determined in accordance with the Group’s usual business practices and policies, consistent with the usual margin given or price received by the Group for the same or substantially similar type of transactions with the unrelated parties, and that the terms are not more favourable to the interested person than those extended to or received from unrelated parties. Where it is impractical or not possible to compare against the terms of other transactions with unrelated third parties or in situations where the products or services may be purchased only from an interested person, such IPT must be reviewed and approved by the AC, and the AC member who is perceived to be related to the interest person is refrained from deliberating, reviewing and approving that particular transaction. A review on all IPTs entered into by the Group (if any), will be incorporated into the Group’s internal audit plan.
During FY2018, there were no IPTs which were more than S$100,000 entered into by the Group or subject to Listing Rules 905, 906 and 907.
MATERIAL CONTRACTSOther than the service agreements entered into with the CEO and the Executive Director, there were no material contracts (including loans) entered into by the Company or any of its subsidiaries involving the interest of the CEO, any Directors, or controlling shareholders which are either still subsisting at the end of FY2018 or if not then subsisting, entered into since the end of the previous financial year ended 31 December 2017.
Corporate Governance Report
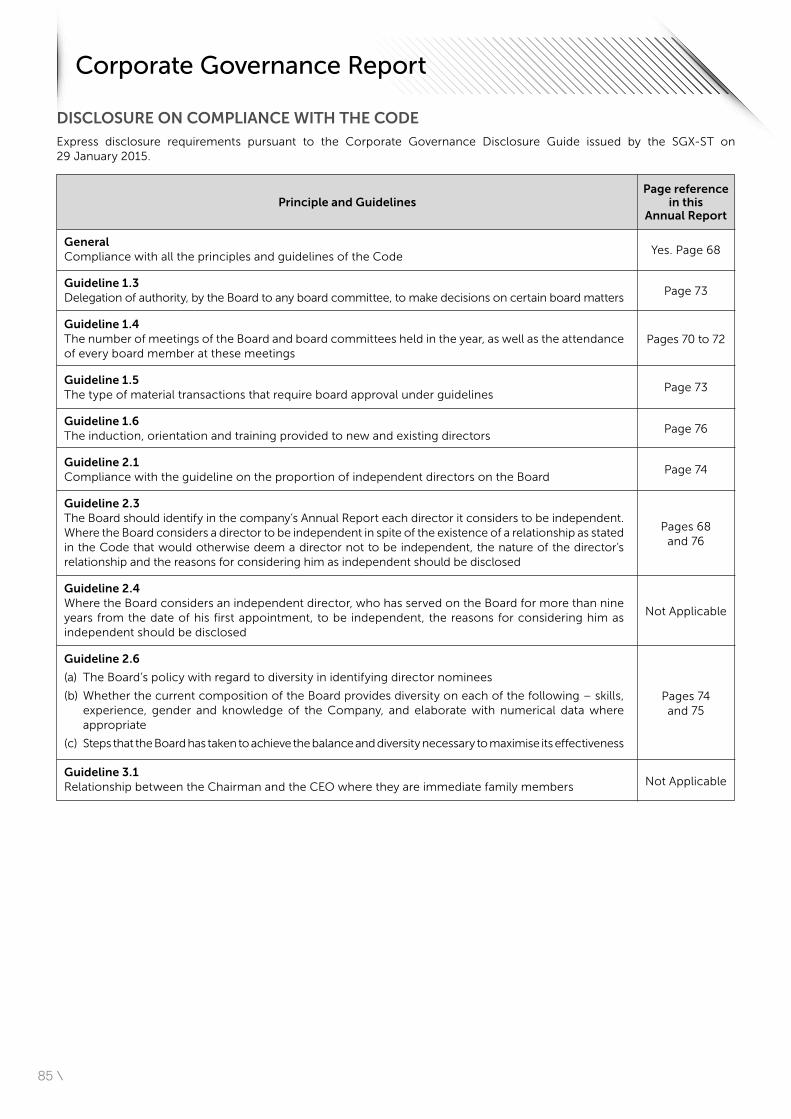
85 \
DISCLOSURE ON COMPLIANCE WITH THE CODEExpress disclosure requirements pursuant to the Corporate Governance Disclosure Guide issued by the SGX-ST on 29 January 2015.
General Compliance with all the principles and guidelines of the Code
Guideline 1.5 The type of material transactions that require board approval under guidelines
Guideline 1.6 The induction, orientation and training provided to new and existing directors
Guideline 2.1 Compliance with the guideline on the proportion of independent directors on the Board
Guideline 3.1 Relationship between the Chairman and the CEO where they are immediate family members
Guideline 2.3 The Board should identify in the company’s Annual Report each director it considers to be independent. Where the Board considers a director to be independent in spite of the existence of a relationship as stated in the Code that would otherwise deem a director not to be independent, the nature of the director’s relationship and the reasons for considering him as independent should be disclosed
Guideline 2.4 Where the Board considers an independent director, who has served on the Board for more than nine years from the date of his first appointment, to be independent, the reasons for considering him as independent should be disclosed
Guideline 2.6
(a) The Board’s policy with regard to diversity in identifying director nominees
(b) Whether the current composition of the Board provides diversity on each of the following – skills, experience, gender and knowledge of the Company, and elaborate with numerical data where appropriate
(c) Steps that the Board has taken to achieve the balance and diversity necessary to maximise its effectiveness
Guideline 1.3 Delegation of authority, by the Board to any board committee, to make decisions on certain board matters
Guideline 1.4 The number of meetings of the Board and board committees held in the year, as well as the attendance of every board member at these meetings
Principle and Guidelines
Yes. Page 68
Page 73
Pages 70 to 72
Page 73
Page 76
Page 74
Not Applicable
Not Applicable
Pages 74 and 75
Pages 68 and 76
Page reference in this
Annual Report
Corporate Governance Report
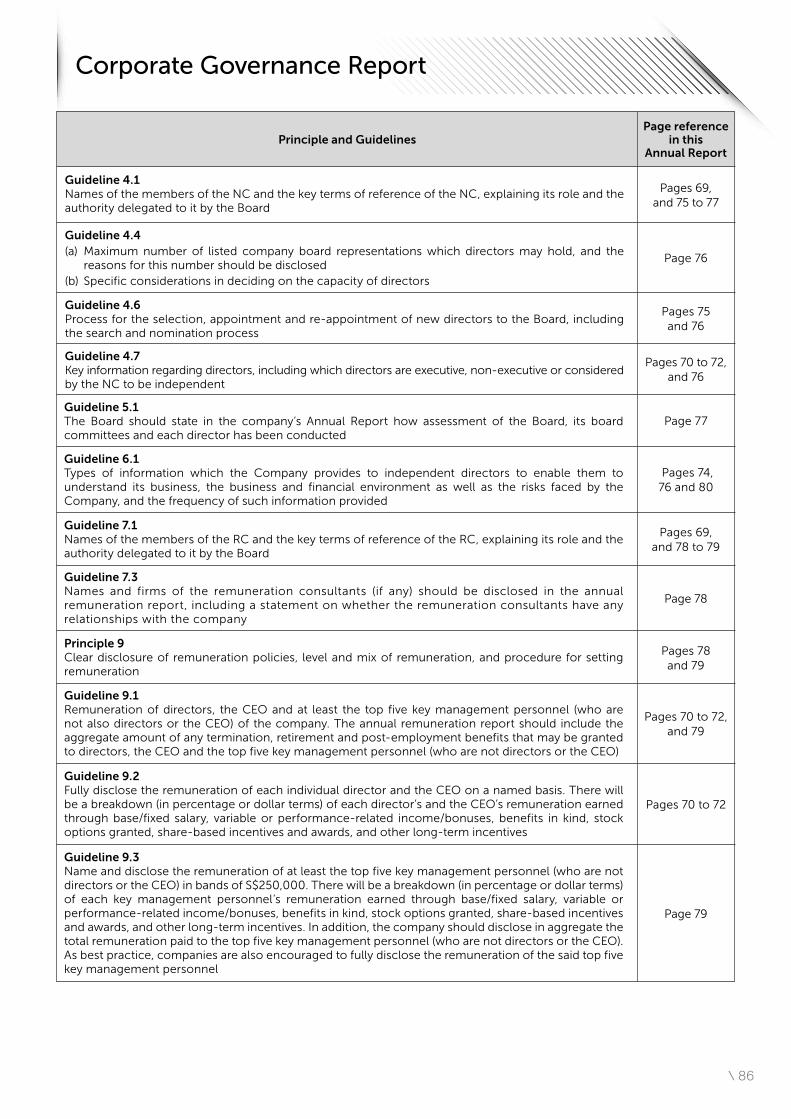
\ 86
Guideline 5.1 The Board should state in the company’s Annual Report how assessment of the Board, its board committees and each director has been conducted
Guideline 6.1 Types of information which the Company provides to independent directors to enable them to understand its business, the business and financial environment as well as the risks faced by the Company, and the frequency of such information provided
Guideline 7.1 Names of the members of the RC and the key terms of reference of the RC, explaining its role and the authority delegated to it by the Board
Guideline 7.3 Names and firms of the remuneration consultants (if any) should be disclosed in the annual remuneration report, including a statement on whether the remuneration consultants have any relationships with the company
Guideline 9.1 Remuneration of directors, the CEO and at least the top five key management personnel (who are not also directors or the CEO) of the company. The annual remuneration report should include the aggregate amount of any termination, retirement and post-employment benefits that may be granted to directors, the CEO and the top five key management personnel (who are not directors or the CEO)
Guideline 9.2 Fully disclose the remuneration of each individual director and the CEO on a named basis. There will be a breakdown (in percentage or dollar terms) of each director’s and the CEO’s remuneration earned through base/fixed salary, variable or performance-related income/bonuses, benefits in kind, stock options granted, share-based incentives and awards, and other long-term incentives
Guideline 9.3 Name and disclose the remuneration of at least the top five key management personnel (who are not directors or the CEO) in bands of S$250,000. There will be a breakdown (in percentage or dollar terms) of each key management personnel’s remuneration earned through base/fixed salary, variable or performance-related income/bonuses, benefits in kind, stock options granted, share-based incentives and awards, and other long-term incentives. In addition, the company should disclose in aggregate the total remuneration paid to the top five key management personnel (who are not directors or the CEO). As best practice, companies are also encouraged to fully disclose the remuneration of the said top five key management personnel
Principle 9 Clear disclosure of remuneration policies, level and mix of remuneration, and procedure for setting remuneration
Principle and GuidelinesPage reference
in this Annual Report
Guideline 4.7 Key information regarding directors, including which directors are executive, non-executive or considered by the NC to be independent
Guideline 4.1 Names of the members of the NC and the key terms of reference of the NC, explaining its role and the authority delegated to it by the Board
Guideline 4.6 Process for the selection, appointment and re-appointment of new directors to the Board, including the search and nomination process
Guideline 4.4(a) Maximum number of listed company board representations which directors may hold, and the
reasons for this number should be disclosed (b) Specific considerations in deciding on the capacity of directors
Pages 69, and 75 to 77
Pages 75 and 76
Pages 70 to 72, and 76
Page 77
Pages 69, and 78 to 79
Pages 78 and 79
Pages 70 to 72, and 79
Pages 70 to 72
Page 79
Page 78
Pages 74, 76 and 80
Page 76
Corporate Governance Report
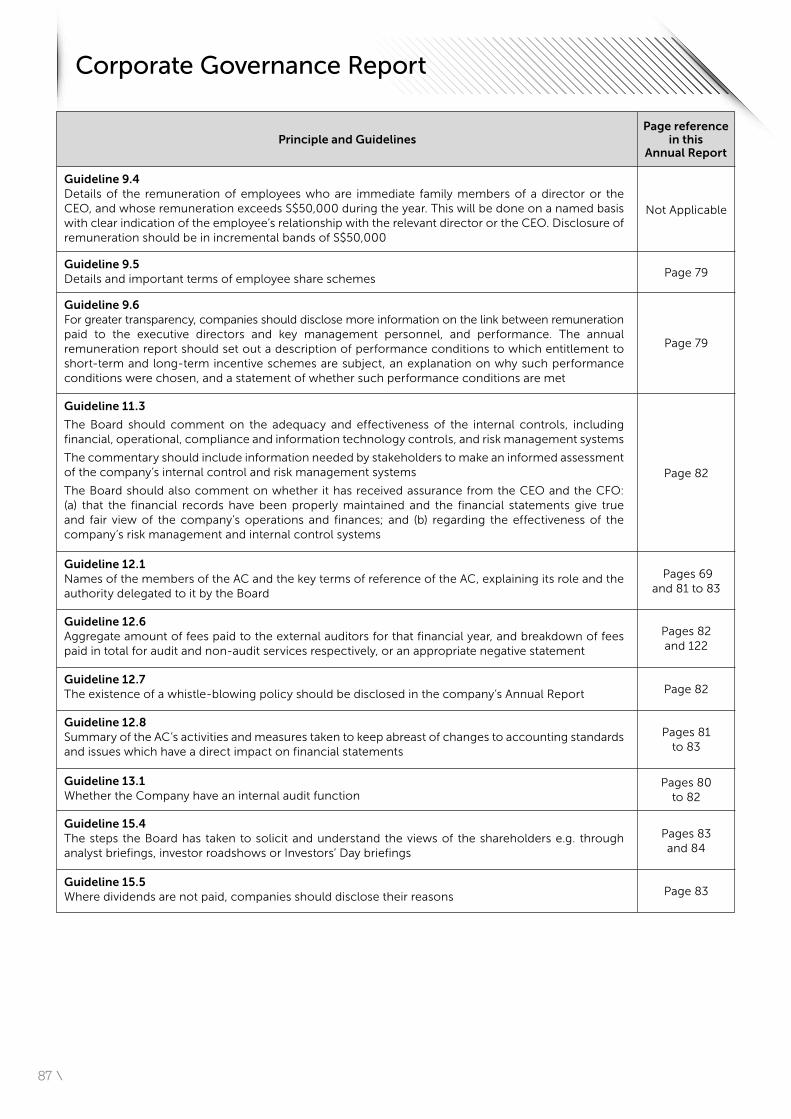
87 \
Guideline 11.3
The Board should comment on the adequacy and effectiveness of the internal controls, including financial, operational, compliance and information technology controls, and risk management systems
The commentary should include information needed by stakeholders to make an informed assessment of the company’s internal control and risk management systems
The Board should also comment on whether it has received assurance from the CEO and the CFO: (a) that the financial records have been properly maintained and the financial statements give true and fair view of the company’s operations and finances; and (b) regarding the effectiveness of the company’s risk management and internal control systems
Guideline 12.1Names of the members of the AC and the key terms of reference of the AC, explaining its role and the authority delegated to it by the Board
Guideline 12.6Aggregate amount of fees paid to the external auditors for that financial year, and breakdown of fees paid in total for audit and non-audit services respectively, or an appropriate negative statement
Guideline 12.8Summary of the AC’s activities and measures taken to keep abreast of changes to accounting standards and issues which have a direct impact on financial statements
Guideline 13.1Whether the Company have an internal audit function
Guideline 15.4The steps the Board has taken to solicit and understand the views of the shareholders e.g. through analyst briefings, investor roadshows or Investors’ Day briefings
Guideline 15.5Where dividends are not paid, companies should disclose their reasons
Guideline 12.7The existence of a whistle-blowing policy should be disclosed in the company’s Annual Report
Principle and GuidelinesPage reference
in this Annual Report
Guideline 9.6 For greater transparency, companies should disclose more information on the link between remuneration paid to the executive directors and key management personnel, and performance. The annual remuneration report should set out a description of performance conditions to which entitlement to short-term and long-term incentive schemes are subject, an explanation on why such performance conditions were chosen, and a statement of whether such performance conditions are met
Guideline 9.5 Details and important terms of employee share schemes
Guideline 9.4 Details of the remuneration of employees who are immediate family members of a director or the CEO, and whose remuneration exceeds S$50,000 during the year. This will be done on a named basis with clear indication of the employee’s relationship with the relevant director or the CEO. Disclosure of remuneration should be in incremental bands of S$50,000
Not Applicable
Page 79
Page 82
Page 83
Pages 81 to 83
Pages 80 to 82
Pages 83 and 84
Pages 69 and 81 to 83
Pages 82 and 122
Page 79
Page 82
Corporate Governance Report
\ 88
Financial Contents
Directors’ Statement 89
Independent Auditor’s Report 91
Consolidated Income Statement 94
Consolidated Statement of Comprehensive Income 95
Statements of Financial Position 96
Statements of Changes in Equity 98
Consolidated Cash Flow Statement 102
Notes to the Financial Statements 105
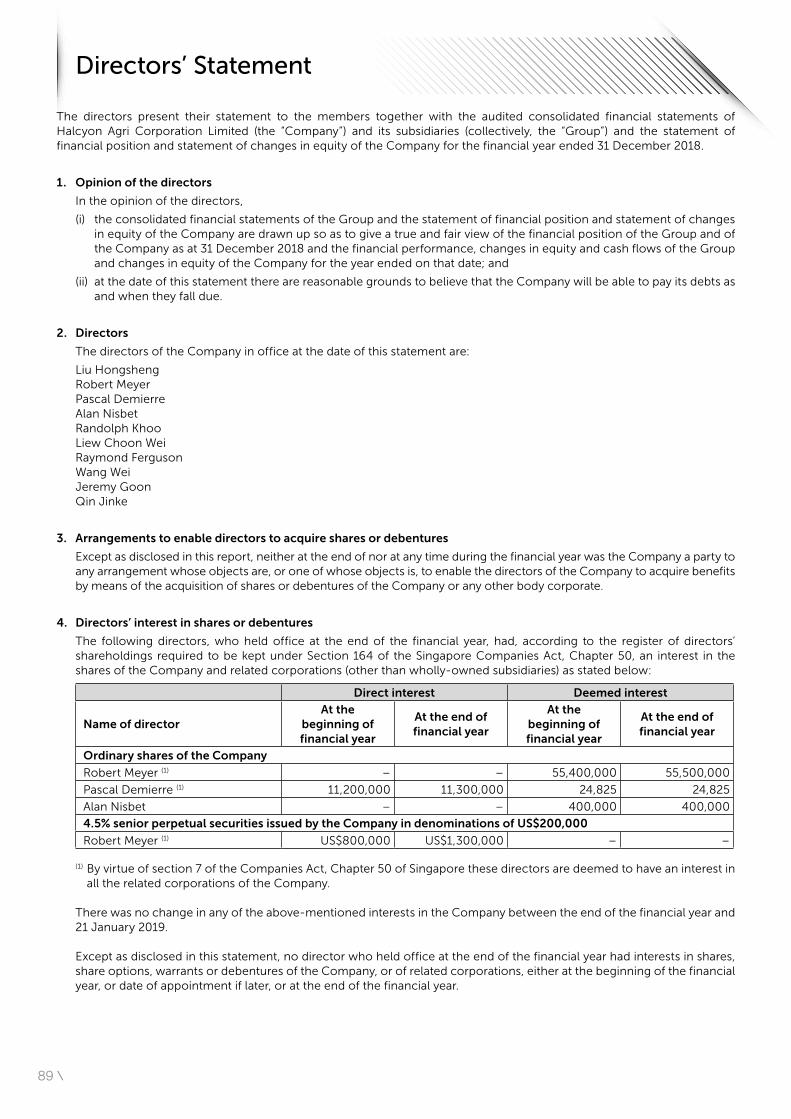
89 \
The directors present their statement to the members together with the audited consolidated financial statements of Halcyon Agri Corporation Limited (the “Company”) and its subsidiaries (collectively, the “Group”) and the statement of financial position and statement of changes in equity of the Company for the financial year ended 31 December 2018.
1. Opinion of the directors
In the opinion of the directors,
(i) the consolidated financial statements of the Group and the statement of financial position and statement of changes in equity of the Company are drawn up so as to give a true and fair view of the financial position of the Group and of the Company as at 31 December 2018 and the financial performance, changes in equity and cash flows of the Group and changes in equity of the Company for the year ended on that date; and
(ii) at the date of this statement there are reasonable grounds to believe that the Company will be able to pay its debts as and when they fall due.
2. Directors
The directors of the Company in office at the date of this statement are:
Liu Hongsheng Robert Meyer Pascal Demierre Alan Nisbet Randolph Khoo Liew Choon Wei Raymond Ferguson Wang Wei Jeremy Goon Qin Jinke
3. Arrangements to enable directors to acquire shares or debentures
Except as disclosed in this report, neither at the end of nor at any time during the financial year was the Company a party to any arrangement whose objects are, or one of whose objects is, to enable the directors of the Company to acquire benefits by means of the acquisition of shares or debentures of the Company or any other body corporate.
4. Directors’ interest in shares or debentures
The following directors, who held office at the end of the financial year, had, according to the register of directors’ shareholdings required to be kept under Section 164 of the Singapore Companies Act, Chapter 50, an interest in the shares of the Company and related corporations (other than wholly-owned subsidiaries) as stated below:
Direct interest Deemed interest
Name of directorAt the
beginning offinancial year
At the end of financial year
At the beginning offinancial year
At the end of financial year
Ordinary shares of the Company
Robert Meyer (1) – – 55,400,000 55,500,000
Pascal Demierre (1) 11,200,000 11,300,000 24,825 24,825
Alan Nisbet – – 400,000 400,000
4.5% senior perpetual securities issued by the Company in denominations of US$200,000
Robert Meyer (1) US$800,000 US$1,300,000 – –
(1) By virtue of section 7 of the Companies Act, Chapter 50 of Singapore these directors are deemed to have an interest in all the related corporations of the Company.
There was no change in any of the above-mentioned interests in the Company between the end of the financial year and 21 January 2019.
Except as disclosed in this statement, no director who held office at the end of the financial year had interests in shares, share options, warrants or debentures of the Company, or of related corporations, either at the beginning of the financial year, or date of appointment if later, or at the end of the financial year.
Directors’ Statement
\ 90
5. Share options
(a) Options to take up unissued shares
During the financial year, no option to take up unissued shares of the Company or any corporation in the Group were granted.
(b) Options exercised
During the financial year, there were no shares of the Company or any corporation in the Group issued by virtue of the exercise of an option to take up unissued shares.
(c) Unissued shares under option
At the end of the financial year, there were no unissued shares of the Company or any corporation in the Group under option.
6. Audit committee
The Company’s audit committee (AC) carried out its functions in accordance with section 201B (5) of the Companies Act, Chapter 50 of Singapore, and it had performed the following core duties and activities (not exhaustive) during the financial year ended 31 December 2018:
a) Reviewed the audit plans, adequacy, effectiveness, scope of audit and reporting obligation of the internal and external auditors;
b) Reviewed the quarterly and full year financial statements as well as the auditor’s report, before their submission to the board of directors (the “Board”);
c) Assessed and concluded the key audit matters with external auditor;
d) Reviewed the effectiveness of the internal control systems, including financial, operational, compliance and information technology controls, as well as the risk management systems;
e) Held a private discussion with the internal and external auditors to discuss matters which would be more appropriately deliberated without the presence of the Company’s management, such as the cooperation of and assistance given by the Company’s management to the internal and external auditors;
f) Reviewed legal and regulatory matters that may have a material impact on the financial statements;
g) Reviewed and evaluated the services of external auditor including the amount of fees paid and/or payable to the external auditor as well as their independence and objectivity;
h) Reviewed the nature and extent of non-audit services provided by the external auditor;
i) Recommended the re-appointment of the external auditor to the Board;
j) Reported to the Board, the material matters deliberated by the AC with appropriate recommendations (as the case may be);
k) Reviewed the policy and arrangements for concerns about possible improprieties in financial reporting or other matters to be safely raised, independently investigated and appropriately followed up on; and
l) Reviewed interested person transactions which fall under the scope of the Listing Manual of the Singapore Exchange Securities Trading Limited.
The AC, having reviewed all non-audit services provided by the external auditor, is satisfied that the nature and extent of such services would not affect the independence of the external auditor.
During the year, four AC meetings were held. The AC also had a private discussion with internal and external auditors, without the presence of the Company’s management.
Further details regarding the AC are disclosed in the Corporate Governance Report.
7. Auditor
Ernst & Young LLP have expressed their willingness to accept re-appointment as auditor.
On behalf of the Board of Directors:
Robert Meyer Pascal Demierre Director Director
Singapore 26 March 2019
Directors’ Statement
91 \
OpinionWe have audited the financial statements of Halcyon Agri Corporation Limited (the “Company”) and its subsidiaries (collectively, the “Group”), which comprise the statements of financial position of the Group and the Company as at 31 December 2018, the consolidated income statement, consolidated statement of comprehensive income and consolidated cash flow statement of the Group and the statements of changes in equity of the Group and the Company for the year then ended, and notes to the financial statements, including a summary of significant accounting policies.
In our opinion, the accompanying consolidated financial statements of the Group, the statement of financial position and the statement of changes in equity of the Company are properly drawn up in accordance with the provisions of the Companies Act, Chapter 50 (the “Act”) and Singapore Financial Reporting Standards (International) (“SFRS(I)”) so as to give a true and fair view of the consolidated financial position of the Group and the financial position of the Company as at 31 December 2018 and of the consolidated financial performance, consolidated changes in equity and consolidated cash flows of the Group and changes in equity of the Company for the year then ended.
Basis for opinionWe conducted our audit in accordance with Singapore Standards on Auditing (“SSA”s). Our responsibilities under those standards are further described in the Auditor’s Responsibilities for the Audit of the Financial Statements section of our report. We are independent of the Group in accordance with the Accounting and Corporate Regulatory Authority (“ACRA”) Code of Professional Conduct and Ethics for Public Accountants and Accounting Entities (“ACRA Code”) together with the ethical requirements that are relevant to our audit of the financial statements in Singapore, and we have fulfilled our other ethical responsibilities in accordance with these requirements and the ACRA Code. We believe that the audit evidence we have obtained is sufficient and appropriate to provide a basis for our opinion.
Key audit mattersKey audit matters are those matters that, in our professional judgment, were of most significance in our audit of the financial statements of the current period. These matters were addressed in the context of our audit of the financial statements as a whole, and in forming our opinion thereon, and we do not provide a separate opinion on these matters. For each matter below, our description of how our audit addressed the matter is provided in that context.
We have fulfilled our responsibilities described in the Auditor’s responsibilities for the audit of the financial statements section of our report, including in relation to these matters. Accordingly, our audit included the performance of procedures designed to respond to our assessment of the risks of material misstatement of the financial statements. The results of our audit procedures, including the procedures performed to address the matters below, provide the basis for our audit opinion on the accompanying financial statements.
1. Impairment of goodwill and process know-how
As at 31 December 2018, the Group’s goodwill and process know-how amounted to US$287,399,000 and US$10,000,000 respectively. They represent approximately 40% of the Group’s net assets.
We focused on the impairment assessment of goodwill and process know-how because the impairment testing of the cash generating units (“CGUs”) attributable to these intangibles rely on estimates of value-in-use (“VIU”) based on the CGU’s expected future cash flows. We considered audit of these cash flow projections to be a key audit matter as these involved significant management judgment, and are based on assumptions that are affected by expected future market and economic conditions. In addition, judgment has also been exercised by management in identifying the appropriate CGUs for the impairment test.
The Group uses assumptions in respect of future market and economic conditions such as forecasted rubber price, forecasted sales volume, growth rates and pre-tax discount rates. We assessed and tested these assumptions which the outcome of the impairment test is most sensitive and data inputs by comparing them to historical performance of the CGU and industry outlook reports. We engaged our valuation specialists to assist us with the audit of the reasonableness of management’s valuation methodologies and certain assumptions used.
We also reviewed the Group’s process in identifying changes to CGUs to which goodwill and/or intangible assets have been allocated to. We obtained and evaluated management’s sensitivity analyses to ascertain the impact of reasonably possible changes in key assumptions and we performed our own independent sensitivity calculations to quantify the downside changes to management’s models required to result in an impairment.
We also assessed the adequacy of the disclosures concerning those key assumptions to which the outcome of the impairment test is most sensitive, as well as changes to CGUs during the year. The disclosures on goodwill and process know-how and key assumptions are included in Note 11.
Independent Auditor’s Report To the members of Halcyon Agri Corporation Limited
\ 92
2. Accounting for acquisitions
During the financial year ended 31 December 2018, the Group completed three acquisitions as disclosed in Note 14(a)(i).
We considered the audit of accounting for these acquisitions to be a key audit matter as these are significant transactions during the year which require significant management judgment regarding the allocation of the purchase price to the assets and liabilities acquired, including: identifying intangible assets acquired in the acquisitions and estimating the value of such intangible assets.
We have, amongst others, read the sales and purchase agreements in relation to these acquisitions to obtain an understanding of the transactions and the key terms. We tested the identification and fair valuation of the acquired assets and liabilities by corroborating the result of the identification against our discussion with management and understanding of the businesses of the newly acquired entities. We involved our internal specialist to assist us in reviewing the valuation methodologies used by management and the external valuation expert engaged by management in the fair valuation of acquired assets and liabilities. We assessed the reasonableness of the valuation assumptions such as discount and growth rates by comparing these assumptions to source data and market data. We have also assessed the competence and relevant experience of the experts engaged by management.
We also assessed the adequacy of the related disclosures in the financial statements regarding these acquisitions in Note 14(a).
Other informationManagement is responsible for other information. The other information comprises the information included in the annual report, but does not include the financial statements and our auditor’s report thereon.
Our opinion on the financial statements does not cover the other information and we do not express any form of assurance conclusion thereon.
In connection with our audit of the financial statements, our responsibility is to read the other information and, in doing so, consider whether the other information is materially inconsistent with the financial statements or our knowledge obtained in the audit or otherwise appears to be materially misstated. If, based on the work we have performed, we conclude that there is a material misstatement of this other information, we are required to report that fact. We have nothing to report in this regard.
Responsibilities of management and directors for the financial statementsManagement is responsible for the preparation of financial statements that give a true and fair view in accordance with the provisions of the Act and SFRS(1), and for devising and maintaining a system of internal accounting controls sufficient to provide a reasonable assurance that assets are safeguarded against loss from unauthorised use or disposition; and transactions are properly authorised and that they are recorded as necessary to permit the preparation of true and fair financial statements and to maintain accountability of assets.
In preparing the financial statements, management is responsible for assessing the Group’s ability to continue as a going concern, disclosing, as applicable, matters related to going concern and using the going concern basis of accounting unless management either intends to liquidate the Group or to cease operations, or has no realistic alternative but to do so.
The directors’ responsibilities include overseeing the Group’s financial reporting process.
Independent Auditor’s Report To the members of Halcyon Agri Corporation Limited
93 \
Auditor’s responsibilities for the audit of the financial statementsOur objectives are to obtain reasonable assurance about whether the financial statements as a whole are free from material misstatement, whether due to fraud or error, and to issue an auditor’s report that includes our opinion. Reasonable assurance is a high level of assurance, but is not a guarantee that an audit conducted in accordance with SSAs will always detect a material misstatement when it exists. Misstatements can arise from fraud or error and are considered material if, individually or in the aggregate, they could reasonably be expected to influence the economic decisions of users taken on the basis of these financial statements.
As part of an audit in accordance with SSAs, we exercise professional judgment and maintain professional skepticism throughout the audit. We also:
• Identify and assess the risks of material misstatement of the financial statements, whether due to fraud or error, design and perform audit procedures responsive to those risks, and obtain audit evidence that is sufficient and appropriate to provide a basis for our opinion. The risk of not detecting a material misstatement resulting from fraud is higher than for one resulting from error, as fraud may involve collusion, forgery, intentional omissions, misrepresentations, or the override of internal control.
• Obtain an understanding of internal control relevant to the audit in order to design audit procedures that are appropriate in the circumstances, but not for the purpose of expressing an opinion on the effectiveness of the Group’s internal control.
• Evaluate the appropriateness of accounting policies used and the reasonableness of accounting estimates and related disclosures made by management.
• Conclude on the appropriateness of management’s use of the going concern basis of accounting and, based on the audit evidence obtained, whether a material uncertainty exists related to events or conditions that may cast significant doubt on the Group’s ability to continue as a going concern. If we conclude that a material uncertainty exists, we are required to draw attention in our auditor’s report to the related disclosures in the financial statements or, if such disclosures are inadequate, to modify our opinion. Our conclusions are based on the audit evidence obtained up to the date of our auditor’s report. However, future events or conditions may cause the Group to cease to continue as a going concern.
• Evaluate the overall presentation, structure and content of the financial statements, including the disclosures, and whether the financial statements represent the underlying transactions and events in a manner that achieves fair presentation.
• Obtain sufficient appropriate audit evidence regarding the financial information of the entities or business activities within the Group to express an opinion on the financial statements. We are responsible for the direction, supervision and performance of the group audit. We remain solely responsible for our audit opinion.
We communicate with the directors regarding, among other matters, the planned scope and timing of the audit and significant audit findings, including any significant deficiencies in internal control that we identify during our audit.
We also provide the directors with a statement that we have complied with relevant ethical requirements regarding independence, and to communicate with them all relationships and other matters that may reasonably be thought to bear on our independence, and where applicable, related safeguards.
From the matters communicated with the directors, we determine those matters that were of most significance in the audit of the financial statements of the current period and are therefore the key audit matters.
We describe these matters in our auditor’s report unless law or regulation precludes public disclosure about the matter or when, in extremely rare circumstances, we determine that a matter should not be communicated in our report because the adverse consequences of doing so would reasonably be expected to outweigh the public interest benefits of such communication.
Report on other legal and regulatory requirements In our opinion, the accounting and other records required by the Act to be kept by the Company and by those subsidiary corporations incorporated in Singapore of which we are the auditors have been properly kept in accordance with the provisions of the Act.
The engagement partner on the audit resulting in this independent auditor’s report is Lee Lai Hiang.
Ernst & Young LLP
Public Accountants and Chartered Accountants Singapore
26 March 2019
Independent Auditor’s Report To the members of Halcyon Agri Corporation Limited
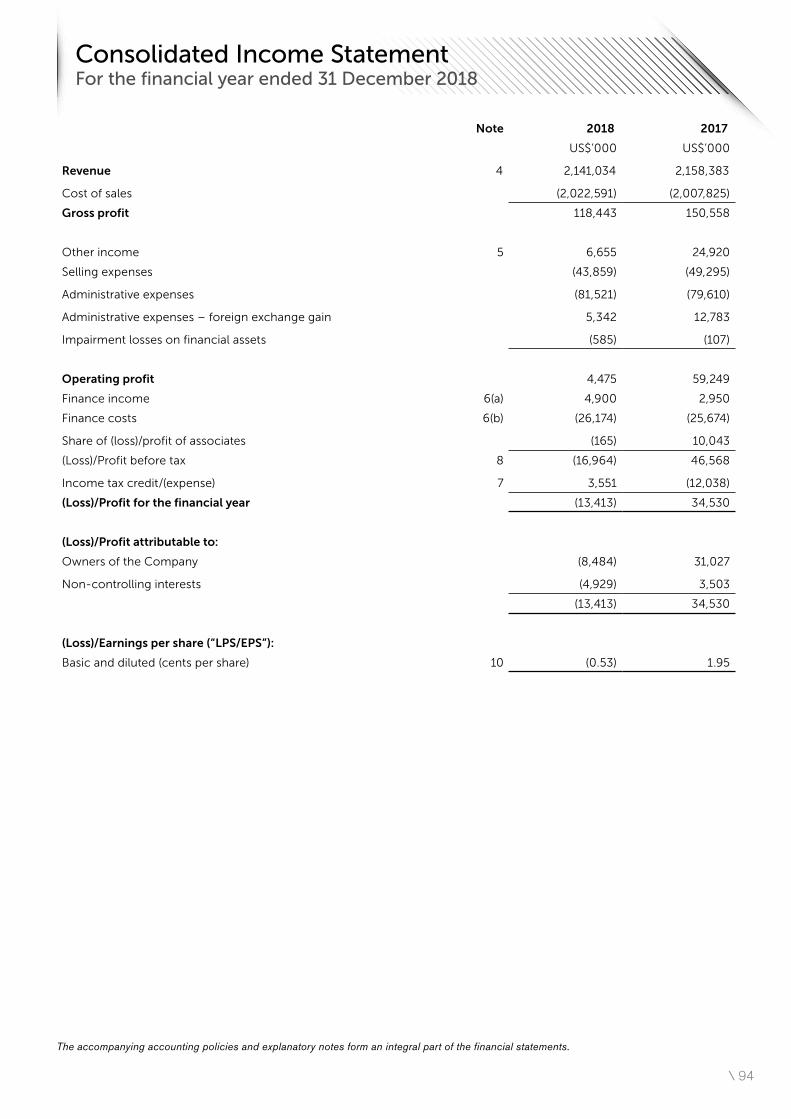
\ 94
Note 2018 2017
US$’000 US$’000
Revenue 4 2,141,034 2,158,383
Cost of sales (2,022,591) (2,007,825)
Gross profit 118,443 150,558
Other income 5 6,655 24,920
Selling expenses (43,859) (49,295)
Administrative expenses (81,521) (79,610)
Administrative expenses – foreign exchange gain 5,342 12,783
Impairment losses on financial assets (585) (107)
Operating profit 4,475 59,249
Finance income 6(a) 4,900 2,950
Finance costs 6(b) (26,174) (25,674)
Share of (loss)/profit of associates (165) 10,043
(Loss)/Profit before tax 8 (16,964) 46,568
Income tax credit/(expense) 7 3,551 (12,038)
(Loss)/Profit for the financial year (13,413) 34,530
(Loss)/Profit attributable to:
Owners of the Company (8,484) 31,027
Non-controlling interests (4,929) 3,503
(13,413) 34,530
(Loss)/Earnings per share (“LPS/EPS”):
Basic and diluted (cents per share) 10 (0.53) 1.95
Consolidated Income Statement For the financial year ended 31 December 2018
The accompanying accounting policies and explanatory notes form an integral part of the financial statements.
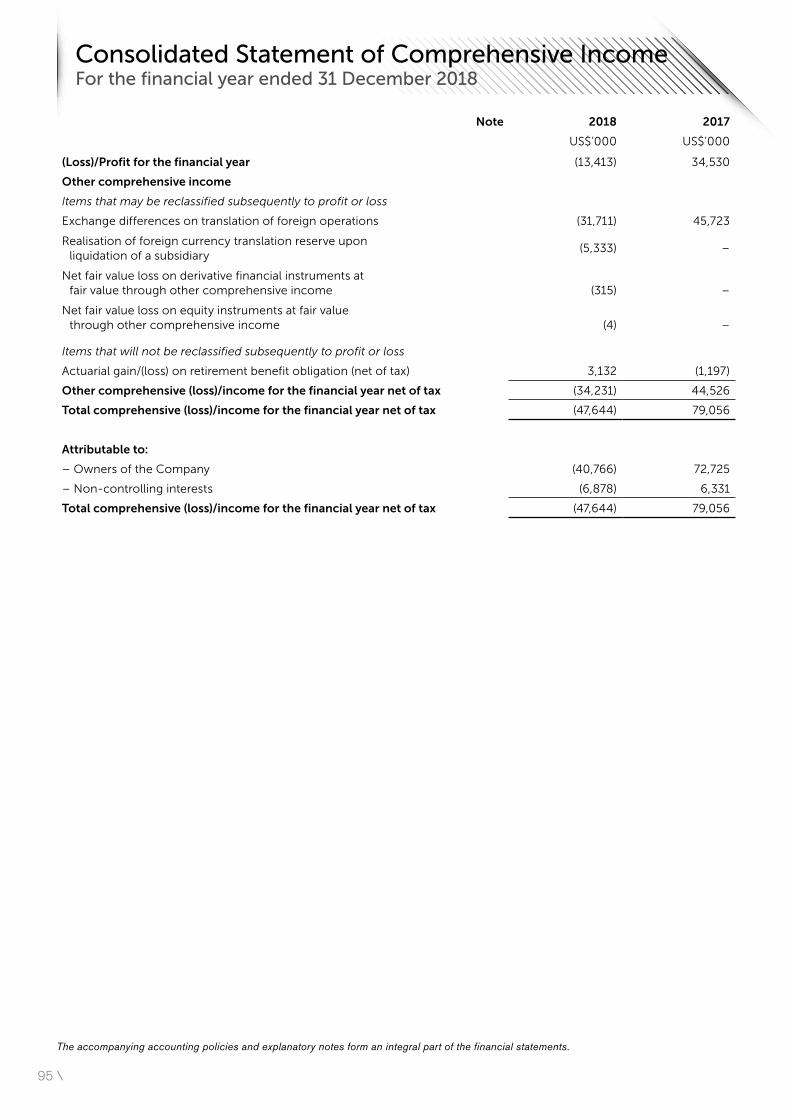
95 \
Note 2018 2017
US$’000 US$’000
(Loss)/Profit for the financial year (13,413) 34,530
Other comprehensive income
Items that may be reclassified subsequently to profit or loss
Exchange differences on translation of foreign operations (31,711) 45,723
Realisation of foreign currency translation reserve upon liquidation of a subsidiary
(5,333) –
Net fair value loss on derivative financial instruments at fair value through other comprehensive income (315) –
Net fair value loss on equity instruments at fair value through other comprehensive income (4) –
Items that will not be reclassified subsequently to profit or loss
Actuarial gain/(loss) on retirement benefit obligation (net of tax) 3,132 (1,197)
Other comprehensive (loss)/income for the financial year net of tax (34,231) 44,526
Total comprehensive (loss)/income for the financial year net of tax (47,644) 79,056
Attributable to:
– Owners of the Company (40,766) 72,725
– Non-controlling interests (6,878) 6,331
Total comprehensive (loss)/income for the financial year net of tax (47,644) 79,056
Consolidated Statement of Comprehensive Income For the financial year ended 31 December 2018
The accompanying accounting policies and explanatory notes form an integral part of the financial statements.
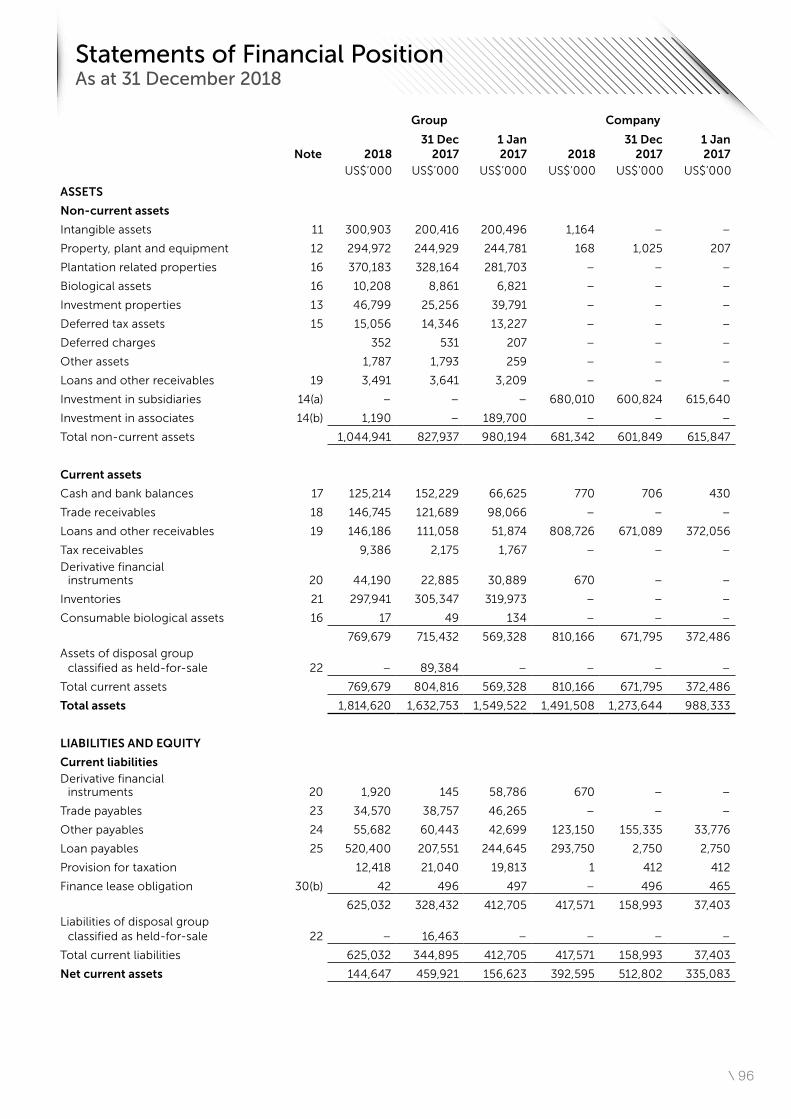
\ 96
Group Company
Note 201831 Dec
20171 Jan 2017 2018
31 Dec 2017
1 Jan 2017
US$’000 US$’000 US$’000 US$’000 US$’000 US$’000
ASSETS
Non-current assets
Intangible assets 11 300,903 200,416 200,496 1,164 – –
Property, plant and equipment 12 294,972 244,929 244,781 168 1,025 207
Plantation related properties 16 370,183 328,164 281,703 – – –
Biological assets 16 10,208 8,861 6,821 – – –
Investment properties 13 46,799 25,256 39,791 – – –
Deferred tax assets 15 15,056 14,346 13,227 – – –
Deferred charges 352 531 207 – – –
Other assets 1,787 1,793 259 – – –
Loans and other receivables 19 3,491 3,641 3,209 – – –
Investment in subsidiaries 14(a) – – – 680,010 600,824 615,640
Investment in associates 14(b) 1,190 – 189,700 – – –
Total non-current assets 1,044,941 827,937 980,194 681,342 601,849 615,847
Current assets
Cash and bank balances 17 125,214 152,229 66,625 770 706 430
Trade receivables 18 146,745 121,689 98,066 – – –
Loans and other receivables 19 146,186 111,058 51,874 808,726 671,089 372,056
Tax receivables 9,386 2,175 1,767 – – –
Derivative financialinstruments 20 44,190 22,885 30,889 670 – –
Inventories 21 297,941 305,347 319,973 – – –
Consumable biological assets 16 17 49 134 – – –
769,679 715,432 569,328 810,166 671,795 372,486
Assets of disposal group classified as held-for-sale 22 – 89,384 – – – –
Total current assets 769,679 804,816 569,328 810,166 671,795 372,486
Total assets 1,814,620 1,632,753 1,549,522 1,491,508 1,273,644 988,333
LIABILITIES AND EQUITY
Current liabilitiesDerivative financial
instruments 20 1,920 145 58,786 670 – –
Trade payables 23 34,570 38,757 46,265 – – –
Other payables 24 55,682 60,443 42,699 123,150 155,335 33,776
Loan payables 25 520,400 207,551 244,645 293,750 2,750 2,750
Provision for taxation 12,418 21,040 19,813 1 412 412
Finance lease obligation 30(b) 42 496 497 – 496 465
625,032 328,432 412,705 417,571 158,993 37,403
Liabilities of disposal group classified as held-for-sale 22 – 16,463 – – – –
Total current liabilities 625,032 344,895 412,705 417,571 158,993 37,403
Net current assets 144,647 459,921 156,623 392,595 512,802 335,083
Statements of Financial Position As at 31 December 2018
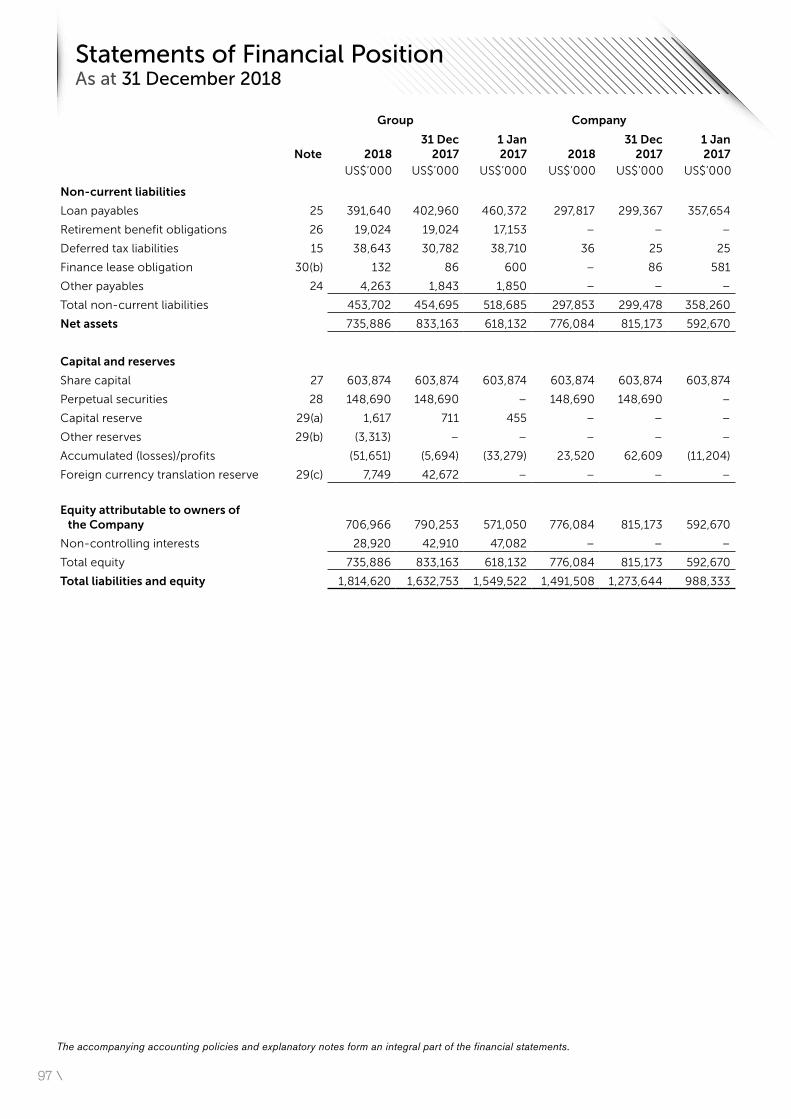
97 \
Group Company
Note 201831 Dec
20171 Jan 2017 2018
31 Dec 2017
1 Jan 2017
US$’000 US$’000 US$’000 US$’000 US$’000 US$’000
Non-current liabilities
Loan payables 25 391,640 402,960 460,372 297,817 299,367 357,654
Retirement benefit obligations 26 19,024 19,024 17,153 – – –
Deferred tax liabilities 15 38,643 30,782 38,710 36 25 25
Finance lease obligation 30(b) 132 86 600 – 86 581
Other payables 24 4,263 1,843 1,850 – – –
Total non-current liabilities 453,702 454,695 518,685 297,853 299,478 358,260
Net assets 735,886 833,163 618,132 776,084 815,173 592,670
Capital and reserves
Share capital 27 603,874 603,874 603,874 603,874 603,874 603,874
Perpetual securities 28 148,690 148,690 – 148,690 148,690 –
Capital reserve 29(a) 1,617 711 455 – – –
Other reserves 29(b) (3,313) – – – – –
Accumulated (losses)/profits (51,651) (5,694) (33,279) 23,520 62,609 (11,204)
Foreign currency translation reserve 29(c) 7,749 42,672 – – – –
Equity attributable to owners of the Company 706,966 790,253 571,050 776,084 815,173 592,670
Non-controlling interests 28,920 42,910 47,082 – – –
Total equity 735,886 833,163 618,132 776,084 815,173 592,670
Total liabilities and equity 1,814,620 1,632,753 1,549,522 1,491,508 1,273,644 988,333
The accompanying accounting policies and explanatory notes form an integral part of the financial statements.
Statements of Financial Position As at 31 December 2018
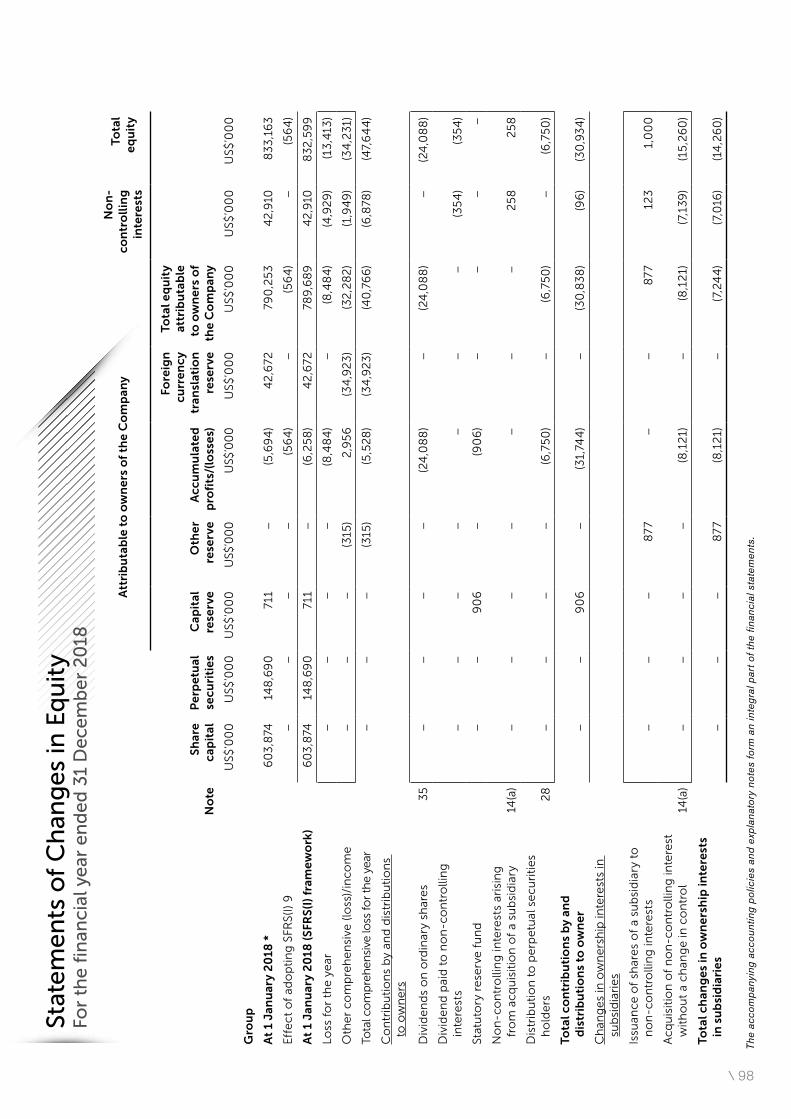
\ 98
Att
rib
uta
ble
to
ow
ne
rs o
f th
e C
om
pan
yN
on
-co
ntr
oll
ing
in
tere
sts
Tota
le
qu
ity
No
teS
har
ec
apit
alP
erp
etu
al
secu
riti
es
Cap
ital
re
serv
eO
the
r re
serv
eA
ccu
mu
late
d
pro
fits
/(lo
sse
s)
Fore
ign
cu
rre
nc
y tr
ansl
atio
n
rese
rve
Tota
l eq
uit
y at
trib
uta
ble
to
ow
ne
rs o
f th
e C
om
pan
y
US$
’00
0U
S$’0
00
US$
’00
0U
S$’0
00
US$
’00
0U
S$’0
00
US$
’00
0U
S$’0
00
US$
’00
0
Gro
up
At
1 Ja
nu
ary
20
18 *
6
03
,874
148
,69
071
1–
(5,6
94
)4
2,6
7279
0,2
53
42
,910
83
3,1
63
Eff
ec
t o
f ad
op
tin
g S
FRS(
I) 9
––
––
(56
4)
–(5
64
)–
(56
4)
At
1 Ja
nu
ary
20
18 (S
FRS
(I) f
ram
ew
ork
)6
03
,874
148
,69
071
1–
(6,2
58
)4
2,6
7278
9,6
89
42
,910
83
2,5
99
Loss
fo
r th
e y
ear
––
––
(8,4
84
)–
(8,4
84
)(4
,92
9)
(13
,413
)
Oth
er
com
pre
he
nsi
ve (
loss
)/in
com
e–
––
(315
)2
,95
6(3
4,9
23
)(3
2,2
82
)(1
,94
9)
(34
,23
1)
Tota
l co
mp
reh
ensi
ve lo
ss fo
r th
e ye
ar–
––
(315
)(5
,52
8)
(34
,92
3)
(40
,76
6)
(6,8
78)
(47,
64
4)
Co
ntr
ibu
tio
ns
by
and
dis
trib
uti
on
s
to o
wn
ers
Div
ide
nd
s o
n o
rdin
ary
shar
es
35
––
––
(24
,08
8)
–(2
4,0
88
)–
(24
,08
8)
Div
ide
nd
pai
d t
o n
on
-co
ntr
olli
ng
in
tere
sts
––
––
––
–(3
54
)(3
54
)
Stat
uto
ry r
ese
rve
fu
nd
––
90
6–
(90
6)
––
––
No
n-c
on
tro
llin
g in
tere
sts
aris
ing
fr
om
acq
uis
itio
n o
f a
sub
sid
iary
14(a
)–
––
––
––
25
82
58
Dis
trib
uti
on
to
pe
rpe
tual
se
curi
tie
s h
old
ers
28
––
––
(6,7
50
)–
(6,7
50
)–
(6,7
50
)
Tota
l co
ntr
ibu
tio
ns
by
and
d
istr
ibu
tio
ns
to o
wn
er
––
90
6–
(31,
744
)–
(30
,83
8)
(96
)(3
0,9
34
)
Ch
ang
es
in o
wn
ers
hip
inte
rest
s in
su
bsi
dia
rie
s
Issu
ance
of
shar
es
of
a su
bsi
dia
ry t
o
no
n-c
on
tro
llin
g in
tere
sts
––
–8
77
––
87
712
31,
00
0
Acq
uis
itio
n o
f n
on
-co
ntr
olli
ng
inte
rest
w
ith
ou
t a
chan
ge
in c
on
tro
l14
(a)
––
––
(8,1
21)
–(8
,12
1)(7
,13
9)
(15
,26
0)
Tota
l ch
ang
es
in o
wn
ers
hip
inte
rest
s in
su
bsi
dia
rie
s–
––
87
7(8
,12
1)–
(7,2
44
)(7
,016
)(1
4,2
60
)
The
acco
mpa
nyin
g ac
coun
ting
polic
ies
and
expl
anat
ory
note
s fo
rm a
n in
tegr
al p
art o
f the
fina
ncia
l sta
tem
ents
.
Stat
em
en
ts o
f C
han
ges
in E
qu
ity
For
the
fin
anci
al y
ear
en
de
d 3
1 D
ece
mb
er
20
18
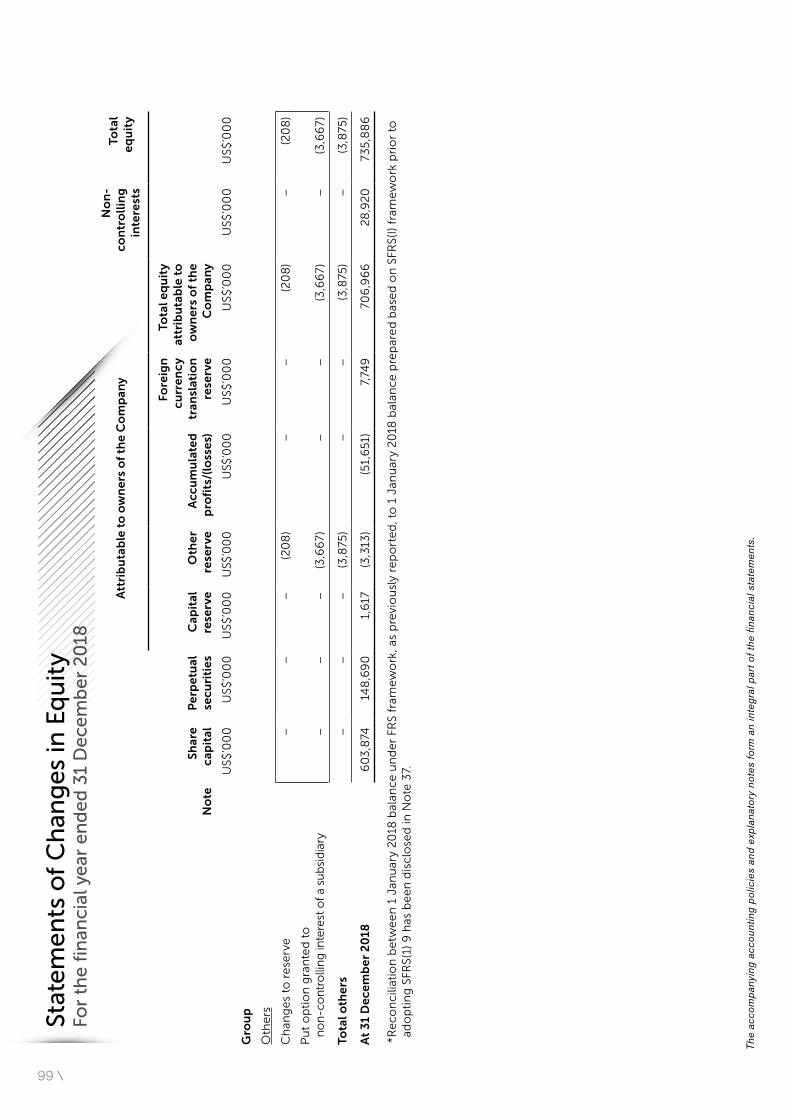
99 \
Att
rib
uta
ble
to
ow
ne
rs o
f th
e C
om
pan
yN
on
-co
ntr
oll
ing
in
tere
sts
Tota
le
qu
ity
No
teS
har
ec
apit
alP
erp
etu
al
secu
riti
es
Cap
ital
re
serv
eO
the
r re
serv
eA
ccu
mu
late
d
pro
fits
/(lo
sse
s)
Fore
ign
cu
rre
nc
y tr
ansl
atio
n
rese
rve
Tota
l eq
uit
y at
trib
uta
ble
to
o
wn
ers
of
the
Co
mp
any
US$
’00
0U
S$’0
00
US$
’00
0U
S$’0
00
US$
’00
0U
S$’0
00
US$
’00
0U
S$’0
00
US$
’00
0
Gro
up
Oth
ers
Ch
ang
es
to r
ese
rve
––
–(2
08
)–
–(2
08
)–
(20
8)
Pu
t o
pti
on
gra
nte
d t
o
no
n-c
on
tro
llin
g in
tere
st o
f a
sub
sid
iary
––
–(3
,66
7)
––
(3,6
67
)–
(3,6
67
)
Tota
l oth
ers
––
–(3
,875
)–
–(3
,875
)–
(3,8
75)
At
31
De
cem
be
r 2
018
60
3,8
7414
8,6
90
1,6
17(3
,313
)(5
1,6
51)
7,74
970
6,9
66
28
,92
073
5,8
86
*Re
con
cilia
tio
n b
etw
ee
n 1
Jan
uar
y 2
018
bal
ance
un
de
r FR
S fr
ame
wo
rk, a
s p
revi
ou
sly
rep
ort
ed
, to
1 J
anu
ary
20
18 b
alan
ce p
rep
are
d b
ase
d o
n S
FRS(
I) f
ram
ew
ork
pri
or
to
ado
pti
ng
SFR
S(1)
9 h
as b
ee
n d
iscl
ose
d in
No
te 3
7.
The
acco
mpa
nyin
g ac
coun
ting
polic
ies
and
expl
anat
ory
note
s fo
rm a
n in
tegr
al p
art o
f the
fina
ncia
l sta
tem
ents
.
Stat
em
en
ts o
f C
han
ges
in E
qu
ity
For
the
fin
anci
al y
ear
en
de
d 3
1 D
ece
mb
er
20
18
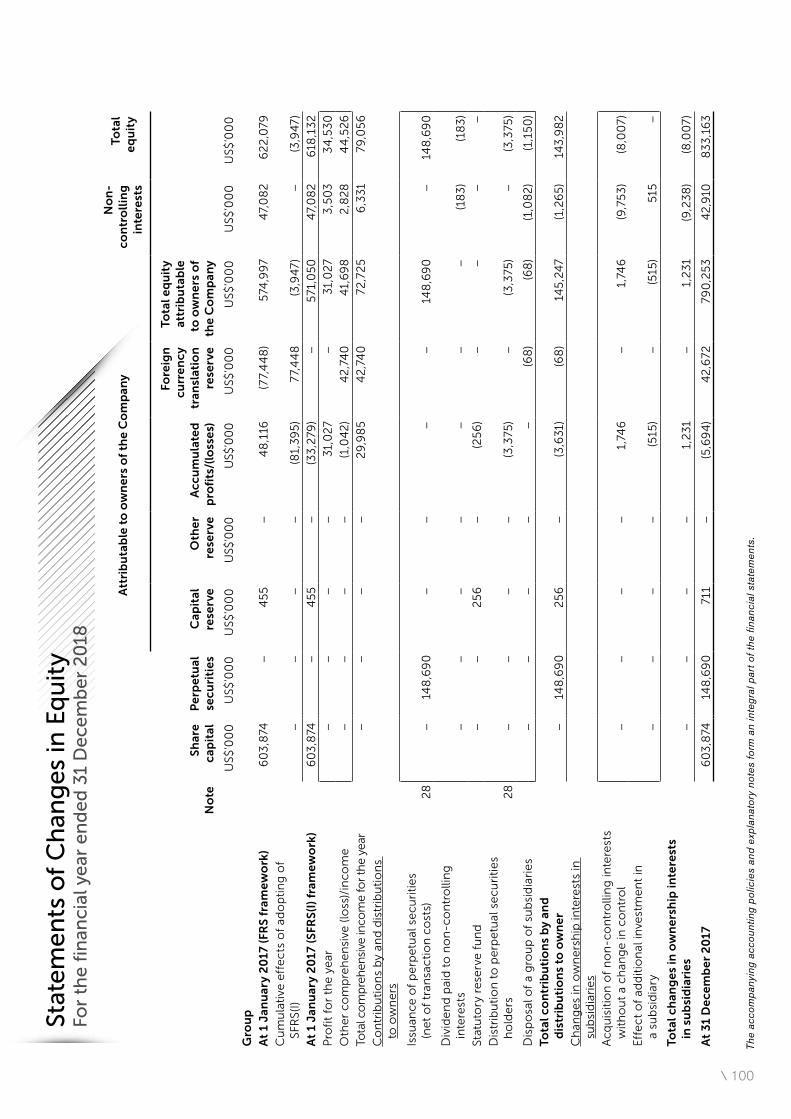
\ 100
Att
rib
uta
ble
to
ow
ne
rs o
f th
e C
om
pan
yN
on
-co
ntr
oll
ing
in
tere
sts
Tota
le
qu
ity
No
teS
har
ec
apit
alP
erp
etu
al
secu
riti
es
Cap
ital
re
serv
eO
the
r re
serv
eA
ccu
mu
late
d
pro
fits
/(lo
sse
s)
Fore
ign
cu
rre
nc
y tr
ansl
atio
n
rese
rve
Tota
l eq
uit
y at
trib
uta
ble
to
ow
ne
rs o
f th
e C
om
pan
y
US$
’00
0U
S$’0
00
US$
’00
0U
S$’0
00
US$
’00
0U
S$’0
00
US$
’00
0U
S$’0
00
US$
’00
0
Gro
up
At
1 Ja
nu
ary
20
17 (F
RS
fram
ew
ork
) 6
03
,874
–4
55
–4
8,1
16(7
7,4
48
)5
74,9
97
47,
08
26
22
,079
Cu
mu
lati
ve e
ffe
cts
of
ado
pti
ng
of
SFR
S(I)
––
––
(81,
39
5)
77,
44
8(3
,94
7)
–(3
,94
7)
At
1 Ja
nu
ary
20
17 (S
FRS
(I) f
ram
ew
ork
)6
03
,874
–4
55
–(3
3,2
79)
–5
71,0
50
47,
08
26
18,1
32
Pro
fit
for
the
ye
ar–
––
–3
1,0
27
–3
1,0
27
3,5
03
34
,53
0
Oth
er
com
pre
he
nsi
ve (
loss
)/in
com
e–
––
–(1
,04
2)
42
,74
04
1,6
98
2,8
28
44
,52
6
Tota
l co
mp
reh
ensi
ve in
com
e fo
r th
e ye
ar–
––
–2
9,9
85
42
,74
072
,72
56
,33
179
,05
6
Co
ntr
ibu
tio
ns
by
and
dis
trib
uti
on
s
to o
wn
ers
Issu
ance
of
pe
rpe
tual
se
curi
tie
s
(ne
t o
f tr
ansa
cti
on
co
sts)
28
–14
8,6
90
––
––
148
,69
0–
148
,69
0
Div
ide
nd
pai
d t
o n
on
-co
ntr
olli
ng
in
tere
sts
––
––
––
–(1
83
)(1
83
)
Stat
uto
ry r
ese
rve
fu
nd
––
25
6–
(25
6)
––
––
Dis
trib
uti
on
to
pe
rpe
tual
se
curi
tie
s h
old
ers
28
––
––
(3,3
75)
–(3
,375
)–
(3,3
75)
Dis
po
sal o
f a
gro
up
of
sub
sid
iari
es
––
––
–(6
8)
(68
)(1
,08
2)
(1,1
50
)
Tota
l co
ntr
ibu
tio
ns
by
and
d
istr
ibu
tio
ns
to o
wn
er
–14
8,6
90
25
6–
(3,6
31)
(68
)14
5,2
47
(1,2
65
)14
3,9
82
Ch
ang
es
in o
wn
ers
hip
inte
rest
s in
su
bsi
dia
rie
s
Acq
uis
itio
n o
f n
on
-co
ntr
olli
ng
inte
rest
s w
ith
ou
t a
chan
ge
in c
on
tro
l–
––
–1,
746
–1,
746
(9,7
53
)(8
,00
7)
Eff
ec
t o
f ad
dit
ion
al in
vest
me
nt
in
a su
bsi
dia
ry–
––
–(5
15)
–(5
15)
515
–
Tota
l ch
ang
es
in o
wn
ers
hip
inte
rest
s in
su
bsi
dia
rie
s–
––
–1,
23
1–
1,2
31
(9,2
38
)(8
,00
7)
At
31
De
cem
be
r 2
017
60
3,8
7414
8,6
90
711
–(5
,69
4)
42
,672
790
,25
34
2,9
108
33
,16
3
The
acco
mpa
nyin
g ac
coun
ting
polic
ies
and
expl
anat
ory
note
s fo
rm a
n in
tegr
al p
art o
f the
fina
ncia
l sta
tem
ents
.
Stat
em
en
ts o
f C
han
ges
in E
qu
ity
For
the
fin
anci
al y
ear
en
de
d 3
1 D
ece
mb
er
20
18
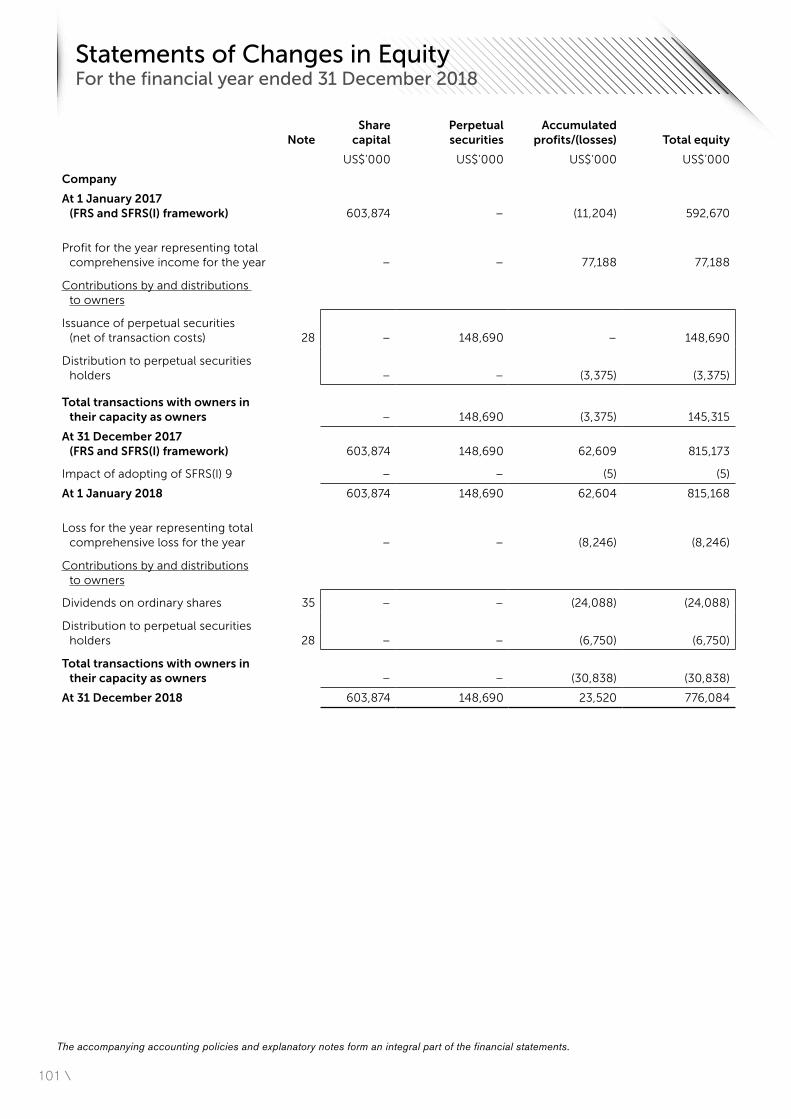
101 \
NoteShare
capitalPerpetual securities
Accumulated profits/(losses) Total equity
US$’000 US$’000 US$’000 US$’000
Company
At 1 January 2017 (FRS and SFRS(I) framework) 603,874 – (11,204) 592,670
Profit for the year representing total comprehensive income for the year – – 77,188 77,188
Contributions by and distributions to owners
Issuance of perpetual securities (net of transaction costs) 28 – 148,690 – 148,690
Distribution to perpetual securities holders – – (3,375) (3,375)
Total transactions with owners in their capacity as owners – 148,690 (3,375) 145,315
At 31 December 2017 (FRS and SFRS(I) framework) 603,874 148,690 62,609 815,173
Impact of adopting of SFRS(I) 9 – – (5) (5)
At 1 January 2018 603,874 148,690 62,604 815,168
Loss for the year representing total comprehensive loss for the year – – (8,246) (8,246)
Contributions by and distributions to owners
Dividends on ordinary shares 35 – – (24,088) (24,088)
Distribution to perpetual securities holders 28 – – (6,750) (6,750)
Total transactions with owners in their capacity as owners – – (30,838) (30,838)
At 31 December 2018 603,874 148,690 23,520 776,084
The accompanying accounting policies and explanatory notes form an integral part of the financial statements.
Statements of Changes in Equity For the financial year ended 31 December 2018
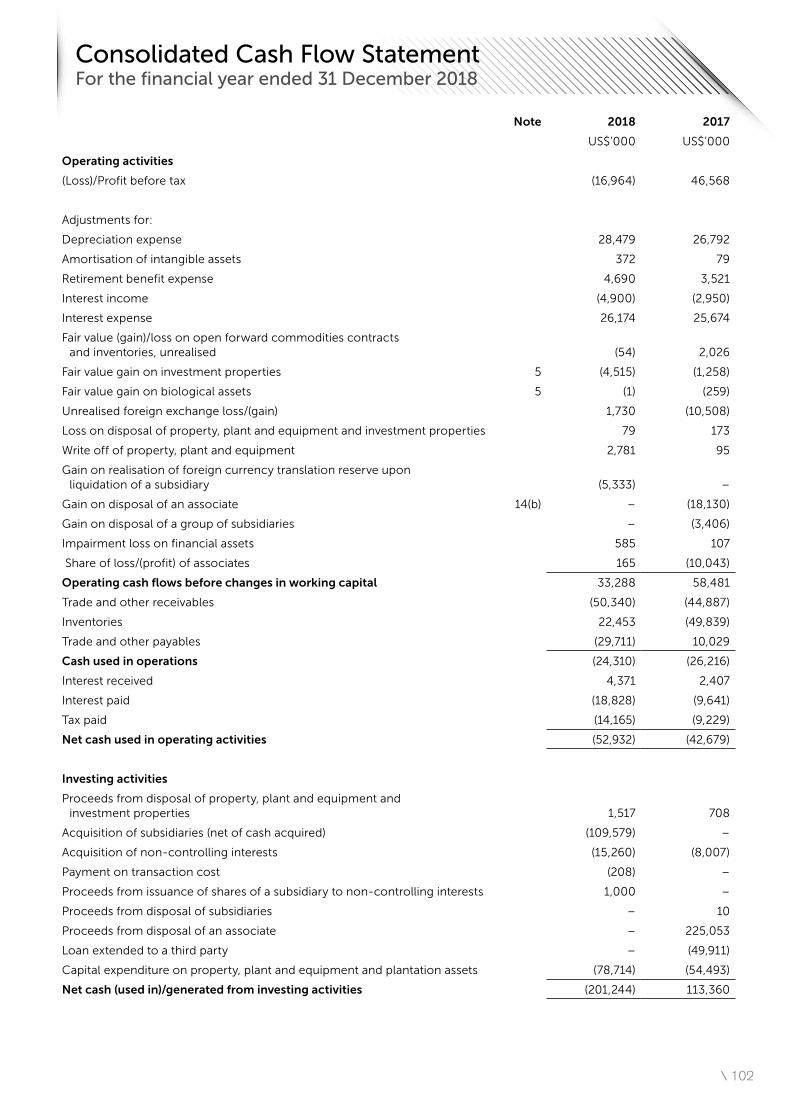
\ 102
Note 2018 2017
US$’000 US$’000
Operating activities
(Loss)/Profit before tax (16,964) 46,568
Adjustments for:
Depreciation expense 28,479 26,792
Amortisation of intangible assets 372 79
Retirement benefit expense 4,690 3,521
Interest income (4,900) (2,950)
Interest expense 26,174 25,674
Fair value (gain)/loss on open forward commodities contracts and inventories, unrealised (54) 2,026
Fair value gain on investment properties 5 (4,515) (1,258)
Fair value gain on biological assets 5 (1) (259)
Unrealised foreign exchange loss/(gain) 1,730 (10,508)
Loss on disposal of property, plant and equipment and investment properties 79 173
Write off of property, plant and equipment 2,781 95
Gain on realisation of foreign currency translation reserve upon liquidation of a subsidiary (5,333) –
Gain on disposal of an associate 14(b) – (18,130)
Gain on disposal of a group of subsidiaries – (3,406)
Impairment loss on financial assets 585 107
Share of loss/(profit) of associates 165 (10,043)
Operating cash flows before changes in working capital 33,288 58,481
Trade and other receivables (50,340) (44,887)
Inventories 22,453 (49,839)
Trade and other payables (29,711) 10,029
Cash used in operations (24,310) (26,216)
Interest received 4,371 2,407
Interest paid (18,828) (9,641)
Tax paid (14,165) (9,229)
Net cash used in operating activities (52,932) (42,679)
Investing activities
Proceeds from disposal of property, plant and equipment and investment properties 1,517 708
Acquisition of subsidiaries (net of cash acquired) (109,579) –
Acquisition of non-controlling interests (15,260) (8,007)
Payment on transaction cost (208) –
Proceeds from issuance of shares of a subsidiary to non-controlling interests 1,000 –
Proceeds from disposal of subsidiaries – 10
Proceeds from disposal of an associate – 225,053
Loan extended to a third party – (49,911)
Capital expenditure on property, plant and equipment and plantation assets (78,714) (54,493)
Net cash (used in)/generated from investing activities (201,244) 113,360
Consolidated Cash Flow Statement For the financial year ended 31 December 2018
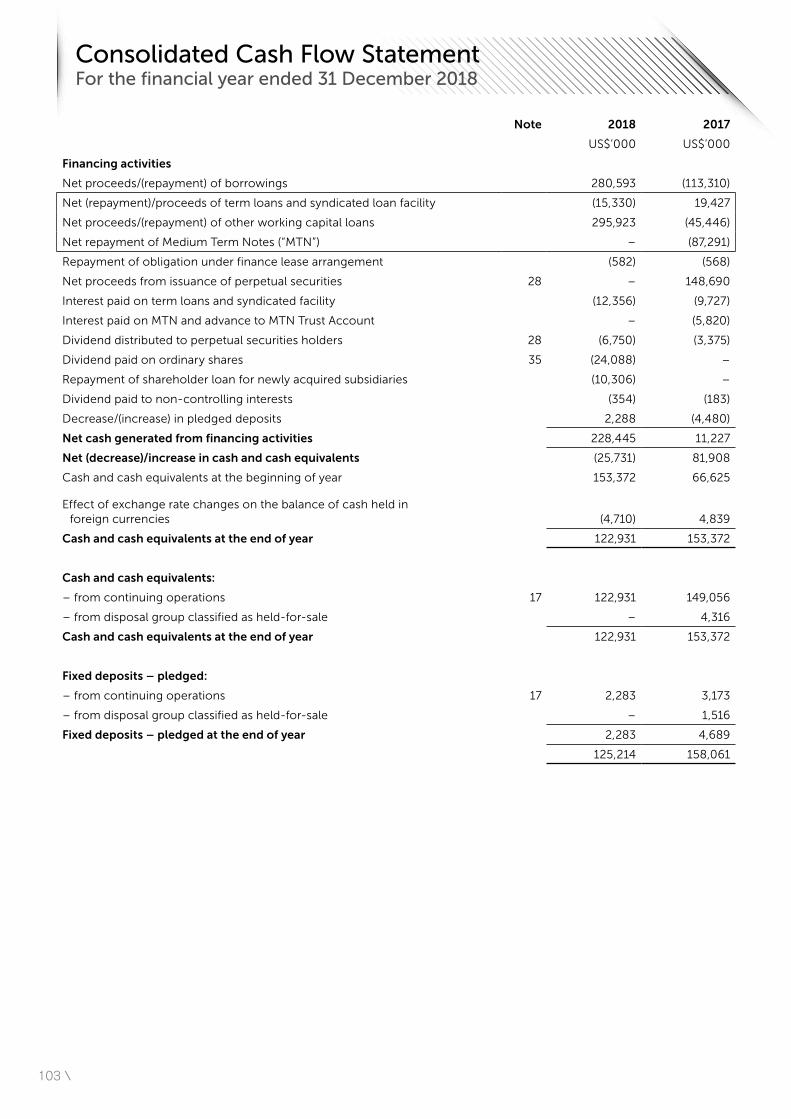
103 \
Note 2018 2017
US$’000 US$’000
Financing activities
Net proceeds/(repayment) of borrowings 280,593 (113,310)
Net (repayment)/proceeds of term loans and syndicated loan facility (15,330) 19,427
Net proceeds/(repayment) of other working capital loans 295,923 (45,446)
Net repayment of Medium Term Notes (“MTN”) – (87,291)
Repayment of obligation under finance lease arrangement (582) (568)
Net proceeds from issuance of perpetual securities 28 – 148,690
Interest paid on term loans and syndicated facility (12,356) (9,727)
Interest paid on MTN and advance to MTN Trust Account – (5,820)
Dividend distributed to perpetual securities holders 28 (6,750) (3,375)
Dividend paid on ordinary shares 35 (24,088) –
Repayment of shareholder loan for newly acquired subsidiaries (10,306) –
Dividend paid to non-controlling interests (354) (183)
Decrease/(increase) in pledged deposits 2,288 (4,480)
Net cash generated from financing activities 228,445 11,227
Net (decrease)/increase in cash and cash equivalents (25,731) 81,908
Cash and cash equivalents at the beginning of year 153,372 66,625
Effect of exchange rate changes on the balance of cash held in foreign currencies (4,710) 4,839
Cash and cash equivalents at the end of year 122,931 153,372
Cash and cash equivalents:
– from continuing operations 17 122,931 149,056
– from disposal group classified as held-for-sale – 4,316
Cash and cash equivalents at the end of year 122,931 153,372
Fixed deposits – pledged:
– from continuing operations 17 2,283 3,173
– from disposal group classified as held-for-sale – 1,516
Fixed deposits – pledged at the end of year 2,283 4,689
125,214 158,061
Consolidated Cash Flow Statement For the financial year ended 31 December 2018
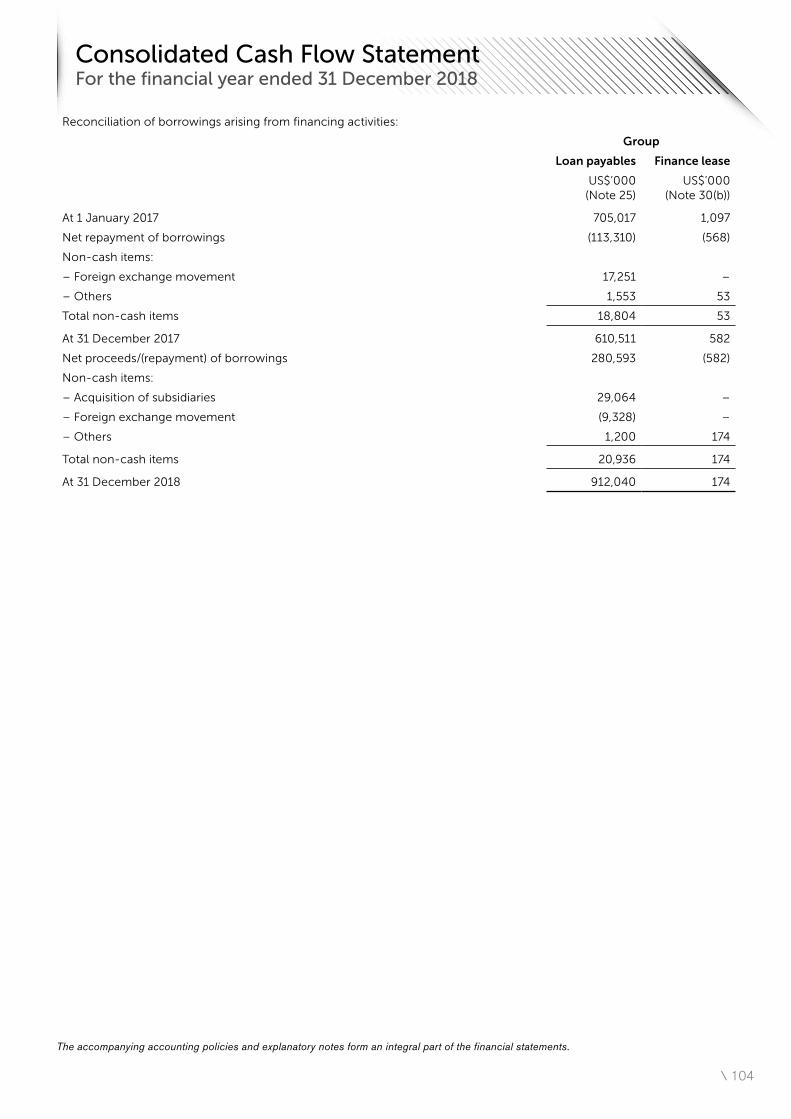
\ 104
Reconciliation of borrowings arising from financing activities:
Group
Loan payables Finance lease
US$’000 (Note 25)
US$’000 (Note 30(b))
At 1 January 2017 705,017 1,097
Net repayment of borrowings (113,310) (568)
Non-cash items:
– Foreign exchange movement 17,251 –
– Others 1,553 53
Total non-cash items 18,804 53
At 31 December 2017 610,511 582
Net proceeds/(repayment) of borrowings 280,593 (582)
Non-cash items:
– Acquisition of subsidiaries 29,064 –
– Foreign exchange movement (9,328) –
– Others 1,200 174
Total non-cash items 20,936 174
At 31 December 2018 912,040 174
The accompanying accounting policies and explanatory notes form an integral part of the financial statements.
Consolidated Cash Flow Statement For the financial year ended 31 December 2018
105 \
1. Corporate information
Halcyon Agri Corporation Limited (the “Company”) is a public limited liability company incorporated and domiciled in Singapore and is listed on the Main Board of the Singapore Exchange Securities Trading Limited.
The registered office of the Company is located at 250 North Bridge Road, #12-01 Raffles City Tower, Singapore 179101.
As at 31 December 2018, the Company is 54.99% owned by Sinochem International (Overseas) Pte. Ltd, a company incorporated and domiciled in Singapore. The penultimate holding company is Sinochem International Corporation Co., Ltd. (“SIC”), which is domiciled in the People’s Republic of China and listed on the Shanghai Stock Exchange. SIC is 55.76% indirectly owned by 中国中化集团公司 (also known as Sinochem Group), a state-owned enterprise of the People’s Republic of China.
The principal activity of the Company is investment holding. The principal activities of the subsidiaries and associates are disclosed in Note 14(a) and Note 14(b) to the financial statements respectively.
2. Summary of significant accounting policies
2.1 (a) Basis of preparation
The consolidated financial statements of the Group and the statement of financial position and statement of changes in equity of the Company have been prepared in accordance with Singapore Financial Reporting Standards (International) (“SFRS(I)”).
For all periods up to and including the year ended 31 December 2017, the Group prepared its financial statements in accordance with Financial Reporting Standards in Singapore (“FRS”). These financial statements for the year ended 31 December 2018 are the first the Group has prepared in accordance with SFRS(I). Refer to Note 2.1 (b) for information on how the Group adopted SFRS(I).
The financial statements have been prepared on the historical cost basis except as disclosed in the accounting policies below.
The financial statements are presented in United States Dollar (“USD” or “US$”) and all values in the tables are rounded to the nearest thousand (“US$’000”) unless otherwise indicated.
(b) First-time adoption of Singapore Financial Reporting Standards (International) (“SFRS(I)”)
These financial statements for the year ended 31 December 2018 are the first the Group and the Company have prepared in accordance with SFRS(I). Accordingly, the Group and the Company have prepared financial statements that comply with SFRS(I) applicable as at 31 December 2018, together with the comparative period data for the year ended 31 December 2017, as described in the summary of significant accounting policies. On preparing the financial statements, the Group’s and the Company’s opening statement of financial positions were prepared as at 1 January 2017, the Group and the Company’s date of transition to SFRS(I).
The principal adjustments made by the Group on adoption of SFRS(I) and the adoption of the new standards that are effective on 1 January 2018 are disclosed below.
Deferred tax on unremitted foreign sourced income
With the adoption of SFRS(I) by the Group from 1 January 2018 onwards, the Group will no longer be able to apply the Recommended Accounting Practice 8 exemption of not providing deferred tax liability for unremitted foreign sourced income which it has no intention of remitting into Singapore. As a result, the Group recognised deferred tax liabilities of US$4,668,000 and deferred tax expense of US$720,000 with a corresponding decrease in the opening retained earnings of US$3,947,000 as of 1 January 2017.
Exemptions applied on adoption of SFRS(I)
SFRS(I) allows first-time adopters exemptions from the retrospective application of certain requirements under SFRS(I). The Group has applied the following exemptions:
i) Exemption for cumulative translation differences
Cumulative currency translation differences for foreign operations are deemed to be zero at the date of transition, 1 January 2017. As a result, an amount of US$77,448,000 of foreign currency translation reserve was adjusted against the opening retained earnings as at 1 January 2017.
ii) The comparative information do not comply with SFRS(I) 9 Financial Instruments: Disclosures to the extent the disclosures relate to item within the scope of SFRS(I) 9.
Notes to the Financial Statements For the financial year ended 31 December 2018

\ 106
2. Summary of significant accounting policies (cont’d)
2.1 (b) First-time adoption of Singapore Financial Reporting Standards (International) (“SFRS(I)”) (cont’d)
New accounting standards effective on 1 January 2018
The accounting policies adopted are consistent with those previously applied under FRS except that in the current financial year, the Group has adopted all the SFRS(I) which are effective for annual financial periods beginning on or after 1 January 2018. Except for the impact arising from the matters described below, the adoption of these standards did not have any material effect on the financial performance or position of the Group and the Company.
iii) SFRS(I) 9 Financial instruments
On 1 January 2018, the Group adopted SFRS(I) 9 Financial instruments, which is effective for annual periods beginning on or after 1 January 2018.
The changes arising from adoption of SFRS(I) 9 have been applied retrospectively. The Group has elected to apply the exemption in SFRS(I) 1 and has not restated comparative information in the year of initial application. The impact arising from SFRS(I) 9 adoption was included in the opening retained earnings at the date of initial application, 1 January 2018. The comparative information was prepared in accordance with the requirement of FRS39.
Impairment
SFRS(I) 9 requires the Group to record expected credit losses on all of its financial assets measured at amortised cost or fair value through other comprehensive income (“FVOCI”). The Group previously recorded impairment based on the incurred loss model where there is objective evidence that a financial asset is impaired.
Under adoption of SFRS(I) 9, the Group recognised additional impairment on the Group’s trade receivable of US$337,000 and other receivables of US$227,000. The additional impairment recognised arising from adoption of SFRS(I) 9 above resulted in a corresponding decrease in retained earnings of US$564,000 as at 1 January 2018.
The Company recognised an additional impairment on the Company’s amounts due from subsidiaries of US$4,000 and other receivables of US$1,000 upon adoption of SFRS(I) 9 as at 1 January 2018.
The reconciliation for loss allowances for the Group are as follows:
Group
Trade receivables Other receivables Total
US$’000 US$’000 US$’000
Opening loss allowances as at 1 January 2018 911 – 911
Amount restated through opening retained earnings 337 227 564
Adjusted loss allowances (Note 18(c)/19) 1,248 227 1,475
The reconciliation for loss allowances for the Company are as follows:
Company
Amounts due from subsidiaries Other receivables Total
US$’000 US$’000 US$’000
Opening loss allowances as at 1 January 2018 – – –
Amount restated through opening retained earnings 4 1 5
Adjusted loss allowances (Note 19) 4 1 5
Refer to Note 37 for reconciliation of the impact arising from first-time adoption of SFRS(I) including application of the new accounting standards on 1 January 2017 to the consolidated statement of financial position and consolidated income statement of the Group.
Notes to the Financial Statements For the financial year ended 31 December 2018
107 \
2. Summary of significant accounting policies (cont’d)
2.1 (b) First-time adoption of Singapore Financial Reporting Standards (International) (“SFRS(I)”) (cont’d)
iv) SFRS(I) 15 Revenue from Contracts with Customers
SFRS(I) 15 established a five-step model to account for revenue arising from contracts with customers. Under SFRS(I) 15, revenue is recognised at an amount that reflects the consideration which an entity expects to be entitled in exchange for transferring goods or services to a customer.
The Group has assessed the impact of adopting SFRS(I) 15 and concluded the financial impact is not material to the Group.
2.2 Standards issued but not yet effective
The Group has not adopted the following standards applicable to the Group that have been issued but not yet effective:
DescriptionEffective for annual periods
beginning on or after
SFRS(I) 16 Leases 1 January 2019
SFRS(I) INT 23 Uncertainty over Income tax Treatments 1 January 2019
Amendments to SFRS(I) 9 Prepayment Features with Negative Compensation 1 January 2019
Amendments to SFRS(I) 1-28 Long-term Interests in Associates and Joint Ventures 1 January 2019
Annual Improvements to SFRS(I)s 2015 – 2017 Cycle 1 January 2019
Amendments to SFRS(I) 10 and SFRS(I) 1 -28 Sale or Contribution of Assets between an Investor and its Associate or Joint Venture
Date to be determined
Except for SFRS(I) 16, the directors expect that the adoption of the other standards above will have no material impact on the financial statements in the period of initial application. The nature of the impending changes in accounting policy on adoption of SFRS(I) 16 are described below.
SFRS(I) 16 Leases
SFRS(I) 16 requires lessees to recognise most leases on statement of financial positions to reflect the rights to use the leased assets and the associated obligations for lease payments as well as the corresponding interest expense and depreciation charges. The standard includes two recognition exemptions for lessees – leases of ‘low value’ assets and short term leases. The new standard is effective for annual periods beginning on or after 1 January 2019. At commencement date of a lease, a lessee will recognise a liability to make a lease payments (i.e. the lease liability) and an asset representing the right to use the underlying asset during the lease term (i.e. the right-of-use asset). Lessees will be required to separately recognise the interest expense on the lease liability and the depreciation expense on the right-of-use asset.
The Group plans to adopt the new standard on the required effective date by applying SFRS(I) 16 retrospectively with the right-of-use assets is recognised at the date of initial application (1 January 2019) at an amount equal to the lease liability, using the Group’s current incremental borrowing rates.
In addition, the Group plans to elect the following practical expedients:
(i) to apply the exemption not to recognise right-of-use asset and lease liabilities to leases for which the lease term ends within 12 months as of 1 January 2019
(ii) to apply single discount rate to a portfolio of leases with reasonably similar characteristics
The Group has performed a preliminary impact assessment based on currently available information, and the assessment may be subject to changes arising from the ongoing analysis until the Group adopts SFRS(I) 16 in 2019.
On the adoption of SFRS(I) 16, the Group expects to recognise right-of-use assets of approximately US$11,000,000 and lease liabilities of approximately US$11,000,000 for its leases previously classified as operating leases.
Notes to the Financial Statements For the financial year ended 31 December 2018
\ 108
2. Summary of significant accounting policies (cont’d)
2.3 Basis of consolidation and business combinations
(A) Basis of consolidation
The consolidated financial statements comprise the financial statements of the Company and its subsidiaries as at the end of the reporting period. The financial statements of the subsidiaries used in the preparation of the consolidated financial statements are prepared for the same reporting date as the Company. Consistent accounting policies are applied to like transactions and events in similar circumstances.
All intra-group balances, income and expenses and unrealised gains and losses resulting from intra-group transactions and dividends are eliminated in full.
Subsidiaries are consolidated from the date of acquisition, being the date on which the Group obtains control, and continue to be consolidated until the date that such control ceases.
Losses within a subsidiary are attributed to the non-controlling interest even if that results in a deficit balance.
A change in the ownership interest of a subsidiary, without a loss of control, is accounted for as an equity transaction. If the Group loses control over a subsidiary, it:
• de-recognises the assets (including goodwill) and liabilities of the subsidiary at their carrying amounts at the date when control is lost;
• de-recognises the carrying amount of any non-controlling interest;
• de-recognises the cumulative translation differences recorded in equity;
• recognises the fair value of the consideration received;
• recognises the fair value of any investment retained;
• recognises any surplus or deficit in profit or loss;
• re-classifies the Group’s share of components previously recognised in other comprehensive income to profit or loss or retained earnings, as appropriate.
(B) Business combinations and goodwill
Where a business combination involves entities or businesses under common control, it is outside the scope of SFRS(I) 3 and may be accounted for using the pooling of interest method or the acquisition method. Acquisition method is applied when the transaction has substance from the perspective of the Group in accordance with SFRS(I) 3.
Business combinations are accounted for by applying the acquisition method. Identifiable assets acquired and liabilities assumed in a business combination are measured initially at their fair values at the acquisition date. Acquisition-related costs are recognised as expenses in the periods in which the costs are incurred and the services are received.
Any contingent consideration to be transferred by the acquirer will be recognised at fair value at the acquisition date. Subsequent changes to the fair value of the contingent consideration which is deemed to be an asset or liability, will be recognised in accordance with SFRS(I) 1-39 either in profit or loss or as a change to other comprehensive income. If the contingent consideration is classified as equity, it is not remeasured until it is finally settled within equity.
The Group elects for each individual business combination, whether non-controlling interest in the acquiree (if any), that are present ownership interests and entitle their holders to a proportionate share of net assets in the event of liquidation, is recognised on the acquisition date at fair value, or at the non-controlling interest’s proportionate share of the acquiree’s identifiable net assets. Other components of non-controlling interests are measured at their acquisition date fair value, unless another measurement basis is required by another SFRS(I).
Any excess of the sum of the fair value of the consideration transferred in the business combination, the amount of non-controlling interest in the acquiree (if any), and the fair value of the Group’s previously held equity interest in the acquiree (if any), over the net fair value of the acquiree’s identifiable assets and liabilities is recorded as goodwill. The accounting policy for goodwill is set out in Note 2.10(a). In instances where the latter amount exceeds the former, the excess is recognised as gain on bargain purchase in profit or loss on the acquisition date.
Goodwill is initially measured at cost. Following initial recognition, goodwill is measured at cost less any impairment losses.
For the purpose of impairment testing, goodwill acquired in a business combination is, from the acquisition date, allocated to the Group’s cash-generating units that are expected to benefit from the synergies of the combination, irrespective of whether other assets or liabilities of the acquiree are assigned to those units.
The cash-generating unit to which goodwill have been allocated is tested for impairment annually and whenever there is an indication that the cash-generating unit may be impaired. Impairment is determined for goodwill by assessing the recoverable amount of each cash-generating unit (or group of cash-generating units) to which the goodwill relates.
Notes to the Financial Statements For the financial year ended 31 December 2018
109 \
2. Summary of significant accounting policies (cont’d)
2.4 Transactions with non-controlling interests
Non-controlling interests represents the equity in subsidiaries not attributable, directly or indirectly, to owners of the Company.
Changes in the Company’s ownership interest in a subsidiary that do not result in a loss of control are accounted for as equity transactions. In such circumstances, the carrying amounts of the controlling and non-controlling interests are adjusted to reflect the changes in their relative interests in the subsidiary. Any difference between the amount by which the non-controlling interest is adjusted and the fair value of the consideration paid or received is recognised directly in equity and attributed to owners of the Company.
2.5 Subsidiaries
A subsidiary is an investee that is controlled by the Group. The Group controls an investee when it is exposed, or has rights, to variable returns from its involvement with the investee and has the ability to affect those returns through its power over the investee.
In the Company’s separate financial statements, investments in subsidiaries are accounted for at cost less impairment losses.
2.6 Associates
An associate is an entity over which the Group has the power to participate in the financial and operating policy decisions of the investee but does not have control or joint control of those policies.
The Group account for its investments in associates using the equity method from the date on which it becomes an associate. On acquisition of the investment, any excess of the cost of the investment over the Group’s share of the net fair value of the investee’s identifiable assets and liabilities is accounted as goodwill and is included in the carrying amount of the investment. Any excess of the Group’s share of the net fair value of the investee’s identifiable assets and liabilities over the cost of the investment is included as income in the determination of the entity’s share of the associate’s profit or loss in the period in which the investment is acquired.
Under the equity method, the investment in associates are carried in the statement of financial position at cost plus post-acquisition changes in the Group’s share of net assets of the associates. The profit or loss reflects the share of results of the operations of the associate. Distributions received from associates reduce the carrying amount of the investment. Where there has been a change recognised in other comprehensive income by the associates, the Group recognises its share of such changes in other comprehensive income. Unrealised gains and losses resulting from transactions between the Group and associate are eliminated to the extent of the interest in the associates.
When the Group’s share of losses in an associate equals or exceeds its interest in the associate, the Group does not recognise further losses, unless it has incurred obligations or made payments on behalf of the associate.
After application of the equity method, the Group determines whether it is necessary to recognise an additional impairment loss on the Group’s investment in associate. The Group determines at the end of each reporting period whether there is any objective evidence that the investment in the associate is impaired. If this is the case, the Group calculates the amount of impairment as the difference between the recoverable amount of the associate and its carrying value and recognises the amount in profit or loss.
The financial statements of the associates are prepared as the same reporting date as the Company. Where necessary, adjustments are made to bring the accounting policies in line with those of the Group.
2.7 Foreign currency
The financial statements are presented in United States Dollar (“USD”), which is also the Company’s functional currency. Each entity in the Group determines its own functional currency and items included in the financial statements of each entity are measured using that functional currency.
(a) Transactions and balances
Transactions in foreign currencies are measured in the respective functional currencies of the Company and its subsidiaries and are recorded on initial recognition in the functional currencies at exchange rates approximating those ruling at the transaction dates. Monetary assets and liabilities denominated in foreign currencies are translated at the rate of exchange ruling as at the statement of financial position date. Non-monetary items that are measured in terms of historical cost in a foreign currency are translated using the exchange rates as at the dates of the initial transactions.
Exchange differences arising on the settlement of monetary items or on translating monetary items at the end of the reporting period are recognised in profit or loss.
Notes to the Financial Statements For the financial year ended 31 December 2018
\ 110
2. Summary of significant accounting policies (cont’d)
2.7 Foreign currency (cont’d)
(b) Consolidated financial statements
For consolidation purpose, the assets and liabilities of foreign operations are translated into USD at the rate of exchange ruling at the statement of financial position date and their profit or loss are translated at the exchange rates prevailing at the date of the transactions. The exchange differences arising on the translation are recognised in other comprehensive income. On disposal of a foreign operation, the component of other comprehensive income relating to that particular foreign operation is recognised in profit or loss.
2.8 Property, plant and equipment
All items of property, plant and equipment are initially recorded at cost. Subsequent to recognition, property, plant and equipment are measured at cost less accumulated depreciation and any accumulated impairment losses. The cost includes the cost of replacing part of the property, plant and equipment and borrowing costs that are directly attributable to the acquisition, construction or production of a qualifying property, plant and equipment. The accounting policy for borrowing costs is set out in Note 2.18. The cost of an item of property, plant and equipment is recognised as an asset if, and only if, it is probable that future economic benefits associated with the item will flow to the Group and the cost of the item can be measured reliably.
When significant parts of property, plant and equipment are required to be replaced in intervals, the Group recognises such parts as individual assets with specific useful lives and depreciation, respectively. Likewise, when a major inspection is performed, its cost is recognised in the carrying amount of the plant and equipment as a replacement if the recognition criteria are satisfied. All other repair and maintenance costs are recognised in profit or loss as incurred.
Depreciation is computed on a straight-line basis over the estimated useful lives of the assets as follows:
Leasehold improvements and renovation – 10 years Office equipment – 2 years Computers and software – 1 to 5 years Leasehold buildings – 20 years Plant and machinery – 10 years Vehicles – 4 to 10 years Leasehold land – 20 to 95 years
Freehold land is not depreciated.
Assets under construction included in property, plant and equipment are not depreciated as these assets are not yet available for use.
Plantation establishment costs, consisting of costs directly incurred during the period of plantation development, are not depreciated. The establishment costs will be transferred to plantation assets and will be subject to depreciation upon commencement of rubber tapping activities.
The carrying values of property, plant and equipment are reviewed for impairment when events or changes in circumstances indicate that the carrying value may not be recoverable.
The residual value, useful life and depreciation method are reviewed at each financial year-end, and adjusted prospectively, if appropriate.
An item of property, plant and equipment is derecognised upon disposal or when no future economic benefits are expected from its use or disposal. Any gain or loss on de-recognition of the asset is included in profit or loss in the year the asset is derecognised.
2.9 Investment properties
Investment properties are properties that are owned by the Group that are held to earn rentals or for capital appreciation, or both, rather than for use in the production or supply of goods or services, or for administrative purposes, or in the ordinary course of business. Investment properties comprise completed investment properties and properties that are being constructed or developed for future use as investment properties. Properties held under operating leases are classified as investment properties when the definition of an investment property is met.
Investment properties are initially measured at cost, including transaction costs.
Subsequent to initial recognition, investment properties are measured at fair value. Gains or losses arising from changes in the fair values of investment properties are included in profit or loss in the year in which they arise.
Investment properties are derecognised when either they have been disposed of or when the investment property is permanently withdrawn from use and no future economic benefit is expected from its disposal. Any gains or losses on the retirement or disposal of an investment property are recognised in profit or loss in the year of retirement or disposal.
Notes to the Financial Statements For the financial year ended 31 December 2018
111 \
2. Summary of significant accounting policies (cont’d)
2.10 Intangible assets
(a) Goodwill
Goodwill is initially measured at cost. Following initial recognition, goodwill is measured at cost less any accumulated impairment losses.
For the purpose of impairment testing, goodwill acquired in a business combination is, from the acquisition date, allocated to the Group’s cash-generating units that are expected to benefit from the synergies of the combination, irrespective of whether other assets or liabilities of the acquiree are assigned to those units.
The cash-generating units to which goodwill have been allocated is tested for impairment annually and whenever there is an indication that the cash-generating unit may be impaired. Impairment is determined for goodwill by assessing the recoverable amount of each cash-generating unit (or group of cash-generating units) to which the goodwill relates. Where the recoverable amount of the cash-generating unit is less than the carrying amount, an impairment loss is recognised in profit or loss. Impairment losses recognised for goodwill are not reversed in subsequent periods.
Where goodwill forms part of a cash-generating unit and part of the operation within that cash-generating unit is disposed of, the goodwill associated with the operation disposed of is included in the carrying amount of the operation when determining the gain or loss on disposal of the operation. Goodwill disposed of in this circumstance is measured based on the relative fair values of the operations disposed of and the portion of the cash-generating unit retained.
(b) Other intangible assets
Intangible assets acquired separately are measured initially at cost. The cost of intangible assets acquired in a business combination is their fair value as at the date of acquisition. Following initial acquisition, intangible assets are carried at cost less any accumulated amortisation and any accumulated impairment losses. Internally generated intangible assets, excluding capitalised development costs, are not capitalised and expenditure is reflected in profit or loss in the year in which the expenditure is incurred.
The useful lives of intangible assets are assessed as either finite or indefinite.
Intangible assets with finite useful lives are amortised over the estimated useful lives and assessed for impairment whenever there is an indication that the intangible asset may be impaired. The amortisation period and the amortisation method are reviewed at least at each financial year-end. Changes in the expected useful life or the expected pattern of consumption of future economic benefits embodied in the asset is accounted for by changing the amortisation period or method, as appropriate, and are treated as changes in accounting estimates.
Intangible assets with indefinite useful lives or not yet available for use are tested for impairment annually, or more frequently if the events and circumstances indicate that the carrying value may be impaired either individually or at the cash-generating unit level. Such intangible assets are not amortised. The useful life of an intangible asset with an indefinite useful life is reviewed annually to determine whether the useful life assessment continues to be supportable. If not, the change in useful life from indefinite to finite is made on a prospective basis.
Gains or losses arising from de-recognition of an intangible asset are measured as the difference between the net disposal proceeds and the carrying amount of the asset and are recognised in profit or loss when the asset is derecognised.
(i) Process know-how
The useful life of the process know-how was estimated to be indefinite because based on the current demand for rubber, management believes there is no foreseeable limit to the period over which the process know-how are expected to generate net cash inflows for the Group.
(ii) Customer relationship
Customer relationship acquired was initially recognised at cost and was subsequently carried at cost less accumulated amortization and accumulated impairment losses. These costs are amortised to the income statement using the straight line method over 10 years.
(iii) Computer software
Acquired computer software licences are initially capitalised at cost and was subsequently carried at cost less accumulated amortization and accumulated impairment losses. These costs are amortised to the income statement using the straight line method over 5 years.
Notes to the Financial Statements For the financial year ended 31 December 2018
\ 112
2. Summary of significant accounting policies (cont’d)
2.11 Land use rights
Certain plantation lands in Cameroon were given land use rights by the State of Cameroon in 1996 for a period of 50 years plus 50 years, renewable at a nominal value to the Group. With the Group’s continuing investment in replanting and extension on the plantation land, the Group is of the view that it is not likely that the land use rights will not be renewed at the expiry of its current term. As such, land use rights for those lands are deemed to have a perpetual life and no depreciation has been provided.
2.12 Bearer plants and biological assets
The classification of rubber trees as bearer plant or non-bearer plant depends on the business plan for respective rubber plantations, pertinent facts and circumstances surrounding the trees, plantation and relevant local market or industry considerations. Rubber trees are not considered bearer plant when there is commercial viable plan to sell the rubber tree as lumber at the end of the rubber production life to an established market.
Bearer plants consist of rubber trees in African plantations and the oil palm trees. Cultivation of seedlings is stated at cost. The accumulated cost will be classified as immature plantations at the time of planting. Mature plantations are stated at cost less accumulated depreciation and impairment. The Group has reassessed its depreciation methodology for plantation assets as its significant investment in bearer plants over the last few years is starting to reach maturity. The Group concluded that depreciating the mature plantations by the expected yield pattern of the bearer plants over their useful lives, estimated at 30 years, is more reflective of the pattern in which the assets future benefit are expected to be consumed. The carrying value of bearer plants are reviewed for impairment when events or changes in circumstances indicate that the carrying value may not be recoverable. A bearer plant is derecognised upon disposal or when no future economic benefits are expected from its use or disposal. Any gain or loss arising on derecognition of the bearer plant is included in the profit or loss when the bearer plant is derecognised.
Biological assets consist of rubber trees in the Malaysian plantations and produce that grows on oil palm trees in the Malaysian plantations, rubber latex in the African plantation and bud wood nursery. These are measured at fair value less estimate costs to sell. Gains or losses arising on initial recognition of plantations at fair value less estimated costs to sell and from the changes in fair value less estimated costs to sell of plantations at each reporting date are included in profit or loss for the period in which they arise.
2.13 Impairment of non-financial assets
The Group assesses at each reporting date whether there is an indication that an asset may be impaired. If any indication exists, or when an annual impairment testing for an asset is required, the Group makes an estimate of the asset’s recoverable amount.
An asset’s recoverable amount is the higher of an asset’s or cash-generating unit’s fair value less costs of disposal and its value in use and is determined for an individual asset, unless the asset does not generate cash inflows that are largely independent of those from other assets or groups of assets. Where the carrying amount of an asset or cash-generating unit exceeds its recoverable amount, the asset is considered impaired and is written down to its recoverable amount.
The Group bases its impairment calculation on detailed budgets and forecast calculations which are prepared separately for each of the Group’s cash-generating units to which the individual assets are allocated. These budgets and forecast calculations are generally covering a period of five years. For longer periods, a long-term growth rate is calculated and applied to project future cash flows after the fifth year.
Impairment losses of continuing operations are recognised in profit or loss.
For assets excluding goodwill, an assessment is made at each reporting date as to whether there is any indication that previously recognised impairment losses may no longer exist or may have decreased. If such indication exists, the Group estimates the asset’s or cash-generating unit’s recoverable amount. A previously recognised impairment loss is reversed only if there has been a change in the estimates used to determine the asset’s recoverable amount since the last impairment loss was recognised. If that is the case, the carrying amount of the asset is increased to its recoverable amount. That increase cannot exceed the carrying amount that would have been determined, net of depreciation, had no impairment loss been recognised previously.
Notes to the Financial Statements For the financial year ended 31 December 2018
113 \
2. Summary of significant accounting policies (cont’d)
2.14 Financial instruments
(a) Financial assets
Initial recognition and measurement
Financial assets are recognised when, and only when, the Group becomes a party to the contractual provisions of the financial instrument. The Group determines the classification of its financial assets at initial recognition.
When financial assets are recognised initially, they are measured at fair value, plus, in the case of financial assets not at fair value through profit or loss, directly attributable transaction costs. Transaction costs of financial assets carried at fair value through profit or loss are expensed in profit or loss.
Trade receivables are measured at the amount of consideration to which the Group expects to be entitled in exchange for transferring promised goods or services to a customer, excluding amounts collected on behalf of third party, if the trade receivables do not contain a significant financing component at initial recognition.
Subsequent measurement
Debt instruments
(i) Amortised cost
Financial assets that are held for collection of contractual cash flows where those cash flows represent solely payments of principal and interest are measured at amortised cost. Financial assets are measured at amortised cost using the effective interest method, less impairment. Gains and losses are recognised in profit or loss when the assets are derecognised or impaired, and through the amortisation process.
(ii) Fair value through other comprehensive income (FVOCI)
Financial assets that are held for collection of contractual cash flows and for selling the financial assets, where the assets’ cash flows represent solely payments of principal and interest, are measured at FVOCI. Financial assets measured at FVOCI are subsequently measured at fair value. Any gains or losses from changes in fair value of the financial assets are recognised in other comprehensive income, except for impairment losses, foreign exchange gains and losses and interest calculated using the effective interest method are recognised in profit or loss. The cumulative gain or loss previously recognised in other comprehensive income is reclassified from equity to profit or loss as a reclassification adjustment when the financial asset is de-recognised.
(iii) Fair value through profit or loss
Assets that do not meet the criteria for amortised cost or FVOCI are measured at fair value through profit or loss. A gain or loss on a debt instruments that is subsequently measured at fair value through profit or loss and is not part of a hedging relationship is recognised in profit or loss in the period in which it arises.
Derivatives
Derivatives are initially recognised at fair value on the date of derivative contract is entered into and are subsequently remeasured to their fair value at the end of each reporting period. Changes in fair value of derivatives are recognised in profit or loss.
De-recognition
A financial asset is derecognised where the contractual right to receive cash flows from the asset has expired. On de-recognition of a financial asset in its entirety, the difference between the carrying amount and the sum of the consideration received and any cumulative gain or loss that had been recognised in other comprehensive income is recognised in profit or loss.
(b) Financial liabilities
Initial recognition and measurement
Financial liabilities are recognised when, and only when, the Group becomes a party to the contractual provisions of the financial instrument. The Group determines the classification of its financial liabilities at initial recognition.
All financial liabilities are recognised initially at fair value plus in the case of financial liabilities not at fair value through profit or loss, directly attributable transaction costs.
Subsequent measurement
After initial recognition, financial liabilities that are not carried at fair value through profit or loss are subsequently measured at amortised cost using the effective interest method. Gains and losses are recognised in profit or loss when the liabilities are derecognised, and through the amortisation process.
Notes to the Financial Statements For the financial year ended 31 December 2018
\ 114
2. Summary of significant accounting policies (cont’d)
2.14 Financial instruments (cont’d)
(b) Financial liabilities (cont’d) De-recognition
A financial liability is de-recognised when the obligation under the liability is discharged or cancelled or expired. When an existing financial liability is replaced by another from the same lender on substantially different terms, or the terms of an existing liability are substantially modified, such an exchange or modification is treated as a de-recognition of the original liability and the recognition of a new liability, and the difference in the respective carrying amounts is recognised in profit or loss.
(c) Gain/loss on commodity contracts
Commodity contracts to buy and sell natural rubber commodities can be subject to net settlement if market conditions are favourable. Such commodity contracts and derivative financial instruments are marked to market at market rates prevailing at the end of the reporting period. Unrealised gains or losses are taken to profit or loss. Market value is generally based on listed market prices. If listed market prices are not available, market value is determined based on relevant factors, including trade price quotations, time value and volatility factors underlying the commodities and price quotations for similar commodities traded in different markets, including markets located in different geographical areas.
2.15 Impairment of financial assets
The Group recognises an allowance for expected credit losses (“ECLs”) for all debt instruments not held at fair value through profit or loss. ECLs are based on the difference between the contractual cash flows due in accordance with the contract and all the cash flows that the Group expects to receive, discounted at an approximation of the original effective interest rate. The expected cash flows will include cash flows from the sale of collateral held or other credit enhancements that are integral to the contractual terms.
ECLs are recognised in two stages. For credit exposures for which there has not been a significant increase in credit risk since initial recognition, ECLs are provided for credit losses that resulted from default events that are possible within the next 12 months (a 12 month ECL). For those credit exposures for which there has been a significant increase in credit risk since initial recognition, a loss allowance is recognised for credit losses expected over the remaining life of the exposures, irrespective of timing of the default (an ECL).
For trade receivables, the Group applies a simplified approach in calculating ECLs. Therefore the Group does not track changes in credit risk, but instead recognises a loss allowance based on ECLs at each reporting date. The Group has established a provision matrix that is based on its historical credit loss experience, adjusted for forward looking factors specific to the debtors and the economic environment.
For debt instruments at fair value through OCI, the Group applies the low credit risk simplification. At every reporting date, the Group evaluates whether the debt instrument is considered to have low credit risk using all reasonable and supportable information that is available without undue cost or effort. In making that evaluation, the Group reassess the internal credit rating of the debt instrument. In addition, the Group considers that there has been a significant increase in credit risk when the contractual payments are more than 90 days past due.
The Group considers a financial asset in default when contractual payments are 365 days past due. However, in certain cases, the Group may also consider a financial asset to be in default when internal and external information indicates that the Group is unlikely to receive the outstanding contractual amounts in full before taking into account any credit enhancements held by the Group. A financial asset is written off when there is no reasonable expectation of recovering the contractual cash flows.
2.16 Cash and cash equivalents
Cash and cash equivalents comprise cash at bank and on hand and short term deposits that are readily convertible to known amount of cash and which are subject to an insignificant risk of changes in value.
Notes to the Financial Statements For the financial year ended 31 December 2018
115 \
2. Summary of significant accounting policies (cont’d)
2.17 Inventories
Inventories except consumables are carried at the fair market value at the end of each reporting period, whereby the resulting unrealised gain or loss is recognised in profit or loss. This is an alternative policy allowed by SFRS(I) 1-2 Inventories for commodity broker or trader, as this better reflect the performance of the Group. The Group’s operating activities, including procurement of raw materials, selling of finished goods and entering into forward commodity (natural rubber) contracts are subject to movements in the market prices of natural rubber. The Group has two main types of sales contracts and purchase contracts; long term contracts (“LTCs”) and spot contracts (“Spot”). The prices for LTCs are usually determined based on the average market price for the delivery months, whereas the prices for Spot contracts are usually agreed on the day the Spot contracts are entered. In addition to the management of the price risk between the sales and purchase activities, which is the key driver and contributor to the Group’s profitability, the Group also provided other ancillary services such as processing and distribution. The profit for these ancillary services is recognised in the profit or loss only when these services are performed by the Group.
Consumables are stated at the lower of cost and net realisable value. Cost is calculated using the weighted average method. Net realisable value represents the estimated selling price less all estimated costs of completion and costs to be incurred in marketing, selling and distribution.
2.18 Borrowing costs
Borrowing costs are capitalised as part of the cost of a qualifying asset if they are directly attributable to the acquisition, construction or production of that asset. Capitalisation of borrowing costs commences when the activities to prepare the asset for its intended use or sale are in progress and the expenditures and borrowing costs are incurred. Borrowing costs are capitalised until the assets are substantially completed for their intended use or sale. All other borrowing costs are expensed in the period they occur. Borrowing costs consist of interest and other costs that an entity incurs in connection with the borrowing of funds.
2.19 Provisions
Provisions are recognised when the Group has a present obligation (legal or constructive) as a result of a past event, it is probable that an outflow of resources embodying economic benefits will be required to settle the obligation and the amount of the obligation can be estimated reliably.
Provisions are reviewed at the end of each reporting period and adjusted to reflect the current best estimate. If it is no longer probable that an outflow of resources embodying economic benefits will be required to settle the obligation, the provision is reversed. If the effect of the time value of money is material, provisions are discounted using a current pre-tax rate that reflects, where appropriate, the risks specific to the liability. When discounting is used, the increase in the provision due to the passage of time is recognised as a finance cost.
2.20 Employee benefits
(a) Retirement benefit costs
Payments to defined contribution retirement benefit plans are charged as an expense when employees have rendered the services entitling them to the contributions. Payments made to state-managed retirement benefit schemes, such as the Singapore Central Provident Fund, are dealt with as payments to defined contribution plans where the group’s obligations under the plans are equivalent to those arising in a defined contribution retirement benefit plan.
For defined benefit retirement benefit plans, the cost of providing benefits is determined using the Projected Unit Credit Method, with actuarial valuations being carried out at the end of each reporting period. Remeasurement comprising actuarial gains and losses, the effect of the changes to the asset ceiling (if applicable) and the return on plan assets (excluding interest), is reflected immediately in the statement of financial position with a charge or credit recognised in other comprehensive income in the period in which they occur. Remeasurement recognised in other comprehensive income is reflected immediately in retained earnings and will not be reclassified to profit or loss. Service costs which include current service cost, past service cost and gains or losses on non-routine settlement are recognised as expense in profit or loss. Net interest is calculated by applying the discount rate based on high quality long term bonds at the beginning of the period to the net defined benefit liability or asset. Net interest on the net defined benefit liability or asset is recognised as expense or income in profit or loss.
Notes to the Financial Statements For the financial year ended 31 December 2018
\ 116
2. Summary of significant accounting policies (cont’d)
2.20 Employee benefits (cont’d)
(a) Retirement benefit costs (cont’d)
Defined benefit costs are categorised as follows: • Service cost; • Net interest expense or income of the net retirement benefit obligation; and
• Re-measurements of net retirement benefit obligation
The Group presents the first two components of defined benefit costs in profit or loss in the line item ‘Employee benefit expense’. Curtailment gains and losses are accounted for as past service costs.
The retirement benefit obligation recognised in the statement of financial position represents the actual deficit or surplus in the group’s defined benefit plans. Any surplus resulting from this calculation is limited to the present value of any economic benefits available in the form of refunds from the plans or reductions in future contributions to the plan.
A liability for a termination benefit is recognised at the earlier of when the entity can no longer withdraw the offer of the termination benefit and when the entity recognises any related restructuring costs.
(b) Employee leave entitlement
Employees’ entitlement to annual leave is recognised as a liability when they are accrued to the employees. The undiscounted liability for leave expected to be settled wholly before twelve months after the end of the reporting period is recognised for services rendered by employees up to the end of the reporting period.
2.21 Leases
(a) As lessee
Finance leases which transfer to the Group substantially all the risks and rewards incidental to ownership of the leased item, are capitalised at the inception of the lease at the fair value of the leased asset or, if lower, at the present value of the minimum lease payments. Any initial direct costs are also added to the amount capitalised. Lease payments are apportioned between the finance charges and reduction of the lease liability so as to achieve a constant rate of interest on the remaining balance of the liability. Finance charges are charged to profit or loss. Contingent rents, if any, are charged as expenses in the periods in which they are incurred.
Capitalised leased assets are depreciated over the shorter of the estimated useful life of the asset and the lease term, if there is no reasonable certainty that the Group will obtain ownership by the end of the lease term.
Operating lease payments are recognised as an expense in profit or loss on a straight-line basis over the lease term. The aggregate benefit of incentives provided by the lessor is recognised as a reduction of rental expense over the lease term on a straight-line basis.
(b) As lessor
Leases in which the Group does not transfer substantially all the risks and rewards of ownership of the asset are classified as operating leases. Initial direct costs incurred in negotiating an operating lease are added to the carrying amount of the leased asset and recognised over the lease term on the same bases as rental income. The accounting policy for rental income is set out in Note 2.23(c). Contingent rents are recognised as revenue in the period in which they are earned.
2.22 Non-current assets held-for-sale and discontinued operations
Non-current assets and disposal groups classified as held-for-sale are measured at the lower of their carrying amount and fair value less costs to sell. Non-current assets and disposal groups are classified as held-for-sale if their carrying amounts will be recovered principally through a sale transaction rather than through continuing use. A component of the Group is classified as a ‘discontinued operation’ when the criteria to be classified as held-for-sale have been met or it has been disposed of and such a component represents a separate major line of business or geographical area of operations or is part of a single coordinated plan to dispose of a separate major line of business or geographical area of operations.
Property, plant and equipment and intangible assets once classified as held-for-sale are not depreciated or amortised.
Notes to the Financial Statements For the financial year ended 31 December 2018
117 \
2. Summary of significant accounting policies (cont’d)
2.23 Revenue
Revenue is measured based on the consideration to which the Group expects to be entitled in exchange for transferring promised goods or services to a customer, excluding amounts collected on behalf of third parties.
Revenue is recognised when the Group satisfies a performance obligation by transferring promised goods or services to the customer, which is when the customer obtains control of the good or service. A performance obligation may be satisfied at a point in time or over time. The amount of revenue recognised is the amount allocated to the satisfied performance obligation.
(a) Sale of goods
Revenue from sale of goods is recognised when goods are delivered to the customer and all criteria for acceptance have been satisfied.
(b) Interest income
Interest income is recognised using the effective interest method.
(c) Rental income
Rental income arising from operating leases on investment properties is accounted for on a straight-line basis over the lease terms. The aggregate costs of incentives provided to lessees are recognised as a reduction of rental income over the lease term on a straight-line basis.
2.24 Taxes
(a) Current income tax
Current income tax assets and liabilities for the current and prior periods are measured at the amount expected to be recovered from or paid to the taxation authorities. The tax rates and tax laws used to compute the amount are those that are enacted or substantively enacted at the end of the reporting period, in the countries where the Group operates and generates taxable income.
Current income taxes are recognised in profit or loss except to the extent that the tax relates to items recognised outside profit or loss, either in other comprehensive income or directly in equity. Management periodically evaluates positions taken in the tax returns with respect to situations in which applicable tax regulations are subject to interpretation and establishes provisions where appropriate.
(b) Deferred tax
Deferred tax is provided using the liability method on temporary differences at the end of the reporting period between the tax bases of assets and liabilities and their carrying amounts for financial reporting purposes.
Deferred tax liabilities are recognised for all temporary differences, except:
– Where the deferred tax liability arises from the initial recognition of goodwill or of an asset or liability in a transaction that is not a business combination and, at the time of the transaction, affects neither the accounting profit nor taxable profit or loss; and
– In respect of taxable temporary differences associated with investments in subsidiaries, associates and interests in joint ventures, where the timing of the reversal of the temporary differences can be controlled and it is probable that the temporary differences will not reverse in the foreseeable future.
Deferred tax assets are recognised for all deductible temporary differences, the carry forward of unused tax credits and unused tax losses, to the extent that it is probable that taxable profit will be available against which the deductible temporary differences, and the carry forward of unused tax credits and unused tax losses can be utilised except:
– Where the deferred tax asset relating to the deductible temporary difference arises from the initial recognition of an asset or liability in a transaction that is not a business combination and, at the time of the transaction, affects neither the accounting profit nor taxable profit or loss; and
– In respect of deductible temporary differences associated with investments in subsidiaries, associates and interests in joint ventures, deferred tax assets are recognised only to the extent that it is probable that the temporary differences will reverse in the foreseeable future and taxable profit will be available against which the temporary differences can be utilised.
The carrying amount of deferred tax assets is reviewed at the end of each reporting period and reduced to the extent that it is no longer probable that sufficient taxable profit will be available to allow all or part of the deferred tax asset to be utilised. Unrecognised deferred tax assets are reassessed at the end of each reporting period and are recognised to the extent that it has become probable that future taxable profit will allow the deferred tax asset to be recovered.
Notes to the Financial Statements For the financial year ended 31 December 2018
\ 118
2. Summary of significant accounting policies (cont’d)
2.24 Taxes (cont’d)
(b) Deferred tax (cont’d)
Deferred tax assets and liabilities are measured at the tax rates that are expected to apply in the year when the asset is realised or the liability is settled, based on tax rates (and tax laws) that have been enacted or substantively enacted at the end of each reporting period.
Deferred tax relating to items recognised outside profit or loss is recognised outside profit or loss. Deferred tax items are recognised in correlation to the underlying transaction either in other comprehensive income or directly in equity and deferred tax arising from a business combination is adjusted against goodwill on acquisition.
Tax benefits acquired as part of a business combination, but not satisfying the criteria for separate recognition at that date, would be recognised subsequently if new information about facts and circumstances changed. The adjustment would either be treated as a reduction to goodwill (as long as it does not exceed goodwill) if it is incurred during the measurement period or in profit or loss.
(c) Sales tax
Revenues, expenses and assets are recognised net of the amount of sales tax except:
– Where the sales tax incurred on a purchase of assets or services is not recoverable from the taxation authority, in which case the sales tax is recognised as part of the cost of acquisition of the asset or as part of the expense item as applicable; and
– Receivables and payables that are stated with the amount of sales tax included.
The net amount of sales tax recoverable from, or payable to, the taxation authority is included as part of other receivables or other payables in the statement of financial position.
2.25 Share capital and share issuance expenses
Proceeds from issuance of ordinary shares are recognised as share capital in equity. Incremental costs directly attributable to the issuance of ordinary shares are deducted against share capital.
Fair valuation of shares are based on the prevailing market price as at the date of issuance.
2.26 Perpetual securities
The perpetual capital securities do not have a maturity date and the Company is able to elect to defer or not making a distribution subject to the terms and conditions of the securities issue. Accordingly, the Company is not considered to have a contractual obligation to make principal repayments or distributions in respect of its perpetual capital securities issue and the perpetual capital securities are presented within equity. Distributions are treated as dividends which will be directly debited from equity. Costs directly attributable to the issue of the perpetual capital securities are deducted against the proceeds from the issue.
On the election of the Company to repay the perpetual securities, the perpetual securities will be reclassified as a financial liability under SFRS(I) 1-39. The financial liability is initially recognised at fair value and any difference between the carrying amount of the liability and the previously recognised equity instrument is recognised in equity.
No gain or loss is recognised in the profit or loss on the reclassification.
2.27 Contingencies
A contingent liability is:
(a) a possible obligation that arises from past events and whose existence will be confirmed only by the occurrence or non-occurrence of one or more uncertain future events not wholly within the control of the Group; or
(b) a present obligation that arises from past events but is not recognised because:
(i) it is not probable that an outflow of resources embodying economic benefits will be required to settle the obligation; or
(ii) the amount of the obligation cannot be measured with sufficient reliability.
A contingent asset is a possible asset that arises from past events and whose existence will be confirmed only by the occurrence or non-occurrence of one or more uncertain future events not wholly within the control of the Group.
Contingent liabilities and assets are not recognised on the statement of financial position of the Group, except for contingent liabilities assumed in a business combination that are present obligations and which the fair values can be reliably determined.
Notes to the Financial Statements For the financial year ended 31 December 2018
119 \
2. Summary of significant accounting policies (cont’d)
2.28 Segment reporting
For management purposes, the Group is organised into operating segments based on their business units Management regularly reviews the segment results in order to allocate resources to the segments and to assess the segment performance. Additional disclosures on each of these segments are shown in Note 33, including the factors used to identify the reportable segments and the measurement basis of segment information.
3. Significant accounting judgements and estimates
The preparation of the Group’s consolidated financial statements requires management to make judgements, estimates and assumptions that affect the reported amounts of revenues, expenses, assets and liabilities, and the disclosure of contingent liabilities at the end of each reporting period. Uncertainty about these assumptions and estimates could result in outcomes that require a material adjustment to the carrying amount of the asset or liability affected in the future periods.
3.1 Judgements made in applying accounting policies
In the process of applying the Group’s accounting policies, management has made the following judgements, apart from those involving estimations, which have the most significant effect on the amounts recognised in the consolidated financial statements:
(a) Classification of rubber trees as bearer plants or non-bearer plants
The Group has rubber plantations in Malaysia and Africa.
The classification of rubber trees as bearer plant or non-bearer plant depends on the business plan for respective rubber plantations, pertinent facts and circumstances surrounding the trees, plantation and relevant local market or industry considerations. Rubber trees are not considered bearer plant when there is commercially viable plan to sell the rubber tree as lumber to an established market.
The Group has assessed that there is an established lumber market for rubber trees in Malaysia and it is the Group’s business plan to sell the rubber trees as lumber at the end of the rubber production life.
Therefore, the Group has accounted for:
i) the rubber trees in its Malaysia plantations as biological assets, which is within the scope of SFRS(I) 1-41, and are stated at fair value less estimated costs to sell; and
ii) the rubber trees in its African plantations as bearer plant which are measured under SFRS(I) 1-16 at accumulated cost (before maturity) and using cost model (after maturity).
(b) Impairment of goodwill and process know-how
Judgement has been made by the Group to identify the cash-generating units and assess the future market and economic assumptions, such as forecasted rubber price, forecasted sales volume, growth rate and pre-tax discount rates. The Group has estimated the recoverable amounts of cash-generating units to which goodwill and process know-how has been allocated to, based on value-in-use approach. Estimates used in deriving the value-in-use, are disclosed in Note 3.2(a).
3.2 Key sources of estimation uncertainty
The key assumptions concerning the future and other key sources of estimation uncertainty at the end of the reporting period are discussed below. The Group based its assumptions and estimates on parameters available when the financial statements were prepared. Existing circumstances and assumptions about future developments, however, may change due to market changes or circumstances arising beyond the control of the Group. Such changes are reflected in the assumptions when they occur.
(a) Impairment of goodwill and process know-how
Determining whether goodwill and process know-how is impaired requires an estimation of the value in use of the cash-generating-unit to which the goodwill and process know-how have been allocated.
The value in use calculation requires the Group to estimate the future cash flows expected to arise, the growth rate used for extrapolation purposes and a suitable discount rate in order to calculate present value. The key assumptions applied in the determination of the value in use including a sensitivity analysis are disclosed and further explained in Note 11 to the financial statements. The Group’s carrying amount of goodwill and process know-how at 31 December 2018 is US$297,399,000 (2017: US$199,887,000).
Notes to the Financial Statements For the financial year ended 31 December 2018
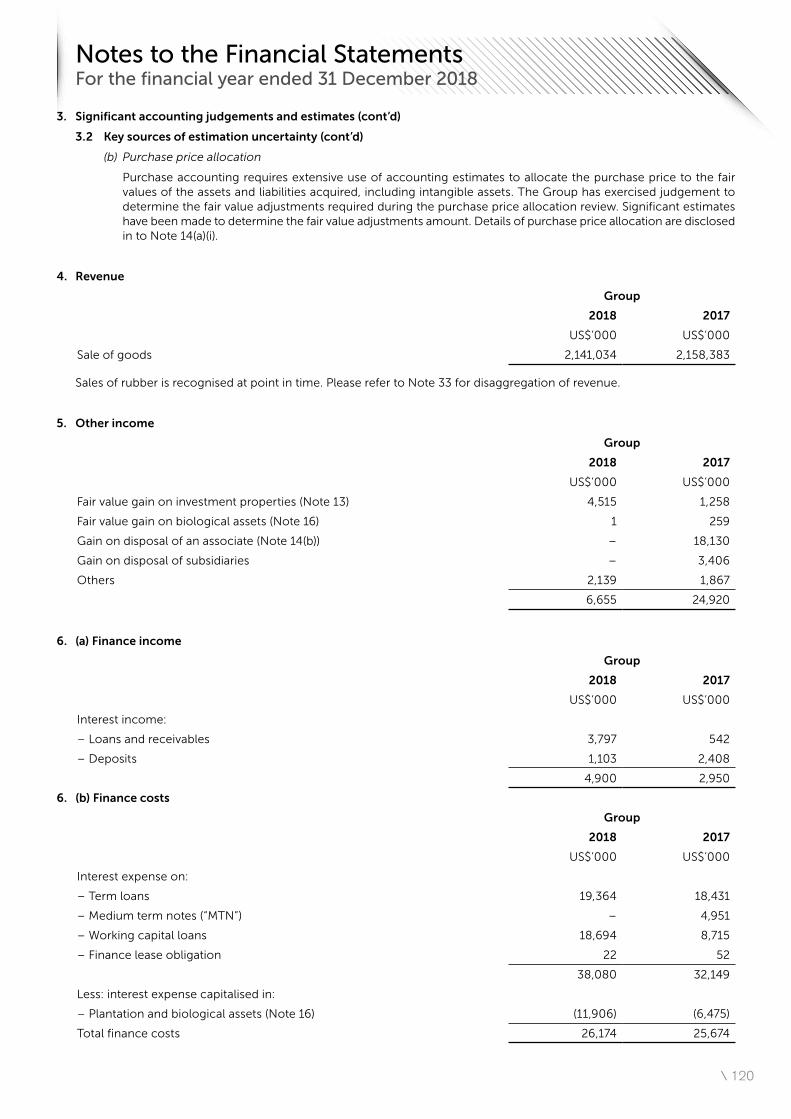
\ 120
3. Significant accounting judgements and estimates (cont’d)
3.2 Key sources of estimation uncertainty (cont’d)
(b) Purchase price allocation
Purchase accounting requires extensive use of accounting estimates to allocate the purchase price to the fair values of the assets and liabilities acquired, including intangible assets. The Group has exercised judgement to determine the fair value adjustments required during the purchase price allocation review. Significant estimates have been made to determine the fair value adjustments amount. Details of purchase price allocation are disclosed in to Note 14(a)(i).
4. Revenue
Group
2018 2017
US$’000 US$’000
Sale of goods 2,141,034 2,158,383
Sales of rubber is recognised at point in time. Please refer to Note 33 for disaggregation of revenue.
5. Other income
Group
2018 2017
US$’000 US$’000
Fair value gain on investment properties (Note 13) 4,515 1,258
Fair value gain on biological assets (Note 16) 1 259
Gain on disposal of an associate (Note 14(b)) – 18,130
Gain on disposal of subsidiaries – 3,406
Others 2,139 1,867
6,655 24,920
6. (a) Finance income
Group
2018 2017
US$’000 US$’000
Interest income:
– Loans and receivables 3,797 542
– Deposits 1,103 2,408
4,900 2,950
6. (b) Finance costs
Group
2018 2017
US$’000 US$’000
Interest expense on:
– Term loans 19,364 18,431
– Medium term notes (“MTN”) – 4,951
– Working capital loans 18,694 8,715
– Finance lease obligation 22 52
38,080 32,149
Less: interest expense capitalised in:
– Plantation and biological assets (Note 16) (11,906) (6,475)
Total finance costs 26,174 25,674
Notes to the Financial Statements For the financial year ended 31 December 2018
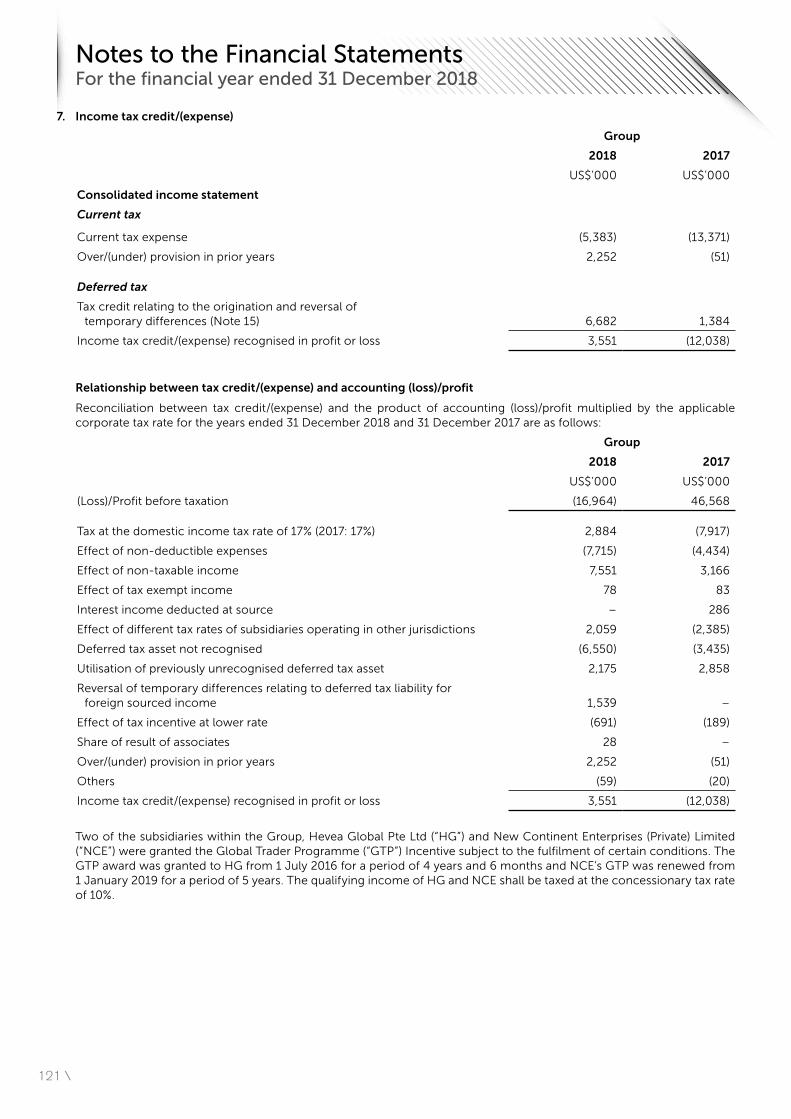
121 \
7. Income tax credit/(expense)
Group
2018 2017
US$’000 US$’000
Consolidated income statement
Current tax
Current tax expense (5,383) (13,371)
Over/(under) provision in prior years 2,252 (51)
Deferred tax
Tax credit relating to the origination and reversal of temporary differences (Note 15) 6,682 1,384
Income tax credit/(expense) recognised in profit or loss 3,551 (12,038)
Relationship between tax credit/(expense) and accounting (loss)/profit
Reconciliation between tax credit/(expense) and the product of accounting (loss)/profit multiplied by the applicable corporate tax rate for the years ended 31 December 2018 and 31 December 2017 are as follows:
Group
2018 2017
US$’000 US$’000
(Loss)/Profit before taxation (16,964) 46,568
Tax at the domestic income tax rate of 17% (2017: 17%) 2,884 (7,917)
Effect of non-deductible expenses (7,715) (4,434)
Effect of non-taxable income 7,551 3,166
Effect of tax exempt income 78 83
Interest income deducted at source – 286
Effect of different tax rates of subsidiaries operating in other jurisdictions 2,059 (2,385)
Deferred tax asset not recognised (6,550) (3,435)
Utilisation of previously unrecognised deferred tax asset 2,175 2,858
Reversal of temporary differences relating to deferred tax liability for foreign sourced income 1,539 –
Effect of tax incentive at lower rate (691) (189)
Share of result of associates 28 –
Over/(under) provision in prior years 2,252 (51)
Others (59) (20)
Income tax credit/(expense) recognised in profit or loss 3,551 (12,038)
Two of the subsidiaries within the Group, Hevea Global Pte Ltd (“HG”) and New Continent Enterprises (Private) Limited (“NCE”) were granted the Global Trader Programme (“GTP”) Incentive subject to the fulfilment of certain conditions. The GTP award was granted to HG from 1 July 2016 for a period of 4 years and 6 months and NCE’s GTP was renewed from 1 January 2019 for a period of 5 years. The qualifying income of HG and NCE shall be taxed at the concessionary tax rate of 10%.
Notes to the Financial Statements For the financial year ended 31 December 2018
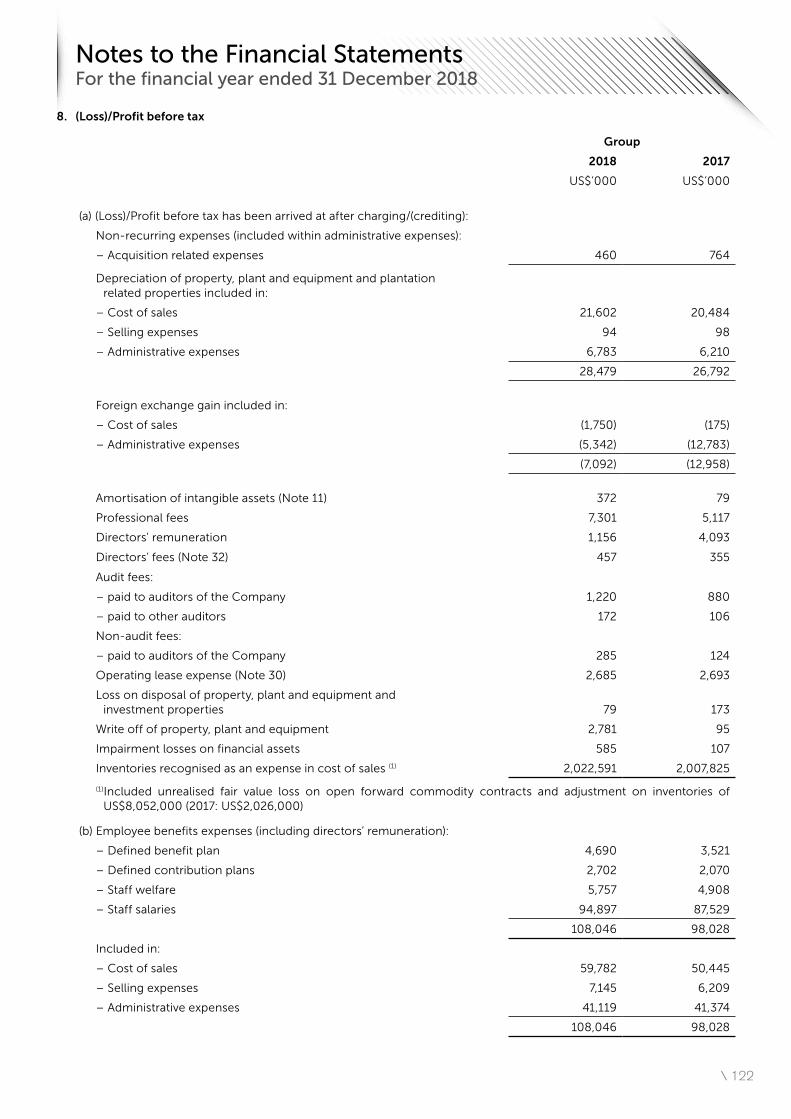
\ 122
8. (Loss)/Profit before tax
Group
2018 2017
US$’000 US$’000
(a) (Loss)/Profit before tax has been arrived at after charging/(crediting):
Non-recurring expenses (included within administrative expenses):
– Acquisition related expenses 460 764
Depreciation of property, plant and equipment and plantation related properties included in:
– Cost of sales 21,602 20,484
– Selling expenses 94 98
– Administrative expenses 6,783 6,210
28,479 26,792
Foreign exchange gain included in:
– Cost of sales (1,750) (175)
– Administrative expenses (5,342) (12,783)
(7,092) (12,958)
Amortisation of intangible assets (Note 11) 372 79
Professional fees 7,301 5,117
Directors’ remuneration 1,156 4,093
Directors’ fees (Note 32) 457 355
Audit fees:
– paid to auditors of the Company 1,220 880
– paid to other auditors 172 106
Non-audit fees:
– paid to auditors of the Company 285 124
Operating lease expense (Note 30) 2,685 2,693
Loss on disposal of property, plant and equipment and investment properties 79 173
Write off of property, plant and equipment 2,781 95
Impairment losses on financial assets 585 107
Inventories recognised as an expense in cost of sales (1) 2,022,591 2,007,825
(1)Included unrealised fair value loss on open forward commodity contracts and adjustment on inventories of US$8,052,000 (2017: US$2,026,000)
(b) Employee benefits expenses (including directors’ remuneration):
– Defined benefit plan 4,690 3,521
– Defined contribution plans 2,702 2,070
– Staff welfare 5,757 4,908
– Staff salaries 94,897 87,529
108,046 98,028
Included in:
– Cost of sales 59,782 50,445
– Selling expenses 7,145 6,209
– Administrative expenses 41,119 41,374
108,046 98,028
Notes to the Financial Statements For the financial year ended 31 December 2018
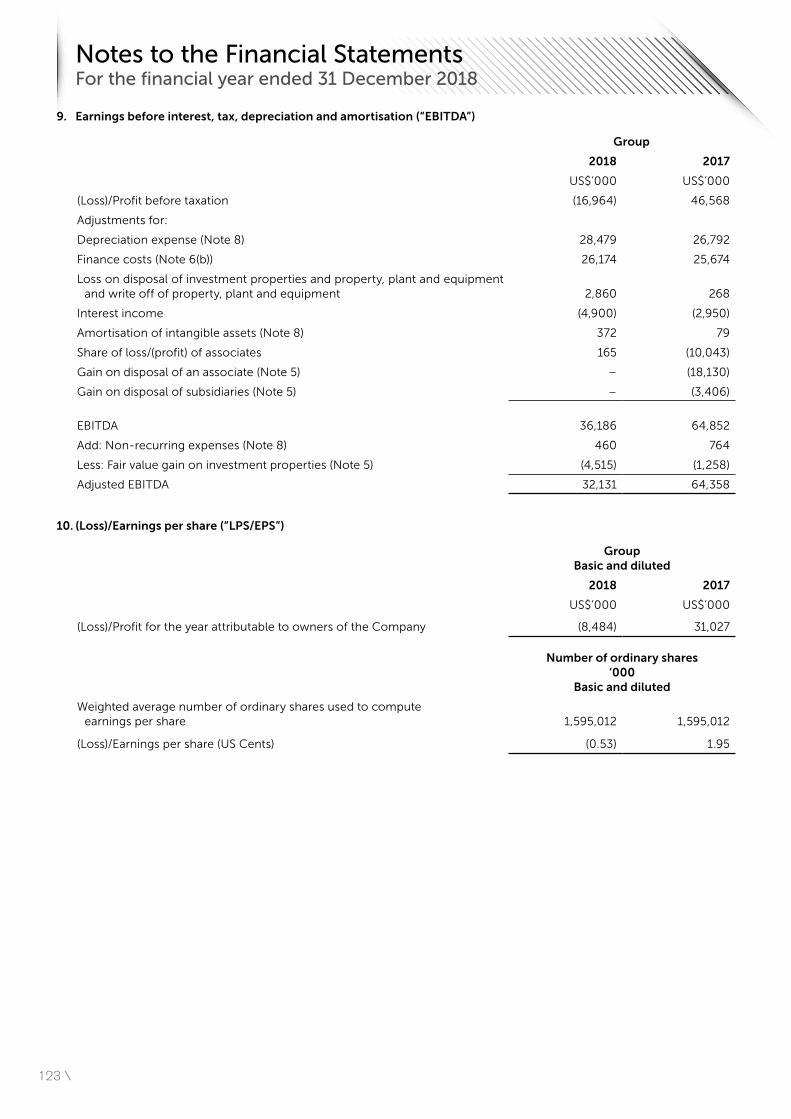
123 \
9. Earnings before interest, tax, depreciation and amortisation (“EBITDA”)
Group
2018 2017
US$’000 US$’000
(Loss)/Profit before taxation (16,964) 46,568
Adjustments for:
Depreciation expense (Note 8) 28,479 26,792
Finance costs (Note 6(b)) 26,174 25,674
Loss on disposal of investment properties and property, plant and equipment and write off of property, plant and equipment 2,860 268
Interest income (4,900) (2,950)
Amortisation of intangible assets (Note 8) 372 79
Share of loss/(profit) of associates 165 (10,043)
Gain on disposal of an associate (Note 5) – (18,130)
Gain on disposal of subsidiaries (Note 5) – (3,406)
EBITDA 36,186 64,852
Add: Non-recurring expenses (Note 8) 460 764
Less: Fair value gain on investment properties (Note 5) (4,515) (1,258)
Adjusted EBITDA 32,131 64,358
10. (Loss)/Earnings per share (“LPS/EPS”)
Group Basic and diluted
2018 2017
US$’000 US$’000
(Loss)/Profit for the year attributable to owners of the Company (8,484) 31,027
Number of ordinary shares ‘000
Basic and diluted
Weighted average number of ordinary shares used to compute earnings per share 1,595,012 1,595,012
(Loss)/Earnings per share (US Cents) (0.53) 1.95
Notes to the Financial Statements For the financial year ended 31 December 2018
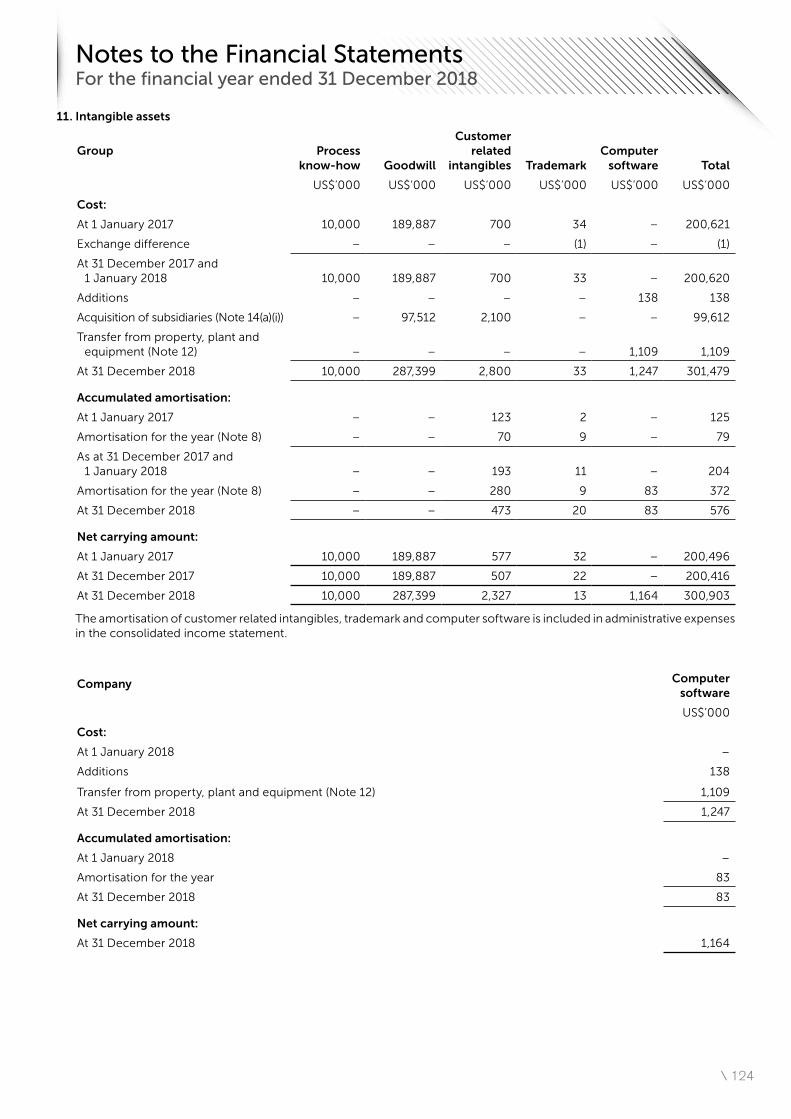
\ 124
11. Intangible assets
Group Process know-how Goodwill
Customer related
intangibles TrademarkComputer
software Total
US$’000 US$’000 US$’000 US$’000 US$’000 US$’000
Cost:
At 1 January 2017 10,000 189,887 700 34 – 200,621
Exchange difference – – – (1) – (1)
At 31 December 2017 and 1 January 2018 10,000 189,887 700 33 – 200,620
Additions – – – – 138 138
Acquisition of subsidiaries (Note 14(a)(i)) – 97,512 2,100 – – 99,612
Transfer from property, plant and equipment (Note 12) – – – – 1,109 1,109
At 31 December 2018 10,000 287,399 2,800 33 1,247 301,479
Accumulated amortisation:
At 1 January 2017 – – 123 2 – 125
Amortisation for the year (Note 8) – – 70 9 – 79
As at 31 December 2017 and 1 January 2018 – – 193 11 – 204
Amortisation for the year (Note 8) – – 280 9 83 372
At 31 December 2018 – – 473 20 83 576
Net carrying amount:
At 1 January 2017 10,000 189,887 577 32 – 200,496
At 31 December 2017 10,000 189,887 507 22 – 200,416
At 31 December 2018 10,000 287,399 2,327 13 1,164 300,903
The amortisation of customer related intangibles, trademark and computer software is included in administrative expenses in the consolidated income statement.
Company Computer software
US$’000
Cost:
At 1 January 2018 –
Additions 138
Transfer from property, plant and equipment (Note 12) 1,109
At 31 December 2018 1,247
Accumulated amortisation:
At 1 January 2018 –
Amortisation for the year 83
At 31 December 2018 83
Net carrying amount:
At 31 December 2018 1,164
Notes to the Financial Statements For the financial year ended 31 December 2018
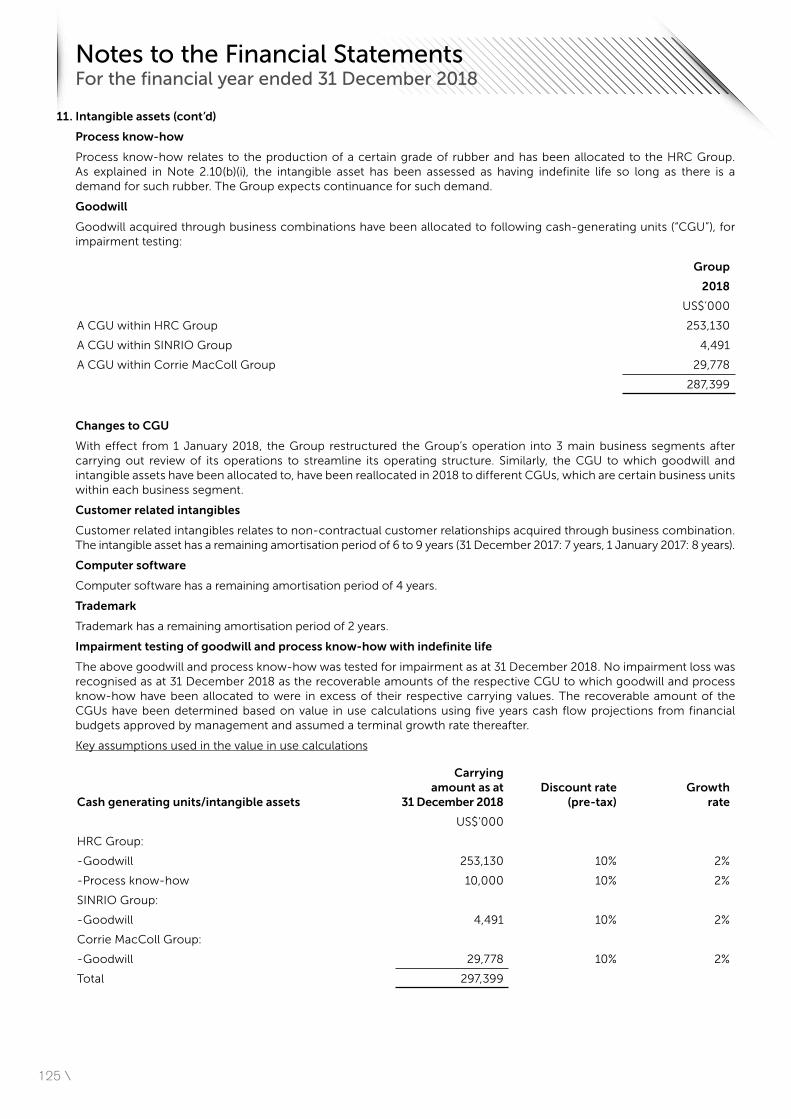
125 \
11. Intangible assets (cont’d)
Process know-how
Process know-how relates to the production of a certain grade of rubber and has been allocated to the HRC Group. As explained in Note 2.10(b)(i), the intangible asset has been assessed as having indefinite life so long as there is a demand for such rubber. The Group expects continuance for such demand.
Goodwill
Goodwill acquired through business combinations have been allocated to following cash-generating units (“CGU”), for impairment testing:
Group
2018
US$’000
A CGU within HRC Group 253,130
A CGU within SINRIO Group 4,491
A CGU within Corrie MacColl Group 29,778
287,399
Changes to CGU
With effect from 1 January 2018, the Group restructured the Group’s operation into 3 main business segments after carrying out review of its operations to streamline its operating structure. Similarly, the CGU to which goodwill and intangible assets have been allocated to, have been reallocated in 2018 to different CGUs, which are certain business units within each business segment.
Customer related intangibles
Customer related intangibles relates to non-contractual customer relationships acquired through business combination. The intangible asset has a remaining amortisation period of 6 to 9 years (31 December 2017: 7 years, 1 January 2017: 8 years).
Computer software
Computer software has a remaining amortisation period of 4 years.
Trademark
Trademark has a remaining amortisation period of 2 years.
Impairment testing of goodwill and process know-how with indefinite life
The above goodwill and process know-how was tested for impairment as at 31 December 2018. No impairment loss was recognised as at 31 December 2018 as the recoverable amounts of the respective CGU to which goodwill and process know-how have been allocated to were in excess of their respective carrying values. The recoverable amount of the CGUs have been determined based on value in use calculations using five years cash flow projections from financial budgets approved by management and assumed a terminal growth rate thereafter.
Key assumptions used in the value in use calculations
Cash generating units/intangible assets
Carrying amount as at
31 December 2018Discount rate
(pre-tax)Growth
rate
US$’000
HRC Group:
-Goodwill 253,130 10% 2%
-Process know-how 10,000 10% 2%
SINRIO Group:
-Goodwill 4,491 10% 2%
Corrie MacColl Group:
-Goodwill 29,778 10% 2%
Total 297,399
Notes to the Financial Statements For the financial year ended 31 December 2018
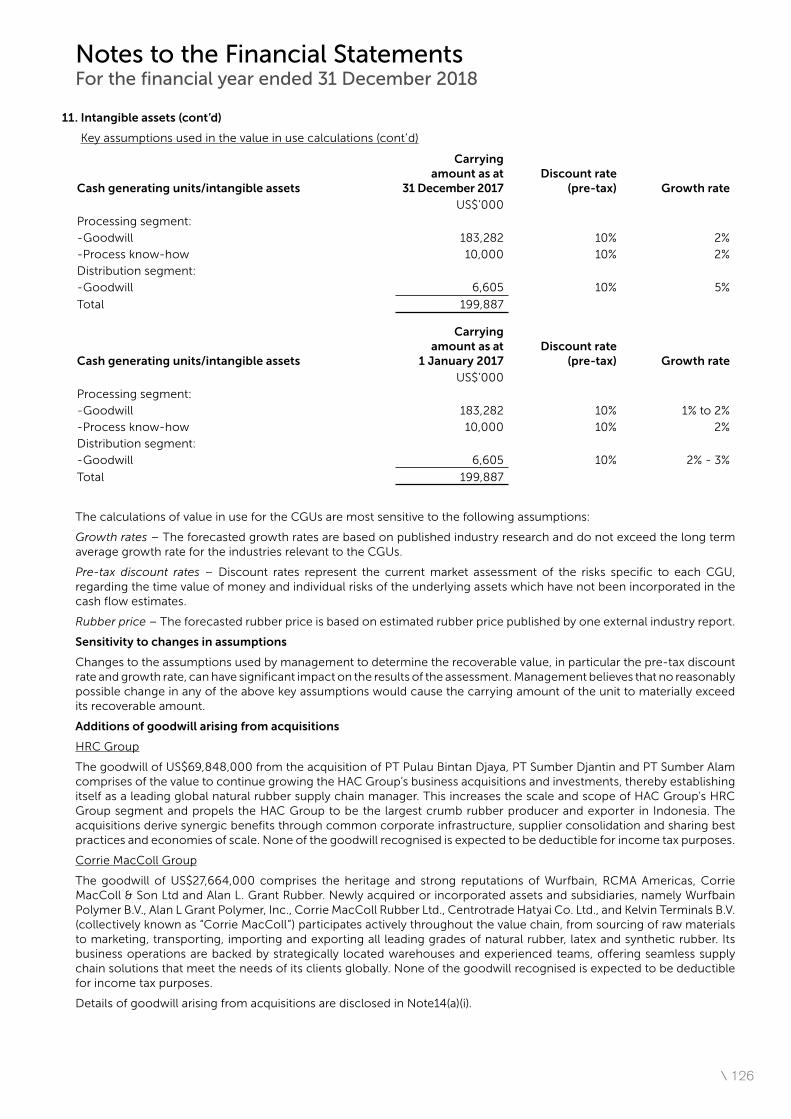
\ 126
11. Intangible assets (cont’d)
Key assumptions used in the value in use calculations (cont’d)
Cash generating units/intangible assets
Carrying amount as at
31 December 2017Discount rate
(pre-tax) Growth rateUS$’000
Processing segment:
-Goodwill 183,282 10% 2%
-Process know-how 10,000 10% 2%
Distribution segment:
-Goodwill 6,605 10% 5%
Total 199,887
Cash generating units/intangible assets
Carrying amount as at
1 January 2017Discount rate
(pre-tax) Growth rateUS$’000
Processing segment:
-Goodwill 183,282 10% 1% to 2%
-Process know-how 10,000 10% 2%
Distribution segment:
-Goodwill 6,605 10% 2% - 3%
Total 199,887
The calculations of value in use for the CGUs are most sensitive to the following assumptions:
Growth rates – The forecasted growth rates are based on published industry research and do not exceed the long term average growth rate for the industries relevant to the CGUs.
Pre-tax discount rates – Discount rates represent the current market assessment of the risks specific to each CGU, regarding the time value of money and individual risks of the underlying assets which have not been incorporated in the cash flow estimates.
Rubber price – The forecasted rubber price is based on estimated rubber price published by one external industry report.
Sensitivity to changes in assumptions
Changes to the assumptions used by management to determine the recoverable value, in particular the pre-tax discount rate and growth rate, can have significant impact on the results of the assessment. Management believes that no reasonably possible change in any of the above key assumptions would cause the carrying amount of the unit to materially exceed its recoverable amount.
Additions of goodwill arising from acquisitions
HRC Group
The goodwill of US$69,848,000 from the acquisition of PT Pulau Bintan Djaya, PT Sumber Djantin and PT Sumber Alam comprises of the value to continue growing the HAC Group’s business acquisitions and investments, thereby establishing itself as a leading global natural rubber supply chain manager. This increases the scale and scope of HAC Group’s HRC Group segment and propels the HAC Group to be the largest crumb rubber producer and exporter in Indonesia. The acquisitions derive synergic benefits through common corporate infrastructure, supplier consolidation and sharing best practices and economies of scale. None of the goodwill recognised is expected to be deductible for income tax purposes.
Corrie MacColl Group
The goodwill of US$27,664,000 comprises the heritage and strong reputations of Wurfbain, RCMA Americas, Corrie MacColl & Son Ltd and Alan L. Grant Rubber. Newly acquired or incorporated assets and subsidiaries, namely Wurfbain Polymer B.V., Alan L Grant Polymer, Inc., Corrie MacColl Rubber Ltd., Centrotrade Hatyai Co. Ltd., and Kelvin Terminals B.V. (collectively known as “Corrie MacColl”) participates actively throughout the value chain, from sourcing of raw materials to marketing, transporting, importing and exporting all leading grades of natural rubber, latex and synthetic rubber. Its business operations are backed by strategically located warehouses and experienced teams, offering seamless supply chain solutions that meet the needs of its clients globally. None of the goodwill recognised is expected to be deductible for income tax purposes.
Details of goodwill arising from acquisitions are disclosed in Note14(a)(i).
Notes to the Financial Statements For the financial year ended 31 December 2018

\ 128127 \
12. Property, plant and equipment
Group
Leasehold improvements
and renovationOffice
equipmentComputers and
softwareLeasehold buildings
Plant and machinery Vehicles Leasehold land Freehold land
Asset under construction Total
US$’000 US$’000 US$’000 US$’000 US$’000 US$’000 US$’000 US$’000 US$’000 US$’000
Cost:
At 1 January 2017 7,032 7,758 4,272 97,353 71,873 6,686 56,888 8,300 11,056 271,218
Additions 120 1,222 367 4,545 3,645 2,123 – – 5,908 17,930
Disposals – (414) (122) (731) (2,611) (2,936) – – (7) (6,821)
Write offs (761) (513) – (1) (47) – – – (10) (1,332)
Transfer from plantation related properties (Note 16) – – – 14,566 – – – – 5,934 20,500
Reclassifications 21,411 4,106 109 (18,298) 3,606 2 28 – (10,964) –
Reclassification to assets of disposal group classified as held-for-sale (Note 22) – (149) (269) (9,483) (7,631) (166) (2,773) (8,981) (297) (29,749)
Exchange difference 633 877 268 7,874 3,346 640 1,484 681 1,250 17,053
At 31 December 2017 and 1 January 2018 28,435 12,887 4,625 95,825 72,181 6,349 55,627 – 12,870 288,799
Additions 790 4,028 734 846 7,163 2,774 297 – 15,364 31,996
Acquisition of subsidiaries 20 367 36 13,730 9,439 330 13,951 – 6 37,879
Disposals – (217) (246) (1) (369) (577) – – (13) (1,423)
Write offs (1,999) (548) (137) (18) (2,097) – – – (52) (4,851)
Transfer to plantation related properties (Note 16) – – – – – – – – (1,545) (1,545)
Transfer to intangible assets (Note 11) – – – – – – – – (1,109) (1,109)
Reclassifications (24,437) 786 209 29,141 2,647 (264) 56 – (8,138) –
Reclassification from assets of disposal group classified as held-for-sale (Note 22) – 149 269 9,483 7,631 166 2,773 8,981 297 29,749
Exchange difference (232) (303) (477) (1,550) (6,916) (1,978) (3,609) – (1,273) (16,338)
At 31 December 2018 2,577 17,149 5,013 147,456 89,679 6,800 69,095 8,981 16,407 363,157
Accumulated depreciation and impairment:
At 1 January 2017 552 2,633 1,009 6,989 9,133 1,851 4,270 – – 26,437
Disposals – (350) (121) (498) (2,610) (2,775) – – – (6,354)
Depreciation for the year (Note 8) 793 1,516 726 7,109 11,472 1,237 2,189 – – 25,042
Write offs (715) (487) – – (35) – – – – (1,237)
Reclassification to assets of disposal group classified as held-for-sale (Note 22) – (54) (62) (227) (2,175) (44) – – – (2,562)
Exchange difference (470) 191 39 2,377 179 246 (18) – – 2,544
At 31 December 2017 and 1 January 2018 160 3,449 1,591 15,750 15,964 515 6,441 – – 43,870
Disposals – (94) (211) – (217) (400) – – – (922)
Depreciation for the year (Note 8) 1,741 1,677 822 7,248 11,758 1,424 2,024 – – 26,694
Write offs (40) (455) (123) (13) (2,056) – – – – (2,687)
Transfer to plantation related properties (Note 16) – 697 33 545 708 312 – – – 2,295
Reclassifications – (213) 190 – 25 (2) – – – –
Reclassification from assets of disposal group classified as held-for-sale (Note 22) – 54 62 227 2,175 44 – – – 2,562
Exchange difference (210) (261) (52) (214) (947) (1,507) (436) – – (3,627)
At 31 December 2018 1,651 4,854 2,312 23,543 27,410 386 8,029 – – 68,185
Net carrying amount:
At 1 January 2017 6,480 5,125 3,263 90,364 62,740 4,835 52,618 8,300 11,056 244,781
At 31 December 2017 28,275 9,438 3,034 80,075 56,217 5,834 49,186 – 12,870 244,929
At 31 December 2018 926 12,295 2,701 123,913 62,269 6,414 61,066 8,981 16,407 294,972
Notes to the Financial Statements For the financial year ended 31 December 2018
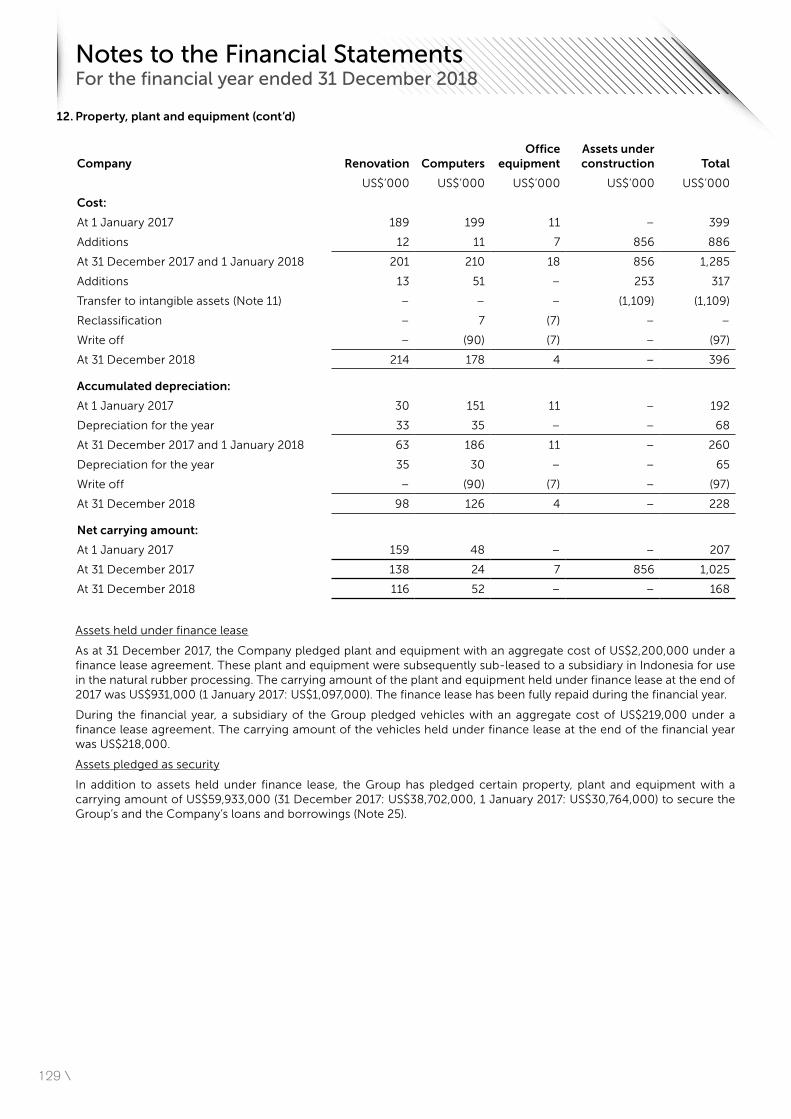
129 \
12. Property, plant and equipment (cont’d)
Company Renovation ComputersOffice
equipmentAssets under construction Total
US$’000 US$’000 US$’000 US$’000 US$’000
Cost:
At 1 January 2017 189 199 11 – 399
Additions 12 11 7 856 886
At 31 December 2017 and 1 January 2018 201 210 18 856 1,285
Additions 13 51 – 253 317
Transfer to intangible assets (Note 11) – – – (1,109) (1,109)
Reclassification – 7 (7) – –
Write off – (90) (7) – (97)
At 31 December 2018 214 178 4 – 396
Accumulated depreciation:
At 1 January 2017 30 151 11 – 192
Depreciation for the year 33 35 – – 68
At 31 December 2017 and 1 January 2018 63 186 11 – 260
Depreciation for the year 35 30 – – 65
Write off – (90) (7) – (97)
At 31 December 2018 98 126 4 – 228
Net carrying amount:
At 1 January 2017 159 48 – – 207
At 31 December 2017 138 24 7 856 1,025
At 31 December 2018 116 52 – – 168
Assets held under finance lease
As at 31 December 2017, the Company pledged plant and equipment with an aggregate cost of US$2,200,000 under a finance lease agreement. These plant and equipment were subsequently sub-leased to a subsidiary in Indonesia for use in the natural rubber processing. The carrying amount of the plant and equipment held under finance lease at the end of 2017 was US$931,000 (1 January 2017: US$1,097,000). The finance lease has been fully repaid during the financial year.
During the financial year, a subsidiary of the Group pledged vehicles with an aggregate cost of US$219,000 under a finance lease agreement. The carrying amount of the vehicles held under finance lease at the end of the financial year was US$218,000.
Assets pledged as security
In addition to assets held under finance lease, the Group has pledged certain property, plant and equipment with a carrying amount of US$59,933,000 (31 December 2017: US$38,702,000, 1 January 2017: US$30,764,000) to secure the Group’s and the Company’s loans and borrowings (Note 25).
Notes to the Financial Statements For the financial year ended 31 December 2018
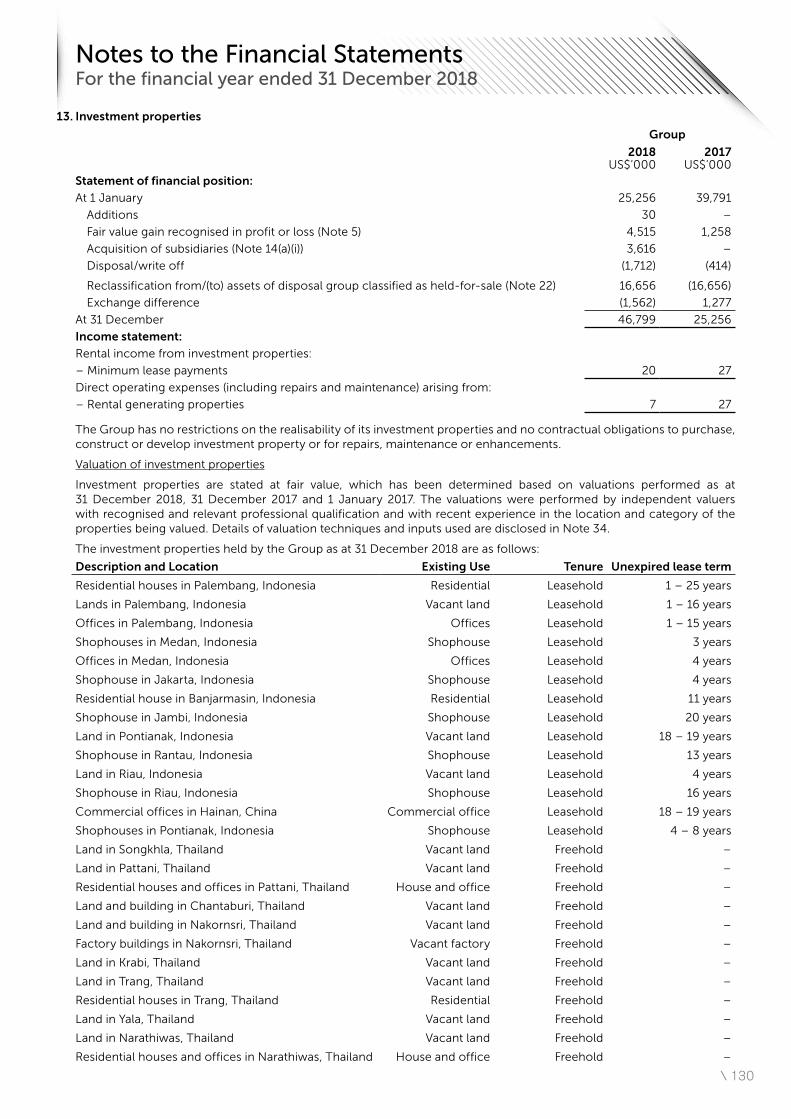
\ 130
13. Investment properties
Group
2018 US$’000
2017 US$’000
Statement of financial position:
At 1 January 25,256 39,791
Additions 30 –
Fair value gain recognised in profit or loss (Note 5) 4,515 1,258
Acquisition of subsidiaries (Note 14(a)(i)) 3,616 –
Disposal/write off (1,712) (414)
Reclassification from/(to) assets of disposal group classified as held-for-sale (Note 22) 16,656 (16,656)
Exchange difference (1,562) 1,277
At 31 December 46,799 25,256
Income statement:
Rental income from investment properties:
– Minimum lease payments 20 27
Direct operating expenses (including repairs and maintenance) arising from:
– Rental generating properties 7 27
The Group has no restrictions on the realisability of its investment properties and no contractual obligations to purchase, construct or develop investment property or for repairs, maintenance or enhancements.
Valuation of investment properties
Investment properties are stated at fair value, which has been determined based on valuations performed as at 31 December 2018, 31 December 2017 and 1 January 2017. The valuations were performed by independent valuers with recognised and relevant professional qualification and with recent experience in the location and category of the properties being valued. Details of valuation techniques and inputs used are disclosed in Note 34.
The investment properties held by the Group as at 31 December 2018 are as follows:
Description and Location Existing Use Tenure Unexpired lease term
Residential houses in Palembang, Indonesia Residential Leasehold 1 – 25 years
Lands in Palembang, Indonesia Vacant land Leasehold 1 – 16 years
Offices in Palembang, Indonesia Offices Leasehold 1 – 15 years
Shophouses in Medan, Indonesia Shophouse Leasehold 3 years
Offices in Medan, Indonesia Offices Leasehold 4 years
Shophouse in Jakarta, Indonesia Shophouse Leasehold 4 years
Residential house in Banjarmasin, Indonesia Residential Leasehold 11 years
Shophouse in Jambi, Indonesia Shophouse Leasehold 20 years
Land in Pontianak, Indonesia Vacant land Leasehold 18 – 19 years
Shophouse in Rantau, Indonesia Shophouse Leasehold 13 years
Land in Riau, Indonesia Vacant land Leasehold 4 years
Shophouse in Riau, Indonesia Shophouse Leasehold 16 years
Commercial offices in Hainan, China Commercial office Leasehold 18 – 19 years
Shophouses in Pontianak, Indonesia Shophouse Leasehold 4 – 8 years
Land in Songkhla, Thailand Vacant land Freehold –
Land in Pattani, Thailand Vacant land Freehold –
Residential houses and offices in Pattani, Thailand House and office Freehold –
Land and building in Chantaburi, Thailand Vacant land Freehold –
Land and building in Nakornsri, Thailand Vacant land Freehold –
Factory buildings in Nakornsri, Thailand Vacant factory Freehold –
Land in Krabi, Thailand Vacant land Freehold –
Land in Trang, Thailand Vacant land Freehold –
Residential houses in Trang, Thailand Residential Freehold –
Land in Yala, Thailand Vacant land Freehold –
Land in Narathiwas, Thailand Vacant land Freehold –
Residential houses and offices in Narathiwas, Thailand House and office Freehold –
Notes to the Financial Statements For the financial year ended 31 December 2018
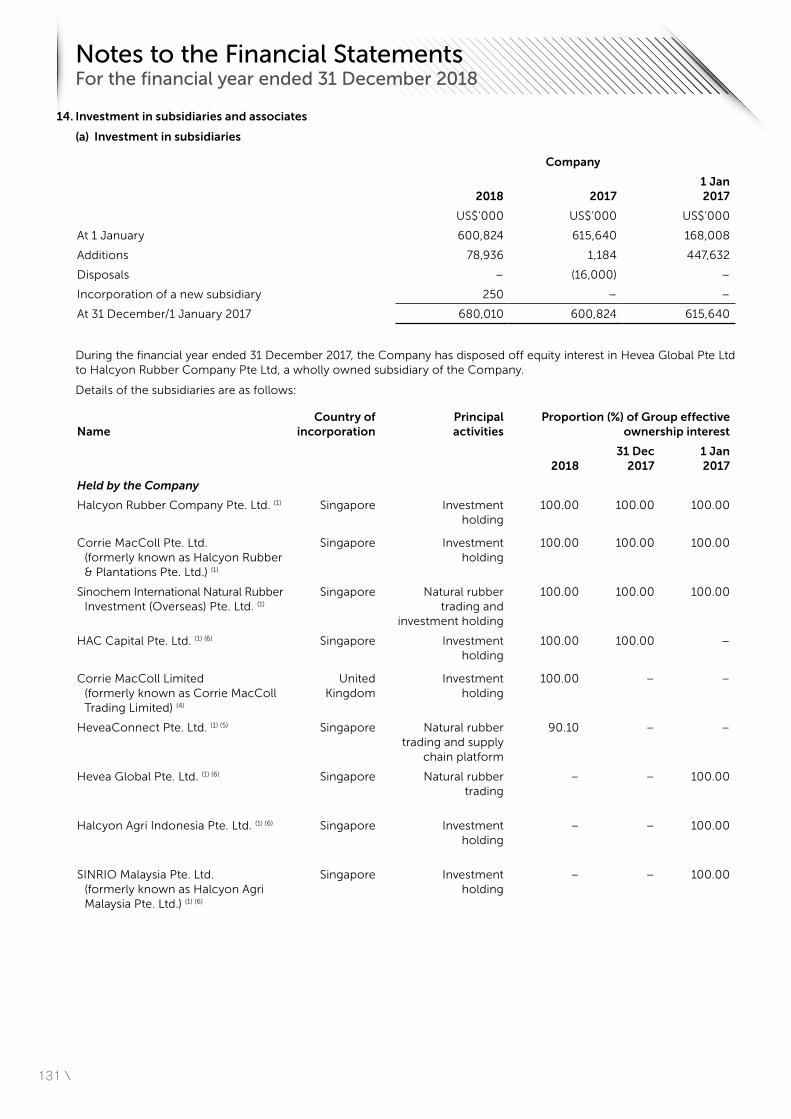
131 \
14. Investment in subsidiaries and associates
(a) Investment in subsidiaries
Company
2018
20171 Jan 2017
US$’000 US$’000 US$’000
At 1 January 600,824 615,640 168,008
Additions 78,936 1,184 447,632
Disposals – (16,000) –
Incorporation of a new subsidiary 250 – –
At 31 December/1 January 2017 680,010 600,824 615,640
During the financial year ended 31 December 2017, the Company has disposed off equity interest in Hevea Global Pte Ltd to Halcyon Rubber Company Pte Ltd, a wholly owned subsidiary of the Company.
Details of the subsidiaries are as follows:
NameCountry of
incorporationPrincipal activities
Proportion (%) of Group effective ownership interest
201831 Dec
20171 Jan 2017
Held by the Company
Halcyon Rubber Company Pte. Ltd. (1) Singapore Investment holding
100.00 100.00 100.00
Corrie MacColl Pte. Ltd. (formerly known as Halcyon Rubber & Plantations Pte. Ltd.) (1)
Singapore Investment holding
100.00 100.00 100.00
Sinochem International Natural Rubber Investment (Overseas) Pte. Ltd. (1)
Singapore Natural rubber trading and
investment holding
100.00 100.00 100.00
HAC Capital Pte. Ltd. (1) (6) Singapore Investment holding
100.00 100.00 –
Corrie MacColl Limited (formerly known as Corrie MacColl Trading Limited) (4)
United Kingdom
Investment holding
100.00 – –
HeveaConnect Pte. Ltd. (1) (5) Singapore Natural rubber trading and supply
chain platform
90.10 – –
Hevea Global Pte. Ltd. (1) (6) Singapore Natural rubber trading
– – 100.00
Halcyon Agri Indonesia Pte. Ltd. (1) (6) Singapore Investment holding
– – 100.00
SINRIO Malaysia Pte. Ltd. (formerly known as Halcyon Agri Malaysia Pte. Ltd.) (1) (6)
Singapore Investment holding
– – 100.00
Notes to the Financial Statements For the financial year ended 31 December 2018
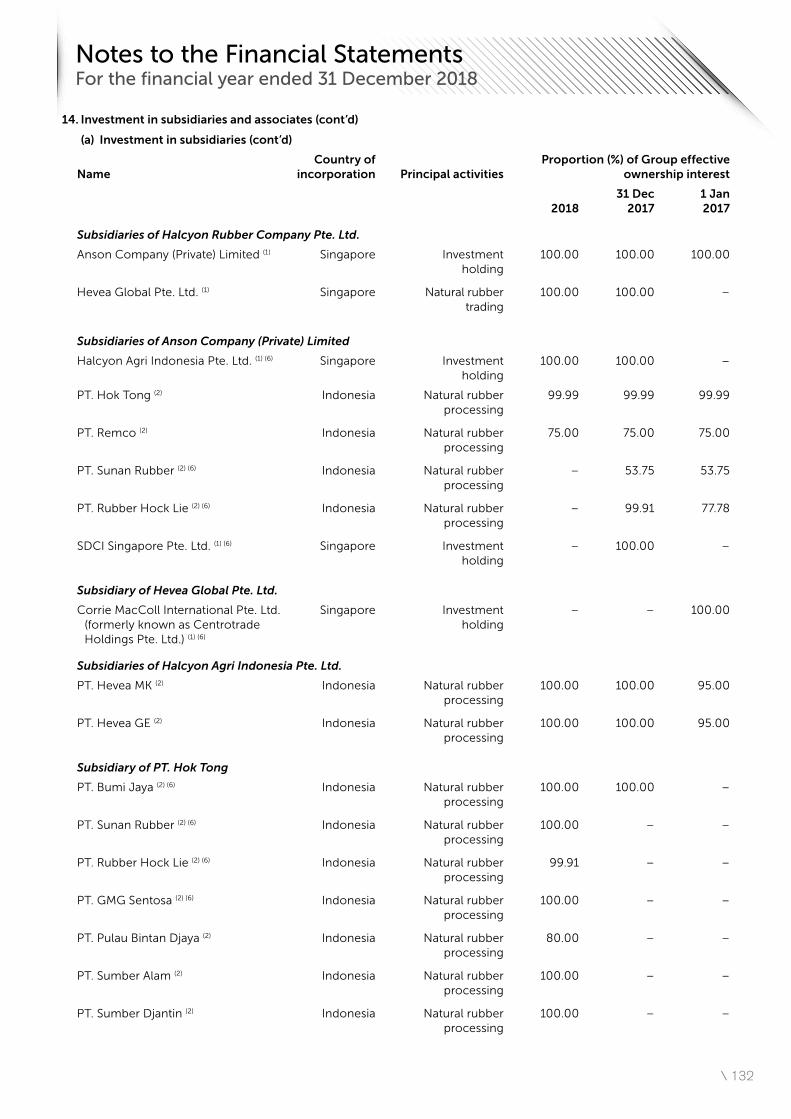
\ 132
14. Investment in subsidiaries and associates (cont’d)
(a) Investment in subsidiaries (cont’d)
NameCountry of
incorporation Principal activitiesProportion (%) of Group effective
ownership interest
201831 Dec
20171 Jan 2017
Subsidiaries of Halcyon Rubber Company Pte. Ltd.
Anson Company (Private) Limited (1) Singapore Investment holding
100.00 100.00 100.00
Hevea Global Pte. Ltd. (1) Singapore Natural rubber trading
100.00 100.00 –
Subsidiaries of Anson Company (Private) Limited
Halcyon Agri Indonesia Pte. Ltd. (1) (6) Singapore Investment holding
100.00 100.00 –
PT. Hok Tong (2) Indonesia Natural rubber processing
99.99 99.99 99.99
PT. Remco (2) Indonesia Natural rubber processing
75.00 75.00 75.00
PT. Sunan Rubber (2) (6) Indonesia Natural rubber processing
– 53.75 53.75
PT. Rubber Hock Lie (2) (6) Indonesia Natural rubber processing
– 99.91 77.78
SDCI Singapore Pte. Ltd. (1) (6) Singapore Investment holding
– 100.00 –
Subsidiary of Hevea Global Pte. Ltd.
Corrie MacColl International Pte. Ltd. (formerly known as Centrotrade Holdings Pte. Ltd.) (1) (6)
Singapore Investment holding
– – 100.00
Subsidiaries of Halcyon Agri Indonesia Pte. Ltd.
PT. Hevea MK (2) Indonesia Natural rubber processing
100.00 100.00 95.00
PT. Hevea GE (2) Indonesia Natural rubber processing
100.00 100.00 95.00
Subsidiary of PT. Hok Tong
PT. Bumi Jaya (2) (6) Indonesia Natural rubber processing
100.00 100.00 –
PT. Sunan Rubber (2) (6) Indonesia Natural rubber processing
100.00 – –
PT. Rubber Hock Lie (2) (6) Indonesia Natural rubber processing
99.91 – –
PT. GMG Sentosa (2) (6) Indonesia Natural rubber processing
100.00 – –
PT. Pulau Bintan Djaya (2) Indonesia Natural rubber processing
80.00 – –
PT. Sumber Alam (2) Indonesia Natural rubber processing
100.00 – –
PT. Sumber Djantin (2) Indonesia Natural rubber processing
100.00 – –
Notes to the Financial Statements For the financial year ended 31 December 2018
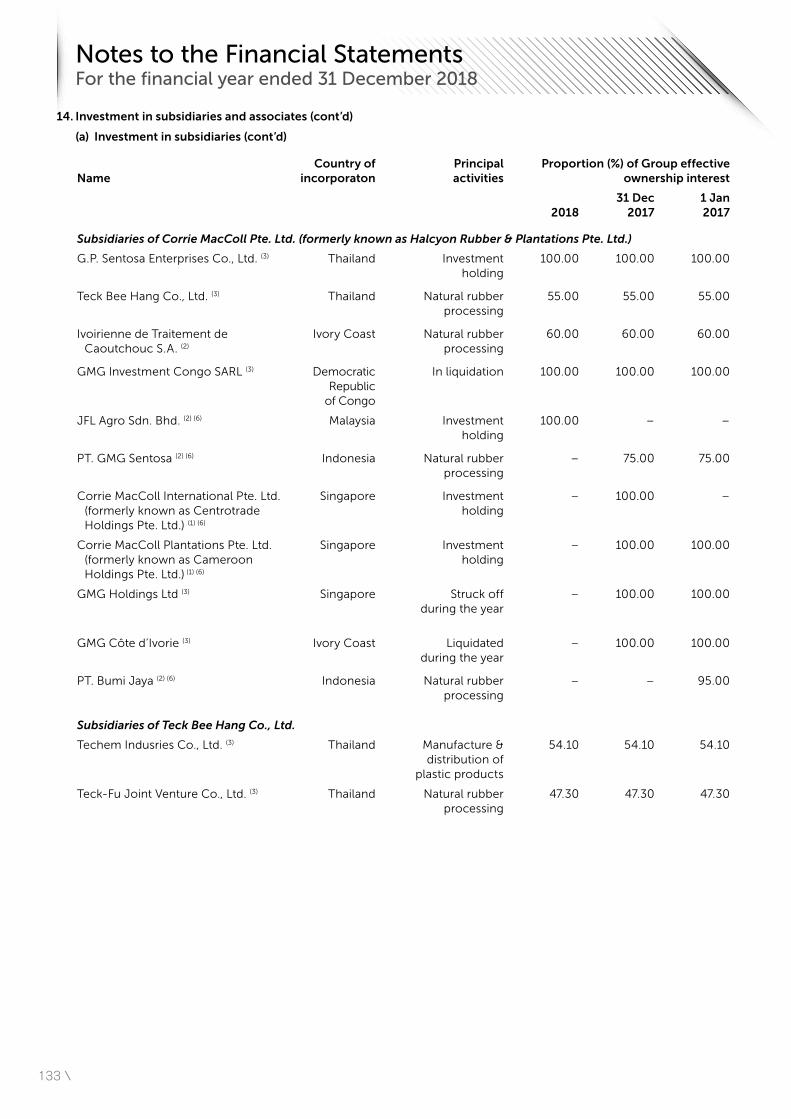
133 \
14. Investment in subsidiaries and associates (cont’d)
(a) Investment in subsidiaries (cont’d)
NameCountry of
incorporatonPrincipal activities
Proportion (%) of Group effective ownership interest
201831 Dec
20171 Jan 2017
Subsidiaries of Corrie MacColl Pte. Ltd. (formerly known as Halcyon Rubber & Plantations Pte. Ltd.)
G.P. Sentosa Enterprises Co., Ltd. (3) Thailand Investment holding
100.00 100.00 100.00
Teck Bee Hang Co., Ltd. (3) Thailand Natural rubber processing
55.00 55.00 55.00
Ivoirienne de Traitement de Caoutchouc S.A. (2)
Ivory Coast Natural rubber processing
60.00 60.00 60.00
GMG Investment Congo SARL (3) Democratic Republic
of Congo
In liquidation 100.00 100.00 100.00
JFL Agro Sdn. Bhd. (2) (6) Malaysia Investment holding
100.00 – –
PT. GMG Sentosa (2) (6) Indonesia Natural rubber processing
– 75.00 75.00
Corrie MacColl International Pte. Ltd. (formerly known as Centrotrade Holdings Pte. Ltd.) (1) (6)
Singapore Investment holding
– 100.00 –
Corrie MacColl Plantations Pte. Ltd. (formerly known as Cameroon Holdings Pte. Ltd.) (1) (6)
Singapore Investment holding
– 100.00 100.00
GMG Holdings Ltd (3) Singapore Struck off during the year
– 100.00 100.00
GMG Côte d’Ivorie (3) Ivory Coast Liquidated during the year
– 100.00 100.00
PT. Bumi Jaya (2) (6) Indonesia Natural rubber processing
– – 95.00
Subsidiaries of Teck Bee Hang Co., Ltd.
Techem Indusries Co., Ltd. (3) Thailand Manufacture & distribution of
plastic products
54.10 54.10 54.10
Teck-Fu Joint Venture Co., Ltd. (3) Thailand Natural rubber processing
47.30 47.30 47.30
Notes to the Financial Statements For the financial year ended 31 December 2018
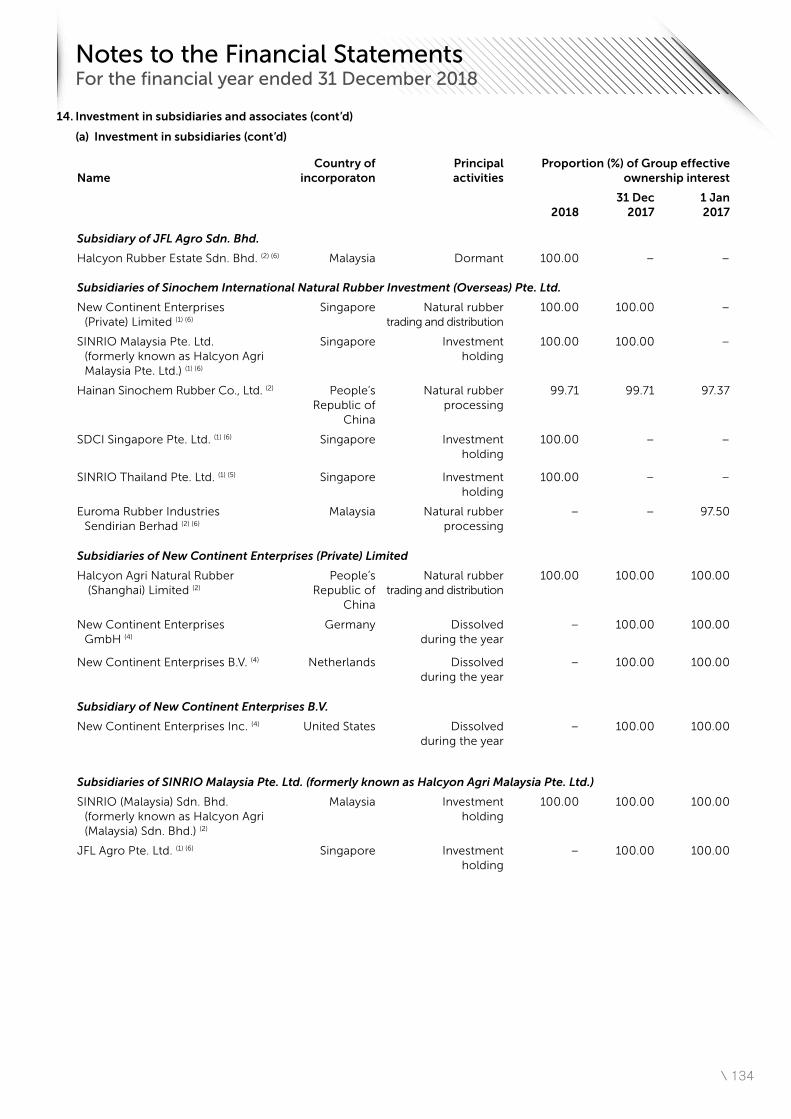
\ 134
14. Investment in subsidiaries and associates (cont’d)
(a) Investment in subsidiaries (cont’d)
NameCountry of
incorporatonPrincipal activities
Proportion (%) of Group effective ownership interest
201831 Dec
20171 Jan 2017
Subsidiary of JFL Agro Sdn. Bhd.
Halcyon Rubber Estate Sdn. Bhd. (2) (6) Malaysia Dormant 100.00 – –
Subsidiaries of Sinochem International Natural Rubber Investment (Overseas) Pte. Ltd.
New Continent Enterprises (Private) Limited (1) (6)
Singapore Natural rubber trading and distribution
100.00 100.00 –
SINRIO Malaysia Pte. Ltd. (formerly known as Halcyon Agri Malaysia Pte. Ltd.) (1) (6)
Singapore Investment holding
100.00 100.00 –
Hainan Sinochem Rubber Co., Ltd. (2) People’s Republic of
China
Natural rubber processing
99.71 99.71 97.37
SDCI Singapore Pte. Ltd. (1) (6) Singapore Investment holding
100.00 – –
SINRIO Thailand Pte. Ltd. (1) (5) Singapore Investment holding
100.00 – –
Euroma Rubber Industries Sendirian Berhad (2) (6)
Malaysia Natural rubber processing
– – 97.50
Subsidiaries of New Continent Enterprises (Private) Limited
Halcyon Agri Natural Rubber (Shanghai) Limited (2)
People’s Republic of
China
Natural rubber trading and distribution
100.00 100.00 100.00
New Continent Enterprises GmbH (4)
Germany Dissolved during the year
– 100.00 100.00
New Continent Enterprises B.V. (4) Netherlands Dissolved during the year
– 100.00 100.00
Subsidiary of New Continent Enterprises B.V.
New Continent Enterprises Inc. (4) United States Dissolved during the year
– 100.00 100.00
Subsidiaries of SINRIO Malaysia Pte. Ltd. (formerly known as Halcyon Agri Malaysia Pte. Ltd.)
SINRIO (Malaysia) Sdn. Bhd. (formerly known as Halcyon Agri (Malaysia) Sdn. Bhd.) (2)
Malaysia Investment holding
100.00 100.00 100.00
JFL Agro Pte. Ltd. (1) (6) Singapore Investment holding
– 100.00 100.00
Notes to the Financial Statements For the financial year ended 31 December 2018
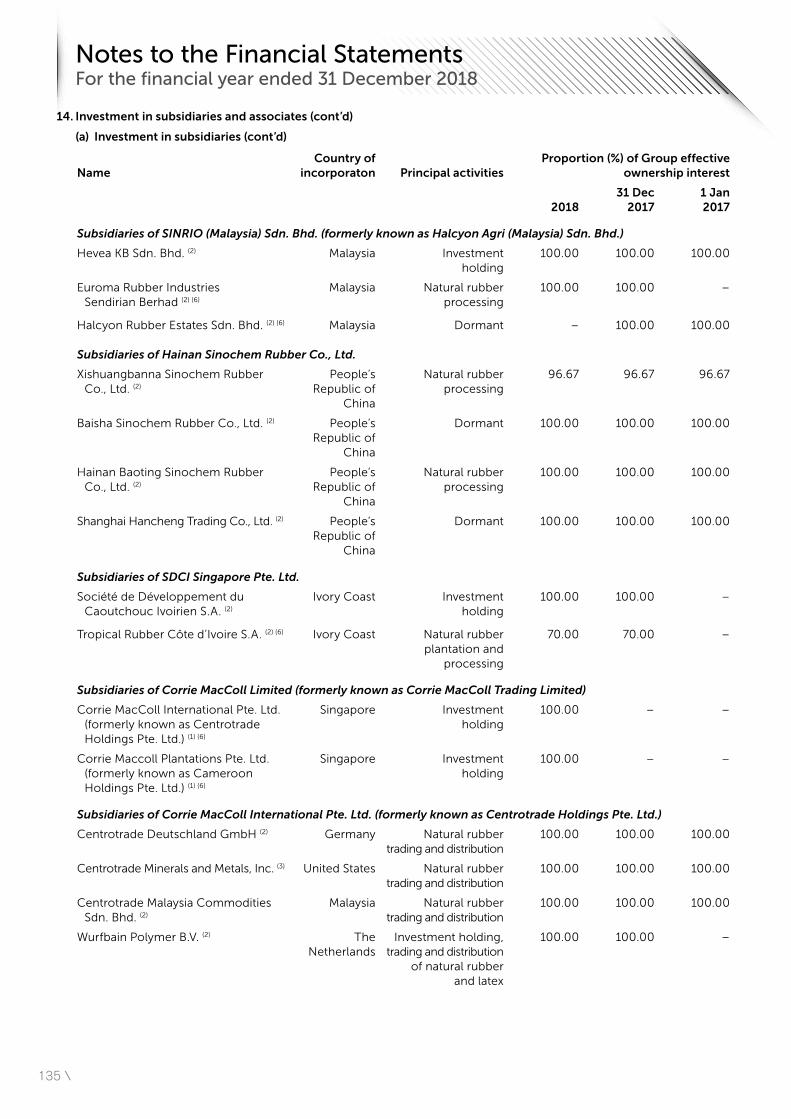
135 \
NameCountry of
incorporaton Principal activitiesProportion (%) of Group effective
ownership interest
201831 Dec
20171 Jan 2017
Subsidiaries of SINRIO (Malaysia) Sdn. Bhd. (formerly known as Halcyon Agri (Malaysia) Sdn. Bhd.)
Hevea KB Sdn. Bhd. (2) Malaysia Investment holding
100.00 100.00 100.00
Euroma Rubber Industries Sendirian Berhad (2) (6)
Malaysia Natural rubber processing
100.00 100.00 –
Halcyon Rubber Estates Sdn. Bhd. (2) (6) Malaysia Dormant – 100.00 100.00
Subsidiaries of Hainan Sinochem Rubber Co., Ltd.
Xishuangbanna Sinochem Rubber Co., Ltd. (2)
People’s Republic of
China
Natural rubber processing
96.67 96.67 96.67
Baisha Sinochem Rubber Co., Ltd. (2) People’s Republic of
China
Dormant 100.00 100.00 100.00
Hainan Baoting Sinochem Rubber Co., Ltd. (2)
People’s Republic of
China
Natural rubber processing
100.00 100.00 100.00
Shanghai Hancheng Trading Co., Ltd. (2) People’s Republic of
China
Dormant 100.00 100.00 100.00
Subsidiaries of SDCI Singapore Pte. Ltd.
Société de Développement du Caoutchouc Ivoirien S.A. (2)
Ivory Coast Investment holding
100.00 100.00 –
Tropical Rubber Côte d’Ivoire S.A. (2) (6) Ivory Coast Natural rubber plantation and
processing
70.00 70.00 –
Subsidiaries of Corrie MacColl Limited (formerly known as Corrie MacColl Trading Limited)
Corrie MacColl International Pte. Ltd. (formerly known as Centrotrade Holdings Pte. Ltd.) (1) (6)
Singapore Investment holding
100.00 – –
Corrie Maccoll Plantations Pte. Ltd. (formerly known as Cameroon Holdings Pte. Ltd.) (1) (6)
Singapore Investment holding
100.00 – –
Subsidiaries of Corrie MacColl International Pte. Ltd. (formerly known as Centrotrade Holdings Pte. Ltd.)
Centrotrade Deutschland GmbH (2) Germany Natural rubber trading and distribution
100.00 100.00 100.00
Centrotrade Minerals and Metals, Inc. (3) United States Natural rubber trading and distribution
100.00 100.00 100.00
Centrotrade Malaysia Commodities Sdn. Bhd. (2)
Malaysia Natural rubber trading and distribution
100.00 100.00 100.00
Wurfbain Polymer B.V. (2) The Netherlands
Investment holding, trading and distribution
of natural rubber and latex
100.00 100.00 –
14. Investment in subsidiaries and associates (cont’d)
(a) Investment in subsidiaries (cont’d)
Notes to the Financial Statements For the financial year ended 31 December 2018
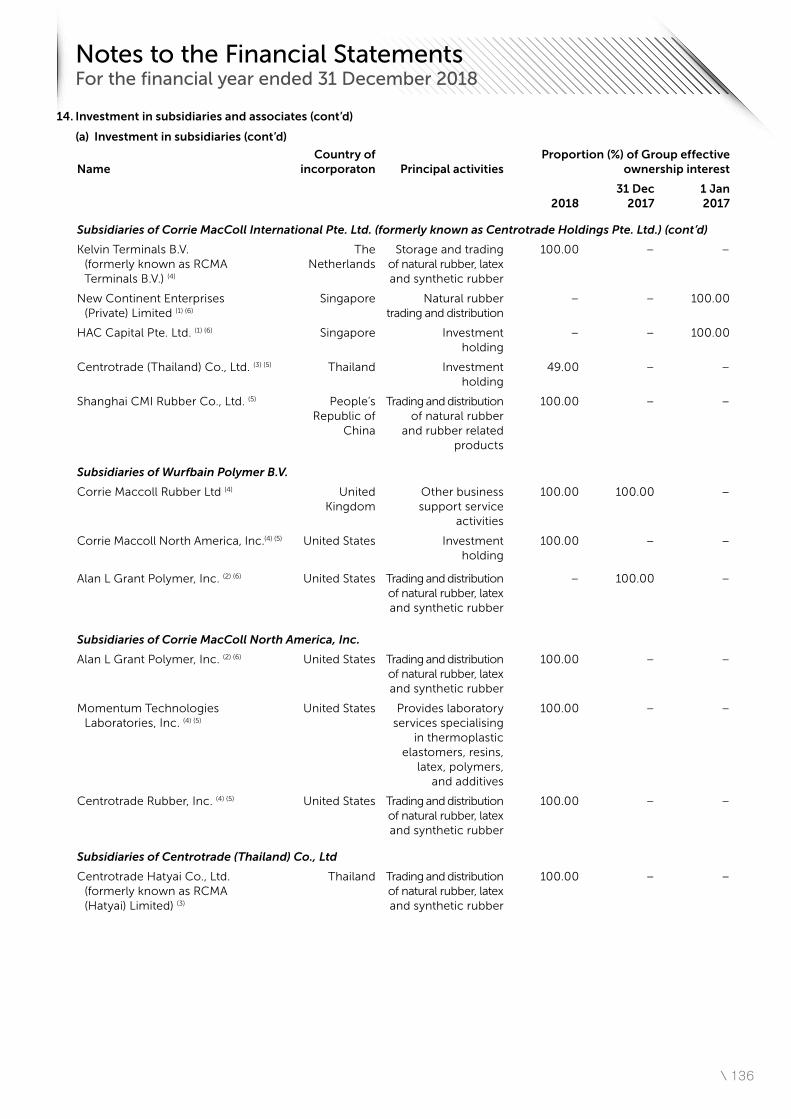
\ 136
NameCountry of
incorporaton Principal activitiesProportion (%) of Group effective
ownership interest
201831 Dec
20171 Jan 2017
Subsidiaries of Corrie MacColl International Pte. Ltd. (formerly known as Centrotrade Holdings Pte. Ltd.) (cont’d)
Kelvin Terminals B.V. (formerly known as RCMA Terminals B.V.) (4)
The Netherlands
Storage and trading of natural rubber, latex and synthetic rubber
100.00 – –
New Continent Enterprises (Private) Limited (1) (6)
Singapore Natural rubber trading and distribution
– – 100.00
HAC Capital Pte. Ltd. (1) (6) Singapore Investment holding
– – 100.00
Centrotrade (Thailand) Co., Ltd. (3) (5) Thailand Investment holding
49.00 – –
Shanghai CMI Rubber Co., Ltd. (5) People’s Republic of
China
Trading and distribution of natural rubber
and rubber related products
100.00 – –
Subsidiaries of Wurfbain Polymer B.V.
Corrie Maccoll Rubber Ltd (4) United Kingdom
Other business support service
activities
100.00 100.00 –
Corrie Maccoll North America, Inc.(4) (5) United States Investment holding
100.00 – –
Alan L Grant Polymer, Inc. (2) (6) United States Trading and distribution of natural rubber, latex and synthetic rubber
– 100.00 –
Subsidiaries of Corrie MacColl North America, Inc.
Alan L Grant Polymer, Inc. (2) (6) United States Trading and distribution of natural rubber, latex and synthetic rubber
100.00 – –
Momentum Technologies Laboratories, Inc. (4) (5)
United States Provides laboratory services specialising
in thermoplastic elastomers, resins,
latex, polymers, and additives
100.00 – –
Centrotrade Rubber, Inc. (4) (5) United States Trading and distribution of natural rubber, latex and synthetic rubber
100.00 – –
Subsidiaries of Centrotrade (Thailand) Co., Ltd
Centrotrade Hatyai Co., Ltd. (formerly known as RCMA (Hatyai) Limited) (3)
Thailand Trading and distribution of natural rubber, latex and synthetic rubber
100.00 – –
14. Investment in subsidiaries and associates (cont’d)
(a) Investment in subsidiaries (cont’d)
Notes to the Financial Statements For the financial year ended 31 December 2018
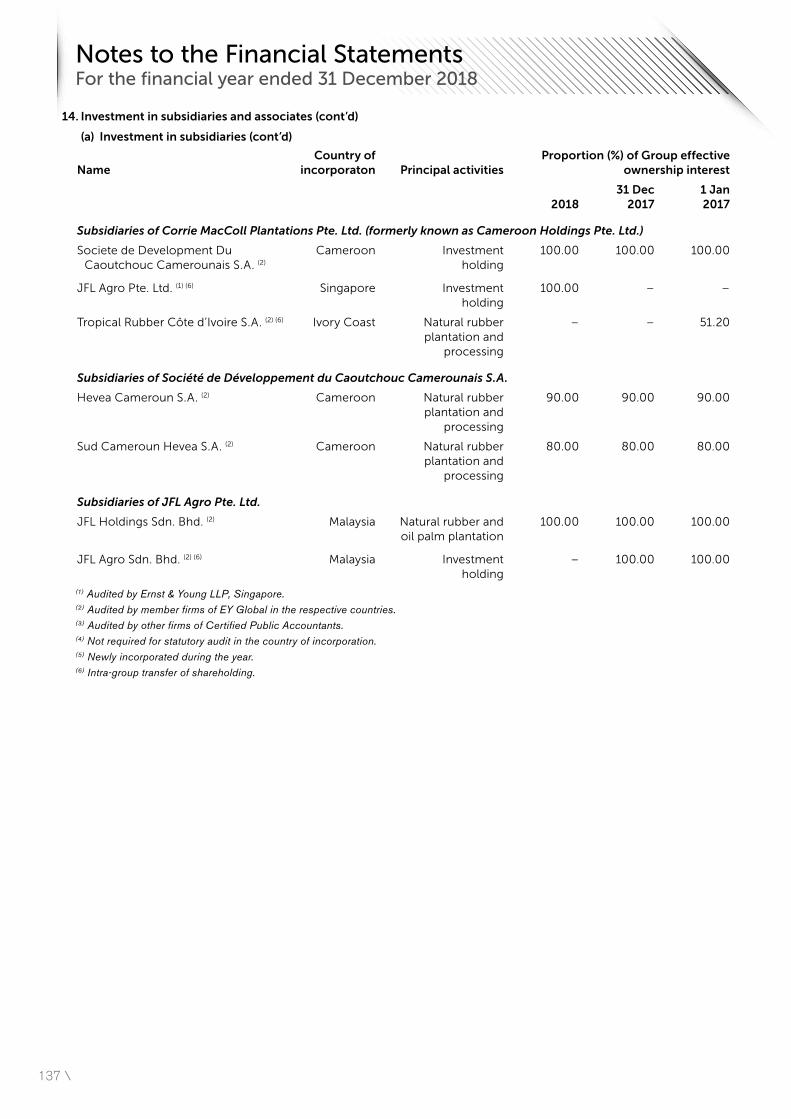
137 \
14. Investment in subsidiaries and associates (cont’d)
(a) Investment in subsidiaries (cont’d)
NameCountry of
incorporaton Principal activitiesProportion (%) of Group effective
ownership interest
201831 Dec
20171 Jan 2017
Subsidiaries of Corrie MacColl Plantations Pte. Ltd. (formerly known as Cameroon Holdings Pte. Ltd.)
Societe de Development Du Caoutchouc Camerounais S.A. (2)
Cameroon Investment holding
100.00 100.00 100.00
JFL Agro Pte. Ltd. (1) (6) Singapore Investment holding
100.00 – –
Tropical Rubber Côte d’Ivoire S.A. (2) (6) Ivory Coast Natural rubber plantation and
processing
– – 51.20
Subsidiaries of Société de Développement du Caoutchouc Camerounais S.A.
Hevea Cameroun S.A. (2) Cameroon Natural rubber plantation and
processing
90.00 90.00 90.00
Sud Cameroun Hevea S.A. (2) Cameroon Natural rubber plantation and
processing
80.00 80.00 80.00
Subsidiaries of JFL Agro Pte. Ltd.
JFL Holdings Sdn. Bhd. (2) Malaysia Natural rubber and oil palm plantation
100.00 100.00 100.00
JFL Agro Sdn. Bhd. (2) (6) Malaysia Investment holding
– 100.00 100.00
(1) Audited by Ernst & Young LLP, Singapore. (2) Audited by member firms of EY Global in the respective countries. (3) Audited by other firms of Certified Public Accountants. (4) Not required for statutory audit in the country of incorporation. (5) Newly incorporated during the year. (6) Intra-group transfer of shareholding.
Notes to the Financial Statements For the financial year ended 31 December 2018
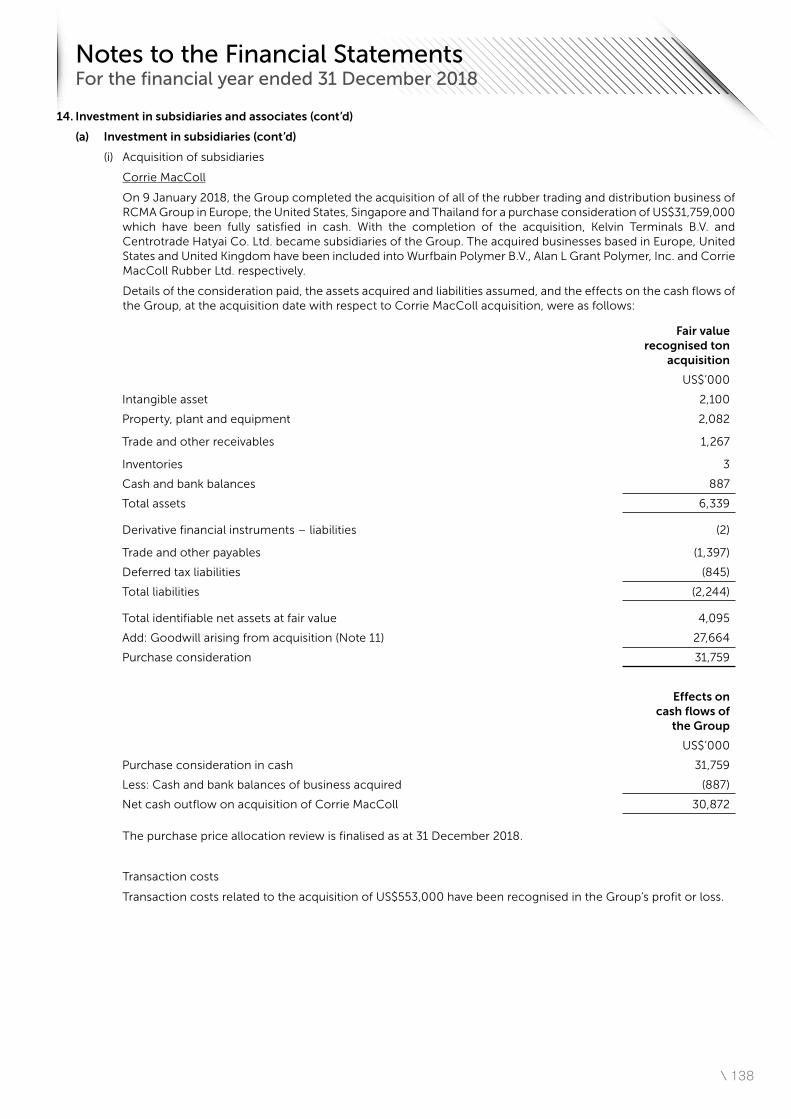
\ 138
14. Investment in subsidiaries and associates (cont’d)
(a) Investment in subsidiaries (cont’d)
(i) Acquisition of subsidiaries
Corrie MacColl
On 9 January 2018, the Group completed the acquisition of all of the rubber trading and distribution business of RCMA Group in Europe, the United States, Singapore and Thailand for a purchase consideration of US$31,759,000 which have been fully satisfied in cash. With the completion of the acquisition, Kelvin Terminals B.V. and Centrotrade Hatyai Co. Ltd. became subsidiaries of the Group. The acquired businesses based in Europe, United States and United Kingdom have been included into Wurfbain Polymer B.V., Alan L Grant Polymer, Inc. and Corrie MacColl Rubber Ltd. respectively.
Details of the consideration paid, the assets acquired and liabilities assumed, and the effects on the cash flows of the Group, at the acquisition date with respect to Corrie MacColl acquisition, were as follows:
Fair value recognised ton
acquisition
US$’000
Intangible asset 2,100
Property, plant and equipment 2,082
Trade and other receivables 1,267
Inventories 3
Cash and bank balances 887
Total assets 6,339
Derivative financial instruments – liabilities (2)
Trade and other payables (1,397)
Deferred tax liabilities (845)
Total liabilities (2,244)
Total identifiable net assets at fair value 4,095
Add: Goodwill arising from acquisition (Note 11) 27,664
Purchase consideration 31,759
Effects on cash flows of
the Group
US$’000
Purchase consideration in cash 31,759
Less: Cash and bank balances of business acquired (887)
Net cash outflow on acquisition of Corrie MacColl 30,872
The purchase price allocation review is finalised as at 31 December 2018.
Transaction costs
Transaction costs related to the acquisition of US$553,000 have been recognised in the Group’s profit or loss.
Notes to the Financial Statements For the financial year ended 31 December 2018
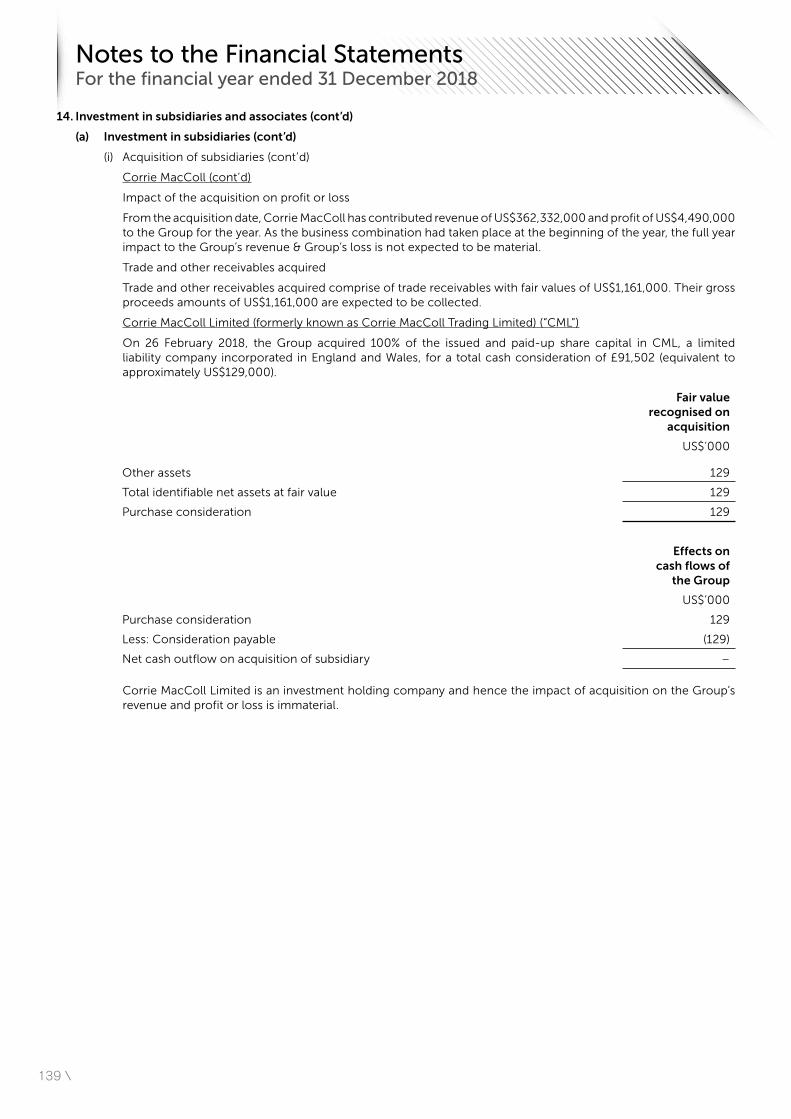
139 \
14. Investment in subsidiaries and associates (cont’d)
(a) Investment in subsidiaries (cont’d)
(i) Acquisition of subsidiaries (cont’d)
Corrie MacColl (cont’d)
Impact of the acquisition on profit or loss
From the acquisition date, Corrie MacColl has contributed revenue of US$362,332,000 and profit of US$4,490,000 to the Group for the year. As the business combination had taken place at the beginning of the year, the full year impact to the Group’s revenue & Group’s loss is not expected to be material.
Trade and other receivables acquired
Trade and other receivables acquired comprise of trade receivables with fair values of US$1,161,000. Their gross proceeds amounts of US$1,161,000 are expected to be collected.
Corrie MacColl Limited (formerly known as Corrie MacColl Trading Limited) (“CML”)
On 26 February 2018, the Group acquired 100% of the issued and paid-up share capital in CML, a limited liability company incorporated in England and Wales, for a total cash consideration of £91,502 (equivalent to approximately US$129,000).
Fair value recognised on
acquisition
US$’000
Other assets 129
Total identifiable net assets at fair value 129
Purchase consideration 129
Effects on cash flows of
the Group
US$’000
Purchase consideration 129
Less: Consideration payable (129)
Net cash outflow on acquisition of subsidiary –
Corrie MacColl Limited is an investment holding company and hence the impact of acquisition on the Group’s revenue and profit or loss is immaterial.
Notes to the Financial Statements For the financial year ended 31 December 2018
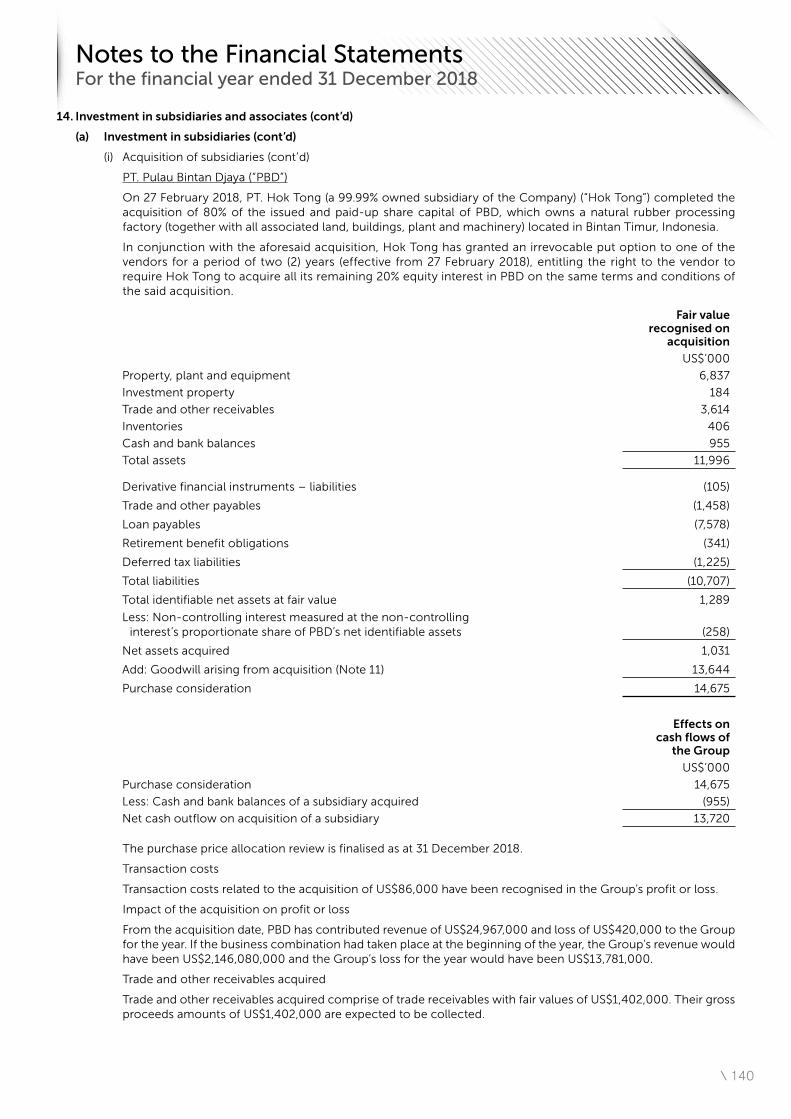
\ 140
14. Investment in subsidiaries and associates (cont’d)
(a) Investment in subsidiaries (cont’d)
(i) Acquisition of subsidiaries (cont’d)
PT. Pulau Bintan Djaya (“PBD”)
On 27 February 2018, PT. Hok Tong (a 99.99% owned subsidiary of the Company) (“Hok Tong”) completed the acquisition of 80% of the issued and paid-up share capital of PBD, which owns a natural rubber processing factory (together with all associated land, buildings, plant and machinery) located in Bintan Timur, Indonesia.
In conjunction with the aforesaid acquisition, Hok Tong has granted an irrevocable put option to one of the vendors for a period of two (2) years (effective from 27 February 2018), entitling the right to the vendor to require Hok Tong to acquire all its remaining 20% equity interest in PBD on the same terms and conditions of the said acquisition.
Fair value recognised on
acquisition
US$’000
Property, plant and equipment 6,837
Investment property 184
Trade and other receivables 3,614
Inventories 406
Cash and bank balances 955
Total assets 11,996
Derivative financial instruments – liabilities (105)
Trade and other payables (1,458)
Loan payables (7,578)
Retirement benefit obligations (341)
Deferred tax liabilities (1,225)
Total liabilities (10,707)
Total identifiable net assets at fair value 1,289
Less: Non-controlling interest measured at the non-controlling interest’s proportionate share of PBD’s net identifiable assets (258)
Net assets acquired 1,031
Add: Goodwill arising from acquisition (Note 11) 13,644
Purchase consideration 14,675
Effects on cash flows of
the Group
US$’000
Purchase consideration 14,675
Less: Cash and bank balances of a subsidiary acquired (955)
Net cash outflow on acquisition of a subsidiary 13,720
The purchase price allocation review is finalised as at 31 December 2018.
Transaction costs
Transaction costs related to the acquisition of US$86,000 have been recognised in the Group’s profit or loss.
Impact of the acquisition on profit or loss
From the acquisition date, PBD has contributed revenue of US$24,967,000 and loss of US$420,000 to the Group for the year. If the business combination had taken place at the beginning of the year, the Group’s revenue would have been US$2,146,080,000 and the Group’s loss for the year would have been US$13,781,000.
Trade and other receivables acquired
Trade and other receivables acquired comprise of trade receivables with fair values of US$1,402,000. Their gross proceeds amounts of US$1,402,000 are expected to be collected.
Notes to the Financial Statements For the financial year ended 31 December 2018
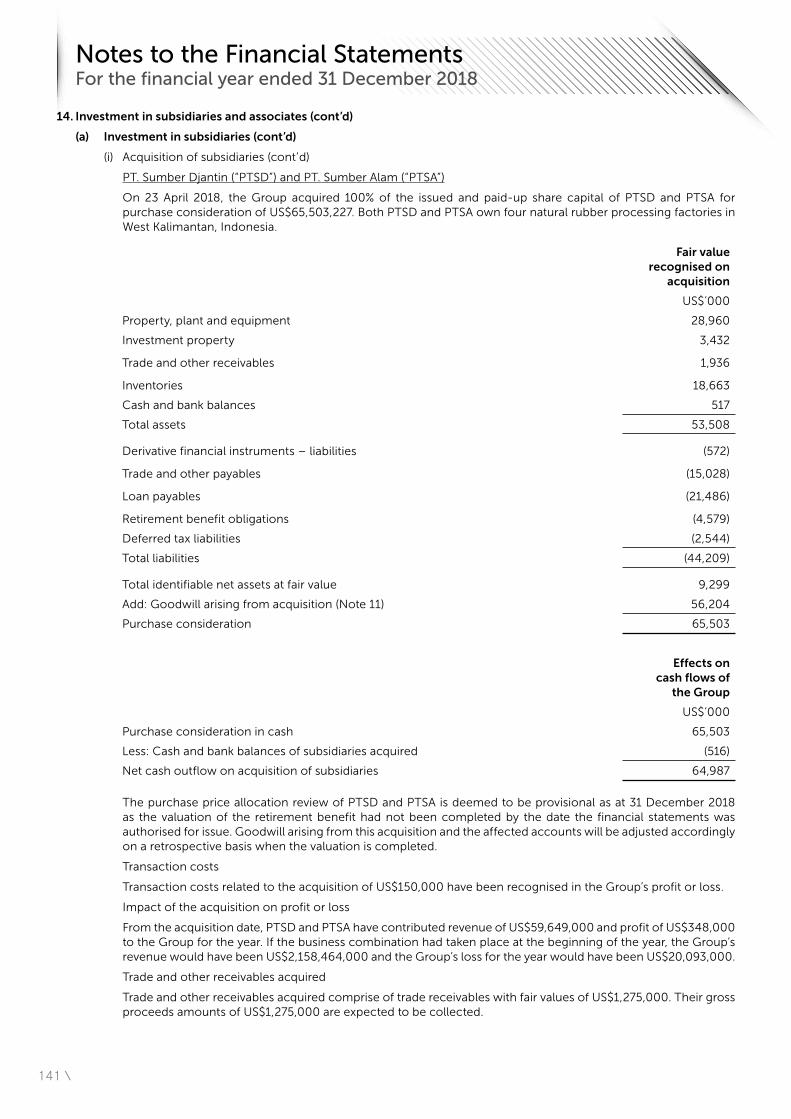
141 \
14. Investment in subsidiaries and associates (cont’d)
(a) Investment in subsidiaries (cont’d)
(i) Acquisition of subsidiaries (cont’d)
PT. Sumber Djantin (“PTSD”) and PT. Sumber Alam (“PTSA”)
On 23 April 2018, the Group acquired 100% of the issued and paid-up share capital of PTSD and PTSA for purchase consideration of US$65,503,227. Both PTSD and PTSA own four natural rubber processing factories in West Kalimantan, Indonesia.
Fair value recognised on
acquisition
US$’000
Property, plant and equipment 28,960
Investment property 3,432
Trade and other receivables 1,936
Inventories 18,663
Cash and bank balances 517
Total assets 53,508
Derivative financial instruments – liabilities (572)
Trade and other payables (15,028)
Loan payables (21,486)
Retirement benefit obligations (4,579)
Deferred tax liabilities (2,544)
Total liabilities (44,209)
Total identifiable net assets at fair value 9,299
Add: Goodwill arising from acquisition (Note 11) 56,204
Purchase consideration 65,503
Effects on cash flows of
the Group
US$’000
Purchase consideration in cash 65,503
Less: Cash and bank balances of subsidiaries acquired (516)
Net cash outflow on acquisition of subsidiaries 64,987
The purchase price allocation review of PTSD and PTSA is deemed to be provisional as at 31 December 2018 as the valuation of the retirement benefit had not been completed by the date the financial statements was authorised for issue. Goodwill arising from this acquisition and the affected accounts will be adjusted accordingly on a retrospective basis when the valuation is completed.
Transaction costs
Transaction costs related to the acquisition of US$150,000 have been recognised in the Group’s profit or loss.
Impact of the acquisition on profit or loss
From the acquisition date, PTSD and PTSA have contributed revenue of US$59,649,000 and profit of US$348,000 to the Group for the year. If the business combination had taken place at the beginning of the year, the Group’s revenue would have been US$2,158,464,000 and the Group’s loss for the year would have been US$20,093,000.
Trade and other receivables acquired
Trade and other receivables acquired comprise of trade receivables with fair values of US$1,275,000. Their gross proceeds amounts of US$1,275,000 are expected to be collected.
Notes to the Financial Statements For the financial year ended 31 December 2018
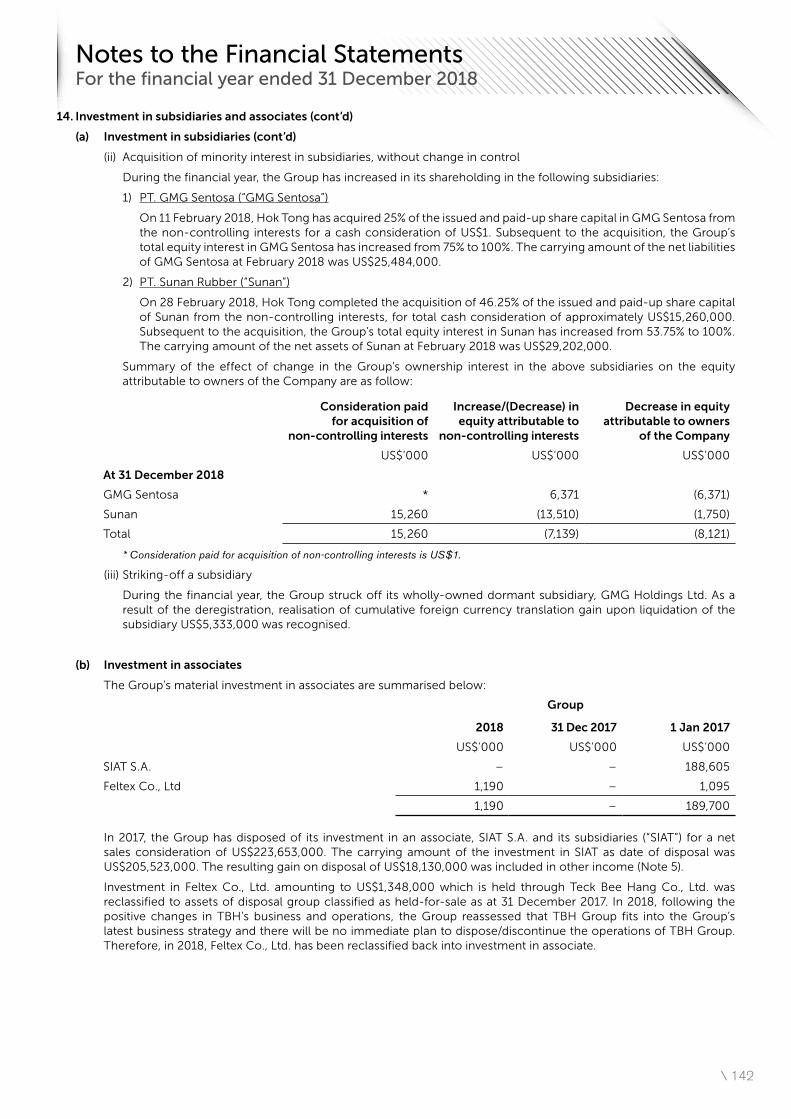
\ 142
14. Investment in subsidiaries and associates (cont’d)
(a) Investment in subsidiaries (cont’d)
(ii) Acquisition of minority interest in subsidiaries, without change in control
During the financial year, the Group has increased in its shareholding in the following subsidiaries:
1) PT. GMG Sentosa (“GMG Sentosa”)
On 11 February 2018, Hok Tong has acquired 25% of the issued and paid-up share capital in GMG Sentosa from the non-controlling interests for a cash consideration of US$1. Subsequent to the acquisition, the Group’s total equity interest in GMG Sentosa has increased from 75% to 100%. The carrying amount of the net liabilities of GMG Sentosa at February 2018 was US$25,484,000.
2) PT. Sunan Rubber (“Sunan”)
On 28 February 2018, Hok Tong completed the acquisition of 46.25% of the issued and paid-up share capital of Sunan from the non-controlling interests, for total cash consideration of approximately US$15,260,000. Subsequent to the acquisition, the Group’s total equity interest in Sunan has increased from 53.75% to 100%. The carrying amount of the net assets of Sunan at February 2018 was US$29,202,000.
Summary of the effect of change in the Group’s ownership interest in the above subsidiaries on the equity attributable to owners of the Company are as follow:
Consideration paid for acquisition of
non-controlling interests
Increase/(Decrease) in equity attributable to
non-controlling interests
Decrease in equity attributable to owners
of the Company
US$’000 US$’000 US$’000
At 31 December 2018
GMG Sentosa * 6,371 (6,371)
Sunan 15,260 (13,510) (1,750)
Total 15,260 (7,139) (8,121)
* Consideration paid for acquisition of non-controlling interests is US$1.
(iii) Striking-off a subsidiary
During the financial year, the Group struck off its wholly-owned dormant subsidiary, GMG Holdings Ltd. As a result of the deregistration, realisation of cumulative foreign currency translation gain upon liquidation of the subsidiary US$5,333,000 was recognised.
(b) Investment in associates
The Group’s material investment in associates are summarised below:
Group
2018 31 Dec 2017 1 Jan 2017
US$’000 US$’000 US$’000
SIAT S.A. – – 188,605
Feltex Co., Ltd 1,190 – 1,095
1,190 – 189,700
In 2017, the Group has disposed of its investment in an associate, SIAT S.A. and its subsidiaries (“SIAT”) for a net sales consideration of US$223,653,000. The carrying amount of the investment in SIAT as date of disposal was US$205,523,000. The resulting gain on disposal of US$18,130,000 was included in other income (Note 5).
Investment in Feltex Co., Ltd. amounting to US$1,348,000 which is held through Teck Bee Hang Co., Ltd. was reclassified to assets of disposal group classified as held-for-sale as at 31 December 2017. In 2018, following the positive changes in TBH’s business and operations, the Group reassessed that TBH Group fits into the Group’s latest business strategy and there will be no immediate plan to dispose/discontinue the operations of TBH Group. Therefore, in 2018, Feltex Co., Ltd. has been reclassified back into investment in associate.
Notes to the Financial Statements For the financial year ended 31 December 2018
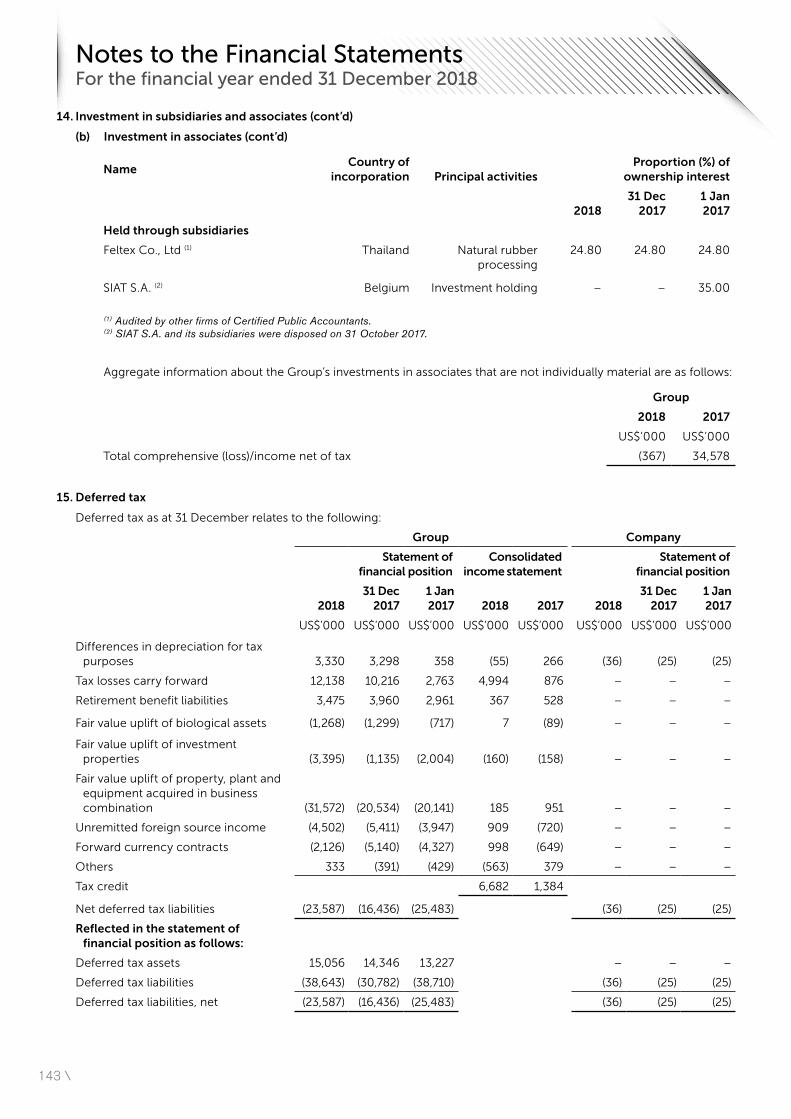
143 \
14. Investment in subsidiaries and associates (cont’d)
(b) Investment in associates (cont’d)
NameCountry of
incorporation Principal activitiesProportion (%) of
ownership interest
201831 Dec
20171 Jan 2017
Held through subsidiaries
Feltex Co., Ltd (1) Thailand Natural rubber processing
24.80 24.80 24.80
SIAT S.A. (2) Belgium Investment holding – – 35.00
(1) Audited by other firms of Certified Public Accountants. (2) SIAT S.A. and its subsidiaries were disposed on 31 October 2017.
Aggregate information about the Group’s investments in associates that are not individually material are as follows:
Group
2018 2017
US$’000 US$’000
Total comprehensive (loss)/income net of tax (367) 34,578
15. Deferred tax
Deferred tax as at 31 December relates to the following:
Group Company
Statement of financial position
Consolidated income statement
Statement of financial position
201831 Dec
20171 Jan 2017 2018 2017 2018
31 Dec 2017
1 Jan 2017
US$’000 US$’000 US$’000 US$’000 US$’000 US$’000 US$’000 US$’000
Differences in depreciation for tax purposes 3,330 3,298 358 (55) 266 (36) (25) (25)
Tax losses carry forward 12,138 10,216 2,763 4,994 876 – – –
Retirement benefit liabilities 3,475 3,960 2,961 367 528 – – –
Fair value uplift of biological assets (1,268) (1,299) (717) 7 (89) – – –
Fair value uplift of investment properties (3,395) (1,135) (2,004) (160) (158) – – –
Fair value uplift of property, plant and equipment acquired in business combination (31,572) (20,534) (20,141) 185 951 – – –
Unremitted foreign source income (4,502) (5,411) (3,947) 909 (720) – – –
Forward currency contracts (2,126) (5,140) (4,327) 998 (649) – – –
Others 333 (391) (429) (563) 379 – – –
Tax credit 6,682 1,384
Net deferred tax liabilities (23,587) (16,436) (25,483) (36) (25) (25)
Reflected in the statement of financial position as follows:
Deferred tax assets 15,056 14,346 13,227 – – –
Deferred tax liabilities (38,643) (30,782) (38,710) (36) (25) (25)
Deferred tax liabilities, net (23,587) (16,436) (25,483) (36) (25) (25)
Notes to the Financial Statements For the financial year ended 31 December 2018
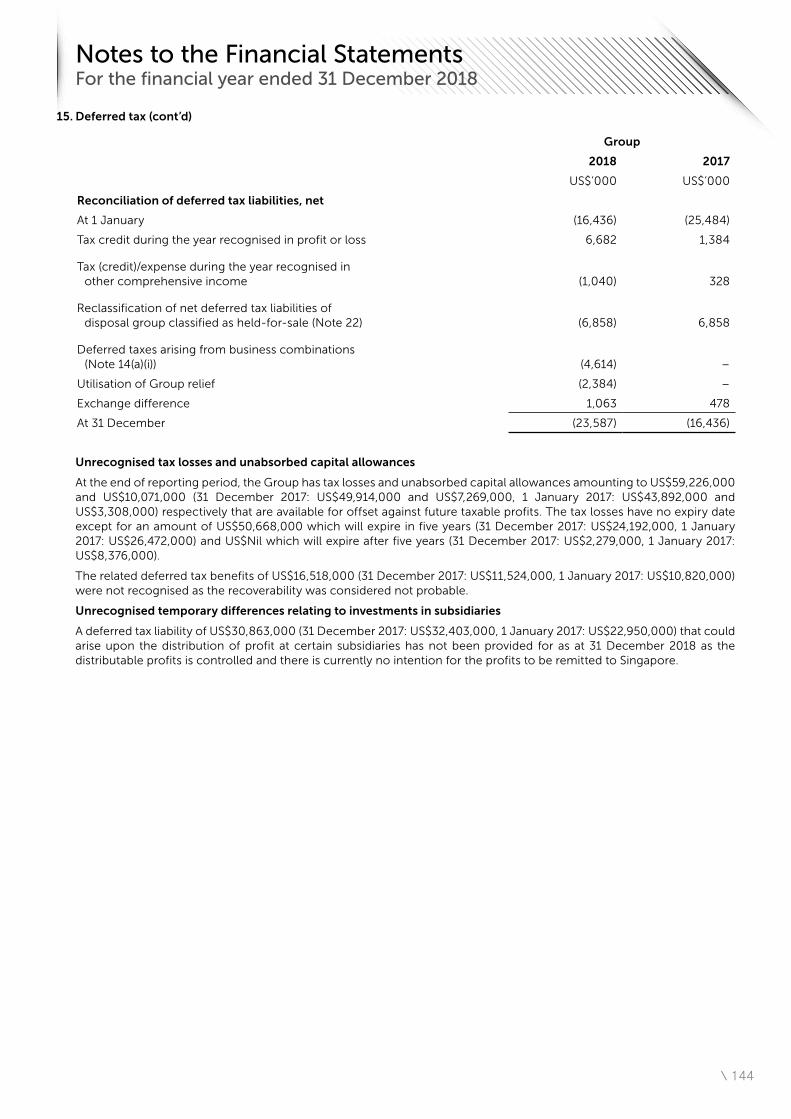
\ 144
15. Deferred tax (cont’d)
Group
2018 2017
US$’000 US$’000
Reconciliation of deferred tax liabilities, net
At 1 January (16,436) (25,484)
Tax credit during the year recognised in profit or loss 6,682 1,384
Tax (credit)/expense during the year recognised in other comprehensive income (1,040) 328
Reclassification of net deferred tax liabilities of disposal group classified as held-for-sale (Note 22) (6,858) 6,858
Deferred taxes arising from business combinations (Note 14(a)(i)) (4,614) –
Utilisation of Group relief (2,384) –
Exchange difference 1,063 478
At 31 December (23,587) (16,436)
Unrecognised tax losses and unabsorbed capital allowances
At the end of reporting period, the Group has tax losses and unabsorbed capital allowances amounting to US$59,226,000 and US$10,071,000 (31 December 2017: US$49,914,000 and US$7,269,000, 1 January 2017: US$43,892,000 and US$3,308,000) respectively that are available for offset against future taxable profits. The tax losses have no expiry date except for an amount of US$50,668,000 which will expire in five years (31 December 2017: US$24,192,000, 1 January 2017: US$26,472,000) and US$Nil which will expire after five years (31 December 2017: US$2,279,000, 1 January 2017: US$8,376,000).
The related deferred tax benefits of US$16,518,000 (31 December 2017: US$11,524,000, 1 January 2017: US$10,820,000) were not recognised as the recoverability was considered not probable.
Unrecognised temporary differences relating to investments in subsidiaries
A deferred tax liability of US$30,863,000 (31 December 2017: US$32,403,000, 1 January 2017: US$22,950,000) that could arise upon the distribution of profit at certain subsidiaries has not been provided for as at 31 December 2018 as the distributable profits is controlled and there is currently no intention for the profits to be remitted to Singapore.
Notes to the Financial Statements For the financial year ended 31 December 2018
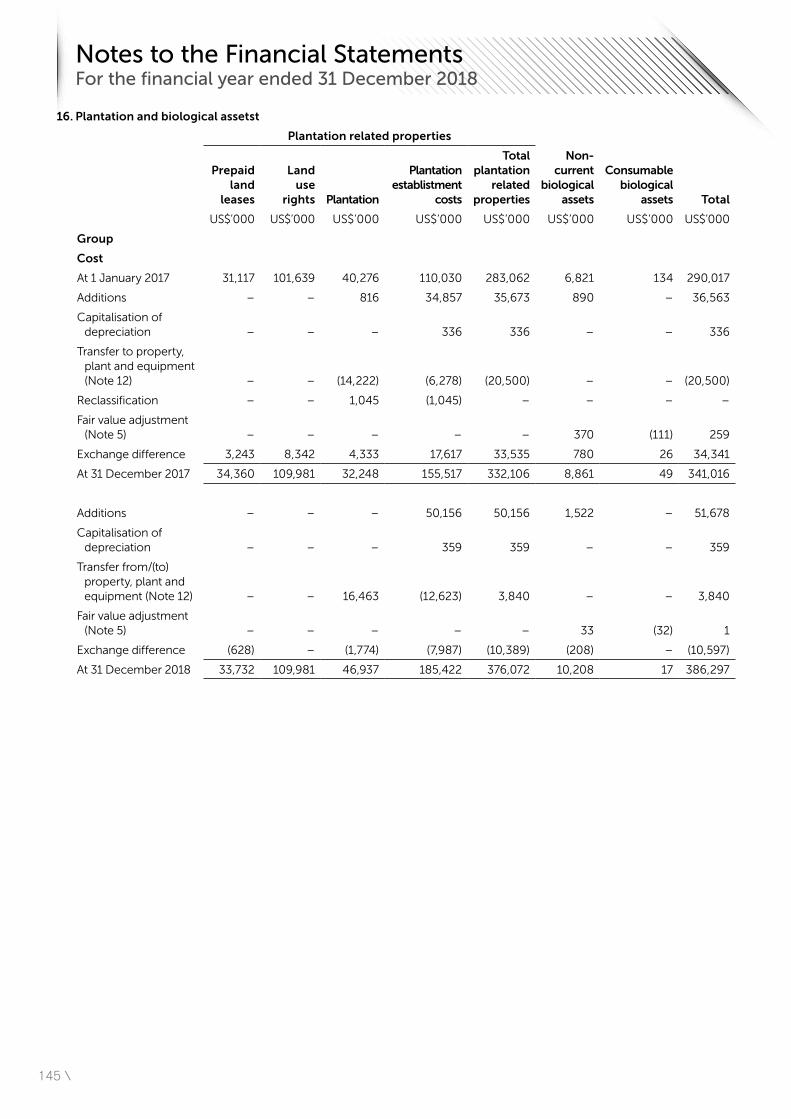
145 \
16. Plantation and biological assetst
Plantation related properties
Prepaid land
leases
Land use
rights Plantation
Plantation establistment
costs
Total plantation
related properties
Non-current
biological assets
Consumable biological
assets Total
US$’000 US$’000 US$’000 US$’000 US$’000 US$’000 US$’000 US$’000
Group
Cost
At 1 January 2017 31,117 101,639 40,276 110,030 283,062 6,821 134 290,017
Additions – – 816 34,857 35,673 890 – 36,563
Capitalisation of depreciation – – – 336 336 – – 336
Transfer to property, plant and equipment (Note 12) – – (14,222) (6,278) (20,500) – – (20,500)
Reclassification – – 1,045 (1,045) – – – –
Fair value adjustment (Note 5) – – – – – 370 (111) 259
Exchange difference 3,243 8,342 4,333 17,617 33,535 780 26 34,341
At 31 December 2017 34,360 109,981 32,248 155,517 332,106 8,861 49 341,016
Additions – – – 50,156 50,156 1,522 – 51,678
Capitalisation of depreciation – – – 359 359 – – 359
Transfer from/(to) property, plant and equipment (Note 12) – – 16,463 (12,623) 3,840 – – 3,840
Fair value adjustment (Note 5) – – – – – 33 (32) 1
Exchange difference (628) – (1,774) (7,987) (10,389) (208) – (10,597)
At 31 December 2018 33,732 109,981 46,937 185,422 376,072 10,208 17 386,297
Notes to the Financial Statements For the financial year ended 31 December 2018
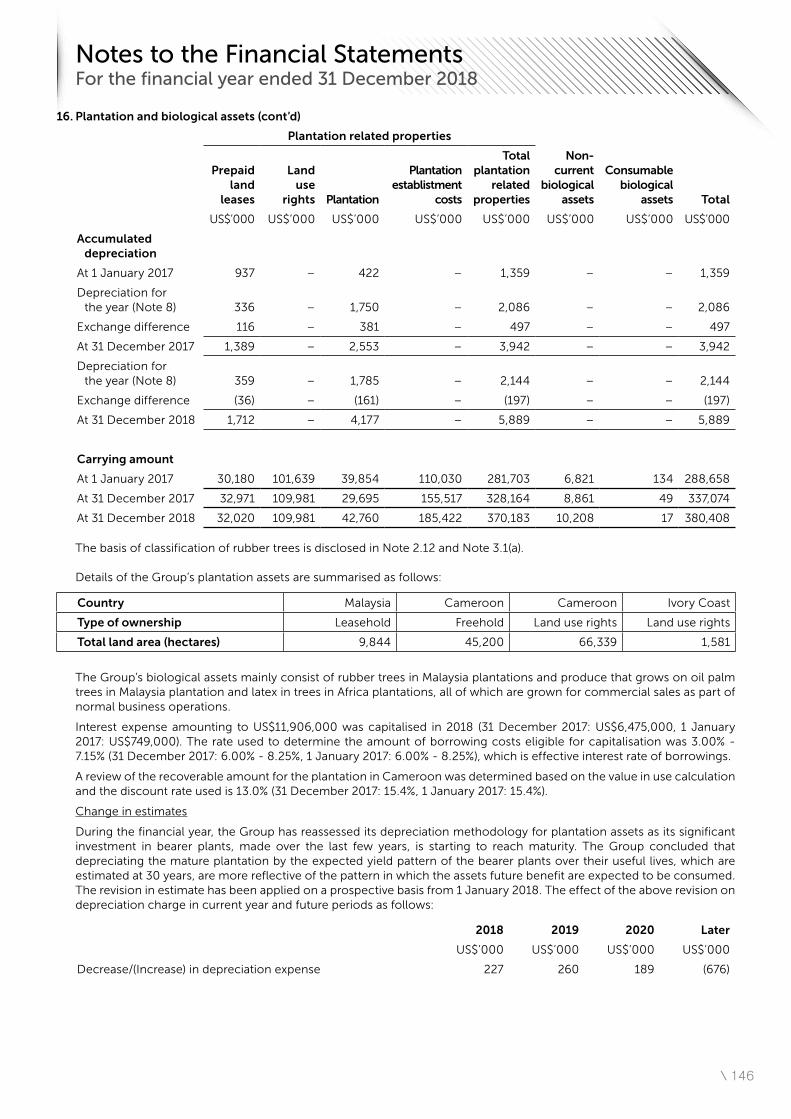
\ 146
16. Plantation and biological assets (cont’d)
Plantation related properties
Prepaid land
leases
Land use
rights Plantation
Plantation establistment
costs
Total plantation
related properties
Non-current
biological assets
Consumable biological
assets Total
US$’000 US$’000 US$’000 US$’000 US$’000 US$’000 US$’000 US$’000
Accumulated depreciation
At 1 January 2017 937 – 422 – 1,359 – – 1,359
Depreciation for the year (Note 8) 336 – 1,750 – 2,086 – – 2,086
Exchange difference 116 – 381 – 497 – – 497
At 31 December 2017 1,389 – 2,553 – 3,942 – – 3,942
Depreciation for the year (Note 8) 359 – 1,785 – 2,144 – – 2,144
Exchange difference (36) – (161) – (197) – – (197)
At 31 December 2018 1,712 – 4,177 – 5,889 – – 5,889
Carrying amount
At 1 January 2017 30,180 101,639 39,854 110,030 281,703 6,821 134 288,658
At 31 December 2017 32,971 109,981 29,695 155,517 328,164 8,861 49 337,074
At 31 December 2018 32,020 109,981 42,760 185,422 370,183 10,208 17 380,408 The basis of classification of rubber trees is disclosed in Note 2.12 and Note 3.1(a).
Details of the Group’s plantation assets are summarised as follows:
Country Malaysia Cameroon Cameroon Ivory Coast
Type of ownership Leasehold Freehold Land use rights Land use rights
Total land area (hectares) 9,844 45,200 66,339 1,581
The Group’s biological assets mainly consist of rubber trees in Malaysia plantations and produce that grows on oil palm trees in Malaysia plantation and latex in trees in Africa plantations, all of which are grown for commercial sales as part of normal business operations.
Interest expense amounting to US$11,906,000 was capitalised in 2018 (31 December 2017: US$6,475,000, 1 January 2017: US$749,000). The rate used to determine the amount of borrowing costs eligible for capitalisation was 3.00% - 7.15% (31 December 2017: 6.00% - 8.25%, 1 January 2017: 6.00% - 8.25%), which is effective interest rate of borrowings.
A review of the recoverable amount for the plantation in Cameroon was determined based on the value in use calculation and the discount rate used is 13.0% (31 December 2017: 15.4%, 1 January 2017: 15.4%).
Change in estimates
During the financial year, the Group has reassessed its depreciation methodology for plantation assets as its significant investment in bearer plants, made over the last few years, is starting to reach maturity. The Group concluded that depreciating the mature plantation by the expected yield pattern of the bearer plants over their useful lives, which are estimated at 30 years, are more reflective of the pattern in which the assets future benefit are expected to be consumed. The revision in estimate has been applied on a prospective basis from 1 January 2018. The effect of the above revision on depreciation charge in current year and future periods as follows:
2018 2019 2020 Later
US$’000 US$’000 US$’000 US$’000
Decrease/(Increase) in depreciation expense 227 260 189 (676)
Notes to the Financial Statements For the financial year ended 31 December 2018
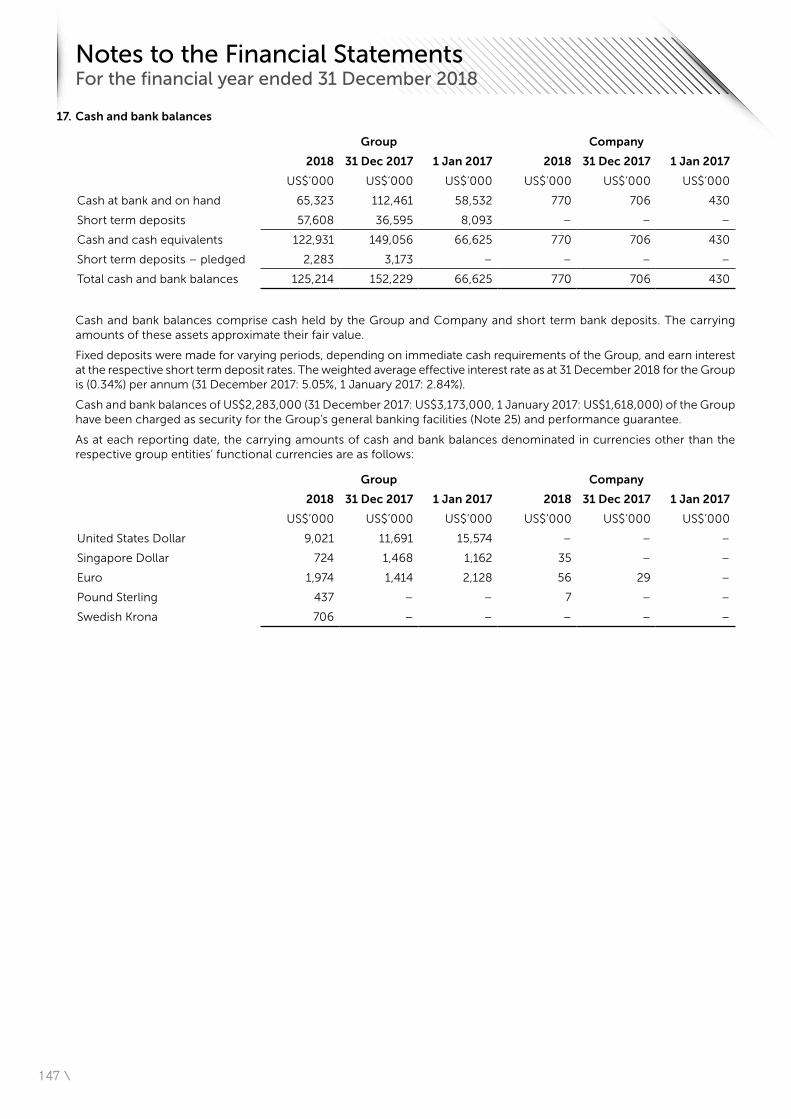
147 \
17. Cash and bank balances
Group Company
2018 31 Dec 2017 1 Jan 2017 2018 31 Dec 2017 1 Jan 2017
US$’000 US$’000 US$’000 US$’000 US$’000 US$’000
Cash at bank and on hand 65,323 112,461 58,532 770 706 430
Short term deposits 57,608 36,595 8,093 – – –
Cash and cash equivalents 122,931 149,056 66,625 770 706 430
Short term deposits – pledged 2,283 3,173 – – – –
Total cash and bank balances 125,214 152,229 66,625 770 706 430
Cash and bank balances comprise cash held by the Group and Company and short term bank deposits. The carrying amounts of these assets approximate their fair value.
Fixed deposits were made for varying periods, depending on immediate cash requirements of the Group, and earn interest at the respective short term deposit rates. The weighted average effective interest rate as at 31 December 2018 for the Group is (0.34%) per annum (31 December 2017: 5.05%, 1 January 2017: 2.84%).
Cash and bank balances of US$2,283,000 (31 December 2017: US$3,173,000, 1 January 2017: US$1,618,000) of the Group have been charged as security for the Group’s general banking facilities (Note 25) and performance guarantee.
As at each reporting date, the carrying amounts of cash and bank balances denominated in currencies other than the respective group entities’ functional currencies are as follows:
Group Company
2018 31 Dec 2017 1 Jan 2017 2018 31 Dec 2017 1 Jan 2017
US$’000 US$’000 US$’000 US$’000 US$’000 US$’000
United States Dollar 9,021 11,691 15,574 – – –
Singapore Dollar 724 1,468 1,162 35 – –
Euro 1,974 1,414 2,128 56 29 –
Pound Sterling 437 – – 7 – –
Swedish Krona 706 – – – – –
Notes to the Financial Statements For the financial year ended 31 December 2018
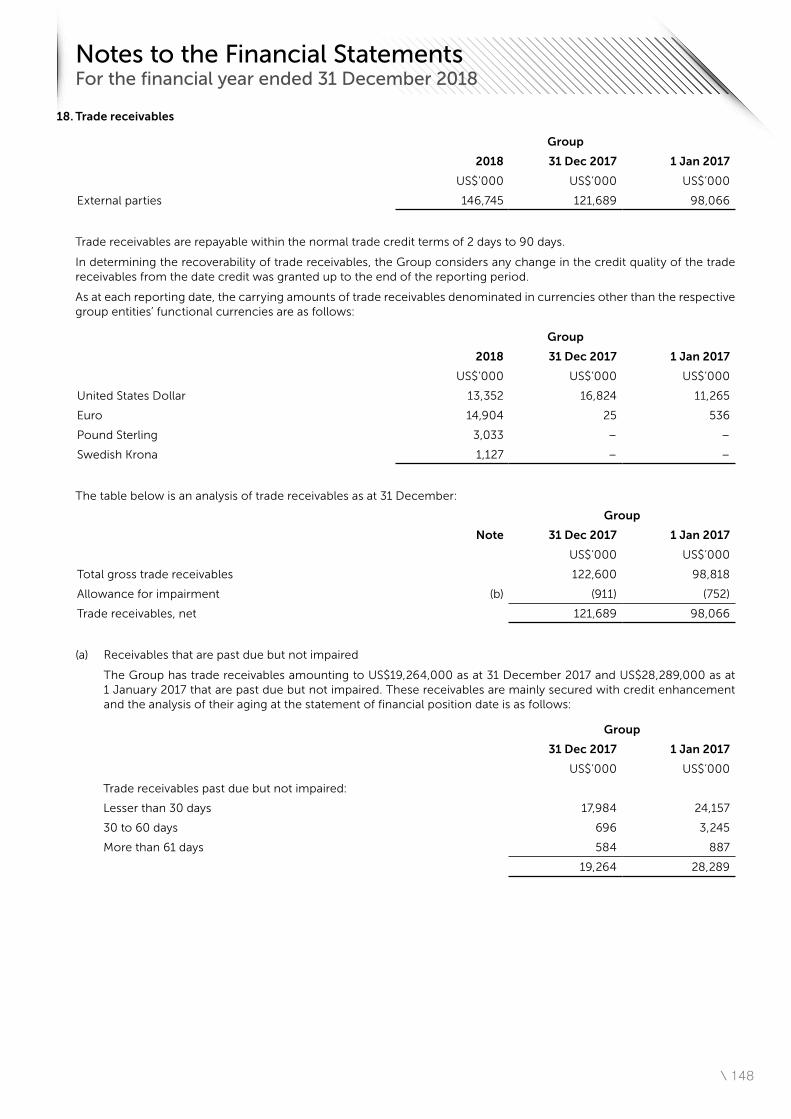
\ 148
18. Trade receivables
Group
2018 31 Dec 2017 1 Jan 2017
US$’000 US$’000 US$’000
External parties 146,745 121,689 98,066
Trade receivables are repayable within the normal trade credit terms of 2 days to 90 days.
In determining the recoverability of trade receivables, the Group considers any change in the credit quality of the trade receivables from the date credit was granted up to the end of the reporting period.
As at each reporting date, the carrying amounts of trade receivables denominated in currencies other than the respective group entities’ functional currencies are as follows:
Group
2018 31 Dec 2017 1 Jan 2017
US$’000 US$’000 US$’000
United States Dollar 13,352 16,824 11,265
Euro 14,904 25 536
Pound Sterling 3,033 – –
Swedish Krona 1,127 – –
The table below is an analysis of trade receivables as at 31 December:
Group
Note 31 Dec 2017 1 Jan 2017
US$’000 US$’000
Total gross trade receivables 122,600 98,818
Allowance for impairment (b) (911) (752)
Trade receivables, net 121,689 98,066
(a) Receivables that are past due but not impaired
The Group has trade receivables amounting to US$19,264,000 as at 31 December 2017 and US$28,289,000 as at 1 January 2017 that are past due but not impaired. These receivables are mainly secured with credit enhancement and the analysis of their aging at the statement of financial position date is as follows:
Group
31 Dec 2017 1 Jan 2017
US$’000 US$’000
Trade receivables past due but not impaired:
Lesser than 30 days 17,984 24,157
30 to 60 days 696 3,245
More than 61 days 584 887
19,264 28,289
Notes to the Financial Statements For the financial year ended 31 December 2018
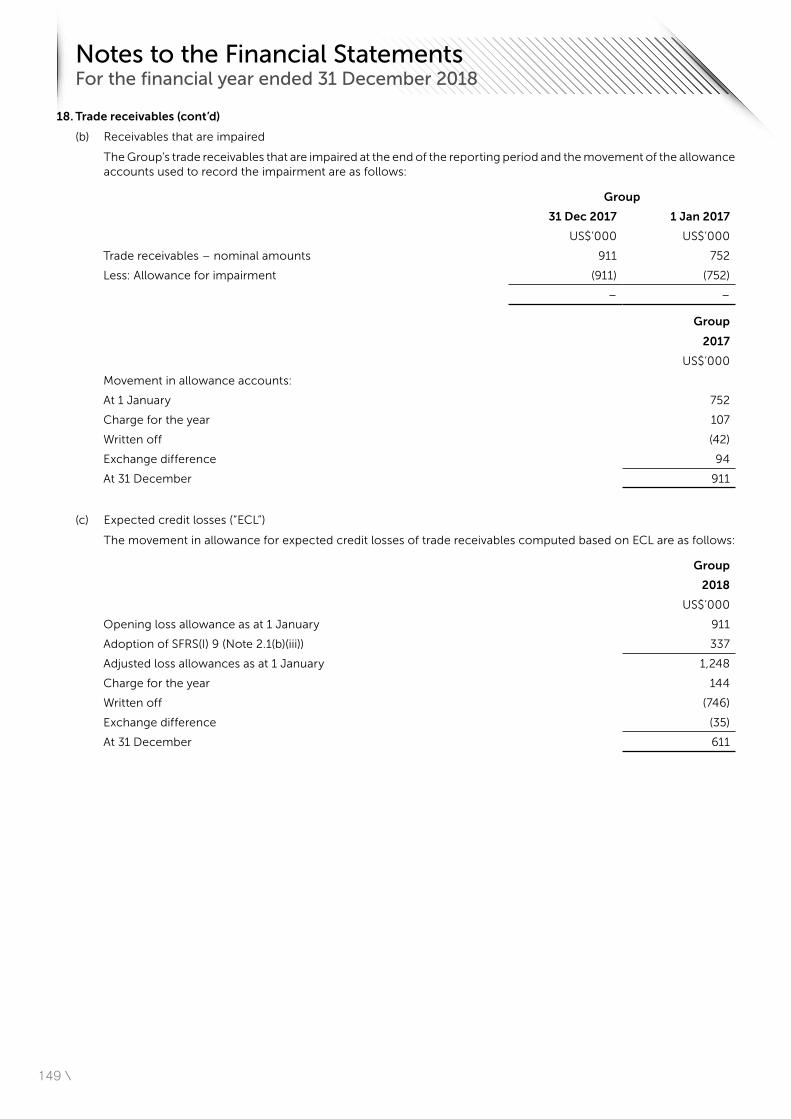
149 \
18. Trade receivables (cont’d)
(b) Receivables that are impaired
The Group’s trade receivables that are impaired at the end of the reporting period and the movement of the allowance accounts used to record the impairment are as follows:
Group
31 Dec 2017 1 Jan 2017
US$’000 US$’000
Trade receivables – nominal amounts 911 752
Less: Allowance for impairment (911) (752)
– –
Group
2017
US$’000
Movement in allowance accounts:
At 1 January 752
Charge for the year 107
Written off (42)
Exchange difference 94
At 31 December 911
(c) Expected credit losses (“ECL”)
The movement in allowance for expected credit losses of trade receivables computed based on ECL are as follows:
Group
2018
US$’000
Opening loss allowance as at 1 January 911
Adoption of SFRS(I) 9 (Note 2.1(b)(iii)) 337
Adjusted loss allowances as at 1 January 1,248
Charge for the year 144
Written off (746)
Exchange difference (35)
At 31 December 611
Notes to the Financial Statements For the financial year ended 31 December 2018
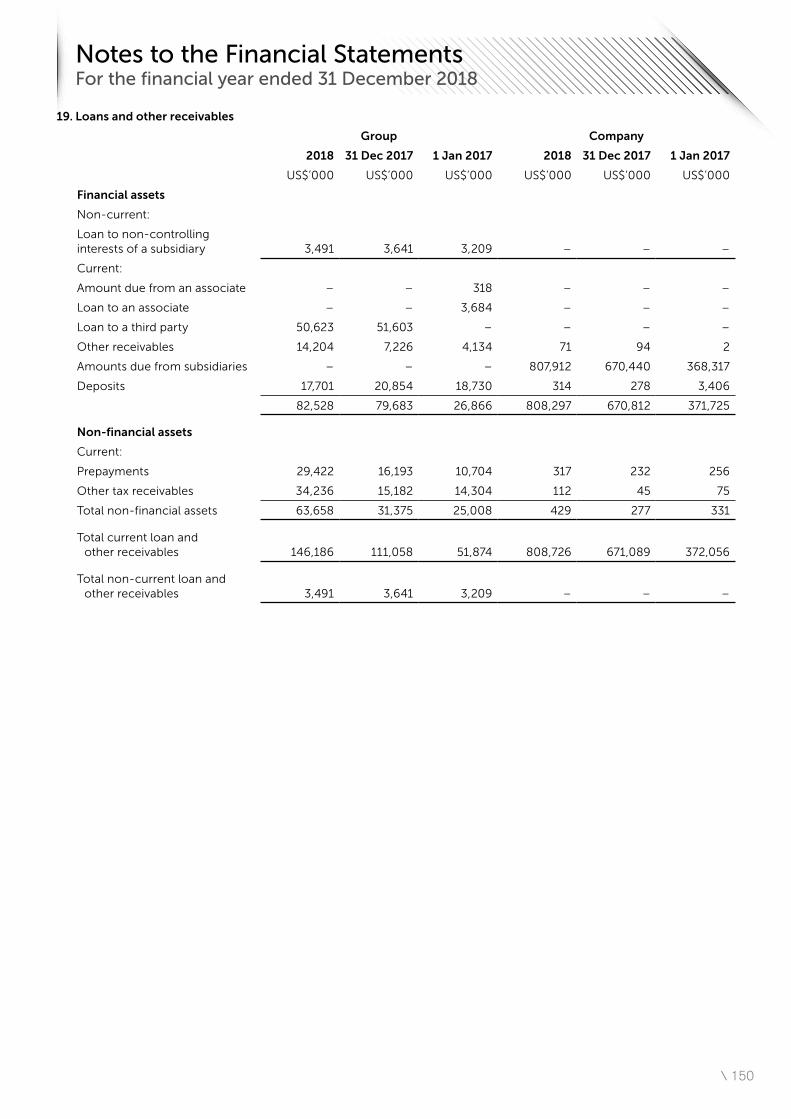
\ 150
19. Loans and other receivables
Group Company
2018 31 Dec 2017 1 Jan 2017 2018 31 Dec 2017 1 Jan 2017
US$’000 US$’000 US$’000 US$’000 US$’000 US$’000
Financial assets
Non-current:
Loan to non-controlling interests of a subsidiary 3,491 3,641 3,209 – – –
Current:
Amount due from an associate – – 318 – – –
Loan to an associate – – 3,684 – – –
Loan to a third party 50,623 51,603 – – – –
Other receivables 14,204 7,226 4,134 71 94 2
Amounts due from subsidiaries – – – 807,912 670,440 368,317
Deposits 17,701 20,854 18,730 314 278 3,406
82,528 79,683 26,866 808,297 670,812 371,725
Non-financial assets
Current:
Prepayments 29,422 16,193 10,704 317 232 256
Other tax receivables 34,236 15,182 14,304 112 45 75
Total non-financial assets 63,658 31,375 25,008 429 277 331
Total current loan and other receivables 146,186 111,058 51,874 808,726 671,089 372,056
Total non-current loan and other receivables 3,491 3,641 3,209 – – –
Notes to the Financial Statements For the financial year ended 31 December 2018
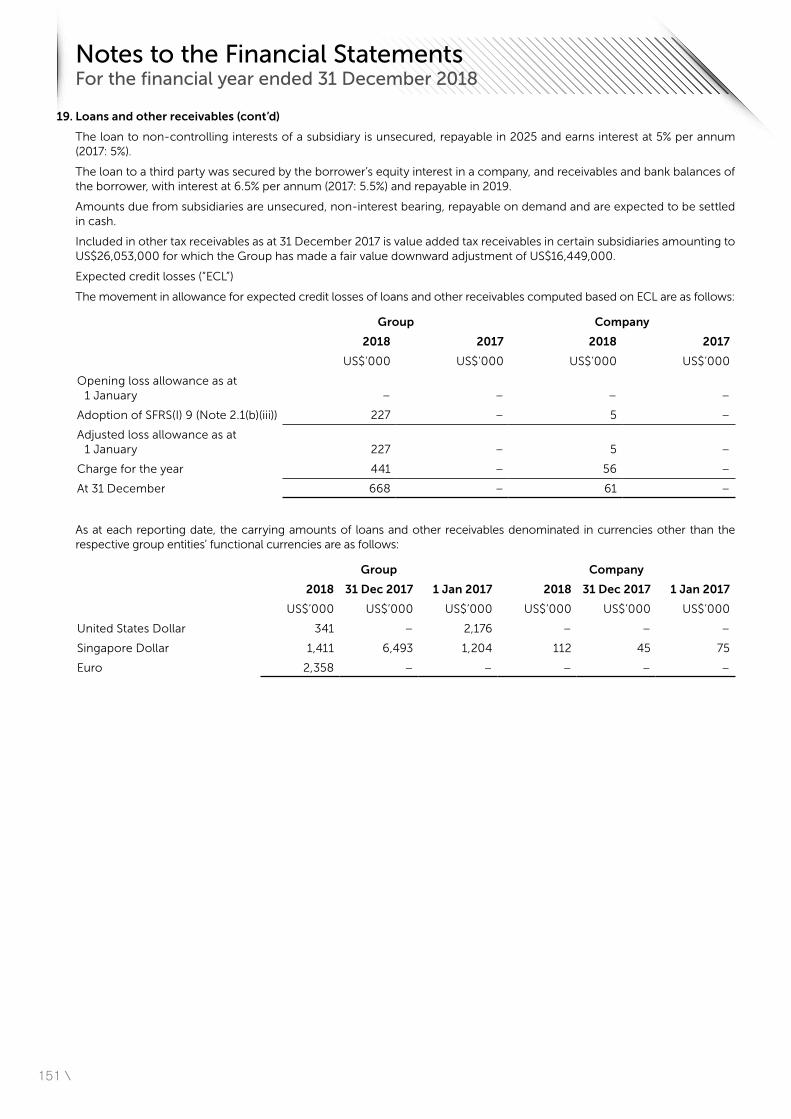
151 \
19. Loans and other receivables (cont’d)
The loan to non-controlling interests of a subsidiary is unsecured, repayable in 2025 and earns interest at 5% per annum (2017: 5%).
The loan to a third party was secured by the borrower’s equity interest in a company, and receivables and bank balances of the borrower, with interest at 6.5% per annum (2017: 5.5%) and repayable in 2019.
Amounts due from subsidiaries are unsecured, non-interest bearing, repayable on demand and are expected to be settled in cash.
Included in other tax receivables as at 31 December 2017 is value added tax receivables in certain subsidiaries amounting to US$26,053,000 for which the Group has made a fair value downward adjustment of US$16,449,000.
Expected credit losses (“ECL”)
The movement in allowance for expected credit losses of loans and other receivables computed based on ECL are as follows:
Group Company
2018 2017 2018 2017
US$’000 US$’000 US$’000 US$’000
Opening loss allowance as at 1 January – – – –
Adoption of SFRS(I) 9 (Note 2.1(b)(iii)) 227 – 5 –
Adjusted loss allowance as at 1 January 227 – 5 –
Charge for the year 441 – 56 –
At 31 December 668 – 61 –
As at each reporting date, the carrying amounts of loans and other receivables denominated in currencies other than the respective group entities’ functional currencies are as follows:
Group Company
2018 31 Dec 2017 1 Jan 2017 2018 31 Dec 2017 1 Jan 2017
US$’000 US$’000 US$’000 US$’000 US$’000 US$’000
United States Dollar 341 – 2,176 – – –
Singapore Dollar 1,411 6,493 1,204 112 45 75
Euro 2,358 – – – – –
Notes to the Financial Statements For the financial year ended 31 December 2018
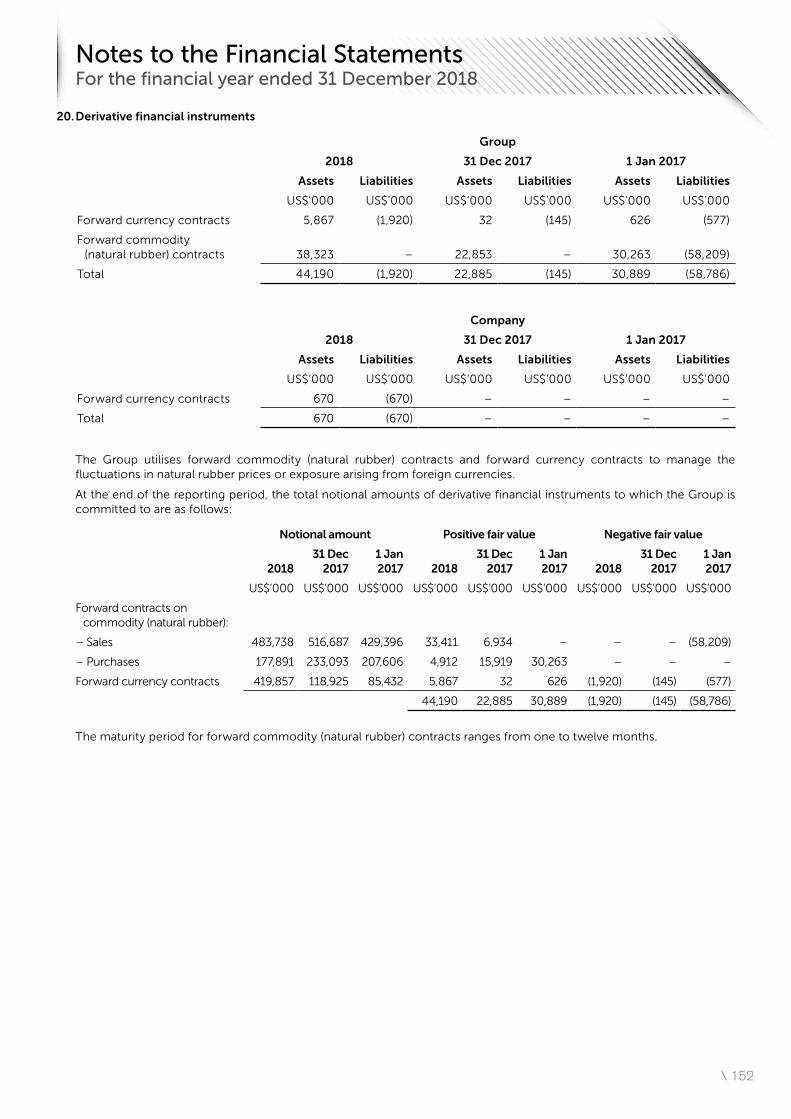
\ 152
20. Derivative financial instruments
Group
2018 31 Dec 2017 1 Jan 2017
Assets Liabilities Assets Liabilities Assets Liabilities
US$’000 US$’000 US$’000 US$’000 US$’000 US$’000
Forward currency contracts 5,867 (1,920) 32 (145) 626 (577)
Forward commodity (natural rubber) contracts 38,323 – 22,853 – 30,263 (58,209)
Total 44,190 (1,920) 22,885 (145) 30,889 (58,786)
Company
2018 31 Dec 2017 1 Jan 2017
Assets Liabilities Assets Liabilities Assets Liabilities
US$’000 US$’000 US$’000 US$’000 US$’000 US$’000
Forward currency contracts 670 (670) – – – –
Total 670 (670) – – – –
The Group utilises forward commodity (natural rubber) contracts and forward currency contracts to manage the fluctuations in natural rubber prices or exposure arising from foreign currencies.
At the end of the reporting period, the total notional amounts of derivative financial instruments to which the Group is committed to are as follows:
Notional amount Positive fair value Negative fair value
201831 Dec
20171 Jan 2017 2018
31 Dec 2017
1 Jan 2017 2018
31 Dec 2017
1 Jan 2017
US$’000 US$’000 US$’000 US$’000 US$’000 US$’000 US$’000 US$’000 US$’000
Forward contracts on commodity (natural rubber):
– Sales 483,738 516,687 429,396 33,411 6,934 – – – (58,209)
– Purchases 177,891 233,093 207,606 4,912 15,919 30,263 – – –
Forward currency contracts 419,857 118,925 85,432 5,867 32 626 (1,920) (145) (577)
44,190 22,885 30,889 (1,920) (145) (58,786)
The maturity period for forward commodity (natural rubber) contracts ranges from one to twelve months.
Notes to the Financial Statements For the financial year ended 31 December 2018
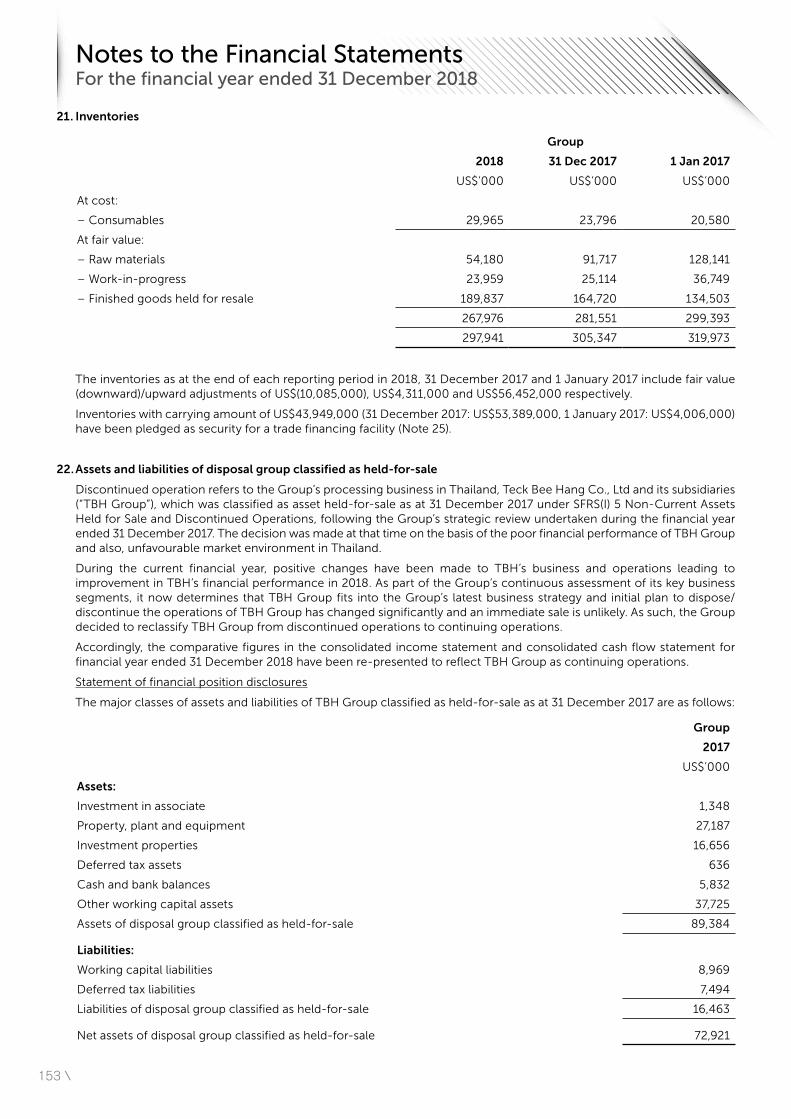
153 \
21. Inventories
Group
2018 31 Dec 2017 1 Jan 2017
US$’000 US$’000 US$’000
At cost:
– Consumables 29,965 23,796 20,580
At fair value:
– Raw materials 54,180 91,717 128,141
– Work-in-progress 23,959 25,114 36,749
– Finished goods held for resale 189,837 164,720 134,503
267,976 281,551 299,393
297,941 305,347 319,973
The inventories as at the end of each reporting period in 2018, 31 December 2017 and 1 January 2017 include fair value (downward)/upward adjustments of US$(10,085,000), US$4,311,000 and US$56,452,000 respectively.
Inventories with carrying amount of US$43,949,000 (31 December 2017: US$53,389,000, 1 January 2017: US$4,006,000) have been pledged as security for a trade financing facility (Note 25).
22. Assets and liabilities of disposal group classified as held-for-sale
Discontinued operation refers to the Group’s processing business in Thailand, Teck Bee Hang Co., Ltd and its subsidiaries (“TBH Group”), which was classified as asset held-for-sale as at 31 December 2017 under SFRS(I) 5 Non-Current Assets Held for Sale and Discontinued Operations, following the Group’s strategic review undertaken during the financial year ended 31 December 2017. The decision was made at that time on the basis of the poor financial performance of TBH Group and also, unfavourable market environment in Thailand.
During the current financial year, positive changes have been made to TBH’s business and operations leading to improvement in TBH’s financial performance in 2018. As part of the Group’s continuous assessment of its key business segments, it now determines that TBH Group fits into the Group’s latest business strategy and initial plan to dispose/discontinue the operations of TBH Group has changed significantly and an immediate sale is unlikely. As such, the Group decided to reclassify TBH Group from discontinued operations to continuing operations.
Accordingly, the comparative figures in the consolidated income statement and consolidated cash flow statement for financial year ended 31 December 2018 have been re-presented to reflect TBH Group as continuing operations.
Statement of financial position disclosures
The major classes of assets and liabilities of TBH Group classified as held-for-sale as at 31 December 2017 are as follows:
Group
2017
US$’000
Assets:
Investment in associate 1,348
Property, plant and equipment 27,187
Investment properties 16,656
Deferred tax assets 636
Cash and bank balances 5,832
Other working capital assets 37,725
Assets of disposal group classified as held-for-sale 89,384
Liabilities:
Working capital liabilities 8,969
Deferred tax liabilities 7,494
Liabilities of disposal group classified as held-for-sale 16,463
Net assets of disposal group classified as held-for-sale 72,921
Notes to the Financial Statements For the financial year ended 31 December 2018
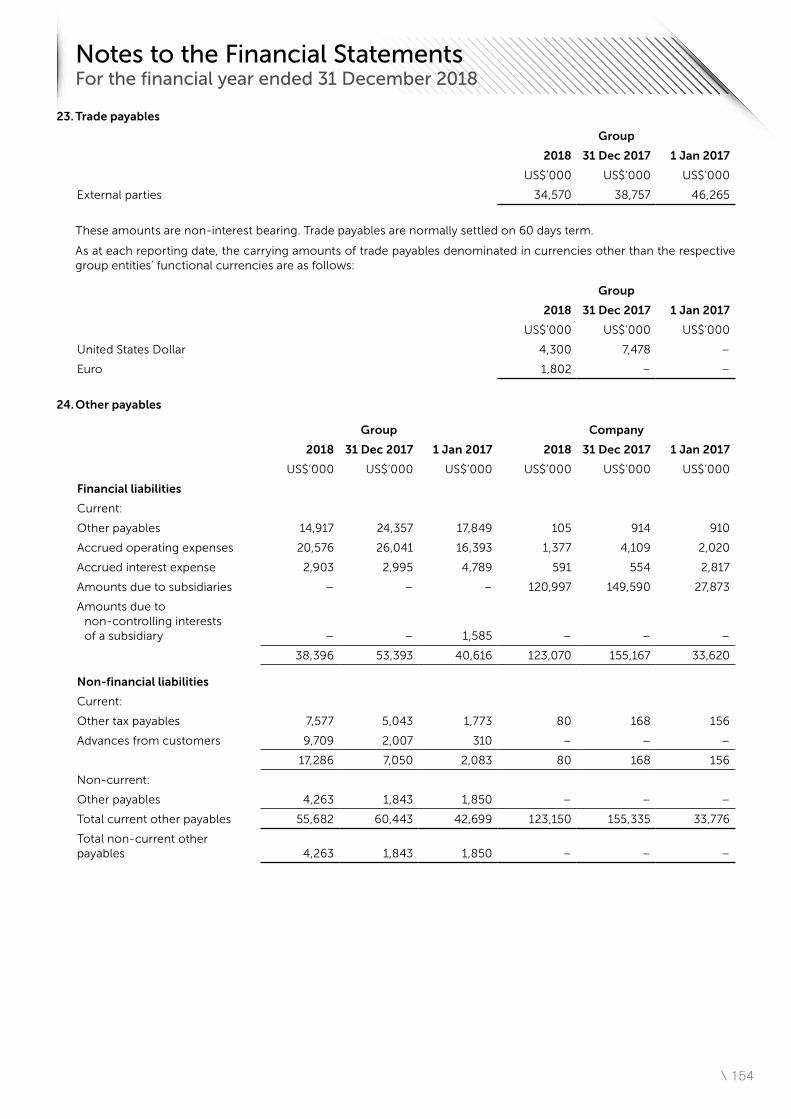
\ 154
23. Trade payables
Group
2018 31 Dec 2017 1 Jan 2017
US$’000 US$’000 US$’000
External parties 34,570 38,757 46,265
These amounts are non-interest bearing. Trade payables are normally settled on 60 days term.
As at each reporting date, the carrying amounts of trade payables denominated in currencies other than the respective group entities’ functional currencies are as follows:
Group
2018 31 Dec 2017 1 Jan 2017
US$’000 US$’000 US$’000
United States Dollar 4,300 7,478 –
Euro 1,802 – –
24. Other payables
Group Company
2018 31 Dec 2017 1 Jan 2017 2018 31 Dec 2017 1 Jan 2017
US$’000 US$’000 US$’000 US$’000 US$’000 US$’000
Financial liabilities
Current:
Other payables 14,917 24,357 17,849 105 914 910
Accrued operating expenses 20,576 26,041 16,393 1,377 4,109 2,020
Accrued interest expense 2,903 2,995 4,789 591 554 2,817
Amounts due to subsidiaries – – – 120,997 149,590 27,873
Amounts due to non-controlling interests of a subsidiary – – 1,585 – – –
38,396 53,393 40,616 123,070 155,167 33,620
Non-financial liabilities
Current:
Other tax payables 7,577 5,043 1,773 80 168 156
Advances from customers 9,709 2,007 310 – – –
17,286 7,050 2,083 80 168 156
Non-current:
Other payables 4,263 1,843 1,850 – – –
Total current other payables 55,682 60,443 42,699 123,150 155,335 33,776
Total non-current other payables 4,263 1,843 1,850 – – –
Notes to the Financial Statements For the financial year ended 31 December 2018
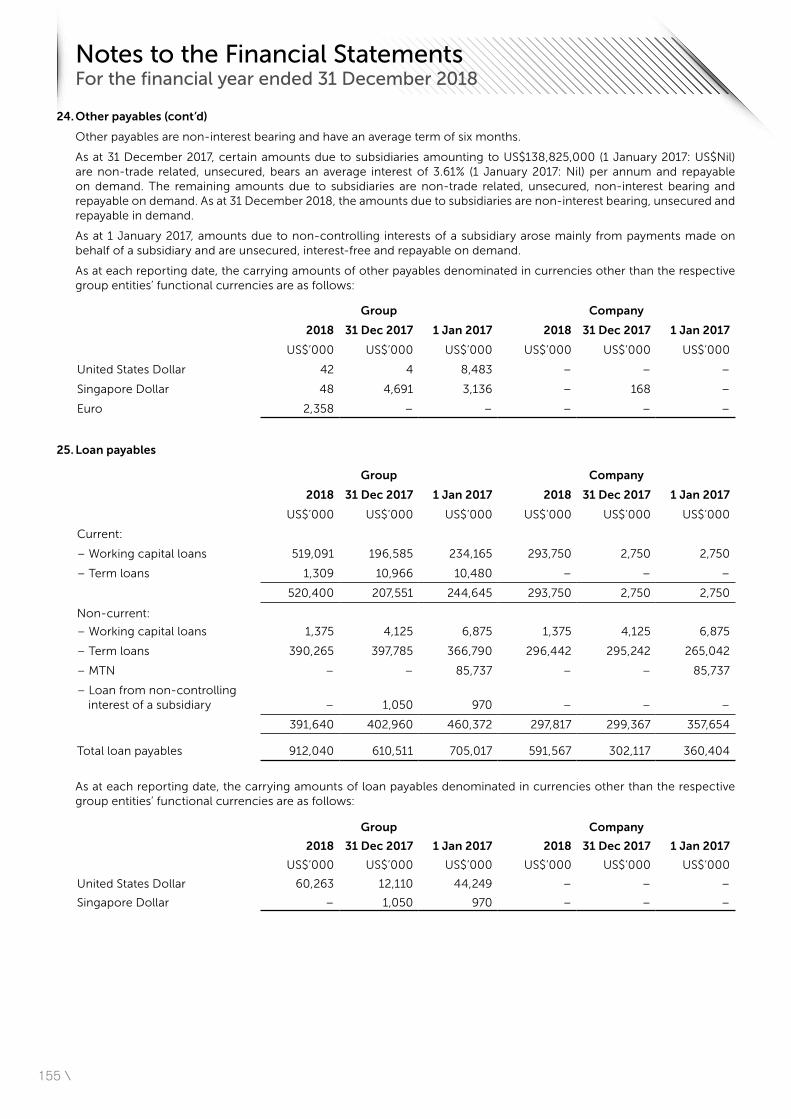
155 \
24. Other payables (cont’d)
Other payables are non-interest bearing and have an average term of six months.
As at 31 December 2017, certain amounts due to subsidiaries amounting to US$138,825,000 (1 January 2017: US$Nil) are non-trade related, unsecured, bears an average interest of 3.61% (1 January 2017: Nil) per annum and repayable on demand. The remaining amounts due to subsidiaries are non-trade related, unsecured, non-interest bearing and repayable on demand. As at 31 December 2018, the amounts due to subsidiaries are non-interest bearing, unsecured and repayable in demand.
As at 1 January 2017, amounts due to non-controlling interests of a subsidiary arose mainly from payments made on behalf of a subsidiary and are unsecured, interest-free and repayable on demand.
As at each reporting date, the carrying amounts of other payables denominated in currencies other than the respective group entities’ functional currencies are as follows:
Group Company
2018 31 Dec 2017 1 Jan 2017 2018 31 Dec 2017 1 Jan 2017
US$’000 US$’000 US$’000 US$’000 US$’000 US$’000
United States Dollar 42 4 8,483 – – –
Singapore Dollar 48 4,691 3,136 – 168 –
Euro 2,358 – – – – –
25. Loan payables
Group Company
2018 31 Dec 2017 1 Jan 2017 2018 31 Dec 2017 1 Jan 2017
US$’000 US$’000 US$’000 US$’000 US$’000 US$’000
Current:
– Working capital loans 519,091 196,585 234,165 293,750 2,750 2,750
– Term loans 1,309 10,966 10,480 – – –
520,400 207,551 244,645 293,750 2,750 2,750
Non-current:
– Working capital loans 1,375 4,125 6,875 1,375 4,125 6,875
– Term loans 390,265 397,785 366,790 296,442 295,242 265,042
– MTN – – 85,737 – – 85,737
– Loan from non-controlling interest of a subsidiary – 1,050 970 – – –
391,640 402,960 460,372 297,817 299,367 357,654
Total loan payables 912,040 610,511 705,017 591,567 302,117 360,404
As at each reporting date, the carrying amounts of loan payables denominated in currencies other than the respective group entities’ functional currencies are as follows:
Group Company
2018 31 Dec 2017 1 Jan 2017 2018 31 Dec 2017 1 Jan 2017
US$’000 US$’000 US$’000 US$’000 US$’000 US$’000
United States Dollar 60,263 12,110 44,249 – – –
Singapore Dollar – 1,050 970 – – –
Notes to the Financial Statements For the financial year ended 31 December 2018
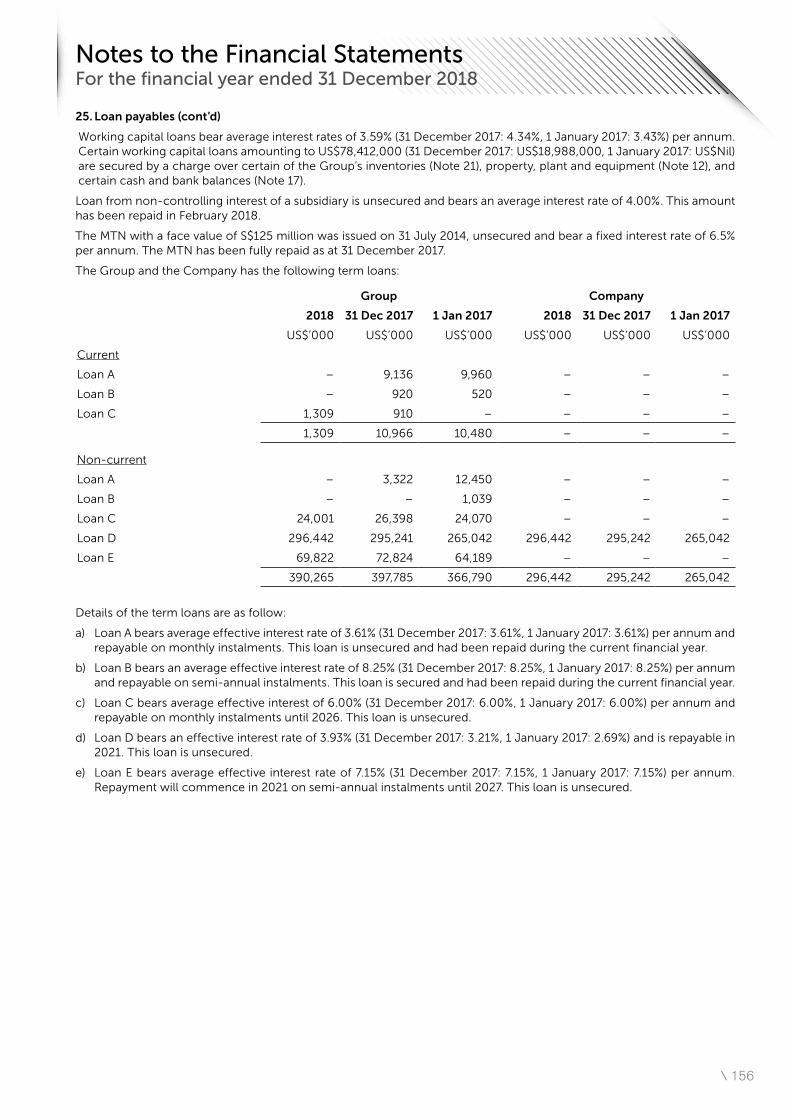
\ 156
25. Loan payables (cont’d)
Working capital loans bear average interest rates of 3.59% (31 December 2017: 4.34%, 1 January 2017: 3.43%) per annum. Certain working capital loans amounting to US$78,412,000 (31 December 2017: US$18,988,000, 1 January 2017: US$Nil) are secured by a charge over certain of the Group’s inventories (Note 21), property, plant and equipment (Note 12), and certain cash and bank balances (Note 17).
Loan from non-controlling interest of a subsidiary is unsecured and bears an average interest rate of 4.00%. This amount has been repaid in February 2018.
The MTN with a face value of S$125 million was issued on 31 July 2014, unsecured and bear a fixed interest rate of 6.5% per annum. The MTN has been fully repaid as at 31 December 2017.
The Group and the Company has the following term loans:
Group Company
2018 31 Dec 2017 1 Jan 2017 2018 31 Dec 2017 1 Jan 2017
US$’000 US$’000 US$’000 US$’000 US$’000 US$’000
Current
Loan A – 9,136 9,960 – – –
Loan B – 920 520 – – –
Loan C 1,309 910 – – – –
1,309 10,966 10,480 – – –
Non-current
Loan A – 3,322 12,450 – – –
Loan B – – 1,039 – – –
Loan C 24,001 26,398 24,070 – – –
Loan D 296,442 295,241 265,042 296,442 295,242 265,042
Loan E 69,822 72,824 64,189 – – –
390,265 397,785 366,790 296,442 295,242 265,042
Details of the term loans are as follow:
a) Loan A bears average effective interest rate of 3.61% (31 December 2017: 3.61%, 1 January 2017: 3.61%) per annum and repayable on monthly instalments. This loan is unsecured and had been repaid during the current financial year.
b) Loan B bears an average effective interest rate of 8.25% (31 December 2017: 8.25%, 1 January 2017: 8.25%) per annum and repayable on semi-annual instalments. This loan is secured and had been repaid during the current financial year.
c) Loan C bears average effective interest of 6.00% (31 December 2017: 6.00%, 1 January 2017: 6.00%) per annum and repayable on monthly instalments until 2026. This loan is unsecured.
d) Loan D bears an effective interest rate of 3.93% (31 December 2017: 3.21%, 1 January 2017: 2.69%) and is repayable in 2021. This loan is unsecured.
e) Loan E bears average effective interest rate of 7.15% (31 December 2017: 7.15%, 1 January 2017: 7.15%) per annum. Repayment will commence in 2021 on semi-annual instalments until 2027. This loan is unsecured.
Notes to the Financial Statements For the financial year ended 31 December 2018
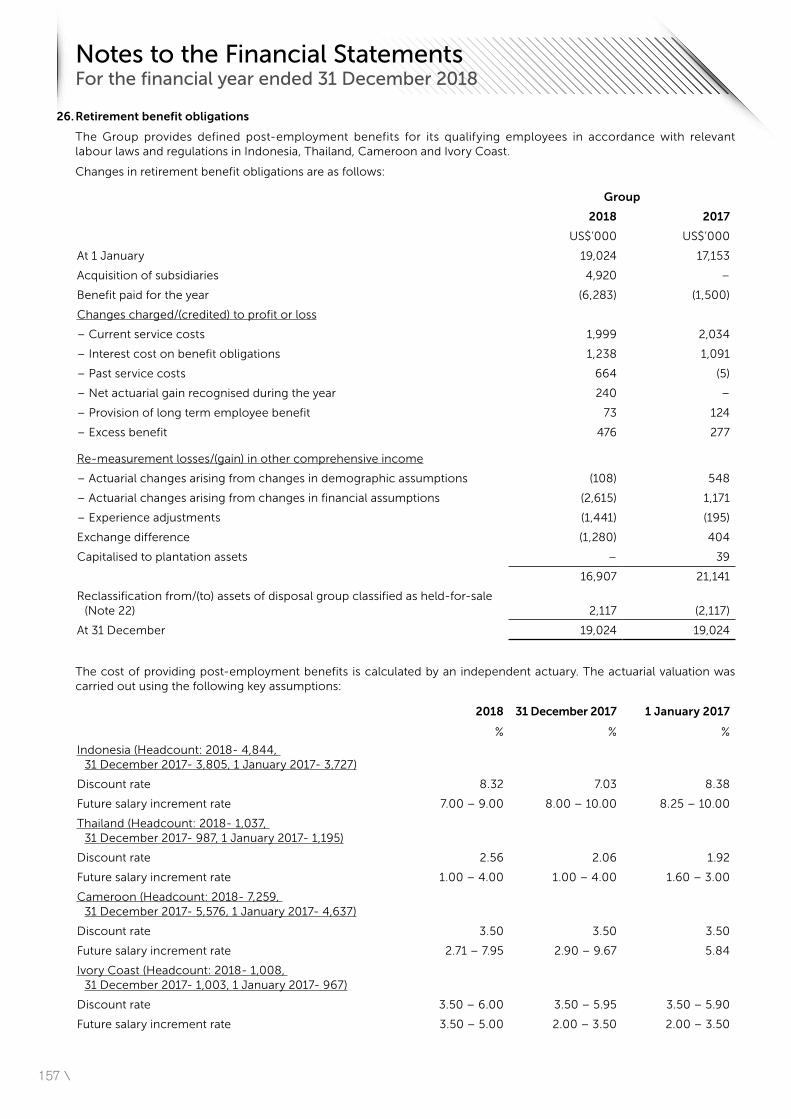
157 \
26. Retirement benefit obligations
The Group provides defined post-employment benefits for its qualifying employees in accordance with relevant labour laws and regulations in Indonesia, Thailand, Cameroon and Ivory Coast.
Changes in retirement benefit obligations are as follows:
Group
2018 2017
US$’000 US$’000
At 1 January 19,024 17,153
Acquisition of subsidiaries 4,920 –
Benefit paid for the year (6,283) (1,500)
Changes charged/(credited) to profit or loss
– Current service costs 1,999 2,034
– Interest cost on benefit obligations 1,238 1,091
– Past service costs 664 (5)
– Net actuarial gain recognised during the year 240 –
– Provision of long term employee benefit 73 124
– Excess benefit 476 277
Re-measurement losses/(gain) in other comprehensive income
– Actuarial changes arising from changes in demographic assumptions (108) 548
– Actuarial changes arising from changes in financial assumptions (2,615) 1,171
– Experience adjustments (1,441) (195)
Exchange difference (1,280) 404
Capitalised to plantation assets – 39
16,907 21,141
Reclassification from/(to) assets of disposal group classified as held-for-sale (Note 22) 2,117 (2,117)
At 31 December 19,024 19,024
The cost of providing post-employment benefits is calculated by an independent actuary. The actuarial valuation was carried out using the following key assumptions:
2018 31 December 2017 1 January 2017
% % %
Indonesia (Headcount: 2018- 4,844, 31 December 2017- 3,805, 1 January 2017- 3,727)
Discount rate 8.32 7.03 8.38
Future salary increment rate 7.00 – 9.00 8.00 – 10.00 8.25 – 10.00
Thailand (Headcount: 2018- 1,037, 31 December 2017- 987, 1 January 2017- 1,195)
Discount rate 2.56 2.06 1.92
Future salary increment rate 1.00 – 4.00 1.00 – 4.00 1.60 – 3.00
Cameroon (Headcount: 2018- 7,259, 31 December 2017- 5,576, 1 January 2017- 4,637)
Discount rate 3.50 3.50 3.50
Future salary increment rate 2.71 – 7.95 2.90 – 9.67 5.84
Ivory Coast (Headcount: 2018- 1,008, 31 December 2017- 1,003, 1 January 2017- 967)
Discount rate 3.50 – 6.00 3.50 – 5.95 3.50 – 5.90
Future salary increment rate 3.50 – 5.00 2.00 – 3.50 2.00 – 3.50
Notes to the Financial Statements For the financial year ended 31 December 2018
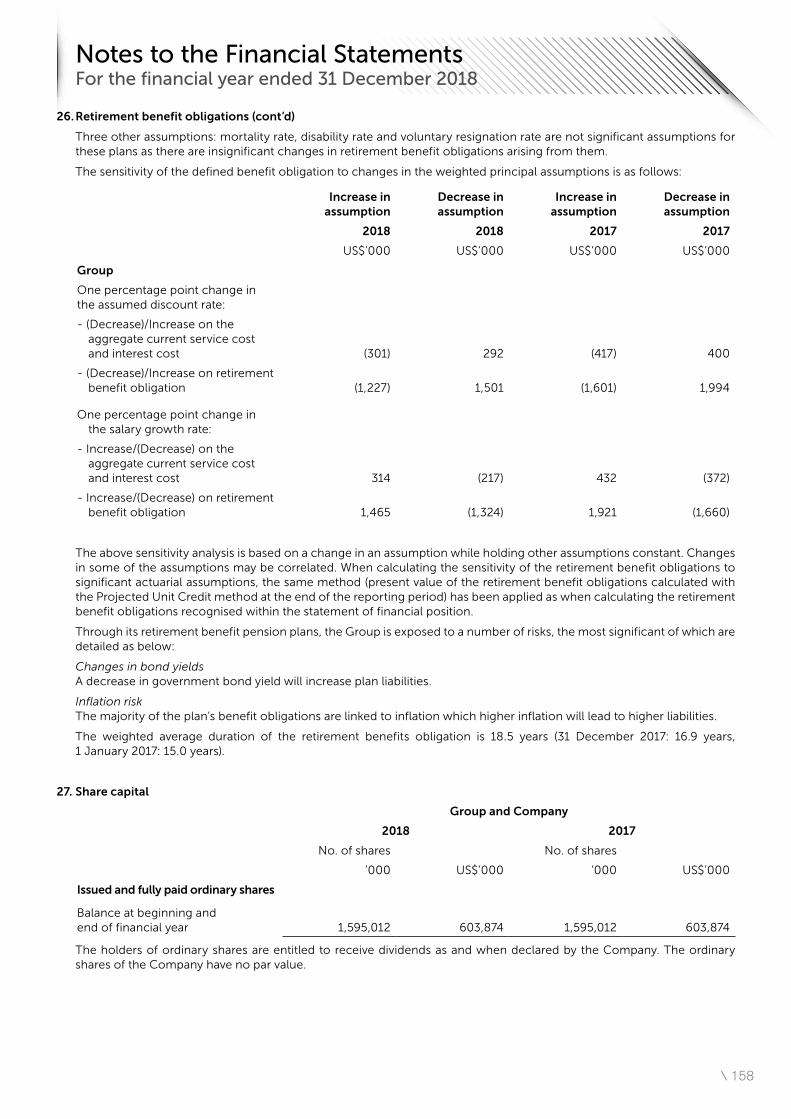
\ 158
26. Retirement benefit obligations (cont’d)
Three other assumptions: mortality rate, disability rate and voluntary resignation rate are not significant assumptions for these plans as there are insignificant changes in retirement benefit obligations arising from them.
The sensitivity of the defined benefit obligation to changes in the weighted principal assumptions is as follows:
Increase in assumption
Decrease in assumption
Increase in assumption
Decrease in assumption
2018 2018 2017 2017
US$’000 US$’000 US$’000 US$’000
Group
One percentage point change in the assumed discount rate:
- (Decrease)/Increase on the aggregate current service cost and interest cost (301) 292 (417) 400
- (Decrease)/Increase on retirement benefit obligation (1,227) 1,501 (1,601) 1,994
One percentage point change in the salary growth rate:
- Increase/(Decrease) on the aggregate current service cost and interest cost 314 (217) 432 (372)
- Increase/(Decrease) on retirement benefit obligation 1,465 (1,324) 1,921 (1,660)
The above sensitivity analysis is based on a change in an assumption while holding other assumptions constant. Changes in some of the assumptions may be correlated. When calculating the sensitivity of the retirement benefit obligations to significant actuarial assumptions, the same method (present value of the retirement benefit obligations calculated with the Projected Unit Credit method at the end of the reporting period) has been applied as when calculating the retirement benefit obligations recognised within the statement of financial position.
Through its retirement benefit pension plans, the Group is exposed to a number of risks, the most significant of which are detailed as below:
Changes in bond yields A decrease in government bond yield will increase plan liabilities.
Inflation risk The majority of the plan’s benefit obligations are linked to inflation which higher inflation will lead to higher liabilities.
The weighted average duration of the retirement benefits obligation is 18.5 years (31 December 2017: 16.9 years, 1 January 2017: 15.0 years).
27. Share capital
Group and Company
2018 2017
No. of shares No. of shares
’000 US$’000 ’000 US$’000
Issued and fully paid ordinary shares
Balance at beginning and end of financial year 1,595,012 603,874 1,595,012 603,874
The holders of ordinary shares are entitled to receive dividends as and when declared by the Company. The ordinary shares of the Company have no par value.
Notes to the Financial Statements For the financial year ended 31 December 2018
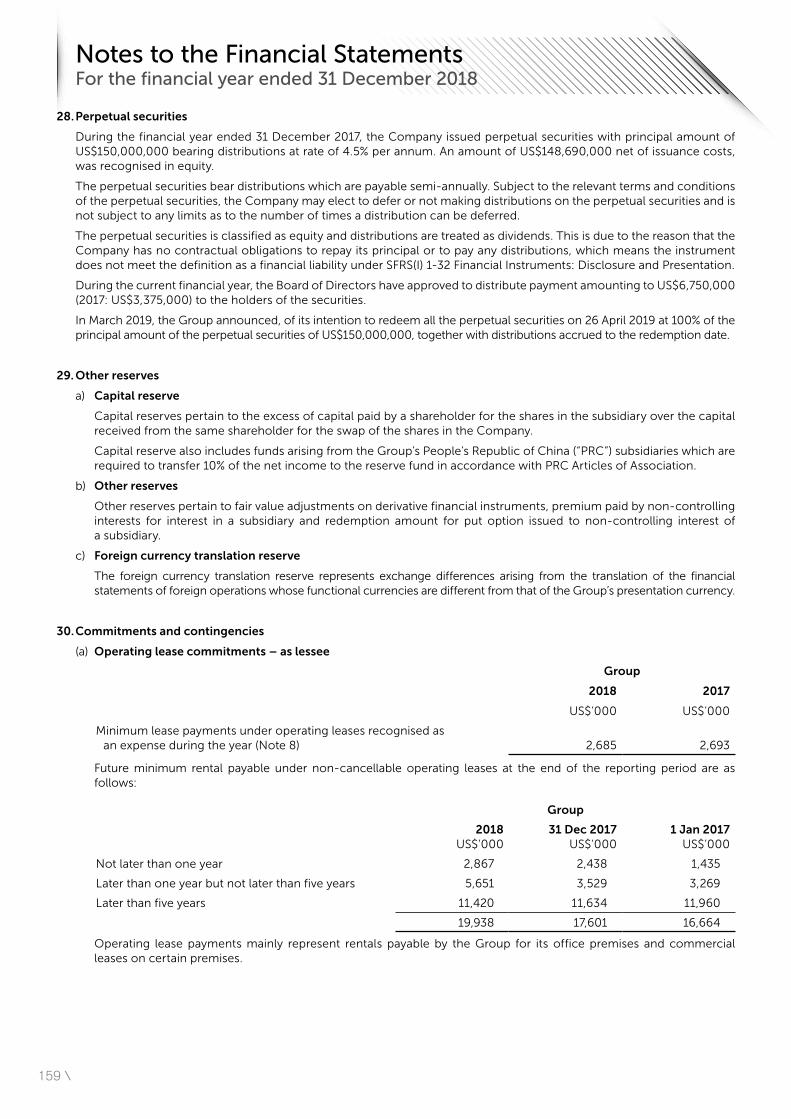
159 \
28. Perpetual securities
During the financial year ended 31 December 2017, the Company issued perpetual securities with principal amount of US$150,000,000 bearing distributions at rate of 4.5% per annum. An amount of US$148,690,000 net of issuance costs, was recognised in equity.
The perpetual securities bear distributions which are payable semi-annually. Subject to the relevant terms and conditions of the perpetual securities, the Company may elect to defer or not making distributions on the perpetual securities and is not subject to any limits as to the number of times a distribution can be deferred.
The perpetual securities is classified as equity and distributions are treated as dividends. This is due to the reason that the Company has no contractual obligations to repay its principal or to pay any distributions, which means the instrument does not meet the definition as a financial liability under SFRS(I) 1-32 Financial Instruments: Disclosure and Presentation.
During the current financial year, the Board of Directors have approved to distribute payment amounting to US$6,750,000 (2017: US$3,375,000) to the holders of the securities.
In March 2019, the Group announced, of its intention to redeem all the perpetual securities on 26 April 2019 at 100% of the principal amount of the perpetual securities of US$150,000,000, together with distributions accrued to the redemption date.
29. Other reserves
a) Capital reserve
Capital reserves pertain to the excess of capital paid by a shareholder for the shares in the subsidiary over the capital received from the same shareholder for the swap of the shares in the Company.
Capital reserve also includes funds arising from the Group’s People’s Republic of China (“PRC”) subsidiaries which are required to transfer 10% of the net income to the reserve fund in accordance with PRC Articles of Association.
b) Other reserves
Other reserves pertain to fair value adjustments on derivative financial instruments, premium paid by non-controlling interests for interest in a subsidiary and redemption amount for put option issued to non-controlling interest of a subsidiary.
c) Foreign currency translation reserve
The foreign currency translation reserve represents exchange differences arising from the translation of the financial statements of foreign operations whose functional currencies are different from that of the Group’s presentation currency.
30. Commitments and contingencies
(a) Operating lease commitments – as lessee
Group
2018 2017
US$’000 US$’000
Minimum lease payments under operating leases recognised as an expense during the year (Note 8) 2,685 2,693
Future minimum rental payable under non-cancellable operating leases at the end of the reporting period are as follows:
Group
2018 US$’000
31 Dec 2017 US$’000
1 Jan 2017 US$’000
Not later than one year 2,867 2,438 1,435
Later than one year but not later than five years 5,651 3,529 3,269
Later than five years 11,420 11,634 11,960
19,938 17,601 16,664
Operating lease payments mainly represent rentals payable by the Group for its office premises and commercial leases on certain premises.
Notes to the Financial Statements For the financial year ended 31 December 2018
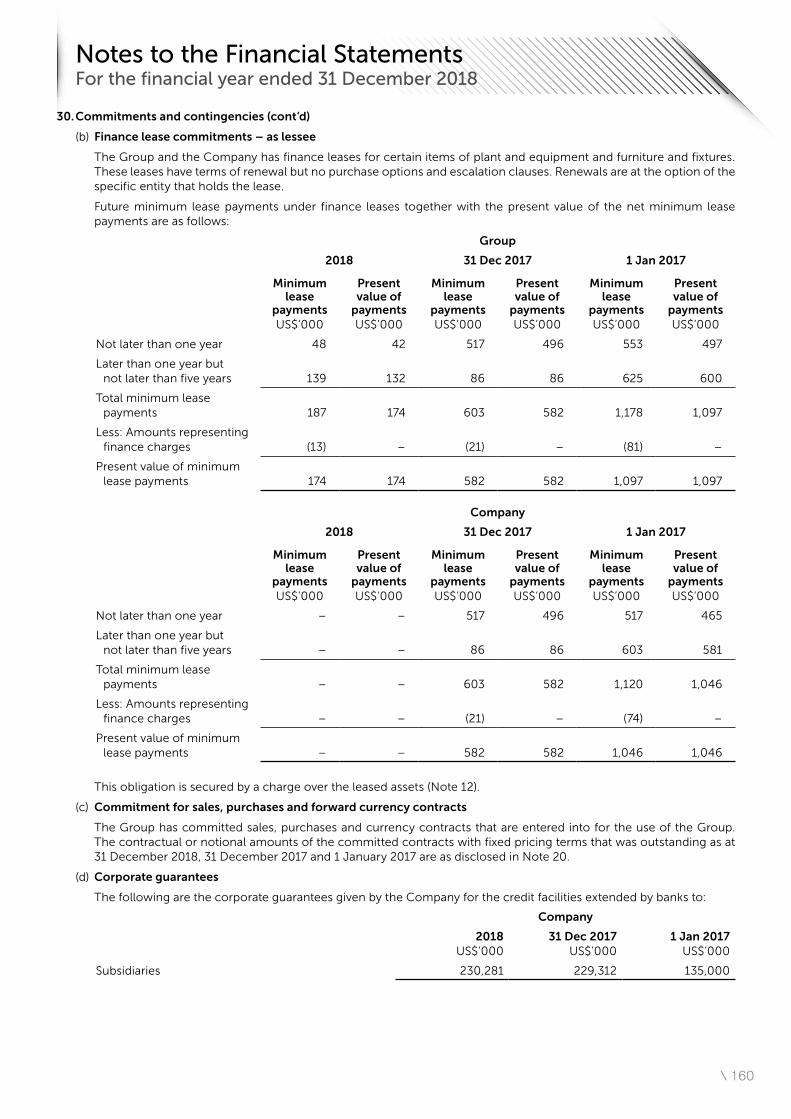
\ 160
30. Commitments and contingencies (cont’d)
(b) Finance lease commitments – as lessee
The Group and the Company has finance leases for certain items of plant and equipment and furniture and fixtures. These leases have terms of renewal but no purchase options and escalation clauses. Renewals are at the option of the specific entity that holds the lease.
Future minimum lease payments under finance leases together with the present value of the net minimum lease payments are as follows:
Group
2018 31 Dec 2017 1 Jan 2017
Minimum lease
payments US$’000
Present value of
payments US$’000
Minimum lease
payments US$’000
Present value of
payments US$’000
Minimum lease
payments US$’000
Present value of
payments US$’000
Not later than one year 48 42 517 496 553 497
Later than one year but not later than five years 139 132 86 86 625 600
Total minimum lease payments 187 174 603 582 1,178 1,097
Less: Amounts representing finance charges (13) – (21) – (81) –
Present value of minimum lease payments 174 174 582 582 1,097 1,097
Company
2018 31 Dec 2017 1 Jan 2017
Minimum lease
payments US$’000
Present value of
payments US$’000
Minimum lease
payments US$’000
Present value of
payments US$’000
Minimum lease
payments US$’000
Present value of
payments US$’000
Not later than one year – – 517 496 517 465
Later than one year but not later than five years – – 86 86 603 581
Total minimum lease payments – – 603 582 1,120 1,046
Less: Amounts representing finance charges – – (21) – (74) –
Present value of minimum lease payments – – 582 582 1,046 1,046
This obligation is secured by a charge over the leased assets (Note 12).
(c) Commitment for sales, purchases and forward currency contracts
The Group has committed sales, purchases and currency contracts that are entered into for the use of the Group. The contractual or notional amounts of the committed contracts with fixed pricing terms that was outstanding as at 31 December 2018, 31 December 2017 and 1 January 2017 are as disclosed in Note 20.
(d) Corporate guarantees
The following are the corporate guarantees given by the Company for the credit facilities extended by banks to:
Company
2018 US$’000
31 Dec 2017 US$’000
1 Jan 2017 US$’000
Subsidiaries 230,281 229,312 135,000
Notes to the Financial Statements For the financial year ended 31 December 2018
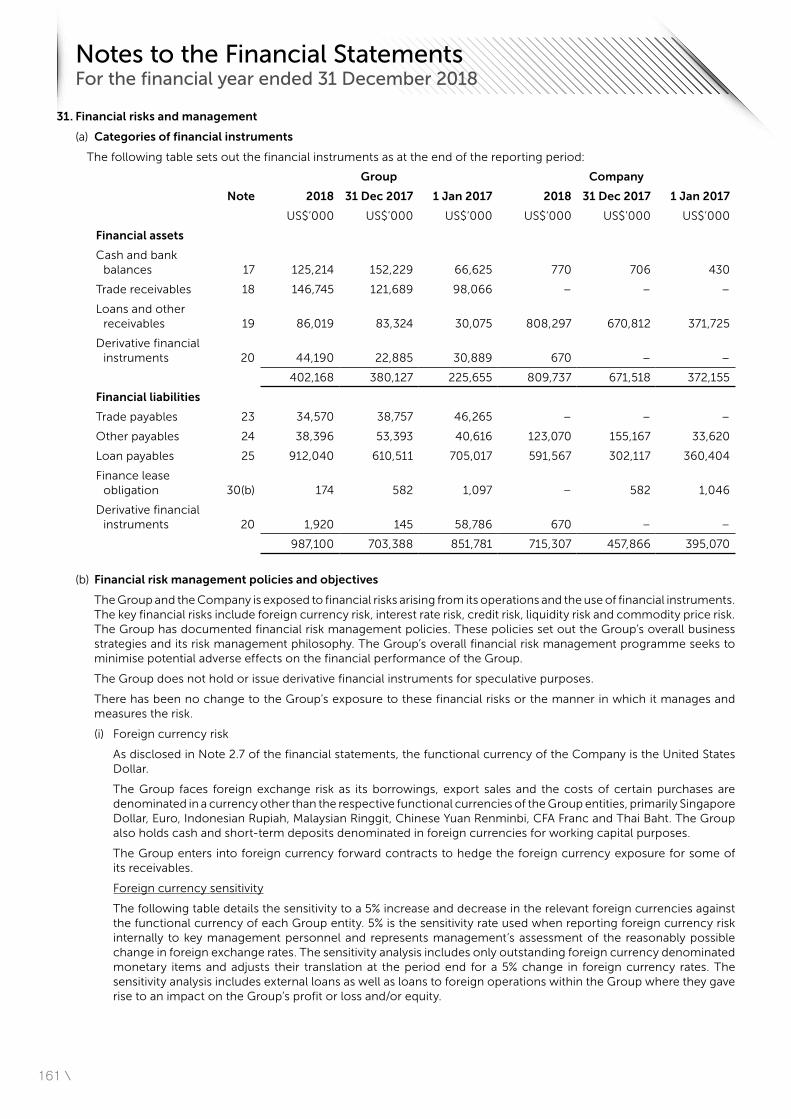
161 \
31. Financial risks and management
(a) Categories of financial instruments
The following table sets out the financial instruments as at the end of the reporting period:
Group Company
Note 2018 31 Dec 2017 1 Jan 2017 2018 31 Dec 2017 1 Jan 2017
US$’000 US$’000 US$’000 US$’000 US$’000 US$’000
Financial assets
Cash and bank balances 17 125,214 152,229 66,625 770 706 430
Trade receivables 18 146,745 121,689 98,066 – – –
Loans and other receivables 19 86,019 83,324 30,075 808,297 670,812 371,725
Derivative financial instruments 20 44,190 22,885 30,889 670 – –
402,168 380,127 225,655 809,737 671,518 372,155
Financial liabilities
Trade payables 23 34,570 38,757 46,265 – – –
Other payables 24 38,396 53,393 40,616 123,070 155,167 33,620
Loan payables 25 912,040 610,511 705,017 591,567 302,117 360,404
Finance lease obligation 30(b) 174 582 1,097 – 582 1,046
Derivative financial instruments 20 1,920 145 58,786 670 – –
987,100 703,388 851,781 715,307 457,866 395,070
(b) Financial risk management policies and objectives
The Group and the Company is exposed to financial risks arising from its operations and the use of financial instruments. The key financial risks include foreign currency risk, interest rate risk, credit risk, liquidity risk and commodity price risk. The Group has documented financial risk management policies. These policies set out the Group’s overall business strategies and its risk management philosophy. The Group’s overall financial risk management programme seeks to minimise potential adverse effects on the financial performance of the Group.
The Group does not hold or issue derivative financial instruments for speculative purposes.
There has been no change to the Group’s exposure to these financial risks or the manner in which it manages and measures the risk.
(i) Foreign currency risk
As disclosed in Note 2.7 of the financial statements, the functional currency of the Company is the United States Dollar.
The Group faces foreign exchange risk as its borrowings, export sales and the costs of certain purchases are denominated in a currency other than the respective functional currencies of the Group entities, primarily Singapore Dollar, Euro, Indonesian Rupiah, Malaysian Ringgit, Chinese Yuan Renminbi, CFA Franc and Thai Baht. The Group also holds cash and short-term deposits denominated in foreign currencies for working capital purposes.
The Group enters into foreign currency forward contracts to hedge the foreign currency exposure for some of its receivables.
Foreign currency sensitivity
The following table details the sensitivity to a 5% increase and decrease in the relevant foreign currencies against the functional currency of each Group entity. 5% is the sensitivity rate used when reporting foreign currency risk internally to key management personnel and represents management’s assessment of the reasonably possible change in foreign exchange rates. The sensitivity analysis includes only outstanding foreign currency denominated monetary items and adjusts their translation at the period end for a 5% change in foreign currency rates. The sensitivity analysis includes external loans as well as loans to foreign operations within the Group where they gave rise to an impact on the Group’s profit or loss and/or equity.
Notes to the Financial Statements For the financial year ended 31 December 2018
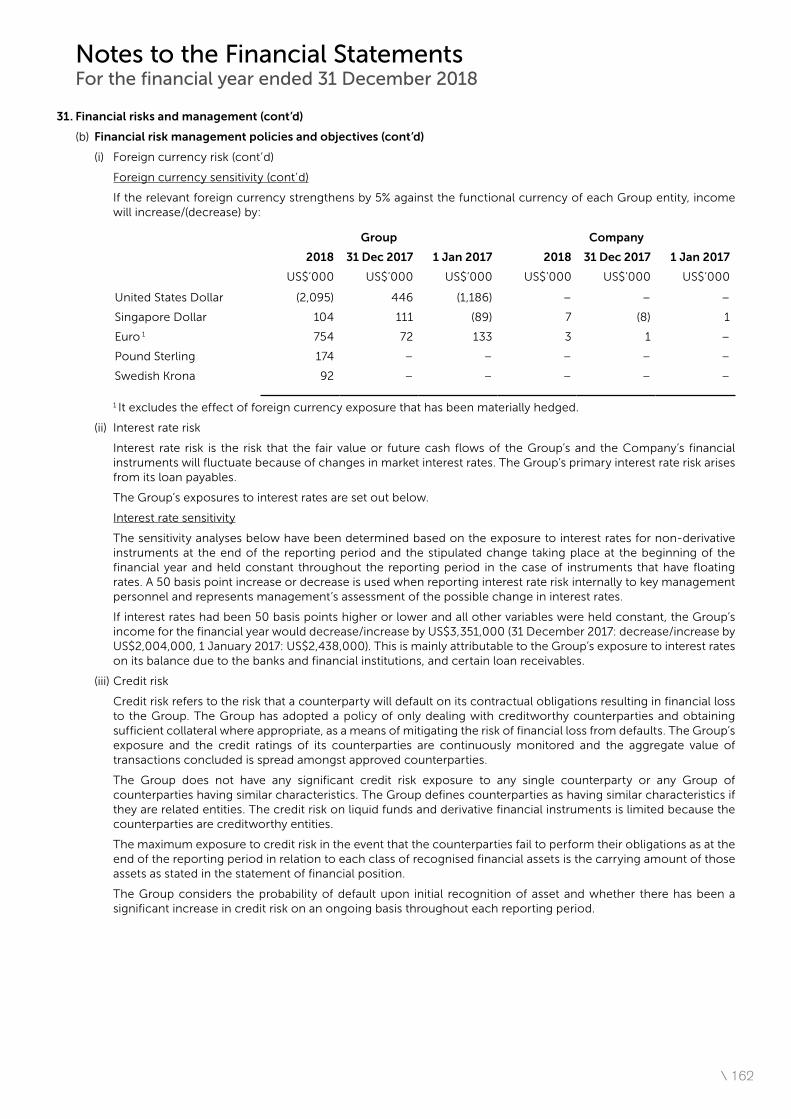
\ 162
31. Financial risks and management (cont’d)
(b) Financial risk management policies and objectives (cont’d)
(i) Foreign currency risk (cont’d)
Foreign currency sensitivity (cont’d)
If the relevant foreign currency strengthens by 5% against the functional currency of each Group entity, income will increase/(decrease) by:
Group Company
2018 31 Dec 2017 1 Jan 2017 2018 31 Dec 2017 1 Jan 2017
US$’000 US$’000 US$’000 US$’000 US$’000 US$’000
United States Dollar (2,095) 446 (1,186) – – –
Singapore Dollar 104 111 (89) 7 (8) 1
Euro 1 754 72 133 3 1 –
Pound Sterling 174 – – – – –
Swedish Krona 92 – – – – –
1 It excludes the effect of foreign currency exposure that has been materially hedged.
(ii) Interest rate risk
Interest rate risk is the risk that the fair value or future cash flows of the Group’s and the Company’s financial instruments will fluctuate because of changes in market interest rates. The Group’s primary interest rate risk arises from its loan payables.
The Group’s exposures to interest rates are set out below.
Interest rate sensitivity
The sensitivity analyses below have been determined based on the exposure to interest rates for non-derivative instruments at the end of the reporting period and the stipulated change taking place at the beginning of the financial year and held constant throughout the reporting period in the case of instruments that have floating rates. A 50 basis point increase or decrease is used when reporting interest rate risk internally to key management personnel and represents management’s assessment of the possible change in interest rates.
If interest rates had been 50 basis points higher or lower and all other variables were held constant, the Group’s income for the financial year would decrease/increase by US$3,351,000 (31 December 2017: decrease/increase by US$2,004,000, 1 January 2017: US$2,438,000). This is mainly attributable to the Group’s exposure to interest rates on its balance due to the banks and financial institutions, and certain loan receivables.
(iii) Credit risk
Credit risk refers to the risk that a counterparty will default on its contractual obligations resulting in financial loss to the Group. The Group has adopted a policy of only dealing with creditworthy counterparties and obtaining sufficient collateral where appropriate, as a means of mitigating the risk of financial loss from defaults. The Group’s exposure and the credit ratings of its counterparties are continuously monitored and the aggregate value of transactions concluded is spread amongst approved counterparties.
The Group does not have any significant credit risk exposure to any single counterparty or any Group of counterparties having similar characteristics. The Group defines counterparties as having similar characteristics if they are related entities. The credit risk on liquid funds and derivative financial instruments is limited because the counterparties are creditworthy entities.
The maximum exposure to credit risk in the event that the counterparties fail to perform their obligations as at the end of the reporting period in relation to each class of recognised financial assets is the carrying amount of those assets as stated in the statement of financial position.
The Group considers the probability of default upon initial recognition of asset and whether there has been a significant increase in credit risk on an ongoing basis throughout each reporting period.
Notes to the Financial Statements For the financial year ended 31 December 2018
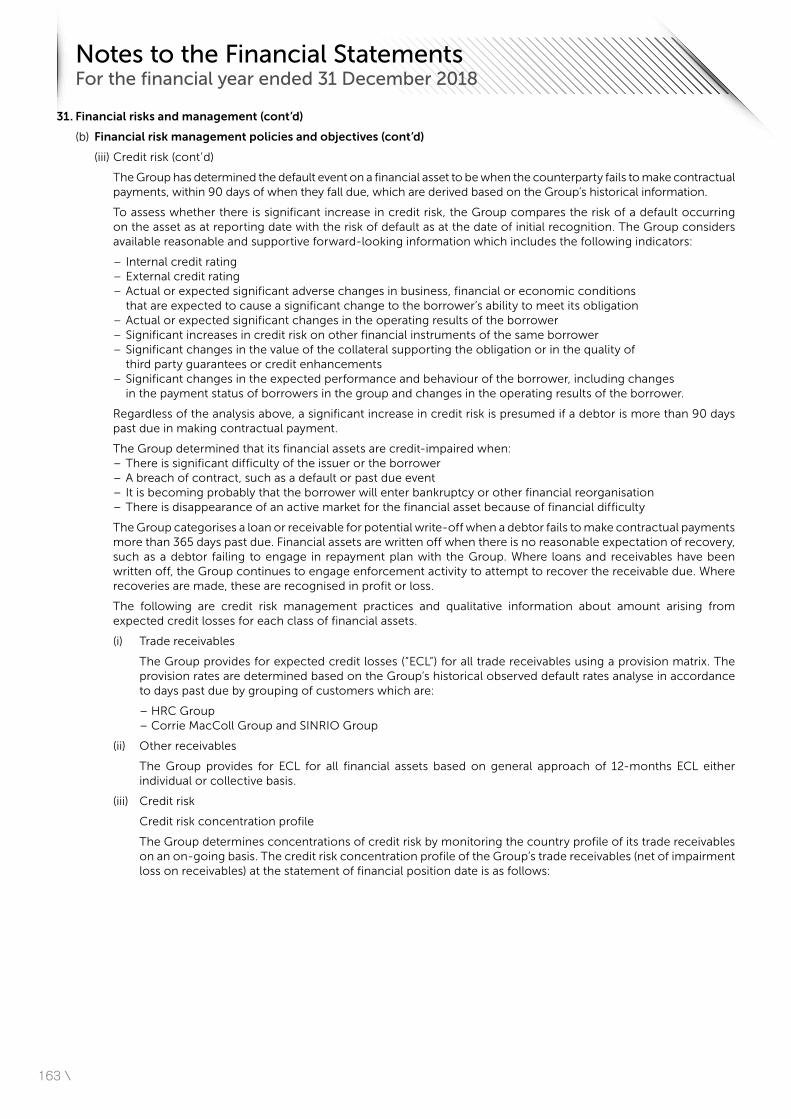
163 \
31. Financial risks and management (cont’d)
(b) Financial risk management policies and objectives (cont’d)
(iii) Credit risk (cont’d)
The Group has determined the default event on a financial asset to be when the counterparty fails to make contractual payments, within 90 days of when they fall due, which are derived based on the Group’s historical information.
To assess whether there is significant increase in credit risk, the Group compares the risk of a default occurring on the asset as at reporting date with the risk of default as at the date of initial recognition. The Group considers available reasonable and supportive forward-looking information which includes the following indicators:
– Internal credit rating – External credit rating – Actual or expected significant adverse changes in business, financial or economic conditions that are expected to cause a significant change to the borrower’s ability to meet its obligation – Actual or expected significant changes in the operating results of the borrower – Significant increases in credit risk on other financial instruments of the same borrower – Significant changes in the value of the collateral supporting the obligation or in the quality of third party guarantees or credit enhancements – Significant changes in the expected performance and behaviour of the borrower, including changes
in the payment status of borrowers in the group and changes in the operating results of the borrower.
Regardless of the analysis above, a significant increase in credit risk is presumed if a debtor is more than 90 days past due in making contractual payment.
The Group determined that its financial assets are credit-impaired when: – There is significant difficulty of the issuer or the borrower – A breach of contract, such as a default or past due event – It is becoming probably that the borrower will enter bankruptcy or other financial reorganisation – There is disappearance of an active market for the financial asset because of financial difficulty
The Group categorises a loan or receivable for potential write-off when a debtor fails to make contractual payments more than 365 days past due. Financial assets are written off when there is no reasonable expectation of recovery, such as a debtor failing to engage in repayment plan with the Group. Where loans and receivables have been written off, the Group continues to engage enforcement activity to attempt to recover the receivable due. Where recoveries are made, these are recognised in profit or loss.
The following are credit risk management practices and qualitative information about amount arising from expected credit losses for each class of financial assets.
(i) Trade receivables
The Group provides for expected credit losses (“ECL”) for all trade receivables using a provision matrix. The provision rates are determined based on the Group’s historical observed default rates analyse in accordance to days past due by grouping of customers which are:
– HRC Group – Corrie MacColl Group and SINRIO Group
(ii) Other receivables
The Group provides for ECL for all financial assets based on general approach of 12-months ECL either individual or collective basis.
(iii) Credit risk
Credit risk concentration profile
The Group determines concentrations of credit risk by monitoring the country profile of its trade receivables on an on-going basis. The credit risk concentration profile of the Group’s trade receivables (net of impairment loss on receivables) at the statement of financial position date is as follows:
Notes to the Financial Statements For the financial year ended 31 December 2018
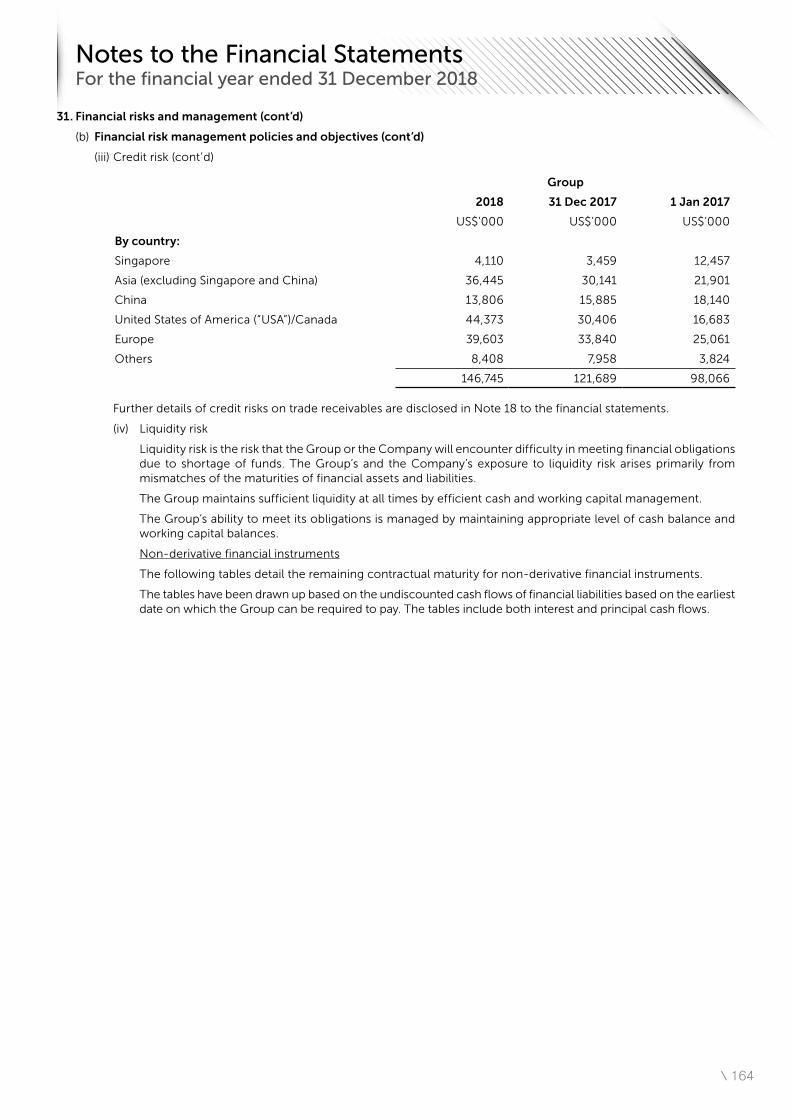
\ 164
31. Financial risks and management (cont’d)
(b) Financial risk management policies and objectives (cont’d)
(iii) Credit risk (cont’d)
Group
2018 31 Dec 2017 1 Jan 2017
US$’000 US$’000 US$’000
By country:
Singapore 4,110 3,459 12,457
Asia (excluding Singapore and China) 36,445 30,141 21,901
China 13,806 15,885 18,140
United States of America (“USA”)/Canada 44,373 30,406 16,683
Europe 39,603 33,840 25,061
Others 8,408 7,958 3,824
146,745 121,689 98,066
Further details of credit risks on trade receivables are disclosed in Note 18 to the financial statements.
(iv) Liquidity risk
Liquidity risk is the risk that the Group or the Company will encounter difficulty in meeting financial obligations due to shortage of funds. The Group’s and the Company’s exposure to liquidity risk arises primarily from mismatches of the maturities of financial assets and liabilities.
The Group maintains sufficient liquidity at all times by efficient cash and working capital management.
The Group’s ability to meet its obligations is managed by maintaining appropriate level of cash balance and working capital balances.
Non-derivative financial instruments
The following tables detail the remaining contractual maturity for non-derivative financial instruments.
The tables have been drawn up based on the undiscounted cash flows of financial liabilities based on the earliest date on which the Group can be required to pay. The tables include both interest and principal cash flows.
Notes to the Financial Statements For the financial year ended 31 December 2018
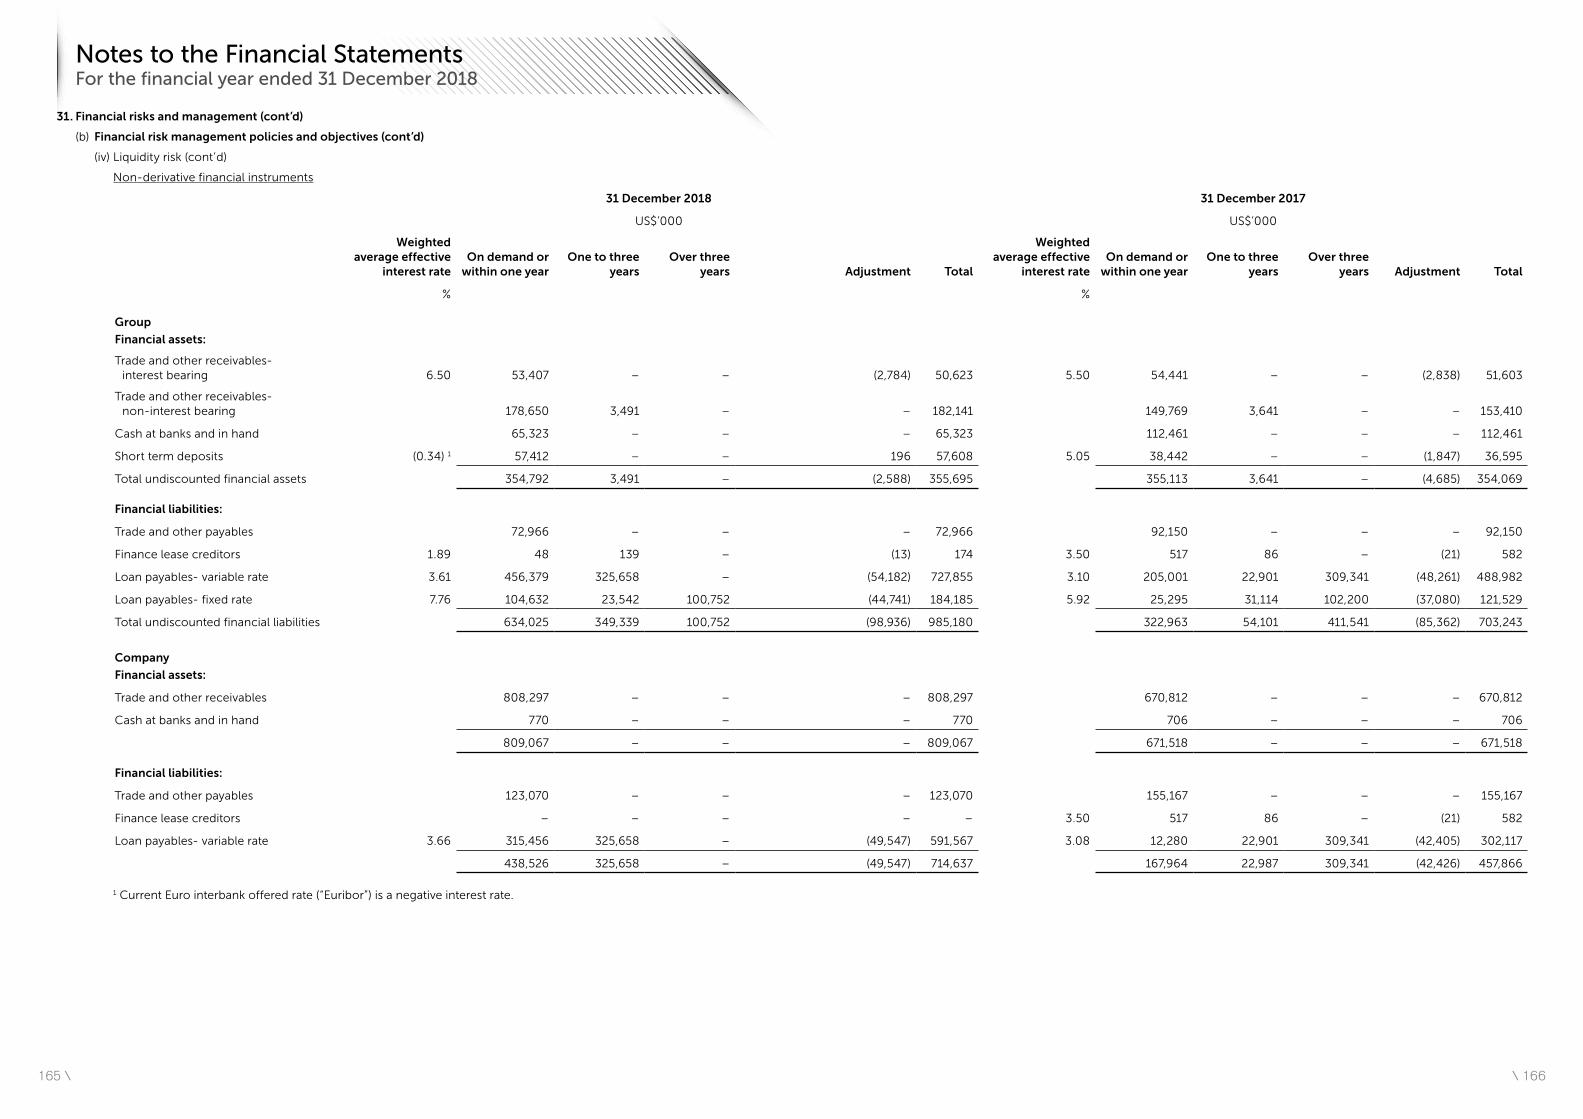
\ 166165 \
31. Financial risks and management (cont’d)
(b) Financial risk management policies and objectives (cont’d)
(iv) Liquidity risk (cont’d)
Non-derivative financial instruments
31 December 2018 31 December 2017
US$’000 US$’000
Weighted average effective
interest rateOn demand or
within one yearOne to three
yearsOver three
years Adjustment Total
Weighted average effective
interest rateOn demand or
within one yearOne to three
yearsOver three
years Adjustment Total
% %
Group
Financial assets:
Trade and other receivables- interest bearing 6.50 53,407 – – (2,784) 50,623 5.50 54,441 – – (2,838) 51,603
Trade and other receivables- non-interest bearing 178,650 3,491 – – 182,141 149,769 3,641 – – 153,410
Cash at banks and in hand 65,323 – – – 65,323 112,461 – – – 112,461
Short term deposits (0.34) 1 57,412 – – 196 57,608 5.05 38,442 – – (1,847) 36,595
Total undiscounted financial assets 354,792 3,491 – (2,588) 355,695 355,113 3,641 – (4,685) 354,069
Financial liabilities:
Trade and other payables 72,966 – – – 72,966 92,150 – – – 92,150
Finance lease creditors 1.89 48 139 – (13) 174 3.50 517 86 – (21) 582
Loan payables- variable rate 3.61 456,379 325,658 – (54,182) 727,855 3.10 205,001 22,901 309,341 (48,261) 488,982
Loan payables- fixed rate 7.76 104,632 23,542 100,752 (44,741) 184,185 5.92 25,295 31,114 102,200 (37,080) 121,529
Total undiscounted financial liabilities 634,025 349,339 100,752 (98,936) 985,180 322,963 54,101 411,541 (85,362) 703,243
Company
Financial assets:
Trade and other receivables 808,297 – – – 808,297 670,812 – – – 670,812
Cash at banks and in hand 770 – – – 770 706 – – – 706
809,067 – – – 809,067 671,518 – – – 671,518
Financial liabilities:
Trade and other payables 123,070 – – – 123,070 155,167 – – – 155,167
Finance lease creditors – – – – – 3.50 517 86 – (21) 582
Loan payables- variable rate 3.66 315,456 325,658 – (49,547) 591,567 3.08 12,280 22,901 309,341 (42,405) 302,117
438,526 325,658 – (49,547) 714,637 167,964 22,987 309,341 (42,426) 457,866
1 Current Euro interbank offered rate (“Euribor”) is a negative interest rate.
Notes to the Financial Statements For the financial year ended 31 December 2018
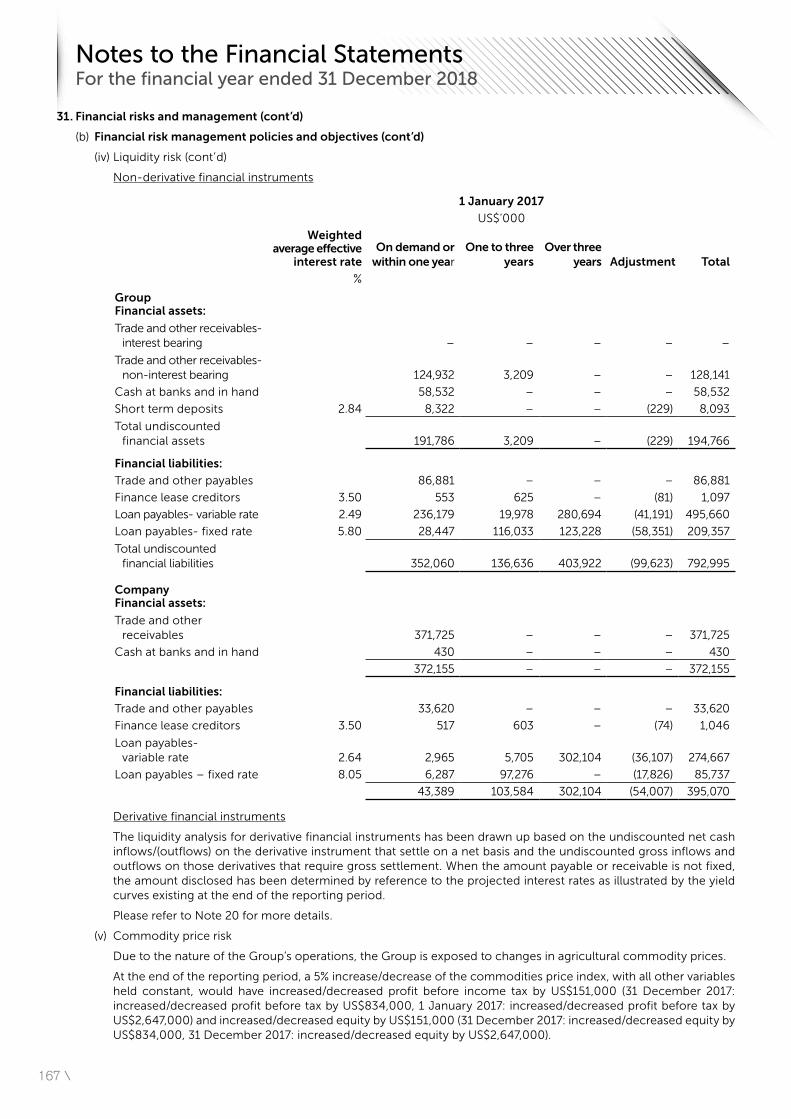
167 \
31. Financial risks and management (cont’d)
(b) Financial risk management policies and objectives (cont’d)
(iv) Liquidity risk (cont’d)
Non-derivative financial instruments
1 January 2017
US$’000
Weighted average effective
interest rateOn demand or
within one yearOne to three
yearsOver three
years Adjustment Total
%
GroupFinancial assets:
Trade and other receivables- interest bearing – – – – –
Trade and other receivables- non-interest bearing 124,932 3,209 – – 128,141
Cash at banks and in hand 58,532 – – – 58,532
Short term deposits 2.84 8,322 – – (229) 8,093
Total undiscounted financial assets 191,786 3,209 – (229) 194,766
Financial liabilities:
Trade and other payables 86,881 – – – 86,881
Finance lease creditors 3.50 553 625 – (81) 1,097
Loan payables- variable rate 2.49 236,179 19,978 280,694 (41,191) 495,660
Loan payables- fixed rate 5.80 28,447 116,033 123,228 (58,351) 209,357
Total undiscounted financial liabilities 352,060 136,636 403,922 (99,623) 792,995
CompanyFinancial assets:
Trade and other receivables 371,725 – – – 371,725
Cash at banks and in hand 430 – – – 430
372,155 – – – 372,155
Financial liabilities:
Trade and other payables 33,620 – – – 33,620
Finance lease creditors 3.50 517 603 – (74) 1,046
Loan payables- variable rate 2.64 2,965 5,705 302,104 (36,107) 274,667
Loan payables – fixed rate 8.05 6,287 97,276 – (17,826) 85,737
43,389 103,584 302,104 (54,007) 395,070
Derivative financial instruments
The liquidity analysis for derivative financial instruments has been drawn up based on the undiscounted net cash inflows/(outflows) on the derivative instrument that settle on a net basis and the undiscounted gross inflows and outflows on those derivatives that require gross settlement. When the amount payable or receivable is not fixed, the amount disclosed has been determined by reference to the projected interest rates as illustrated by the yield curves existing at the end of the reporting period.
Please refer to Note 20 for more details.
(v) Commodity price risk
Due to the nature of the Group’s operations, the Group is exposed to changes in agricultural commodity prices.
At the end of the reporting period, a 5% increase/decrease of the commodities price index, with all other variables held constant, would have increased/decreased profit before income tax by US$151,000 (31 December 2017: increased/decreased profit before tax by US$834,000, 1 January 2017: increased/decreased profit before tax by US$2,647,000) and increased/decreased equity by US$151,000 (31 December 2017: increased/decreased equity by US$834,000, 31 December 2017: increased/decreased equity by US$2,647,000).
Notes to the Financial Statements For the financial year ended 31 December 2018
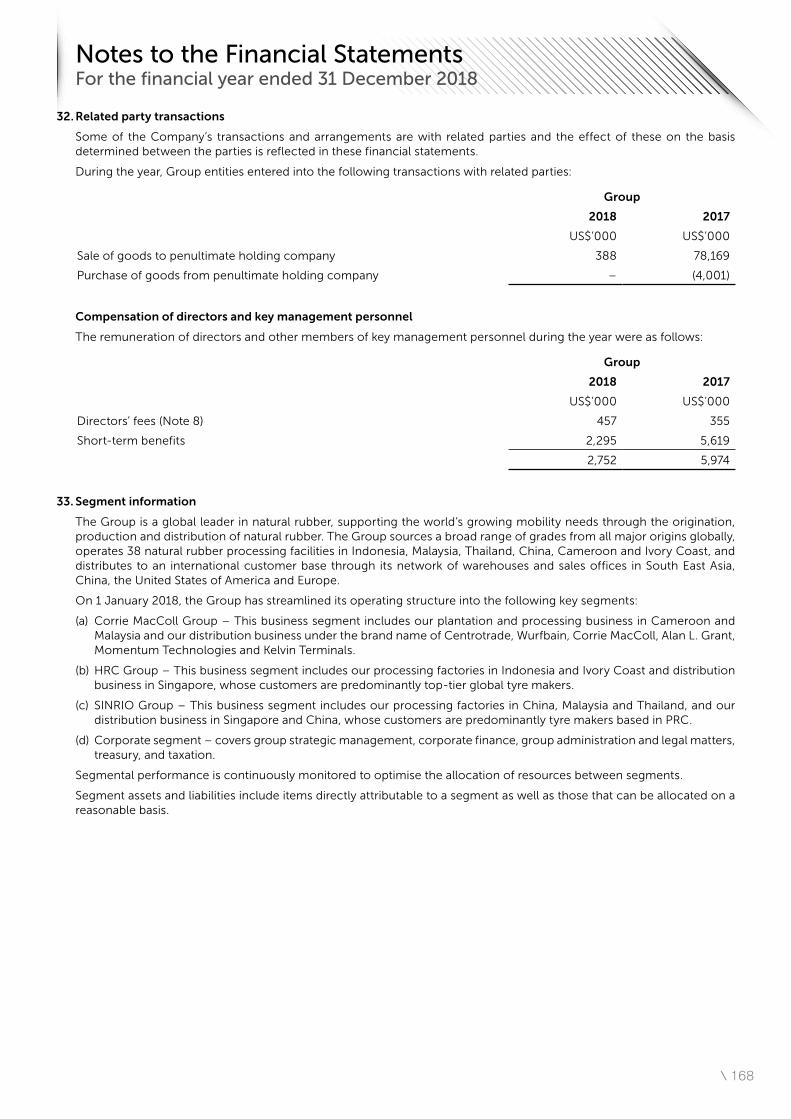
\ 168
32. Related party transactions
Some of the Company’s transactions and arrangements are with related parties and the effect of these on the basis determined between the parties is reflected in these financial statements.
During the year, Group entities entered into the following transactions with related parties:
Group
2018 2017
US$’000 US$’000
Sale of goods to penultimate holding company 388 78,169
Purchase of goods from penultimate holding company – (4,001)
Compensation of directors and key management personnel
The remuneration of directors and other members of key management personnel during the year were as follows:
Group
2018 2017
US$’000 US$’000
Directors’ fees (Note 8) 457 355
Short-term benefits 2,295 5,619
2,752 5,974
33. Segment information
The Group is a global leader in natural rubber, supporting the world’s growing mobility needs through the origination, production and distribution of natural rubber. The Group sources a broad range of grades from all major origins globally, operates 38 natural rubber processing facilities in Indonesia, Malaysia, Thailand, China, Cameroon and Ivory Coast, and distributes to an international customer base through its network of warehouses and sales offices in South East Asia, China, the United States of America and Europe.
On 1 January 2018, the Group has streamlined its operating structure into the following key segments:
(a) Corrie MacColl Group – This business segment includes our plantation and processing business in Cameroon and Malaysia and our distribution business under the brand name of Centrotrade, Wurfbain, Corrie MacColl, Alan L. Grant, Momentum Technologies and Kelvin Terminals.
(b) HRC Group – This business segment includes our processing factories in Indonesia and Ivory Coast and distribution business in Singapore, whose customers are predominantly top-tier global tyre makers.
(c) SINRIO Group – This business segment includes our processing factories in China, Malaysia and Thailand, and our distribution business in Singapore and China, whose customers are predominantly tyre makers based in PRC.
(d) Corporate segment – covers group strategic management, corporate finance, group administration and legal matters, treasury, and taxation.
Segmental performance is continuously monitored to optimise the allocation of resources between segments.
Segment assets and liabilities include items directly attributable to a segment as well as those that can be allocated on a reasonable basis.
Notes to the Financial Statements For the financial year ended 31 December 2018
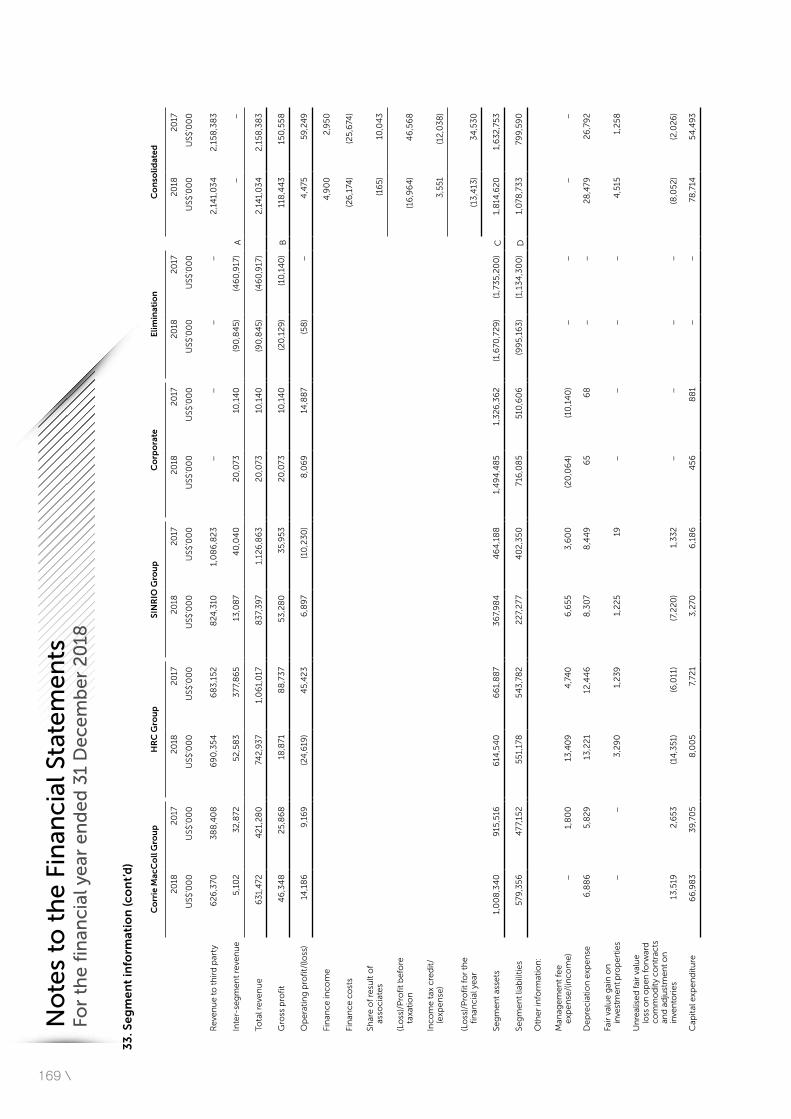
169 \
33
. Se
gm
en
t in
form
atio
n (c
on
t’d
)
Co
rrie
Mac
Co
ll G
rou
pH
RC
Gro
up
SIN
RIO
Gro
up
Co
rpo
rate
Elim
inat
ion
Co
nso
lidat
ed
20
18
US$
’00
0
20
17
US$
’00
0
20
18
US$
’00
0
20
17
US$
’00
0
20
18
US$
’00
0
20
17
US$
’00
0
20
18
US$
’00
0
20
17
US$
’00
0
20
18
US$
’00
0
20
17
US$
’00
0
20
18
US$
’00
0
20
17
US$
’00
0
Rev
en
ue
to t
hir
d p
arty
62
6,3
703
88
,40
86
90
,35
46
83
,15
28
24,3
101,
08
6,8
23
––
––
2,1
41,
03
42
,15
8,3
83
Inte
r-se
gm
en
t re
ven
ue
5,1
02
32
,872
52
,58
33
77,8
65
13,0
87
40
,04
02
0,0
7310
,14
0(9
0,8
45)
(46
0,9
17)
A–
–
Tota
l rev
en
ue
631
,472
42
1,2
80
742
,93
71,
06
1,0
178
37,
397
1,12
6,8
63
20
,073
10,1
40
(90
,84
5)(4
60
,917
)2
,14
1,0
34
2,1
58
,38
3
Gro
ss p
rofi
t4
6,3
48
25
,86
818
,871
88
,73
75
3,2
80
35
,95
32
0,0
7310
,14
0(2
0,1
29
)(1
0,1
40
)B
118
,44
315
0,5
58
Op
era
tin
g p
rofi
t/(lo
ss)
14,1
86
9,1
69
(24
,619
)4
5,4
23
6,8
97
(10
,23
0)
8,0
69
14,8
87
(58
)–
4,4
7559
,24
9
Fin
ance
inco
me
4,9
00
2,9
50
Fin
ance
co
sts
(26
,174
)(2
5,6
74)
Shar
e o
f re
sult
of
asso
ciat
es
(16
5)10
,04
3
(Lo
ss)/
Pro
fit
bef
ore
ta
xati
on
(16
,96
4)
46
,56
8
Inco
me
tax
cre
dit
/(e
xpe
nse
)3
,551
(12
,03
8)
(Lo
ss)/
Pro
fit
for
the
fi
nan
cial
ye
ar(1
3,4
13)
34
,53
0
Seg
me
nt
asse
ts1,
00
8,3
40
915
,516
614
,54
06
61,
88
73
67,
98
44
64
,18
81,
49
4,4
85
1,3
26,3
62
(1,6
70,7
29
)(1
,73
5,2
00
)C
1,8
14,6
20
1,6
32
,75
3
Seg
me
nt
liab
iliti
es
579
,35
64
77,1
52
551
,178
54
3,7
82
22
7,2
774
02
,35
071
6,0
85
510
,60
6(9
95
,16
3)
(1,1
34
,30
0)
D1,
078
,73
379
9,5
90
Oth
er
info
rmat
ion
:
Man
age
me
nt
fee
e
xpe
nse
/(in
com
e)–
1,8
00
13,4
09
4,7
40
6,6
55
3,6
00
(20
,06
4)
(10
,14
0)
––
––
De
pre
ciat
ion
exp
en
se
6,8
86
5,8
29
13,2
21
12,4
46
8,3
07
8,4
49
65
68
––
28
,479
26
,79
2
Fair
val
ue
gai
n o
n
inve
stm
ent p
rop
ertie
s–
–3
,29
01,
239
1,2
25
19–
––
–4
,515
1,2
58
Un
real
ise
d f
air
valu
e
loss
on
op
en fo
rwar
d
com
mo
dit
y co
ntr
acts
an
d a
dju
stm
ent o
n
inve
nto
ries
13,5
192
,65
3(1
4,3
51)
(6,0
11)
(7,2
20
)1,
33
2–
––
–(8
,05
2)
(2,0
26
)
Cap
ital
exp
en
dit
ure
66
,98
339
,70
58
,00
57,
721
3,2
706
,18
64
56
88
1–
–78
,714
54
,49
3
No
tes
to t
he
Fin
anci
al S
tate
me
nts
Fo
r th
e f
inan
cial
ye
ar e
nd
ed
31
De
cem
be
r 2
018
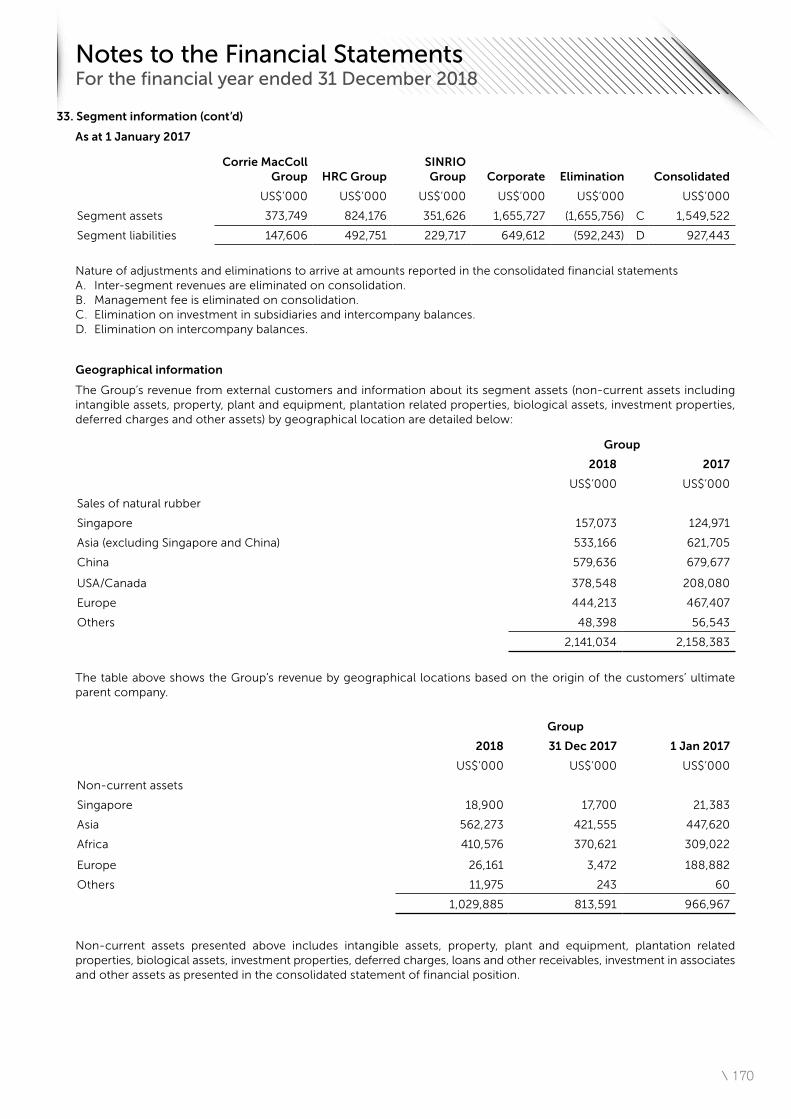
\ 170
33. Segment information (cont’d)
As at 1 January 2017
Corrie MacColl Group HRC Group
SINRIO Group Corporate Elimination Consolidated
US$’000 US$’000 US$’000 US$’000 US$’000 US$’000
Segment assets 373,749 824,176 351,626 1,655,727 (1,655,756) C 1,549,522
Segment liabilities 147,606 492,751 229,717 649,612 (592,243) D 927,443
Nature of adjustments and eliminations to arrive at amounts reported in the consolidated financial statements A. Inter-segment revenues are eliminated on consolidation. B. Management fee is eliminated on consolidation. C. Elimination on investment in subsidiaries and intercompany balances. D. Elimination on intercompany balances.
Geographical information
The Group’s revenue from external customers and information about its segment assets (non-current assets including intangible assets, property, plant and equipment, plantation related properties, biological assets, investment properties, deferred charges and other assets) by geographical location are detailed below:
Group
2018 2017
US$’000 US$’000
Sales of natural rubber
Singapore 157,073 124,971
Asia (excluding Singapore and China) 533,166 621,705
China 579,636 679,677
USA/Canada 378,548 208,080
Europe 444,213 467,407
Others 48,398 56,543
2,141,034 2,158,383
The table above shows the Group’s revenue by geographical locations based on the origin of the customers’ ultimate parent company.
Group
2018 31 Dec 2017 1 Jan 2017
US$’000 US$’000 US$’000
Non-current assets
Singapore 18,900 17,700 21,383
Asia 562,273 421,555 447,620
Africa 410,576 370,621 309,022
Europe 26,161 3,472 188,882
Others 11,975 243 60
1,029,885 813,591 966,967
Non-current assets presented above includes intangible assets, property, plant and equipment, plantation related properties, biological assets, investment properties, deferred charges, loans and other receivables, investment in associates and other assets as presented in the consolidated statement of financial position.
Notes to the Financial Statements For the financial year ended 31 December 2018
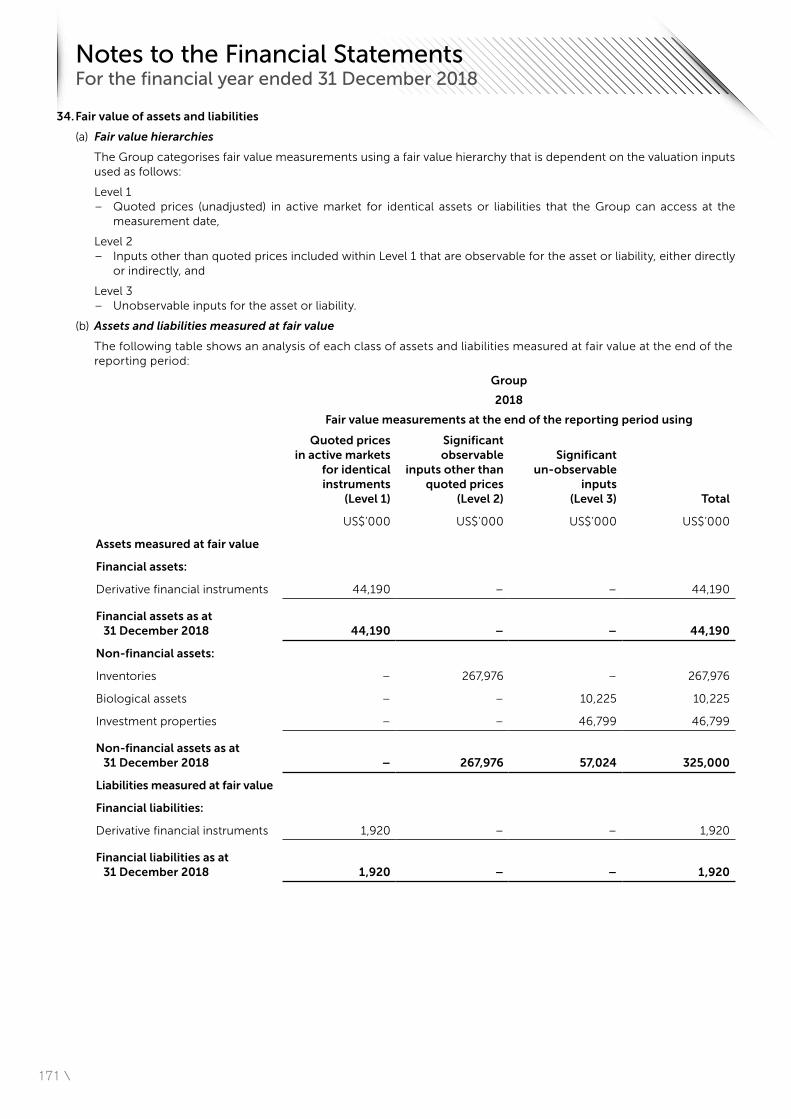
171 \
34. Fair value of assets and liabilities
(a) Fair value hierarchies
The Group categorises fair value measurements using a fair value hierarchy that is dependent on the valuation inputs used as follows:
Level 1 – Quoted prices (unadjusted) in active market for identical assets or liabilities that the Group can access at the
measurement date,
Level 2 – Inputs other than quoted prices included within Level 1 that are observable for the asset or liability, either directly
or indirectly, and
Level 3 – Unobservable inputs for the asset or liability.
(b) Assets and liabilities measured at fair value
The following table shows an analysis of each class of assets and liabilities measured at fair value at the end of the reporting period:
Group
2018
Fair value measurements at the end of the reporting period using
Quoted prices in active markets
for identical instruments
(Level 1)
Significant observable
inputs other than quoted prices
(Level 2)
Significant un-observable
inputs (Level 3) Total
US$’000 US$’000 US$’000 US$’000
Assets measured at fair value
Financial assets:
Derivative financial instruments 44,190 – – 44,190
Financial assets as at 31 December 2018 44,190 – – 44,190
Non-financial assets:
Inventories – 267,976 – 267,976
Biological assets – – 10,225 10,225
Investment properties – – 46,799 46,799
Non-financial assets as at 31 December 2018 – 267,976 57,024 325,000
Liabilities measured at fair value
Financial liabilities:
Derivative financial instruments 1,920 – – 1,920
Financial liabilities as at 31 December 2018 1,920 – – 1,920
Notes to the Financial Statements For the financial year ended 31 December 2018
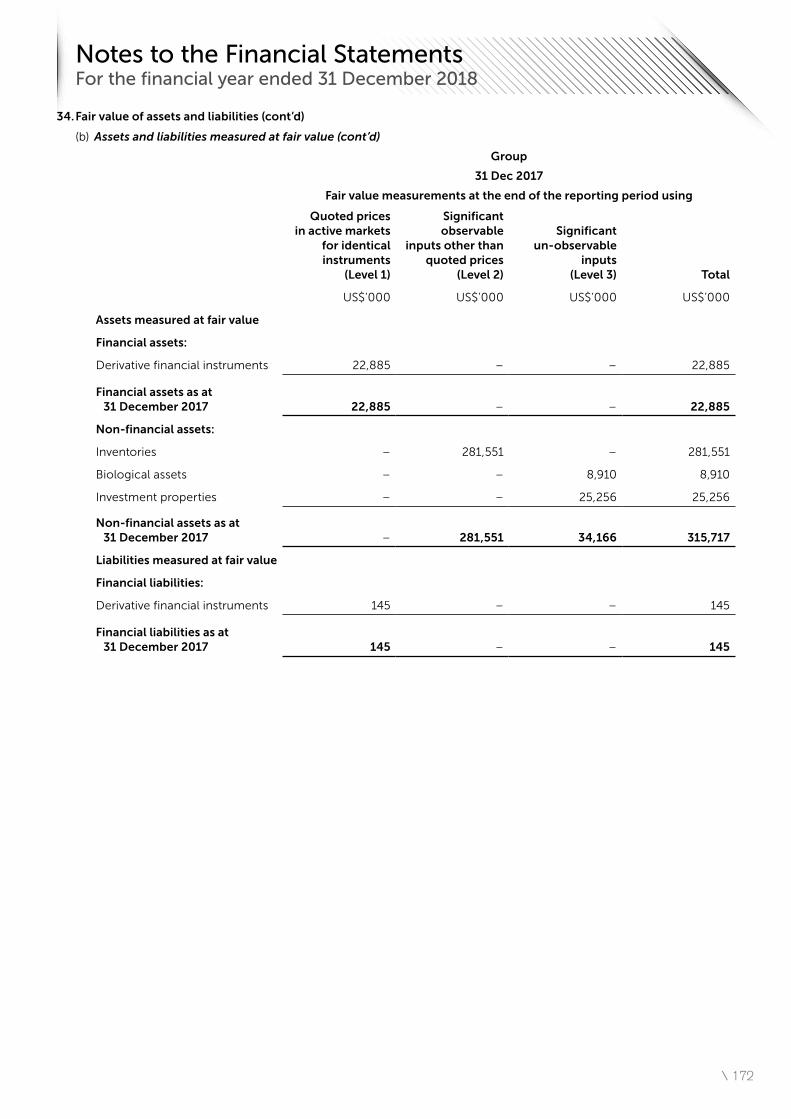
\ 172
34. Fair value of assets and liabilities (cont’d)
(b) Assets and liabilities measured at fair value (cont’d)
Group
31 Dec 2017
Fair value measurements at the end of the reporting period using
Quoted prices in active markets
for identical instruments
(Level 1)
Significant observable
inputs other than quoted prices
(Level 2)
Significant un-observable
inputs (Level 3) Total
US$’000 US$’000 US$’000 US$’000
Assets measured at fair value
Financial assets:
Derivative financial instruments 22,885 – – 22,885
Financial assets as at 31 December 2017 22,885 – – 22,885
Non-financial assets:
Inventories – 281,551 – 281,551
Biological assets – – 8,910 8,910
Investment properties – – 25,256 25,256
Non-financial assets as at 31 December 2017 – 281,551 34,166 315,717
Liabilities measured at fair value
Financial liabilities:
Derivative financial instruments 145 – – 145
Financial liabilities as at 31 December 2017 145 – – 145
Notes to the Financial Statements For the financial year ended 31 December 2018
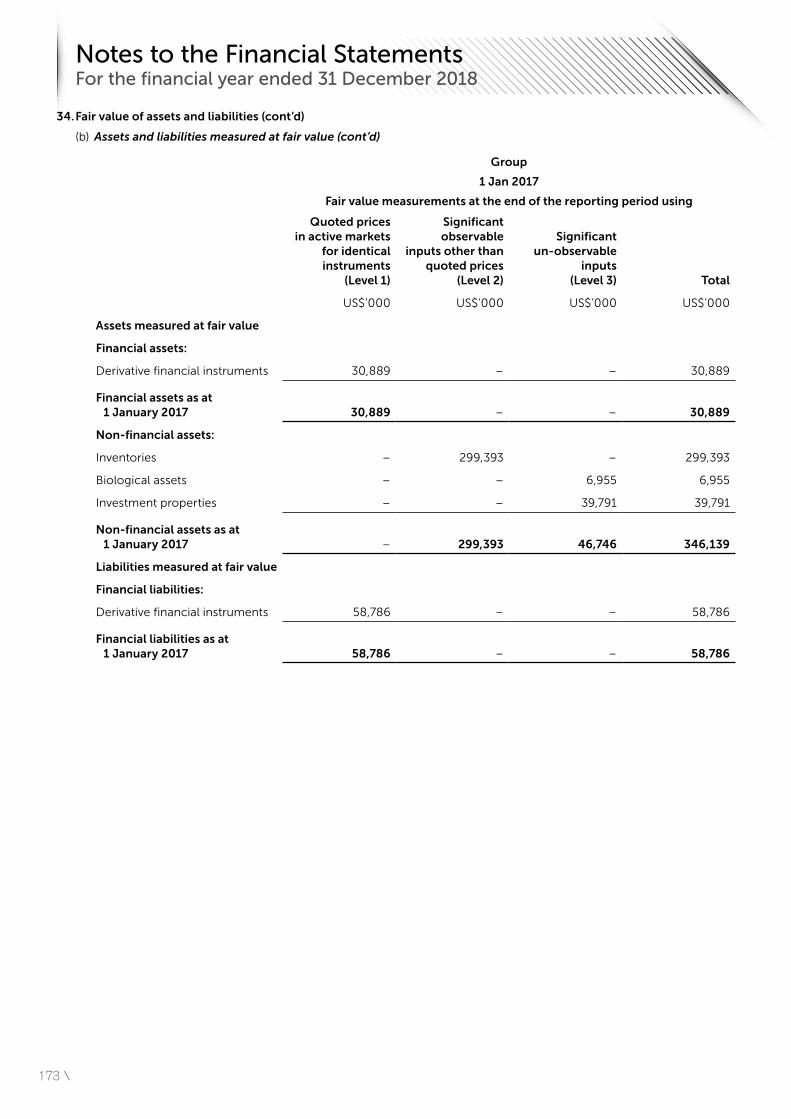
173 \
34. Fair value of assets and liabilities (cont’d)
(b) Assets and liabilities measured at fair value (cont’d)
Group
1 Jan 2017
Fair value measurements at the end of the reporting period using
Quoted prices in active markets
for identical instruments
(Level 1)
Significant observable
inputs other than quoted prices
(Level 2)
Significant un-observable
inputs (Level 3) Total
US$’000 US$’000 US$’000 US$’000
Assets measured at fair value
Financial assets:
Derivative financial instruments 30,889 – – 30,889
Financial assets as at 1 January 2017 30,889 – – 30,889
Non-financial assets:
Inventories – 299,393 – 299,393
Biological assets – – 6,955 6,955
Investment properties – – 39,791 39,791
Non-financial assets as at 1 January 2017 – 299,393 46,746 346,139
Liabilities measured at fair value
Financial liabilities:
Derivative financial instruments 58,786 – – 58,786
Financial liabilities as at 1 January 2017 58,786 – – 58,786
Notes to the Financial Statements For the financial year ended 31 December 2018
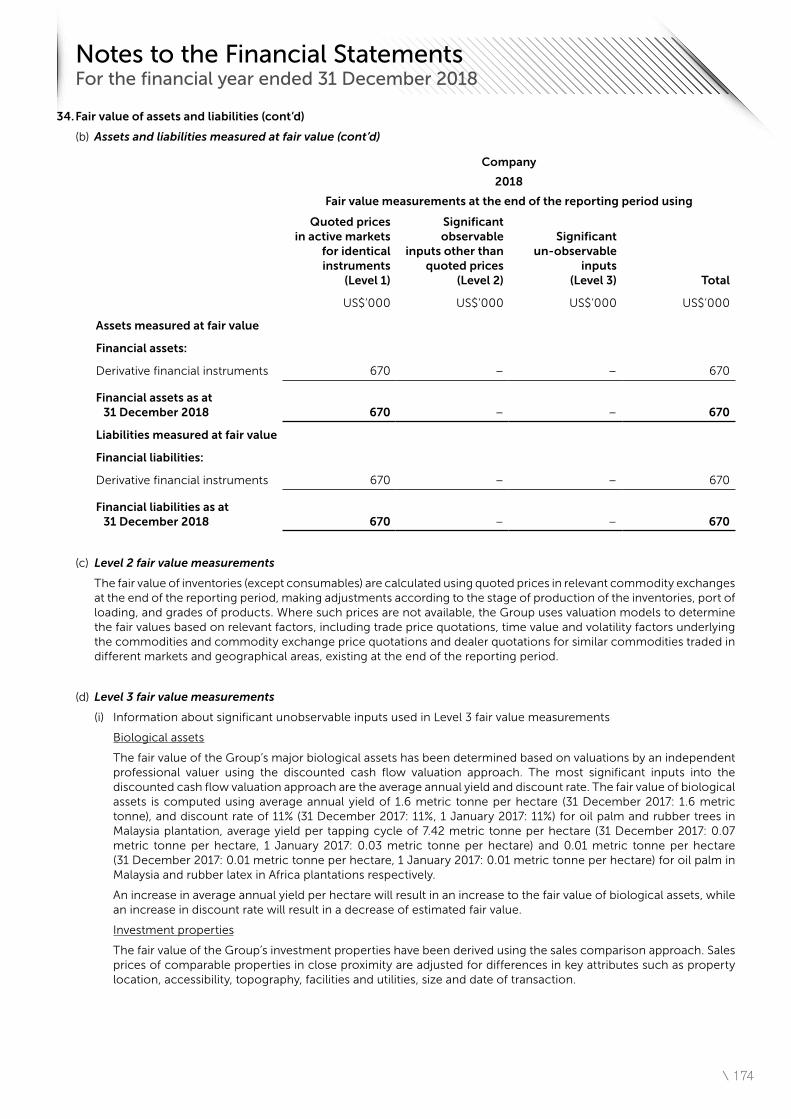
\ 174
34. Fair value of assets and liabilities (cont’d)
(b) Assets and liabilities measured at fair value (cont’d)
Company
2018
Fair value measurements at the end of the reporting period using
Quoted prices in active markets
for identical instruments
(Level 1)
Significant observable
inputs other than quoted prices
(Level 2)
Significant un-observable
inputs (Level 3) Total
US$’000 US$’000 US$’000 US$’000
Assets measured at fair value
Financial assets:
Derivative financial instruments 670 – – 670
Financial assets as at 31 December 2018 670 – – 670
Liabilities measured at fair value
Financial liabilities:
Derivative financial instruments 670 – – 670
Financial liabilities as at 31 December 2018 670 – – 670
(c) Level 2 fair value measurements
The fair value of inventories (except consumables) are calculated using quoted prices in relevant commodity exchanges at the end of the reporting period, making adjustments according to the stage of production of the inventories, port of loading, and grades of products. Where such prices are not available, the Group uses valuation models to determine the fair values based on relevant factors, including trade price quotations, time value and volatility factors underlying the commodities and commodity exchange price quotations and dealer quotations for similar commodities traded in different markets and geographical areas, existing at the end of the reporting period.
(d) Level 3 fair value measurements
(i) Information about significant unobservable inputs used in Level 3 fair value measurements
Biological assets
The fair value of the Group’s major biological assets has been determined based on valuations by an independent professional valuer using the discounted cash flow valuation approach. The most significant inputs into the discounted cash flow valuation approach are the average annual yield and discount rate. The fair value of biological assets is computed using average annual yield of 1.6 metric tonne per hectare (31 December 2017: 1.6 metric tonne), and discount rate of 11% (31 December 2017: 11%, 1 January 2017: 11%) for oil palm and rubber trees in Malaysia plantation, average yield per tapping cycle of 7.42 metric tonne per hectare (31 December 2017: 0.07 metric tonne per hectare, 1 January 2017: 0.03 metric tonne per hectare) and 0.01 metric tonne per hectare (31 December 2017: 0.01 metric tonne per hectare, 1 January 2017: 0.01 metric tonne per hectare) for oil palm in Malaysia and rubber latex in Africa plantations respectively.
An increase in average annual yield per hectare will result in an increase to the fair value of biological assets, while an increase in discount rate will result in a decrease of estimated fair value.
Investment properties
The fair value of the Group’s investment properties have been derived using the sales comparison approach. Sales prices of comparable properties in close proximity are adjusted for differences in key attributes such as property location, accessibility, topography, facilities and utilities, size and date of transaction.
Notes to the Financial Statements For the financial year ended 31 December 2018
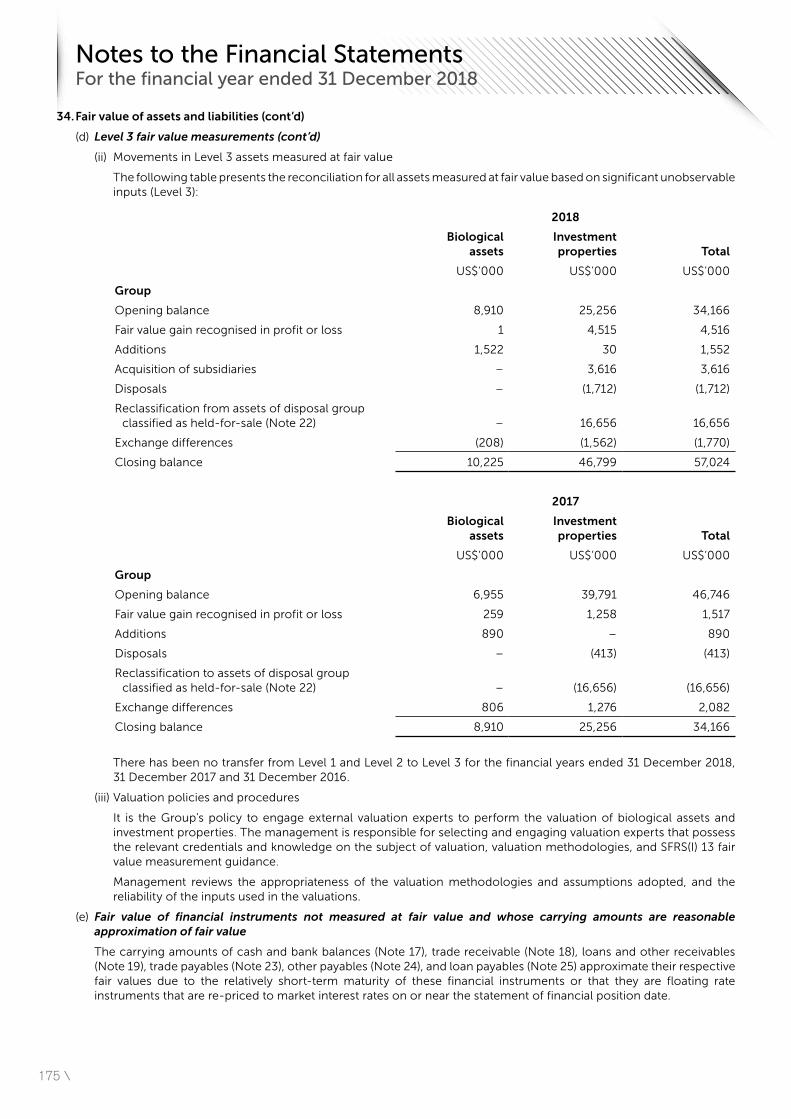
175 \
34. Fair value of assets and liabilities (cont’d)
(d) Level 3 fair value measurements (cont’d)
(ii) Movements in Level 3 assets measured at fair value
The following table presents the reconciliation for all assets measured at fair value based on significant unobservable inputs (Level 3):
2018
Biological assets
Investment properties Total
US$’000 US$’000 US$’000
Group
Opening balance 8,910 25,256 34,166
Fair value gain recognised in profit or loss 1 4,515 4,516
Additions 1,522 30 1,552
Acquisition of subsidiaries – 3,616 3,616
Disposals – (1,712) (1,712)
Reclassification from assets of disposal group classified as held-for-sale (Note 22) – 16,656 16,656
Exchange differences (208) (1,562) (1,770)
Closing balance 10,225 46,799 57,024
2017
Biological assets
Investment properties Total
US$’000 US$’000 US$’000
Group
Opening balance 6,955 39,791 46,746
Fair value gain recognised in profit or loss 259 1,258 1,517
Additions 890 – 890
Disposals – (413) (413)
Reclassification to assets of disposal group classified as held-for-sale (Note 22) – (16,656) (16,656)
Exchange differences 806 1,276 2,082
Closing balance 8,910 25,256 34,166
There has been no transfer from Level 1 and Level 2 to Level 3 for the financial years ended 31 December 2018, 31 December 2017 and 31 December 2016.
(iii) Valuation policies and procedures
It is the Group’s policy to engage external valuation experts to perform the valuation of biological assets and investment properties. The management is responsible for selecting and engaging valuation experts that possess the relevant credentials and knowledge on the subject of valuation, valuation methodologies, and SFRS(I) 13 fair value measurement guidance.
Management reviews the appropriateness of the valuation methodologies and assumptions adopted, and the reliability of the inputs used in the valuations.
(e) Fair value of financial instruments not measured at fair value and whose carrying amounts are reasonable approximation of fair value
The carrying amounts of cash and bank balances (Note 17), trade receivable (Note 18), loans and other receivables (Note 19), trade payables (Note 23), other payables (Note 24), and loan payables (Note 25) approximate their respective fair values due to the relatively short-term maturity of these financial instruments or that they are floating rate instruments that are re-priced to market interest rates on or near the statement of financial position date.
Notes to the Financial Statements For the financial year ended 31 December 2018
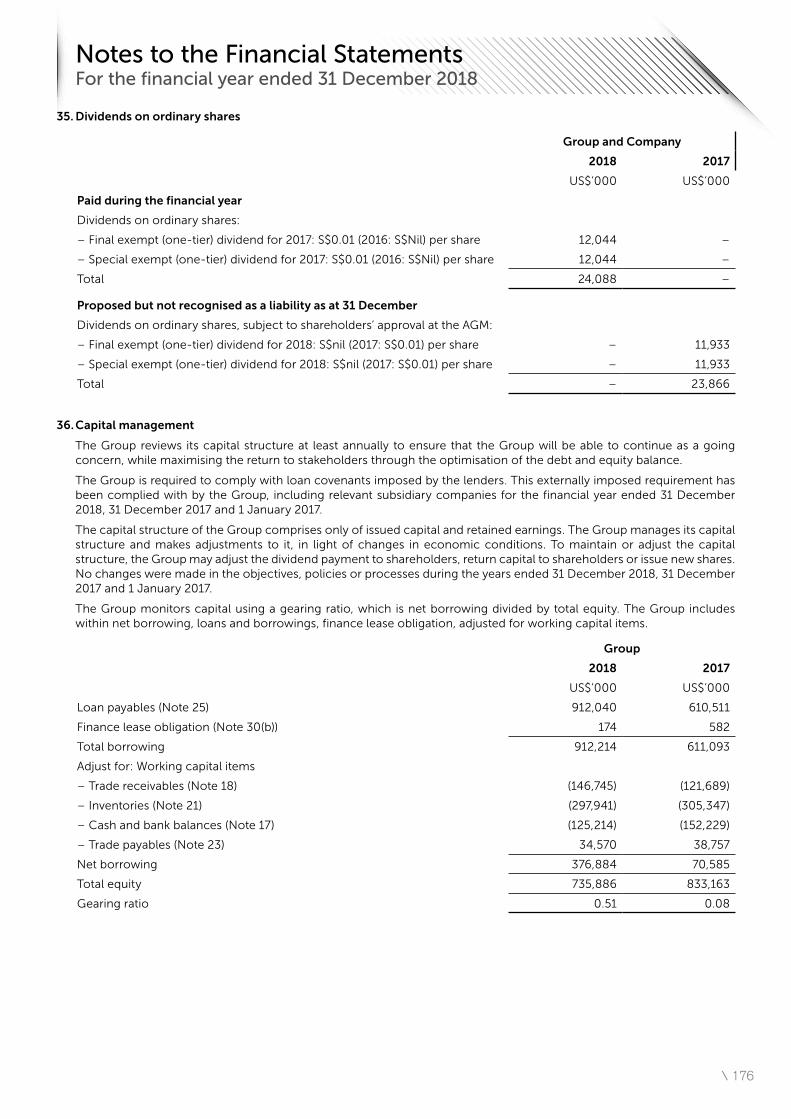
\ 176
35. Dividends on ordinary shares
Group and Company
2018 2017
US$’000 US$’000
Paid during the financial year
Dividends on ordinary shares:
– Final exempt (one-tier) dividend for 2017: S$0.01 (2016: S$Nil) per share 12,044 –
– Special exempt (one-tier) dividend for 2017: S$0.01 (2016: S$Nil) per share 12,044 –
Total 24,088 –
Proposed but not recognised as a liability as at 31 December
Dividends on ordinary shares, subject to shareholders’ approval at the AGM:
– Final exempt (one-tier) dividend for 2018: S$nil (2017: S$0.01) per share – 11,933
– Special exempt (one-tier) dividend for 2018: S$nil (2017: S$0.01) per share – 11,933
Total – 23,866
36. Capital management
The Group reviews its capital structure at least annually to ensure that the Group will be able to continue as a going concern, while maximising the return to stakeholders through the optimisation of the debt and equity balance.
The Group is required to comply with loan covenants imposed by the lenders. This externally imposed requirement has been complied with by the Group, including relevant subsidiary companies for the financial year ended 31 December 2018, 31 December 2017 and 1 January 2017.
The capital structure of the Group comprises only of issued capital and retained earnings. The Group manages its capital structure and makes adjustments to it, in light of changes in economic conditions. To maintain or adjust the capital structure, the Group may adjust the dividend payment to shareholders, return capital to shareholders or issue new shares. No changes were made in the objectives, policies or processes during the years ended 31 December 2018, 31 December 2017 and 1 January 2017.
The Group monitors capital using a gearing ratio, which is net borrowing divided by total equity. The Group includes within net borrowing, loans and borrowings, finance lease obligation, adjusted for working capital items.
Group
2018 2017
US$’000 US$’000
Loan payables (Note 25) 912,040 610,511
Finance lease obligation (Note 30(b)) 174 582
Total borrowing 912,214 611,093
Adjust for: Working capital items
– Trade receivables (Note 18) (146,745) (121,689)
– Inventories (Note 21) (297,941) (305,347)
– Cash and bank balances (Note 17) (125,214) (152,229)
– Trade payables (Note 23) 34,570 38,757
Net borrowing 376,884 70,585
Total equity 735,886 833,163
Gearing ratio 0.51 0.08
Notes to the Financial Statements For the financial year ended 31 December 2018
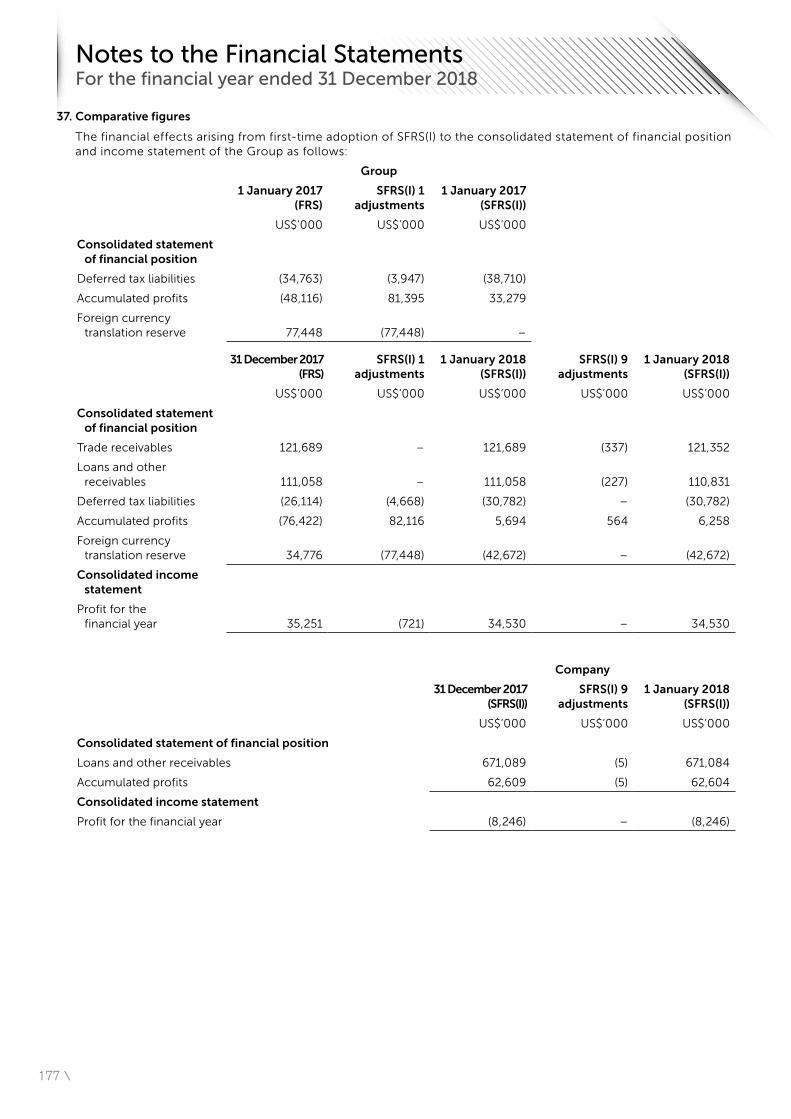
177 \
37. Comparative figures
The financial effects arising from first-time adoption of SFRS(I) to the consolidated statement of financial position and income statement of the Group as follows:
Group
1 January 2017 (FRS)
SFRS(I) 1 adjustments
1 January 2017 (SFRS(I))
US$’000 US$’000 US$’000
Consolidated statement of financial position
Deferred tax liabilities (34,763) (3,947) (38,710)
Accumulated profits (48,116) 81,395 33,279
Foreign currency translation reserve 77,448 (77,448) –
31 December 2017 (FRS)
SFRS(I) 1 adjustments
1 January 2018 (SFRS(I))
SFRS(I) 9 adjustments
1 January 2018 (SFRS(I))
US$’000 US$’000 US$’000 US$’000 US$’000
Consolidated statement of financial position
Trade receivables 121,689 – 121,689 (337) 121,352
Loans and other receivables 111,058 – 111,058 (227) 110,831
Deferred tax liabilities (26,114) (4,668) (30,782) – (30,782)
Accumulated profits (76,422) 82,116 5,694 564 6,258
Foreign currency translation reserve 34,776 (77,448) (42,672) – (42,672)
Consolidated income statement
Profit for the financial year 35,251 (721) 34,530 – 34,530
Company
31 December 2017 (SFRS(I))
SFRS(I) 9 adjustments
1 January 2018 (SFRS(I))
US$’000 US$’000 US$’000
Consolidated statement of financial position
Loans and other receivables 671,089 (5) 671,084
Accumulated profits 62,609 (5) 62,604
Consolidated income statement
Profit for the financial year (8,246) – (8,246)
Notes to the Financial Statements For the financial year ended 31 December 2018
\ 178
38. Event occurring after the reporting period
a) Issuance of shares by a subsdiary
In February 2019, the Group’s subsidiary, HeveaConnect Pte. Ltd. (“HeveaConnect”) entered into a share subscription agreement with ITOCHU Corporation (“ITOCHU”) for ITOCHU to subscribe 66,807 shares for US$2,200,000 and an option to subscribe for additional shares for US$800,000. Subsequent to the shares issuance, the Group’s total equity interest in HeveaConnect has changed from 90.1% to 71.1%.
b) Redemption of perpetual securities
In March 2019, the Group announced, of its intention to redeem all the perpetual securities on 26 April 2019 at 100% of the principal amount of the perpetual securities of US$150,000,000, together with distribution accrued to the redemption date.
39. Authorisation of financial statements for issue
The financial statements for the year ended 31 December 2018 were authorised for issue in accordance with a resolution of the directors on 26 March 2019.
Notes to the Financial Statements For the financial year ended 31 December 2018
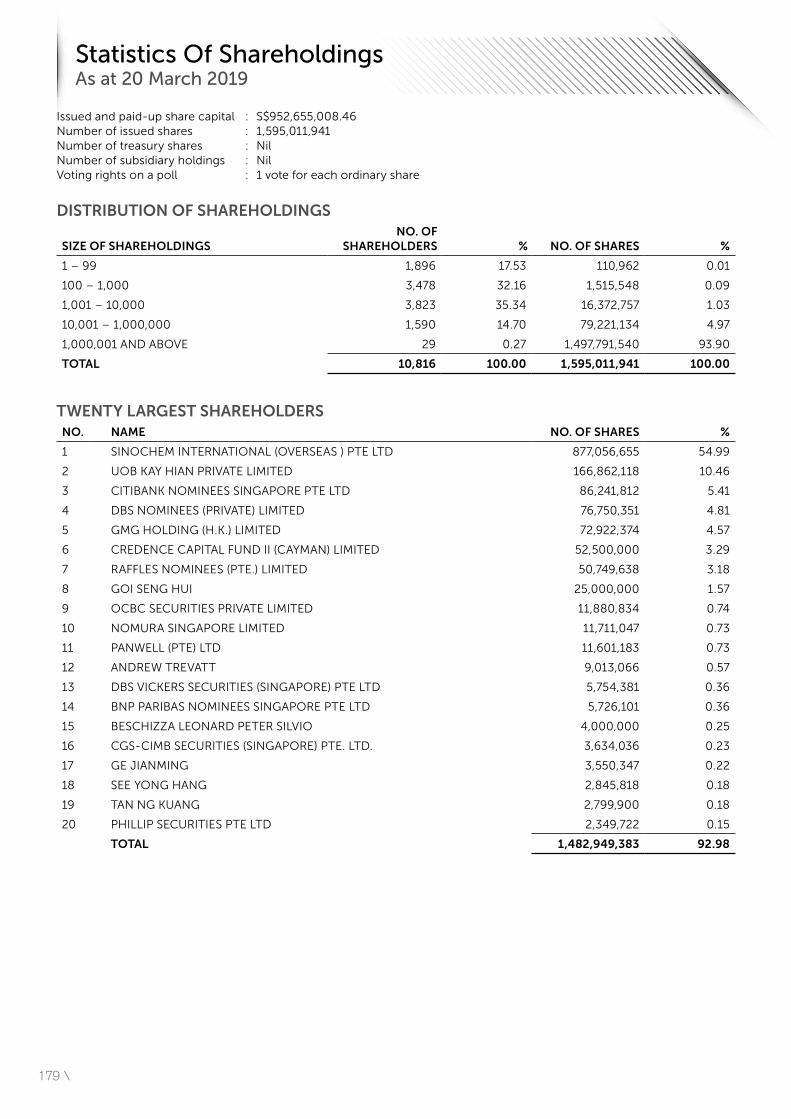
179 \
Statistics Of Shareholdings As at 20 March 2019
Issued and paid-up share capital : S$952,655,008.46Number of issued shares : 1,595,011,941Number of treasury shares : NilNumber of subsidiary holdings : NilVoting rights on a poll : 1 vote for each ordinary share
DISTRIBUTION OF SHAREHOLDINGS
SIZE OF SHAREHOLDINGSNO. OF
SHAREHOLDERS % NO. OF SHARES %
1 – 99 1,896 17.53 110,962 0.01
100 – 1,000 3,478 32.16 1,515,548 0.09
1,001 – 10,000 3,823 35.34 16,372,757 1.03
10,001 – 1,000,000 1,590 14.70 79,221,134 4.97
1,000,001 AND ABOVE 29 0.27 1,497,791,540 93.90
TOTAL 10,816 100.00 1,595,011,941 100.00
TWENTY LARGEST SHAREHOLDERSNO. NAME NO. OF SHARES %
1 SINOCHEM INTERNATIONAL (OVERSEAS ) PTE LTD 877,056,655 54.99
2 UOB KAY HIAN PRIVATE LIMITED 166,862,118 10.46
3 CITIBANK NOMINEES SINGAPORE PTE LTD 86,241,812 5.41
4 DBS NOMINEES (PRIVATE) LIMITED 76,750,351 4.81
5 GMG HOLDING (H.K.) LIMITED 72,922,374 4.57
6 CREDENCE CAPITAL FUND II (CAYMAN) LIMITED 52,500,000 3.29
7 RAFFLES NOMINEES (PTE.) LIMITED 50,749,638 3.18
8 GOI SENG HUI 25,000,000 1.57
9 OCBC SECURITIES PRIVATE LIMITED 11,880,834 0.74
10 NOMURA SINGAPORE LIMITED 11,711,047 0.73
11 PANWELL (PTE) LTD 11,601,183 0.73
12 ANDREW TREVATT 9,013,066 0.57
13 DBS VICKERS SECURITIES (SINGAPORE) PTE LTD 5,754,381 0.36
14 BNP PARIBAS NOMINEES SINGAPORE PTE LTD 5,726,101 0.36
15 BESCHIZZA LEONARD PETER SILVIO 4,000,000 0.25
16 CGS-CIMB SECURITIES (SINGAPORE) PTE. LTD. 3,634,036 0.23
17 GE JIANMING 3,550,347 0.22
18 SEE YONG HANG 2,845,818 0.18
19 TAN NG KUANG 2,799,900 0.18
20 PHILLIP SECURITIES PTE LTD 2,349,722 0.15
TOTAL 1,482,949,383 92.98
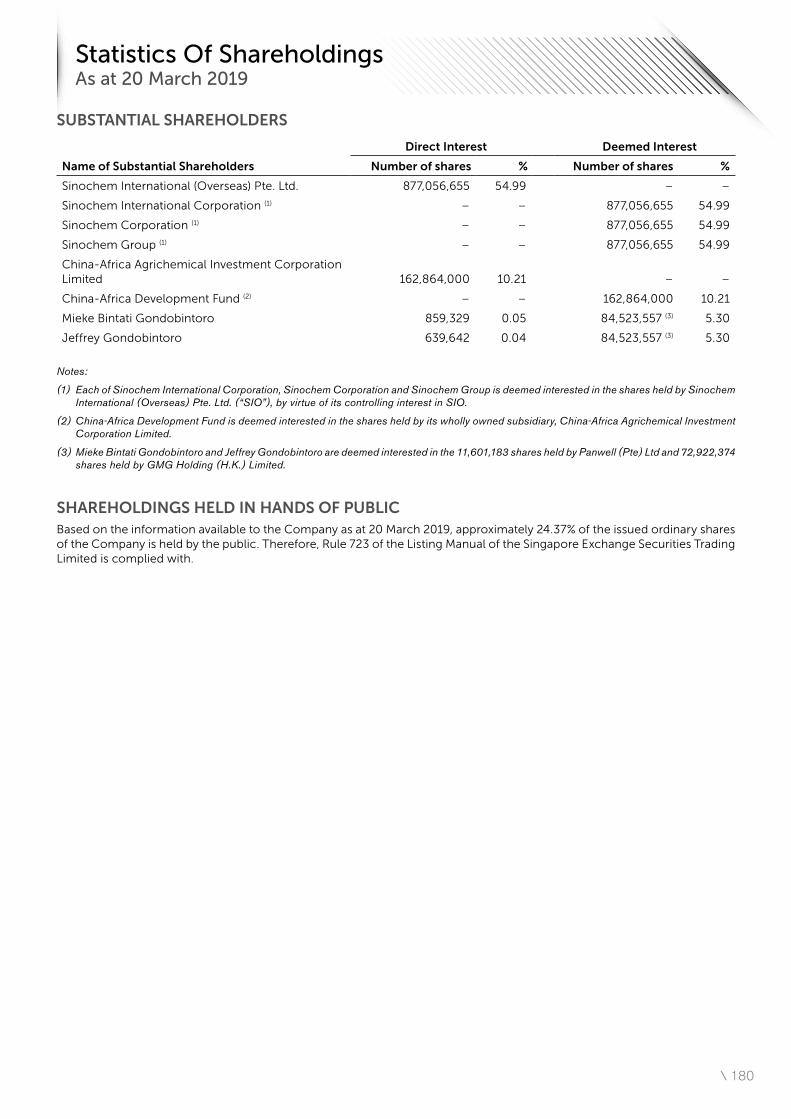
\ 180
Statistics Of Shareholdings As at 20 March 2019
SUBSTANTIAL SHAREHOLDERS
Direct Interest Deemed Interest
Name of Substantial Shareholders Number of shares % Number of shares %
Sinochem International (Overseas) Pte. Ltd. 877,056,655 54.99 – –
Sinochem International Corporation (1) – – 877,056,655 54.99
Sinochem Corporation (1) – – 877,056,655 54.99
Sinochem Group (1) – – 877,056,655 54.99
China-Africa Agrichemical Investment Corporation Limited 162,864,000 10.21 – –
China-Africa Development Fund (2) – – 162,864,000 10.21
Mieke Bintati Gondobintoro 859,329 0.05 84,523,557 (3) 5.30
Jeffrey Gondobintoro 639,642 0.04 84,523,557 (3) 5.30
Notes:
(1) Each of Sinochem International Corporation, Sinochem Corporation and Sinochem Group is deemed interested in the shares held by Sinochem International (Overseas) Pte. Ltd. (“SIO”), by virtue of its controlling interest in SIO.
(2) China-Africa Development Fund is deemed interested in the shares held by its wholly owned subsidiary, China-Africa Agrichemical Investment Corporation Limited.
(3) Mieke Bintati Gondobintoro and Jeffrey Gondobintoro are deemed interested in the 11,601,183 shares held by Panwell (Pte) Ltd and 72,922,374 shares held by GMG Holding (H.K.) Limited.
SHAREHOLDINGS HELD IN HANDS OF PUBLICBased on the information available to the Company as at 20 March 2019, approximately 24.37% of the issued ordinary shares of the Company is held by the public. Therefore, Rule 723 of the Listing Manual of the Singapore Exchange Securities Trading Limited is complied with.
181 \
Notice of Annual General Meeting
NOTICE IS HEREBY GIVEN that the Annual General Meeting (“AGM”) of Halcyon Agri Corporation Limited (the “Company”) will be held at RELC International Hotel, 30 Orange Grove Road (Off Orchard Road), Singapore 258352 on Tuesday, 23 April 2019 at 4.00 p.m. for the purpose of transacting the following business:
ORDINARY BUSINESS1. To receive and adopt the Audited Financial Statements for the financial year ended 31 December
2018, the Directors’ Statement and the Independent Auditor’s Report thereon.(Resolution 1)
2. To re-elect Mr Gunther Robert Meyer, the Director who is retiring pursuant to Regulation 91 of the Constitution of the Company and who, being eligible, offers himself for re-election.
(Resolution 2)
3. To re-elect Mr Liu Hongsheng, the Director who is retiring pursuant to Regulation 91 of the Constitution of the Company and who, being eligible, offers himself for re-election.
(Resolution 3)
4. To re-elect Mr Liew Choon Wei, the Director who is retiring pursuant to Regulation 91 of the Constitution of the Company and who, being eligible, offers himself for re-election.
(Resolution 4)
5. To appoint Mr Lam Chun Kai @Lam Chung Kai as a Director of the Company pursuant to Regulation 95 of the Constitution of the Company.
To note the retirement of Mr Raymond John Ferguson pursuant to Regulation 91 of the Constitution of the Company.
(Resolution 5)
6. To approve the sum of up to S$750,000 to be paid quarterly in arrears, to the non-executive Directors as Directors’ fees for the financial year ending 31 December 2019.
(Resolution 6)
7. To re-appoint Messrs Ernst & Young LLP as Auditor of the Company and to authorise the Directors to fix its remuneration.
(Resolution 7)
8. To transact any other ordinary business which may be properly transacted at an AGM.
SPECIAL BUSINESSTo consider and, if thought fit, to pass the following as Ordinary Resolutions, with or without modification(s):
9. Authority to Allot and Issue Shares (Resolution 8)
THAT pursuant to Section 161 of the Companies Act, Chapter 50 of Singapore (the “Act”) and Rule 806 of the Listing Manual, the Directors of the Company be authorised and empowered to:
(I) (a) allot and issue shares in the capital of the Company (the “Shares”) whether by way of rights, bonus or otherwise; and/or
(b) make or grant offers, agreements or options (collectively, “Instruments”) that might or would require Shares to be issued, including but not limited to the creation and issue of (as well as adjustments to) warrants, debentures or other instruments convertible into Shares,
at any time and upon such terms and conditions and for such purposes and to such persons as the Directors may in their absolute discretion deem fit; and
at any time and upon such terms and conditions and for such purposes and to such persons as the Directors may in their absolute discretion deem fit; and
(II) issue Shares in pursuance of any Instruments made or granted by the Directors while this Resolution was in force, notwithstanding that the authority conferred by this Resolution may have ceased to be in force at the time of such issuance of Shares,
PROVIDED THAT:
(1) the aggregate number of Shares to be issued pursuant to this Resolution (including Shares to be issued in pursuance of the Instruments, made or granted pursuant to this Resolution), shall not exceed fifty per cent (50%) of the total number of issued Shares (excluding treasury shares and subsidiary holdings) (as calculated in accordance with sub-paragraph (2) below), of which the aggregate number of Shares to be issued other than on a pro-rata basis to existing shareholders of the Company (including Shares to be issued in pursuance of Instruments made or granted pursuant to this Resolution) shall not exceed twenty per cent (20%) of the total number of issued Shares (excluding treasury shares and subsidiary holdings) (as calculated in accordance with sub-paragraph (2) below);
(2) (subject to such manner of calculation as may be prescribed by the Singapore Exchange Securities Trading Limited (“SGX-ST”)) for the purpose of determining the aggregate number of Shares (including Shares to be issued in pursuance of the Instruments, made or granted pursuant to this Resolution) that may be issued under sub-paragraph (1) above, the percentage of total issued Shares shall be based on the total number of issued Shares (excluding treasury shares and subsidiary holdings) at the time this Resolution is passed, after adjusting for:
(a) new Shares arising from the conversion or exercise of any convertible securities;
(b) new Shares arising from the exercise of share options or vesting of share awards which are outstanding and/or subsisting at the time of the passing of this Resolution, provided the options or awards (as the case may be) were granted in compliance with Part VIII of Chapter 8 of the Listing Manual of the SGX-ST; and
(c) any subsequent bonus issue, consolidation or sub-division of Shares,
\ 182
Notice of Annual General Meeting
(3) in exercising the authority conferred by this Resolution, the Company shall comply with the provisions of the Listing Manual for the time being in force (unless such compliance has been waived by the SGX-ST), all applicable legal requirements under the Act and the Constitution of the Company for the time being; and
(4) the authority conferred by this Resolution shall, unless revoked or varied by the Company in general meeting, continue to be in force until the conclusion of the next AGM of the Company or the date by which the next AGM of the Company is required by law to be held, whichever is the earlier.
10. Renewal of Share Buyback Mandate (Resolution 9)
THAT:
(1) for the purposes of Sections 76C and 76E of the Companies Act, Chapter 50 of Singapore (the “Act”), the exercise by the Directors of the Company of all the powers of the Company to purchase or otherwise acquire issued ordinary shares of the Company (the “Shares”) not exceeding in aggregate the Maximum Percentage (as hereafter defined), at such price or prices as may be determined by the Directors from time to time up to the Maximum Price (as hereafter defined), whether by way of:
(a) market purchase(s) (“Market Purchases”) on the Singapore Exchange Securities Trading Limited (“SGX-ST”) or on any other securities exchange on which the Shares may for the time being be listed and quoted (“Other Exchange”); and/or
(b) off-market purchase(s) (if effected otherwise than on the SGX-ST or, as the case may be, Other Exchange) (“Off-Market Purchases”), otherwise than on a securities exchange, in accordance with an equal access scheme as may be determined or formulated by the Directors as they consider fit, which scheme(s) shall satisfy all the conditions prescribed by the Act,
and otherwise in accordance with all other laws and regulations and rules of the SGX-ST or, as the case may be, Other Exchange as may for the time being be applicable, be and is hereby authorised and approved generally and unconditionally (the “Share Buyback Mandate”);
(2) unless varied or revoked by the Company in general meeting, the authority conferred on the Directors of the Company pursuant to the Share Buyback Mandate may be exercised by the Directors at any time and from time to time during the period commencing from the date of the passing of this Resolution and expiring on the earliest of:
(a) the date on which the next annual general meeting of the Company is held;
(b) the date by which the next annual general meeting of the Company is required by law to be held; and
(c) the date on which purchases and acquisitions of Shares pursuant to the Share Buyback Mandate are carried out to the full extent mandated;
(3) in this Resolution:
“Average Closing Price” means the average of the closing market prices of a Share over the last five consecutive market days on which the Shares are transacted on the SGX-ST or, as the case may be, the Other Exchange, immediately preceding the date of the Market Purchase by the Company or, as the case may be, the date of the making of the offer pursuant to the Off-Market Purchase, and deemed to be adjusted, in accordance with the listing rules of the SGX-ST, for any corporate action that occurs after the relevant five-day period;
“date of the making of the offer” means the date on which the Company announces its intention to make an offer for the purchase or acquisition of Shares from shareholders, stating therein the purchase price (which shall not be more than the Maximum Price calculated on the basis set out below) for each Share and the relevant terms of the equal access scheme for effecting the Off-Market Purchase;
“Maximum Percentage” means that number of issued Shares representing 10% of the issued Shares of the Company as at the date of the passing of this Resolution (excluding treasury shares and subsidiary holdings (as defined in the Listing Manual of the SGX-ST)); and
“Maximum Price” in relation to a Share to be purchased or acquired, means the purchase price (excluding related brokerage, commission, applicable goods and services tax, stamp duties, clearance fees and other related expenses) which shall not exceed:
(a) in the case of a Market Purchase, 105% of the Average Closing Price of the Shares; and
(b) in the case of an Off-Market Purchase, 120% of the Average Closing Price of the Shares; and
(4) the Directors of the Company and/or any of them be and are hereby authorised to complete and do all such acts and things (including executing such documents as may be required) as they and/or he may consider expedient or necessary to give effect to the transactions contemplated and/ or authorised by this Resolution.
By Order of the Board
Liew Guat Yi Company Secretary Singapore 8 April 2019
183 \
Notice of Annual General Meeting
Explanatory Notes
Resolution 2: Re-election of Mr Gunther Robert Meyer as a Director
Mr Gunther Robert Meyer will, upon re-election as a Director of the Company, remain as an Executive Director and Chief Executive Officer, and a member of the Strategy and Investment Committee. There are no relationships (including family relationships) between Mr Meyer and the other Directors, the Company and its substantial shareholders. Please refer to the sections on Board of Directors and Corporate Governance in the Company’s Annual Report which is available at https://www.halcyonagri.com/investors-media/publications/ (the “Annual Report”) for further information on Mr Meyer, including information on the current directorships in other listed companies (if any) and other principal commitments.
Resolution 3: Re-election of Mr Liu Hongsheng as a Director
Mr Liu Hongsheng will, upon re-election as a Director of the Company, remain as a Non-executive Non-independent Chairman and Co-chairman of the Strategy and Investment Committee. Mr Liu is a nominee director of Sinochem International (Overseas) Pte. Ltd. (54.99% shareholder) and is a co-worker of Mr Qin Jinke, a Non-executive Non-independent Director, at Sinochem International Corporation. Please refer to the sections on Board of Directors and Corporate Governance in the Annual Report for further information on Mr Liu, including information on the current directorships in other listed companies and other principal commitments. Save as disclosed in the Annual Report, there are no relationships (including family relationships) between Mr Liu and the other Directors, the Company and its substantial shareholders.
Resolution 4: Re-election of Mr Liew Choon Wei as a Director
Mr Liew Choon Wei will, upon re-election as a Director of the Company, remain as an Independent Director, Chairman of the Remuneration Committee, and a member of the Audit Committee and Nominating Committee. He will be considered independent for the purpose of Rule 704(8) of the Listing Manual of the SGX-ST (the “Listing Manual”). There are no relationships (including family relationships) between Mr Liew and the other Directors, the Company and its substantial shareholders. Please refer to the sections on Board of Directors and Corporate Governance in the Annual Report for further information on Mr Liew, including information on the current directorships in other listed companies and other principal commitments.
Resolution 5: Appointment of Mr Lam Chun Kai @Lam Chung Kai as a Director
Mr Lam Chun Kai @Lam Chung Kai was nominated by Sinochem International (Overseas) Pte. Ltd. pursuant to Regulation 95 of the Constitution of the Company, for election onto the Board of Directors of the Company at the AGM. Please refer to the Company’s announcement made on 8 April 2019 on the SGX-ST for information relating to Mr Lam Chun Kai @Lam Chung Kai, as set out in Appendix 7.4.1 to the Listing Manual.
Retirement of Mr Raymond John Ferguson as a Director
Mr Raymond John Ferguson has indicated that he does not wish to seek re-election as a Director of the Company, and he will retire from office at the conclusion of the AGM.
Resolution 6: Approval of Directors’ fees of up to S$750,000
Resolution 6, if passed, will facilitate the payment of Directors’ fees during the financial year ending 31 December 2019, in which the fees are incurred. Remuneration framework for the non-executive Directors (including the Chairman) remains unchanged from the framework for the financial year ended 31 December 2018. Directors’ fees are computed based on the anticipated number of Board and Board Committee meetings, assuming full attendance by all of the non-executive Directors. The amount also caters for any fee increases and unforeseen circumstances, for example, the appointment of additional Directors, additional unscheduled Board meetings and/or the formation of additional Board Committee(s). Please refer to the section on Corporate Governance in the Annual Report for further information on the Directors’ fees.
Resolution 8: Authority to the Directors to allot and issue shares
Resolution 8, if passed, will empower the Directors of the Company, effective from the conclusion of the above AGM until the conclusion of the next AGM of the Company, or the date by which the next AGM of the Company is required by law to be held or such authority is varied or revoked by the Company in a general meeting, whichever is the earlier, to allot and issue Shares and convertible securities in the Company (without seeking any further approval from shareholders in general meeting) within the limitation imposed by the Resolution 8, for such purposes as the Directors may consider would be in the best interests of the Company.
The number of Shares and convertible securities that the Directors may allot and issue under the Resolution 8 would not exceed fifty per cent (50%) of the total number of issued Shares (excluding treasury shares and subsidiary holdings) at the time of passing of the Resolution 8. For the issue and allotment of Shares and convertible securities other than on a pro-rata basis to all shareholders, the aggregate number of Shares and convertible securities to be issued and allotted shall not exceed twenty per cent (20%) of the total number of issued Shares (excluding treasury shares and subsidiary holdings) at the time of passing of the Resolution 8.
\ 184
Notice of Annual General Meeting
For determining the aggregate number of Shares that may be issued, the percentage of issued Shares will be based on the total number of issued Shares (excluding treasury shares and subsidiary holdings) at the time the Resolution 8 is passed after adjusting for new Shares arising from the conversion or exercise of any convertible securities, the exercise of share options or the vesting of share awards outstanding and/or subsisting at the time the Resolution 8 is passed and any subsequent bonus issue, consolidation or subdivision of the Company’s Shares.
Resolution 9: Renewal of Share Buyback Mandate
Resolution 9 is to renew the mandate to allow the Company to purchase or otherwise acquire its issued ordinary shares, on the terms and subject to the conditions set out in the Resolution 9. Please refer to the Company’s Letter to Shareholders dated 8 April 2019, which is available at https://www.halcyonagri.com/investors-media/agm-egm-announcements/, for more details.
Notes1. A member of the Company who is not a relevant intermediary is entitled to appoint not more than two proxies to attend,
speak and vote at the AGM in his stead.
2. Pursuant to Section 181 of the Act, any member who is a relevant intermediary is entitled to appoint one or more proxies to attend, speak and vote at the AGM. “Relevant intermediary” has the meaning ascribed to it in Section 181 of the Act.
3. A proxy need not be a member of the Company.
4. The instrument appointing a proxy must be deposited at the office of the Company’s Share Registrar, Boardroom Corporate & Advisory Services Pte. Ltd. at 50 Raffles Place, #32-01, Singapore Land Tower, Singapore 048623, not less than 72 hours before the time appointed for holding the AGM.
GeneralThe Company shall be entitled to reject a Proxy Form which is incomplete, improperly completed, illegible or where the true intentions of the appointor are not ascertainable from the instructions of the appointor specified on and/or attached to the Proxy Form. In addition, in the case of a member whose shares are entered in the Depository Register, the Company may reject a Proxy Form if the member, being the appointor, is not shown to have shares entered against his name in the Depository Register as at 72 hours before the time appointed for holding the AGM, as certified by The Central Depository (Pte) Limited to the Company.
Personal data privacyBy submitting an instrument appointing proxy or proxies, and/or representative(s) to attend, speak and vote at the AGM and/or any adjournment thereof, a member of the Company:
(i) consents to the collection, use and disclosure of the member’s personal data by the Company (or its agents or service providers) for the purpose of the processing, administration and analysis by the Company (or its agents or service providers) of proxy(ies) and/or representative(s) appointed for the AGM (including any adjournment thereof) and the preparation and compilation of the attendance lists, minutes and other documents relating to the AGM (including any adjournment thereof), and in order for the Company (or its agents or service providers) to comply with any applicable laws, listing rules, regulations and/or guidelines (collectively, the “Purposes”);
(ii) warrants that where the member discloses the personal data of the member’s proxy(ies) and/or representative(s) to the Company (or its agents or service providers), the member has obtained the prior consent of such proxy(ies) and/or representative(s) for the collection, use and disclosure of such individual’s personal data for the Purposes; and
(iii) agrees that the member will indemnify the Company in respect of any penalties, liabilities, claims, demands, losses and damages as a result of the member’s breach of warranty.

Halcyon Agri Corporation Limited180 Clemenceau Avenue#05-02 Haw Par CentreSingapore 239922
www.halcyonagri.com