Embed Size (px)
Citation preview
The world’s agricultural equipment markets continue to improve. CLAAS increased its agricultural equipment business by around 10%, with the main growth drivers being our harvesters and tractors.
Strategy 50
Industry Trends 51
Financial Performance 54
Sales 54 Earnings 56
Cash Position 58
Cash Flows 58 Liquidity and Financing 59
Financial Position 61
Capital Expenditure 64
Research and Development 65
Purchasing 66
Employees 67
Risk Management 69
Events After the Balance Sheet Date 73
Outlook 74
Group Management Report
Strategy
Long-term strategy provides future security
CLAAS has always based its stability and corporate success on deeply rooted commitments and principles during its almost 100 years of company history. These principles include commitment and a passion for innovation, but also harmonious partnerships and a down-to-earth approach. All corporate activities are strategically focused on expanding and developing the leading technology, quality, and customer benefits of our products. CLAAS places great value on its employees who live up to these standards.
Global agriculture was boosted by fundamental changes at the beginning of the 21st century. The world’s population will continue to grow in the long term. Additionally, there is a rapid pace of urban influx and rising living standards, together with increased per-capita income, especially in the emerging markets. This leads to a distinct trend toward diets that are higher in quality and richer in protein.
On the non-food side of agricultural production, fossil fuels are increasingly being replaced by biomass, a form of renewable energy. Highly efficient agricultural equipment products and services are necessary to cover all agricultural product uses. This will be a prerequisite to meet rapidly increasing global demands limited by the finite area of agricultural land available.
With this in mind, CLAAS develops its corporate strategy in a multi-stage, revolving process. This strategy sets long-term goals and takes into account specific conditions. The Company’s planned development path sets the direction for the operating divisions:
Expanding established market positions in the traditional regions of Western and Central Europe, the targeted development of business activities in North America as well as significant growth in the agricultural pro-duction countries of Eastern Europe and Asia. Here, we are working to expand our production and sales structures.
Continuing to build on technological leadership.
Group Management Report
50

Continuously developing the after sales, service and financing offerings as well as providing additional innovative products and services, especially for precision agriculture.
Strengthening our value-added partnerships in sales as well as in procurement and production by making use of development collaborations and optimizing the supply chain.
Continuously optimizing all divisional structures and processes.
Focusing on qualified employees with an emphasis on finding and supporting employees with global awareness and adaptability. CLAAS particularly looks for people with a passion for agriculture and agri-cultural engineering as well as a demonstrated economic and technical background.
Active communication plays a particularly important role in implementing necessary corporate changes, especially in eventful economic times. Establishing a trust-based dialog with employees, their representatives as well as suppliers, sales and financial partners ensures that our measures and changes receive the neces-sary backing and are supported by everyone involved – for the long term.
Industry Trends
Economic environment
The economy continued to feel the effects of increasing uncertainty in fiscal year 2012. Growth rates fell due, in particular, to the negative effects from high levels of sovereign debt in parts of Europe and the United States. Sovereign debt in certain Southern European countries continues to pose a threat to the stability of the entire euro zone. Declining growth rates in the major emerging markets also limit global economic prospects.
The world’s agricultural equipment markets again improved year on year, regardless of the overall economic situation. Agricultural markets are setting new records. Compared to fiscal year 2008, price volatility is con-siderably lower and the markets are much more stable. Current high agricultural commodity prices reflect the structural supply shortfall.
51Corporate Boards | Group Management Report | Consolidated Financial Statements
Strategy
Industry Trends
The present positive economic situation is due to the increase in farmers’ income seen in 2011. This was mainly due to the 5.6% rise in global cereal production together with consistently high cereal prices, a fact that in turn encouraged agricultural equipment investments. In the past fiscal year, industrial commodity prices – which are high and point to stable commodity markets – experienced relatively low levels of volatility on the whole. On the other hand, agricultural input costs have not increased at the same rate. One exception to this is the price of oil, which fell for a time but has now risen once again to the prior level.
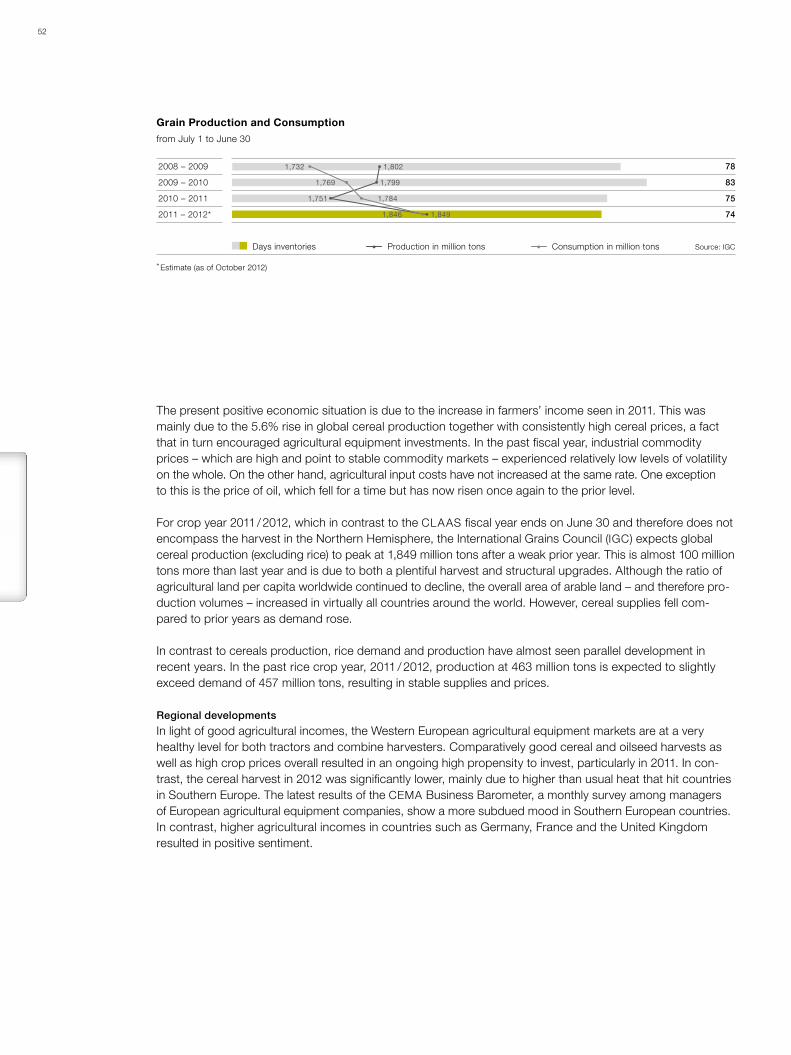
For crop year 2011 / 2012, which in contrast to the CLAAS fiscal year ends on June 30 and therefore does not encompass the harvest in the Northern Hemisphere, the International Grains Council (IGC) expects global cereal production (excluding rice) to peak at 1,849 million tons after a weak prior year. This is almost 100 million tons more than last year and is due to both a plentiful harvest and structural upgrades. Although the ratio of agricultural land per capita worldwide continued to decline, the overall area of arable land – and therefore pro-duction volumes – increased in virtually all countries around the world. However, cereal supplies fell com-pared to prior years as demand rose.
In contrast to cereals production, rice demand and production have almost seen parallel development in recent years. In the past rice crop year, 2011 / 2012, production at 463 million tons is expected to slightly exceed demand of 457 million tons, resulting in stable supplies and prices.
Regional developments
In light of good agricultural incomes, the Western European agricultural equipment markets are at a very healthy level for both tractors and combine harvesters. Comparatively good cereal and oilseed harvests as well as high crop prices overall resulted in an ongoing high propensity to invest, particularly in 2011. In con-trast, the cereal harvest in 2012 was significantly lower, mainly due to higher than usual heat that hit countries in Southern Europe. The latest results of the CEMA Business Barometer, a monthly survey among managers of European agricultural equipment companies, show a more subdued mood in Southern European countries. In contrast, higher agricultural incomes in countries such as Germany, France and the United Kingdom resulted in positive sentiment.
78
83
75
74
Grain Production and Consumptionfrom July 1 to June 30
2008 – 2009
2009 – 2010
2010 – 2011
2011 – 2012*
Days inventories Production in million tons Consumption in million tons Source: IGC
1,732 1,802
1,769 1,799
1,846 1,849
1,7841,751
* Estimate (as of October 2012)
52

The Central European agricultural equipment markets continued to develop well and show record levels for tractors and combine harvesters. Agricultural incomes – and therefore also agricultural purchasing power – rose once more as a result of a good harvest in 2011 and stable agricultural commodity prices. Most Central European countries have experienced considerable structural change since joining the EU. Some have devel-oped national programs with which they encourage investments in agriculture to supplement the support they receive from the EU. Many businesses in this region are doing well and are producing under competitive con-ditions.
The development of markets in Eastern Europe varied during the past fiscal year. Due to high agricultural incomes, tractor market volumes soared, while the markets for combine harvesters recorded significant declines. One possible explanation for this trend is Russia’s admission to the WTO. Although the country continues to desire Western technologies, the prospect of declining import duties following WTO admission has resulted in end customers being more reluctant to buy. Import restrictions were slashed in August 2012 as a first measure.
The North American agricultural equipment markets recorded a high level of combine harvester sales with only a slight decline over last year, while tractor sales increased slightly. The 2012 harvest was hit by a period of extreme heat, especially in the Midwest. However, average agricultural incomes are expected to climb fur-ther thanks to crop insurance payouts, state agricultural grants and generally high crop prices.
Although the agricultural equipment markets in South America declined slightly, they are still up considerably on recent year averages. Domestic agricultural equipment production in Brazil continues to benefit from government programs. Low rainfall resulted in smaller harvests, but high prices generated significant income. Access to the Argentinean market is increasingly impeded by additional protectionist measures.
Asia’s agricultural equipment markets continue to develop positively. Rich harvests and high crop prices led to high incomes, thereby encouraging investments in many regions. While demand for self-propelled harvesters in India declined due to the weak monsoon, tractor sales remained stable. One reason for this difference is that tractors are very versatile, even outside the agricultural sector (such as in transport or logistics). The huge demand for greater mechanization in China is in part supported by subsidies. The most important market players here are state farms and contractors, although private enterprises and cooperatives also play a large role. Demand for mechanization in Asia’s key growth regions is expected to increase further in the coming years on account of continuing urbanization.
53Corporate Boards | Group Management Report | Consolidated Financial Statements
Industry Trends

Financial Performance
Sales
Agricultural Equipment sales up 9.8%
Fiscal year 2012 was very successful for CLAAS. The Company continued to pursue the successful course set in the prior year with new sales and earnings highs. The good market positions in Germany and France as well as the strong demand for our premium products, especially in Central and Eastern European countries, were the key to success. In total, sales rose by 4.0% year on year to €3,435.6 million, 77.3% of which were generated outside Germany. Currency translation effects did not directly impact sales.
Agricultural Equipment net sales rose by 9.8% to €3,414.9 million (prior year: €3,109.5 million), primarily due to harvester and tractor sales increases. Industrial Engineering is an important supplier to Agricultural Equip-ment. As a result, this division has been recognized within the Agricultural Equipment division since the begin-ning of the reporting period. The prior-year figures were adjusted accordingly.
During the first half of 2012, CLAAS sold the Production Technology division companies to Deutsche Beteili-gungs AG, Frankfurt am Main / Germany and MBB Industries AG, Berlin / Germany. For the period of the re-porting year in which these companies were part of the CLAAS Group, the Production Technology division generated net sales of €20.7 million (prior year: €194.7 million). The Group’s positive sales development completely offset the drop in sales resulting from the disposal of the Production Technology division.
Growth driver: harvesters and tractors
In 2012, the CLAAS Group again increased its high level of prior-year sales. The main growth drivers here were the harvester and tractor businesses, allowing CLAAS to consolidate its already strong market position.
Demand for combine harvesters, the product that makes the single largest contribution to sales, was high in a favorable market environment. Western Europe continues to be the most important sales market, although there is increasing demand for CLAAS combine harvesters in other regions.
please refer
to page 83
2008
2009
2010
2011
2012
3,236.2
2,900.8
2,475.5
3,304.2
3,435.6
Sales per Yearin € million
Foreign sales in % German sales in %
24.8
77.6 22.4
75.2
73.1
73.5
26.9
26.5
22.777.3
54
As in the prior year, tractors were the product group with the second-highest new machinery sales in the CLAAS Group, after combine harvesters. The key to this was the positive market feedback to our new prod-ucts. However, demand was not satisfied in all regions. The Group successfully expanded its tractor market position in most regions, particularly in Western Europe.
Forage harvesters again generated record sales on the back of the top prior-year figure. Overall market demand continues to benefit from the developments of the renewable energies industry. CLAAS has been the global market leader in forage harvesters for many years.
Demand for forage harvesting machinery and balers has also developed very strongly for CLAAS. The market position in these product groups improved further, recording double-digit growth rates.
Sales of spare parts, accessory components and used machinery again topped the high figures recorded in the prior year, as did sales in the service business. Sales here are making an increasing contribution to total Group sales.
Regional differences in sales increases
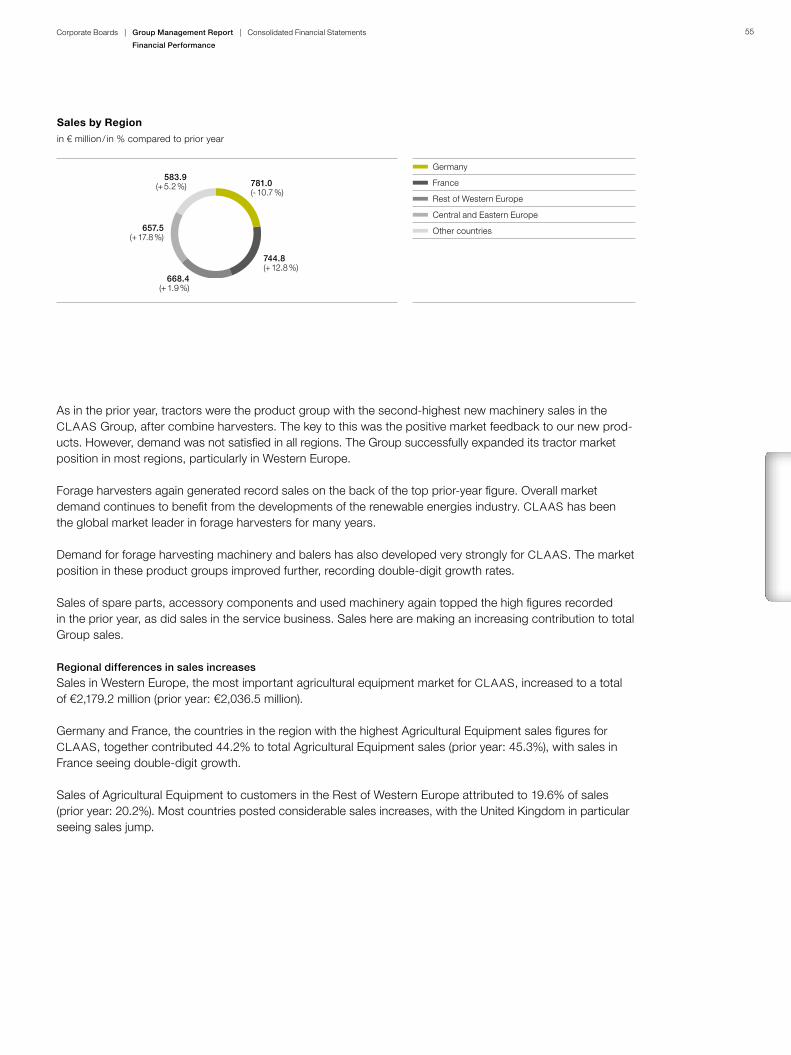
Sales in Western Europe, the most important agricultural equipment market for CLAAS, increased to a total of €2,179.2 million (prior year: €2,036.5 million).
Germany and France, the countries in the region with the highest Agricultural Equipment sales figures for CLAAS, together contributed 44.2% to total Agricultural Equipment sales (prior year: 45.3%), with sales in France seeing double-digit growth.
Sales of Agricultural Equipment to customers in the Rest of Western Europe attributed to 19.6% of sales (prior year: 20.2%). Most countries posted considerable sales increases, with the United Kingdom in particular seeing sales jump.
Sales by Regionin € million / in % compared to prior year
Germany
France
Rest of Western Europe
Central and Eastern Europe
Other countries
781.0(- 10.7 %)
657.5(+ 17.8 %)
744.8(+ 12.8 %)
583.9(+ 5.2 %)
668.4(+ 1.9 %)
55Corporate Boards | Group Management Report | Consolidated Financial Statements
Financial Performance
Sales in Central and Eastern European countries again experienced particularly strong year-on-year growth. Sales in individual countries in this region were up considerably on the prior year, while sales in the region as a whole rose by 18.5%; as a result, sales were even up on the previous record set in 2008. This was mainly due to substantial sales increases in Poland and the Russian Federation, as well as in the Czech Republic and Ukraine.
Sales generated outside Europe made up 17.0% of total Agricultural Equipment sales (prior year: 16.7%). Although growth varied from one country to the next, overall growth was positive. The most important region here was North America. Asia is becoming ever more important, not least due to the earnings generated from the successful development of own sales structures.
Earnings
Gross profit margin up significantly
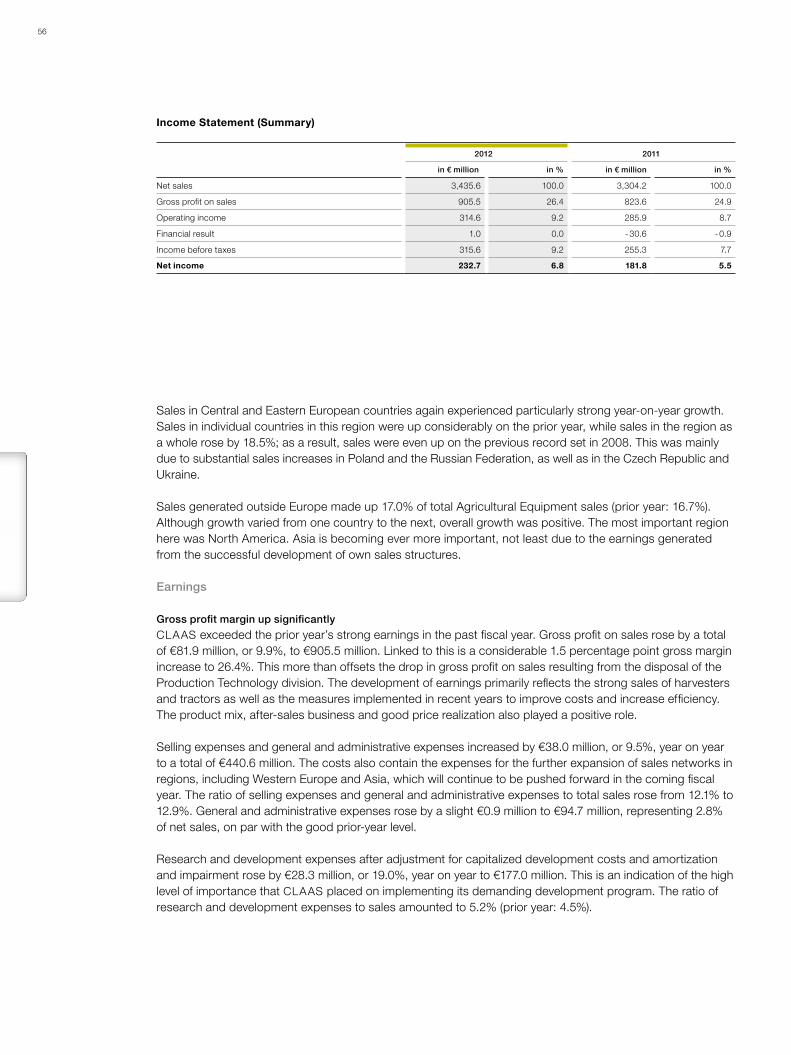
CLAAS exceeded the prior year’s strong earnings in the past fiscal year. Gross profit on sales rose by a total of €81.9 million, or 9.9%, to €905.5 million. Linked to this is a considerable 1.5 percentage point gross margin increase to 26.4%. This more than offsets the drop in gross profit on sales resulting from the disposal of the Production Technology division. The development of earnings primarily reflects the strong sales of harvesters and tractors as well as the measures implemented in recent years to improve costs and increase efficiency. The product mix, after-sales business and good price realization also played a positive role.
Selling expenses and general and administrative expenses increased by €38.0 million, or 9.5%, year on year to a total of €440.6 million. The costs also contain the expenses for the further expansion of sales networks in regions, including Western Europe and Asia, which will continue to be pushed forward in the coming fiscal year. The ratio of selling expenses and general and administrative expenses to total sales rose from 12.1% to 12.9%. General and administrative expenses rose by a slight €0.9 million to €94.7 million, representing 2.8% of net sales, on par with the good prior-year level.
Research and development expenses after adjustment for capitalized development costs and amortization and impairment rose by €28.3 million, or 19.0%, year on year to €177.0 million. This is an indication of the high level of importance that CLAAS placed on implementing its demanding development program. The ratio of research and development expenses to sales amounted to 5.2% (prior year: 4.5%).
Income Statement (Summary)
2012 2011
in € million in % in € million in %
Net sales 3,435.6 100.0 3,304.2 100.0
Gross profit on sales 905.5 26.4 823.6 24.9
Operating income 314.6 9.2 285.9 8.7
Financial result 1.0 0.0 - 30.6 - 0.9
Income before taxes 315.6 9.2 255.3 7.7
Net income 232.7 6.8 181.8 5.5
56

Functional costs include the amortization of intangible assets and depreciation of property, plant and equip-ment of €71.2 million (prior year: €74.8 million).
Other operating earnings, which is the balance of other operating income and other operating expenses, increased by €13.2 million year on year to €26.7 million. During the reporting period, the effect on earnings resulting from the disposal of the Production Technology division companies in particular had a positive impact on other operating earnings.
This resulted in operating income rising by 10.1% year on year to €314.6 million.
The financial result, which is made up of “income from investments, net”, “interest expense and income from securities, net” and “other financial result” climbed by €31.6 million year on year to €1.0 million (prior year: €-30.6 million). The performance of the individual items making up the financial result varied: While “income from investments” were down on the prior year at €8.4 million (prior year: €11.3 million), “interest expense and income from securities, net” increased by €4.6 million, mainly due to lower financing costs. “Other financial result” performed much better than in the prior year, rising by €29.9 million to €8.5 million, mainly due to “for-eign exchange gains and losses, net”: While “foreign exchange gains and losses, net” had been negatively influenced by valuation effects in the currency hedging portfolio in the prior year, “foreign exchange gains and losses, net” amounted to a significantly positive €13.7 million in the reporting year as a result of higher market valuation effects on the currency hedging portfolio and hedging strategy earnings contributions.
Income before taxes up 23.7% year on year – return on sales of 9.2%
Income before taxes rose to €315.6 million on the back of the massive figure in the prior year (€255.3 million), and the return on sales before income taxes increased to 9.2% (prior year: 7.7%). In fiscal year 2012, the CLAAS Group generated EBIT of €347.6 million, exceeding the prior-year figure of €292.3 million.
At €232.7 million, the Group’s net income was up €50.9 million on the prior year. The Group tax rate changed from 28.8% in the prior year to 26.3%, mainly due to the effect on earnings resulting from the tax-free disposal of the Production Technology division. The return on sales after tax amounted to 6.8% (prior year: 5.5%).
Expense Structure by Functional Cost
2012 2011
in € million in % in € million in %
Net sales 3,435.6 100.0 3,304.2 100.0
Cost of sales 2,530.1 73.6 2,480.6 75.1
Selling expenses 345.9 10.1 308.8 9.3
General and administrative expenses 94.7 2.8 93.8 2.8
Research and development expenses 177.0 5.2 148.7 4.5
57Corporate Boards | Group Management Report | Consolidated Financial Statements
Financial Performance
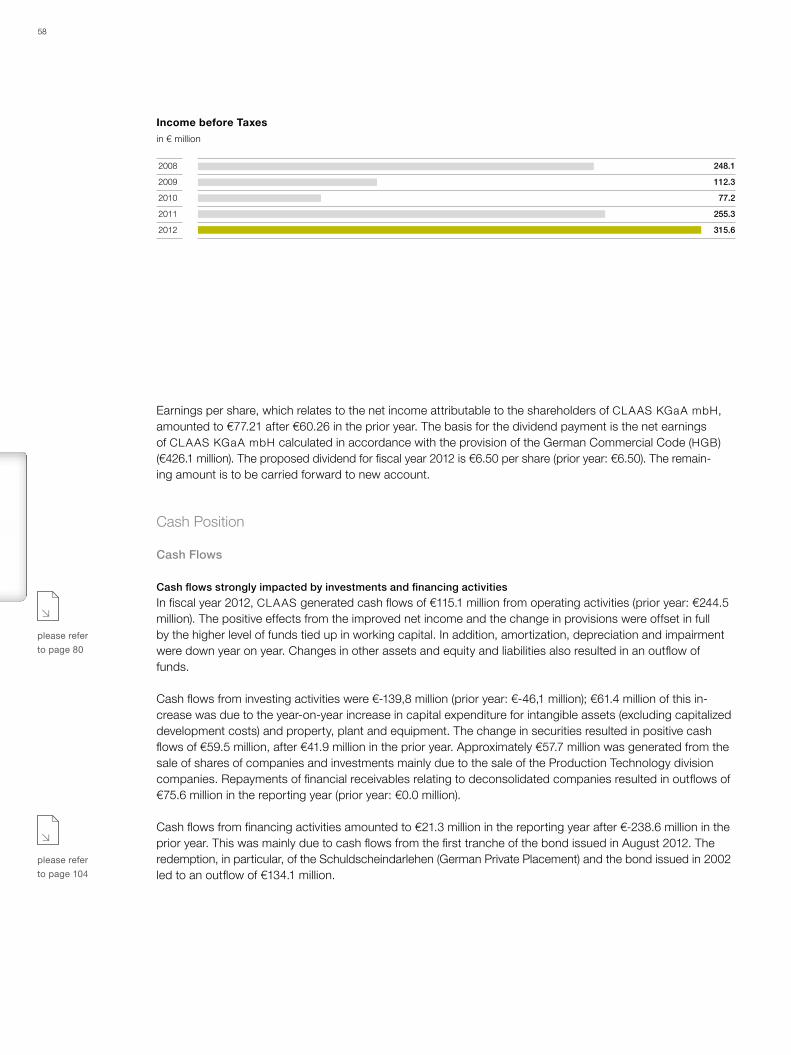
Income before Taxesin € million
2008
2009
2010
2011
2012
248.1
112.3
77.2
255.3
315.6
Earnings per share, which relates to the net income attributable to the shareholders of CLAAS KGaA mbH, amounted to €77.21 after €60.26 in the prior year. The basis for the dividend payment is the net earnings of CLAAS KGaA mbH calculated in accordance with the provision of the German Commercial Code (HGB) (€426.1 million). The proposed dividend for fiscal year 2012 is €6.50 per share (prior year: €6.50). The remain - ing amount is to be carried forward to new account.
Cash Position
Cash Flows
Cash flows strongly impacted by investments and financing activities
In fiscal year 2012, CLAAS generated cash flows of €115.1 million from operating activities (prior year: €244.5 million). The positive effects from the improved net income and the change in provisions were offset in full by the higher level of funds tied up in working capital. In addition, amortization, depreciation and impairment were down year on year. Changes in other assets and equity and liabilities also resulted in an outflow of funds.
Cash flows from investing activities were €-139,8 million (prior year: €-46,1 million); €61.4 million of this in-crease was due to the year-on-year increase in capital expenditure for intangible assets (excluding capitalized development costs) and property, plant and equipment. The change in securities resulted in positive cash flows of €59.5 million, after €41.9 million in the prior year. Approximately €57.7 million was generated from the sale of shares of companies and investments mainly due to the sale of the Production Technology division companies. Repayments of financial receivables relating to deconsolidated companies resulted in outflows of €75.6 million in the reporting year (prior year: €0.0 million).
Cash flows from financing activities amounted to €21.3 million in the reporting year after €-238.6 million in the prior year. This was mainly due to cash flows from the first tranche of the bond issued in August 2012. The redemption, in particular, of the Schuldscheindarlehen (German Private Placement) and the bond issued in 2002 led to an outflow of €134.1 million.
please refer
to page 80
please refer
to page 104
58

Cash earnings amounted to €295.6 million in the fiscal year (prior year: €255.5 million). The €40.1 million increase was primarily due to improved earnings. As a result, the cash flow-to-sales ratio rose to 8.6% (prior year: 7.7%).
Free cash flow amounted to €-84.2 million (prior year: €156.5 million), mainly due to the rise in net capital expenditure in intangible assets and property, plant and equipment. The increase in working capital, which could not be completely offset by improved earnings and the change in provisions, also impacted free cash flow.
Liquidity and Financing
Strong liquidity position
As of the reporting date, the CLAAS Group had liquidity of €767.2 million (prior year: €818.8 million) that is mainly invested in time deposits and call money as well as near-money market securities. As of September 30, 2012, the CLAAS Group also had financing commitments of €826.8 million (prior year: €823.0 million), of which €521.9 million (prior year: €562.4 million) had not been called.
Stable and long-term refinancing
The two privately placed bonds are the largest individual financial liabilities items. At the end of 2002, CLAAS issued a bond with a nominal value of 200.0 million US dollars with a term until December 2014 and a coupon of 5.76% p.a. on the US capital market. Following the scheduled redemptions of 40.0 million US dollars each in 2010 and 2011, the nominal value of this bond as of the reporting date amounted to 120.0 million US dollars. In August 2012, CLAAS undertook an additional private placement in the US dollar zone, placing a bond in the United States. The proceeds of the bond, with a total volume of 300.0 million US dollars, is distributed in two 10-year term tranches with bullet maturity. The first tranche, with a nominal volume of 190.0 million US dollars and a coupon of 3.98% p.a., was redeemed in August 2012. The second tranche, with a nominal volume of 110.0 million US dollars and a coupon of 4.08% p.a., will be redeemed in first quarter of the next fiscal year. The purpose of the new bond is to serve the long-term financing of the CLAAS Group.
please refer
to page 104 f.
Cash Earningsin € million
2008
2009
2010
2011
2012
Cash earnings Cash flow-to-sales ratio in %
285.9
156.9
117.2
255.5
295.6
4.7
5.4
7.7
8.6
8.8
59Corporate Boards | Group Management Report | Consolidated Financial Statements
Financial Performance
Cash Position

Financial liabilities also include the Schuldscheindarlehen (German Private Placement). Following the scheduled redemption of €73.0 million in June 2012, the outstanding part of the loan with a fixed interest rate of 6.04% p.a. (due in June 2015) is valued at €53.5 million as of the end of the fiscal year.
In addition to readily available credit facilities from banks of €271.9 million (prior year: €312.4 million), CLAAS also has access to a flexible multi-currency credit facility (“syndicated loan”) with a nominal value of €250.0 million and a term until 2014 to provide additional funding.
CLAAS also reinforced its capital base by issuing subordinated perpetual securities in the amount of €80.0 million in October 2004. This equity instrument has a coupon of 7.62% p.a.
CLAAS also uses the asset-backed securitization program (ABS) to sell trade receivables to a special pur-pose entity on a revolving basis. Due to the seasonal nature of sales realization in the agricultural equipment industry, substantial financing is needed during the course of the year. By contrast, at the end of the fiscal year, the relatively lower level of capital tied up in working capital generally leads to high liquidity levels. The ABS program helped to effectively reduce seasonal liquidity fluctuations. The volume of receivables trans-ferred amounted to €121.0 million as of September 30, 2012 (prior year: €142.0 million).
Net liquidity amounted to €333.5 million – liquidity ratios are up
At €333.5 million, net liquidity was down €109.4 million on the prior year’s figure of €442.9 million, due to con-siderably high capital expenditure and the rise in working capital as well as the increase in financial liabilities resulting from the newly placed bond.
At the end of the fiscal year, CLAAS had a strong liquidity position, indicated by the liquidity ratios: At 82.3% and 132.5% as of the reporting date, the cash and quick ratios were up on the prior year’s figures of 80.1% and 121.6% respectively. This was primarily due to the relatively low decline in liquidity compared with the drop in current liabilities, which was mainly due to the redemption of the Schuldscheindarlehen (German Private Placement).
please refer
to page 103
Statement of Cash Flows (Summary)
2012 2011
in € million
Free cash flowStatement of
cash flows
Free cash flowStatement of
cash flows
Cash and cash equivalents at beginning of year 535.8 579.6
Cash flows from operating activities 115.1 115.1 244.5 244.5
Net capital expenditure in intangible assets, property, plant and equipment, borrowings and investments
- 123.7
- 123.7
- 88.0
- 88.0
Repayment of financial receivables from deconsolidated companies
- 75.6
- 75.6
-
-
Free cash flow - 84.2 156.5
Change in securities 59.5 41.9
Cash flows from investing activities - 139.8 - 46.1
Cash flows from financing activities 21.3 - 238.6
Effect of foreign exchange rate changes on cash and cash equivalents
4.1
- 3.6
Change in cash and cash equivalents 0.7 - 43.8
Cash and cash equivalents at end of year 536.5 535.8
60
Financial Position
Solid balance sheet structure
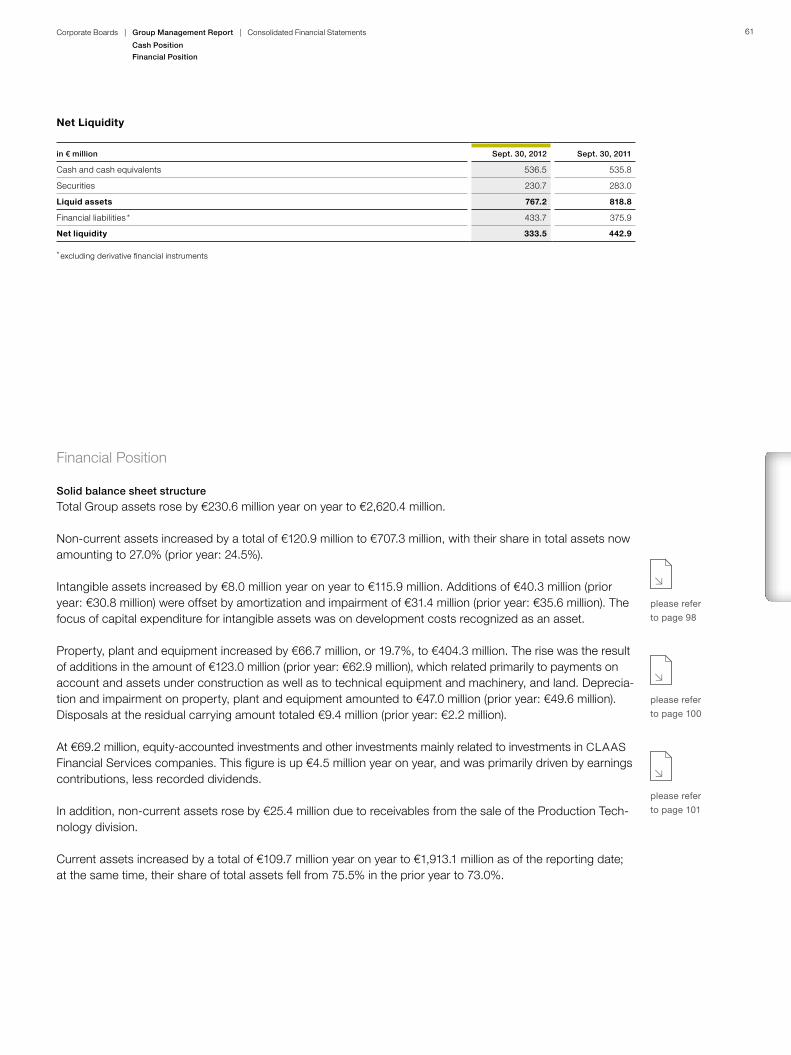
Total Group assets rose by €230.6 million year on year to €2,620.4 million.
Non-current assets increased by a total of €120.9 million to €707.3 million, with their share in total assets now amounting to 27.0% (prior year: 24.5%).
Intangible assets increased by €8.0 million year on year to €115.9 million. Additions of €40.3 million (prior year: €30.8 million) were offset by amortization and impairment of €31.4 million (prior year: €35.6 million). The focus of capital expenditure for intangible assets was on development costs recognized as an asset.
Property, plant and equipment increased by €66.7 million, or 19.7%, to €404.3 million. The rise was the result of additions in the amount of €123.0 million (prior year: €62.9 million), which related primarily to payments on account and assets under construction as well as to technical equipment and machinery, and land. Deprecia-tion and impairment on property, plant and equipment amounted to €47.0 million (prior year: €49.6 million). Disposals at the residual carrying amount totaled €9.4 million (prior year: €2.2 million).
At €69.2 million, equity-accounted investments and other investments mainly related to investments in CLAAS Financial Services companies. This figure is up €4.5 million year on year, and was primarily driven by earnings contributions, less recorded dividends.
In addition, non-current assets rose by €25.4 million due to receivables from the sale of the Production Tech-nology division.
Current assets increased by a total of €109.7 million year on year to €1,913.1 million as of the reporting date; at the same time, their share of total assets fell from 75.5% in the prior year to 73.0%.
please refer
to page 98
please refer
to page 100
please refer
to page 101
Net Liquidity
in € million Sept. 30, 2012 Sept. 30, 2011
Cash and cash equivalents 536.5 535.8
Securities 230.7 283.0
Liquid assets 767.2 818.8
Financial liabilities * 433.7 375.9
Net liquidity 333.5 442.9
* excluding derivative financial instruments
61Corporate Boards | Group Management Report | Consolidated Financial Statements
Cash Position
Financial Position

Inventories increased by €122.5 million, or 21.9%, to €682.1 million, mainly due to a higher assembly program and related not only to work in progress, but also to finished goods in particular. As a result, average inventory turnover amounted to 18.1% (prior year: 14.8%). The increase in inventories also resulted in a rise in working capital, which climbed by €171.8 million, or 26.4%, year on year to €822.7 million. The share of working capital in total assets amounted to 31.4% (prior year: 27.2%).
Trade receivables increased in a sales-related manner by €29.5 million to €294.4 million. Average receivables turnover amounted to 8.1% (prior year: 7.7%). At 42 days, the average Days Sales Outstanding (DSO) adjusted for ABS receivables was on par with the prior-year figure of 41 days.
Liquid assets, which are composed of cash and cash equivalents plus current securities, fell by €51.6 million to €767.2 million (prior year: €818.8 million). Its share in total assets decreased from 34.3% to 29.3%.
Equity-to-assets ratio up considerably
Equity of the CLAAS Group increased by €224.7 million to €1,094.8 million year on year, which was mainly due to positive net income of €232.7 million. This was offset in particular by dividend payments. The equity-to-assets ratio rose to 41.8% (prior year: 36.4%) and is an indication of the Group’s strong internal financing power.
Non-current liabilities increased by a total of €96.2 million, or 19.4%, to €593.5 million, primarily due to the change in financial liabilities. A bond with a nominal value of 300.0 million US dollars was placed in August 2012; the first tranche of the bond, with a nominal value of 190.0 million US dollars, was paid out in the report-ing period. This was offset by a reclassification of non-current financial liabilities to current financial liabilities. Pension provisions as of the reporting date amounted to €179.4 million (prior year: €185.5 million).
please refer
to page 102
Balance Sheet (Summary)
Sept. 30, 2012 Sept. 30, 2011
in € million in % in € million in %
Non-current assets 707.3 27.0 586.4 24.5
thereof: intangible assets (115.9) (4.4) (107.9) (4.5)
thereof: property, plant and equipment (404.3) (15.4) (337.6) (14.1)
Current assets 1,913.1 73.0 1,803.4 75.5
thereof: inventories (682.1) (26.0) (559.6) (23.4)
thereof: trade receivables (294.4) (11.2) (264.9) (11.1)
thereof: liquid assets (767.2) (29.3) (818.8) (34.3)
Total assets 2,620.4 100.0 2,389.8 100.0
Equity 1,094.8 41.8 870.1 36.4
Non-current liabilities 593.5 22.6 497.3 20.8
thereof: financial liabilities (310.4) (11.8) (193.8) (8.1)
thereof: provisions (224.6) (8.6) (236.1) (9.9)
Current liabilities 932.1 35.6 1,022.4 42.8
thereof: trade payables (162.7) (6.2) (170.8) (7.1)
thereof: provisions (500.7) (19.1) (507.8) (21.2)
Total equity and liabilities 2,620.4 100.0 2,389.8 100.0
62

By contrast, current liabilities decreased by €90.3 million to €932.1 million, primarily due to the changes in financial liabilities, payments received on account and provisions. Current financial liabilities mainly declined due to the scheduled redemption of the Schuldscheindarlehen (German Private Placement). No payments received on account needed to be recognized as of the reporting date (prior year: €22.4 million) due to the disposal of the Production Technology division companies. In addition, provisions declined by a total of €7.1 million to €500.7 million. Other current provision increased mainly as a result of higher sales obligations, which went hand in hand with the positive business development. The share of current and non-current provisions in total equity and liabilities totaled 27.7% (prior year: 31.1%).
Sound asset and capital structure
Non-current assets were covered by equity and non-current liabilities at a ratio of 238.7% (prior year: 233.2%). Non-current assets plus 50.0% of inventories were financed by equity and non-current liabilities at a ratio of 161.0% (prior year: 157.9%). These figures show that the CLAAS Group has a sound asset and capital struc-ture.
Changes in the scope of consolidation, which in the reporting year mainly related to the disposal of the Pro-duction Technology division companies, resulted in a total €181.4 million decrease in non-current and current assets (prior year: €25.2 million), while non-current and current liabilities declined by €140.0 million (prior year: €24.8 million).
Other financial commitments not reported in the consolidated balance sheet mainly resulted from the rental and lease business. No off-balance sheet liabilities that could prove to be a financial burden on CLAAS in the future were incurred while selling the Production Technology division companies.
Balance Sheet Structurein %
Total assets in € million
Assets Equity and liabilities
2,3902,620
2012 2011
2,390
18
27
26
29
42
23
35
2,620
2012 2011
Equity
Non-current liabilities
Current liabilities
Non-current assets
Inventories
Other current assets
Liquid assets
18
25
23
34
36
21
43
63Corporate Boards | Group Management Report | Consolidated Financial Statements
Financial Position
Capital Expenditure
Investments at €191.3 million
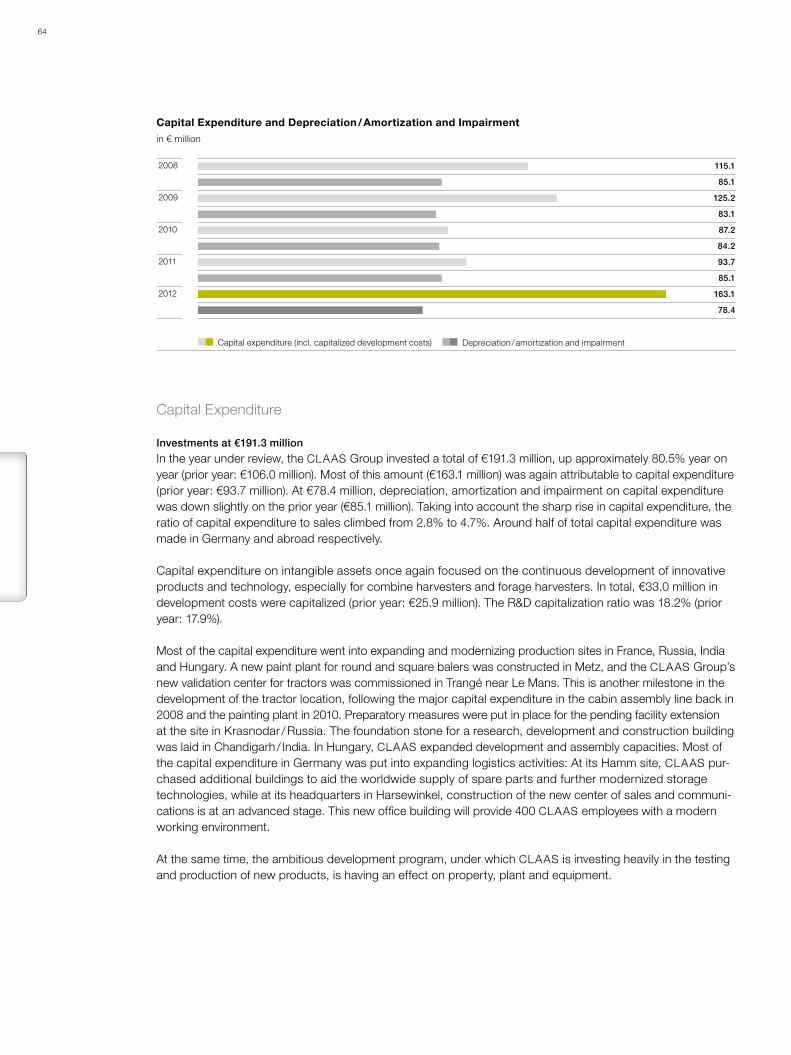
In the year under review, the CLAAS Group invested a total of €191.3 million, up approximately 80.5% year on year (prior year: €106.0 million). Most of this amount (€163.1 million) was again attributable to capital expenditure (prior year: €93.7 million). At €78.4 million, depreciation, amortization and impairment on capital expenditure was down slightly on the prior year (€85.1 million). Taking into account the sharp rise in capital expenditure, the ratio of capital expenditure to sales climbed from 2.8% to 4.7%. Around half of total capital expenditure was made in Germany and abroad respectively.
Capital expenditure on intangible assets once again focused on the continuous development of innovative products and technology, especially for combine harvesters and forage harvesters. In total, €33.0 million in development costs were capitalized (prior year: €25.9 million). The R&D capitalization ratio was 18.2% (prior year: 17.9%).
Most of the capital expenditure went into expanding and modernizing production sites in France, Russia, India and Hungary. A new paint plant for round and square balers was constructed in Metz, and the CLAAS Group’s new validation center for tractors was commissioned in Trangé near Le Mans. This is another milestone in the development of the tractor location, following the major capital expenditure in the cabin assembly line back in 2008 and the painting plant in 2010. Preparatory measures were put in place for the pending facility extension at the site in Krasnodar / Russia. The foundation stone for a research, development and construction building was laid in Chandigarh / India. In Hungary, CLAAS expanded development and assembly capacities. Most of the capital expenditure in Germany was put into expanding logistics activities: At its Hamm site, CLAAS pur-chased additional buildings to aid the worldwide supply of spare parts and further modernized storage technologies, while at its headquarters in Harsewinkel, construction of the new center of sales and communi-cations is at an advanced stage. This new office building will provide 400 CLAAS employees with a modern working environment.
At the same time, the ambitious development program, under which CLAAS is investing heavily in the testing and production of new products, is having an effect on property, plant and equipment.
Capital Expenditure and Depreciation / Amortization and Impairmentin € million
2008
2009
2010
2011
2012
115.1
85.1
125.2
83.1
87.2
84.2
93.7
85.1
163.1
78.4
Capital expenditure (incl. capitalized development costs) Depreciation / amortization and impairment
64

Research and Development
As a leading manufacturer of agricultural machinery, CLAAS knows exactly what farmers want and need: Exceptional cost effectiveness, great versatility, intelligent technologies and, last but not least, maximum comfort. CLAAS continues to set new standards in all these areas. To ensure things stay this way in the future, CLAAS invested a total of €181.2 million (prior year: €144.3 million) in research and development – a new Company record. CLAAS now has some 3,000 active patents filed around the world, including the 87 devel-opments (prior year: 80) for which patents were filed in the reporting year.
Innovative products and developments
CPS – CLAAS Power Systems – brings together all competencies needed to generate, transform and use power to provide the best possible drive system. This system meets the requirements of the statutory emission standards for self-propelled machines and was a focal point for development work in the reporting year.
The development of combine harvesters focused on the completion of the new top-of-the-line LEXION 780 model. The new LEXION is full of key innovations and improvements. In addition to complying with the Tier 4i emission standard, the combine harvester is equipped with the new machine optimization system CEMOS AUTOMATIC as well as the intelligent and variable cooling system DYNAMIC COOLING. The 4-link axel pro-vides exceptional maneuverability. Customer benefit is further augmented by the 12,500 liter grain tank and increased discharge rate.
New forage harvester standards are being set by CLAAS DYNAMIC POWER. This demand-led power control system was honored by German agricultural association Deutsche Landwirtschafts-Gesellschaft e.V. (DLG).
Among the large tractors, the new XERION 5000 proved its precision and power at speed in fiscal 2012, setting a new world record in the precision sowing of maize. With its enormous pulling power, ease of opera-tion and wealth of intelligent systems, the AXION 900 opens up great potential in many highly demanding applications.
The press response to the mid-sized tractor ARION has been positive on all counts. The new model offers not only ultimate comfort and high efficiency, it is also extremely versatile. The new top model, the ARION 640, comes equipped with CPM Powerboost and can achieve an output of up to 175 hp when needed.
For further infor-
mation, please
visit our Web site
www.claas.com
Select country site
Products
Research and Development Costs*in € million
2008
2009
2010
2011
2012
113.8
124.8
122.6
144.3
181.2
* Before capitalized and amortized development costs.
65Corporate Boards | Group Management Report | Consolidated Financial Statements
Capital Expenditure
Research and Development
The forage harvesting machinery and the combi-wagons now include the new DISCO mowers range and the CARGOS combi-wagon, which comes equipped with an LED lighting kit to provide greater comfort when working in the dark. A further innovation in this area is the VOLTO 1100: The trailed version of the world’s first three-point linkage mounted 10 rotor tedder has a working range of 10.7 m. The VOLTO 1100 was awarded the 2012 innovation prize at the Bayerischen Zentral-Landwirtschaftsfest (ZLF).
Many Efficient Agriculture Systems (EASY) topics are currently being worked on: The vendor-neutral TONI (Telematics on Implement) telemetry system bundles and accelerates the transmission of data from the tractor and the attached machinery directly to the office via ISOBUS, irrespective of the task at hand. CLAAS is also involved in a number of different projects funded by the Federal Ministry of Agriculture; one of these projects is the networking of agricultural working processes.
Purchasing
Fiscal year 2012 was marked by the stabilization of market prices at a high level. Although the volatility of commodity prices declined, raw materials prices fluctuated wildly. They were not in line with the economic climate as a result of the financial and economic crisis, which simmered for the entire year. Rubber prices normalized once more after hitting a record high. Steel prices also dropped due to considerable price volatil-ity, while scrap steel prices remained high. Despite the crisis, oil and oil product prices remained relatively high, impacting the substitutability of steel and synthetic materials in our products. The prices of non-ferrous metals rose unexpectedly towards the end of the fiscal year. This may be a sign that the latent effects of com-modity speculation (liquidity) will offset global economic worries in the coming year.
CLAAS Purchasing successfully addressed this development by putting targeted measures into place. Against the market trend, savings were made through the invitation to tender for the inbound freight volume for West-ern Europe and new logistics structures were implemented. A long-term logistics purchasing strategy was also developed using a structured approach. The geographic growth of the CLAAS Group was also supported by new outbound freight approaches (CLAAS machines to Romania and Bulgaria) as well as by new ideas for inbound freight (India and Turkey) and optimizing the total cost of purchasing.
For further infor-
mation, please
visit our Web site
www.claas.com
Homepage Group
Purchasing
CLAAS Supplier.Net
66

Activities to increase localization in the United States and Russia were further intensified. One purchasing project in Russia identified new local suppliers.
Taking into account geographic growth, Global Sourcing also looked at Asia, which was then integrated into the Global Sourcing Plan for the coming years.
The CLAAS purchasing strategy was also redefined: Under the heading of “Mutual Earned Preferential Treat-ment”, this is based on the close relationship between CLAAS and its suppliers, focusing on the goals of cost and innovative leadership.
Employees
Commitment and company loyalty
As a family-owned company, CLAAS is characterized by long-term and future-oriented thinking and actions, placing a great deal of value on the commitment shown by its employees.
The personnel policy of continuity and identification with the Company promotes employee loyalty and forms the basis for stable jobs and professional development opportunities.
Number of employees worldwide is up
The number of people employed by the CLAAS Group as of September 30, 2012 rose to 9,077 (prior year: 9,060) despite the sale of the Production Technology division companies. CLAAS is becoming increasingly international. This fact is reflected by the share of people employed outside Germany, a figure that rose to 48.7% (prior year: 45.3%). The greatest number of employees abroad work in France (approximately 26.8%). A total of 521 people were in vocational training throughout the Company at the end of the fiscal year (prior year: 538).
The year-on-year rise in the number of employees is not limited to individual countries, but is instead due to the new employees engaged in all areas worldwide.
Our corporate group features a balanced age structure and a high degree of company loyalty. The average age of CLAAS employees in Germany as of the reporting date was 41 years.
please refer
to page 119
Employees by Region
2,941 (32.4 %)
599(6.6 %)
Germany
Rest of Western Europe
Central and Eastern Europe
Other countries
4,660(51.3 %)
877 (9.7 %)
67Corporate Boards | Group Management Report | Consolidated Financial Statements
Research and Development
Purchasing
Employees

Personnel expenses rose by 1.4% in fiscal year 2012 to €548.1 million (prior year: €540.4 million), correspond-ing to a 16.0% share of Group sales (prior year: 16.4%).
International networking of personnel development and marketing
Finding qualified young talent and internal personnel development are especially important for CLAAS. The Company’s future strategy is mainly based on providing systematic training and personnel development. CLAAS trains young people in Germany in various technical and business professions and as part of the Ger-man “dual study” system. The same applies to the other countries in which CLAAS has operations such as France, Russia, the United Kingdom and India. The ratio of trainees to full-time equivalents in Germany was 7.3% in the reporting period (prior year: 7.8%). This has been at a constantly high level for many years.
By maintaining close contact with technical colleges and universities in a number of different countries, CLAAS fosters the interest of up-and-coming technical and business students in agriculture, a contact that regularly attracts qualified graduates to the Company.
In 2012, CLAAS was again rated as one of the 50 top employers in Germany for young engineers, confirming once more that it is an attractive employer.
In the past fiscal year, the international CLAAS junior staff advancement and succession planning trainee pro-gram allowed a total of 46 qualified graduates to systematically prepare to take on a challenging position within the Company. As a global program, the individual countries have their own key areas. The focus in the United States is on sales, while France, Russia, India and Hungary focus on engineering.
Technology leaders such as CLAAS must constantly work to improve the expertise of their employees. At CLAAS, this is achieved through a Group-wide targeted seminar and training program. This program focuses on developing methods along with specialist knowledge and social competence as well as working to pro-mote intercultural cooperation. Project managers and other management executives can also participate in indi-vidual development programs.
For further infor-
mation, please
visit our Web site
www.claas.com
Homepage Group
Jobs & Career
Trainees by region Trainee courses in Germany
Dual business course of study
Dual technical course of study
Business training
Technical / commercial training
India
United Kingdom
France
Germany
Trainees
331
521
148
339
331235
40
2828
68

Attractive remuneration and fringe benefits
CLAAS promotes company loyalty by offering interesting and challenging positions as well as by providing attractive, performance-related remuneration packages. All employees also have the option of investing a portion of their salary in retirement programs. In Germany, all employees can take advantage of the wealth-creation program sponsored by CLAAS by becoming silent partners and participating in the earnings of the Company via CMG Claas-Mitarbeiterbeteiligungs-Gesellschaft mbH.
CLAAS is highly conscious of the challenge of balancing family and work. Flextime and part-time models as well as working from home, for example, enable large portions of the workforce to tailor their work hours individually.
In view of the demographic change taking place, activities to promote and maintain employee health is a key part of the overall concept of forward-looking human resources.
Risk Management
Internal control and risk management system
As a globally active corporate group, CLAAS is subject to various types of risk. In order to systematically identify, measure, and adequately respond to these risks at an early stage, CLAAS has implemented a three-pillar concept of risk management. At CLAAS, one of the goals when taking entrepreneurial action is to deliberately enter into calculable risk to allow it to take advantage of the related opportunities.
In the CLAAS Group, a uniform, Group-wide risk management system is an integral part of corporate management and control. This serves to take advantage of opportunities, identify any significant risk that could jeopardize the ability of the Company to continue as a going concern, and ensure appropriate risk handling. The risk management system and implemented risk controlling utilizes a wide variety of information for ongoing identification, evaluation, and control of risks. The existing system, which is continually being developed further, complies with all statutory early warning requirements in full.
69Corporate Boards | Group Management Report | Consolidated Financial Statements
Employees
Risk Management

The Group’s reporting system represents an essential element in the continuous monitoring of economic risks. In addition to the external data supplied, detailed internal reports and evaluations are provided to decision-makers on a monthly basis. Budgets are monitored for deviations, earnings projections for feasibility, and any new risks are identified and documented on an ongoing basis. Within existing organizational structures, the risk management system is accounted for and supported by the operating and administrative areas of responsibility. In addition to the regular information provided, an obligation to prepare ad hoc risk reports ensures prompt management action at all times. The internal auditing department of CLAAS is responsible for monitoring the adequacy of the risk management system and conformity with regulations.
The goal of the internal control and risk management system for the financial reporting process and the Group financial reporting process is to ensure the effectiveness of the accounting system and its adherence to generally accepted accounting principles. This system guarantees compliance with statutory norms, financial reporting standards, and intragroup accounting policies, which are binding for all companies included in the consolidated financial statements. The key information on this is available to the entire Group via the CLAAS intranet. CLAAS ensures that all information is up to date by conducting continuous analyses of any changes to determine their relevance and their impact on the financial statements. The Group accounting department is primarily responsible for this task. CLAAS prepares its financial statements using a Group-wide reporting system that is also used for preparation of the budget, medium-term planning, and estimates during the fiscal year. The reporting system incorporates principles, processes, and controls to ensure that the financial statements comply with all requirements. The extensive scope of the control processes is exemplified by the following:
Group-wide specifications for accounting, measurement, and account coding of key items that are updated and communicated to the responsible departments on an ongoing basis;
Organizational measures in combination with access authorizations for accounting systems, separation of tasks, and rights of disposal;
Dual control of financial reporting processes and in connection with the preparation of the financial statements;
Internal audit procedures;
Activities from external service providers
70

Internal audit conducts regular reviews as well as reviews on a case-by-case basis of whether legal requirements and internal instructions are being adhered to by all companies and corporate functions, both in and outside of Germany, and of whether the internal control system is effective and functional. As part of the reviews, inter-nal audit develops suitable measures to be implemented by management of the relevant company.
More detail on the main risks is provided below. In addition, the risk related to financial instruments is described in Notes 36 and 37 of the consolidated financial statements.
Industry and company-specific risk
The risk landscape of CLAAS as an internationally positioned enterprise is affected by extreme variations in harvest yields due to climate conditions and by decisions on agricultural policies in addition to intense com-petitive pressure in the industry. Risks and opportunities are managed centrally by monitoring and evaluating market-related indicators in conjunction with the risks of specific countries.
Along with controlled risk taking, acting entrepreneurially also involves dealing in depth with all risks along the value-added chain. Due to faster innovation cycles, research and development are critical in ensuring that innovative and technically mature products are developed and brought to market for the benefit of customers.
Risk on the procurement side is taken into account by constantly observing the relevant markets and entering into the according hedging transactions.
In the production area, all equipment is serviced regularly and any potential sources of risk are eliminated by modifying the equipment in order to reduce the risk of production downtime. Flexible working time models ensure that the required human resources can be adjusted to meet the degree of capacity utilization. To reduce quality risk, a central quality management department guarantees adherence to and fulfillment of pre-defined standards of quality.
Markets and their early warning indicators are carefully observed on an ongoing basis in order to identify any fluctuations in demand or changing buying behavior in sales markets at an early stage. This ensures that product strategies are kept up to date and are adapted to respond to changing customer requirements and reactions from competitors.
please refer
to page 113 ff.
71Corporate Boards | Group Management Report | Consolidated Financial Statements
Risk Management
Financial risk
In recent months and years, corporate financing has focused more on the viability of existing risk manage-ment principles and companies’ financing policies. Like other companies, CLAAS has also had to ask itself whether its available liquidity commitments would suffice on a sustained basis and whether its refinancing risks are sufficiently covered. Another question involved was whether the Company’s finance policy has been sensibly planned and will take account of expected changes at banks and on the capital markets.
CLAAS was prepared for a typical risk pattern to ensue from the financial and economic crisis: counterparty and refinancing risk. Strategic refinancing risks are monitored for a relatively long target for our drawn borrowings. To cover these, CLAAS successfully completed a private placement with a value of 300.0 million US dollars with a term of 10 years in the United States during the reporting year. In terms of operating liquidity management, we had ensured in prior years that short-term liquidity planning was fully comprehensible and linked to short-term balance sheet planning and with the short-term account statement, eliminating “isolation effects”. In com-bination with the internal incentive and sanction mechanisms introduced in earlier years, the CLAAS Group has considerably improved forecasting quality and the speed at which items are recorded in the liquidity plan-ning system.
CLAAS has been managing its investment and derivative positions based on counterparty limits for years. The system of managing debit and credit risk in Purchasing and Sales has also proven effective. Credit risks that could result from payment default or delayed payments are minimized through effective receivables management, close cooperation with banks, and credit insurance. Financial risk and currency risk are coun-tered by employing hedging instruments and by regular, intense monitoring of a set of early warning indicators. In addition, the Group treasury department began using Performance Management Software (PMS) in its full range of functions in 2009 to enable independent evaluations, performance measurement, and forward-looking scenario simulations of financial instruments. This software is used at CLAAS to rate financial assets and to hedge interest rate and exchange rate risk.
In the area of dealer and sales financing, the policy of following a captive financing model to a limited extent only has paid off. The risk mix has remained sustainable thanks to the close integration of CLAAS Financial Services companies into the risk reporting system of a major European commercial bank known for its con-servative approach, and the practice of concentrating primarily on business with end consumers.
72
IT risk
The Group’s uniform global IT strategy allows systems as well as security strategies and concepts to be effectively and continuously adapted to reflect current requirements and developments.
Legal risk
Decisions in the CLAAS Group are based on intense legal consultation in order to avoid any risk related to the various provisions and statutes regarding taxes, competition laws, patents, and tort law. When deemed prudent to enter into risk, the risks are transferred to insurance companies by means of global master policies and national framework agreements on a uniform basis across the Group.
Assessment of the overall risk position of the CLAAS Group
An analysis of the individual risks currently discernible has not identified any risks that – singly or in combination with other risks – could jeopardize the continued existence of the CLAAS Group as a going concern during or beyond the period under review, even in light of the current economic climate.
Events After the Balance Sheet Date
There were no events or developments after the end of the fiscal year that could have led to material chang-es in the presentation or the measurement of individual assets or liabilities as of September 30, 2012. The second tranche of the privately placed bond resulted in cash inflows of 110.0 million US dollars in November 2012. This tranche of the bond, with a nominal interest rate of 4.08% p.a., matures in November 2022.
73Corporate Boards | Group Management Report | Consolidated Financial Statements
Risk Management
Events After the Balance Sheet Date

Outlook
While the macro-economic situation remains tense, conditions for sustained agricultural growth are positive. Steady yields and high crop prices significantly increased farmers’ income. Empirical data and recent surveys indicate a stable willingness to invest.
For the coming crop year, 2012 / 2013, the IGC expects cereal production to decline, primarily due to climatic conditions. While 1,849 million tons were produced in 2011 / 2012, the forecasts for 2012 / 2013 only amount to 1,761 million tons (as of October 2012).
Demand for cereals will continue climbing as the world’s population increases and dietary habits change to include more animal protein. Power generation is an increasingly important agricultural topic. Analysts and trade associations expect agricultural product prices to remain steady or increase slightly. Potential risks may arise in particular from unforeseen weather conditions and trade restrictions.
The markets in Western and Central Europe will trend toward continued high-level development. While macro-economic prospects are currently muted in light of the euro crisis, steady yields and high crop prices significantly increased farmers’ income. Farmers’ declining capital expenditure in wind power and photovoltaic plants affords additional free capital for agricultural equipment.
The agricultural equipment industry is expected to see continuing growth in Eastern Europe. Despite a sig-nificant drop in the production of agricultural products due to the long period of drought during the summer, the agricultural equipment market is expected to grow. Many Western manufacturers will see Russia’s admis-sion to the WTO as an opportunity to increase sales. Risks arise from possible protectionist measures as well as the country’s overall unstable economy.
Expectations for the North American markets remain positive. Despite the extreme drought that hit many parts of the United States, the Department of Agriculture (USDA) expects agricultural incomes to hit a new record high. Based on these factors in combination with continued low interest rates, it can be assumed that investor activity will pick up and markets will remain stable.
74

The agricultural equipment markets in South America will again develop at a high level following a slight downturn last year. Agricultural production values are expected to be up in Brazil and Argentina. High prices and stable input costs result in good incomes and a corresponding high willingness to invest.
Asia’s agricultural equipment markets will grow even more in 2013. Despite delayed rains in some regions in summer 2012, harvest yields were higher than in the prior year. High crop prices also meant positive agri-cultural incomes in Asia. However, a tense global economy still provides a degree of uncertainty.
All in all, CLAAS assesses the market trend as positive for the coming fiscal year. However, given global economic developments and the high and quickly varying financial liquidity, risk exists due to the volatility of procurement prices, such as those for energy, steel, and other commodities, and based on the perfor-mance of currencies of significance to CLAAS such as the US dollar and the Russian ruble. Given the bud-getary and debt crisis affecting a number of countries in the euro zone, it is currently impossible to say whether the measures of the European stability mechanism will have any effect. All of the above-mentioned risks are being monitored carefully and appropriate measures are taken to combat them in the best possible way.
CLAAS is forecasting a moderate rise in sales in the coming two years on the basis of this market assessment. CLAAS will continue to pursue the measures implemented in prior years to increase efficiency and reduce costs. We again expect good earnings, even if these prove to be down on the high level seen in the past fiscal year. High expenses for the ambitious development program as well as the ongoing expansion of sales struc-tures and locations will impact financial performance in 2013.
75Corporate Boards | Group Management Report | Consolidated Financial Statements
Outlook