Embed Size (px)
Citation preview

10/23/2015
1
The world without oilThe world without oil
How the world will operate without fossil energy and when is this likely to
happen
1

10/23/2015
2
Conventional Wisdom• Oil and gas is a limited natural resource. We are finding hydrocarbon
resources in hard to reach and operate environments. That is why access to energy resources will continue to be more costly.
• Society is prepared to pay this high cost of energy because it has no real alternative.
• Alternatives that have been presented so far are too expensive, have fundamental technical limitations and will not be produced on a large enough scale to make a difference in the next 30-50 years.
• As nations like China and India continue to develop, they will replicate the same patterns of energy production and consumption as developed nations. That will continue to increase the demand for hydrocarbons for ground transportation, electricity generation and air travel.
• The oil and gas industry has unmatched intellectual, financial, political resources, and is well positioned to compete in the 21st century and will continue to prosper.
2

10/23/2015
3
“Its hard to make predictions. Especially about the future” h b d b l h– Danish proverb used by Niels Bohr
• Salt, was a “strategic resource used for centuries” and turned into an affordable commodity.y
• “Great horse manure crisis” ‐ never materialized.• “The great promise of nuclear energy” turned out to be too
expensive and too riskyexpensive and too risky.• “The limits to growth”. “Hubbard’s curve”. “Twilight in the
desert”. The world did not run out of fossil fuels, we are running out of fresh air to put CO2 into “Peak oil” for USA hasrunning out of fresh air to put CO2 into. Peak oil for USA has happened in the 1970’s based on per capita metric.
• Holditch “resource triangle” – essentially infinite hydrocarbon resourcesresources.
• “World will continue to use more fossil energy.” We see the decoupling of GDP and energy consumption in advanced economies (USA Germany others)economies (USA, Germany, others).
3

10/23/2015
4
Presentation OutlinePresentation Outline
• A little bit of history. The story of salt and the y ygreat environmental crisis at the beginning of the 20th century.
• Unconventional resources energy parity and the• Unconventional resources, energy parity and the era of great competition.
• How do we use oil? Do we expect changes?How do we use oil? Do we expect changes?– Automobiles and transportation– Heat and electric power generation– Aviation
• Where do we go from here?
4

10/23/2015
5
Salt Story• Today salt is a common and inexpensive substance. But, “Until about 100 years
ago, when modern geology revealed its prevalence, salt was one of the world's most sought‐after commodities. A substance so valuable it served as currency, l h i fl d h bli h f d d i i k d dsalt has influenced the establishment of trade routes and cities, provoked and
financed wars, secured empires and inspired revolutions.”• Salt has shaped civilizations from the very beginning. “Most Italian cities were
f d d i l k i i h R i h hill b hi d hfounded proximate to saltworks, starting with Rome in the hills behind the saltworks at the mouth of the Tiber”.
• Over the past several thousand years, humans have used salt to preserve food. Th R i d lt f it ldi d h At ti ldiThe Roman army required salt for its soldiers and horses. At times soldiers were even paid in salt, hence the words salary, “worth his salt”, soldier.
• Demand for salt established the earliest trade routes. The first of the great R d th Vi S l i S lt R d b ilt t b i thi lt t l tRoman roads, the Via Salaria, Salt Road, was built to bring this salt not only to Rome but across the interior of the peninsula.
• Salt has provoked and financed some wars, and been a strategic element in th h th A i R l ti d th Ci il W G dhi' lt h iothers, such as the American Revolution and the Civil War. Gandhi's salt march in
1930 began the overthrow of British rule in India.
Mark Kurlansky Salt: A World History. (2002), ISBN 0‐8027‐1373‐45

10/23/2015
6
Salt Industry InventionsSalt Industry Inventions
The salt industry invented drilling and pumping, and had the first recorded industrial use of natural gas “Few endeavors have inspired more ingenuity than salt making from theof natural gas. Few endeavors have inspired more ingenuity than salt making, from the natural gas furnaces of ancient China to the drilling techniques that led to the age of petroleum”.
6Mark Kurlansky Salt: A World History. (2002), ISBN 0‐8027‐1373‐4

10/23/2015
7
“The Great Horse Manure Crisis” • By the late 1800s, horse
pollution became a major problem. A public health and
it ti i i fsanitation crisis of “unimaginable dimensions” loomed. All transport of goods or people was drawn by horses. The horse had been the dominant mode of transportation for thousands of yearsof years.
• Horse population was growing faster than human city population. London (1900) had > 50,000 horses. In New York (1900) 100,000 horses produced 2.5 million pounds of horse manure per day More horses required more land to stable and feed themmanure per day. More horses required more land to stable and feed them.
• In 1894, the Times of London estimated that by 1950 every street in the city would be buried nine feet deep in horse manure. It was predicted that by 1930 the horse droppings in NYC would rise to Manhattan’s third‐story windows. “Vacant lots across America were
http://www.accessmagazine.org/articles/spring‐2007/ From Horse Power to Horsepower By Eric A. MorrisEdwin G. Burrows and Mike Wallace, Gotham: A History of New York City to 1898 New York: Oxford University Press, 1999.
piled high with manure; in New York these sometimes rose to forty and even sixty feet”.
7

10/23/2015
8
What Happened? Better Technology Better EconomicsBetter Technology, Better Economics
• Modern geology and drilling technology proved that salt resources are essentially infinite for practical purposes.
• The invention of refrigeration reduced the need for salt. Refrigeration is a better technology to preserve food. Also it led to increased productivity of farming and increased population of the western states.
• It took about 30 years for refrigeration to become prevalent. The timeline: – On February 15, 1882, the Dunedin sailed for London from New Zealand, what was the first commercially
successful refrigerated shipping voyage, and the foundation of the refrigerated meat industry.[*]
– By 1914, almost every location used artificial refrigeration. The big meat packers had purchased the most expensive units which they installed on train cars and in branch houses and storage facilities in the more remote distribution areas. [**]
• The great horse manure crisis vanished when millions of horses were replaced by motor vehicles.
• The price of horse‐drawn transport rose steadily as the cost of keeping cities clean, feeding and housing horses increased. This created strong incentives for people to find alternatives.
* Colin Williscroft (2007). A lasting Legacy ‐ A 125 year history of New Zealand Farming since the first Frozen Meat Shipment. NZ Rural Press Limited.** Freidberg, Susanne (2010). Fresh : a perishable history (1st Harvard University Press pbk. ed. ed.). Cambridge, Mass.: Belknap. p. 142. ISBN 0674057228.http://fee.org/freeman/detail/the‐great‐horse‐manure‐crisis‐of‐1894 09/ 01/2004 by Stephen Davies
8

10/23/2015
9
When The Transition Starts It Takes 30 to 45 Years
http://www.dtpli.vic.gov.au/__data/assets/pdf_file/0010/220402/Electric‐Vehicle‐trial‐mid‐term‐report.pdf
Technology adoption curves for a range of modern innovations. Theoretical take‐off point at 16% market penetration. (Rogers 1962)
9

10/23/2015
10
Unconventional Oil and Gas• Estimates of conventional vs. unconventional reserves and resources for North Americareserves and resources for North America.
• Worldwide projections for “unconventionals” show essentially unlimited resource.show essentially unlimited resource.
• Amazing technology advances led to drilling and completion efficiency gains.p y g
• EUR is not very attractive for low k oil.• What is the production activation index (PAI)?What is the production activation index (PAI)? How does it translate to cost of power $/W?
• Implications.p
10

10/23/2015
11
11Lecture on unconventional resources by SPE President 2002 Dr. S.A.Holditch

10/23/2015
12
Oil Price HistoryOil Price History
BP statistical review of world energy 201412

10/23/2015
13
Coal Price History, in $/short ton and $/MMbtu
70
2 586
3.103
50
60
70Nominal, $/mmbtu
1 552
2.069
2.586
30
40
50
short ton Real,
$/mmbtu
0 517
1.034
1.552
10
20
30
$ pe
r
0.000
0.517
0
10
49 52 55 58 61 64 67 70 73 76 79 82 85 88 91 94 97 00 03 06 09
19 19 19 19 19 19 19 19 19 19 19 19 19 19 19 19 19 20 20 20 20
13
10/23/2015
14
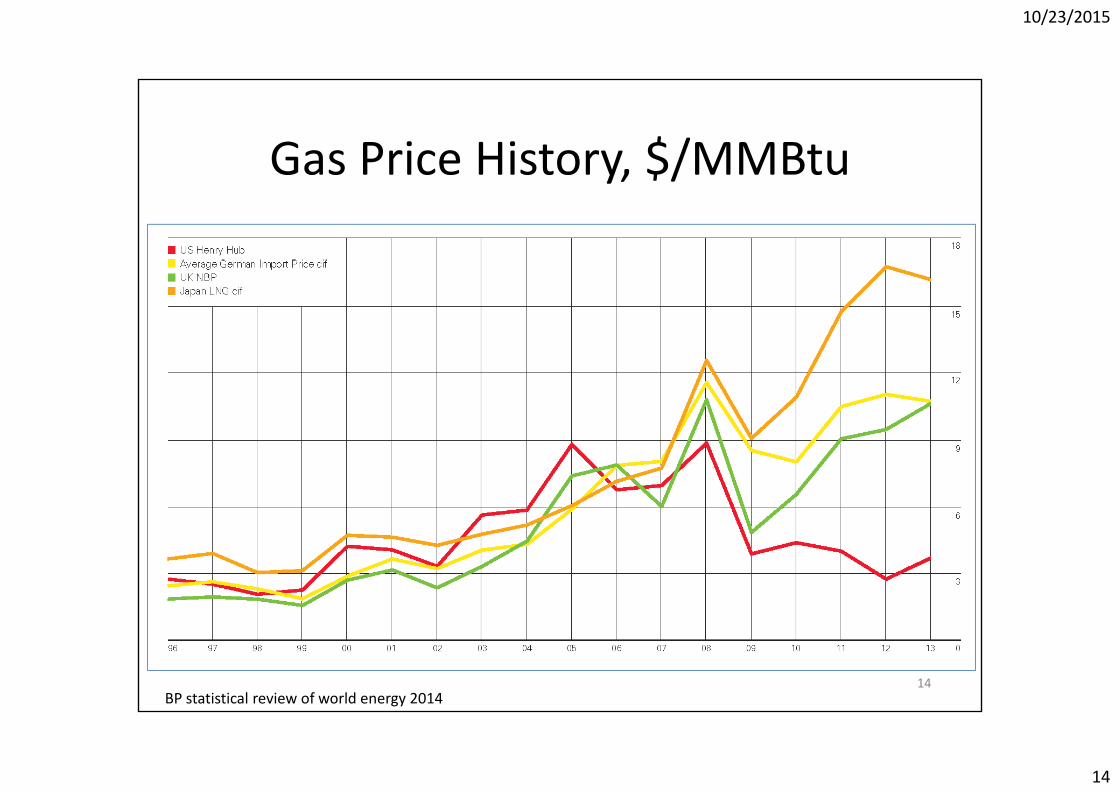
Gas Price History, $/MMBtuGas Price History, $/MMBtu
BP statistical review of world energy 201414

10/23/2015
15
Oil Industry Continues to Enjoy a Convenience Fee
70
High oil price $25/MMBtu vs gas $10/MMBtu vs. coal $1.5/MMBtu (2008)
60
70
40
50
hort to
n
20
30
$ pe
r sh
0
10
1949
1953
1957
1961
1965
1969
1973
1977
1981
1985
1989
1993
1997
2001
2005
2009
BP statistical review of world energy 201415

10/23/2015
16
Aggregate Technically Recoverable Resources (TRR) in N th A i A S ffi i t f 60 YNorth America Are Sufficient for 60+ Years
10000
1000
TRR Conventional, Tcfe
TRR Unconventional, Tcfe
Aggregate Resources (Tcfe)
10
100
1
16Cheng, K., Wu, W., Holditch, S. A., Ayers, W. B., & McVay, D. A. (2010, January 1). Assessment of the Distribution of Technically Recoverable Resources in North American Basins. Society of Petroleum Engineers. doi:10.2118/137599‐MS

10/23/2015
17
Worldwide Conventional And Unconventional Resources Are Essentially InfiniteResources Are Essentially Infinite
P10/P50/P90 correspond to 377, 219 and 146 years at current consumption
Unconventional OGIP Tcfe 1,000,000
100,000
1,000,000 Unconventional OGIP, Tcfe
P90
100,000
Total unconventional OGIP, Tcf
Conventional hydrocarbons (oil plus gas) in‐place, Tcfe
10,000
Tcfe
P90
P50
P10 10,000
1,000 CIS MET NAM AAO AFR LAM EUP World
1,000 CIS MET NAM AAO AFR LAM EUP World
“ConclusionsConclusionsFrom using published assessments of 26 North American basins, published global assessments, and resource-triangle-based methodology presented in this paper, we have developed a global estimate of unconventional gas in place with quantifying the uncertainty and conclude the following:1. Estimated global unconventional OGIP ranges from 83,300 Tcf(P90) to 184,200 Tcf(P10). The P50 of our global
17
unconventional OGIP assessments (125,700 Tcf) is 4 times greater than Rogner's estimate of 32,600 Tcf.”
Dong, Z., Holditch, S., McVay, D., & Ayers, W. B. (2012, October 1). Global Unconventional Gas Resource Assessment. Society of Petroleum Engineers. doi:10.2118/148365‐PA

10/23/2015
18
Comparing Different Sources of Energy• Oil production rate, Qo (STB/D), Energy/time => Power => W• Production activation index (PAI) = CAPEX/Qo => $/W • PAI correlated to EUR > CAPEX/Energy > c/kWh
Darcy’s Law for PSS Flow in oil field unitsDarcy’s Law for PSS Flow in oil field units
• PAI correlated to EUR => CAPEX/Energy => c/kWh
Darcy s Law for PSS Flow in oil field unitsDarcy s Law for PSS Flow in oil field units
ppkhQ wfr**00708.0 khT 00708.0
srrB
Qe
oo
fo
75.0ln
ppPB
khT
f
oo
00708.0
rw
J
ppP
D
wfr
1JPTQ **
s
rrw
e 75.0lnDo JPTQ **

10/23/2015
19
Comparison Between PAI In Different Areas
19SPE 108818 Diyashev 2005

10/23/2015
20
Typical EUR Per Well And PAI For Low k Oil Fields
1000.0
500 0
600.0
700.0
800.0
900.0
MSTB
EUR for 10 mln$ CAPEX, MSTB
100.0
200.0
300.0
400.0
500.0
EUR, M
0.0
• EUR per well is from about 180 M STB to 700 M STB • EUR per 10MMUSD CAPEX is in the range of about 400 M to 1 MM STB
PAI USD/STB/D i i th f 4000 t 14000 $/STB/D
20http://www.ogj.com/articles/print/vol‐110/issue‐12/exploration‐development/evaluating‐production‐potential‐of‐mature‐us‐oil.html 12/3/2012 by Rafael Sandrea
• PAI, USD/STB/D is in the range from 4000 to 14000 $/STB/D

10/23/2015
21
Amazing Efficiency Gains• Average oil and gas production rate per active drilling rig has improved by a factor of 3.5. • We use more efficient drilling process, pattern drilling, better technologies, and tools.
10000100
Permian
• Horizontal drilling and better completion/stimulation increased Qo.
1000
illing rig
, boe
/D Bakken Region
Eagle Ford Region
Haynesville Region g im
provem
ent
Permian Region
Niobrara Region
Eagle Ford Region
100
s produ
ction pe
r dr Haynesville Region
Marcellus Region
Niobrara Region
10
uctio
n rate per rig Region
Bakken Region
Haynesville Region
Marcellus
10
6 7 8 9 0 1 2 3 4 5 6Average oil an
d gas Permian Region
Utica Region
1Prod
u Marcellus Region
Utica Region
21
01/01/06
01/01/07
01/02/08
01/01/09
01/01/10
01/01/11
01/02/12
01/01/13
01/01/14
01/01/15
01/02/16A
Time
http://www.eia.gov/petroleum/drilling/ data from EIA drilling productivity report

10/23/2015
22
Smaller Efficiency Gains In The Larger Basins
1000
10000total rig count
100
Bakken Region
Eagle Ford Region
1000
average oil and gas rate per rig, BOE/D
100
Rig coun
t Haynesville Region
Marcellus Region100
05/28/05
10/10/06
02/22/08
07/06/09
11/18/10
04/01/12
08/14/13
12/27/14
05/10/16
10 Niobrara Region
Permian Region
Utica Region
100Q improvement
0 0 0 0 0 0
1
01/01/06
01/01/07
01/02/08
01/01/09
01/01/10
01/01/11
01/02/12
01/01/13
01/01/14
01/01/15
01/02/16
10
Q im
provem
ent
22
Time
110 100 1000
Q
Rig countData from EIA drilling productivity report

10/23/2015
23
Comparison Of The Production Profile For “Conventional” And “Unconventional” Oil WellConventional And Unconventional Oil Well
1 600100000
800
1,000
1,200
1,400
1,600
M STB
Qo, hyperbolic
Qo, STB/D
Conventional
200
400
600
800
EUR, M
10000
tion, STB
/mon
th
Conventional Qo
‐Np Conventional,
ExponentialNp Hyperbolic Np
Unconventional, Hyp+Exp 1000
Oil prod
uct
Qoi = 500 STB/D
1000 60 120 180 240 300 360 420
Conventional Di =12%, 1/yearDi, 1/year= 70%b = 1Dmin = 12%
23
0 60 120 180 240 300 360 420Time, months
Dmin = 12%Economic Limit = 10 STB/D

10/23/2015
24
Production Activation Index100
Economic AssumptionsUnconventional oilCombination of hyperbolic and
10
of cost, c/kW
h
cent/kWh
Combination of hyperbolic and exponential declineCFAT = 40%Di, year‐1 = 70%b = 1
11000 10000 100000
Fuel com
pone
nt
100
b = 1Dmin = 12%d (ROR) = 12%
0.1Production Activation Index, $/STB/D
10
EX
$50
$75For a given volume of investment
11000 10000 100000
Payout/CAP
$75
$100
For a given volume of investment $10 MM, for a value of PAI we can calculate EUR. Under the assumption of hyperbolic plus exponential decline
240.1Production Activation Index, $/STB/D
$150
PAI is related to EUR. Hence we have CAPEX/Energy => c/kWh
10/23/2015
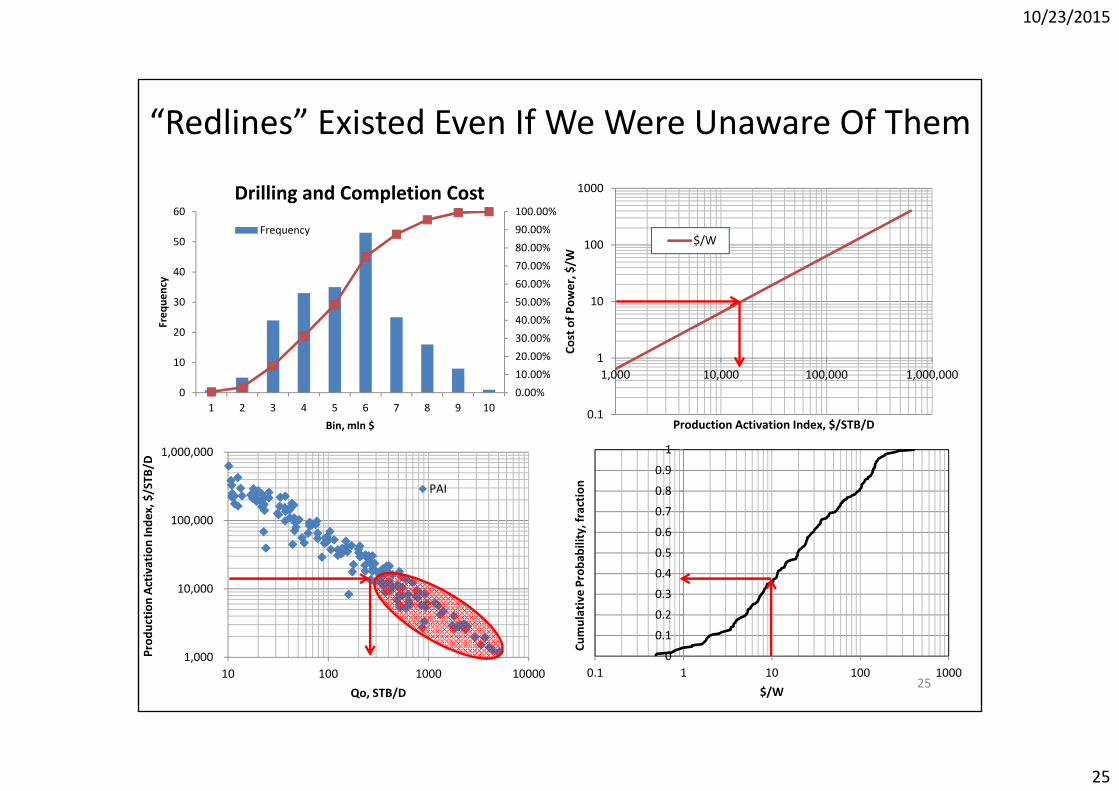
25
“Redlines” Existed Even If We Were Unaware Of Them
80.00%90.00%100.00%
50
60Drilling and Completion Cost
Frequency100
1000
W
$/W
30.00%40.00%50.00%60.00%70.00%
20
30
40
Freq
uency
10
Cost of P
ower, $/W
0.00%10.00%20.00%
0
10
1 2 3 4 5 6 7 8 9 10Bin, mln $
0.1
11,000 10,000 100,000 1,000,000
C
Production Activation Index, $/STB/D
100,000
1,000,000
ndex, $/STB
/D
PAI
0 6
0.7
0.8
0.9
1
y, fractio
n10,000
ction Ac
tivation In
0.2
0.3
0.4
0.5
0.6
ulative Prob
ability
25
1,000 10 100 1000 10000
Prod
uc
Qo, STB/D
0
0.1
0.1 1 10 100 1000
Cumu
$/W

10/23/2015
26
About ¾ Of All Produced Oil Is Used As Gasoline Heating Oil And Jet FuelGasoline, Heating Oil And Jet Fuel
26Data from http://www.eia.gov/dnav/pet/pet_cons_psup_dc_nus_mbbl_m.htm

10/23/2015
27
API View “If It Ain’t Broke, Don’t Fix It.”API View If It Ain t Broke, Don t Fix It.• Transportation solutions are primarily oil driven. Natural gas still is the major source of energy for electric power.
h f d l bl i h hi i i i l ffi i I l• The fundamental problem with this mix is its low energy efficiency. Internal combustion engines have an energy efficiency of about 20%. Jet airplanes and power stations have an efficiency of about 30‐40%.
27http://www.api.org/~/media/files/policy/soae‐2015/api‐2015‐soae‐report.pdf

10/23/2015
28
Disruptive TechnologiesDisruptive Technologies
• Gasoline fueled cars => electric carsGasoline fueled cars => electric cars• Electricity generated from fossil fuels => Solar
h l i i d d?• How much solar power generation is needed? • Airplanes => electric trains => magnetic levitation trains
• Efficiency and costs history and projectionsy y p j
28

10/23/2015
29
Number Of Electrified Models Available In The US MarketIn The US Market
Transportation consumes 46% of the oil in the US.
100hybrids
f l ll
1000
mod
els
10
fuel cell carEV 100
+Hyb
rid+FC m
in th
e USA
10
10
numbe
r of E
V+available i
total EV+Hybrid+FC
1
1998
2000
2002
2004
2006
2008
2010
2012
2014
1
1990
2000
2010
2020
2030
2040
2050
Total n
1 2 2 2 2 2 2 2 2 1 2 2 2 2 2 2
www.fueleconomy.gov data from annual fuel economy review by EPA and DOE 29

10/23/2015
30
By 2023 We Should See The Trajectory Of Market P t ti b El t i CPenetration by Electric Cars
16% of total current number of automobiles is 176 million2.5% of total number of automobiles is 27,5 million2.5% of total number of automobiles is 27,5 million
100,000,000
1,000,000,000
es
Global number of Plug‐Ins
Alternative projection
10,000,000
of Plug‐in veh
icle projection
100,000
1,000,000
Globa
l num
ber
10,000 2009
2010
2011
2012
2013
2014
2015
2016
2017
2018
2019
2020
2021
2022
2023
2024
2025
2026
2027
2028
2029
2030
2031
http://www.hybridcars.com/global‐plug‐in‐car‐sales‐now‐over‐600000/ by Jeff Cobb October 22, 2014http://cleantechnica.com/2015/09/21/1‐million‐evs‐sold‐worldwide/ by James Ayre September 21st, 2015
30
1/1/2
1/1/2
1/1/2
1/1/2
1/1/2
1/1/2
1/1/2
1/1/2
1/1/2
1/1/2
1/1/2
1/1/2
1/1/2
1/1/2
1/1/2
1/1/2
1/1/2
1/1/2
1/1/2
1/1/2
1/1/2
1/1/2
1/1/2

10/23/2015
31
USA Sales Numbers Indicate A Transition From Innovators To Early Adopters
100000
y p
10000
1000
s d d S af d lt d d d
Toyota Priu
ota Ca
mry Hybrid
ord Fusio
n Hy
brid
Tesla
Mod
el
Nissan
Le a
ord C‐max Hybrid
Chevy Vo
l
us CT200h Hy
brid
ota Avalon
Hybrid
da Accord Hy
brid
Toyo Fo Fo
Lexu
Toyo
Hond
USA sales over Jan‐May 2014. Estimated the year 2014 sales of 450000 units are about 2.5% of total USA sales.
Eric Schaal http://www.cheatsheet.com/automobiles/10‐best‐selling‐electric‐vehicles‐and‐hybrids‐in‐2014.html/?a=viewall http://en.wikipedia.org/wiki/Hybrid_electric_vehicles_in_the_United_States
Today there are 1.4% of EV of the total fleet of 256 MM
31
10/23/2015
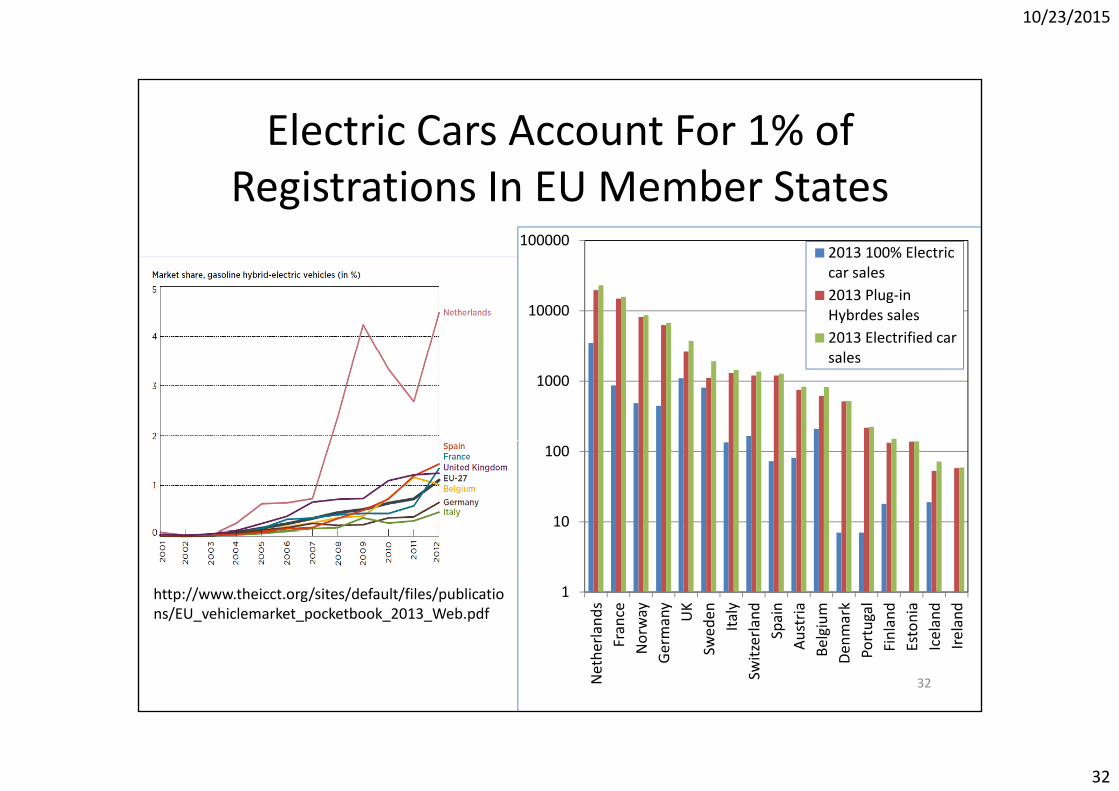
32
Electric Cars Account For 1% of bRegistrations In EU Member States
1000002013 100% Electric
10000
car sales2013 Plug‐in Hybrdes sales2013 Electrified car
1000sales
10
100
1nd
snce
way any
UK
den
aly
and
ain
tria um ark
gal
and
nia
and
and
http://www.theicct.org/sites/default/files/publications/EU_vehiclemarket_pocketbook_2013_Web.pdf
Nethe
rlan
Fran
Norw
Germa
Swed It
Switzerl a Spa
Aust
Belgiu
Denm
aPo
rtu
Finla
Esto
Icela
Irela
_ _p _ _ p
32

10/23/2015
33
Hybrids Break Through In The Japan kAuto Market
20 km/l = 47 miles/gallon
http://www.theicct.org/blogs/staff/hybrids‐break‐through‐japan‐auto‐marketPublished Fri, 2014.04.04 | By Dan Rutherford 33

10/23/2015
34
China EV Story Is Amazing In Two WaysPlug‐in EV Sales in China rose 37.9% to 17,600 in 2013. Overall sales in 2014 appear to have more than tripled as compared to 2013, with total market share climbing to 0.25%. All the top selling models are Chinese made except for the Tesla model S.
China car sales 2008-2014
http://chinaautoweb.com/2014/01/plug‐in‐ev‐sales‐in‐china‐rose‐37‐9‐to‐17600‐in‐2013/http://evobsession.com/china‐electric‐car‐sales‐estimates‐2014/ February 13th, 2015 by James Ayre
34

10/23/2015
35
Current State Of Battery TechnologyCurrent State Of Battery Technology
Tesla 85kWh battery has stored energy equivalent to the useful energy in 11 gallons of gas. 35
http://my.teslamotors.com/roadster/technology/battery

10/23/2015
36
Cost And Energy Density Of EV Batteriesgy y
If battery life is 1,000 cycles, then the extra cost of storage of kWh is 20c/kWh.If battery life is 10 000 then the extra cost is just 2c/kWh Storage of solar energy
http://energy.gov/sites/prod/files/2014/02/f8/eveverywhere_road_to_success.pdfEV everywhere – Grand Challenge, US DOE
36
If battery life is 10,000, then the extra cost is just 2c/kWh. Storage of solar energy becomes competitive.

10/23/2015
37
Principle Limitations Today Are Long Charging Times And Low Energy Densityg g gy y100.00
h/kg
1.00
10.00
nsity, kWh
ges in
cond
s
0.10
nergy de
n
Charg
16 se
0.01
total
gy useful
y y no
w
ne
citors
ne‐ hium
eries
E
Gasoline
energ
Gasoline u
energy
est b
attery
Graph
enup
ercapac
Graph
enrapp
ed lit
ulfur b
atte
G
Be su w su
5 October 2010. The Royal Swedish Academy of Sciences has decided to award the Nobel Prize in Physics for 2010 to Andre Geim and Konstantin Novoselov"for groundbreaking experiments regarding the two‐dimensional material graphene“. http://www.nobelprize.org/nobel_prizes/physics/laureates/2010/press.html
37

10/23/2015
38
Bernstein said “Welcome to Terrordome”Electric power generation and heating consumes 21% of the oil in the USA.
http://reneweconomy.com.au/wp‐content/uploads/2014/04/Bernstein‐solar.pdfBernstein Energy & Power Blast: Equal and Opposite… If Solar Wins, Who Loses; By Michael Parker, Hugh Wynne, Neil Beveridge, Oswald Clint, Bob Brackett, Scott Gruber, April 4, 201438

10/23/2015
39
Available Energy Resourcesgy
Solar Energy Perspectives © OECD/IEA, 2011
Technical potentials reported here represent the range of estimates for total worldwide potentials for annual RE supply and do not deduct any potential that is already being utilized. 1 exajoule (EJ) ≈ 278 terawatt hours (TWh).
39

10/23/2015
40
Price Learning Curve ‐ Swanson’s Law• Learning Rate: Each time the cumulative production doubled, the price went down by 20 %
for the last 33 years. Learning rate for Crystalline Technology (from Q2-2006 to Q4-2013) is 24.5 %. Learning rate for Thin Film Technology (from Q2-2006 to Q4-2013) is 20.9 %. I G i f t i l 10 t 100 kW PV ft t d 14 000• In Germany prices for a typical 10 to 100 kWp PV rooftop-system were around 14,000 €/kWp in 1990. At the end of 2013, such systems cost about 1,350 €/kWp. This is a net-price regression of 89 % over a period of 23 years and is equivalent to an annual compound average price reduction rate of 9 %.
all bulk PV Technologies
2
2
//$$
Wm
WUnitCost
c‐Si 121 GWpThin Film 18 GWp
2/ mWattWatt
40FRAUNHOFER INSTITUTE FOR SOLAR ENERGY SYSTEMS ISE “Photovoltaics Report”. Freiburg, 24 October 2014, www.ise.fraunhofer.de Dr. Simon Philipps (Fraunhofer ISE) [email protected] and Werner Warmuth (PSE AG) [email protected]

10/23/2015
41
41

10/23/2015
42
42

10/23/2015
43
Levelized Cost Of Energy Comparison—Sensitivity to Fuel PricesSensitivity to Fuel Prices
Unconventional
Conventional
Lazard‘s levelized cost of energy analysis — version 8.0 September 2014
Darkened areas in horizontal bars represent low end and high end levelized cost of energy corresponding with ±25% fuel price fluctuations.
43

10/23/2015
44
Average Price For 1 kWh In January Tripled Over 35 YearsTripled Over 35 Years
44

10/23/2015
45
Solar Is Affordable And CompetitiveTypical ranges and weighted averages for the total installed costs of utility‐scale renewable power generation technologies by region, 2013/2014.
Nuclear CAPEX = 10 USD/W
SOFC CAPEX = 7‐8 USD/W
SD/kW
2014
US
IRENA. Renewable power generation costs in 2014 http://www.irena.org/DocumentDownloads/Publications/IRENA_RE_Power_Costs_Summary.pdf
45

10/23/2015
46
254*254 km of Solar Panels In The Sahara C S l Th E ti W ld With ECan Supply The Entire World With Energy
46

10/23/2015
47
Pay Back Time for Multicrystalline Silicon PV R f S G hi l C iRooftop Systems ‐ Geographical Comparison
47
Data: M.J. de Wild‐Scholten 2013. Image: JRC European Commision. Graph: PSE AG 2014 (Modified scale with updated data from PSE AG and FraunhoferISE) FRAUNHOFER INSTITUTE FOR SOLAR ENERGY SYSTEMS ISE “Photovoltaics Report”. Freiburg, 24 October 2014, www.ise.fraunhofer.de Dr. Simon Philipps (Fraunhofer ISE) [email protected] and Werner Warmuth (PSE AG) [email protected]
10/23/2015
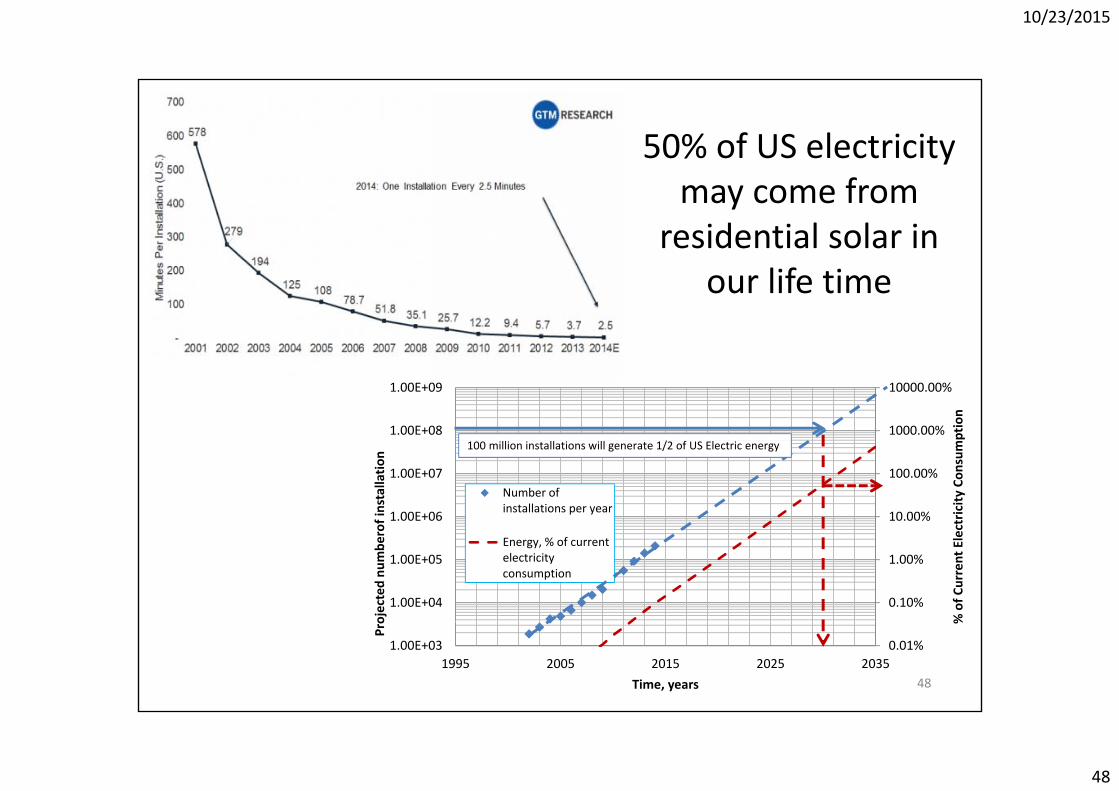
48
50% of US electricity may come from
residential solar in our life time
1000.00%
10000.00%
1.00E+08
1.00E+09
ption
/
10.00%
100.00%
1.00E+06
1.00E+07
ectricity
Con
sum
of in
stallatio
n
Number of installations per year
100 million installations will generate 1/2 of US Electric energy
0.10%
1.00%
1.00E+04
1.00E+05
% of C
urrent Ele
ojected nu
mbe
r
Energy, % of current electricity consumption
0.01%1.00E+031995 2005 2015 2025 2035
%
Pro
Time, years 48

10/23/2015
49
Transforming Parking Lots Into Power Plants
BakersfieldCollegeCollege
Number of Parking spots in the USA 800,000,000Area (8.5*21 ft) 16.58Share of parking spots under the sun 50%Share of parking spots under the sun 50%Total area that can be harvested, m2 6,633,277,056Annual Global Horizontal Irradiation, kW*h/m2 (Average in USA) 1600Conversion efficiency, % 20A l ti t ti l kW*h 2 1E 12
Photo credit http://solairegeneration.com/
Annual energy generation potential, kW*h 2.1E+12Electric power consumption (kWh) in the United States 4.1E+12Share of electric power consumption 51% 49

10/23/2015
50
World Total Energy Demand ProjectionWorld Total Energy Demand Projection
900 30.1
800
Qua
ds
World: New Policies Scenario, Quads
Current Policies Scenario, Quads
450 Scenario, Quads
26.8
r
600
700
Projectio
n, Q
23.4
20.1 power
500
gy Dem
and P
16.7
TW
300
400
Total Ene
rg
13.4
10 03001980 1990 2000 2010 2020 2030 2040 2050
Years
10.0
© 2014 OECD/IEA Source: World Energy Outlook 201450

10/23/2015
51
Total World Energy Demand in 2007 Was 465 Quads Q
Energy efficiency = 45.65%Most energy is wasted in electricity generation 63.2% and transportation 75.6% 51

10/23/2015
52
Solar Will Probably Overtake Fossil Fuels In Power Generation In Our Life TimePower Generation In Our Life Time
100000Wh
10000
ation, TW
1000
wer gen
era
CoalGasOil
100
Globa
l pow
OilSolar
102000 2010 2020 2030 2040 2050
G
Time, yearsSource: World Energy Outlook 2014 New Policies ScenarioHistorical data by Hanergy Research Team, Bloomberg New Energy Finance
52
10/23/2015
53
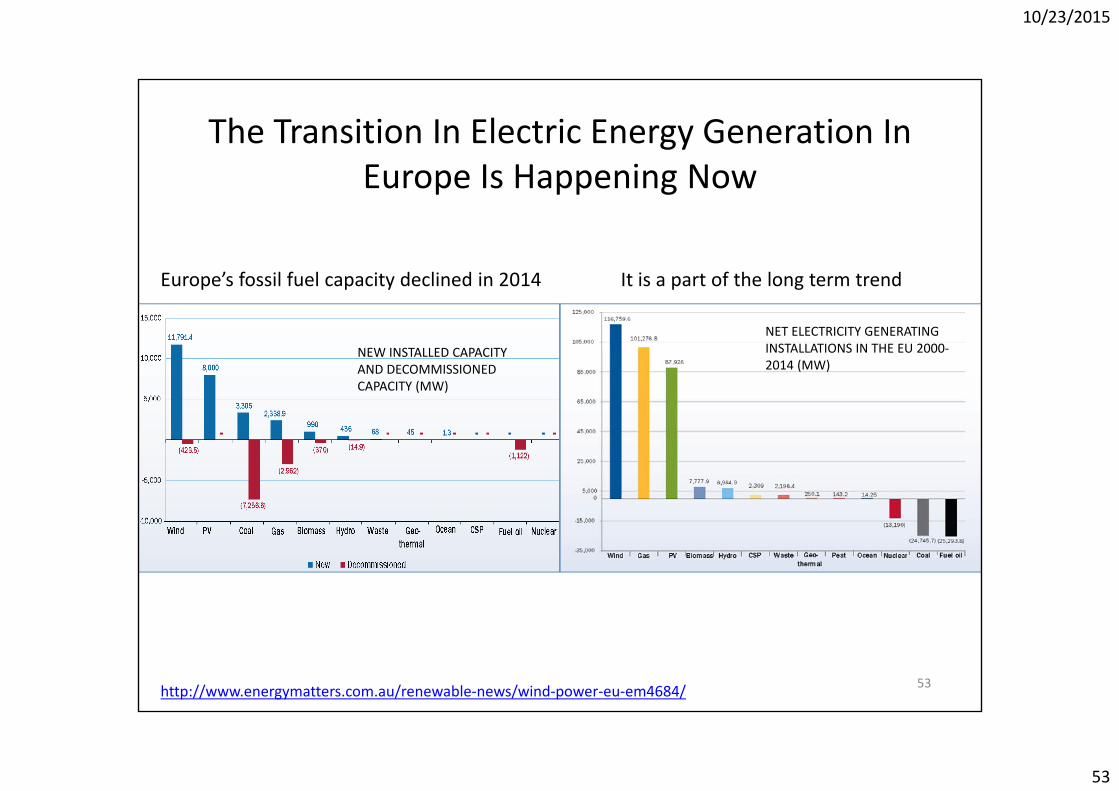
The Transition In Electric Energy Generation In E I H i NEurope Is Happening Now
NEW INSTALLED CAPACITY
Europe’s fossil fuel capacity declined in 2014 It is a part of the long term trend
NET ELECTRICITY GENERATING INSTALLATIONS IN THE EU 2000‐NEW INSTALLED CAPACITY
AND DECOMMISSIONED CAPACITY (MW)
INSTALLATIONS IN THE EU 20002014 (MW)
http://www.energymatters.com.au/renewable‐news/wind‐power‐eu‐em4684/ 53

10/23/2015
54
A Vision Of A Future Euro‐Mediterranean GridInterconnecting sites with large renewable electricity sources and sites with high demand for clean energy .
http://www.menarec.org/resources/Trieb_EUMENA_Whitebook_02.pdfSustainable electricity and water for Europe Middle East and North Africa By Franz Trieb and Hans Müller‐Steinhagen
54

10/23/2015
55
DCHV Transmission Is a KeyDCHV Transmission Is a Key• “War of Currents” competition (end of 19th century) between the direct
current (DC) system of Thomas Edison and the AC system of Georgecurrent (DC) system of Thomas Edison and the AC system of George Westinghouse. AC transmission became the de facto standard.
• Technology mainly developed in Sweden and Germany in the 1930’s. One of the first large scale trials in USSR in 1950.
• Now the longest HVDC link in the world is currently the Xiangjiaba–Shanghai 2,071 km (1,287 mi), ±800 kV, 6400 MW link connecting the Xiangjiaba Dam to Shanghai in China.
• This is roughly equivalent to 24” gas transmission pipeline operating at• This is roughly equivalent to 24” gas transmission pipeline operating at 250 bars (about 3700 psia) of pressure.
• HVDC link Ekibastuz – Tambov (USSR, Kaz‐Rus) 2414 km line 750 kV 6000 MW was abandoned around 1990 due to the collapse of the USSR.6000 MW was abandoned around 1990 due to the collapse of the USSR.
• The principle advantage of DCHV is minimal energy losses of about 3% at 1000 km in transmission of vast quantities of energy at large distances.
http://new.abb.com/systems/hvdc/references/xiangjiaba‐‐‐shanghaihttp://en.wikipedia.org/wiki/List_of_HVDC_projects 55

10/23/2015
56
In Europe Transition Seems To Be Accelerating
What are the reasons? Prices? Environmental concerns? Politics?
100.0%
Share of energy from renewable sources for electricity
2000 2010 2020 2030 2040 2050
56
10.0%
Data from http://ec.europa.eu/eurostat/statistics‐explained/index.php/Energy_from_renewable_sources
10/23/2015
57
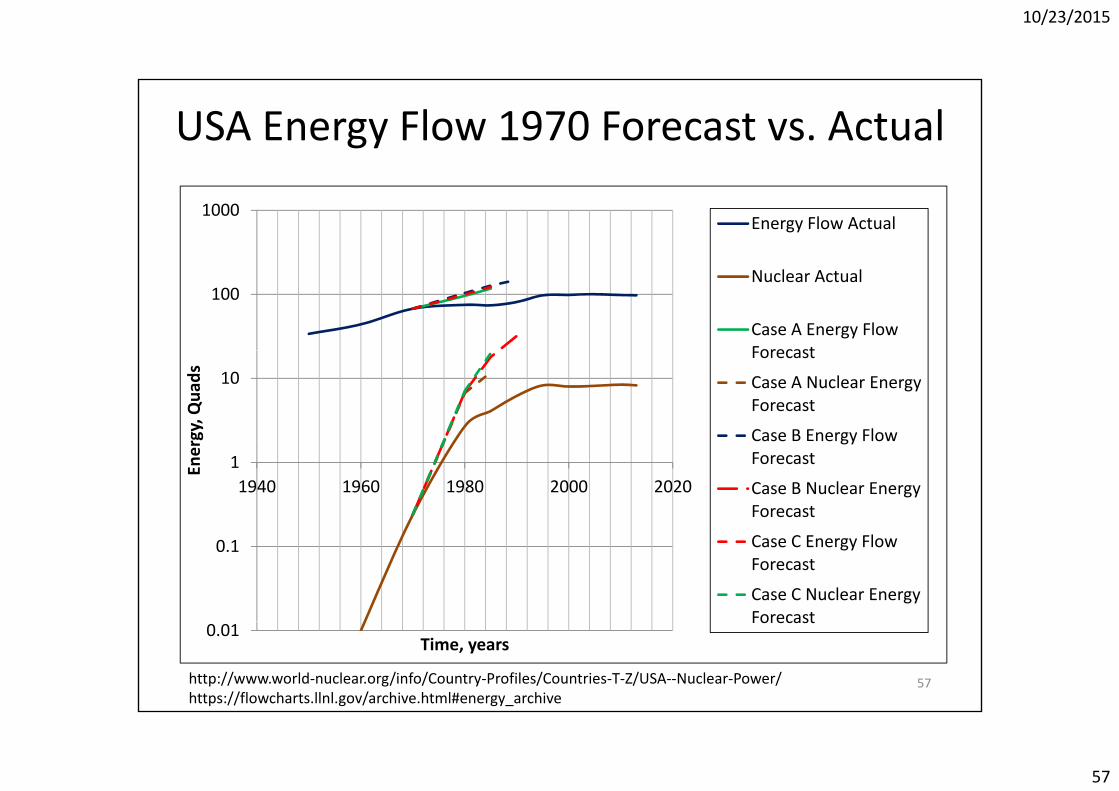
USA Energy Flow 1970 Forecast vs. Actual
1000Energy Flow Actual
100Nuclear Actual
Case A Energy Flow Forecast
10
rgy, Qua
ds
Forecast
Case A Nuclear Energy Forecast
Case B Energy Flow11940 1960 1980 2000 2020
Ener
Case B Energy Flow Forecast
Case B Nuclear Energy Forecast
0.1 Case C Energy Flow Forecast
Case C Nuclear Energy Forecast
57
0.01Time, years
Forecast
http://www.world‐nuclear.org/info/Country‐Profiles/Countries‐T‐Z/USA‐‐Nuclear‐Power/https://flowcharts.llnl.gov/archive.html#energy_archive
10/23/2015
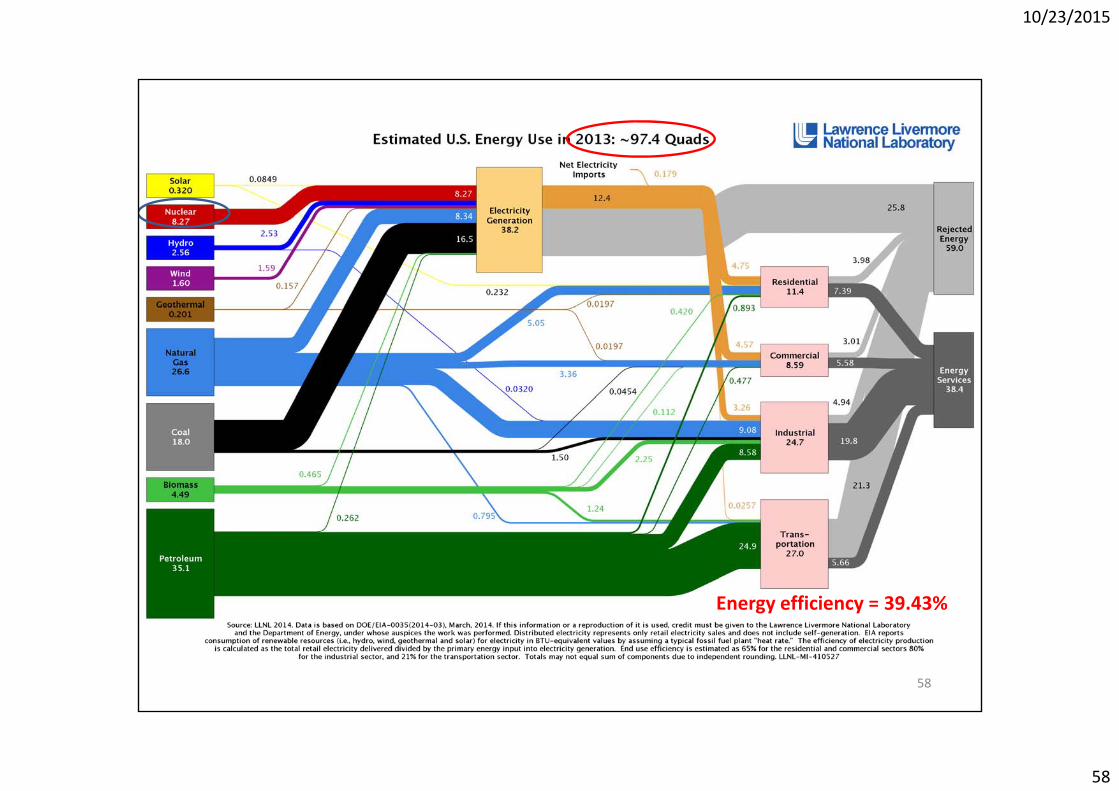
58
Energy efficiency = 39.43%
58

10/23/2015
59
Nuclear Is NOT The Solution, And Perhaps Should Not Be A Part Of The Solution
The Historic Crossover
Should Not Be A Part Of The Solution
Solar and Nuclear Costs — The Historic Crossover: Solar Energy is Now the Better BuyBy John O. Blackburn and Sam Cunningham. July 2010. Prepared for NC WARN: Waste Awareness & Reduction Network, PO Box 61051, Durham, NC 27715‐1051 • 919‐416‐5077, www.ncwarn.org
http://www.ucsusa.org/sites/default/files/legacy/assets/documents/nuclear_power/nuclear‐economics‐fact‐sheet.pdf by Union of Concerned Scientists August 2009 Nuclear Power: A Resurgence We Can’ t Affordhttp://npolicy.org/article_file/New_Nuclear‐The_Economics_Say_No.pdf New Nuclear – The Economics Say No Pan‐Europe Utilities (Citi) by Peter Atherton, Andrew M Simms, Sofia Savvantidou, Stephen B Hunt
59

10/23/2015
60
Nuclear Is NOT The Solution, And Perhaps Sho ld Not Be A Part Of The Sol tion
• Safety record is not very good. To date, there have been around 440 reactors constructed The following 9 have melted down to some degree:
Should Not Be A Part Of The Solution
reactors constructed. The following 9 have melted down to some degree:3 reactors at Fukushima1 reactor at Chernobyl1 reactor at 3-Mile Island1 reactor in Saint-Laurent, France, 19691 reactor at Lucens, Switzerland, 19691 reactor KS 150 in Czech Republic Feb. 22, 19771 reactor NRX Ontario Canada in 19521 reactor NRX Ontario Canada in 1952
• Gap of 15 TW will require to build 15000 nuclear reactors of 1GW each over next 30 years. Potentially dozens of major accidents, nuclear terrorism danger, unsolved and (potentially unsolvable) nuclear waste problem and g , (p y ) pabout 150 trillion USD in CAPEX.
Prof. Mark Jacobson, Stanford University 60

10/23/2015
61
Will There Be More Air Travel and More Demand For Jet Fuel As China and India Develop?For Jet Fuel As China and India Develop?
Jet fuel accounts for 8% of US oil consumption.
61Radius of this circle is about 3000 km.

10/23/2015
62
R = 3000 kmR 3000 kmTotal length of TAR network is about 117000 km.
62

10/23/2015
63
63"Rail map of China" by Howchouhttp://commons.wikimedia.org/wiki/File:Rail_map_of_China.svg#/media/File:Rail_map_of_China.svg

10/23/2015
64
Proven Concept, Technology And l bl lAvailable Capital
• “Just five years after China’s high-speed rail system opened, it is carrying l t i h th th t ’ d tinearly twice as many passengers each month as the country’s domestic
airline industry. With traffic growing 28 percent a year for the last several years, China’s high-speed rail network will handle more passengers by early next year than the 54 million people a month who board domestic y y p pflights in the United States”. (NY Times)
• The Mid-to-Long Term Railway Network Plan adopted in 2004, and updated in 2008, laid out such a railway development plan through 2020, including the connection of all provincial capitals and cities aboveincluding the connection of all provincial capitals and cities above 500,000 people to a rapid rail network of 45,000 km, including about 16,000 km of dedicated high speed rail lines. This program was subsequently accelerated to achieve most of these objectives by 2015.
• Asian Infrastructure Investment Bank established for major infrastructure projects. All of the important Asian and European economic powers have joined this effort.
64http://qz.com/116190/high‐speed‐rail‐is‐at‐the‐foundation‐of‐chinas‐growth‐strategy/http://www.nytimes.com/2013/09/24/business/global/high‐speed‐train‐system‐is‐huge‐success‐for‐china.html?_r=0
10/23/2015
65
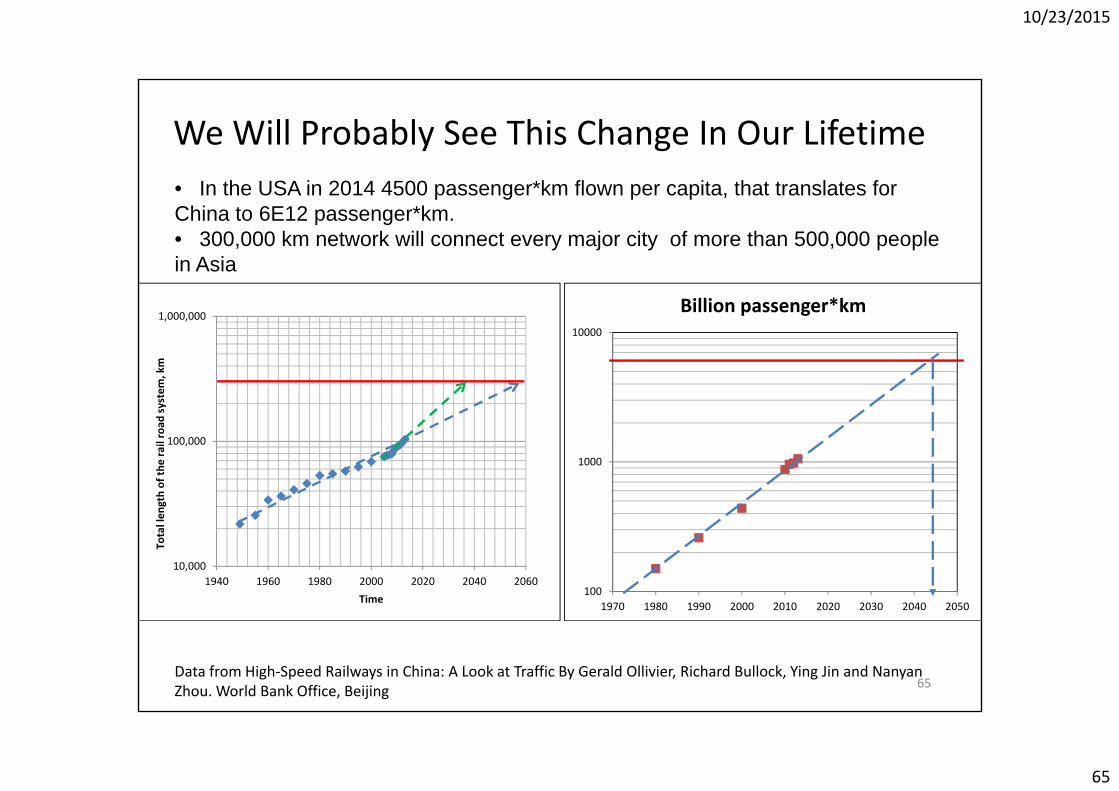
We Will Probably See This Change In Our Lifetime• In the USA in 2014 4500 passenger*km flown per capita, that translates for China to 6E12 passenger*km.• 300,000 km network will connect every major city of more than 500,000 people i A i
1,000,00010000
Billion passenger*km
in Asia
100 000road
system
, km
100,000
al length of the
rail
1000
10,0001940 1960 1980 2000 2020 2040 2060
Tota
Time100
1970 1980 1990 2000 2010 2020 2030 2040 2050
65Data from High‐Speed Railways in China: A Look at Traffic By Gerald Ollivier, Richard Bullock, Ying Jin and NanyanZhou. World Bank Office, Beijing

10/23/2015
66
Energy Efficiency by Transport ModeIn Barrels of Oil or Oil Equivalent Per 10,000 Passenger*Miles
Oil fueled autos, trucks, & airplanes dominated 20th century transport. Electrically powered automobiles and MagLev will dominate 21st century transportpowered automobiles and MagLev will dominate 21st century transport.
66Energy Efficiency and Economics of Maglev Transport By James Powell and Gordon Danbyhttp://www.aertc.org/conference/AEC_Sessions%5CCopy%20of%20Session%201%5CTrack%20E‐%20Innovation%5CIntelligent%20Advanced%20Transport%5C3.%20Dr.%20James%20Powell%5CJames%20Powell%20presentation.pdf

10/23/2015
67
Conclusions
• Our industry during the “unconventional revolution” had the same rate of improvement as high tech industries. Is this rate of innovation sustainable for the petroleum industry?
• Innovations in material sciences challenge the high energy density advantage of our product.
• Competitive technologies are likely to erode the “convenience premium” for oil. Electric cars will be just as convenient as gasoline powered cars. Electric powered trains may be more convenient then airplanes.
• For the first time in history we are in direct competition with industries (transportation and power generation) that used to be our customers.
67

10/23/2015
68
So what do we have to do now?So what do we have to do now? • Production activation index of 20000 USD/STB/D or more is a sign
of great danger to the prosperous existence of our industryof great danger to the prosperous existence of our industry.• We must keep innovating and improving drilling efficiency. We must
continue to focus on recovery efficiency in developed basins. High capital cost projects like Arctic offshore may never be developedcapital cost projects like Arctic offshore may never be developed.
• Innovate, develop new products and materials based on natural gas and petroleum chemistry. W h ld b f l ll t h l f di t ib t d• We should embrace fuel cell technology for distributed power generation.
• We should embrace every type of technology where solar energy t i i h i l b dstorage is in chemical bonds.
• Young petroleum engineers must be trained to be much more adaptable to changing business environment. We should be more like energ engineers rather than j st petrole m engineerslike energy engineers rather than just petroleum engineers.
68