Embed Size (px)
Citation preview

The World in 2050 -- Perspective on Global Economic Competition and the Role of China
John Hawksworth Head of Macroeconomics PricewaterhouseCoopers
Beijing, 16 May 2006

Date16 May 2006Page 2
PricewaterhouseCoopers LLP
Agenda
Methodology
- Growth model and key assumptions
- Market exchange rates vs PPPs
Key results: focus on China and India
Implications for OECD and Chinese companies
Public policy issues
Q&A

Date16 May 2006Page 3
PricewaterhouseCoopers LLP
Study covers the 17 largest economies in the world in 2004 based on GDP at PPPs (World Bank estimates)
G7 plus Spain, Australia and South Korea
E7 economies
- BRICs (Brazil, Russia, India and China)
- Indonesia, Mexico and Turkey
Note: methodology could easily be extended to other countries (though probably not small, very open economies like Ireland)

Date16 May 2006Page 4
PricewaterhouseCoopers LLP
Growth model structure
Each country modelled individually but with linkages via US productivity growth (the global technological frontier)
Cobb-Douglas production function with human capital included
Growth driven by:
- Investment in physical capital
- Working age population growth (UN projections)
- Investment in human capital (rising average education levels)
- Catch-up with US productivity levels (at varying rates: 0.5-1.5% per annum of the TFP gap closed each year)
Real exchange rates vary with relative productivity growth

Date16 May 2006Page 5
PricewaterhouseCoopers LLP
Figure 1: Relative GDP at market exchange rates and PPPs (2004)
0
20
40
60
80
100
120
Source: World Bank
Ind
ex r
elat
ive
to U
S =
10
0
GDP at market exchange rates
GDP at PPPs
China
India
US
Brazil RussiaUK

Date16 May 2006Page 6
PricewaterhouseCoopers LLP
How to compare GDP: Market exchange rates or PPPs?
GDP at PPPs a better indicator of:
- Relative living standards (GDP per capita)
- Volume of outputs or inputs (oil, carbon emissions etc)
GDP at market exchange rates better for assessing current market size for investors/exporters into emerging economies
- but need to allow for real exchange rate changes in longer term projections

Date16 May 2006Page 7
PricewaterhouseCoopers LLP
Projected real exchange rate changes: ratio of MERs to PPPs
0 20 40 60 80 100
India
China
Indonesia
Turkey
Brazil
Russia
Mexico
2005
MERs as % of PPPs

Date16 May 2006Page 8
PricewaterhouseCoopers LLP
Projected real exchange rate changes: ratio of MERs to PPPs
0 20 40 60 80 100
India
China
Indonesia
Turkey
Brazil
Russia
Mexico
2005
2050
MERs as % of PPPs

Date16 May 2006Page 9
PricewaterhouseCoopers LLP
Figure 3: Projected average growth rate of working age population: 2050-50
-1.5%
-1.0%
-0.5%
0.0%
0.5%
1.0%
Source: UN
% c
han
ge p
er a
nnu
m
IndiaUS
UK
China
Brazil
Russia

Date16 May 2006Page 10
PricewaterhouseCoopers LLP
Figure 4: Human capital per worker relative to the US
0
20
40
60
80
100
120
Source: PwC estimates using base data from Barro and Lee (2001)
Ind
ex r
elat
ive
to U
S =
10
0
2050 estimate
2004 estimate
UKRussia
China India
Korea

Date16 May 2006Page 11
PricewaterhouseCoopers LLP
Key model results
GDP growth
Relative size of economies
GDP per capita levels
Sensitivity analysis

Date16 May 2006Page 12
PricewaterhouseCoopers LLP
Figure 6: Real GDP growth in US, Japan and the BRICs
0.0%
1.0%
2.0%
3.0%
4.0%
5.0%
6.0%
7.0%
% r
eal g
row
th
US
China
India
Brazil
Russia
Japan
India
China
Brazil
Russia
US
Japan

Date16 May 2006Page 13
PricewaterhouseCoopers LLP
Projected average real GDP growth: 2005-50
0 2 4 6 8
India
Indonesia
China
Turkey
Brazil
Mexico
Russia
US
UK
Germany
Japan
Domestic currency
% real GDP growth p.a.

Date16 May 2006Page 14
PricewaterhouseCoopers LLP
Projected average real GDP growth: 2005-50
0 2 4 6 8
India
Indonesia
China
Turkey
Brazil
Mexico
Russia
US
UK
Germany
Japan
Domestic currency
US $ terms
% real GDP growth p.a.

Date16 May 2006Page 15
PricewaterhouseCoopers LLP
Figure 7: Relative size of G7 and E7 economies
0
20000
40000
60000
80000
100000
120000
140000
2005 MER 2050 MER 2005 PPP 2050 PPP
$ bi
llio
n (
2004
rea
l va
lues
)
G7 GDP
E7 GDP

Date16 May 2006Page 16
PricewaterhouseCoopers LLP
Relative size of E7 vs G7 economies: 2005, 2025 and 2050
0
20
40
60
80
100
120
140
160
180
200
GDP at MERs GDP at PPPs
2005
2025
2050
Index: G7 GDP = 100

Date16 May 2006Page 17
PricewaterhouseCoopers LLP
China and India vs US GDP in 2050
0
20
40
60
80
100
120
140
160
China at MERs China at PPPs India at MERs India at PPPs
2005
2025
2050
Index: US = 100

Date16 May 2006Page 18
PricewaterhouseCoopers LLP
China and India dominate E7 economies (relative GDP at MERs)
0
20
40
60
80
100
120
2005
2025
2050
Index: US = 100
Date16 May 2006Page 19
PricewaterhouseCoopers LLP
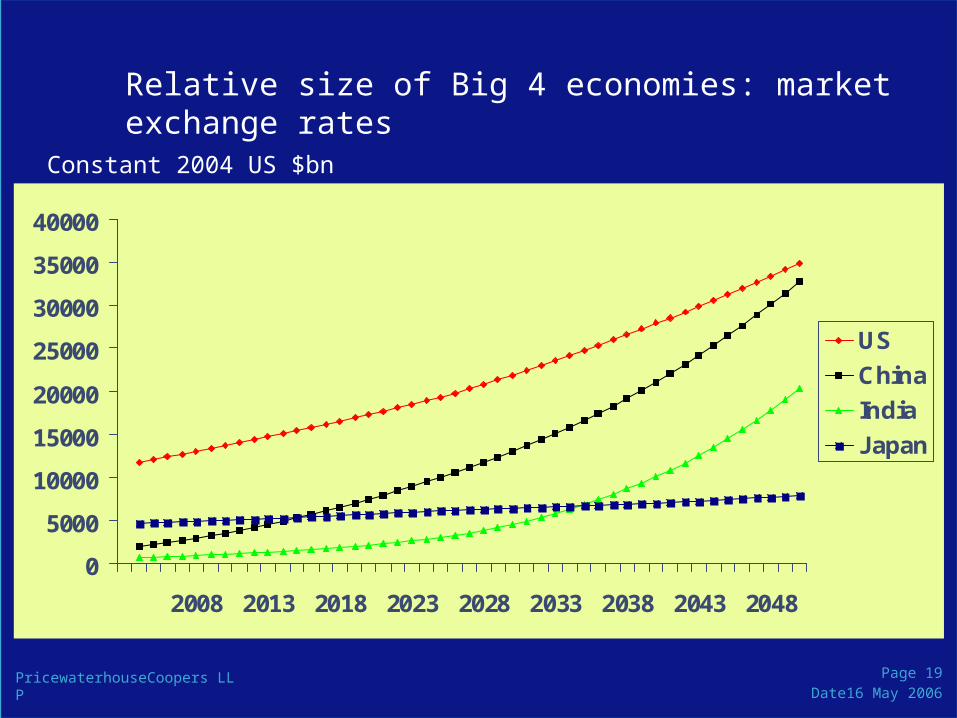
Relative size of Big 4 economies: market exchange rates
0
5000
10000
15000
20000
25000
30000
35000
40000
2008 2013 2018 2023 2028 2033 2038 2043 2048
US
China
India
Japan
Constant 2004 US $bn

Date16 May 2006Page 20
PricewaterhouseCoopers LLP
Relative size of Big 4 economies: PPP exchange rates
0
10000
20000
30000
40000
50000
60000
2006
2009
2012
2015
2018
2021
2024
2027
2030
2033
2036
2039
2042
2045
2048
US
China
India
Japan
Constant 2004 US $bn at PPPs

Date16 May 2006Page 21
PricewaterhouseCoopers LLP
Figure 8: Projected GDP per capita in PPP terms
0
10000
20000
30000
40000
50000
60000
70000
80000
90000
100000
2004
$ p
er
cap
ita a
t P
PP
s
2005
2050
US
UK
Russia
Brazil China
India
Germany
Korea
E7 still well below G7 onincome per capita at PPPs

Date16 May 2006Page 22
PricewaterhouseCoopers LLP
Sensitivity analysis
Results are particularly sensitive to assumptions on:
- investment rates
- education level trends
- catch-up rates for E7 economies
- real exchange rate relationship to productivity (for GDP at MERs)
Perfectly possible that China relative to US could be 30% higher or lower than base case in 2050 – but would not alter the broad direction of change
Model allows effect of alternative assumptions to be explored

Date16 May 2006Page 23
PricewaterhouseCoopers LLP
What might derail growth in China and India?
Macroeconomic instability:
- Overheating in China
- Fiscal deficit in India
Energy, water and transport infrastructure constraints
Over-investment without proper capital allocation mechanisms (c.f. Japan in 1980s/1990s)
Protectionism in key export markets (US/EU)
Political instability
Environmental crises
Date16 May 2006Page 24
PricewaterhouseCoopers LLP
How can the OECD economies compete with China, India and other E7 economies?
Competitive advantage vs comparative advantage
- Some commentators focus on the former -> relative pessimism
- Economists tend to focus on the latter -> relative optimism (though there will be winners and losers)
- recent PwC survey suggest multinational CEOs also mostly positive about opportunities in BRICs

Date16 May 2006Page 25
PricewaterhouseCoopers LLP
Figure 9: Accessing new customers is the key driver for doing business in emerging economies
12
48
82
28
18
35
46
74
35
39
22
50
75
38
48
11
56
76
30
20
0 20 40 60 80 100
Accessing a highlyskilled talent pool
Serving existingcustomers
Accessing newcustomers
Increasing capacity
Reducing costs
%
Brazil
China
IndiaRussia
Ref: Q5. Which of the following business objectives are driving your decision to do business in………………..?
Source: PricewaterhouseCoopers’ 9th Annual Global CEO Survey. All respondents, except Brazil, China, India and Russia (331-674)
China ranks higheston cost reduction
India ranks higheston skilled talent pool

Date16 May 2006Page 26
PricewaterhouseCoopers LLP
Figure 10: Main actions that CEOs are taking/planning to take inemerging economies
11
28
53
22
48
13
17
11
32
52
26
44
28
30
10
40
62
27
54
33
34
32
47
26
35
15
19
12
0 10 20 30 40 50 60 70 80
Making charitable donations/performing other pro-bono work
Developing unique products for this market
Forming alliances with partners
Engaging in mergers and acquisitions
Opening new offices
Offshoring manufacturing activities or supportservices within your own company
Outsourcing manufacturing activities or supportservices to a third party
%
Brazil
China
India
Russi a
Ref: Q6. Which of the following actions is your organization taking or planning to take in………………..?
Source: PricewaterhouseCoopers’ 9th Annual Global CEO Survey. All respondents, except Brazil, China, India and Russia (331-674)
China is toppriority on mostmeasures

Date16 May 2006Page 27
PricewaterhouseCoopers LLP
China and India have different comparative advantages
India has strengths in:
- IT skills and technologies
- low cost English speaking staff for offshoring services
- younger population
China has advantages in:
- low cost manufacturing
- higher average education levels
- higher savings and investment rates
Should create potential for mutually beneficial trade
But: also competing for resources to support growth

Date16 May 2006Page 28
PricewaterhouseCoopers LLP
Relative competitiveness rankings: China vs India
5731Business competitiveness index
5033- Macroeconomics environment sub-index
5256- Public institutions sub-index
5564- Technology sub-index
5049Overall global competitiveness index
IndiaChinaCountry rankings (out of 117)
Source: World Economic Forum Global Competitiveness Report 2005

Date16 May 2006Page 29
PricewaterhouseCoopers LLP
Potential impact on OECD companies over next 10 years
Winners
Retailers
Global brand owners
Business and financial services
Creative industries
Healthcare and education providers
Niche high value added manufacturers
Losers
Mass market manufacturers (both low tech and increasingly hi-tech)
Financial services companies not able to penetrate E7 markets who become vulnerable at home to E7 entrants
Companies that over-commit to E7 without right local partners and business strategies

Date16 May 2006Page 30
PricewaterhouseCoopers LLP
Potential longer term challenges for Chinese companies
Gradual loss of cost advantages to other emerging markets
Rising input costs (energy, metals etc)
Competition from OECD companies in domestic market as effects of WTO membership continue to feed through
Overseas investments: choosing the right targets and not overpaying for them (c.f. Japan)
Moving from technological imitation to innovation
Developing domestic capital markets
Adapting to an ageing labour force
Date16 May 2006Page 31
PricewaterhouseCoopers LLP
Public policy issues for China (and other countries)
Danger of protectionist response from US/Europe
Capital market development and banking sector reform
Rural-urban income inequalities (land reform?)
Energy and water supply
Education
Environmental issues
- Domestic: air and water quality, soil erosion, deforestation etc
- Global: challenge of climate change

Date16 May 2006Page 32
PricewaterhouseCoopers LLP
Rise of China and India will push up C02 emissions unless offsetting measures taken to reduce energy/carbon intensity
0
5
10
15
20
25
2005 2025 2050
A2 world (low energyefficiency)
A1 world (moderateenergy efficiency)
B1 world (high energyefficiency)
Source: IPCC scenarios (2000), preliminary PwC model estimates
GtC

Date16 May 2006Page 33
PricewaterhouseCoopers LLP
Summary
The E7 are coming!
- US, China and India to be three major economies by 2050
- India could actually grow faster than China beyond c.2015
- Brazil, Russia, Indonesia, Mexico and Turkey smaller but also potentially significant
Potential win-win for the UK and other OECD economies if they can remain open, flexible and focused on human capital
China and India potential partners as well as rivals
Major public policy challenges … not least climate change