Embed Size (px)
Citation preview
Services Trade Protectionand Economic Isolation
Ingo Borchert1, Batshur Gootiiz2, Arti Grover Goswami2 and Aaditya Mattoo21University of Sussex, Brighton, UK and 2World Bank, Washington, DC, USA
1. INTRODUCTION
A country’s ability to benefit from flows of trade, tourism and knowledge depends on how
well connected it is, internally and internationally. Poor connectivity, in turn, is conven-
tionally blamed on difficult geography and low income. But economic isolation could also
result from policy choices in key ‘linking’ services such as air transportation and telecommu-
nications. A new services policy database reveals that many countries restrict trade and invest-
ment in these sectors. We show that these policies lead to more concentrated market
structures and more limited access to services, even after taking into account the constraining
influences of geography and low incomes, and the possibility that policies are endogenous.
To motivate the analysis, consider the example of three countries: Laos, Nepal and Zam-
bia. Each suffers the serious disadvantage of landlockedness, which is traditionally regarded
as the main reason for their economic isolation. Less attention has been focused on a self-in-
flicted handicap: their restrictive policies. Each country has at least until recently stifled com-
petition in telecommunications – primarily by restricting the conditions for new entry – and
in air transport – primarily by negotiating restrictive bilateral air service agreements (BASAs)
on key routes. In terms of access and quality of services, each of the three countries fairs
poorly. In Nepal, there are 2.5 telephone mainlines per 100 people, half the regional average
for South Asia; in Laos 1.5, one-seventh the regional average for East Asia; and in Zambia
0.75, one-quarter of the regional average for sub-Saharan Africa. In mobile telephony, the
gaps are slightly less stark but still significant; for example, Nepal had a mobile teledensity
(subscriptions per 100 people) of 12, which is about one-third of the South Asian regional
average. In air passenger transportation, Nepal Airlines, which has seen its fleet shrunk to two
Boeing 757 and four twin otters, occupies transport capacity agreed in BASAs that it is inca-
pable of exploiting. For instance, the number of seats is limited to 6,000 per week to the key
hub of Delhi, but Nepal Airlines uses only 1,300 seats of its allocated quota.
To what extent can concentrated markets and poor performance be attributed to poor pol-
icy? Or are they primarily attributable to other disadvantages? It is not easy to provide a con-
vincing answer to these questions because the policy information we have collected is only
for a single time period, making it difficult to control for all the possible sources of heteroge-
The authors would like to thank Nora Dihel, Ana M. Fernandes, Christopher Findlay, John Gibson,Hiau-Looi Kee, Charles Kunaka, Daniel Lederman, C�a�glar €Ozden, Gael Raballand, Martin Ravallion andBarry Reilly for helpful comments and discussions. This paper is part of a World Bank research projecton trade in services supported in part by the governments of Norway, Sweden and the United Kingdomthrough the Multidonor Trust Fund for Trade and Development, and by the UK Department for Interna-tional Development (DFID). The findings, interpretations and conclusions expressed in this paper areentirely those of the authors. They do not necessarily represent the views of the International Bank forReconstruction and Development/World Bank and its affiliated organisations, or those of the executivedirectors of the World Bank or the governments they represent, or any of the aforementioned individualsor institutions.
© 2015 The World Bank The World Economy© 2015 John Wiley & Sons Ltd
1
The World Economy (2015)doi: 10.1111/twec.12327
The World Economy
neous performance across countries. Nevertheless, we are able to control for the most likely
determinants of poor performance: the adverse influences of geography and low incomes. We
show that poor policies lead to more concentrated market structures and to more limited
access to services than these countries would otherwise have. In addition, we recognise that
the commonly made assumption that trade policy is exogenous may not be entirely plausible,
and therefore also gauge robustness by employing an instrumental variable (IV) strategy. Even
though there are clear limitations to an IV exercise in a cross-country context, it leads to
broadly similar results.
Previous studies have looked at possible reasons for the transport sector’s poor perfor-
mance. Limao and Venables (2001) highlight the effect of infrastructure on trade costs and
trade flows but do not consider policy choices. Other studies recognise the role of policy, par-
ticularly in trucking. Raballand and Macchi (2009) find that market regulation is a critical
determinant of the price of trucking services, while market access restrictions and freight shar-
ing schemes hinder competitiveness and raise trade costs especially for landlocked countries
in Africa. Hallaert et al. (2011) do not find domestic transportation infrastructure to be an
important determinant of countries’ trade performance, pointing instead to the importance of
regulatory issues in the transport sector.1 The present study builds on this earlier work but is
broader in scope, both in terms of the range of countries and types of sectors and policies
covered. While previous studies acknowledge the importance of market structure, this paper
adds to that literature by illustrating how specific policies contribute to a concentrated market
structure. The dominant trend in trade facilitation projects under new ‘aid for trade’ initiatives
is increased investment in infrastructure, but this paper shows how such investments alone
may yield a low return as long as policies that restrict competition among service providers
remain in place.
2. POLICY DATA AND PATTERNS
A range of services link a country to the rest of the world. We focus on air transportation
and telecommunications, primarily because they are vital for connectivity but also because
countries’ policy choices could have a larger influence on performance in these sectors than
in other sectors such as road transportation, in which exogenous geographic factors play a
stronger role. In addition, better policy data are available for these services than for other rel-
evant services sectors such as trucking.
We focus on policies that affect market structure, particularly by influencing foreign entry.
The policy data come from the new World Bank Services Trade Restrictions Database, which
offers for the first time detailed information on actual or applied policies affecting foreign
presence in a number of services sectors (Borchert et al., 2014). In the telecommunications
sector, relevant policies include limits on the number of licences issued, restrictions on the
extent of foreign ownership in firms, nationality requirement for board of directors, restric-
tions on establishing an international gateway (IG) and the use of voice-over-IP (VOIP) tech-
nology. In the air transport sector, relevant policies include not just those affecting the ability
of foreign airlines to establish a local commercial presence, but also the BASAs that govern
international transport. To capture the restrictiveness of BASAs, we draw on the WTO’s
1 Raballand et al. (2008), Lall et al. (2009) and Arvis et al. (2010) also focus on road transport inAfrica.
© 2015 The World Bank The World Economy© 2015 John Wiley & Sons Ltd
2 I. BORCHERT ET AL.

‘Quantitative Air Services Agreements Review’ (QUASAR) database which represents the
most comprehensive source currently available on bilateral air services agreements, covering
over 2,000 such agreements.
a. A Qualitative Picture of Policy in Selected Countries
To provide a country face to the subsequent empirical analysis, consider examples of
policies from the telecommunications sector in three landlocked countries: Nepal, Laos and
Zambia.2 In telecommunications, as much of the world is being transformed by the inter-
play between competition and new technologies, each of these countries has stifled compe-
tition in its own unique way. Nepal granted exclusive licences in the fixed-line segment
until 2009 to United Telecommunications Limited (with majority Indian Government own-
ership) and in mobile to Spice Telecom (with majority Kazakh ownership), effectively cre-
ating duopolies in each segment between these firms and the state-owned firm. Zambia set
a prohibitively high licence fee ($12 million) for establishing an independent international
gateway market (IGW), in order to give the incumbent state-owned operator, Zamtel,
a de facto monopoly in the international segment.3 Monopoly profits enabled Zamtel to
inhibit competition in other segments of the market through cross-subsidisation and did not
lead to a significant expansion of the rural network. In Laos, new entry is possible only
through direct negotiation with the government, and the government has in all cases
reserved its right to be a partial owner of the new undertakings (Millicom, Shinawatra,
Sky Communications and Veittel). In each of these countries, the regulatory authority is
not really independent and is widely reported to favour state-owned incumbent operators.
For example, since the regulator in Laos was unable or unwilling to induce the incumbent
firm to share its fibre-optic ‘backbone’ cable with rival firms, one of them has chosen to
create a parallel fibre-optic backbone at significant cost. Similar examples of policies
inhibiting competition and availability of services can be found in the air transport sector
of these three countries, primarily by maintaining restrictive BASAs. Schlumberger (2007)
has shown how both Zambia and South Africa have in the past denied fifth freedom rights
to other countries.4
b. Quantification of Survey Policy Information
It is hard to measure barriers to services trade.5 The most transparent approach would be
to include each policy variable separately as an explanatory variable, either as directly mea-
sured (e.g. the number of licences permitted) or as a binary indicator variable (e.g. whether
voice over internet protocol is allowed). The scope for such a strategy is, however,
constrained by the problem of collinearity between policy variables and limited degrees of
2 For an in-depth study of services sectors in Zambia, see Mattoo and Payton (2007).3 This licence fee has recently been reduced.4 Even though Zambia no longer has a national airline, it has denied Fifth Freedom rights to Ethiopia tofly the Addis Ababa-Lusaka-Johannesburg route, to Nigeria on the Lagos-Lusaka-Johannesburg route,and to Kenya on the Nairobi-Lusaka-Harare route.5 Non-tariff barriers, which are pervasive in services, have also proved hard to measure in goods trade.Existing methods in goods rely on inferring restrictiveness on the basis of the impact on trade flows(Kee et al., 2009), but the absence of disaggregated services trade data especially for developing coun-tries rules out such techniques.
© 2015 The World Bank The World Economy© 2015 John Wiley & Sons Ltd
SERVICES PROTECTION AND ISOLATION 3
freedom. Therefore, we use a combination of methods. To the extent feasible, we assess the
impact of policy variables individually, but we also construct a summary measure of open-
ness in specific sectors.6 The latter approach conserves degrees of freedom in estimation, and
in addition enables us to address concerns about the possible endogeneity of policy through
an instrumental variable strategy.
Existing methods of constructing openness measures range from simple counts of
restrictive policies to more complex weighted averages, where weights reflect prior assess-
ments of the relatively restrictiveness of specific policy barriers (Francois and Hoekman,
2010). There is, however, a potentially serious problem with methods that treat all restric-
tions (entry, operational, regulatory) as additive. For instance, if foreign suppliers are not
allowed to enter in the first place, then the restrictions on operations and regulatory envi-
ronment simply do not matter. Similarly, a foreign equity limit of 49 per cent already pre-
cludes foreign corporate control and so adding to it a further (frequently encountered)
requirement that the majority of board of directors be nationals would amount to double
counting.
The measure of openness we construct is relatively transparent and avoids the pitfalls of
earlier additive approaches. Essentially, we assess policy regimes in their entirety and assign
them into five broad categories: completely open, that is, no restrictions at all; completely
closed, that is, no entry allowed at all; virtually open but with minor restrictions; virtually
closed but with very limited opportunities to enter and operate; and a final residual ‘middle’
category of regimes which allow entry and operations but impose restrictions that are nei-
ther trivial nor virtually prohibitive. We either represent each of these regimes by an indica-
tor variable or, when required for instrumental variables estimation, the regimes are
assigned a services trade restrictiveness index (STRI) on an openness scale from 0 to 1
with intervals of 0.25. When two or more measures are in place, the regime assignment
reflects the overall restrictiveness of the measures.7 More details about the methodology can
be found in Borchert et al. (2014).
For cross-border trade in air transport, we use the air liberalisation index (ALI) of the
QUASAR database created by the WTO Secretariat. The ALI ranges from 0 to 50 with
zero being the most restrictive. The ALI is calculated by selecting the provisions of
BASAs deemed to be particularly important for market access and assigning a score
between zero (most restrictive) and eight (least restrictive) to each restriction. These scores
are then averaged in consultation with a group of experts, using weights intended to reflect
the relative importance of each restriction. The scores attributed can also be altered to take
into account the specific situation of a country pair, in particular by giving more weight
to: fifth freedom traffic rights (e.g. for geographically remote countries such as Australia
and New Zealand); withholding, in particular, community of interest and principal place of
6 Notice that when the goal is to demonstrate how policies matter for outcome variables of interest, aswe endeavour in this paper, the restrictiveness of certain measures cannot be quantified econometricallyin a first step by estimating their effect on some outcome variable. In this case, the restrictiveness scoreneeds to be exogenous and must not be derived in a way that involves the quantity to be explained.7 Measures covered can be divided in two tiers. The first-tier measures include those that affect marketentry decisions most significantly, such as the limit on foreign ownership and the number of licencesallowed. The second-tier measures are those that affect operations of service providers, such as the boardof directors and repatriation of earnings etc. If the first-tier measures are prohibitive, the second-tiermeasures are not considered. But if the first-tier measures are not prohibitive, then the second-tier mea-sures are also considered to determine the overall restrictiveness.
© 2015 The World Bank The World Economy© 2015 John Wiley & Sons Ltd
4 I. BORCHERT ET AL.
business; and multiple designation. For comparability, the scale of ALI is converted to the
STRI scale.8
c. Patterns of Policy and Performance
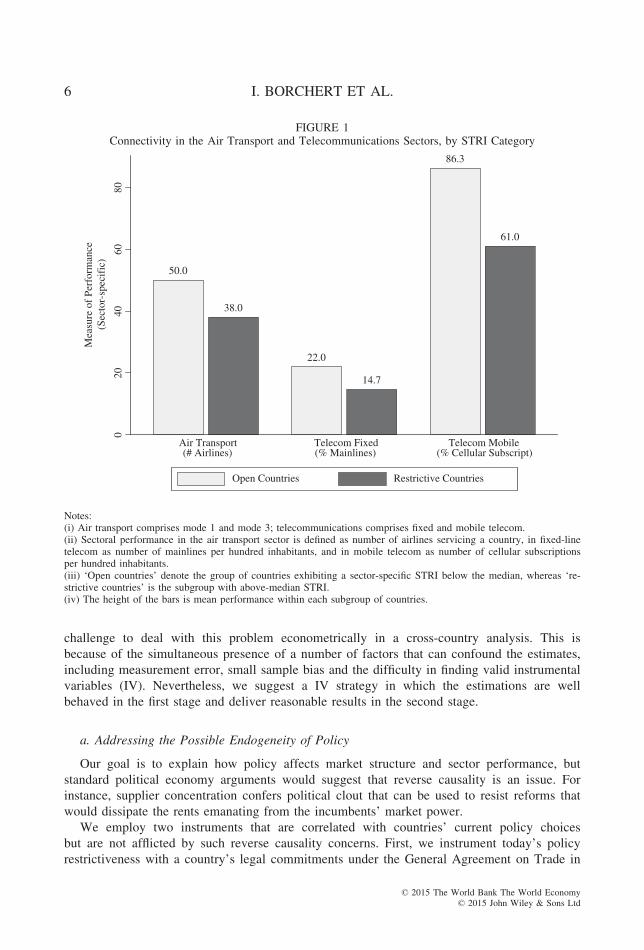
Before embarking on the econometric analysis, it is useful to compare sector performance
across groups of countries which differ in the level of policy restrictiveness. We take as indi-
cators of performance in the air transport sector the number of airlines servicing a country, in
fixed-line telecommunication the number of mainlines per hundred inhabitants, and in mobile
telecommunication the number of cellular subscriptions per hundred inhabitants. In Figure 1,
‘open countries’ denote the group of countries exhibiting a sector-specific STRI below the
median, whereas ‘restrictive countries’ is the subgroup with above-median STRI. The height
of the bars is mean performance within each subgroup of countries. The underlying differ-
ences in performance are in fact substantial; in each case, the performance indicator for the
open countries is about one-third higher than the indicator for restrictive countries. Annex 1
(published online as supplementary material) provides more detail on the patterns of policy at
the individual country level. More information about particular applied policy measures can
also be obtained from the Services Trade Restrictions Database website at http://iresearch.-
worldbank.org/servicetrade/home.htm. The relationship depicted in Figure 1 is likely to reflect
additional factors other than policy, but this distinctive pattern does suggest that policies
affect access to services. The next section therefore investigates the impact of policies
econometrically.
3. MARKET STRUCTURE AND PERFORMANCE – AN ECONOMETRIC ANALYSIS
We now investigate whether policy restrictions matter for market structure and perfor-
mance in the telecommunication and transportation sector, respectively. The effects of ser-
vices policy measures are not well studied especially in developing countries due to the
paucity of data on policy restrictiveness.9
The long-standing tradition in the trade literature, especially relating to services, is to treat
trade policy as exogenous and to study its effect on outcomes of interest (see e.g. the survey
by Francois and Hoekman, 2010). One part of our analysis follows this standard approach.
Even though we recognise that policy choices may be endogenously determined, it is a major
8 In Figure 1 presenting the overall STRI in air transport, the STRI for cross-border trade (BASAs) iscombined with the STRI for commercial presence using a weight of 0.7 and 0.3, respectively, becausecross-border supply is the primary mode of supply for air transport.9 Among the few studies in this area is Fink et al. (2003) who analyse the impact of policy reform inbasic telecommunications across 86 developing countries and find that both privatisation and competitionlead to significant improvements in performance. A study by the OECD (2009) is closest to ours, findingthat countries’ restrictiveness in telecommunications, as measured by a similar index, significantlyimpedes inward foreign direct investment (FDI) as well as domestic sales by foreign affiliates (FATS).Some studies provide index-type descriptive evidence on regulatory barriers in the telecom sector but donot proceed to a quantitative impact analysis, for example Holmes and Hardin (2000) on APEC coun-tries, Koyama and Golup (2006) on OECD and 13 non-OECD countries, Marouani and Munro (2009)on Egypt, Jordan and Morocco, and Golub (2009) on 73 developing and developed countries across theglobe. The latter focuses on a narrower definition of restrictiveness (only barriers to FDI) but demon-strates how FDI per capita decreases as the FDI restrictions index increases.
© 2015 The World Bank The World Economy© 2015 John Wiley & Sons Ltd
SERVICES PROTECTION AND ISOLATION 5
challenge to deal with this problem econometrically in a cross-country analysis. This is
because of the simultaneous presence of a number of factors that can confound the estimates,
including measurement error, small sample bias and the difficulty in finding valid instrumental
variables (IV). Nevertheless, we suggest a IV strategy in which the estimations are well
behaved in the first stage and deliver reasonable results in the second stage.
a. Addressing the Possible Endogeneity of Policy
Our goal is to explain how policy affects market structure and sector performance, but
standard political economy arguments would suggest that reverse causality is an issue. For
instance, supplier concentration confers political clout that can be used to resist reforms that
would dissipate the rents emanating from the incumbents’ market power.
We employ two instruments that are correlated with countries’ current policy choices
but are not afflicted by such reverse causality concerns. First, we instrument today’s policy
restrictiveness with a country’s legal commitments under the General Agreement on Trade in
50.0
38.0
22.0
14.7
86.3
61.0
020
4060
80
Mea
sure
of
Perf
orm
ance
(Sec
tor-
spec
ific
)
Air Transport(# Airlines)
Telecom Fixed(% Mainlines)
Telecom Mobile(% Cellular Subscript)
Open Countries Restrictive Countries
FIGURE 1Connectivity in the Air Transport and Telecommunications Sectors, by STRI Category
Notes:(i) Air transport comprises mode 1 and mode 3; telecommunications comprises fixed and mobile telecom.(ii) Sectoral performance in the air transport sector is defined as number of airlines servicing a country, in fixed-linetelecom as number of mainlines per hundred inhabitants, and in mobile telecom as number of cellular subscriptionsper hundred inhabitants.(iii) ‘Open countries’ denote the group of countries exhibiting a sector-specific STRI below the median, whereas ‘re-strictive countries’ is the subgroup with above-median STRI.(iv) The height of the bars is mean performance within each subgroup of countries.
© 2015 The World Bank The World Economy© 2015 John Wiley & Sons Ltd
6 I. BORCHERT ET AL.
Services (GATS) made either in 1995 at the conclusion of the Uruguay Round or in 1997 at
the conclusion of the negotiations on basic telecommunications. These commitments vary
across services subsectors and countries and predate applied policies captured in the STRI by
more than a decade. The policy restrictiveness of GATS commitments has been quantified by
Borchert et al. (2011) using the same methodology as that used to derive the STRI scores.
Thus, even though policies may have evolved, GATS commitment scores provide a proxy for
policy choices that originate from within the same country, yet the variable is predetermined
with respect to today’s political economy forces and sector performance. One disadvantage of
this instrument is that ten countries in our sample did not make commitments under the GATS,
reducing the number of available observations down to 93 for this instrument.10 While the
fixed-line and mobile telecommunication sectors can be straightforwardly matched to GATS
commitments, air transportation services have always been outside the realm of the WTO. For
the latter, we therefore use an average of commitments made in the transportation sector (con-
sisting of maritime shipping, maritime auxiliary services, road transport and railway freight).
A second strategy for finding an instrument exploits the similarity of institutions across coun-
tries, in particular, is the extent to which they restrain rent-seeking.11 Specifically, the inclina-
tion of a government to favour vested interests is constrained by the extent to which it will be
held accountable for its decisions. Thus, political institutions that shape governance and the rule
of law appear to matter when policymakers decide on the level of openness.12 We use this
insight to instrument for a given country’s policy restrictiveness with the STRI score of another
country that is most similar in terms of institutional setup and stage of development. Yet the
matching country’s policymakers are insulated from any lobbying efforts that might exact an
influence on the STRI of the country for which we are seeking an instrument. We call the result-
ing variable a ‘nearest neighbour STRI’ which, in contrast to the GATS commitments variable,
can be constructed for all 103 countries in the sample (cf. Annex Table A.2.1). The approach is
implemented using the matching procedure incorporated in the Abadie and Imbens (2002) near-
est neighbour matching estimator. We match on per capita income as well as political institu-
tions such as the Polity IV Project’s political regime indicator, the Economist Intelligence
Unit’s democracy indicator and the Heritage Foundation’s Index of Economic Freedom.13
10 A list of those countries and further details are provided in Annex 2.11 Dihel and Shepherd (2007) show how policy barriers inflate firms’ price-cost margins. For commer-cial presence in fixed-line telecom, these estimates mostly range between 50 and 130 per cent, while thetax equivalents for the mobile segment in mode 3 are mostly in the single-digit range.12 Gasmi et al. (2009) find that in developing countries, the quality of the political process has a favour-able impact on performance in the telecom industry, though their measure of ‘accountability’ capturesinstitutions ranging from corruption to currency risk and is thus not directly comparable to our notion ofthis term. Gual and Trillas’s (2006, p. 263) search for determinants of telecom policy is inconclusive;they find that entry barriers are mainly a function of the inherited legal system, while the other institu-tional variables are insignificant. In addition, the size of the incumbent telecom firm, supposedly reflect-ing its political clout, is positively associated with the decision to create an independent regulator, a factthe authors themselves call ‘surprising’.13 The Polity IV Project’s political regime indicator locates countries along the range of being ‘stronglydemocratic’ to ‘strongly autocratic’ and summarises the opportunities available to citizens to expresstheir preferences over alternative policies and leaders, as well as the existence of institutionalized con-straints on the exercise of power by the executive branch. The Economist Intelligence Unit’s democracyindex is based on five categories: electoral process and pluralism; civil liberties; the functioning of gov-ernment; political participation; and political culture. The Heritage Foundation’s score measures fourbroad categories: rule of law, limited government, regulatory efficiency, and open markets.
© 2015 The World Bank The World Economy© 2015 John Wiley & Sons Ltd
SERVICES PROTECTION AND ISOLATION 7
To the extent that instrument validity can be tested for, both variables perform very well.
The first-stage coefficients are always highly significant and correctly signed. Crucially, even
though using GATS commitments comes at a loss of observations, employing both instru-
ments allows an overidentifying restrictions test, which is comfortably passed across all
estimations.
b. Telecommunications
We estimate a non-structural linear model for each outcome variable of interest since there
is no established unified estimation framework for such diverse variables as market structure
and connectivity (in both telecommunications and transport sectors). In each specification, we
consider a core set of covariates as fundamental determinants of market structure and connec-
tivity, which reflect a country’s attractiveness to investors in telecommunications and trans-
port services sectors. These variables include GDP, GDP per capita, the percentage of urban
population and population density. We also include a dummy variable for landlocked and for
sub-Saharan African countries, respectively, to account for geography and to ensure that
results regarding policy choices are not driven solely by the Africa region. All these determi-
nants are closely related to gravity model variables that are known to affect goods trade
flows. In addition, the distribution and ‘lumpiness’ of demand, as proxied by the two popula-
tion variables, is important in services sectors because the fixed (often sunk) costs of sizable
investments in both telecommunications and transport must be covered by sufficiently high
(local) demand.
We start by looking at market structure in telecommunications, using data on the Herfind-
ahl index (HHI) of market concentration in the fixed-line and mobile segment.14 The model
including individual policy measures or the restrictiveness index (STRI) to be estimated is
given by
HHIi ¼ /0 þ /1Policyi þ /2Fundamentalsi þ /3Geographyi þ ei;
in which the vector of geographic controls includes a dummy for Africa and for landlocked-
ness, and fundamental determinants include GDP, income per capita, the share of urban popu-
lation and population density.15 We are interested in the conditional effect of policy variables.
Results are displayed in Table 1. Policy variables are first treated as exogenous in the col-
umns labelled ‘OLS.’ In the columns labelled ‘IV’, we instrument for the STRI variable as
discussed in the previous section. Before summarising a country’s policies in a single index
(see Section 2b on quantification), we explore directly the effects of individual elements of
policy. The relatively small sample size does not allow us to identify separately the effects
of the entire range of policy measures. We therefore focus on four aspects of the regulatory
regime, which were identified as salient in discussions with industry stakeholders and
14 We compute the HHI based on TeleGeography’s GlobalComms database as the sum of squared mar-ket shares of all firms in a market. A taxonomy commonly used by competition authorities would call amarket with HHI < 1,000 ‘unconcentrated’, 1,000 ≤ HHI < 1,800 ‘moderately concentrated’, and withHHI ≥ 1,800 ‘concentrated’. In the latter case, a market is usually no longer assumed to be competitive.A value of 10,000 would indicate a monopoly.15 The specification including GDP and GDP per capita follows from our interest in controlling fornotions of market size and stage of development. The marginal effects of GDP and population per secould, however, be easily computed from the two coefficient estimates in Table 1.
© 2015 The World Bank The World Economy© 2015 John Wiley & Sons Ltd
8 I. BORCHERT ET AL.
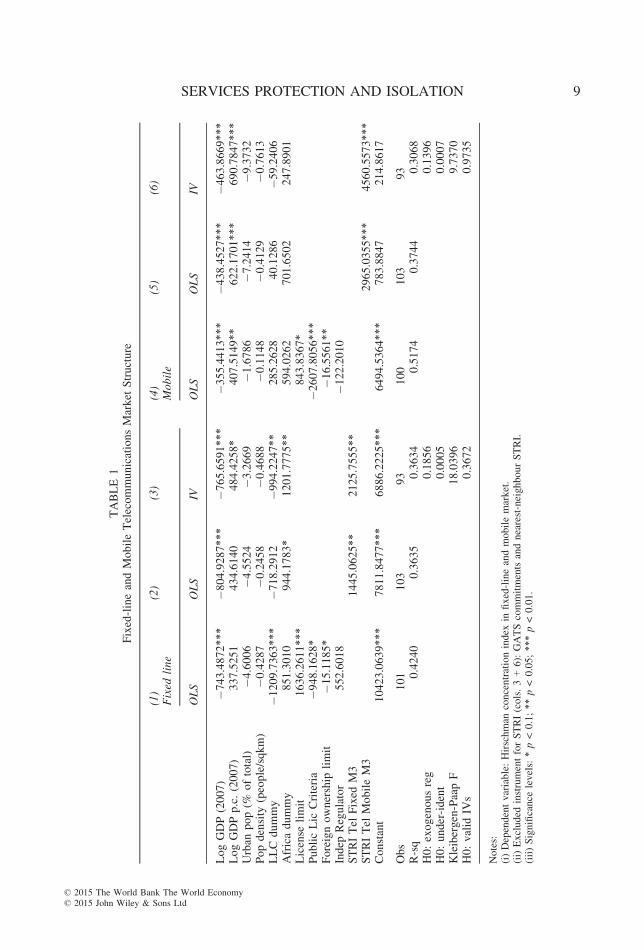
TABLE1
Fixed-lineandMobileTelecommunicationsMarket
Structure
(1)
(2)
(3)
(4)
(5)
(6)
Fixed
line
Mobile
OLS
OLS
IVOLS
OLS
IV
LogGDP(2007)
�743.4872**
*�8
04.9287**
*�7
65.6591**
*�3
55.4413**
*�4
38.4527**
*�4
63.8669**
*LogGDPp.c.(2007)
337.5251
434.6140
484.4258*
407.5149**
622.1701**
*690.7847**
*Urban
pop(%
oftotal)
�4.6006
�4.5524
�3.2669
�1.6786
�7.2414
�9.3732
Popdensity
(people/sqkm)
�0.4287
�0.2458
�0.4688
�0.1148
�0.4129
�0.7613
LLCdummy
�1209.7363**
*�7
18.2912
�994.2247**
285.2628
40.1286
�59.2406
Africadummy
851.3010
944.1783*
1201.7775**
594.0262
701.6502
247.8901
License
limit
1636.2611**
*843.8367*
PublicLic
Criteria
�948.1628*
�2607.8056**
*Foreignownership
limit
�15.1185*
�16.5561**
Indep
Regulator
552.6018
�122.2010
STRITel
Fixed
M3
1445.0625**
2125.7555**
STRITel
MobileM3
2965.0355**
*4560.5573**
*Constant
10423.0639**
*7811.8477**
*6886.2225**
*6494.5364**
*783.8847
214.8617
Obs
101
103
93
100
103
93
R-sq
0.4240
0.3635
0.3634
0.5174
0.3744
0.3068
H0:exogenousreg
0.1856
0.1396
H0:under-ident
0.0005
0.0007
Kleibergen-PaapF
18.0396
9.7370
H0:valid
IVs
0.3672
0.9735
Notes:
(i)Dependentvariable:Hirschman
concentrationindex
infixed-lineandmobilemarket.
(ii)Excluded
instrumentforSTRI(cols.3+6):GATScommitmentsandnearest-neighbourSTRI.
(iii)Significance
levels:*p<0.1;**
p<0.05;**
*p<0.01.
© 2015 The World Bank The World Economy© 2015 John Wiley & Sons Ltd
SERVICES PROTECTION AND ISOLATION 9
regulators and which relate to whether: (i) there is a limit on the number of licences awarded;
(ii) licencing criteria are publicly available; (iii) there is a limit on the equity share foreign
investors are permitted to hold; and (iv) a regulatory authority exists that is independent of
the sector ministry.
The main result is a significant and quantitatively important effect of services policy
restrictiveness (columns 2 and 5), suggesting that – conditional on relevant country character-
istics – less open countries on average have a more concentrated market structure. The policy
effect remains strong and significant even after controlling for African and landlocked
countries.16 Moreover, the results remain fully robust when we account for the endogeneity of
policy choices (columns 3 and 6).17 If anything, the unbiased impact of restrictive policies on
market concentration seems to be even larger in magnitude.18
In terms of individual policies, the existence of a licence limit has a strong effect on fixed-
line operators and results in an average increase in market concentration by 1,636 index
points. Transparency of the licencing process reduces concentration, and the same is true of
more liberal foreign ownership rules. Overall, when all these (and other) policies are encapsu-
lated in a single index, a more restrictive policy stance – reflected in a higher STRI score – is
associated with significantly higher market concentration. The STRI coefficient in column 2
implies that a change in the index score by 25 points (which corresponds to one increment)
would on average be associated with a market that is less concentrated by about 361 HHI
points. The IV estimate in column 3 would raise this effect to about 531 HHI points. Thus,
the impact is sizable. In terms of scoring restrictiveness, the presence of a quota-like limit on
licences would ceteris paribus change a country’s STRI by 50 points, which corresponds to a
higher market concentration by 1,063 index points according to the column 3 coefficient; this
is somewhat lower than the effect inferred from model (1) but within the same ballpark, con-
sidering that the STRI is a composite index.
Similar findings emerge from the mobile telecommunications market, except that the quan-
titative impact of policy restriction tends to be higher (models 5 and 6). Transparency of
licencing criteria turns out to be more important than licence limits. This result is not surpris-
ing since the availability of radio spectrum imposes in principle exogenous limits on the num-
ber of mobile providers, and telecommunication authorities have often used discretion rather
than explicit licence limits to set licencing conditions.
In both market segments, the IV estimations with two instruments are based on slightly
fewer observations dictated by data availability. However, this loss of observations is
16 We always present robust standard errors which, in addition, include a correction for small samplesize. The findings are therefore designed to provide a conservative lower bound, in spite of the largerstandard errors associated with two-stage IV estimation.17 The IV estimation’s first-stage regression results are presented in Annex 2.2. The coefficient on theexcluded instruments is highly significant throughout and carries the expected sign. Shea’s (1997) partialR2 with respect to both instruments ranges between 28 and 35 per cent in telecommunications, and 14per cent in air transport. We are therefore confident to have strong and relevant instruments.18 A larger coefficient estimate under IV would be counterintuitive if one thought that the least squaresanalysis suffered from an upward bias due to reverse causality. However, this reasoning rests on asymp-totic behaviour of the estimators, whereas in small samples such as ours (about 100 observations) thedirection of bias is indeterminate. In addition, measurement error would induce an attenuation bias inthe OLS estimates, an effect that may dominate here. The phenomenon of OLS and IV coefficientsdiverging in an unexpected way has been a persistent feature in the literature on returns to education/schooling; see Card (2001) for an in-depth treatment of potential explanations.
© 2015 The World Bank The World Economy© 2015 John Wiley & Sons Ltd
10 I. BORCHERT ET AL.
outweighed by the possibility of performing a test of overidentifying restrictions. The last
line of regression statistics in columns 3 and 6, respectively, reports the p-value associated
with Hansen’s J statistic. The joint null of the test is that the instruments are valid instru-
ments, that is uncorrelated with the error term, and that excluded instruments are correctly
excluded from the estimated equation. A rejection would cast doubt on the validity of the
instruments; however, the null cannot be rejected in any of the models (here or there-
after).
The effect of restrictive telecom policies on the sector’s market structure is robust to
other measures of market structure as well. In Annex Table A.3.1, we present results on
how restrictive policies affect the number of telecom operators active in a country, esti-
mated using a non-linear count data model. This approach yields qualitatively the same
results. Likewise, more restrictive policies are also associated with a significantly higher
market share of the largest provider in a given country, both in the fixed-line and the
mobile market. Apart from the main variables of interest, we also see that larger countries
are characterised by lower concentration, presumably because larger economies can sustain
more operators.19
Next we turn to an analysis of access to telecommunications services, for which we look
at the number of telephone main lines per hundred people (in fixed line) and the number of
mobile cellular subscriptions per hundred people (in mobile); data are taken from the World
Development Indicators for the year 2008. Estimating performance in the telecommunications
sector follows the approach taken in Ros (1999), Boylaud and Nicoletti (2000) and Fink et al.
(2003). We include the familiar set of covariates controlling for telecommunications market
attractiveness and estimate the following equation.20
logeðAccess to Telecom ServiceiÞ ¼ c0 þ c1STRIi þ c2Fundamentalsi þ c3Geographyi þ ni:
Table 2 presents the results for the fixed-line and mobile telecommunications sector,
respectively. For each sector, column 1 (column 4) estimates a model in which dummy vari-
ables capture the effect of intermediate and highly restrictive telecom policies, relative to
open countries.21 As an alternative, column 2 (column 5) treats the STRI as a quasi-continu-
ous variable.22 In general the results show a significant negative impact of restrictive policies
on a country’s teledensity. Column 3 (column 6) then applies the IV procedure to correct for
potential endogeneity and measurement error in the policy variable. Without placing too
much emphasis on the difference between OLS and IV coefficients–since the direction of the
bias in small samples is anyway indeterminate–we conclude that the adverse effect of more
restrictive policies on accessibility is confirmed. To the extent that the IV procedure reduces
attenuation bias, the true size of the effect might be stronger than indicated by the exogenous
policy model. Notice that in each segment the STRI coefficients are significant at the 1 per cent
19 This is confirmed by estimating the determinants of the number of operators with a Poisson model,the results of which can be found in the Annex.20 We continue to include log(GDP) but omit per capita income since the dependent variable in thisspecification is already normalised with respect to population. In addition, there exists a strong positivecorrelation between ICT access measures and stage of development (see World Bank 2009a, p. 136)which masks the effect of restrictive policies that is mainly behind this association.21 Open countries: STRI = 0; intermediate STRI = (25, 50); high STRI = (75, 100).22 In contrast to the dummy variable approach, this specification restricts the STRI to have a uniformlinear partial effect across all values of restrictiveness.
© 2015 The World Bank The World Economy© 2015 John Wiley & Sons Ltd
SERVICES PROTECTION AND ISOLATION 11

TABLE2
Accessto
Telecom
Services
–Mainlines
andCellularSubscriptionsper
100Inhabitants
(1)
(2)
(3)
(4)
(5)
(6)
Fixed
line
Mobile
OLS
OLS
IVOLS
OLS
IV
LogGDP(2007)
3.9285**
*3.8478**
*3.1180**
*1.4323
1.5648
�0.5291
Urban
pop(%
oftotal)
0.3044**
*0.3196**
*0.3218**
*0.7333**
*0.7549**
*0.7806**
*Popdensity
(people/sqkm)
0.0054
0.0075
0.0143**
0.0037
0.0055
0.0199
Africadummy
�2.1596
�3.0254
�1.0841
�20.3490**
*�2
0.9946**
*�1
7.9575*
LLC
dummy
3.1080
4.4019**
3.2508
�7.4681
�4.4221
�6.9672
STRIinterm
ed�7
.3807**
*�2
0.0000**
*STRIhigh
�6.5709*
�22.6063**
*STRITelecom
M3
�8.2861**
�28.7561**
*�3
4.0787**
*�8
1.8148**
*Constant
�13.2371**
�16.1957**
*�8
.6152
47.5710**
*40.6288**
58.9118**
*
Obs
103
103
93
103
103
93
R-sq
0.6068
0.5870
0.5147
0.5916
0.5727
0.5192
H0:exogenousreg
0.0011
0.0149
H0:under-ident
0.0002
0.0002
Kleibergen-PaapF
22.0307
13.0442
H0:valid
IVs
0.7983
0.1932
Notes:
(i)Dependentvariables:Number
ofmainlines
(cols.1–3)andcellularsubscriptions(cols.4–6)per
100inhabitants.
(ii)STRIdenotesfixed-lineSTRIin
cols.1–3
andmobileSTRIin
cols.4–6,respectively.
(iii)Excluded
instrumentforSTRI(cols.3+6):GATScommitmentsandnearest-neighbourSTRI.
(iv)Significance
levels:*p<0.1;**
p<0.05;**
*p<0.01.
© 2015 The World Bank The World Economy© 2015 John Wiley & Sons Ltd
12 I. BORCHERT ET AL.

level despite the higher standard errors typically associated with IV estimation. As before, the
instruments are strong and appear to be valid according to Hansen’s J test.
Comparing estimation results for the fixed-line market with the mobile segment suggests
that the application of restrictive measures has a significant effect in both markets; however,
the effect on fixed lines is quantitatively not as strong as the one on cellular subscriptions.
The coefficient estimates in columns 1–2 suggest that countries with restrictive policies have
on average 7 to 8 percentage points fewer fixed telephone mainlines than open countries. This
effect is highly significant. Given the much larger effect indicated by IV estimation, this esti-
mate probably constitutes a lower bound on the policy penalty. When policies are considered
one by one, it is the existence of an independent regulator as well as the prohibition of VoIP
and operation of own international gateways that stifles access to mainlines (see Annex
Table A.3.2). The absence of an independent regulator and restrictions on entrants ability to
use their own gateways and technology can inhibit competition which limits expansion of
mainlines.
Results for mobile telephony are qualitatively similar in that restrictive policies exert a
negative and highly significant effect on mobile cellular subscriptions. Compared with
fixed-line policies, the mobile STRI is more skewed towards openness; for example, there
are only four countries with high STRI values, which renders data support in the upper
tail thin. Thus, we mainly interpret the coefficient on the ‘intermediate STRI’ level in col-
umn 4 which, however, is quite large. The presence of major restrictions is associated
with about 20 percentage points fewer subscriptions, and all policy effects in columns 4–5are again highly significant.23 In terms of individual policy measures, apart from the exis-
tence of an independent regulator, publicly available licencing criteria are associated with
higher levels of per capita subscriptions (Annex Table A.3.3).24 The latter finding reflects
the positive effect of transparency already found in the mobile segment’s market structure
model.
In passing, we also note that the results confirm that the degree of urbanisation is a strong
determinant of access to telecom services, as we would expect. In the fixed-line segment,
absolute market size is also important, which plausibly reflects the high fixed costs associated
with setting up a fixed-line network. The large negative coefficient associated with the
sub-Saharan African region indicates that the level of wireless connectivity there is still
substantially lower than elsewhere, notwithstanding spectacular growth rates in cellular
subscriptions (from a low base) in many African countries.
c. Air Passenger Transportation
The number of international flights (inbound and outbound), as well as total seat capacity
serve as indicators for how well a country is connected in terms of air transport. We continue
to use the core set of gravity-type variables that determine a market’s attractiveness to foreign
providers, in this case airlines. GDP as a measure of economic size will control for the scale
23 We have checked whether observed market structure – itself a result of the first-round impact of pol-icy on entry decisions – directly influences access to telecommunication services. We find a small statis-tically significant effect in the mobile segment, but all results are qualitatively unchanged. Results areavailable upon request.24 It has proved difficult to include several policy measures simultaneously, which appears to be a prob-lem of insufficient degrees of freedom; see column 6 in Annex Tables A.3.2 and A.3.3, respectively.
© 2015 The World Bank The World Economy© 2015 John Wiley & Sons Ltd
SERVICES PROTECTION AND ISOLATION 13
effect. In the following analysis, we limit our attention to air passenger transportation.25 Since
about half of global airborne cargo is transported in the belly of passenger aircraft, the results
in this section may be relevant beyond the narrowly defined air passenger sector (see also
World Bank 2009b).
Air passenger transport services are traded primarily on a cross-border basis. It is not
essential for airlines to establish a commercial presence in order to fly to a specific country,
but a commercial presence can facilitate operations. The key policy instruments affecting
air transport are governed by BASAs which stipulate conditions under which international
flights might be provided between the two contracting parties. However, the national invest-
ment regime, that is a set of rules for FDI in the airline sector, is also relevant. The type
and scope of relevant BASA provisions will be discussed in greater detail below. Due to
the predominance of cross-border trade in air services the number of airlines established in
a country is not a meaningful metric of market structure; airlines would rather compete to
provide flights between city pairs; that is, competition is defined on a route-specific basis.
We therefore focus directly on the impact of air transport policies on the availability of air
transport services, for which the number of airlines flying to a given country matters as
well.26
Information on the number of airlines, the number of international flights and available seat
kilometres for each country is obtained from Air Transport Intelligence’s (ATI) Flight Global
database. We consider the total number of international flights (or, alternatively, the total seat
capacity of such flights) as the dependent variable. In addition to the core set of gravity-type
variables already introduced, the provision of flights is also linked to two additional character-
istics. From a supply-side perspective, airport infrastructure matters and is, at least in the short
run, exogenous to the number of flights. Second, from the demand side, a country’s attractive-
ness to tourism is an important determinant of flights and seats offered. Therefore, we also
control for the number of airports with a paved runway per country and for tourist arrivals as
a share of domestic population.27
In terms of policies affecting air connectivity, the appropriate measure of policy restrictive-
ness needs to take into account both air traffic rights and foreign investment rules. The former
is summarised by the WTO’s ALI, whereas information on the latter comes from the World
Bank’s newly developed policy database (see footnote 8 on the construction of the combined
STRI). We estimate the following model:
25 The chief reason for limiting our analysis to passenger transportation is inadequate data availability interms of both policies that specifically apply to air cargo transportation as well as cargo volume, someof which travels as belly cargo in scheduled passenger flights and some on dedicated cargo flights. Onewould need to concord the fraction of belly cargo to the corresponding BASA provisions applicable topassenger traffic, and the remainder to specific provisions governing dedicated cargo traffic, which maybe scheduled or charter flights. Current data availability do not allow for this matching.26 We regard the evidence of policy impact on air movements offered in this paper as complementary torelated work that has studied the effect of aviation policies on bilateral goods trade flows. For example,Geloso Grosso (2008), Piermartini and Rousov�a (2008), and Geloso Grosso and Shepherd (2009) havedirectly included the ALI in the trade cost function of gravity model of goods trade.27 For instance, Dresner et al. (2002) show that constrained access to gates may constitute a barrier toentry (and increase the cost of airline service for incumbents). Similarly, Brueckner (2002) uses a Cour-not duopoly model to show how incumbent duopolists may restrict runway capacity such that no thirdparty can enter the market. These studies strongly suggest that airport infrastructure matters.
© 2015 The World Bank The World Economy© 2015 John Wiley & Sons Ltd
14 I. BORCHERT ET AL.
LogðNo:of FlightsiÞ ¼ b0 þ b1STRIi þ b2Infrastri þ b3Tourismi þ b4Fundamentalsiþ b5Geographyi þ ni:
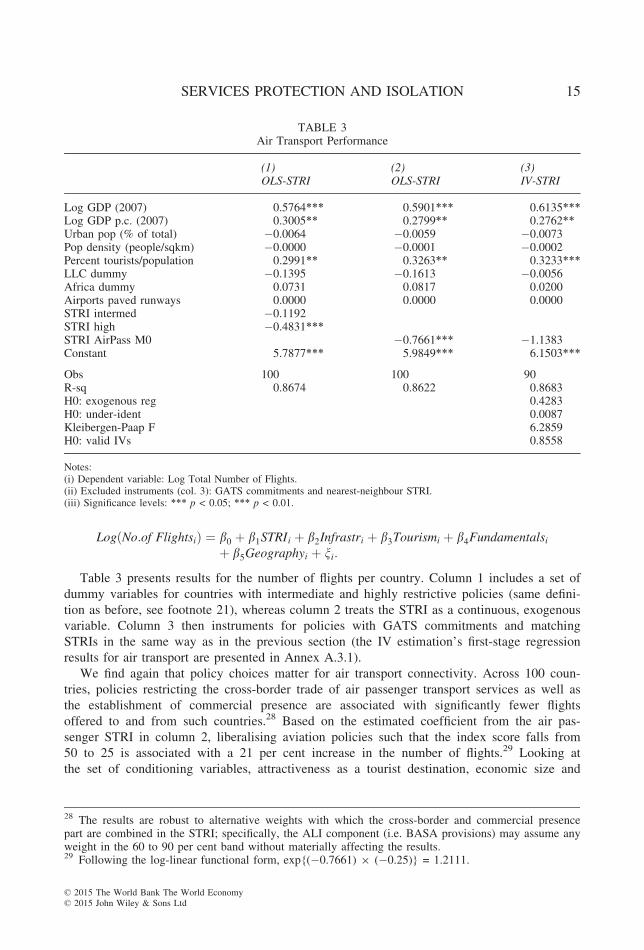
Table 3 presents results for the number of flights per country. Column 1 includes a set of
dummy variables for countries with intermediate and highly restrictive policies (same defini-
tion as before, see footnote 21), whereas column 2 treats the STRI as a continuous, exogenous
variable. Column 3 then instruments for policies with GATS commitments and matching
STRIs in the same way as in the previous section (the IV estimation’s first-stage regression
results for air transport are presented in Annex A.3.1).
We find again that policy choices matter for air transport connectivity. Across 100 coun-
tries, policies restricting the cross-border trade of air passenger transport services as well as
the establishment of commercial presence are associated with significantly fewer flights
offered to and from such countries.28 Based on the estimated coefficient from the air pas-
senger STRI in column 2, liberalising aviation policies such that the index score falls from
50 to 25 is associated with a 21 per cent increase in the number of flights.29 Looking at
the set of conditioning variables, attractiveness as a tourist destination, economic size and
TABLE 3Air Transport Performance
(1) (2) (3)OLS-STRI OLS-STRI IV-STRI
Log GDP (2007) 0.5764*** 0.5901*** 0.6135***Log GDP p.c. (2007) 0.3005** 0.2799** 0.2762**Urban pop (% of total) �0.0064 �0.0059 �0.0073Pop density (people/sqkm) �0.0000 �0.0001 �0.0002Percent tourists/population 0.2991** 0.3263** 0.3233***LLC dummy �0.1395 �0.1613 �0.0056Africa dummy 0.0731 0.0817 0.0200Airports paved runways 0.0000 0.0000 0.0000STRI intermed �0.1192STRI high �0.4831***STRI AirPass M0 �0.7661*** �1.1383Constant 5.7877*** 5.9849*** 6.1503***
Obs 100 100 90R-sq 0.8674 0.8622 0.8683H0: exogenous reg 0.4283H0: under-ident 0.0087Kleibergen-Paap F 6.2859H0: valid IVs 0.8558
Notes:(i) Dependent variable: Log Total Number of Flights.(ii) Excluded instruments (col. 3): GATS commitments and nearest-neighbour STRI.(iii) Significance levels: *** p < 0.05; *** p < 0.01.
28 The results are robust to alternative weights with which the cross-border and commercial presencepart are combined in the STRI; specifically, the ALI component (i.e. BASA provisions) may assume anyweight in the 60 to 90 per cent band without materially affecting the results.29 Following the log-linear functional form, exp{(�0.7661) 9 (�0.25)} = 1.2111.
© 2015 The World Bank The World Economy© 2015 John Wiley & Sons Ltd
SERVICES PROTECTION AND ISOLATION 15

income per capita all exert a positive and significant effect on flights, as expected. Overall,
the model fits the data very well, explaining about 86 per cent of the cross-country
variation in the number of international flights. The same qualitative results obtain when we
look at total seat capacity rather than flights. These estimations are therefore not shown to
conserve space but are available upon request. In both cases – number of flights and seat
capacity as dependent variables – the results are robust to using the ALI alone as a measure
of policy openness.
When aviation policies are instrumented for, the magnitude of the coefficient on policy
increases but ceases to be significant. However, this result based on total seat capacity hides that
fact that policies do have an effect along a certain dimension, as we will show in the next step.
In Table 3, the number of flights is an ‘absolute’ measure of connectivity in that it is not
scale-invariant. As such, a given number of flights, say 400, could be the result of 40 airlines
offering 10 flights each or a single airline offering 400 flights, or of course any other combina-
tion. In analogy to the goods trade literature, in which a distinction is commonly made between
‘trade in more product categories’ and ‘more trade of a given product’, we may think of the
number of airlines serving a country as the ‘extensive margin’ and of the number of flights per
airline as the ‘intensive margin’, Individual BASA provisions may either primarily affect the
number of airlines or the frequency and/or size of carriers’ operations, respectively.30 On the
one hand, air traffic rights, in particular fifth and higher freedom rights, as well as the type of
designation and withholding clauses, are likely to affect the number of airlines able (or willing)
to service a country. On the other hand, the range of provisions relating to airfares, number of
flights per route and maximum seat capacity directly affect the frequency and capacity of
flights for a given (designated) airline.
In order to disentangle the channel through which aviation rules affect air connectivity, we
split the total number of flights (F) into the average number of flights per airline (F/A) and
the number of airlines (A), which allows us to study the intensive and extensive margin sepa-
rately. We take advantage of the property of OLS estimation that under these circumstances,
the estimated coefficients on the policy variable in the flights-per-airline and in the number-
of-airline estimations will exactly add up to the policy coefficient in the total number of
flights regression. This allows for a convenient decomposition of the overall policy effect into
one working through the intensive and extensive margin, respectively.
Fi ¼ ðF=AÞi � Ai
logðFiÞ ¼ log ðF=AÞi þ logðAiÞ+
b̂F
STRI ¼ b̂ðF=AÞSTRI þ b̂
A
STRI
:
Table 4 presents the decomposition results; the first three columns refer to OLS estimations
assuming the STRI is an exogenous variable, whereas the last three columns employ IV
30 Bilateral air service agreements contain four types of provisions that regulate the possibility and theextent of bilateral flight connections: (i) traffic rights; (ii) ownership rules; (iii) fares/tariffs; and (iv)capacity. For a comprehensive overview of regulatory aspects of the air transport services sector, andhow the restrictiveness of market access provisions is quantified in the QUASAR database, see WTOdocument S/C/W/270/Add.1, Volume I, of November 2006. A detailed exposition of the ‘Freedoms ofthe Skies’ can be found on page I.15.
© 2015 The World Bank The World Economy© 2015 John Wiley & Sons Ltd
16 I. BORCHERT ET AL.

estimation. Looking at the STRI coefficients, it is evident that aviation policies affect
predominantly the average number of flights per airline. In column (2), the effect of policy is
highly significant at the 1 per cent level and increasing in magnitude as restrictiveness moves
from an intermediate to a high level. The partial effect of an intermediate STRI value is a
reduction in the number of flights per airline by 25 per cent, whereas highly restrictive polices
reduce flights per airline by another 15 per cent, that is by almost 40 per cent compared with
the reference point of liberal policies.31 The decomposition thus reveals that the number of
flights per airline is the primary margin of adjustment in response to restrictive aviation
policies. The IV estimation in column 5 corroborates this finding.
Apart from the main findings pertaining to policy, results for other covariates are also of
interest. For instance, and unlike aviation policies, attractiveness for tourists increases the num-
ber of flights mainly through more airlines (two-thirds of the effect) and only to a smaller but
still significant extent through more flights. Given that different airlines bring in tourists from
TABLE 4Air Transport Performance – Number of Flights, Flights per Airline and Number of Airlines
(1) (2) (3) (4) (5) (6)OLS IV
F-STRI F/A-STRI A-STRI F-STRI F/A-STRI A-STRI
Log GDP (2007) 0.5764*** 0.1975*** 0.3789*** 0.6135*** 0.2213*** 0.3955***Log GDP p.c.(2007)
0.3005** 0.2546*** 0.0459 0.2762** 0.2401*** 0.0342
Urban pop (% oftotal)
�0.0064 �0.0044 �0.0020 �0.0073 �0.0042 �0.0030
Pop density(people/sqkm)
�0.0000 �0.0001 0.0001 �0.0002 �0.0000 �0.0002
Percent tourists/Population
0.2991** 0.1060* 0.1931* 0.3233*** 0.0865 0.2388***
LLC dummy �0.1395 0.0460 �0.1854 �0.0056 0.1970 �0.1947Africa dummy 0.0731 0.2500* �0.1771 0.0200 0.2166 �0.1982Airports pavedrunways
0.0000 0.0001** �0.0000 0.0000 0.0001** �0.0001*
STRI intermed �0.1192 �0.2830*** 0.1637STRI high �0.4831*** �0.5104*** 0.0273STRI AirPass M0 �1.1383 �1.4688** 0.3534Constant 5.7877*** 4.5629*** 1.2250* 6.1503*** 4.8239*** 1.3143
Obs 100 100 100 90 90 90R-sq 0.8674 0.7208 0.7491 0.8683 0.7233 0.7585H0: exogenous reg 0.4283 0.2278 0.9216H0: under-ident 0.0087 0.0087 0.0087Kleibergen-Paap F 6.2859 6.2859 6.2859H0: valid IVs 0.8558 0.7408 0.8561
Notes:(i) Dependent variable: Total flights (F); Flights per airline (F/A); Number of airlines (A).(ii) Excluded instruments for STRI (cols. 4–6): GATS commitments and nearest-neighbour STRI.(iii) Significance levels: * p < 0.1; ** p < 0.05; *** p < 0.01.
31 Using the coefficient estimates of column (2), one obtains exp{�0.2803} � 1 = �0.2465 andexp{�0.5104} � 1 = �0.3997, respectively, the difference of which is �0.1533.
© 2015 The World Bank The World Economy© 2015 John Wiley & Sons Ltd
SERVICES PROTECTION AND ISOLATION 17
their respective national markets, this result and the relative size of both margins are quite plau-
sible. Likewise, a country’s ‘absorptive capacity’ as measured by airports with paved runways
affects the number of flights per airline rather than the number of airlines.
The findings in Table 4 suggest that the adverse impact on air transport connectivity is
mainly driven by BASA provisions that affect frequency and capacity of air traffic, for example
designation clauses, weekly flight limitations and perhaps also traffic rights. A more detailed
analysis of the differential impact of various BASA provisions would require much richer data.
4. CONCLUSIONS AND POLICY IMPLICATIONS
Drawing on a new data set of applied policies affecting services trade, we are able to iso-
late the effect of policies on market structure and performance from other country characteris-
tics. Our results suggest that a country’s own policy reform can contribute to a more
competitive market structure and to improved access to telecommunications and air transport
services. We find that in the telecommunications sector, moving from an intermediate level of
restrictiveness to an open regime would result on average in an increase in cellular teledensity
by 20 percentage points and an increase in fixed-line teledensity by 7 percentage points.
Within the STRI scoring framework applied in this paper, such a step could for instance be
achieved by abolishing a licence limit or by allowing majority foreign ownership. In the air
transport sector, a reform of aviation policies from a similar level of intermediate restrictive-
ness is estimated to be associated with a 25 per cent increase in the number of flights per air-
line. The effect of aviation policies works mainly through reducing the average number of
flights per airline, rather than reducing the number of airlines flying to and from a country.
Countries with highly restrictive aviation policies have on average almost 40 per cent fewer
flights per airline than liberal countries.
The importance of services policies for market structure and performance, therefore, has
two implications for policymaking. First, international assistance for transport and telecommu-
nications infrastructure needs to be complemented by policy reform. Second, in transport ser-
vices, there is a strong case for multilateral negotiations because there are limits to what
unilateral reform can achieve. We address each aspect in turn.
Our results suggest that access to key ‘linking’ services is determined not only by the state of
infrastructure (see Francois and Manchin, 2007; Portugal-Perez and Wilson, 2008) but also by
competition in those sectors. However, current trade facilitation and trade-related aid have
placed a heavy emphasis on infrastructure projects, especially so in transportation but also in
telecommunication. Moreover, studies which evaluate the effectiveness of aid for trade (see e.g.
Cali and TeVelde, 2010) do not explicitly specify the role of restrictive policies as constraints to
trade performance. Our findings indicate that international assistance for infrastructure invest-
ment is likely to earn a low return where policies restrict competition between service providers.
Apart from policy reform within a country, progress in transport liberalization requires
stronger international cooperation. First, the reason is that a particularly country, say Zambia,
is limited in what it can achieve on its own in the air transport sector because introducing
competition on any international route requires the consent of other countries involved.32
32 While Zambia is engaging in restrictive BASA policies itself (see footnote 4), South Africa has alsodenied Fifth Freedom rights to other countries such as Egypt to fly the vital Cairo-Lusaka-Johannesburgroute, out of a desire to protect its national airline’s interests on routes between Zambia and SouthAfrica.
© 2015 The World Bank The World Economy© 2015 John Wiley & Sons Ltd
18 I. BORCHERT ET AL.
Second, Borchert et al. (2014) show that air transport services are also restricted in other
developing and industrial countries, many of which are either important destination and
source countries, or transit or hub countries for connecting flights to landlocked economies.
Third, even though the mercantilistic quid pro quo logic may not be particularly suited to
services negotiations, regional or multilateral negotiations with strong demandeurs may some-
times help overcome entrenched domestic interests, as the example of Costa Rica shows,
which opened one of its most sensitive services sectors (telecommunications) under the aus-
pices of the CAFTA-DR agreement (Robert and Stephenson, 2008). Finally, the beneficial
effect on specific countries’ connectivity of policy reforms in other (transit or final destina-
tion) countries constitutes a positive externality that is unlikely to be fully internalised by
policymakers in those partner countries. This externality could be addressed in international
negotiations.
The WTO would be a natural platform for multilateral negotiations, but its contribution
to liberalising the transport sector has so far been limited. Air traffic rights are explicitly
excluded from the scope of services negotiations, and maritime transport has never been
seriously negotiated. In the Uruguay Round, many countries, including OECD countries,
did not make full commitments on cross-border road and rail transport services. Regional
agreements like the Yamoussoukro Decision, which entered into force in 2000, also
offer scope for regional policy reform, but they have, however, so far seen only limited
implementation.
There is no doubt that transport and telecommunications services are critical to a coun-
try’s overall economic performance. However, connectivity requires not just good infras-
tructure but also an appropriate national policy regime and international regulatory
cooperation. International assistance for infrastructure investment, therefore, needs to be
complemented by national and multilateral reform in order to yield full benefits. To insist
on such reform as a condition for assistance is now anathema. At the same time, mecha-
nisms to ensure participation by country governments and other stakeholders in processes
to determine country needs, such as ‘poverty reduction strategy papers’, are noticeably
short on reform proposals and long on lists of required investments.33 Perhaps the way for-
ward is to ask countries to present proposals that specify both intended reforms and
required investments, and to allocate assistance competitively to maximise the expected
social rate of return.
SUPPORTING INFORMATION
Additional Supporting Information may be found in the online version of this
article:
Annex A1. Restrictiveness of services trade policies.
Annex A2. Instrumental variables.
Annex A3. Additional estimation results.
Annex A4. Data sources and description.
33 Poverty Reduction Strategy Papers (PRSPs) were introduced in 1999 by the World Bank and the IMFas a new framework to enhance domestic accountability for poverty reduction reform efforts; a means toenhance the coordination of development assistance between governments and development partners;and a precondition for access to debt relief and concessional financing from both institutions.
© 2015 The World Bank The World Economy© 2015 John Wiley & Sons Ltd
SERVICES PROTECTION AND ISOLATION 19

REFERENCES
Abadie, A. and G. W. Imbens (2002), ‘Simple and Bias-Corrected Matching Estimators for AverageTreatment Effects’, NBER Technical Working Paper 0283 (Cambridge, MA: National Bureau ofEconomic Research).
Arvis, J.-F., G. Raballand and J.-F. Marteau (2010), ‘The Cost of Being Landlocked: Logistics Costsand Supply Chain Reliability’, Directions in Development – Trade No. 55837 (Washington, DC:The World Bank).
Borchert, I., B. Gootiiz and A. Mattoo (2011), ‘Services in Doha: What’s on the Table?’, in W. Martinand A. Mattoo (eds.), Unfinished Business? The WTO’s Doha Agenda (London: CEPR and WorldBank), 115–43.
Borchert, I., B. Gootiiz and A. Mattoo (2014), ‘Policy Barriers to International Trade in Services:Evidence from a New Database’, World Bank Economic Review, 28, 1, 162–88.
Boylaud, O. and G. Nicoletti (2000), ‘Regulation, Market Structure and Performance in Telecommunica-tions’, OECD Economics Department Working Paper No. 237 (Paris: OECD).
Brueckner, J. K. (2002), ‘Airport Congestion When Carriers Have Market Power’, American EconomicReview, 92, 5, 1357–75.
Cali, M. and D. W. TeVelde (2010), ‘Does Aid for Trade Really Improve Trade Performance?’, WorldDevelopment, 39, 5, 725–40.
Card, D. (2001), ‘Estimating the Return to Schooling: Progress on Some Persistent EconometricProblems’, Econometrica, 69, 5, 1127–60.
Dihel, N. and B. Shepherd (2007), ‘Modal Estimates of Services Barriers’, OECD Trade Policy WorkingPaper 51, TD/TC/WP(2005)36/FINAL (Paris: OECD).
Dresner, M., R. Windle and Y. Yao (2002), ‘Airport Barriers to Entry in the US’, Journal of TransportEconomics and Policy, 36, 2, 389–405.
Fink, C., A. Mattoo and R. Rathindran (2003), ‘An Assessment of Telecommunications Reform inDeveloping Countries’, Information Economics and Policy, 15, 4, 443–66.
Francois, J. and B. Hoekman (2010), ‘Services Trade and Policy’, Journal of Economic Literature, 48,3, 642–92.
Francois, J. and M. Manchin (2007), ‘Institutions, Infrastructure, and Trade’, World Bank PolicyResearch Working Paper 4152 (Washington, DC: World Bank).
Gasmi, F., P. Noumba Um and L. Recuero Virto (2009), ‘Political Accountability and Regulatory Perfor-mance in Infrastructure Industries: An Empirical Analysis’, World Bank Economic Review, 23, 3,509–31.
Geloso Grosso, M. (2008), ‘Liberalising Air Passenger Services in APEC’, Working Paper, Grouped’�Economie Mondiale, Sciences Po, November 2008 (Paris: Groupe d’ �Economie Mondiale).
Geloso Grosso, M. and B. Shepherd (2009), ‘Liberalising Air Cargo Services in APEC’, MPRA WorkingPaper 17781 (Munich: University Library of Munich).
Goldberg, P. K. and G. Maggi (1999), ‘Protection for Sale: An Empirical Investigation’, AmericanEconomic Review, 89, 5, 1135–55.
Golub, S. S. (2009), ‘Openness to Foreign Direct Investment in Services: An International ComparativeAnalysis’, The World Economy, 32, 8, 1245–68.
Grossman, G. M. and E. Helpman (1994), ‘Protection for Sale’, American Economic Review, 84, 4,833–50.
Gual, J. and F. Trillas (2006), ‘Telecommunications Policies: Measurement and Determinants’, Reviewof Network Economics, 5, 2, 249–72.
Hallaert, J.-J., R. C. Cepeda and G. Kang (2011), ‘Estimating the Constraints to Trade of DevelopingCountries’, OECD Trade Policy Working Paper 116 (Paris: OECD).
Holmes, L. and A. Hardin (2000), ‘Assessing Barriers to Services Sector Investment’, in C. Findlay andT. Warren (eds.), Impediments to Trade in Services – Measurements and Policy Implications(London: Routledge), 52–70.
Kee, H. L., A. Nicita and M. Olarreaga (2009), ‘Estimating Trade Restrictiveness Indices’, EconomicJournal, 119, 534, 172–99.
Koyama, T. and S. Golup (2006), ‘OECD’s FDI Regulatory Restrictiveness Index: Revision and Exten-sion to More Economies’, OECD Working Papers on International Investment 2006/4 (Paris: OECD).
© 2015 The World Bank The World Economy© 2015 John Wiley & Sons Ltd
20 I. BORCHERT ET AL.

Lall, S. V., H. Wang and T. Munthali (2009), ‘Explaining High Transport Costs within Malawi’, WorldBank Policy Research Working Paper 5133 (Washington, DC: World Bank).
Limao, N. and A. J. Venables (2001), ‘Infrastructure, Geographical Disadvantage, Transport Costs andTrade’, World Bank Economic Review, 15, 3, 451–79.
Marouani, M. A. and L. Munro (2009), ‘Assessing Barriers to Trade in Services in the MENA Region’,OECD Trade Policy Working Paper 84, TAD/TC/WP(2008)25/FINAL (Paris: OECD).
Mattoo, A. and L. Payton (eds) (2007), ‘Services Trade and Development: The Experience of Zambia’,(Basingstoke: co-publication of Palgrave Macmillan and the World Bank).
OECD (2009), ‘Testing the Services Trade Restrictiveness Index: Gravity Regressions and Trade CostsAnalysis’, paper presented at the OECD Experts Meeting on the Services Trade Restrictiveness Index(STRI), 2–3 July 2009 (Paris: OECD).
Piermartini, R. and L. Rousov�a (2008), ‘Liberalisation of Air Transport Services and Passenger Traffic’,Staff Working Paper Economic Research and Statistics Division, ERSD-2008-06 (Geneva: WorldTrade Organisation).
Portugal-Perez, A. and J. S. Wilson (2008), ‘Trade Costs in Africa: Barriers and Opportunities forReform’, World Bank Policy Research Working Paper 4619 (Washington, DC: World Bank).
Raballand, G. and P. Macchi (2009), ‘Transport Prices and Costs: The Need to Revisit Donors’ Policiesin Transport in Africa’, BREAD Working Paper 190 (Washington, DC: Bureau for Research andEconomic Analysis of Development).
Raballand, G., C. Kunaka and B. Giersing (2008), ‘The Impact of Regional Liberalization and Harmo-nization in Road Transport Services: A Focus on Zambia and Lessons for Landlocked Countries’,World Bank Policy Research Working Paper 4482 (Washington, DC: World Bank).
Robert, M. and S. Stephenson (2008), ‘Opening Services Markets at the Regional Level Under theCAFTA-DR: The Cases of Costa Rica and the Dominican Republic’, in J. A. Marchetti and M. Roy(eds.), Opening Markets for Trade in Services: Countries and Sectors in Bilateral and WTONegotiations (Cambridge: Cambridge University Press), 537–72.
Ros, A. J. (1999), ‘Does Ownership or Competition Matter? The Effects of Telecommunications Reformon Network Expansion and Efficiency’, Journal of Regulatory Economics, 15, 1, 65–92.
Schlumberger, C. E. (2007), ‘Air Transport: Revitalizing Yamoussoukro’, in A. Mattoo and L. Payton(eds.), Services Trade and Development: The experience of Zambia (Basingstoke: co-publication ofPalgrave Macmillan and the World Bank), 191–211.
World Bank (2009a), Information and Communications for Development 2009: Extending Reach andIncreasing Impact (Washington, DC: The World Bank Group).
World Bank (2009b), ‘Air Freight: A Market Study with Implications for Landlocked Countries’,Transport Papers TP-26 (Washington, DC: The World Bank Group).
© 2015 The World Bank The World Economy© 2015 John Wiley & Sons Ltd
SERVICES PROTECTION AND ISOLATION 21

本文献由“学霸图书馆-文献云下载”收集自网络,仅供学习交流使用。
学霸图书馆(www.xuebalib.com)是一个“整合众多图书馆数据库资源,
提供一站式文献检索和下载服务”的24 小时在线不限IP
图书馆。
图书馆致力于便利、促进学习与科研,提供最强文献下载服务。
图书馆导航:
图书馆首页 文献云下载 图书馆入口 外文数据库大全 疑难文献辅助工具