Embed Size (px)
Citation preview

THE WORLD BANK GROUP IN MONGOLIA
This Economic Update assesses recent economic developments and policies in Mongolia. The Update was
prepared by Altantsetseg Shiilegmaa (Economist), Khandtsooj Gombosuren (Consultant) and Gregory Smith
(Economist); led by Taehyun Lee (Senior Economist) and under the overall guidance of Chorching Goh (Lead
Economist). Contributions were gratefully received from Zahid Hasnain, Marius Vismantas, Ekaterina Mikhaylova,
Lars Jessen. This Economic Update also greatly benefited from advice and contributions from Coralie Gevers
(Country Manager). Copies can be downloaded from http://www.worldbank.org.mn. For further information,
comments and questions, please contact Tina Puntsag ([email protected]).
Mongolia Economic Update
1
Table of Contents
Executive Summary ....................................................................................................................................................... 3
Economic Development and Prospects ......................................................................................................................... 6
Real Sector Development and Outlook ...................................................................................................................... 6
Inflation ..................................................................................................................................................................... 9
Fiscal Developments and Outlook ........................................................................................................................... 11
External Sector ........................................................................................................................................................ 16
Monetary and Banking Secto .................................................................................................................................. 20
Challenges Ahead: Toward Sustainable Mineral Revenue Management .................................................................... 24
Key Economic Indicators .............................................................................................................................................. 27
Annex: Mining Sector Outlook ..................................................................................................................................... 28
Figures
Figure 1: Real GDP Growth (annual, %) ......................................................................................................................... 8
Figure 2: Sector Contribution to GDP growth (% point) ................................................................................................ 8
Figure 3: Growth contribution of consumption and Investment (% point) ................................................................... 8
Figure 4: Industrial Production Growth at 2005 Price (3 months mma, %) ................................................................... 8
Figure 5: Consumer Prices in Ulaanbaatar(%, yoy) ...................................................................................................... 10
Figure 6: Key drivers of food inflation (% yoy change) ................................................................................................ 10
Figure 7: Fiscal Balance Trend (% of GDP) ................................................................................................................... 14
Figure 8: Revenue and Expenditure Trend (% of GDP) ................................................................................................ 14
Figure 9: Mineral Revenue Trend (% of GDP) .............................................................................................................. 14
Figure 10: Changes in Revenue (%): 2012 Revenue Outturn vs 2013 Budget Projection ............................................ 14
Figure 11: Changes in Expenditures (%): 2012 and 2013 ............................................................................................ 15
Figure 12: Fiscal Deficit Projection (% of GDP) ............................................................................................................ 15
Figure 13: CA Balance (12-month rolling sum, million USD) ....................................................................................... 17
Figure 14: Export and Import (12-month rolling sum, million USD) ............................................................................ 17
Figure 15: Total Exports Monthly Growth (yoy %) contribution ................................................................................. 17
Figure 16: Total Imports Monthly Growth (yoy %) contribution) ................................................................................ 17
Figure 17: Exports composition (2012, % of total) ...................................................................................................... 18
Figure 18: Import composition (2012, % of total) ....................................................................................................... 18
Figure 19: Net FDI Monthly Inflows (million USD) ....................................................................................................... 19
Figure 20: Net International Reserves (billion USD, %) ............................................................................................... 19
Figure 21: Money Supply (% change of outstanding stock) ......................................................................................... 21
Figure 22: Growth of Bank Loan and Deposit (%, yoy) ................................................................................................ 21
Figure 23: Real Interest rates and CPI inflation (%) ..................................................................................................... 21
Figure 24: Policy rates and Central Bank Loans to Banks (%, billions MNT) ................................................................ 21
Figure 25: Liquidity Risk Indicators (%) ........................................................................................................................ 22
Figure 26: NPL to Total Asset Ratio (%) ....................................................................................................................... 22

Mongolia Economic Update
2
Figure 27: Fiscal Balance to GDP (%): Chile’s Case ...................................................................................................... 26
Figure 28: Fiscal Balance to GDP(%): Botswana’s Case................................................................................................ 26
Boxes
Box 1: Price Stabilization Program .............................................................................................................................. 10
Box 2: Debt Management Strategy in Mongolia ........................................................................................................ 15
Box 3: Export Shares of Mineral and Non-Mineral Goods ........................................................................................... 18
Box 4: Mongolia Deposit Insurance Reform ................................................................................................................ 23
Box 5: Short story of Two Countries: How did they successfully save and use mineral revenues? ............................ 26
Box 6: Main Mineral Occurences of Mongolia ............................................................................................................ 26
Box 7: Charateristics of the current global mining sector ........................................................................................... 26
Box 8: Current Key Commodities Behavor .............................................................................................................................. 26
Acronyms and Abbreviations
BoM Bank of Mongolia CPI Consumer Price Index DBM Development Bank Mongolia FX Foreign Currency FSL Fiscal Stability Law GDP Gross Domestic Product HDF Human Development Fund LC Local currency LHS Left hand side MFA Mongolian Financial Association MNT Mongolia Togrog MoF Ministry of Finance Mom Month-on-month Mt Metric ton NPL Non-Performing Loan NSO National Statistics office OT Oyu Tolgoi RHS Right hand side tn Trillion SEFIL USD
Strategic Entities Foreign Investment Law United States Dollar
TT Tavan Tolgoi WPT Windfall Profit Tax Yoy Year-on-year

Mongolia Economic Update
3
In 2012, Mongolia’s economy continued to experience a high growth rate of 12.3 percent. This growth rate was however
lower than anticipated as Mongolia saw its coal exports drop significantly due to China’s economic slowdown. Most
noticeably, Mongolia had to finance a large fiscal deficit of 8.4% of GDP, a record in the last 13 years. It is concerning that
similar fiscal trends might continue in 2013 with the economy growing at a double-digit rate but also accumulating
another large fiscal deficit. As Mongolia embarks on its largest infrastructure investments ever — which can be in part
financed through a first successful sovereign Chinggis bonds issuance — greater attention has to be paid: (i) to preparing
those investments rigorously to ensure maximum socioeconomic return and avoid potential wastage of public resources
and (ii) to reflecting their financing transparently in the national budget.
Real Sector Development and Prospects
Mongolian economy grew at a slower pace in 2012 but still maintained double-digit growth. Annual economic growth
rate of 2012 decelerated to 12.3 percent from 17.5 percent in 2011. Despite weaker performance of mineral export, the
double-digit economic growth was driven by the robust performance of non-mineral sector fueled by the recovery of the
agricultural sector as well as steady growth in construction and transportation industries. In 2013, the industrial
production growth is slowing down due to weakening coal production despite the robust performance of manufacturing
industry.
The World Bank is revising its baseline growth forecast for 2013 to 13 percent, still one of the highest in the global
economy; however significant uncertainty over key growth factors makes the economic outlook highly volatile. The
downward revision reflects the recent trends of negative export growth, sharply weakening FDI inflow and slower pace
of Chinese economic recovery in the first quarter. The ramp-up in mineral production of Oyu Tolgoi mine is expected to
lift mineral output significantly starting from this summer and any delays or disruptions in the production would have
large adverse impact. Public investment projects currently being planned for the use of Chinggis bond proceeds are also
posing another uncertainty over the growth outlook. Significant upfront investment using the bond proceeds seems
unlikely, given that large-scale projects currently being considered would require sufficient time for proper planning and
feasibility assessment. In light of the rapid economic growth outpacing the production capacity of the economy, large
extra public investment expenditure funded through the Chinggis bond proceeds could crowd out private investment
activities and could thus have a limited growth impact while adding to the inflationary pressure.
Inflation has slowed down to 9.8 percent in March 2013, from double-digit inflations in 2012 and early 2013. It
remains uncertain whether the current downward trend in inflation will continue throughout the year, given the recent
turnaround of monetary policy to an accommodative stance and continuous expansionary fiscal policy.
Fiscal Sector Development and Outlook
Fiscal balance significantly deteriorated in 2012 with the fiscal deficit climbing to 8.4 percent of GDP, a thirteen-year
record level. Total revenue outturn fell short of the budget projection by 12.1 percent whilst total expenditure
maintained high growth pace due to a hike in the recurrent spending. Capital expenditure was significantly under-
executed absorbing most of the revenue shortfalls and reflecting a still constrained capacity to implement over-stretched
investment portfolio. If the spending of the DBM on non-bankable projects — that is currently off the government
budget— had been included, the overall budget deficit would have jumped to 10.4 percent of GDP.

Mongolia Economic Update
4
In 2013, the fiscal outlook is likely to follow a similar path; the structural fiscal deficit is likely to reach over 7% of GDP,
although the approved budget keeps it at the 2 percent ceiling of the Fiscal Stability Law. The current revenue
projection of the budget was made based on the over-estimated revenue forecast of the 2012 budget and is again likely
to overestimate revenue by 15-20 percent. The revenue outturn for the first three months in 2013 confirms this
misplaced optimism: total revenue increased only by 5.8 percent between January and March compared with the same
period of the last year while the annual revenue growth projection of the budget is 47 percent. The budget also includes
extra revenue (MNT 445 billion) expected from the re-negotiation of the OT investment agreement which is unlikely at
this time. The World Bank projects an overall budget deficit to reach 6 percent of GDP and the structural deficit at over 7
percent due to the revenue shortage, under an assumption that the expenditure plan of the current budget will be also
under-executed by 5 percent due to tight revenue stream.
The fragile fiscal outlook is yet to include two off-budget financing operations —i.e., the Price Stabilization Program
and the lending from the Development Bank of Mongolia to socially-motivated projects— and the use of Chinggis
bond proceeds. If they were to be accounted for in the budget, it could bring the total fiscal deficit to around 13
percent of GDP. In particular, the proceeds from the Chinggis bond issuance came from a direct external borrowing
activity of the Government and the use of the bond proceeds would create large fiscal burden and economic impact. The
use of the proceeds should be properly accounted for as budget expenditure, not as an off-budget component.
External Sector
The trade balance is likely to remain weak in early 2013 but is expected to improve in the latter half of the year due to
strengthened mineral export. Amidst the burgeoning fiscal spending and growing domestic demand, the external
imbalance reached a record level in 2012, with the current account deficit widening to 3.2 billion USD—equivalent to
31.3 percent of GDP. Total exports dropped by 9 percent due to a sharp contraction of coal exports while total imports
increased by 2.1 percent last year. In 2013, the trade balance still remains in significant deficit as exports continue to
contract due to weakening coal exports and import growth that turned negative in the first quarter. Export is expected to
pick up in the latter half of this year as the copper export starts increasing from the OT mine. Import will likely remain
under pressure from reduced OT construction related imports.
The rapid slowdown of the FDI inflow is becoming a significant downside risk to the economy. In 2012, the net FDI
inflow declined by 17 percent to USD 3.8 billion, from USD 4.6 billion of the previous year. In the first two months of
2013, the net FDI inflow slowed down rapidly: it amounts to only 42 percent compared with the level during the same
period in 2012. The sharp deterioration of the FDI inflow reflects the expected unwinding of capital expenditure by OT
but also signals the growing wariness of foreign investors over the investment climate in Mongolia as Mongolia adopted
SEFIL (Strategic Entities Foreign Investment Law) in June 2012 and has called into question some investment agreements
and contracts. With no well-functioning domestic capital markets and limited access to international capital markets, the
sharp drop of the FDI inflow has a significant economic implication as it has been the main source of private investment
for the last two years.
Monetary and Banking Sector
Monetary policy has turned accommodative in early 2013 in the wake of slowdown of economic growth in 2012 and
slower credit growth. After two years of tight monetary stance, the Monetary Policy Committee of the Bank of Mongolia
cut the policy rate twice during the first quarter, from 13.25% to 12.5% in January and again to 11.5% in early April. In
line with the policy rate cuts, the Bank of Mongolia has been injecting reserve money into the economy through the
Price Stabilization Program and the placement of 12-month term deposits in commercial banks. While the headline

Mongolia Economic Update
5
inflation slowed down to single digit in March 2013, the increasingly loose monetary policy may add to inflationary
pressure by stimulating aggregate demand. Close monitoring on the inflationary effect of the monetary easing is needed.
Key financial indicators indicate no imminent signs of financial instability. With under-developed capital markets, a
small group of large banks remains the main conduit for corporate and individual financing. In 2012, four commercial
banks accounted for 75 percent of total banking sector loans: Khan (25.2 %), TDB (21.8%), Golomt (20.5%) and Khas Bank
(9%). Given the significance of the large banks in the financial system, continuous monitoring and supervision over the
soundness of the banking system remains an important task.
Challenges Ahead: Toward Sustainable Mineral Revenue Management
Continuous expansionary and pro-cyclical fiscal policy remains a potential risk to the stable and sustainable growth of
the economy. Lessons from the 2008-2009 economic crisis had led Parliament to adopt a Fiscal Stability Law (FSL) in
2010 to smooth public spending over time. However, Mongolia’s fiscal policy has resumed its pre-crisis pro-cyclical
pattern that had failed to cope with the abrupt collapse in the copper market, driven by increasing call for more
spending. As significant fiscal deficits continue to build up, capability of the fiscal authorities to cope with sudden mineral
market shock would be highly limited as there is not sufficient saving to function as a fiscal buffer in times of fiscal shock.
Painful adjustment of spending would inevitably have to follow to absorb the revenue shortage, which would lead to
further contraction of the economy.
The rapid increases in capital expenditures — a thirty-five fold increase over the past decade — also risk undermining
the quality of new projects as the public investment management system and the construction sector’s capability to
absorb extensive new projects cannot be scaled up quickly. Institutions for project appraisal, procurement, contracting
and monitoring are currently under development and are being strained by the rapid increases in the capital budget,
resulting in the poor quality of these projects. The rapid increase in fiscal spending is also outpacing the production
capacity of the economy. Mongolia is a small open economy with limited labor and intermediate goods (e.g.,
construction materials). As public investment is scaled up rapidly beyond the production limit of an economy, insufficient
supply of skilled labor and other production factors would likely drive up the costs of production, leading to high inflation
and poor quality of public investment.
A significant challenge at this stage is to build strong consensus to shift the fiscal management paradigm currently
focused on “spending fast” toward one on “spending well”. It would require a more prudent fiscal framework to
prevent repetition of the past boom-bust cycle and to ensure that the pace of expenditure growth is adjusted to the
capacity of the government to effectively manage public investment portfolio and the absorptive capacity of the
economy. Public spending needs to be delinked from the short-term volatility of mineral revenues to the possible extent.
An urgent task will be to abide by the rules of the FSL without resorting to off-budget financing scheme. In 2013, the
fiscal deficit needs to be contained close to the ceiling of the FSL through proper fiscal consolidation plan.
“Spending well” implies that mineral resources are spent effectively for the welfare of current and future generations
of Mongolia and that some resources are saved as precautionary saving. Given the highly volatile and unpredictable
mineral revenue stream, Mongolian economy is always exposed to the possibility of sudden collapse of mineral market.
Key challenge in introducing savings framework into the fiscal management would be to overcome political pressures for
spending now and growing expectations for mineral wealth dividend. Precautionary saving is also an effective pro-poor
and development strategy. Fiscal saving can be effectively used to strengthen social welfare measures in order to
support the poor and vulnerable as well as to maintain development expenditure in times of serious economic downturn.

Mongolia Economic Update
6
Real Sector Development and Outlook
The Mongolian economy grew at a slower pace in 2012 but still maintained strong double-digit growth. Annual
economic growth decelerated to 12.3 percent in 2012 from 17.5 percent in 2011 (Figure 1). After robust 14.5
percent growth year-on-year (yoy) in the first half of 2012, the economic expansion slowed down to 10.6 percent
(yoy) in the latter half as China’s demand for Mongolia’s mineral exports weakened. Despite slower growth of
mineral exports, double-digit economic growth was driven by the robust performance of the non-mineral sector
fueled by the recovery of agricultural sector as well as steady growth in construction, transportation and ICT
industries (Figure 2).
Non-mineral GDP (which excludes mining and quarrying industry) grew at 12.9 percent in 2012, down from 19.7
percent in the previous year. While the wholesale and retail sector was characterized by weaker performance,
strong recovery of agricultural sector largely contributed to maintaining the double-digit growth rate.
The agricultural sector expanded by 21.3 percent in 2012, a strong rebound from a contraction of 0.5
percent in 2011. Contributing almost a quarter of the total economic growth, the sector’s performance was
driven by a buoyant farming industry and a recovery of the livestock headcount from the devastating ‘Dzud’
(severe weather conditions) that had decimated nearly a fifth of the country’s livestock during 2009-10. The
Dzud had reduced agricultural output by over 16 percent in 2010 but recent growth pushed the number of
livestock to 40.9 million; and the livestock sector registered growth of 12.6 percent in 2012. Total crops —
wheat and cereals— were also up by 14.2 percent (yoy) in 2012 due to favorable weather condition.
Production in the manufacturing and transportation sectors showed steady growth and the construction
sector registered strong performance. The manufacturing sector grew at 8.9 percent, up from 7.3 percent in
2011, thanks to increased production of food and beverages. The construction industry grew at 25.6 percent
in 2012 due to continuous public infrastructure investment. While the construction of industrial and
residential buildings was significantly weaker when compared to 2011, this was largely offset by increased
public construction activities, including basic service facilities (e.g., schools and hospitals). The transportation
sector displayed a rate of expansion by 12.8 percent, up from 9.1 percent in the previous year. Production
growth in the wholesale and retail industry slowed down from 38.3 percent in 2011 to 10.3 percent in 2012.
Mining industrial output continued expanding, registering 8.9 percent growth in 2012, up from 7.3 percent
growth in 2011 despite the contraction of coal production.
Coal production declined by 7.7 percent to 28.6 million tons in 2012 (from 30.9 million tons in 2011) as
industrial production in China slowed down in the second half of 2012. In 2012, coal production accounted for
around 30 percent of mineral GDP and 86 percent of extracted coal was exported.
Crude oil production jumped by 42.6 percent reaching 3.6 million barrels in 2012 due to increased production
from new oil wells. Crude oil accounted for 15.4 percent of mineral GDP in 2012; all of which was exported to
China.

Mongolia Economic Update
7
Production of gold increased by 5.1 percent in 2012 as gold extraction rebounded after contraction in 2011
partly due to abolition of the controversial Windfall Profit Tax in 2012. Iron ore production increased by over
30 percent in 2012, but copper production remained around the same level as in 2011. Copper production is
expected to significantly increase starting from 2013 as phase one (open pit) of Oyu Tolgoi (OT) mine is due to
start production later this year.
The share of mineral GDP among total economic output has been moderately declining since 2009, accounting
for 15.7 percent of GDP in 2012. The steady pace of expansion of mining production in the range of 7-8 percent for
the last two years was surpassed by the rapid growth of construction, transportation and other services associated
with increasing mining activities. The GDP share of mineral output will likely significantly increase from 2013 if the
new copper and gold production of OT mine takes place as planned.
From the perspective of the expenditure side, double-digit growth has been driven by both consumption and
investment activities; while deceleration of investment growth and a widening trade deficit have constrained
further expansion of economy (Figure 3). Final consumption increased by 18 percent (yoy) in 2012, displaying
steady growth in the range of 17-20 percent throughout the year, fuelled by increased government consumption
including cash distribution (tuition fee, cash), SME loans, wool and cashmere bonus1. While the expansion of
investment stayed at still a high level of 24 percent, the investment spending growth significantly decelerated from
68 percent in the first quarter to 16.3 percent in the last quarter in 2012 due to weaker foreign direct investment
inflows that have been a recent and major source of domestic investment activity. In line with the slowdown of
investment, the growth of imports of machinery and transportation equipment rapidly slowed down in the second
half of the year and turned negative in the fourth quarter.
In the first quarter of 2013, Industrial production growth is slowing down despite the robust performance of the
manufacturing industry, due to the weakening production of coal. The pace of industrial output expansion
decelerated for the first three consecutive months from 16 percent (yoy) in January to 2 percent (yoy) in March.
The slowdown of industrial output was driven by continuous deterioration of coal production, which fell from 23.9
percent expansion in January to 32.2 percent contraction in March year-on-year; total coal production in the first
quarter dropped by 9.2 percent from the same period a year ago. Meanwhile, manufacturing industrial production
was strong, growing by 32 percent (yoy) in the first quarter of the year; it was driven by significantly robust
production growth in textile goods, rubber and plastic products and leather and tanning products. Delayed
recovery of coal production is likely to weigh on industrial production this year, especially in light of the recent
slowdown of Chinese economy in the first quarter.
1 The cash distribution includes a 1 million MNT universal cash transfer (comprised of monthly payments of 20 thousand MNT)
to every citizen and a 70 thousand MNT transfer to students for their stipend. The Government also issued bonds of 300 billion MNT to provide concessional loans to SMEs under Parliament Resolution # 30 in 2011.

Mongolia Economic Update
8
Real GDP growth has slowed down but it still remains in double digits.
Figure 1: Real GDP Growth (annual, %)
Double digit growth was driven by agriculture and construction sector while mining sector grew moderately.
Figure 2: Sector Contribution to GDP growth (% point)
While investment growth slowed down, stronger consumption supported economic growth in 2012. Figure 3: Growth contribution of consumption and Investment (% point)
Industrial production is slowing down in 2013 due to weak coal exports, despite strong manufacturing production. Figure 4: Industrial Production Growth at 2005 Price (3 months moving average, %)
Source: NSO, WB staff estimates
The World Bank is revising its baseline growth forecast for 2013 to 13 percent, still one of the highest in the
global economy; however significant uncertainty over key growth factors makes economic outlook highly
volatile. The revision reflects the recent trend of slower FDI inflows, weaker coal export and slower pace of
recovery in China’s economy. China’s economic growth in the first quarter was 7.7 percent, a slowdown from 7.9
percent growth in the fourth quarter last year. The economic outlook for this year will depend heavily on how
uncertainties over the following factors unfold:
Commercial production of the OT mine. Should the commercial production of copper and gold start in the
second quarter as originally planned, the mineral output is expected to pick up roughly by 30-40 percent in
2013. The growth contribution of the OT mine production is likely to further rise in the medium- and long-
term as the mine gradually approaches full production capacity expected around 2021. The baseline
projection assumes that the production at the OT mine will take place as planned. However, any delays or
disruptions in the production of the mine would have significant adverse impact on economic growth in 2013
and beyond.

Mongolia Economic Update
9
Recovery of coal production. The coal production will likely gradually recover from the sharp contraction in
2012 should China regain its momentum of economic recovery in the coming months. However, given the
weak coal production and China’s economic growth weaker than expected in the first quarter, the timing and
speed of recovery in coal production and export still remains uncertain, posing a downside risk to the
economic outlook.
Extra public investment projects. Large public investment projects are currently being planned to utilize the
USD 1.5 billion Chinggis bond proceeds. Accounting for approximately 12 percent of GDP, the eventual use of
the funds will have significant economic implications. It seems unlikely that a significant amount of the
proceeds can be spent through large investment projects this year, given large-scale projects currently being
considered would require time for proper planning and feasibility assessment. Hasty front-loading of large
investment projects without due consideration of project feasibility and the limited absorptive capacity of the
economy would likely have limited positive impact on growth while adding to overheating pressure of the
economy.
Inflation
Inflation shows signs of slowdown in 2013, decelerating to a single digit year-on-year in March, after registering
double digit inflation in 2012 (Figure 5). In December 2012, the national CPI inflation stood at 14.0 percent (yoy),
exceeding the single-digit target set by the Bank of Mongolia. In 2013, inflation decelerated to 11.3 percent in
February and 9.8 percent in March on year-on-year basis. The recent slowdown of headline inflation was driven by
a significant deceleration in increases of prices of meat and meat product. Core inflation —which excludes volatile
food and energy prices— slowed down from 10.5 percent in January to 9.6 percent in March.
Food price inflation decelerated to 9.5 percent (yoy) in March 2013 from over 30 percent of the last year. Food
price inflation2 was the main driver of high headline inflation over the previous year, reaching 32.5 percent at the
end of 2012 and contributing one-third of the headline inflation (Figure 6). A major factor behind the soaring food
inflation last year was a hike in meat price caused by supply shortages. The shortages were attributed to reduced
incentive of herders to slaughter their cattle due to the unintended effect of wool/cashmere cash handouts and
improved cash from universal cash handouts. In 2013, the price of meat and meat product has considerably slowed
down from 28.8 percent in January to 10.1 percent in March year-on-year, possibly reflecting the elevated meat
reserve level due to the Price Stabilization Program that has been implemented since last November. However,
the downward trend in year-on-year inflation —that measures the price increase compared with the level a year
ago— needs to be seen with caution, given that the price level of meat and meat product in March has increased
by 16 percent between January and March from the level at the end of 2012.
Energy and fuel price inflation has been relatively moderate in the first quarter of 2013. In 2012, the energy and
fuel inflation (yoy) steadily declined over the course of the year from 24.5 percent in January to 5.3 percent in
December. Repeated interventions of the government helped fuel prices decline in February and April 2012, but
increased border prices from Russia pushed the fuel price level back up in the last quarter of 2012. In 2013, the
energy and fuel price growth remains relatively stable, registering 5.8 percent in March (yoy). The price of
transportation fuel has been kept at the same level since last December.
2 Official CPI data from the NSO includes energy and fuel prices in the food price index category. In this Economic Update, we
use the prices of meat, milk and cheese as the ‘food price category’ and analyze energy and fuel price separately.

Mongolia Economic Update
10
Inflation is expected to slow down moderately in 2013 but will likely remain in low double digits, given the
continuous expansionary fiscal policy and the recent turnaround of monetary policy to an accommodative
stance. Demand side pressure is expected to continue to build up and put pressure on inflation, due to the recent
monetary easing of the monetary authorities and continuous fiscal stimulus through large budget deficit and off-
budget financing. Should the effects of government interventions through the Price Stabilization Program —that
has been implemented since last October— be materialized gradually, supply side pressures on meat and fuel
prices might be mitigated to some extent. However, the actual effect of the program still remains to be seen for
the remainder of the year. Between last November and March 2013, the price of transportation fuel was raised
once by 6 percent in December and has been kept at the same level through March. The price of meat and meat
products has increased by 16 percent since last November. The program also raises concerns on several issues,
including its effectiveness as well as the involvement of the central bank in a quasi-fiscal operation. (See Box 1 for
further discussion.)
Inflation is moderately decelerating in 2013 turning into a single digit level in March.
Figure 5: Consumer prices Ulaanbaatar(%, yoy)
Meat price increase was a main driver of high inflation in 2012 and is slowing down in the first quarter in 2013.
Figure 6: Key drivers of food inflation (%, yoy)
Source: NSO, WB staff estimates
Box 1: Price Stabilization Program
The Government of Mongolia and the Bank of Mongolia signed a Memorandum of Understanding on “Joint Implementation of Medium-term Program to Stabilize Prices of Key Commodities and Products” in October 2012. The price stabilization program (PSP) consists of four sub programs: i) price stability of staple food; ii) fuel retail price stability; iii) reducing the cost of imported consumption goods; and iv) promoting the construction sector and achieving stability of housing prices. The program is expected to cost 720 billion MNT and aims to address supply bottlenecks in the four areas. By February 2013, 229.6 billion MNT of credit lines have been released to local oil, meat and flour industries through participating banks.
Oil price stabilization measures have been implemented to stabilize the retail price of petrol. Since October 2012, 105.3 billion MNT of credit has been issued at an interest rate of 3.8 percent interest rate and a forward agreement at favorable terms has been offered to eleven oil import companies. The purpose of these measures is to delink retail fuel price from wholesale price fluctuations by providing financing through

Mongolia Economic Update
11
commercial banks. In addition, the authorities signed oil importing agreements with China and South Korea in an effort to diversify its oil import sources and imported 20 thousand tons of oil products since the start of the program. Around 90 percent of Mongolia’s oil consumption is currently imported from Russia.
The second component of the program is to reduce prices of imported consumption goods through measures aimed at addressing transportation bottleneck. The measures include using special wagons; improving the railway service; better organizing loading brigade work; introducing “from door to door” service and arranging additional wagons and railway transportation during the peak times and holidays.
The third sub-program aims to stabilize the prices of meat and flour —that together weigh around 20 percent of total CPI basket and over 60 percent of food CPI basket— through strengthening meat and flour reserves. 122 billion MNT of loan at 3.8 percent interest rate was provided to meat and flour producers. The construction and housing sub-program implementation is yet to be implemented as of February 2013.
While the actual impact of the program remains to be seen throughout the remainder of this year as it is still in the initial stage, some measures of the program might succeed to bring down prices of certain goods that are directly affected by the increased financing to suppliers or elevated level of reserves. However, the following issues remain concerning and need close attention from the authorities:
The program involves the central bank in supply side measures —government operations in nature. The financing provided by the Bank of Mongolia to commercial banks was planned to be replaced by the Government through domestic government bond issuance early this year. As the program takes its shape with the involvement of the central bank, the authorities need to announce clear exit plan of the central bank and include the program properly in the fiscal plan.
While the program intends to address structural bottlenecks, the program injects new base money to the economy. Effects of supply-side measures are likely to become materialized gradually in the medium and long-term as supply constraints are eased thanks to policy measures. Given this, money supply through the program might add to demand-side pressure on inflation in the near-term while the intended benefit of the program is likely to be materialized more in the longer-term. Proper monetary sterilization measures are needed along with close monitoring of the inflationary impact of the program going forward.
The program intends to smooth retail petroleum prices through subsidies to suppliers. This will allow excessive
demand for fuel to build up despite rising prices. After the program expires in three years as planned, the unabated demand for fuel will likely put heavy pressure on the fuel price again along with uncontrollable supply side factors. Should the Government decide to keep the program after the current three year time horizon to keep fuel price in check, it might turn into a significant fiscal burden.
Source: World Bank staff
Fiscal Development and Outlook
In 2012, the fiscal balance significantly deteriorated to a record deficit of 8.4
3 percent of GDP, the highest level
over the last thirteen years (Figure 7). The structural deficit reached 9 percent of GDP. The level of fiscal deficit
was around only 5 percent of GDP even during the crisis period in 2008 and 2009. The considerable deterioration
of the fiscal balance last year was caused by over-estimation of the budget revenue and excessive spending plan.
3 This figure reflects updated 2012 fiscal outturn including spending that was carried over to 2013.

Mongolia Economic Update
12
Total revenue for 2012 fell short of the budget projection by 12.1 percent, even after the second amendment of
the budget that had attempted to revise down the revenue projections in September 2012. In part, the significant
revenue shortage could be attributed to unpredictable mineral market fluctuation and still weak revenue
projection capacity of the fiscal authorities. However, the over-estimation was also largely due to the prevailing
tendency during the Parliament review process to increase revenue projections based on unrealistic economic
assumptions in order to finance extra spending programs. As a result, budget revenue projections tend to rely on
highly optimistic assumptions, creating significant revenue shortages. More robust and realistic revenue
projections based on conservative assumptions are needed to establish a credible fiscal plan; especially in light of
high volatility and unpredictability of mineral resources.
Total revenue (including grants) increased by only 10.8 percent in 2012 –a sharp deceleration from 43 percent
growth in 2011 and well below the budget projection of 26 percent increase (Figure 8). In real terms, total
revenue was down by 6.7 percent (yoy). A sharp drop in mineral revenues due to weaker coal exports was a major
factor behind the sluggish revenue growth, which signifies increasing vulnerability of the fiscal soundness to highly
volatile and unpredictable mineral revenue stream.
Total mineral revenue4 (0.8 trillion MNT) declined by 35.6 percent from 1.3 trillion MNT during the previous
year, reflecting falling external demand for coal in the latter half of the year. Coal exports –accounting for
over 40 percent of total exports– fell by 15 percent in 2012. Reduced mineral export was translated into the
contraction of mineral revenue. Corporate income tax revenue from mining sector dropped by 50 percent,
royalty by 46.4 percent and customs duties by 62.6 percent respectively. As a result, the percentage share of
mineral revenues among total revenue declined to 16.4 percent in 2012, a significant fall from 28.2 percent in
2011 (Figure 9).
Non-mineral revenue grew at 29.1 percent in 2012, roughly in line with non-mineral nominal GDP growth.
As the nominal income and consumption levels increased, personal income tax grew by 49 percent and VAT on
domestic consumption by 35 percent. However, growth in VAT receipts on imported goods (mostly mining
equipment) slowed down to 5.6 percent as the first phase construction of the OT mine neared its completion.
Total expenditures increased by 22 percent in 2012, far exceeding the revenue growth, due to rapid increases in
recurrent spending. The share of government spending to GDP reached 42.5 percent in 2012, a significant jump
from 35 percent in 2009. The large expenditure growth was driven mainly by sharp increases in recurrent
expenditures by 37.6 percent. The recurrent spending hike was caused by the 49.2 percent increase in the
government wage bill and increased cash transfers by 16.8 percent. Interest payments more than tripled in 2012,
reaching 126 billion MNT. Interest payments for domestic government bonds constituted 62 percent (78.7 billion
MNT) of total interest payments whilst interest payments on the DBM bonds amounted to 24.3 billion in 2012.
In contrast to surging recurrent expenditure, capital expenditure was significantly under-executed, absorbing
most of the revenue shortage and reflecting the limited capacity to implement public investment projects.
Capital spending increased by only 8 percent (yoy) in 2012, falling short of the budget plan by 20 percent (Figure
11). Significant under-execution of the capital expenditure manifests the increasing vulnerability of public
investment expenditure —discretionary spending in nature— to middle-year adjustment pressure in times of
revenue shortfall. While recurrent spending was executed close to the budget plan despite the revenue shortfall,
public investment spending took the hard hit absorbing most of the fiscal adjustment pressure. In addition, in light
4 Mineral Revenue includes Mining CIT, Royalty, Dividend and Customs Tax following the definition of the budget document.

Mongolia Economic Update
13
of significantly increased public expenditure level over the past three years5, the limited capacity of the authorities
to properly manage overstretched public investment projects is constraining effective implementation of capital
budget plan. The short funding situation also translated into reduced capital maintenance/repair spending by 5.7
percent despite significant demand for more resources to be allocated towards it.
In 2013, the fiscal outlook is likely to follow a similar path; the structural deficit is expected to reach over 7
percent of GDP despite the commitment of the approved budget to the 2 percent ceiling of the FSL. The current
revenue projection is still highly optimistic and includes unrealistic assumptions on key revenue sources. Revenue
projections of the approved budget were made based on over-estimated revenue projections of the 2012 budget
that had eventually caused a 12 percent revenue shortage last year. The approved budget projects that the import
VAT tax revenue will increase by 47 percent and customs duty tax revenue by over 76 percent; a significant
increase from 5.6 percent and negative 6.3 percent in 2012 respectively. The budget also includes extra revenue
(MNT 445 billion) expected from the ongoing discussions around the OT investment agreement, although the
outcome is uncertain. Given these factors, revenue shortage is likely to reach 15-20 percent of the revenue
projection of the approved budget. The World Bank projects the overall budget deficit to reach 6 percent and the
structural deficit over 7 percent in 2013, when accounting only for the revenue shortage effect, under an
assumption that the expenditure plan of the approved budget will be under-executed by 5 percent due to tight
revenue stream.
The fragile fiscal outlook is yet to include two off-budget financing operations —i.e., the Price Stabilization
Program and the lending from the Development Bank of Mongolia to socially-motivated projects— and the use
of Chinggis bond proceeds. If they were to be accounted for in the budget, it would likely add additional fiscal
deficit of 7 percent of GDP on top of the deficit of the approved budget, pushing the total fiscal deficit up to 13
percent of GDP in 2013. Had the off-budget spending through the DBM been included in the 2012 budget outturn,
the overall fiscal deficit would have reached 10.4 percent of GDP in 2012.
The Price Stabilization Program —that is currently financed by the Bank of Mongolia on a temporary
basis— is a fiscal policy operation in nature and needs to be reflected in the fiscal plan as soon as possible.
The total cost of the program is 720 billion MNT (equivalent to over 4 percent of 2013 GDP) and 230
billion MNT was already implemented by February 2013.
While not covered by the fiscal rules of the FSL, the DBM —100 percent state-owned entity— is becoming
a major source of public financing for development projects. While its funding was made under explicit
government guarantees including overseas borrowing of USD 580 million in 2012, many of public projects
financed by the DBM were social projects or non-bankable projects; raising concern on future fiscal
obligations as well as its impact on macro-economic stability. In 2012, roughly half of the total DBM
lending (488.2 billion MNT) was made to social benefit projects (e.g., local roads, mortgage) that will have
to be eventually repaid by the state budget after four years from now.
Development spending programs are currently under consideration for utilization of the Chinggis bond
proceeds. Even spending a quarter of the proceeds would create additional fiscal spending equivalent to
over 3 percent of GDP. In addition, the macro-economic impact of the public investment projects is likely
to multiply given that the government is considering additional private sector financing by limiting the
government share to one-third of the total project cost. It is concerning that the large amount of non-
5 Capital expenditure level in 2012 has reached two and a half times the level in 2009.

Mongolia Economic Update
14
concessional external borrowing was carried out without either proper consideration of its impact on the
fiscal deficit (regulated by the FSL) or concrete plans on how to use the external financing. Investment
projects to be financed by the bond proceeds need sufficient time for planning and feasibility assessment.
In particular, the proceeds came from a direct borrowing activity of the Government and the use of the
proceeds should be accounted for as budget expenditure, not as an off-budget component.
Implementation of the approved budget has been cautious in the first quarter in 2013, registering a budget
surplus. Total revenue increased by 5.8 percent between January and March compared with the same period of
the last year. Given that the annual revenue growth projection of the approved budget is 47 percent, the modest
revenue outturn confirms the likelihood of significant revenue shortage this year. The sluggish revenue growth was
largely due to weak performance in the import VAT and customs duty, dropping by 15.7 percent and 16.5 percent
respectively in the first quarter, as the import growth turned negative. The weak revenue stream has been
constraining the execution of budget expenditures; total budget expenditure declined by 7.7 percent from the
actual expenditure of the first quarter last year. Proper fiscal consolidation plan needs to be formalized through
budget amendment in order to prevent a rapid ramp up of spending in the remainder of the year and to
incorporate realistic revenue outlook.
Fiscal deficit reached 7 percent of GDP in 2012, a 13 year record level.
Figure 7: Fiscal Balance Trend (% of GDP)
Fiscal policy is returning to pro-cyclical pattern of the pre-crisis period.
Figure 8: Revenue and Expenditure Trend (12 months rolling sum, % of GDP)
Mineral revenue declined significantly in 2012 while non-mineral revenue performance was robust.
Figure 9: Mineral Revenue Trend (% of GDP)
Total revenue fell short of budget by 12% in 2012 and the revenue projection of 2013 budget is optimistic again.
Figure 10: 2012 Revenue Outturn and 2013 Budget Projection (%)
0
5
10
15
20
25
30
35
40
2005 2006 2007 2008 2009 2010 2011 2012
Mineral Revenue to GDP (%)
Mineral Revenu to Total Revenue(%)
49.2
-4.1 5.6 6.3
16.1 14.7
65.1
47.3
90.5
28
-20
0
20
40
60
80
100
PIT CIT Import VAT Excise Tax Royalty
2012
2013

Mongolia Economic Update
15
Capital expenditure is set to increase by 80 percent based on unrealistic revenue projection.
Figure 11: Changes in Expenditures (%): 2012 and 2013
Fiscal outlook will not likely improve much in 2013.
Figure 12: Fiscal Deficit Projection (% of GDP)
Source: Mongolian Authorities, World Bank staff estimates
Box 2. Debt Management Strategy in Mongolia For many years Mongolia relied on external concessional borrowing. Concessional loans are attractive since they have low interest rate, and very long maturities, implying low exposure to changes in interest rates and exchange rates. As the economy has developed, the access to these loans is gradually disappearing, and borrowing will increasingly take place at market terms. While this implies higher cost and higher risk, the advantage from a debt management perspective is that the government gets to choose the financial terms and therefore risk exposure that it prefers. A medium term debt management strategy is a plan that the government intends to implement in order to achieve a desired composition of the government debt, which captures the government’s preferences with regard to the cost-risk tradeoff. It operationalizes country authorities’ debt management objectives —e.g., ensuring the government’s financing needs and payment obligations are met at the lowest possible cost consistent with a prudent degree of risk. A debt management strategy has a strong focus on managing the risk exposure embedded in the debt portfolio rather than the size of the debt —specifically, potential variations in the cost of debt servicing and its impact on the budget. The composition of the debt will determine the risk exposure, i.e. how much the budget cost and debt size will change, as interest rates and/or the tugrig fluctuates in line with domestic and external developments. While the focus of debt management is the composition of the debt, fiscal policy is the main determinant of the size of the debt. The government of Mongolia has made important progress in debt management over that last decade. In 2012, the Ministry of Finance published a debt management strategy, covering the period 2012-14. More recently, the domestic debt has increased, which is positive for both the development of a government securities market, and from the perspective of reducing exposure to foreign exchange rates. Also, the Fiscal Stability Law is an important input to the debt management strategy, since the limits on debt and deficits in the law will have an impact on a debt structure and size. The issuance of bonds in the international markets in late 2012 (Chinggis bonds) demonstrates that alignment between external debt issuance and overall debt management strategy needs to be improved. The debt transaction seems to have been led by the Ministry of Economic Development, with no clear reference to the Medium Term Debt Management Strategy 2012-14. While the issuance was successful from a market perspective, its size and structure substantially altered the cost and risk profile of the debt. For example, the share of external debt increased with the issuance, where the stated goal in the debt management strategy is to reduce the share of external debt and to focus more on domestic borrowing and supporting domestic government securities market development. From the perspective of the FSL, the increasing debt size implies that it could be a challenge to ensure that the debt level remains below the stated limits of the law. More importantly from a debt management perspective, the risk exposure of the debt means that even a limited depreciation of the local currency could result in the debt limit being breached, even if appropriate fiscal measure has been taken.
-14
-12
-10
-8
-6
-4
-2
0
2
2010 2011 2012 2013
Budget Projection
WB Staff Projection(Revenue shortage effect)
WB Staff Projection (off-budget spending andChinggis bond use included)

Mongolia Economic Update
16
Going forward, all debt-related decisions need to be made within the framework of an agreed and published medium term debt management strategy in line with best international practices. The most effective way of ensuring strong coordination is to have one unit in the government responsible for debt management strategy development and implementation. Typically such a unit is a department in the Ministry of Finance. A second best would be establishing a high-level debt management committee with participation from the Ministry of Finance, the Ministry of Economic Development, and Bank of Mongolia. This committee would vet all borrowing decisions, and would also be the forum in which the annual update of the medium term debt management strategy would be discussed.
External Sector
Amidst burgeoning fiscal spending and growing domestic demand, the external imbalance reached record levels
in 2012, with the current account deficit widening to USD 3.2 billion; equivalent to 31.3 percent of GDP (Figure
13). The current account imbalance was driven by the record level of deficit in the trade balance. The trade deficit
reached USD 2.4 billion as total exports dropped by 9 percent (yoy) while total imports increased by 2.1 percent
(yoy). The deficit of the service balance reached USD 1.2 billion due to a decline in the tourist and transportation
service activities.
The 9 percent reduction in total exports, largely generated by the sharp contraction of major mineral exports
(coal and copper), led to the massive trade deficit in 2012 (Figure 14). Coal exports decreased by 16.3 percent
(yoy) in December 2012, driven by export volume reduction of 1.8 percent and a unit price decline of 14.7 percent.
The significant drop in major mineral exports reflected weak demand from China especially in the latter half of the
last year. In contrast to the weak performance of coal and copper exports, export of crude oil increased by 33
percent —accounting for 7.7 percent of total export— thanks to stable extraction from two oil extraction fields.
Gold export increased by 8.4 percent (yoy), which partly benefited from the abolishment of the Windfall Profit Tax6
law in 2012. Non-mineral exports also declined by 8.4 percent in 2012 due to weaker export of meat products.
Growth of total imports decelerated to 2.1 percent in 2012, a significant slowdown from doubling in the
previous year. The slowdown of import growth was mainly due to stagnant imports of heavy machineries for
mining industry as the OT mine completed most of its construction. The growth of machinery and equipment
import turned into negative 7.3 percent (yoy) and the import of transportation equipment also declined by 15.9
percent (yoy) in 2012. The two import categories accounted for 43 percent of total import in 2012.
In 2013, a significant trade deficit persists for the first three months of the year. The trade deficit is narrowing
when compared with the same period of previous yeas as the negative growth of export is surpassed by the faster
pace of import contraction. Between January and March, total exports declined by 7.8 percent while total imports
dropped by 17.3 percent.
Total export growth is still negative due to weak coal exports despite moderate signs of recovery in
exports of copper and other goods. Coal exports —the main factor behind the fall of total exports in
2012— remain weak, registering 43 percent negative growth (yoy) in value between January and March
2013 (Figure 15). In contrast, copper exports are showing moderate growth so far this year, increasing by
5.4 percent (yoy) in the first quarter. Non-mining trade exports —especially leather and wool products—
6 The windfall profits tax, which had been introduced in 2006, imposed a 68% tax on the portion of the metal sales price
(defined by reference to the London Metal Exchange) in excess of US $2,600 per ton of copper and US $850 per ounce of gold. The law was abolished in 2012.
Mongolia Economic Update
17
started increasing significantly early this year thanks to the strengthened support of the Government,
more than doubling for the first three months.
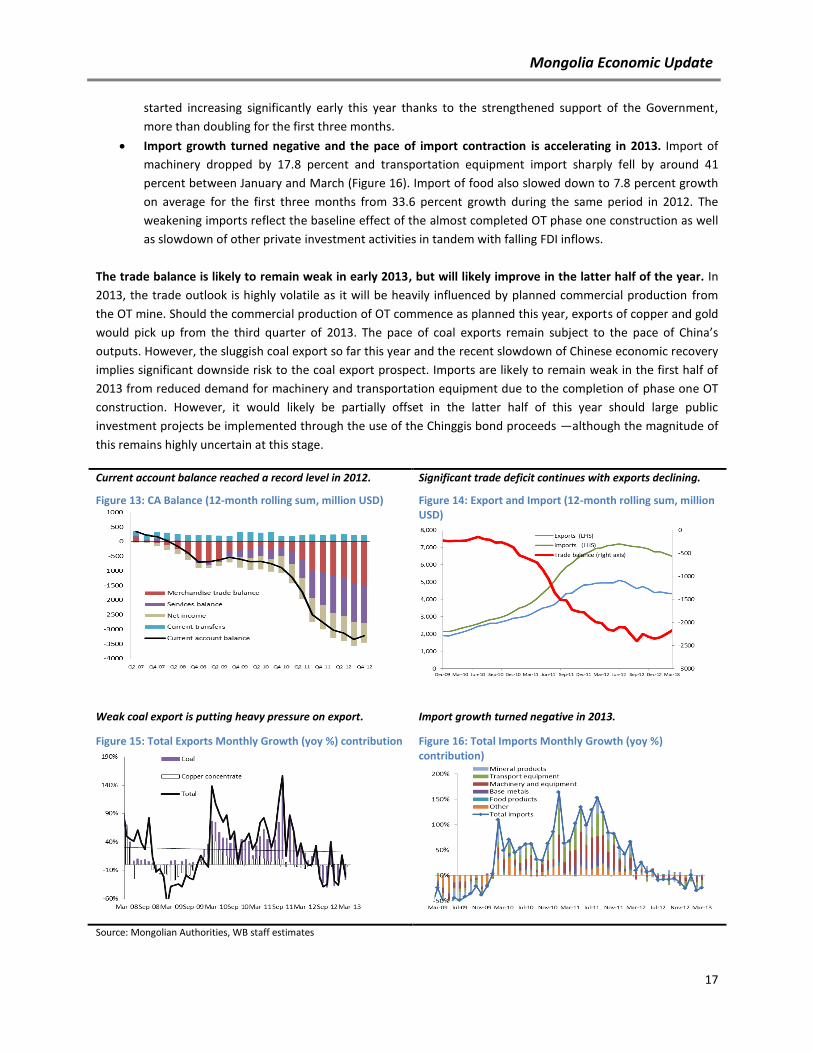
Import growth turned negative and the pace of import contraction is accelerating in 2013. Import of
machinery dropped by 17.8 percent and transportation equipment import sharply fell by around 41
percent between January and March (Figure 16). Import of food also slowed down to 7.8 percent growth
on average for the first three months from 33.6 percent growth during the same period in 2012. The
weakening imports reflect the baseline effect of the almost completed OT phase one construction as well
as slowdown of other private investment activities in tandem with falling FDI inflows.
The trade balance is likely to remain weak in early 2013, but will likely improve in the latter half of the year. In
2013, the trade outlook is highly volatile as it will be heavily influenced by planned commercial production from
the OT mine. Should the commercial production of OT commence as planned this year, exports of copper and gold
would pick up from the third quarter of 2013. The pace of coal exports remain subject to the pace of China’s
outputs. However, the sluggish coal export so far this year and the recent slowdown of Chinese economic recovery
implies significant downside risk to the coal export prospect. Imports are likely to remain weak in the first half of
2013 from reduced demand for machinery and transportation equipment due to the completion of phase one OT
construction. However, it would likely be partially offset in the latter half of this year should large public
investment projects be implemented through the use of the Chinggis bond proceeds —although the magnitude of
this remains highly uncertain at this stage.
Current account balance reached a record level in 2012.
Figure 13: CA Balance (12-month rolling sum, million USD)
Significant trade deficit continues with exports declining.
Figure 14: Export and Import (12-month rolling sum, million USD)
Weak coal export is putting heavy pressure on export.
Figure 15: Total Exports Monthly Growth (yoy %) contribution
Import growth turned negative in 2013.
Figure 16: Total Imports Monthly Growth (yoy %) contribution)
Source: Mongolian Authorities, WB staff estimates
Mongolia Economic Update
18
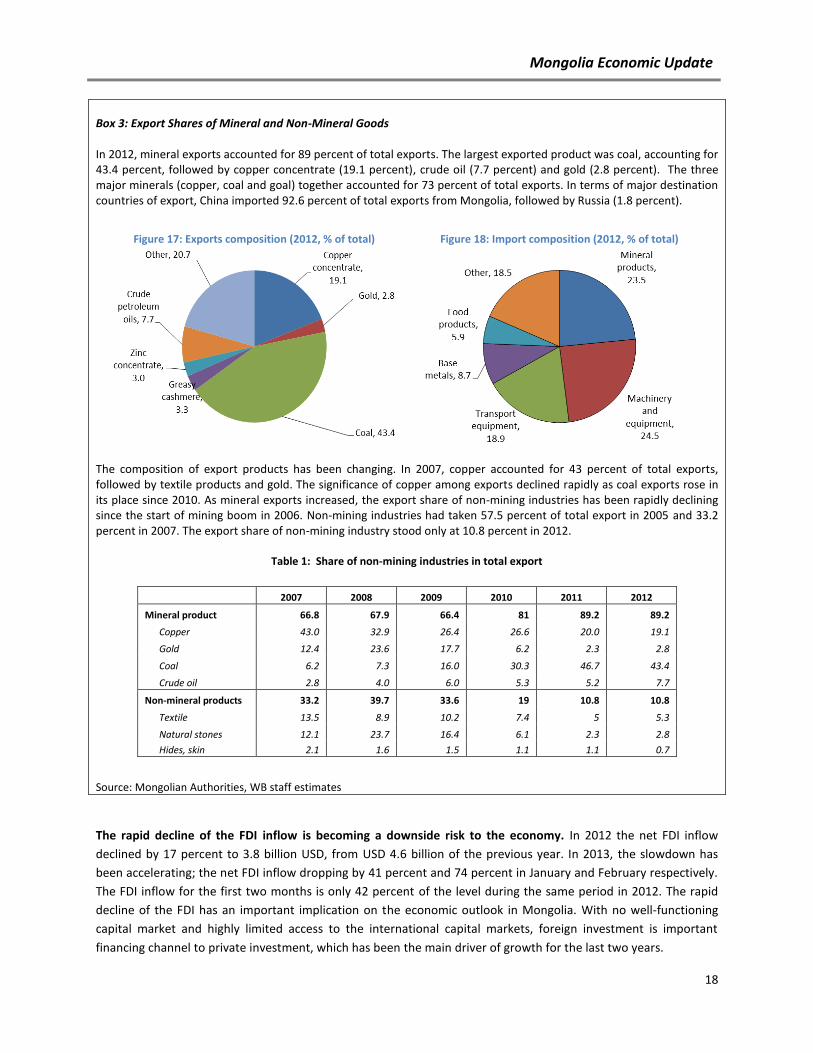
Box 3: Export Shares of Mineral and Non-Mineral Goods In 2012, mineral exports accounted for 89 percent of total exports. The largest exported product was coal, accounting for 43.4 percent, followed by copper concentrate (19.1 percent), crude oil (7.7 percent) and gold (2.8 percent). The three major minerals (copper, coal and goal) together accounted for 73 percent of total exports. In terms of major destination countries of export, China imported 92.6 percent of total exports from Mongolia, followed by Russia (1.8 percent).
Figure 17: Exports composition (2012, % of total)
Figure 18: Import composition (2012, % of total)
The composition of export products has been changing. In 2007, copper accounted for 43 percent of total exports, followed by textile products and gold. The significance of copper among exports declined rapidly as coal exports rose in its place since 2010. As mineral exports increased, the export share of non-mining industries has been rapidly declining since the start of mining boom in 2006. Non-mining industries had taken 57.5 percent of total export in 2005 and 33.2 percent in 2007. The export share of non-mining industry stood only at 10.8 percent in 2012.
Table 1: Share of non-mining industries in total export
2007 2008 2009 2010 2011 2012
Mineral product 66.8 67.9 66.4 81 89.2 89.2
Copper 43.0 32.9 26.4 26.6 20.0 19.1
Gold 12.4 23.6 17.7 6.2 2.3 2.8
Coal 6.2 7.3 16.0 30.3 46.7 43.4
Crude oil 2.8 4.0 6.0 5.3 5.2 7.7
Non-mineral products 33.2 39.7 33.6 19 10.8 10.8
Textile 13.5 8.9 10.2 7.4 5 5.3
Natural stones 12.1 23.7 16.4 6.1 2.3 2.8
Hides, skin 2.1 1.6 1.5 1.1 1.1 0.7
Source: Mongolian Authorities, WB staff estimates
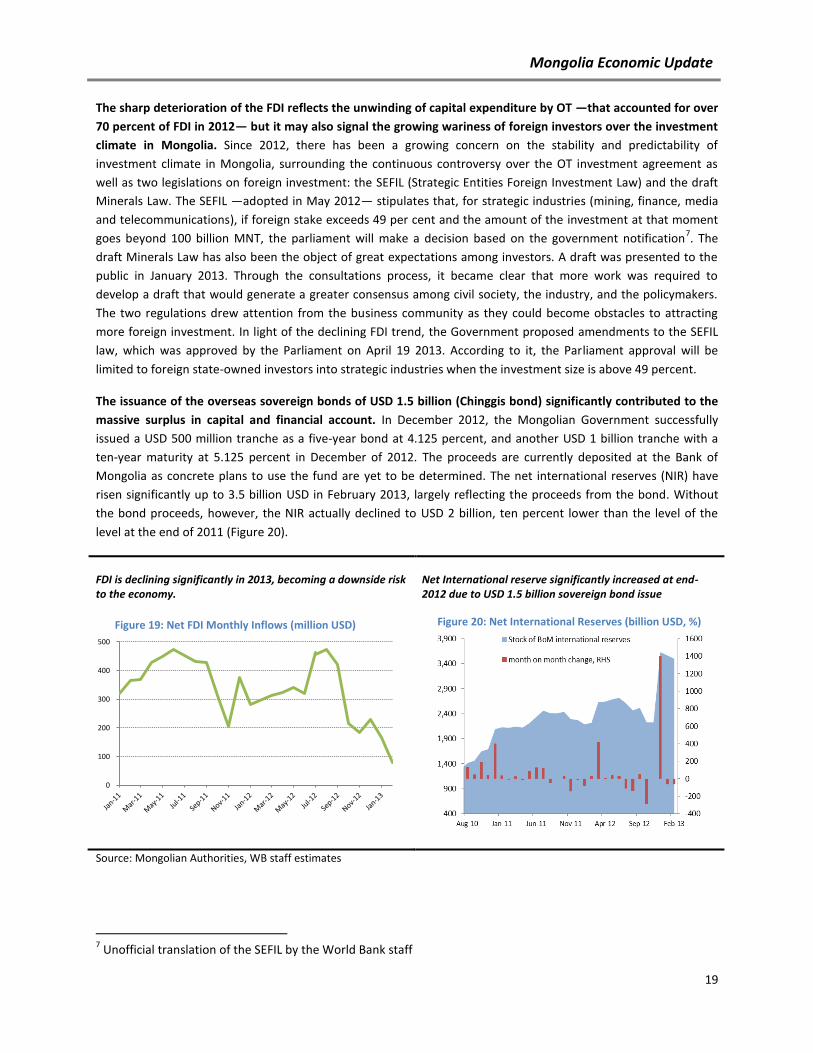
The rapid decline of the FDI inflow is becoming a downside risk to the economy. In 2012 the net FDI inflow
declined by 17 percent to 3.8 billion USD, from USD 4.6 billion of the previous year. In 2013, the slowdown has
been accelerating; the net FDI inflow dropping by 41 percent and 74 percent in January and February respectively.
The FDI inflow for the first two months is only 42 percent of the level during the same period in 2012. The rapid
decline of the FDI has an important implication on the economic outlook in Mongolia. With no well-functioning
capital market and highly limited access to the international capital markets, foreign investment is important
financing channel to private investment, which has been the main driver of growth for the last two years.
Mongolia Economic Update
19
The sharp deterioration of the FDI reflects the unwinding of capital expenditure by OT —that accounted for over
70 percent of FDI in 2012— but it may also signal the growing wariness of foreign investors over the investment
climate in Mongolia. Since 2012, there has been a growing concern on the stability and predictability of
investment climate in Mongolia, surrounding the continuous controversy over the OT investment agreement as
well as two legislations on foreign investment: the SEFIL (Strategic Entities Foreign Investment Law) and the draft
Minerals Law. The SEFIL —adopted in May 2012— stipulates that, for strategic industries (mining, finance, media
and telecommunications), if foreign stake exceeds 49 per cent and the amount of the investment at that moment
goes beyond 100 billion MNT, the parliament will make a decision based on the government notification7. The
draft Minerals Law has also been the object of great expectations among investors. A draft was presented to the
public in January 2013. Through the consultations process, it became clear that more work was required to
develop a draft that would generate a greater consensus among civil society, the industry, and the policymakers.
The two regulations drew attention from the business community as they could become obstacles to attracting
more foreign investment. In light of the declining FDI trend, the Government proposed amendments to the SEFIL
law, which was approved by the Parliament on April 19 2013. According to it, the Parliament approval will be
limited to foreign state-owned investors into strategic industries when the investment size is above 49 percent.
The issuance of the overseas sovereign bonds of USD 1.5 billion (Chinggis bond) significantly contributed to the
massive surplus in capital and financial account. In December 2012, the Mongolian Government successfully
issued a USD 500 million tranche as a five-year bond at 4.125 percent, and another USD 1 billion tranche with a
ten-year maturity at 5.125 percent in December of 2012. The proceeds are currently deposited at the Bank of
Mongolia as concrete plans to use the fund are yet to be determined. The net international reserves (NIR) have
risen significantly up to 3.5 billion USD in February 2013, largely reflecting the proceeds from the bond. Without
the bond proceeds, however, the NIR actually declined to USD 2 billion, ten percent lower than the level of the
level at the end of 2011 (Figure 20).
FDI is declining significantly in 2013, becoming a downside risk to the economy.
Figure 19: Net FDI Monthly Inflows (million USD)
Net International reserve significantly increased at end-2012 due to USD 1.5 billion sovereign bond issue
Figure 20: Net International Reserves (billion USD, %)
Source: Mongolian Authorities, WB staff estimates
7 Unofficial translation of the SEFIL by the World Bank staff
0
100
200
300
400
500

Mongolia Economic Update
20
Monetary and Banking Sector
Money supply and domestic credit growth has been slowing, reflecting efforts by the Bank of Mongolia for the
last two years to curb rising inflation. Average broad money growth (yoy) stabilized to 23.9 percent in 2012 from
57.2 percent in 2011, slowing down further to 17 percent on average between January and February (Figure 21).
Reserve money growth on average slowed down only moderately from 66 percent to 60 percent during the same
period. The widening gap between the broad money growth and the reserve money supply indicates slowing
money circulation amidst the slowdown of economic growth and declining FDI inflow in 2012. Domestic credit
growth also slowed down to a more sustainable pace. Growth of total bank loan has been steadily decelerating
from over 60 percent early last year to 24 percent at the end of 2012 and 26 percent in February in 2013. The
slowdown of domestic credit growth reflects the monetary tightening that has been maintained throughout the
last year and tight liquidity situation of commercial banks.
Concentration of bank loans to mining industry and real estate business is increasing. The share of mining sector
among the total bank loan increased to 14.3 percent at the end of 2012 from 12.0 percent a year ago, the real
estate business to 17.3 percent from 14.1 percent , and the construction industry to 16.1 percent from 11.8
percent. In total, the three sectors accounted for 47.7 percent of total outstanding loans at the end of 2012, up
from 37.9 percent a year ago. Increasing exposure to these sectors reflects increasing business activities in the
areas but needs continuous attention as they tend to be vulnerable to boom-bust cycles in the mineral market.
Bank deposit growth also slowed down in 2012, but has been increasing at a steady pace throughout the latter
half of 2012 and in early 2013. Total bank deposits increased by 26.5 percent in 2012, down from 41 percent in
2011. In 2012 domestic currency deposits increased by 19.5 percent and foreign currency deposits by 46.7 percent
(Figure 22). After a sharp drop in local currency deposits in the first three months of 2012, deposit inflows into the
banking sector continued to rebound, reflecting recovery of confidence in the strength of banking sector. After a
sharp increase between May and June, foreign currency deposit growth has continuously slowed down and has
turned negative since October 2012.
Bank domestic deposit and lending interest rates remain in double digits. The average weighted interest rate on
local currency deposits has stood at 11.7 percent in December 2012, slightly up from 10.7 percent in 2011. Given
the high inflation around 14 percent in 2012, the average deposit interest rate in real terms stayed negative,
constraining further growth of deposits which is the main source of bank credits to businesses in Mongolia (Figure
23). In the first quarter of 2013, the real deposit rates turned slightly positive as the inflation slowed down. The
weighted average rate on foreign currency deposits, meanwhile, has risen at a faster pace from 4.5 percent in
2011 to 6.1 percent in December 2012, with the maximum rate offered rising from 10.2 percent to 15.2 percent to
attract customers. Weighted average domestic lending interest rates have also been on the rise but to a larger
extent, to 18.2 percent in December 2012 from 15 percent of the same month of the previous year. The spread
between average domestic deposit rates and domestic lending rates has widened to around 7 percentage points
since February in 2012, partially reflecting tightened credit market condition.
Monetary policy has turned accommodative since early 2013 in the wake of slower economic growth and credit
growth. The Bank of Mongolia had been maintaining tight monetary policy throughout 2012 in an attempt to curb
soaring inflation rate: its policy rate was raised by 100 bps to 13.25 percent and the reserve requirement ratio was
also strengthened to 12 percent by 100 bps in 2012. After two years of tight monetary stance, the Monetary Policy
Committee of the Bank of Mongolia cut the policy rate twice in the four months in 2013, by 75 bps to 12.5 percent
in January and by 100 bps to 11.5 percent in April (Figure 24). This is a significant turnaround of the monetary

Mongolia Economic Update
21
policy stance. An underlying assumption behind the decision seems to be an expectation on the effect of the on-
going price stabilization program, especially on the meat and fuel prices.
Central bank credit to commercial banks has also significantly increased in early 2013, in line with the recent
turnaround of monetary policy stance. The outstanding liability of banking sector to the Bank of Mongolia more
than doubled to 1.1 trillion MNT over the first two months of 2013 from 405 billion MNT in December 2012. This
quantitative easing of the monetary authorities is implemented through two channels. Under the Price
Stabilization Program, the Bank of Mongolia has provided significant amount of loans to commercial banks at a
discounted terms over the recent months. Total credit of 230 billion MNT has been provided by February to
selected industries for this purpose since the program was launched in November 2012. The increased commercial
bank liability to the Central Bank also reflects increased liquidity supply to commercial banks, which was carried
out under the “Financial Intermediary Agreement” with the Government since February in order to stimulate
economic activities through increased supply of credit. According to the agreement, the Bank of Mongolia placed
twelve-month term deposits for a total amount of 850 billion MNT with commercial banks in February (400 billion
MNT) and March (450 billion MNT). Along with the policy rate cuts, the increased increase in monetary base may
have an adverse impact on the recent downward trend of inflation by stimulating aggregate demand. The
monetary authorities need to closely monitor the effect of loosening monetary policy on inflation and credit
growth to prevent likely additional inflationary pressure going forward.
Source: Mongolian Authorities, WB staff estimates
Money Supply has been steadily slowing down while reserve money supply has been volatile.
Figure 21: Money Supply (% change of outstanding stock)
As deposit growth slows, credit growth has also decelerated to a sustainable pace.
Figure 22: Growth of Bank Loan and Deposit (%, yoy)
Bank lending and deposit rates remain in double digits but deposit rates stay negative in real terms.
Figure 23: Real Interest rates and CPI inflation (%)
Monetary policy may have turned accommodative significantly in early 2013.
Figure 24: Policy rates and Central Bank Loans to Banks
0
200
400
600
800
1000
1200
7
8
9
10
11
12
13
14
Jan
-10
Mar
-10
May
-10
Jul-
10
Sep
-10
No
v-1
0
Jan
-11
Mar
-11
May
-11
Jul-
11
Sep
-11
No
v-1
1
Jan
-12
Mar
-12
May
-12
Jul-
12
Sep
-12
No
v-1
2
Jan
-13
Mar
-13
Central Bank Credit to Banks(RHS, billions MNT)
Policy Rate (LHS, %)

Mongolia Economic Update
22
Financial indicators indicate no signs of systemic risks to financial stability. However continuous vigilance on
potential risks remains important. Mongolia’s financial market is dominated by the banking sector (i.e., non-
banking sector accounts for less than 3 percent of total financial assets). With small and under-developed capital
market, only a small group of large banks remain a main conduit for corporate and individual financing. In 2012,
four commercial banks accounted for more than 75 percent of total banking sector loans: Khan (25.2 percent), TDB
(21.8 percent), Golomt (20.5 percent) and Khas bank (9 percent). Given the significance of the systemically
important banks in the financial system, continuous monitoring and supervision over them remain important.
Vulnerability to liquidity risks is gradually on the rise. Liquid assets to total assets ratio —an indicator to measure
liquidity risk— improved slightly from 23.4 percent at the end of 2011 to 23.9 percent in February, 2013. Despite
the recent improvement, the liquidity asset ratio has declined steadily from over 30 percent since 2010 when the
liquidity buffer had been strengthened. The liquidity assets ratio to short-term liability has also declined from 36.2
percent in the fourth quarter in 2011 to 34.2 percent in the same period last year. Loan to Deposit ratio reached
104 percent in February 2013, a significant increase from around 87 percent in December last year and from
around 70 percent in 2010 (Figure 25).
The Non-Performing Loan (NPL) Ratio has been declining since 2010. The ratio of NPL (bad loans plus principal in
arrears) to total loans outstanding fell to 5.8 percent at the end of 2012 from 7.2 percent a year ago. The
improvement was most noticeable in the agricultural sector that had been particularly affected by the severe
weather in 2009-10, with its NPL ratio among total outstanding loan dropping to 6.2 percent in the last quarter in
2012 from 19.1 percent a year ago (Figure 26). The total value of NPLs dropped from 330 billion MNT at the end of
2012 down to 305 billion MNT in February 2013 due to significant improvements in repayment of NPLs of two
failed banks: ‘Zoos’ and ‘Anod’.
High level of foreign currency deposit and increasing unhedged foreign currency loans remain sources of
vulnerability to the financial stability. At the end of 2012, foreign currency deposits constituted a quarter of total
deposits. While the ratio is lower than the pre-crisis level of over 30 percent, the high share of foreign currency
liability of banking sector is likely to constrain the capacity of the central bank to act effectively as a lender of last
resort in times of financial distress. In light of increasing local currency denominated loans driven by the recent
rapid economic growth, the financial supervisory authorities also need to pay attention to potential risk that could
be caused by significant currency mismatches between foreign currency liabilities and local currency assets of the
banking sector. Foreign currency deposits account for about 25 percent of net international reserves of Mongolia
in February 2013.
Source: Mongolian Authorities, WB staff estimates
Loan-to-Deposit ratio is on the rise, reaching over 100%. Figure 25: Liquidity Risk Indicators
Non-Performing Loans of banking sector are steadily falling. Figure 26: NPL to Total Asset Ratio (%)
10
15
20
25
30
35
60
65
70
75
80
85
90
95
100
105
110
Jan
-10
Mar
-10
May
-…
Jul-
10
Sep
-10
No
v-1
0
Jan
-11
Mar
-11
May
-…
Jul-
11
Sep
-11
No
v-1
1
Jan
-12
Mar
-12
May
-…
Jul-
12
Sep
-12
No
v-1
2
Jan
-13
Loan to Depost (%, LHS)
Liquidity Asset to Total Asset(%, RHS)
0
2
4
6
8
10
12
14
16
18
20
22
24
Dec-09 Jun-10 Dec-10 Jun-11 Dec-11 Jun-12 Dec-12
NPLs: AggregateNPLS: Private sectorNPLs: IndividualsPrincipal in arrears: Aggregate

Mongolia Economic Update
23
Box 4: Mongolia Deposit Insurance Reform
A new law on Bank Deposit Insurance was passed on January 10, 2013. This marks an important landmark in the development of Mongolia’s financial system, and a transition of the deposit insurance system from blanket guarantee to limited deposit insurance. The new deposit insurance system, once finalized and made fully operational, will manifest closer compliance with modern deposit insurance standards (Core Principles for Effective Deposit Insurance Systems), promoted by the International Association of Deposit Insurers (IADI). Blanket Deposit Guarantee
From 2008, Mongolia maintained a blanket deposit guarantee system whereby all deposits were guaranteed by the state regardless of their type and volume. Introduction of such blanket guarantee was prompted by the global financial crisis which also affected Mongolia to a certain extent. Two private banks failed and were taken over by the authorities in 2008-2009. Blanket deposit guarantee was considered to be a right instrument for preventing a potential deposit run on the entire banking system and a further disturbance in the market. The blanket guarantee was expected to be of a temporary nature, lasting at most four years. The law on blanket guarantee expired on November 25, 2012. The 2008 law which introduced blanket guarantee also prescribed an insurance premium to be paid by the banks to the Ministry of Finance. As of end 2012, however, only a small amount of the accrued premiums has been paid. There has been a dispute between some of the banks and the government on the payment of the remaining part of the premiums. The final settlement is yet to be reached. Moving to limited deposit guarantee scheme
The authorities earnestly started developing a concept for a new, modern limited deposit guarantee system in 2010. At that time, advisory services were solicited from multilateral financial institutions, including the World Bank, Asian Development Bank, and the European Bank for Reconstruction and Development to assist the Mongolian authorities with putting a concept in place, and drafting a new law and regulations. Mongolia opted to have a paybox-type bank deposit guarantee scheme (with some extended powers), whereby a deposit insurance agency would have as its primary mandate payout of insured deposits once an insured event – withdrawal of bank’s license – took place. Bank supervision and bank resolution mandates will remain with the Bank of Mongolia, the bank regulator.
The new law enacted in January 2013 prescribes establishment of a Deposit Insurance Corporation (DIC), which will serve as the national deposit insurance agency, with initial capital of MNT 100 billion, provided in equal shares by the state budget and the Bank of Mongolia. Deposit insurance will be limited to MNT 20 million (around US$14,400). Given a relatively small average deposit size8, this amount covers absolute majority – over 99% - of individual retail depositors. Based on 2011 data on the breakdown of bank deposits, the new insurance coverage would apply to around 31% of deposits by volume. The total amount of deposits have grown during 2012, therefore it is presumed that the new deposit insurance amount (MNT 20 million) will cover less than 30% of all deposits by volume, but will still be above the rule-of-thumb9 minimum 20% volume coverage. The new Bank Deposit Insurance law provides some extended powers to the DIC, such as ability to set risk-based premiums to individual banks, and provide financial support to a bank which assumes deposits of a failed bank. The DIC is also mandated to apply least-cost test in deciding on the amount of support to such assuming bank. These extended powers and some other provisions of the law will need to be further clarified in subsequent regulations. At this time, the core priority is to establish and staff the DIC, and develop relevant internal policies and regulations to empower its activities as a new essential element in Mongolia’s financial stability and safety net architecture. Source: The World Bank
8 Around 800,000 MNT in 2010
9 The Core Principles do not prescribe a preferred coverage level. However, the assessment methodology Handbook suggests
that limits should be set so that (i) the vast majority of small scale retail depositors are covered in full (removing the incentive to run) but (ii) a significant portion of the value of total deposit liabilities remains uncovered and exposed to market discipline. See for example FSB, 2012, “Thematic review on Deposit Insurance Systems: Peer Review Report”, and Ulrich H. Klueh & David S. Hoelscher & Michael Taylor, 2006, "The Design and Implementation of Deposit Insurance Systems", IMF Occasional Papers 251. The latter paper used the rule of minimum 80 percent of all accounts and 20 percent of volume.
Mongolia Economic Update
24
While Mongolia registered double-digit growth over the last two years, its vulnerability to external shock is
increasing along with its dependence on mineral resources. In 2013, mineral revenue is expected to account for
over 20 percent of total government revenue and the export share of mineral export will jump beyond 90 percent.
On the one hand, increasing dependence on mineral resources is an inevitable phenomenon given the weak
capacity of non-mineral sectors and the small size of the economy. If managed effectively, the vast amount of
mineral wealth could transform Mongolia into one of the most prosperous economies in the region in the long run.
However the blessing from the natural endowment does come with its challenges. Growing reliance on mineral
revenues makes the Mongolian economy more vulnerable to external shocks and abrupt disruption in the mineral
market.
Despite the strengthened fiscal institution (e.g., FSL, IBL), the fiscal management over the past two years
indicates that the fiscal policy framework is returning to the pro-cyclical pattern of the pre-crisis period. After a
slight surplus of 0.5 percent of GDP in 2010, the fiscal balance has been deteriorating considerably; fiscal balance
turned into a deficit of 4.8 percent in 2011 and further deteriorated to a thirteen-year record level of 7 percent in
2012. The deteriorating fiscal balance reflects rapid spending increase far exceeding the pace of revenue growth —
fiscal spending increased by 41 percent on average over the last two years while revenue grew by 27 percent.
Despite the spirit of the FSL encouraging prudent spending and fiscal saving, the fiscal deficit levels in 2011 and
2012 are even beyond the levels during the crisis period when the mineral prices collapsed.
In light of the rapid growth trend and inflation near double-digits, highly pro-cyclical fiscal policy management is
becoming a potential risk to stable and sustainable economic growth path. Potential fiscal risks include:
Vulnerability to a boom-bust cycle is increasing as a sufficient fiscal buffer is not present. As witnessed
during the 2008-9 period, sudden fluctuation of mineral prices would easily translate into serious fiscal
shock and downturn of the economy. As significant fiscal deficits continue to build up, capability of the
fiscal authorities to cope with sudden mineral market shock would be highly limited as there is not
sufficient saving to function as a fiscal buffer. Painful adjustment of spending would have to follow to
absorb the revenue shortage, which would lead to further contraction of the economy.
Rising public debt can turn into significant burden in the future. Public debt is rapidly rising in 2012 as
the large fiscal deficits have been financed by external or domestic borrowing. In particular, massive
external borrowing of over USD 2 billion in 2012 through the DBM and the Chinggis bond —equivalent to
20 percent of GDP— has a significant implication in terms of future fiscal obligation as those external
loans have to be eventually repaid or rolled over after five and ten years. At the time of maturity, the
large repayment burden could limit the fiscal space seriously as the fiscal revenue would need to be
diverted from other expenditures. Should the burgeoning trend of the fiscal deficit and public debt
continue, it would also likely have adverse impact on the future borrowing cost. Increased contingent
liability to guarantee off-budget financing vehicles including the DBM and PPP projects under Built-
Transfer scheme could also turn into significant fiscal burden in the future.
Rapid increase in fiscal spending is likely outpacing the government’s planning and implementation
capacity, and the production capacity of the economy. Making sure that spending results in a good road

Mongolia Economic Update
25
or power plant being built requires proper planning and sound construction. An infrastructure project
needs a realistic cost estimate; contracts need to be given in a transparent and competitive manner;
contractors should have the necessary skills and resources to do the job and has to be supervised to
ensure that the work is done properly. Right now none of these key links in the chain from spending to a
good new road or other infrastructure is working satisfactorily. Also, Mongolia is a small open economy
with limited skilled labor and intermediate goods (e.g., construction materials). Given this, rapid increases
in public investment beyond the production limit of an economy would likely drive up the costs of
production and lead to high inflation.
A significant challenge at this stage is to build a stronger consensus to shift the fiscal management paradigm
currently focused on “spending fast” toward one on “spending well”. It would require a more prudent fiscal
framework to prevent repetition of the past boom-bust cycle and to ensure that the expenditure grows at a
sustainable pace given the government’s spending capacity and the absorptive capacity of the economy. The
prudent and sustainable fiscal framework would begin by smoothing public expenditures over the mid-term
horizon, controlling the growth of spending to a manageable level, and start building up precautionary fiscal
saving. Examples of successful mineral revenue management in other countries underscore the importance of
precautionary savings in maintaining stable growth and achieving economic success over the medium and long
term (Box 4).
Public spending needs to be delinked from the short-term volatility of mineral revenues to the possible
extent. Urgent task will be to abide by the rules of the FSL without resorting to off-budget financing
scheme. The fiscal discipline of the FSL is strong and lays a foundation for prudent and effective
management of resource revenue. In 2013, the fiscal deficit needs to be kept close to the ceiling of the
FSL to a possible extent, through proper fiscal consolidation plan. Going forward, spending plan needs to
be adjusted to the reality of the limited capacity of the government and economy to spend well: (i) the
capacity of the government to effectively manage public investment projects and (ii) the absorptive
capacity of construction sector.
Sufficient amount of mineral resource needs to be saved, both as precautionary saving and to modulate
expenditure growth to the capacity to spend well. Mongolian economy is always exposed to the
possibility of sudden collapse of mineral market. Private sector credits are pro-cyclical in nature and it is
the role of fiscal buffer to cope with sudden shock from mineral market downswing. Key challenge would
be to overcome political pressures for spending now and growing expectations for growth dividends.
Precautionary saving is also an effective pro-poor strategy. The poor are the most vulnerable group in
times of economic distress. Fiscal saving can be utilized to strengthen social welfare measures to support
the poor and to maintain development expenditure in times of serious economic downturn.

Mongolia Economic Update
26
Box 5: Short story of Two Countries: How did they successfully save and use mineral revenues? Chile and Botswana have been internationally praised as two of the best examples of successfully overcoming the challenges of effectively managing their mineral resources against spending pressures. On March 20-21, an International Conference on Sovereign Wealth was held in Ulaanbaatar, co-hosted by the Ministry of Finance of Mongolia and the World Bank. In the Conference, cases of the two countries were introduced and the importance of prudent framework of fiscal management was underscored in resource dependent developing countries. Chile is another resource dependent country, producing about one-third of the world’s copper. Copper exports accounts for 55 percent of total export in 2011. Chile has a strong track record of fiscal discipline. The Fiscal Responsibility Law was adopted in 2006, providing a legal institution for the fiscal discipline. The FRL sets guidelines for computing the structural balance. The FRC also established rules for accumulating and managing fiscal resources and set up two sovereign wealth funds, the Pension Reserve Fund and the Economic and Social Stabilization Fund. The resources of two funds are invested abroad. According to the FRL, Chile accumulated significant fiscal saving during the boom years between 2004 and 2008. Fiscal surplus in 2006 and 2007 reached over 7 percent of GDP. In 2008 and 2010 amidst the global financial crisis, Chile actively spent the accumulated fiscal saving to counter the fiscal shock, by creating fiscal deficit up to over 4 percent of GDP. As a result, Chile was able to keep its annual growth rate at similar levels to the booming years prior to the crisis. Botswana is also a land locked small resource dependent country. It was one of the poorest countries with USD 284 of GDP per Capita and only 12 km of paved road after its independence in 1966. However, the country was able to sustain high economic growth for five decades through an effective management of fiscal resources from diamonds, now accounting for 80 percent of exports and about one-fifth of output. Fiscal policy in Botswana has been ensuring that current spending is financed only with non-mineral revenues while mineral revenues are either used to finance investment or saved in the Pula Fund, its sovereign wealth fund. Over time, the government of Botswana has accumulated large financial savings reaching over 10% of GDP during the mid-1980s and between 2007-08 periods in Pula fund. The accumulated saving was effectively used to finance budget deficits that successfully coped with the abrupt downturn of mineral market in 2002-3 and 2007-08 global crisis period. In 2011, its GDP per capita reached over USD 8,000.
Source: The World Bank; Macroeconomic Policy Frameworks for Resource Rich Developing Countries, IMF August 2012
Figure 27: Fiscal Balance to GDP (%): Chile’s Case
Source: WB, IMF
Figure 28: Fiscal Balance to GDP(%): Botswana’s Case
Source: WB SWF Conference, Botswana’s Case, Keith Jefferis (2013)
0
1,000
2,000
3,000
4,000
5,000
6,000
7,000
8,000
9,000
10,000
-6%
-4%
-2%
0%
2%
4%
6%
8%
10%
2000 2001 2002 2003 2004 2005 2006 2007 2008 2009 2010 2011 2012
Fiscal Balance to GDP(%)
Copper Price (US$/ton)

Mongolia Economic Update
27
Indicators 2009 2010 2011 2012 2013 f 2014f 2015f
Real Sector
Output, Employment and Prices
Real GDP (% yoy change) -1.3 6.4 17.5 12.3 13.0 11.5 8.1
Industrial production (% yoy change) -3.3 10 9.7 7.2 26.3 15.3 5.7
CPI Ulaanbaatar (% yoy change,
average) 1.9 14.3 9.4 14.2 11.5 9.0 8.0
Public Sector
Government expenditures (as % of
GDP) 35.5 36.6 45.1 43.9 41.2
… …
Government revenues (as % of GDP) 30.3 37.1 40.3 35.5 35.1 … …
Government balance (% of GDP) -5.2 0 -4.8 -8.4 -6.1 … …
Non-mineral govt balance -12.4 -10.0 -18.1 -19.5 -13.7 … …
Public Sector Debt (% of GDP) 46.6 45.3 51.7 … … … …
Balance of Payment
Exports of goods (US$ mn) 1,903 2,899 4,817.5 4,384.6 … … …
(% yoy change) -25 52.8 66.2 -9.0 … … …
Imports of goods (US$ mn) 2,131 3,278 6,598.4 6,738.9 … … …
(% yoy change) -32.3 53.8 101.3 2.1 … … …
Current account balance (US$ mn) -592.0 -886.7 -2,758.6 -3,215.3 … … …
(% of GDP) -12.9 -14.3 -31.0 -31.3 … … …
Foreign direct investment (US$ mn) 1,037.6 1,629.7 4,620.1 3,835.1 … … …
External debt (% of GDP) (2) 43.2 28.2 26.1 29.4 … … …
Gross official reserves, net (US$ mn) 1,328 2,288 2,457.1 4,090.7 … … …
In month of next year’s imports of g&s 4.0 4.2 4.9 5.8 … … …
Financial Markets
Domestic credit (% yoy change) -9.33 26.69 75.8 -7.5 … … …
Base policy rate (eop) 10.00 11.00 12.3 13.25 … … …
Exchange rate (MNT/USD, eop) 1,443 1,257 1,395.4 1,392.1 … … …
REER (real effective exch rate) (% yoy
eop, +app) -16.6 28.2 -5.6 8.0
… … …
Stock Market Top 20 index (2000=100,
eop) 1,229 2,931 4,059.0 3,443.9
… … …
Memo:
Nominal GDP (MNT bn) 6,591 8,414.5 11,087.7 13,944.2 17,172.7 … …
Source: Bank of Mongolia, National Statistical Office, Ministry of Finance, World Bank staff estimates.

Mongolia Economic Update
28
Mining in Mongolia
Mongolia is rich in mineral resources and has some of the world’s major mineral deposits including gold, copper,
uranium and coal. Geological data gathered since the 1920s and exploration to date has proven vast mineral
reserves, but only 15 per cent of the country has been fully mapped. There are over 6,000 deposits of around 80
different minerals discovered to date in Mongolia. Only 400 of these have been defined, and of this number
approximately 160 are currently being mined, and only about 17 per cent of the country is under exploration
license (Box 6). There are over 200 foreign-owned and joint venture companies currently operating in Mongolia.
According to the Mongolian stock exchange, mining companies accounted for 28% of the total companies listed on
the exchange in 201011
. In 2012, the mining sector employed approximately 19,217 people which was a 17.9%
increase compared with the number in 2010.
Mining generates mixed reactions in Mongolia, though it is increasingly bringing revenue and employment. The
dissatisfaction arises from the way the benefits and impacts are distributed, interruption to the traditional life
styles of Mongolians in the rural areas, as well as concerns about water which is scarce across country and in
particular in the Gobi region where major developments are taking place (Tavan Tolgoi coal and Oyu Tolgoi copper,
gold and molybdenum). The government maintains high share of ownership over strategic deposits.
For Mongolia it is critical to ensure that (i) the mining sector is developed in an environmentally and socially
sustainable way; (ii) the revenues from mining are efficiently collected and transparently managed to achieve
desired growth across all productive sectors; (iii) the resource curse is avoided through sound fiscal management,
planning and diversification of the economy; and (iv) mining contributes to the overall economic growth and
development agenda of the country, including infrastructure and power generation, and mobilization of
midstream, downstream and ancillary industry and business. Historically, the development of mineral resources
(or other natural resources, such as forestry) in developing countries in parts of Africa and Asia had little
correlation with reducing poverty. However, based on experience in such countries as Australia, Canada, the
United States, South Africa, several Gulf countries, Finland and others, it is important to recognize that positive
impacts on overall poverty levels are achievable with sound governance and resource management policies and
targeted programs to implement them. These countries triggered growth as resource-based economies, but
ultimately succeeded in achieving wider growth, diversification and poverty reduction through targeted
interventions and policies.
Box 6.Main mineral occurrences of Mongolia
Gold (Au). There are ten major gold bearing areas in Mongolia. Gold production grew significantly between 1990 and 2005, with 5.9 tonnes of gold produced in 2005. Copper and Molybdenum (Cu-Au-Mo). There are three belts across Mongolia, located in the Altai, northern Mongolia, and southern Mongolia. Current production mainly through the Erdenet. The development of the Oyu Tolgoi deposit will significantly increase Mongolia’s share of world production as a major copper producer.
10
This sectoral focus was prepared by Ekaterina Mikhaylova, Senior Mining Specialist, The World Bank. Analysis of the current mineral sector cycle includes feedback from the Annual Mining Indaba in Cape Town, February 2013. 11
National Statistical Office of Mongolia, 2012, p. 30; Mineral Resources Authority of Mongolia, 2011b, p. 23; World Bank, The, 2011, p. 23)

Mongolia Economic Update
29
Fluorspar (CaF2). There are more than 600 deposits and occurrences of fluorite in Mongolia across the three major areas, including, north Mongolia, trans-Mongolian, and south Mongolian fluorite provinces. Trans-Mongolian province has the largest reserves and is the most actively mined. Mongolia is the 5
th largest producer with 4 per cent of the world’s total production,
producing both acid and metallurgical grades. Coal (Co). There are numerous occurrences of coal across central and southern Mongolia, with the Ulaannuur Basin considered the richest. Since 2004 export opportunities have increased with the discovery of high quality, coking coal deposits at Tavan Tolgoi, Ukhaa Khugag, Bortolgoi, Ovoot Tolgoi, Khoshoot and Altai Nuurs. Estimated deposits are 160 billion tonnes. Rare Earths (REE). Commercially viable quantities are mainly found in the Altai, north Mongolian Hentii, Hangai, southeast Mongolian, and south Mongolian provinces. The most common and economically viable rare earth metals are: tantalum, niobium, yttirium, thorium and zircon. Uranium (Ur). The most commercially viable uranium deposits are found in the Dornod, Gurvanbulag, Mardai regions in eastern Mongolia and the Kharaat region of southern Mongolia. Estimated reserves to be 1.3 Mt, of which 62 Mt are proven. Past uranium mining has taken place at the Mardai open pit mine from 1989-1993, but this mine has since closed. Source: Mdendi Report, Mineral Resource Authority of Mongolia
Global trends in mining sector affecting Mongolia
Over the past two decades the world has witnessed an emergence of a so-called “mining super-cycle”. With strong
industrial growth in Asia, Latin America, and some Eastern European countries, demand for metals and energy
minerals keeps growing; technological advancements have boosted demand for virtually all elements of the
periodic table; gold maintained its counter-cycle nature to the financial markets and have shown unprecedented
price increases.
Historically, higher commodity prices triggered a so-called “race to the bottom” among countries competing to
attract mineral investment. However, the current super-cycle can be characterized by more sophisticated and
holistic approaches. Over the past two decades virtually all new mining jurisdictions passed modern mining laws
and adopted competitive fiscal regimes for mining (Box 7). They have adopted principles of the Extractive
Industries Transparency Initiative (EITI) to improve transparency of revenues. They have carried out country-wide
geological, geophysical and geochemical surveying and mapping to reduce geological risks for the investors, as well
as have set up and/or strengthened specialized entities to manage mining cadastre and geodata. While in the
1990s functioning mining sector governance in a new mining jurisdiction was rather an exception, since 2000s it
became a requirement in particular for countries competing for mining megaprojects. Host governments are
paying much more attention to the “life beyond the life of the mine”, including setting up revenue management
mechanisms, facilitating the development of shared infrastructure, and investing into human capital and economic
diversification.
Box 7.Characteristics of the current global mining sector
Commodity markets behavior tends to be volatile
Mining companies have been enjoying several years of elevated profitability but are facing a quadruple squeeze induced by the mineral commodity super-cycle through cost escalation (labor and input costs), demanding shareholders (elevated earnings-per-share requirements), mounting host country demands (taxes and equity) and increased expectations by mining affected communities.
With the quadruple squeeze taking place, even a modest softening of mineral prices causes a sharp re-appraisal of capital allocations between greenfield and brownfield projects. High quality mineral deposits are becoming increasingly difficult to find and miners have to move into more challenging environments to access them. However, with higher risks and reduced margins, exploration is usually the first to be cut back, next are the projects in the countries where security of tenure may be weak. This leaves less risky projects, including expansion of existing operations, taking priority.
Source: Word Bank Staff, report on Mining Indaba, Cape Town, February 2013

Mongolia Economic Update
30
Global experience highlights the importance to balance a fair distribution of benefits and risks between the state,
the investor, and the communities. The competition between the countries and among the major mining houses
to maintain market share remains fierce and having an excellent resource potential nowadays does not guarantee
its development in the near to medium term. Going forward, the duration of the current super-cycle depends on
resumption of more certain demand as well as the degree of cut-back in near term mineral production induced by
the current uncertain outlook. Barclays Capital projects mineral output growth globally to remain robust before
demand growth really picks up, leading to softer mineral prices (Box 8). Barclay’s projection is based on the
analysis that the mining projects that are being held back are mainly long-lead time projects, whereas mining
houses are still keen to generate cash from near-term incremental output growth through expansions and shovel-
ready projects.
Box 8. Current Key Commodities Behavior
Gold: prices have remained very firm, sufficient to have protected margins even at a time of considerable cost escalation.
Copper: while being more volatile than gold prices, copper prices nonetheless continue to reflect difficulty in new supply
matching robust demand.
Bulk Minerals: prices for the bulk minerals, especially iron ore and coal, have been especially sensitive to developments in
the Chinese economy and the situation now involves the sorting out of more durable projects. Large, infrastructure
dependent and long-lead time projects in more risky/challenging environments may give way to incremental expansions at
existing mines with access to infrastructure in better understood environments.
Source: Word Bank Staff, report on Mining Indaba, Cape Town, February 2013
The big question then is whether any incremental cash generated by companies in the near term is allocated to
higher costs, dividend pay outs, government tax demands, community programs or to new mine development. If
capital allocations to new mines give way to the other demands, new mine investments may take longer to
materialize than generally thought. Notwithstanding the complexities today, over the longer term the outlook for
mineral sector growth is strong and underlying demand trends based on the increasing resource intensity of global
growth, marked by industrial development in emerging economies, are likely to support high commodity prices
over the longer run. This is a thesis supported by McKinsey (Resource Revolution 2011) and Chatham House
(Resource Futures 2012). Mineral endowment, coupled with exhaustion, scarcity and barriers to access
elsewhere, will continue attracting investment.
What it means for Mongolia?
A lot will depend on the business environment and infrastructure solutions for bulk commodities. With the new
minerals law under preparation in 2013, it is likely that many investors will wait for its passage before making
investment decisions. With the freeze of issuance of new exploration licenses since 2010 accompanied by
prohibition of transfer of existing licenses, exploration activities are taking a strong hit which will ultimately delay
new projects going forward. After favorable geology, security of tenure is ranked as one of the most important
factors for a mining operation to proceed, and as such functioning mining cadastre and transparent and non-
discretionary licensing regime must be in place to maintain sustainable sector development and growth. While
Mongolia’s location next to the major market, its excellent mineral endowment, and overall stability give it a
strong advantage, the ability of investors to make and expatriate profits will be a dominating criterion in
exploitation of resources going forward. Existing advanced operations of scale of Oyu Tolgoi or Tavan Tolgoi will
in all probability go forward. However, the risk of many greenfield projects being dropped or put “in reserve” until
business environment becomes more favorable should not be underestimated. For domestic mining companies,
capital and capacity will most likely remain bottlenecks for years to come.