Embed Size (px)
Citation preview

Document of The World Bank
Report No: 25907
IMPLEMENTATION COMPLETION REPORT(IDA-29380)
ON A
CREDIT
IN THE AMOUNT OF SDR 16.90 MILLION(US$ 24.20 MILLION EQUIVALENT)
AND A
GLOBAL ENVIRONMENT FACILITY GRANT
IN THE AMOUNT OF SDR 4.2 MILLION(US$ 5.9 MILLION EQUIVALENT)
TO
THE DEMOCRATIC SOCIALIST REPUBLIC OF SRI LANKA
FOR AN
ENERGY SERVICES DELIVERY PROJECT
June 4, 2003
Energy Sector UnitSouth Asia Region
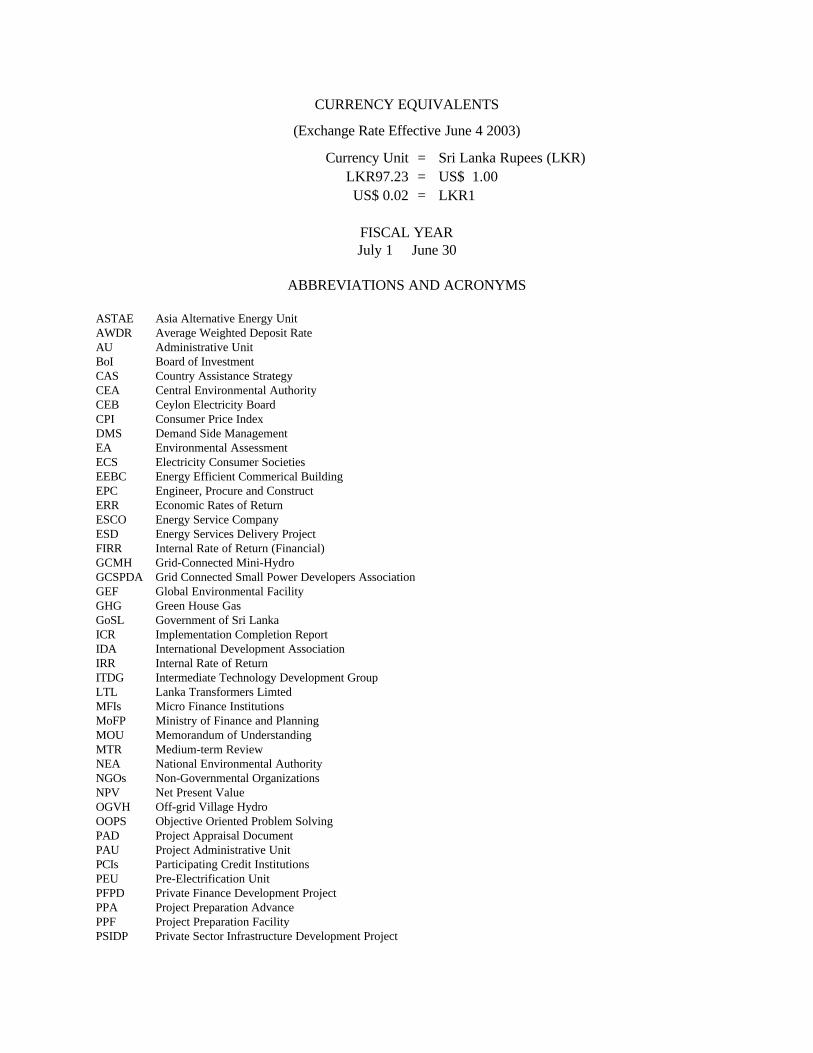
CURRENCY EQUIVALENTS
(Exchange Rate Effective June 4 2003)
Currency Unit = Sri Lanka Rupees (LKR) LKR97.23 = US$ 1.00
US$ 0.02 = LKR1
FISCAL YEARJuly 1 June 30
ABBREVIATIONS AND ACRONYMS
ASTAE Asia Alternative Energy UnitAWDR Average Weighted Deposit RateAU Administrative UnitBoI Board of InvestmentCAS Country Assistance StrategyCEA Central Environmental AuthorityCEB Ceylon Electricity BoardCPI Consumer Price IndexDMS Demand Side ManagementEA Environmental AssessmentECS Electricity Consumer SocietiesEEBC Energy Efficient Commerical Building EPC Engineer, Procure and ConstructERR Economic Rates of ReturnESCO Energy Service CompanyESD Energy Services Delivery ProjectFIRR Internal Rate of Return (Financial)GCMH Grid-Connected Mini-HydroGCSPDA Grid Connected Small Power Developers AssociationGEF Global Environmental FacilityGHG Green House GasGoSL Government of Sri LankaICR Implementation Completion ReportIDA International Development AssociationIRR Internal Rate of ReturnITDG Intermediate Technology Development GroupLTL Lanka Transformers LimtedMFIs Micro Finance InstitutionsMoFP Ministry of Finance and PlanningMOU Memorandum of UnderstandingMTR Medium-term ReviewNEA National Environmental AuthorityNGOs Non-Governmental OrganizationsNPV Net Present ValueOGVH Off-grid Village HydroOOPS Objective Oriented Problem SolvingPAD Project Appraisal DocumentPAU Project Administrative UnitPCIs Participating Credit InstitutionsPEU Pre-Electrification UnitPFPD Private Finance Development ProjectPPA Project Preparation AdvancePPF Project Preparation FacilityPSIDP Private Sector Infrastructure Development Project

QAG Quality at EntryRERED Renewable Energy for Rural Economic Development ProjectSDR Special Drawing RightsSEEDS Sarvodaya Economic Enterprises Development ServicesSHS Solar Home SystemsSIA Solar Industry Generator ControllerSLBDC Sri Lanka Business Development CenterSLR Sri Lanka RupeesSPPA Small Power Purchase AgreementSPPT Small Power Purchase TariffTA Technical AssistanceTOR Terms of ReferenceVAT Value-added TaxVHS Village Hydro SystemWASP Wien Automatic System Planning Package
Vice President: Mieko NishimizuCountry Director: Peter HarroldSector Manager: Penelope Brook
Task Team Leader: Chandrasekar Govindarajalu

SRI LANKAENERGY SERVICES DELIVERY PROJECT
CONTENTS
Page No.1. Project Data 12. Principal Performance Ratings 13. Assessment of Development Objective and Design, and of Quality at Entry 24. Achievement of Objective and Outputs 45. Major Factors Affecting Implementation and Outcome 126. Sustainability 147. Bank and Borrower Performance 158. Lessons Learned 179. Partner Comments 2310. Additional Information 23Annex 1. Key Performance Indicators/Log Frame Matrix 24Annex 2. Project Costs and Financing 26Annex 3. Economic Costs and Benefits 28Annex 4. Bank Inputs 44Annex 5. Ratings for Achievement of Objectives/Outputs of Components 46Annex 6. Ratings of Bank and Borrower Performance 47Annex 7. List of Supporting Documents 48

Project ID: P010498 Project Name: ENERGY SERVICES DLVYTeam Leader: Chandrasekar Govindarajalu TL Unit: EASEGICR Type: Core ICR Report Date: June 4, 2003
1. Project Data
Name: ENERGY SERVICES DLVY L/C/TF Number: IDA-29380Country/Department: SRI LANKA Region: South Asia Regional
Office
Sector/subsector: Renewable energy (96%); Power (4%)Theme: Climate change (P); Rural services and infrastructure (P); Other
financial and private sector development (P); Civic engagement, participation and community driven development (P)
KEY DATESOriginal Revised/Actual
PCD: 06/08/1994 Effective: 07/22/1997Appraisal: 06/24/1996 MTR: 04/03/2000Approval: 03/18/1997 Closing: 12/31/2002
Borrower/Implementing Agency: GOSL/MOF; GOSL/CEB; GOSL/PVT SCTROther Partners:
STAFF Current At AppraisalVice President: Mieko Nishimizu Mieko NishimizuCountry Director: Peter C. Harrold Mariana TodorovaSector Manager: Penelope Brook Per LjungTeam Leader at ICR: Chandrasekar Govindarajalu Loretta SchaefferICR Primary Author(s): Chandrasekar Govindarajalu
2. Principal Performance Ratings
(HS=Highly Satisfactory, S=Satisfactory, U=Unsatisfactory, HL=Highly Likely, L=Likely, UN=Unlikely, HUN=Highly Unlikely, HU=Highly Unsatisfactory, H=High, SU=Substantial, M=Modest, N=Negligible)
Outcome: S
Sustainability: L
Institutional Development Impact: H
Bank Performance: S
Borrower Performance: HS
QAG (if available) ICRQuality at Entry:
Project at Risk at Any Time: No

3. Assessment of Development Objective and Design, and of Quality at Entry
3.1 Original Objective:Project Development Objectives: In order of importance, the project objectives were to: a) Promote the provision by the private sector, NGOs and cooperatives of grid-connected and off-grid energy services using environmentally sustainable renewable energy technologies; b) Strengthen the environment for Demand Side Management (DSM) implementation; and c) Improve public and private sector performance to deliver energy services through renewable energy and DSM.
Global Development Objectives: To mitigate the impact of Green House Gas (GHG) emissions by overcoming barriers to renewable energy and energy efficiency market development
The project development objectives were consistent with the energy sector assistance outlined in the CAS: Report No.15633-CE, Board date May 21, 1996. Specifically, three CAS objectives supported by the ESD Project were (i) environmentally sustainable energy development; (ii) promoting private sector delivery of energy services; and (iii) enhancing efficiency in the power sector. At the time of appraisal, public sector energy investments in Sri Lanka were inadequate to meet the rapidly growing demand. Energy shortages were causing almost daily power cuts in 1996 and this underscored the need for new generating capacity and improved efficiencies. Since a sizeable part of the population (about 48%) was without access to the grid, the possibility of their being served in the near future through the conventional system was nearly non-existent. This project therefore was prepared in response to the need for increased access to electricity in rural areas. The guiding principle was to initiate innovative approaches that overcame the typical constraints of grid expansion and inefficiencies of a public sector approach. While this project was designed to meet the need of small rural systems of below 5 MW capacity, a parallel IDA operation, the Private Sector Infrastructure Development Project (PSIDP)-- Cr. 2880-CE was designed at same time to support larger generation projects.
3.2 Revised Objective:The Development Objectives were not revised
3.3 Original Components:
ESD Credit Program Component. This component was designed to provide support for medium and long-term financing to private sector firms, NGOs and cooperatives for renewable energy investments. Specific types of energy technologies envisioned included solar home systems (SHS) and off-grid village hydro (OGVH) projects as well as grid-connected mini-hydro (GCMH) projects. Under the credit program design, the Ministry of Finance and Planning (MOFP) would onlend proceeds of the credit component to eligible Participating Credit Institutions (PCIs) at the Average Weighted Deposit Rate (AWDR), which would in turn, onlend these proceeds, along with complementary financing out of their own resources, to eligible sub borrowers at market rates and terms.
In addition to the IDA credit, the grant co-financing from Global Environment Facility (GEF) was available through PCIs to developers of SHS and OGVH sub-projects to cover feasibility or business planning costs as well as for one time capital cost buydown. The program was to be administered based on a set of operating guidelines agreed by the GOSL and IDA. Grant funds were also available to the Administrative Unit (AU) for off-grid promotional efforts, verification and consumer protection activities.
The ESD credit program component has been central to the design of the project being the main channel to encourage private sector provision of energy services. As lack of access to long-term financing was the key
- 2 -

barrier to private sector investments, the credit program design was appropriately targeted at meeting project objectives. The credit program design, including on-lending arrangements were modeled after the successful Private Finance Development Project (PFDP-- Cr. 2484-CE) and therefore, built on a good track record. In particular, the following features of design are noteworthy; (a) choice of direct on-lending to PCIs through an Administrative Unit (AU) arrangement rather than an on-lending arrangement through an Apex financial institution; (b) project administration by a private entity (DFCC bank) on contract to the government. These features had been successfully used in the PFDP project, and therefore a reasonable design choice for the ESD project; and (c) The onlending terms for PCIs and eventual borrowers reflect market conditions. The AU was established within one of the PCIs, the DFCC Bank, following the practice established by the PFDP project. DFCC bank is one of the two premier private sector development finance institutions in Sri Lanka. The decision to use DFCC Bank as the administrative unit was taken by the Government in consultation with the World Bank and other interested institutions. The use of one institution as both a PCI and the AU required the creation of a “Chinese wall” between the AU and the lending operations at the PCI. This prudent design was endorsed by the other PCIs. Being part of an established finance institution, the AU started with the advantage of being familiar with the prevailing banking regulations and procedures. Its initial staffing was carried out in a manner that ensured adequate capacity to deal with the administration of the IDA credit and GEF grant.
Pilot Grid-Connected Wind Farm Component. This component intended to pilot the feasibility of small-scale wind power generation projects in Sri Lanka from a technical and commercial standpoint. The Ceylon Electricity Board (CEB) implemented a 3-MW pilot wind farm project, based on previous studies that indicated a significant wind potential. The pilot was designed to obtain technical know-how and long-run economic potential of wind power in Sri Lanka and to assess the scope for private sector participation. The key design choice of the pilot wind farm component was selection of CEB as the implementing agency. This choice was reasonable because: (i) CEB was the only entity positioned to mange the risk of new technologies such as Wind ( It is useful to note that previous in-country experience relating to implementation of SHS, village hydro and small hydro projects allowed for a financial intermediation design for those technologies), and (ii) Pricing for a private supplier of wind energy would have been difficult given the lack of prior benchmarks.
Capacity Building Component. This component provided training and technical support in the area of renewable energy and energy efficiency for the different stakeholders and implementing entities in the public and private sector. The intended beneficiaries were CEB and energy service entrepreneurs. The CEB had the institutional structures in place in the form of a Demand Side Management (DSM) Cell and the Pre-Electrification Unit (PEU) that suited the implementation of this component. The design of this sub-component was adequate as the institutional suitability and expertise were available at CEB to absorb this technical assistance. Previous studies had indicated the latent market demand for such services and CEB was well positioned to develop this expertise and reach out to other stakeholders.
3.4 Revised Components:Project components were not revised
3.5 Quality at Entry:Quality at entry is considered satisfactory for the following reasons: (a) For the grid connected mini-hydro sub-projects, an enabling pricing and contract mechanism was in place. These included the small power purchase agreement, non-negotiable tariff and interconnect specifications for small power producers; (b) A sound pipeline of mini-hydro, village hydro, and solar home system projects totaling over US$ 58 million in project costs had been identified for financing; (c) Broad community participation was evident from the fact that more than 30 villages requested assistance for preparing village hydro projects in the range of 1.5
- 3 -

to 60 kW s under the GEF Project Preparation Advance (PPA).
With respect to the credit program quality at entry is evident from the following (a) the operating guidelines were in place; (b) PCI eligibility criteria were established; (c) GOSL was in advanced stages of discussions with several PCIs.
With respect to the Wind farm, readiness is demonstrated from the fact that the CEB had prepared the feasibility study and the bid package utilizing the IDA Project Preparation Facility (PPF) on the basis of which the ICB process was ongoing. CEB had also completed preparatory studies for DSM related work.
Since the project was appraised by June 1996 and became effective on July 22, 1997, it preceded the introduction of the Bank’s LACI guidelines. Since the project preceded LACI, no formal financial management was conducted at the appraisal stage.
4. Achievement of Objective and Outputs
4.1 Outcome/achievement of objective:The project's set of development objectives was fully achieved and overall project outcome is satisfactory.
(a) Promote the provision by private sector, NGOs and cooperatives of grid-connected and off-grid energy services using environmentally sustainable renewable energy technologies. The ESD project created an enabling environment for private sector participation in grid-connected renewable energy projects by facilitating development of a Small Power Purchase Agreement (SPPA) and by channeling long term credit through licensed commercial Banks and licensed specialized Banks. Private sector participation in off-grid renewable energy development was stimulated by the participation of Micro Finance Institutions (MFIs) in the credit program. In particular, participation of MFIs was instrumental in achieving increased penetration of solar home systems (SHS). The implementation of private sector renewable energy projects has created a vibrant industry of suppliers, developers, consultants and trainers. Today there are 11 mini-hydro developers, 4 major solar companies and about 12-15 village hydro developers as compared to 1 mini-hydro developer, 2-3 fledgling solar dealers and 1-2 village hydro developers at project appraisal. In addition, at the village level, there are nearly 80 functioning electricity consumer societies. The success of the pilot wind farm has generated considerable private sector interest and CEB recently launched a bid solicitation for a 22 MW wind power project. The collective experience has created a dynamic renewable energy industry with significant local expertise, minimizing the need for expatriate consultants. Having achieved success in the domestic market, Sri Lankan mini-hydro developers are now looking to overseas markets in Asia and Africa and local renewable energy consultants have began undertaking regional assignments to share their experience.
(b) Strengthen the environment for Demand Side Management Implementation. Through Technical Assistance support to the CEB and the private sector stakeholders, the project has also strengthened the environment for the implementation of DSM projects as well as built private sector capacity in the delivery of energy efficiency and renewable energy services. Completion of the first national load research program under the project is notable in this regard as it helped in identification of impacts of different classes of consumers and appliances on the system peak demand (details available at website http://www.ceb.lk). Evaluation of the ongoing energy efficient lighting program helped CEB build capacity in the area of DSM program evaluation. The associated technical training also helped refine CEB’s audit programs. During the course of the project, CEB also led the preparation and issuance of energy efficiency building codes for voluntary adoption by architects, builders and property developers
- 4 -

(c) Improve public and private sector performance to deliver energy services through renewable energy and DSM. The first Energy Service Company (ESCO), initially established as a division within Lanka Transformers Limited (LTL), also came into being during the course of project, benefiting from the capacity building efforts under the project and following-up on the success of this company, 2-3 new companies are also now providing energy efficiency services. The pre-electrification unit at the CEB helped increase awareness and build renewable energy project implementation capacity in its area offices as well as private sector and NGOs through regular training programs.
(d) The global objective of reducing carbon emissions were fully achieved. The project will result in reducing carbon emissions by some 514,000 tons (including the impact of mini-hydro projects)over the life of sub-projects, compared to the Project Appraisal Document (PAD) estimates of 140,000 tons (which excluded minihydro)
4.2 Outputs by components:ESD Credit Program: The outputs achieved under the various sub-components are discussed below.
(a) Mini-Hydro Development: This industry was virtually non existent at the beginning of the project and only about 1 MW of privately owned mini-hydro capacity was available in 1997. As part of the ESD project, 31 MW were installed through 15 sub-projects as against a target of implementing 21 MW of grid-connected mini-hydro projects. About six serious private-sector mini-hydro developers now in operation are planning more sub-projects. The costs of development have also come down, enabling additional project development. As a against appraisal estimates of US$ 1030/kW of installed capacity, average costs of US$ 963.5/kW were achieved.
(b) Solar Home Systems: The Solar industry was at a nascent stage when the project became effective, with 2-3 small operations (Solar Power and Light, Sarvodaya, RESCO) selling roughly 20-30 systems/ month in 1998. The ESD project has catalyzed the market for SHS and the average annual sales industry sales were about 850 systems/month in 2002, achieved by 4 companies (Shell Solar, Access Solar, SELCO and Alpha Thermal). Cumulatively, compared to a revised target of 15,000 SHS installations, 20,953 systems were installed under the ESD project. The initial target was 30,000, but that was revised at mid-term due to the slow market development in the initial stages of the Project. The actual average costs are comparable to the appraisal estimates of about US$ 11/Wp (total installed system costs). However, market prices have declined slightly to about US$ 10 /Wp today.
(c) Village Hydro Systems: The ESD Project has supported the installation of 350 kW of village hydro systems serving 1,732 beneficiary households. This result exceeded the original ESD target of developing 250 kW in capacity, but was lower than the 2,000 rural households anticipated at appraisal. Although the capacity target was exceeded, lower number of households benefited due to possible underestimate of household demand. The appraisal estimate was 100 W per household but in practice the demand is found to be to about 200 W/household. As against a targeted output of implementing 20 systems, a total of 35 systems were implemented during the course of the project. A further 49 projects are at various stages of completion and have been transferred to the follow-on Renewable Energy for Rural Economic Development Project (RERED). These projects were approved given the importance of maintaining the momentum of village hydro market take off. The completed project costs show an average capital cost of $2,060/kW. This is comparable to the economic capital cost estimated at appraisal of $2,023/kW.
Pilot Wind Farm: The pilot grid-connected wind farm component was completed in February 1999 and certified in May 2000 (see website http://www.ceb.lk for detailed information). Despite a commissioning delay of 9 months, CEB has logged 31 months of operating experience by the time of project closing. The
- 5 -

plant consists of five 46-meter towers with 600 kW turbines designed to supply a total annual capacity of about 4.5 GWh. Total economic project cost amounted to US$1,175/kW, which is acceptable for a first grid-connected wind farm operation in a country and compares to the expected estimates at appraisal.. The CEB continues to monitor and record operational data from the wind farm and learn from this experience the issues that must be addressed for integrating non-dispatchable and intermittent renewable power. The successful implementation and operation of the wind farm has catalyzed significant interest among private developers looking to develop private power projects.
Capacity Building:
The Capacity-building component was programmed to be carried out in the CEB through its Pre-Electrification and Demand-side Management units.
In the CEB Pre-electrification unit (PEU), the capacity building program enhanced in-house expertise in off-grid project preparation and helped facilitate and promote technically and economically viable renewable energy subprojects as part of the ESD credit program. It also enhanced the ability of PEU staff to train staff from CEB's area offices, the private sector, and NGOs in the areas of off-grid renewable energy project design and development. This broad objective was met by the PEU by actively engaging in: (a) Preparation of materials describing off-grid electrification options for training of stakeholders including CEB staff, Pvt. sector and NGOs; (b)Training of CEB area staff in disseminating information and promotion of off-grid electrification options. In total 26 programs were held with the participation of 748 officers from CEB, provincial government, private sector, and NGOs; (c) Coordination between CEB and off-grid project developers on CEB rural electrification plans including indication of areas not likely to receive grid service in the near term and (d) Preparation and dissemination of a guide for practical implementation of grid interconnection /integration requirements to facilitate mini-hydro development. There was some delay in executing the non-dispatchable power source modeling and planning study. This has now been incorporated under a more comprehensive system study to be financed by the follow-on RERED project.
The capacity building in the CEB Demand Side Management (DSM) branch consisted significantly of two technical assistance packages: (a) Implementation of a Load Research Program and a DSM strategy and (b) Design and implementation of a Code of Practice for Energy Efficient Commercial Buildings. Under (a), the first National load research program was completed and the quality of the CEB DSM programs were enhanced. Specifically with respect to the CEB DSM/EE program, energy audit skills were developed to enable staff prepare investment grade audits and DSM program monitoring and evaluation skills enhanced by an evaluation of CEB's ongoing energy efficient lighting program. Under (b), CEB took the lead in the development and implementation of energy efficient building codes through an extensive stakeholder consultation process including architects, equipment manufacturers, NGOs, and engineering consultants.
4.3 Net Present Value/Economic rate of return:Credit Program:
Mini-Hydro sub-component: Table 1 shows the comparisons of ERR and FIRR at appraisal and as achieved to date. In order to preserve the confidentiality of the cost information, the achieved values are based on a representative project whose costs and performance reflect the industry average (capital costs of 1025$/kW, 43% plant factor).
- 6 -

Table 1: Summary Assessment, Mini-Hydro
Appraisal (1) AchievedEllaPitiya Ella Generic Project
ERR 18% 26%FIRR 13% 24%(1) GEF, Republic of Sri Lanka, Energy Service Delivery Project, Project Document, February 1998.
Both the achieved ERR and FIRR are significantly above that estimated at appraisal, notwithstanding that CEB’s announced avoided cost tariff are likely underestimates of the actual avoided cost.
Village Hydro Sub-component: Table 2 shows the comparisons of ERR and FIRR at appraisal and as achieved to date. The achieved ERR is significantly greater than that estimated at appraisal (the achieved FIRR could not be calculated due to unavailability of information)
Table 2: Summary Assessment, Village hydro
Appraisal (1) Achieved(benefits at
avoided costs only)
Achieved(with
consumer surplus
benefits)EconomicERR (without GEF) 12% 18 54Costs (NPV at 12%), $Usmillion 23400Benefits (NPV at 12%), $Usmillion 23316Net benefit, $Usmillion -684ERR (with GEF grant) 22 61Financial (to VHS)FIRR 22% *Costs (NPV at 12%), $Usmillion 17,487 *Benefits (NPV at 12%), $Usmillion 26,633 *(1) GEF, Republic of Sri Lanka, Energy Service Delivery Project, Project Document, February 1998. * not possible to estimate actual FIRR due to unavailability of information.
The achieved ERR is greater than that estimated at appraisal for two main reasons. First, capacity factors are significantly greater in practice than as estimated at appraisal, a consequence of the design approach followed by the leading consulting firms and developers which calls for systems to be sized on the basis of the available average dry season flow. Second, expenditures for kerosene and battery prior to electric service have increased significantly since 1996 as a consequence of real income gains (and by more than the CPI), and consequently the willingness to pay for electric service is higher. Economic returns are even higher when additional consumer benefits are taken into account (based on estimates of the demand curve for the first tranche of high-valued electricity used for lighting and TV viewing, as verified for SHS beneficiaries).
Solar Home Systems sub-component: Table 3 shows the comparisons of ERR and FIRR at appraisal and as achieved to date. The NPV values at appraisal are converted to a per household value
1.
For the FIRR, it is not possible to determine the achieved financial returns to the dealers, since the solar
- 7 -

companies are unwilling to divulge information on their margins and returns. However, the strong private sector interest in the SHS programme suggests their equity returns are likely to be at least 20%.
Table 3: Summary Assessment, SHS
Appraisal(1) AchievedEconomicERR(without GEF) Not shown 31%Costs (NPV at 12%), $US. 603 650Benefits(NPV at 12%), $US 610 810ERR(with GEF grant) 12% 42.6%Financial (for NGO subproject)FIRR 19% Cannot be
calculated, likelyto be 20%+
Costs (NPV at 12%), $US 566Benefits(NPV at 12%), $US 638
(1) GEF, Republic of Sri Lanka, Energy Service Delivery Project, Project Document, February 1998
_____________________________
1 i.e. The values are divided by the 2,200 homes assumed to be served by the subproject.
- 8 -

The achieved ERR is significantly higher than estimated at appraisal because we use the gain in consumer surplus to capture the observed willingness to pay for SHS that is far in excess of the replacement costs of kerosene and battery charging equipment.
Wind Farm Component: Table 4 shows the comparisons of ERR and FIRR at appraisal and as achieved to date. The achieved ERR and FIRR are based on the assumption that the long-term average capacity factor is the average achieved to date.
Table 4. Summary Assessment, Wind Farm
Feasibilitystudy(1)
Appraisal(2)
Achieved
Machine configuration 13 x 225kW 13 x 225kW 5 x 600kWEconomicERR(without GEF) 7.5% 9.8% 0.8%ERR with GEF 11.4% 14% 3.9%Costs (NPV at 12%), $USm 2.5 2.5Benefits(NPV at 12%), $USm 2.9 1.5Net benefit,$Usm 0.4 -1.0FinancialFIRR 11% 0.9%Costs (NPV at 12%), $USm 2.9 2.6Benefits(NPV at 12%), $USm 2.8 1.5
(1) RLA Consulting, Feasibility Study for a 3MW Pilot Project in Sri Lanka, Report to CEB, September 1996(2) GEF, Republic of Sri Lanka, Energy Service Delivery Project, Project Document, February 1998.
The achieved ERR is significantly below that estimated at appraisal, but is based on 2-3 year wind data which is not necessarily indicative of the long-term average. The long-term average at Hambantota (1986-1995) is 5.74 m/s, as opposed to the actually achieved average of 5.15 m/s at site (from startup to February 2003). Despite a satisfactory operating experience, and capital and operating costs that are essentially the same as those estimated at appraisal, the low ERR is a consequence of the achieved capacity factor, which is substantially below that assumed at appraisal: this can be attributed to three factors. First, wind speed measurements show actual winds speeds to have been significantly lower than the estimates made by the various bids to supply the wind turbines. Second, the best site selected for the wind farm at the time of feasibility study could not be utilized due to concerns raised by environmental NGOs (the site was close to a wildlife reserve). The second best site could also not be used because of objections from the Sri Lanka Air Force. And third, it appears that the turbine power curve assumptions made by the feasibility study could not be matched by the equipment actually offered at time of tender.
4.4 Financial rate of return:The financial analysis for the small hydro, solar home system and wind components has been included in the previous section. Overall, the renewable energy business in Sri Lanka has yielded sound financial returns to the investors, both service providers and beneficiaries. The detailed results of economic and financial analysis are presented in Annex 3.
4.5 Institutional development impact:
Sri Lanka has become a showcase for renewable energy development. It is widely recognized as a
- 9 -

successful model and Sri Lankan expertise in this area now sought internationally. All aspects of this program-technical, financial, project design and implementation have provided important lessons for renewable energy initiatives in other countries and projects. Specific impacts by stakeholder institutions are discussed below.
Financial Institutions:
The commercial banks, licensed specialized Banks and MFIs involved in the project as Participating Credit Institutions (DFCC Bank, Sampath Bank, National Development Bank, Hatton National Bank, Commercial Bank and Sarvodaya Economic Enterprises Development Services (SEEDS)) have gained familiarity of issues related to financing grid-connected and off-grid renewable energy projects. As a result of the successful implementation of sub-projects, other financial institutions including commercial banks, leasing companies and MFIs have shown keen interest in renewable energy project financing as demonstrated by a greater number of PCIs in the follow-up RERED project. Cumulative amount of loans disbursed by PCIs as of December 31, 2002 were in the amount of about SLR 1.9 billion (IDA refinance amounts are in the Table 5 below). All PCIs admitted into the program have continued to meet the eligibility criteria and have remained in the program. The criteria include measures of profitability, liquidity, solvency and collection performance. These results have been confirmed by external auditors annually.
Table 5. Amount of Refinance Provided to PCIs as at 31 March 2003
Participating Credit InstitutionAmount disbursed by IDA Date of first
withdrawalRs million % of total
DFCC Bank 560 3621 Aug 1998National Development Bank 541 3516 Mar 1999Hatton National Bank 122 826 Oct 1998Sampath Bank 34 219 Apr 1999Commercial Bank 26 204 Sep 2001SEEDS 262 1706 Jun 2001Total 1,545 100
Private Sector Developers and Suppliers:
The project has also helped foster a number of private sector developers of grid connected and off-grid projects and suppliers of equipment. In particular,
Solar companies such as Shell, Access, and Selco, have entered the market and helped trigger the take-off in sales and general improvement in after-sales service. They have brought international standards into play and much of their professional management is provided by Sri Lankan staff. Components such as light bulbs are now manufactured locally and supply and service chains established. A total of about 80 service and distribution centers are now in place in Sri Lanka and a total of around 500 technicians have been trained and employed. The Solar industry provides direct and indirect employment to about 1500 people . An active Solar Industry Association (SIA) has come into being and is leading advocacy on industry concerns and renewable energy issues.
Mini-hydro design, engineering and construction capacity have developed to the extent that some of the
- 10 -

developers are exploring overseas markets in other Asian and African countries. Although electro-mechanical equipment is still largely imported, capacity to implement civil works, and manufacture penstocks and smaller components has developed locally.
The village hydro community has reached a critical mass and established its own association. The community is highly respected worldwide for its capabilities. Developers who help communities design and implement these 4-45 kW sub-projects have standardized approaches and are also undertaking overseas consulting assignments. The mechanical equipment for village hydro projects is manufactured locally by four manufacturers. The microprocessor based Induction Generator Controller (IGC), a key component, is also being designed and manufactured locally by four manufacturers.
The implementation of the pilot wind-farm has also generated good private sector interest in wind projects with 7-8 companies presenting unsolicited proposals to the CEB. As a result of this level of private sector interest, the CEB has recently issued a tender for development of a 22 MW wind-farm.
The ESD project has also generated private sector interest in the delivery of energy efficiency services. The first energy service company (ESCO) to be established in Sri Lanka is operating successfully and at least 2-3 others are beginning operations. LTL energy, a wholly owned subsidiary of Lanka Transformers Ltd., has about 20 clients and more than 100 energy efficiency installations. LTL energy started with a staff of two and has now expanded to a 8 member company with an annual turnover of 80 million SLR.
Ceylon Electricity Board:
While the main objective of the ESD project was to help build private sector capacity in the implementation of renewable energy projects, the project also helped to enhance the institutional capacity of CEB in the implementation of energy efficiency and renewable energy projects. In particular, the project had a significant impact by the way of bringing increased renewable energy awareness in the area offices of the CEB. The implementation of the pilot grid-connected wind farm also built expertise within the CEB to implement such projects. About six staff members including a senior engineer are now fully trained to handle all operational and technical aspects of wind projects..
National and Provincial Government
While building the institutional capacity of the Government was not a key objective under the Project, the ESD project did help in creating a greater awareness for renewable energy projects within the National and Provincial governments. In particular, the Central Environmental Authority (CEA), Ministry of Finance, and Ministry of Irrigation and Power have better understanding of small private power projects in general and renewable energy projects. Provincial level governments and financial institutions have been exposed to off-grid renewable energy projects. The Uva Provincial Government expressed an interest in becoming a part of the ESD project by promoting the adoption of solar systems in remote unconnected areas of the province. The Uva province has one of the lowest rates of electricity access in Sri Lanka. The AU helped Uva Provincial Government to design and implement a solar grant program under which 6000 households have benefited through installation of SHS Two other Provincial Governments-Sabaragamuwa and North-East province- have initiated similar programs
NGOs
Several NGOs took part in implementing the ESD project. These included promotional and operational
- 11 -

activities related to solar provision and village hydro development. Sarvodaya Economic and Enterprise Development Services (SEEDS) received technical assistance under the project that helped in increasing the quality of its operations through better business planning and the implementation of a portfolio management system. It entered the program as an MFI, but was upgraded to PCI status in the year 2000. Village cooperatives implementing village hydro projects also received substantial training which helped to build their capacity in this area. In particular, Intermediate Technology Development Group (ITDG) and Sri Lanka Business Development Center (SLBDC) trained about 30 NGOs in social mobilization and village hydro development. The project has also significantly increased the capacity of renewable energy and energy efficiency consultants. The Energy Forum has been successful in seeking grassroots feedback and mobilizing communities to represent and advocate their views. This feedback has been valuable in identifying and correcting deficiencies in the program
5. Major Factors Affecting Implementation and Outcome
5.1 Factors outside the control of government or implementing agency:Impact of the ethnic conflict on the market for renewable energy in Sri Lanka. The ESD Project was prepared and implemented during a period when the country was involved in an ethnic conflict. Due to the prevailing ethnic conflict in the North and Eastern provinces, the size of the market for renewable energy technologies, particularly solar, was affected.
Impact of the ethnic conflict on the availability of long-term capital in the country. The conflict also had an impact on the macroeconomic situation---the financial sector in Sri Lanka experienced a shortage of long term capital, partly due to fact that the Government absorbed a significant amount of long-term capital in the form of Government bonds and treasury bills.
The international price of oil was another major factor outside Government control affecting implementation as the tariffs for the mini-hydro projects are determined based on the cost of avoided capacity of oil fired power plants. Therefore, when the international price of oil declined, to abnormally low levels in 1998 (to $10/bbl by December 1998), the buy-back tariff offered by CEB to the mini-hydro developers also declined, threatening their continued development. However, by 2000 oil prices returned to pre-1998 levels, resulting in significant increases in the CEB avoided cost tariff, and a return to strong profitability for mini-hydro developers.
5.2 Factors generally subject to government control:
Domestic options for Increasing availability of long-term financing. In order to address the lack of availability of long-term capital, the Government has considered an option to redirect pension funds to the mini-hydro industry through the credit Program. This has not worked out successfully so far due to the severe constraints faced by the government.
Government/Regulatory Oversight on Small Hydro Power Tariff Issues. After an initially good start, mini-hydro development slowed down towards MTR due to the unsatisfactory buy-back tariff announced by the CEB. Developers took issue with the data inputs and methodology for tariff calculation used by the CEB, while CEB attributed the low tariffs to the declining international price of oil only. An independent review was undertaken on behalf of the government to examine the issue. The formula was revised and the existing tariff formula for the Standard Power Purchase Agreement provides a floor price for the tariff equivalent to 90 percent of the first year’s tariff and sets tariffs as a rolling average of three year values. These measures along with the CEB’s good payment record provides confidence and certainty to developers and financiers. While the issue was amicably resolved, perhaps more active Government
- 12 -

oversight could have mitigated this risk. Ongoing power sector reforms and the setting-up of an independent regulatory body will mitigate this risk in the future.
Clear demarcation of grid and off-grid areas. Accurate demarcation of grid and off-grid areas required for solar market assessment was not possible due to the lack of reliable RE master plans. However, the area offices of the CEB played a key role in facilitating market development of renewables such as Village Hydros and SHS by providing reliable grid-extension estimates.
Effective government coordination with NGOs. The Government also played a key role in interfacing with the NGOs who were concerned regarding the environmental impacts of the Windfarm. The Government was able to effectively and adequately address the concerns raised by NGOs regarding bird hits and disruption of the elephant migration path by putting in place a monitoring requirement.
5.3 Factors generally subject to implementing agency control:The Project Administrative Unit (AU) at the DFCC Bank as well as the Ceylon Electricity Board (CEB) were the implementing agencies under the Project.
The AU was instrumental in ensuring smooth flow of Grant and Credit funds. There was an initial learning curve on the assessment and implementation of the TA support to the industry, but the AU quickly adapted to addressing these requirements. The AU has established a reputation of being responsive and inclusive among industry stakeholders and maintaining flexibility in addressing project issues They have strictly adhered to safeguards requirements and financial due diligence norms. Similarly, high standards for monitoring, asset verification and customer acceptance have been implemented.
The CEB effectively implemented its components despite some initial problems with procurement. Adequate preparation and early start by the way of preparing feasibility reports and clear Consultant Terms of References (TORs), helped in ensuring that there were no major delays in implementation. The DSM branch and the PEU were pro active in involving stakeholders and effectively implementing their respective TA components.
5.4 Costs and financing:The Project Administrative Unit (AU) at the DFCC Bank as well as the Ceylon Electricity Board (CEB) were the implementing agencies under the Project.
The AU was instrumental in ensuring smooth flow of Grant and Credit funds. There was an initial learning curve on the assessment and implementation of the TA support to the industry, but the AU quickly adapted to addressing these requirements. The AU has established a reputation of being responsive and inclusive among industry stakeholders and maintaining flexibility in addressing project issues They have strictly adhered to safeguards requirements and financial due diligence norms. Similarly, high standards for monitoring, asset verification and customer acceptance have been implemented.
The CEB effectively implemented its components despite some initial problems regarding procurement of goods and services. In order to overcome the problems, the procurement staff att he field office had several discussions with individuals and also conducted a training session for the CEB staff. It should be noted that CEB staff was very receptive to the suggestions and also had the capacity to absorb the content. Adequate preparation and early start by the way of preparing feasibility reports and clear Consultant
- 13 -

Terms of References (TORs), helped in ensuring that there were no major delays in implementation. The DSM branch and the PEU were pro active in involving stakeholders and effectively implementing their respective TA components.
5.4 Costs and financing:
The total cost of the project at the time of appraisal was US$ 55.3 million. This comprised of the Credit Program (US$ 47.7 million), Wind Farm (US$ 3.5 million), capacity building (US$ 2.4 million), unallocated and remaining PPF (US$ 1.7). The available financing was adequate to reach the project targets. Although the GEF grant was fully utilized and only about US$ 10,623 of the IDA was unutilised and all physical targets exceeded, there are some differences between planned and actual disbursements as shown in Table 6 below (see Annex 2 for details).
Table 6. Disbursements, US$ m
IDA GEF PCIs Entre-preneurs
CEB/GOSL
Total
Total project cost (Appraisal) 24.2 5.9 13.7 9.6 1.9 55.3Composition, % 43.8 10.7 24.8 17.4 3.4 100.0
Total project cost (Actual) 22.1 5.7 4.8 10.7 1.3 44.6Composition, % 49.6 12.8 10.7 24.0 2.9 100.0
The lower disbursement figures for IDA and GEF are due to the appreciation of the US$ against SDR, the currency used in the legal agreements. Although net disbursements from IDA were US$ 22.1 million against the anticipated US$ 24.2 million at appraisal, all physical targets were met or exceeded. The sharp decrease in the contribution from PCIs is due to three principal reasons, namely, (a) the increase in the amount of IDA refinance from 60% to 80%, (b) the lower than expected $ per kW investment costs for both mini hydro and village hydro projects and (c) PCIs adopting conservative gearing ratios (of about 65:35 versus the 80:20 planned) to minimise the financial risk of investment projects. Item (c) is confirmed by the higher than planned contribution from entrepreneurs, in terms of both value and proportion. In sum, the project components either met or exceeded the physical targets at an overall cost that was about 20% lower in US dollar terms.
6. Sustainability
6.1 Rationale for sustainability rating:The ESD started out as a pilot initiative. Over the course of the project, it established the institutional and financial framework for a sustainable renewable energy industry in Sri Lanka. The institutional development described earlier and the robust returns from investments made by different financial stakeholders point towards continued sustainability. The renewable energy industry is currently going through an expansionary phase, supported in part by, (a) the follow-on RERED project and (b) opening –up of the northern and eastern parts of the country following the establishment of peace. The main risk to sustainability arises from the policy environment for renewable energy lagging behind the development of the industry itself. The RERED project is addressing this risk by working toward suitable rural and renewable energy policy interventions, and would increase the likelihood of medium to longer term sustainability being ensured. The continued development of solar home systems and village hydro projects would require limited GEF grant support for a few more years, though solar grants will be fully phased out by the end of the RERED project. It should also be recognized that continued expansion of the solar market and village hydro projects is subject to a limit imposed by expansion of the grid and exhausting
- 14 -

potential sites respectively. It is useful to note that solar market assessment was undertaken keeping in mind that only areas where grid extension would not be economically viable in the 5-7 year time frame would be suitable for solar electrification. From the project financial management perspective sustainability is likely given that AU is now well established, has experienced staff (and has recruited one additional person), and is part of a development finance bank that is well established . Audits have been regular and unqualified and financial management systems and reporting are also being computerized under the RERED project. Because of these factors, the overall sustainability is being rated as likely.
6.2 Transition arrangement to regular operations:The renewable energy industry in Sri Lanka is largely sustained through a number of private companies involved in the business of setting-up and operating hydro projects and sales, installation and service of solar home systems, assisted by private sector commercial banks and micro credit institutions. Therefore, the transition from a public sector intervention to a market based system has already taken place. The follow-on RERED project is relying on this industry structure and largely private stakeholders to deliver development objectives and project outputs. The RERED project also incorporates declining grant mechanisms. It envisages complete phase out of grants for SHS and reduction of grants for community driven projects to levels that can be sustained by government energy promotion programs.
7. Bank and Borrower Performance
Bank7.1 Lending:Lending is rated satisfactory. The project was formulated based on a number of studies undertaken with the assistance of the Asia Alternative Energy Unit (ASTAE), GEF and PPF. The studies helped in the development of the Small Power Purchase Agreement (SPPA), a key to the success of mini-hydro development, as well as pre-feasibilities and surveys to detail the various components. The project was consistent with the Government's energy sector and macroeconomic reform strategy and complied with the Bank's Country Assistance Strategy. Both project design and implementation were marked by extensive consultations among the Bank team, Government, commercial financial institutions, private sector and communities/NGOs. The selection of DFCC Bank as the Project Administrative Unit was based on an assessment of the interest and capability of available financial institutions, and included consultations with Bank financial sector team. During preparation, the robustness of the initial pipeline of subprojects was carefully evaluated and appraisal estimates in this regard were more or less validated. Technical and financial risk assessment and suggested mitigations were largely borne out during project implementation. However, the Bank team underestimated the policy risk for sustainable renewable energy development in general. In particular, risks related to implementation of the small power purchase agreement were underestimated. Capacity issues were adequately researched and recognizing the lack of capacity in different stakeholder institutions significant GEF funds were allocated for this purpose.
7.2 Supervision:Supervision is rated satisfactory. There was a high degree of continuity in the task team during preparation and supervision of the project. During implementation, the Bank team remained proactively engaged with the entire range of stakeholders, both to diagnose problems and devise solutions. Corrective action in the form consultative workshops, intensive supervision, private sector consultations and feedbacks, quarterly monitoring of stakeholder meeting reports were undertaken. Two examples of these types of interventions were: (a) An Objective Oriented Problem Solving (OOPS) workshop, conducted as part of a bank supervision mission to identify barriers to solar market development, and (b) A village hydro stakeholder workshop was organized and an innovative solicitation approach was recommended to improve the pipeline of village hydro projects- this was a key factor in the eventual success of the village hydro program. Typically two to three mission were undertaken every year including field visits and stakeholder
- 15 -
consultations. The teams consisted of technical specialists, financial/economic, environment as well as procurement specialists and disbursement specialists as required. As and when there were key issues, the team responded quickly and if required, amendments to the agreements were made. The role of the local staff is especially noteworthy in providing close supervision and being regularly engaged with clients and stakeholders. The project has especially benefited from competent financial management inputs and supervision provided by Colombo based specialist on an ongoing basis. Hence, supervision missions have not included FM specialists. The main FM issue has been ensuring consistency between the FM practices and standards of the Bank and that of the DFCC Bank and Government of Sri Lanka. This has been handled well and the Bank guidelines have strengthened the procedures and FM practice by the borrower.
7.3 Overall Bank performance:Overall Bank performance was satisfactory
Borrower7.4 Preparation:Borrower preparation was satisfactory. The Borrower, represented by the CEB and DFCC bank, facilitated consultations with key stakeholders, supported preparation activities and policy formulation. CEB was actively involved in project preparation activities related to all components. The private sector took early ownership of project preparation and acted as a key partner in preparation activities.
7.5 Government implementation performance:Government performance during the implementation was highly satisfactory. Rationalization of the import duties for the solar equipment, active role in addressing NGO concerns during the construction of the Wind-farm and the adjudicative role played in the resolution of the mini-hydro tariff issue are all commendable. The government quickly and effectively responded to issues raised by the project administrative unit or by the World Bank. In particular, the Director General of External Resources, Ministry of Finance played an important role in the preparation of the project and demonstrated continued commitment to the project objectives through timely actions for resolving the mini-hydro tariff issue, upgrading the status of MFIs to PCIs and effective liaison with financial institutions, private sector and provincial governments.
7.6 Implementing Agency:The performance of the implementing agencies, DFCC as the AU for Part A of the project, and CEB for Parts B and C of the project is rated highly satisfactory.
The AU has effectively carried out its implementation responsibilities as outlined in its Terms of Reference (TOR), including processing of loan disbursement request, maintaining of disbursements records and accounts, compiling program related statistical records and submitting quarterly reports. The AU also conducted regular stakeholders meetings to seek feedback on the Loan/Grant disbursements as well as TA implementation. Equally important was the long-term view taken by DFCC in operating the AU. The DFCC demonstrated a willingness to initially sustain losses from AU operations for the first three years before starting to operate profitably. The model of an effective, efficient and proactive AU with a long-term commitment and able leadership was an important element in the success of the project. Borrower's compliance with financial covenants (Article 4.01 of DCA) was satisfactory. Receiving a qualified audit opinion, even when there are no major issues, is typical of project reports of projects audited by the Auditor General. All renewable energy sub-projects financed under the ESD Credit program, except for the solar home systems, were subject to environmental and social analysis. Considering the scope of the sub-projects that were to be financed under the Credit program, it was anticipated that any environmental and social impacts would not be significant and reversible. Respective developers prepared environmental
- 16 -

assessments of sub-projects in accordance with the agreed environmental and social assessment framework, which was based on the National Environmental Act (NEA) and the Bank’s safeguard policies. The environmental assessments were reviewed by the Central Environmental Authority (CEA), the environmental regulatory agency, and cleared as a pre-requisite to developers accessing the Credit program. The Bank’s periodic review of sub-project specific environmental assessments and CEA’s clearance process were found to be satisfactory. All sub-projects financed under Credit program were considered by the CEA to have no reversible environmental impacts and included no involuntary resettlement. Site visits undertaken by the Bank’s Environmental Specialists during the implementation phase of the project confirmed CEA’s assessments and the assumptions made at the project preparation stage, that potential environmental and social impacts of sub-projects will not be significant and reversible, were realistic.
The CEB carried out its implementation responsibilities in accordance with expectations both on the wind farm project and the capacity building components. Because the pilot wind farm site was located near a bird sanctuary, it raised potential environmental concerns. The CEB carried out a detailed environmental assessment (EA) with public consultation. Some concerns were raised about the possibility of the wind turbines interfering with bird migration patterns. Detailed data on bird kills collected by the CEB after the wind farm became operational and reviewed by the Bank show that there has been no adverse impacts on bird migration in the area.
Safeguard compliance reviews and audit reports from both agencies were received on time and latter mostly carried unqualified audit opinions.
7.7 Overall Borrower performance:Overall Borrower performance is rated highly satisfactory.
8. Lessons Learned
The lessons below are drawn from supervision efforts conducted over the life of the project, reviews conducted by GEF and others and a small customer impact assessment survey conducted in July 2002. The survey covered 100 SHS end-users and 50 Off-grid village hydro end-users. Although the project began as a pilot initiative, its concept and approach have proved robust and scalable. The successful lessons of the project are now being replicated on a larger scale under the successor RERED project. Several key lessons for the development of a commercially sustainable renewable energy and energy efficiency service market emerge from this project, and these are summarized below. The success of ESD project interventions can be ascribed to their being demand driven and commercially oriented, while enabling and empowering appropriate stakeholders to overcome technical, financial and institutional barriers. The lack of effective reform and regulation in the main sector did not prove to be a detriment, mainly because the market for renewables has developed among communities and households that do not have access to the main grid supply and also do not expect such access in the foreseeable future.
It is within this overlap of the Private sector and the Energy sector that the following nine main lessons have been learned for embarking on a successful private sector led (renewable) energy intervention:
• Lesson 1. Improve access to capital• Lesson 2. Build a enabling business and policy environment• Lesson 3. Scale-up capacity building initiatives• Lesson 4. Introduce new products and technology through market principles • Lesson 5. Learn the market and its consumers
- 17 -

• Lesson 6. Integrate productive uses at all levels• Lesson 7. Allow for flexibility in project design.• Lesson 8. Sound project and financial management are enabling factors• Lesson 9. Critical role of GEF in project implementation
Lesson 1. Improve access to capital. One of the key barriers for private entrepreneurs and households was access to additional capital for energy investments, each of them with their own set of reasons. For the project developers, who were seeking to sell their electricity to the national utility, the need was for longer term loans that would better fit the cash flow requirements of the system (high upfront investment, relatively long repayment period). For the village based Electricity Consumer Societies and individual households, the need was for loans that would make the systems more affordable. For some of the other entrepreneurs, it was the needs for working capital to support their rapid growth. The project addressed these needs in several ways through a credit program and an output focused co-financing grant program. Detailed lessons were learned as follows:
• Microfinance institutions play a significant role in small and medium enterprises development. In the original project design, MFIs could participate in the program but they had to obtain funds from the participating credit organizations. This increased the cost of their funds to the ultimate end users but also down-played their status in the banking sector which for some was unacceptable. At mid-term, MFIs were allowed to participate as PCIs in the project under a specific set of criteria following practices from other countries. The entry of the MFIs into the program made system more affordable and opened new markets for the retailers. This allowed many of them to achieve double digits growth rates.
• Microfinance institutions are more suited for rural energy service provision than commercial banks or SHS vendors. In the original project design, the SHS vendors and commercial banks were expected to perform the function of a financial intermediary. The vendors early in the project acknowledged that given the additional costs, expertise and risks involved, the credit service should be handled by specialist organizations. The commercial banks reached the same conclusion but for different reasons. • Output focused co-financing grants provide incentives for private companies to enter new markets and deliver pre-defined products. The project provided grants to cover some of the incremental cost for the introduction of environmentally friendly technologies. These grants were output focused and only disbursed after the pre-defined results were achieved. This approach was replicated by one of the provincial governments (Uva province) when it became clear that its budget for rural electrification (through grid) could support at least three times more households through an off-grid program.
Lesson 2. Build an enabling business and policy environment. For all of the private developers involved in the project, the strengthening of a business enabling environment was of a key importance. For the Small Hydro Power Developers, it was lack of a transparent and standardized contracting arrangement with the only utility. The Solar dealers were hindered by the high import duties and the lack of an institutional partner willing to provide consumer credit to rural households. For the village hydro developers, it was the financial support to allow them to go out to the rural areas and identify potential communities willing to invest in a mini grid. After these key barriers were addressed, existing investors were willing to take on larger projects and new companies were willing to enter. The latter included some of the larger local companies but also some of the better known multinationals. During implementation, several more detailed lessons were learned:
• For a private sector led program to succeed institutional structures must be effective and
- 18 -

policy framework must be conducive. Commitment by the government is very important, and this should be reflected in willingness to ensure consistency among national and sectoral objectives, e.g. making sure renewable energy can compete with other technologies on a level playing field. During the initial consultations conducted by the World Bank with the Government of Sri Lanka concerning the ESD project, the GOSL agreed to rationalize import duties on photovoltaic modules, removing one of the major barriers to widespread utilization of this technology. Similiary, the establishment of the small power purchase framework by the CEB was a key factor in facilitating the implementation of small hydro projects. Towards the end of the project, the government also introduced its new Rural Electrification Policy, which aims to promote sustainable market-based provision of rural services. It is also currently in the process of finalizing electricity reform legislation, which is expected to reinforce incentives and institutional structures for the continued development of small renewable energy projects.
• The implementation of a standardized power purchase agreement should be ensured to reduce overhead costs. The project supported the preparation of a standardized Small Power Purchase Agreement (SPPA) and a standardized, formula-based way of determining the least cost tariff. The SPPA is a standardized legally binding arrangement between the small power project developer and the national utility. The SPPA replaces the cumbersome process of negotiating every small power project on an individual basis. In many cases the negotiation process required substantial input from specialists and lawyers often increasing the bureaucracy and overhead to a level at which the project became unviable. The overall cost of preparing this set of regulations was less than US$200,000. Within a time span of 5 years it facilitated more than 30 MW in private power projects.
• Business associations improve impact, and allow for constituency building for business environment improvement. In total, five associations where established: Small power producers association, Solar industry association, Village hydro association, Village hydro consumers association and Biomass association. The business associations have been effective in several ways; They took lead role in discussing the Standardized Small Power Purchase Agreements and Tariffs with the national utility and Ministry when uncertainties arose over transparency in calculation and selection of input data; They took lead in requesting CEB rural electrification expansion plans, engaging Provincial Government’s in off-grid electrification concepts, and further harmonizing the Government’s policies. They have also been involved in further improvement of the industry by requiring quality standards of members, addressing technical and financing issues and resolving quality in service delivery issues. In this organized fashion, these private electricity providers have become a constituency for private participation in the power sector.
Lesson 3. Scale-up capacity building initiatives. The introduction of a new industry coincides with learning of new skills within almost all organizations involved. For the project developers, it is the knowledge of a technology, the closing of a deal with the national utility, and the preparation of a bankable proposal among others. For the financiers, it is the analysis of the risks. For the utility and the end-user it is the quality of the product offered. In the initial stages of the market uptake, the capacity building initiatives were conducted on project by project basis. This took time and is one of the reasons for a slower than anticipated uptake in the village hydro and solar home system component. With the market growing, the industry started to bundle capacity building efforts including: technical training for hundreds of installers of solar systems through the Industry Association; supporting formal training institutions with integration of curriculum in regular programs; usage of a methodology to identify in a short timeframe key issues and a wholesale agenda for further actions for the industry; a “innovation solicitation” process to stimulate further market growth with the key members of the industry; and, establishment of a framework for wholesale capacity building initiatives. Through these initiatives nearly one thousand employees were trained under the program.
- 19 -

Lesson 4. Introduce new systems and technology through market principles. Introduction of new technology in a sector as well as in a company often needs to be driven by sound economic rationale and market principles. For the introduction of the alternative energy systems in Sri Lanka, two fundamental principles were followed: (i) the system need to be the least-cost option compared to its competitor products (grid connected mini hydro projects); or, (ii) the incremental cost of the systems need to be in-line with the incremental cost globally and have a clear declining path of these costs due to economies of scale (solar home systems and village hydro projects). These principles have contributed to an industry that is expected to grow even after external grant support is withdrawn. More detailed lessons were identified by the stakeholders during surveys and are detailed below:
• Establish reliable after-sales service to ensure project sustainability. Under the ESD project, many of the end-users were concerned about the availability of long-term support after warranties expire and some vendors opt to close their field offices, especially in the ‘saturated’ areas. They also expressed willingness to pay for the continued presence of an entity that would ensure reliable servicing of the systems. So far, the Solar Industry has responded well and currently there are about 80 sales and service outlets throughout Sri Lanka—mostly developed through foreign and local private investment estimated of some $1.0 to 5.0 million.
• Improving the efficiency of the delivery chain through the introduction of information technology. The infrastructure of the enterprises operating in the rural areas is costly and often in-efficient. One of the key organizations in delivering services – the participating micro finance organization – has embarked on introducing information technology to further mainstream their operations. When fully operational, it is expected to reduce the turn-around time of loan approvals from more than 90 days to less than 30 days.
• Most problems can be avoided if customers are made more aware about proper use and of the limitations of their systems. The most common technical problems encountered by SHS users usually involve the batteries, and are often caused by over-usage. Other technical problems involve wiring defects, loose connections, and incorrect placing of PV module. These are problems that can be avoided if customers are made more aware about proper use and of the limitations of their systems. For mini hydro users, most of the technical problems encountered (including low voltage, power breakdown, lack of water, flickering bulbs) are also due to over-usage. These can also be avoided if the necessary measures to educate the end-users on the limitations of the system are taken. It is important to note that the vast majority of the systems were installed in the last two years, so there have been no major servicing needs, which are bound to arise as the systems grow older and components start failing. It is already felt that some companies are not providing adequate service, although this is kept in check by the ESD-AU inspections for grant disbursement as well as customer feedback to industry.
Lesson 5. Learn the market and its consumers. Initial market surveys and pre-investment studies scoped the market for the new technology systems. These attracted early developers to enter the market. The survey and studies however did not provide any detailed information on the specific need consumers have for the different products. With competition increasing and the expectation of returns, companies have emerged with greater understanding of their clients in their particular market niche. More detailed lessons were identified by the stakeholders during the surveys, especially, including:
• Rural end-users are willing to pay more for their energy expenditures, as long as the energy supply is reliable and safe. Even if it costs more than what they are used to paying, end-users place a
- 20 -

higher premium on the quality, reliability and safety offered by sources like hydro and solar energy. As revealed in the survey, households current energy expenditures are higher than when they were using kerosene as the main energy source for lighting, but they prefer to continue doing so because SHS and OGVH do not pose the same health risks that kerosene use does, and provide continuous, more reliable energy services such as lighting.
• Investment in market development activities is crucial to the success and sustainability of a renewable energy program. This can take the form of technical assistance directed at enhancing the capacity of the private sector, concerned government agencies, NGOs, etc to first, learn about the technologies and the associated issues, and then how to properly implement and monitor projects. Under the ESD, the Administrative Unit provided technical support and training to subproject developers and PCIs for ESD credit operations. It also worth mentioning that a process like this requires time to build the framework and perseverance (about two to three years) but after that acceleration is much faster, up-scaling much easier at lower cost. This is consistent with the lesson learned in the India Renewable Resources Development Project ( Report No 23489).
• Local or community participation in, and cash contribution for, the implementation and monitoring of off-grid projects is a crucial element to project success as it ensures ownership on part of the communities involved, promotes improvement of local capabilities, strengthening of community relations, and also aids in cost recovery. In Sri Lankan society, there is the unique concept called ‘shramadana’ which basically means voluntary work in exchange for payment. Under the village hydro component of the ESD project, which involved construction of civil works and erection of distribution lines in the villages, families contributed their time to assist in these tasks. Although the amounts of time expended were assigned equivalent cash amounts and deducted from their actual required payments, their assistance was also brought on by a sense of project ownership and desire to ensure successful implementation. This is proven by other contributions of the villagers e.g. poles, sand, etc for which they asked for nothing in return. In a survey conducted for village hydro customers in the districts of Ratnapura and Kegalle in June and July 2002, 43% of the households interviewed contributed between 20 to 39 days to the project, and 33% contributed more than 60 days of sharamadana.
• Middle to upper income rural people benefit most as the technology involved is not cheap, and these are the groups that have the willingness and ability to pay. To financing institutions, they also represent ‘sound risk.’ Under the ESD project, SHS and OGVH customers typically fall under the middle-income category (on the basis of actual income and expenditures data obtained through the field surveys). More than half are involved in agriculture and have seasonal incomes. Around 25% hold either government or private sector jobs and earn monthly incomes.
Lesson 6: Integrate productive uses at all levels. Under the ESD project, SHS and OGVH customers who were included in the field survey all acknowledged an improvement in their overall well being. They also cited the accrual of economic/financial benefits, but mainly in the form of future savings once their loans are fully paid off. For a rural electrification project to have a direct impact on economic development, the project design should have an integrated approach where specific activities targeted at economic development are incorporated, e.g. improvement of local infrastructure, local capacity-building, etc. This is being addressed in the follow-on RERED project, which has a pronounced focus on promoting rural development and productive uses through electricity access. Specifically, project developers will be encouraged to include income generation components in designing their renewable energy projects. Organizations involved in providing rural services in the areas of health and education will likewise be engaged to find activities with opportunities for integrating energy provision. Cooperation with other
- 21 -

initiatives that combine energy provision with income generation will also be pursued.
Lesson 7: Allow for flexibility in project design. One of the major reasons for the success of the ESD is that project design was flexible enough to allow different approaches and changes as and when required. For instance, with the off-grid SHS component of the project, it was recommended at mid-term that role of MFIs in servicing isolated rural areas should be increased specifically by (1) providing assistance to potential microfinance institutions (MFIs) to help them qualify as PCIs for the project, (2) considering appropriate criteria for MFIs to qualify as PCIs, and (3) encouraging existing PCIs to work with and provide loans to MFIs that have proven outreach capabilities. This resulted in the introduction of microfinance (with the accreditation of SEEDS as a PCI) and a private partnership model for market development and financing. The evolution of a new business model involving a tripartite relationship between the customer, MFIs and the solar company was a key to success. This tripartite relationship was structured through a Memorandum of Understanding (MOU) between the solar companies and the MFI. The key features of the MOU were a buy back scheme and identification of responsibilities of each party regarding consumer service provision. To address the slow village hydro market development, an open solicitation process was initiated to get proposals from consultants on how to address policy, technical, and sustainability issues. To ensure that the process would yield concrete accomplishments, consulting contracts were tied to deliverables. As in the SHS component, the interventions resulted in the attainment of targets.
Lesson 8: Sound project management and financial management are enabling factors: Competent financial management and project management staff in both implementing agencies were enabling factors for successful project implementation. Accounting, record keeping, and reporting on project financial transactions (though manual) were timely, comprehensive and satisfactory. Notworthy is DFCC’s financial management system for monitoring and disbursing against loan refinancing applications from PCIs, which is a good model to follow for future projects that have financial intermediation components. The existing financial management arrangements were augumented for the follow-up project.
Lesson 9. Critical role of the GEF in implementation: This project could not have been implemented without GEF grant support that helped catalyzing the solar home system (SHS) and village hydro industries. Also, generous GEF supervision budgets during supervision made possible close supervision of these components and taking corrective actions as required. GEF's initial support will be further leveraged through the RERED project where solar and village hydro programs are being scaled-up. It is also important to note that the subsidy role of the GEF for these two types of subprojects will be reduced over time, so that eventually these subprojects can proceed without such support.
- 22 -

9. Partner Comments
(a) Borrower/implementing agency:Mr. Chandrasekar GovindarajaluTeam LeaderEnergy Services Delivery ProjectWorld BankWashington DC
Dear Mr. Chandrasekar,
Sri Lanka - Energy Services Delivery Project Cr. 2938, TF 028955Comments on the draft ICR
This is with reference to your e-mail sent to us on 30th April 2003 regarding the above subject.
We have reviewed the draft ICR and are in agreement with its contents except for the Bank's very modest rating of its own performance. We are of the opinion that the ratings for "Bank supervision" and "Bank overall" given in section 7 of the ICR should both be "Highly Satisfactory" . We justify this on the grounds that the World Bank team played an extremely participative and proactive role right through the Project, without which the Borrower, Implementing Agencies and subproject developers could not have achieved much success. In particular, the OOPS workshop for solar stakeholders and the innovation solicitation workshop for village hydros conducted around mid-term with the Bank's direct participation were creative inputs that paved the way for the rapid market take-off for solar home systems and off-grid village hydros.
Thank you.
Yours sincerely,
R.V.NanayakkaraAddl. Director GeneralFor DG/ERD Copy : 1. Mr. Jayantha Nagendran, Senior Vice President ESD Project, DFCC Bank 2. Country Director, WB
(b) Cofinanciers:
(c) Other partners (NGOs/private sector):
10. Additional Information
- 23 -

- 24 -

Annex 1. Key Performance Indicators/Log Frame Matrix
Project Progress per Key Performance Indicators
Narrative Summary Key Performance Indicators Progress as of Project ClosingProject Development Objectives:
1. Promote the provision by private sector, NGOs, and cooperatives of grid-connected and off-grid energy services using environmentally sustainable renewable energy technologies
2. Strengthen the environment for DSM implementation
3. Improved public and private sector performance to deliver energy services through renewable energy
1.1 Installation of at least 26 MW of grid and off-grid renewable energy capacity by the end of 2002, including service to 32,000 off-grid customers by end of project.
1.2 (old) At least one power purchase agreement for a private wind power project signed by CEB*
1.2(new) Inclusion of provisions for privately developed renewable energy into the power sector restructuring program.
2. CEB issuance of Energy Efficient Commercial Building Code of Practice (EEBC)
3.1 CEB annual update of Small Power Purchase Tariff (SPPT)
3.2 Signing by CEB of at least 5 SPPA contracts by mid-term evaluation; 12 by Project completion
3.3 Generation planning models prepared by CEB which incorporates intermittent, non-dispatchable renewable energy generating sources
About 35.3 MW installed (31 MW mini-hydro, 3 MW wind, 0.94 MW solar and 0.35 MW village hydro). About 22,685 off-grid customers served (20,953 solar, 1,732 village hydro)
No serious private wind power proposals expected until after power sector restructuring, therefore this indicator was dropped at Mid-term.
This indicator added at mid-term. The reform act recognizes the value of small renewable energy producers though no specific provisions have been included at this stage.
EEBC codes issued in April 2001.
Updates published annually
14 SPPAs signed by mid-term and over 37 SPPAs signed by project closing in December 2002.
No action
Project Outputs
1. Renewable Energy Subprojects
2. Pilot Wind Farm
3. Training and materials to enhance private, NGO, and public sector capability.
4. Code of Practice for Energy Efficiency in Commercial Buildings
5. Load Research Program
1.1 Standard Small Power Purchase Agreement (SPPA), non-negotiable power purchase tariff in place.
1.2 Installation of about 16 MW (about 15 subprojects) of grid and off-grid renewable energy capacity by end of project (7 MW by mid-term review)
2. Commissioning of Pilot Wind Farm of about 3 MW by 5/98
3.1 At least 15 CEB staff/private sector developers/NGO staff trained to deliver energy services via renewable energy by mid-term evaluation
3.2 A guide for practical implementation of existing grid interconnection specifications by mid-term evaluation
4. Public review and completion of EEBC (by mid-term review and end of project respectively)
5.1 Review of draft Load Research program by mid-term review; load research program
SPPA in place
About 35.3 MW installed (31 MW mini-hydro, 3 MW wind, 0.94 MW solar and .35 MW village hydro), in 51 subprojects (15 mini-hydro, 1 wind, and 35 village hydro)
Pilot Wind Farm commissioned in March 1999
About 548 CEB and private sector staff trained through training programs sponsored by CEB and Solar Industries Association of Sri Lanka
The guide was prepared and issued in December 2000
Activity completed successfully in April 2001
First Load research program completed in May 2002 and successfully operating
- 25 -

start-up by end of project
5.2 On-premises load metering of at least 10 major consumers.
On-premises load metering of 15 customers completed
- 26 -

Annex 2. Project Costs and Financing
Project Cost by Component in US$ million equivalentAppraisal Estimate Actual/Latest Estimate Percentage of Appraisal
Project Cost by Component
US$ million US$ million %
ESD Credit Program
Mini HydroVillage HydroSolar Home SystemsBusiness DevOff-grid project support
30.80.7
14.40.51.2
26.70.89.21.00.7
86.7114.263.820058.3
Wind Farm 3.5 3.8 108.5Capacity Building
Pre-Electrification UnitDSM Unit
0.51.9
0.41.9
80100
Other (unallocated and PPF)
1.7
55.2 44.5 80.6
Project Costs by Procurement Arrangements (at Appraisal)
Expenditure Category Procurement Method Total Cost ICB NCB Other NBF
1. Credit Program Subloans (a) Goods (b) Works (c) Services
19.0 (11.9) 16.5 (10.6) 1.9
5.2 4.6 0.5
24.2 (11.9) 21.1 (10.6) 2.4
2. Pilot Wind Farm (EPC contract) 2.8 (2.5)
0.7 (0.5)
3.5 (3.0)
3. Capacity Building (a) Consulting Services and Training (b) Goods
0.1 (0.1)
0.9 (0.9) 0.6 (0.6)
0.3 (0.3) 0.1 (0.1)
0.3 0.1
1.5 (1.21) 0.9 (0.8)
4. PPF 0.3 (0.3)
0.3 (0.3)
5. Unallocated 1.4 (1.4)
1.4 (1.4)
Total 2.9 (2.6)
1.5 (1.5)
40.2 (26.2)
10.7 55.3 (30.3)
Note: NBF = Note Bank-Financed.Figures in parentheses are the amounts to be financed by the IDA Credit and GEF
Grant.• The Project Preparation Facility (PPF) is $340,000.
- 27 -

Project Costs by Procurement Arrangements (Actual)
Expenditure Category Procurement Method Total Cost ICB NCB Other NBF
1. Credit Program Subloans (a) Goods (b) Works (c) Services
20.1
(15.4) 7.6
(5.1) 1.1
(0.7)
5.5 2.1 0.3
25.6 (15.4) 9.7 (5.1) 1.4
(0.7)
2. Pilot Wind Farm (EPC contract) 3.5
(3.1) 0.3
(0.2)
3.8 (3.3)
3. Capacity Building (a) Consulting Services and Training (b) Goods
0.2 (0.2)
3.7
(3.7) 0.2
(0.1)
3.7 (3.7) 0.4 (0.3)
Total 3.5
(3.1) 0.5
(0.4) 32.7
(25.0) 7.9 44.6
(28.5)
*Other includes all consultancy contracts and Established Commercial Practices (ECP)
- 28 -

Annex 3. Economic Costs and Benefits
Economic and Financial Analysis
An ex-post economic analysis was conducted for the different investment areas of the project.2
This includes: grid connected mini hydro projects, village based hydro projects, solar home systems, and the pilot wind farm.
A. Grid connected mini hydro projects
1. Introduction. The very success of the ESD project in catalyzing a sustainable private sector development of mini-hydro poses certain difficulties for economic and financial analysis: much of the data on the financial performance of actual projects is confidential. While some developers and the Banks shared their information with us, we are bound by confidentiality agreements, and therefore the analysis is presented in terms of the “representative industry average” rather than individual projects.
2. Assumptions and ERR at Appraisal. Table 3.1 shows the assumptions for, and the analysis of, the ERR at appraisal. The 18% ERR was estimated on the basis of a preliminary assessment of a 580kW project at Ellapitiya Ella.
3
Table 3.1: Economic analysis at Appraisal
Project Name Ellapitiya EllakW 580 [kW]plant factor 0.445 [ ]GWh/year 2.261 [GWh/year]cost($)/kW: base estimate 1030 [$US/kW]local fraction 0.40 [ ]capital cost, local component 12.66 [RsMillion]actual exchange rate 53 [Rs/$US]capital cost, foreign 19.00 [RsMillion]O&M costs (%of capital cost) 0.02 [ ]total capital cost 31.66 [RsMillion]discount rate 12.00% [ ]
Economic returns Ellapitiya Ella 580 [kw]1995 1996 1997 1998 1999 2000 2001 2002 2003 2004 2005 2006
[-1] [0] [1] [2] [3] [4] [5] [6] [7] [8] [9] [10]GWH/year 2.3 2.3 2.3 2.3 2.3 2.3 2.3 2.3 2.3 2.3avoided cost 3.368 3.4 3.4 3.4 3.4 3.4 3.4 3.4 3.4 3.4benefits@avoided cost 7.6 7.6 7.6 7.6 7.6 7.6 7.6 7.6 7.6 7.6O&M costs -0.6 -0.6 -0.6 -0.6 -0.6 -0.6 -0.6 -0.6 -0.6 -0.6disbursement 1capital cost -31.7 0.0economic flows -31.7 0.0 7.0 7.0 7.0 7.0 7.0 7.0 7.0 7.0 7.0 7.0NPV@discount rate 13.3
251.0ERR 18.00%PAD estimate of ERR 18.00%
3. The ERR is sensitive to three main assumptions (beyond the prescribed discount rate): the capital cost, the annual capacity factor, and the avoided cost (used as a measure of benefit). Likely deviations of O&M costs, assumed in the PAD at 2% of capital cost, play a small role.
- 29 -

______________________________________2. Sri Lanka Energy Service Delivery Project: Economic Analysis for the Implementation Conmpletion Report, May 2003.3. The Ellapitya Ella project was subsequently constructed by ECOPOWER Ltd.
4. Capital costs. The average completed project cost (financial) is $1,025,4 which falls to
$963.5/kW as an economic capital cost. This compares to $1,030 assumed at appraisal. There are two explanations of the variation in capital costs. First, the most usual (and most obvious) is site quality, for which head is the best summary proxy among the project built this far.
5 The second is the learning curve
effect: as developers gain experience, one would expect the incidence of cost overruns and project implementation delays to fall.
5. Avoided costs. Table 3.2 shows the tariffs that apply to mini-hydro projects, as determined by CEB. It may be seen that even the dry season tariffs are significantly below the estimate of avoided cost used in the PAD (of 6.3 UScents/kWh). The tariff is estimated at the end of each year for the year ahead; the announced tariff is then given by the average of this estimate and that of the past two years.
Table 3.2: CEB announced tariff
1997 1998 1999 2000 2001 2002 2003Dry season(1) Rs/kWh 3.38 3.51 3.22 3.11 4.20 5.13 5.85Wet season Rs/kWh 2.89 3.14 2.74 2.76 4.00 4.91 6.06exchange rate (2) Rs/$US 59.0 64.5 70.6 77.0 89.4 95.0 100.0Dry USCents/kWh 5.7 5.4 4.6 4.0 4.7 5.4 6.1Wet USCents/kWh 4.9 4.9 3.9 3.6 4.5 5.2 5.9weighted average USCents/kWh 5.1 5.0 4.0 3.7 4.5 5.2 5.9(1) February, March, April.(2) Exchange rates are period averages
6. In theory, the use of avoided costs as the measure of economic benefits of mini hydro is unassailable, but how avoided costs are actually to be determined is more difficult. Since CEB’s avoided costs are also the basis for the mini-hydro tariff, it is unsurprising that the tariff, and the methodology of calculation, have been controversial, with several committees and an independent consultant
6 coming to
varying conclusions. Two developers are presently in an arbitration proceeding against CEB contesting CEB’s tariff determinations.
7 The consultant’s recommendations for the 2001 tariff were not adopted by
CEB: a comparison is shown in Table 3.3.
Table 3.3: Tariffs for 2001
CEB Recommended by
ConsultantDry Rs/kWh 4.20 5.35Wet Rs/kWh 4.00 5.03exchange rate Rs/$US 89 89Dry USCents/kWh 4.70 5.99Wet USCents/kWh 4.48 5.63weighted average USCents/kWh 4.53 5.72Source: Siyamabalapitya, op.cit.
- 30 -

______________________________4. source: DFCC database on PCI financings.5. Low head projects built on irrigation canal drops may also be of high quality depending on the degree of upstream regulation; but to date, none of the mini-hydro projects built under ESD fall in this category. 6. T. Siyamabalpitiya, Study on Grid Connected Small Power Tariff, Sri Lanka, Final Report, June 2001. 7. ECOPOWER and Mark Marine. These two developers account for some 50% of all mini hydro capacity.
- 31 -

7. Capacity benefit. At present, the announced tariff is based solely on avoided energy costs, and does not take into account any capacity benefit. However, while the capacity benefit may be small, it is unlikely to be zero. The main argument against a capacity benefit is that, in the short run, the quantity of mini-hydro is so small that CEB’s capacity expansion plan is unlikely to be any different, a result that seems to be confirmed by runs of the WASP model, which identifies little or no impact on the optimal expansion plan.
8 However, for the two years for which complete data of the monthly
generation exists, show that even in the driest months of February and March there is some mini hydro generation. As the number of mini hydro plants increase, it is likely that the diversity effect will increase the capacity value to CEB. In other words, while the capacity benefit of any single plant may be small, because of the monthly and annual variation of a particular site, when the output of all projects are added together, the extent of variation declines. This is illustrated by the calculation of the coefficient of variation (standard deviation divided by mean) for eight of the ESD projects, whose average monthly variability is 56%. But when the outputs are added together (i.e. the total input to CEB), the variability decreases to 43%.
9 As the number of operational plants increases, this diversity effect is likely to increase, particularly
with the additional of low-head projects on highly regulated rivers and irrigation canal drops.
8. Achieved capacity factors. The achieved capacity factors are somewhat lower than those estimated at appraisal. While the achieved capacity factor at the Ellapitiya Ella project is only marginally below the assumed 44.5% at appraisal, significantly lower capacity factors have been observed at some of the other ESD-supported projects though the general trend is clearly one of increase (from 0.38 in 2000 to 0.43 in 2002).
9. Achieved ERR. The representative mini-hydro project supported by ESD may be said to have the following features: a completed (financial) capital cost of 1,025$/kW; an imported component of 60% (free of import duty); SCF of 0.9 (as applies to domestic capital costs); an economic capital cost of 963.5$/kW; a capacity factor of 43%; and, a size of 1.75 MW. Under the PAD estimate of avoided cost of 6.3 UScents/kWh, the ERR is 24.7%; with the actual CEB avoided cost tariff the ERR falls to 23.5%. For the most attractive projects with capital costs of $900/kW and 55% capacity factors, the ERR increases to 34%.
10. Financial returns. As noted above, the actual financial results of the private companies involved in mini-hydro development were not available to us. However, the strong interest among private developers is in itself an indicator that financial returns are presently attractive. To assess likely financial returns to the developers we have constructed a financial model that replicates the results of a financial analysis published by the Grid Connected Small Power Developers Association (GCSPDA), which shows IRR as a function of capital cost and power purchase rate.
10 The analysis makes the following assumptions: Capital
cost funded 40% equity; 60% debt; Debt repaid over five years at 24% interest rate; Initial exchange rate Rs94/$, depreciating at 7% per year; Annual O&M as 10% of annual revenue; Income tax rate of 15% (consistent with BoI status); Annual capacity factor 55%; which produces the results shown in Table 3.4.
______________________________8. The Siyambalapitya report notes the sensitivity of the capacity credit calculations in WASP to exogenous assumptions made by CEB about thermal capacity additions in the short run, (assumptions that have also been consistently optimistic). In any
- 32 -

event, as noted in the report, capacity and energy credits need to be estimated in the same model: one cannot use WASP for capacity credits, and some other model (such as METRO) for the energy credits. 9. Similar arguments would apply to wind projects, once 5-10 projects are developed at different locations across which there is likely to be some diversity. 10. Grid Connected Small Power Developers Association (GCSPDA), A Policy Framework for Accelerated Development of Small Hydro Power, January 2002.
- 33 -

Table 3.4: IRR on Rupee Equity Investment in small hydro power plants
Capital cost Power purchase rate$/kW 5 UScents/kWh5.5 UScents/kWh6 UScents/kWh1000 32.3%35.8%39.4%1250 25.9%28.4%31.0%1500 21.9%23.9%25.9%Source: GCSPDA, op.cit., Exhibit 2
11. The financial model is shown in Table 3.5 for the case of $1,000/kW and a 5 UScent/kWh tariff: the result of FIRR=32.3% replicates that shown in Table 3.4 as estimated by GCSPDA. With 2002 and 2003 tariffs in the range of 5-6 UScents/kWh (Table 3.2), the profitability of mini-hydro projects is clear. In constant terms the FIRR is 25.8%.
Table 3.5: Financial model, mini hydro-1 0 1 2 3 4 5 6 7 8 9 10
exchange rate 0.07 [Rs/$] 94 101 108 115 123 132 141 151 162 173 185 198deflator [ ] 1 1.07 1.14 1.23 1.31 1.40 1.50 1.61 1.72 1.84 1.97 2.10capital cost 1000 [$/kW]debt 0.6 [ ]equity 0.4 [ ]disbursement profile [ ] 0.1 0.9capacity [MW] 1capital cost [1000$US] 1000
[RsMillion] 94energy 0.55 [MWh] 4818 4818 4818 4818 4818 4818 4818 4818 4818 4818tariff 0.05 [US$/kWh] 0.05 0.05 0.05 0.05 0.05 0.05 0.05 0.05 0.05 0.05 0.05 0.05
[Rs/kWh] 4.70 5.03 5.38 5.76 6.16 6.59 7.05 7.55 8.08 8.64 9.25 9.89revenue [RsMillion] 25.9 27.7 29.7 31.8 34.0 36.4 38.9 41.6 44.5 47.7
O&M costs 0.02 [RsMillion] -2.6 -2.8 -3.0 -3.2 -3.4 -3.6 -3.9 -4.2 -4.5 -4.8debt service [RsMillion] -21.4 -19.4 -17.4 -15.3 -13.3 0.0 0.0 0.0 0.0 0.0Equity 37.6 [RsMillion] -3.76 -33.8total financial flows, before tax [RsMillion] -3.8 -33.8 1.9 5.6 9.3 13.2 17.3 32.7 35.0 37.5 40.1 42.9income tax [RsMillion] -1.3 -1.8 -2.4 -3.0 -3.6 -4.2 -4.5 -4.9 -5.3 -5.7financial flows, after tax [RsMillion] -3.8 -33.8 0.6 3.7 7.0 10.3 13.7 28.5 30.5 32.6 34.8 37.2IRR [ ] 32.3%IRR[after x years] -35.7% -15.1% -1.6% 11.5% 18.3% 22.6% 25.3% 27.2%debt servicedebt balance [RsMillion] 56.4 56.4 45.1 33.8 22.6 11.3 0.0principal [RsMillion] 11.3 11.3 11.3 11.3 11.3interest 0.18 [RsMillion] 10.2 10.2 8.1 6.1 4.1 2.0total debt service [RsMillion] 10.2 21.4 19.4 17.4 15.3 13.3Income taxRevenue [RsMillion] 0.0 0.0 25.9 27.7 29.7 31.8 34.0 36.4 38.9 41.6 44.5 47.7O&M costs [RsMillion] 0.0 -2.6 -2.8 -3.0 -3.2 -3.4 -3.6 -3.9 -4.2 -4.5 -4.8Depreciation basis 1 [ ]Depreciation 20 [RsMillion] -4.7 -4.7 -4.7 -4.7 -4.7 -4.7 -4.7 -4.7 -4.7 -4.7Interest [RsMillion] -10.2 -10.2 -8.1 -6.1 -4.1 -2.0EBT [RsMillion] 0.0 -10.2 8.5 12.1 15.9 19.8 23.9 28.0 30.3 32.8 35.4 38.2taxRate [ ] 0.15 0.15 0.15 0.15 0.15 0.15 0.15 0.15 0.15 0.15Tax [RsMillion] 1.3 1.8 2.4 3.0 3.6 4.2 4.5 4.9 5.3 5.7
12. It should be noted that the 32.3% IRR calculated in Table 3.5 is the IRR achieved if the project goes to its expected lifetime of 20 years. The IRR achieved in earlier years, however, will be lower. This is illustrated by the IRR profile of Figure 1.4, which shows the IRR achieved at the end of each year of operation: we see that an 18% IRR is achieved by the end of year 7, and 27% be the end of year 10. In other words, if the tariff dropped in year 8 to zero, the IRR to the developer would be 18%. This relatively attractive risk profile further enhances the financial attractiveness to private sector entities.
- 34 -
13. When the returns are calculated in constant Rs., the FIRR to the developer falls to 23.5%, for which the corresponding economic rate of return is 25.8% (and 27.1% with carbon benefits at 15$/ton).
14. Table 3.6 shows the corresponding reconciliation of costs and benefits. The columns of this table represent the stakeholders, and the rows the individual transactions. Note that because the tariff is assumed to be equal to CEB’s avoided costs, electricity consumers do not benefit. Rather the net benefits are distributed among the developer, government, and the financial institutions.
11
___________________________________________11. A surplus accrues to the financial institutions because the assumed financial rate of interest (18%) exceeds the discount rate (12%).
- 35 -

Table 3.6: Distribution of costs and benefits (NPV, constant 2002 RsMillion)
Developer Govt financial institutions
CEB Economic global env. (15$/ton)
Economic (with ENV)
Economic benefit 154.4 154.4 154.4 environmental benefits 6.9 6.9 costs: 0.0 Construction -75.8 4.6 -71.3 -71.3 Revenue 154.4 -154.4 0.0 0.0 O&M costs -15.4 1.5 -13.9 -13.9 debt service: 45.5 -45.5 0.0 0.0 debt service: repayment -51.2 51.2 0.0 0.0
transfer payments corporate income tax -13.8 13.8 0.0 0.0 Customs duty 0.0 0.0 0.0 0.0 Total 43.6 19.9 5.7 0.0 69.2 6.9 76.1
15. Summary assessment. Table 3.7 shows the comparisons of ERR and FIRR at appraisal and as achieved to date. In order to preserve the confidentiality of the cost information, the achieved values are based on a representative project whose costs and performance reflect the industry average. Both the achieved ERR and FIRR are significantly above that estimated at appraisal, notwithstanding that CEB’s announced avoided cost tariff likely underestimates the actual avoided cost.
Table 3.7: Summary Assessment, mini hydro projects
Appraisal (1) AchievedEllaPitiya Ella Generic
ProjectERR 18% 25.8%ERR with carbon benefit Not calculated 27.1%FIRR 13% 23.5%(1) GEF, Republic of Sri Lanka, Energy Service Delivery Project, Project Document, February 1998.
B. Village based hydro projects
16. Introduction. The economic analysis of the village hydro component benefits from the survey conducted by A. C. Nielson, which surveyed 100 village hydro system (VHS) beneficiaries, and which permits more precise assessment of benefits than was possible at appraisal. They also surveyed 30 village hydro systems. In additional, the records of DFCC that record all the loan disbursements under ESD provide further information. On the other hand, because of generally inadequate record-keeping of kWh generation by the village cooperatives, it is difficult to precisely determine achieved actual monthly and annual capacity factors, which serve as an important cross-check of benefits as revealed by the surveys of the beneficiaries.
17. Assumptions and ERR at appraisal. The following key assumptions were made at appraisal for the calculation of the ERR and FIRR: capital cost: 2,023$/kW; O&M cost : 1% of capital cost; Discount rate: 12%; Installed capacity: 15kW; Capacity factor: 50%; GEF Grant: 400$/kW (6,000$ for a 15kW
- 36 -

system); Number of customers per system: 150; Benefit per kWh: 5.4 UScents/kWh. Based on these assumptions, the ERR as reported in the PAD was calculated at 12%, exclusive of all grants (Table 3.8).
- 37 -

Table 3.8: ERR at appraisalNPV 1996 1997 1998 1999 2000 2001 2002 2003 2004
0 1 2 3 4 5 6 7 8capital cost 2024 [$/kW]kW 15 [kW] GEF [$US] 5357 6000capital costs [$US] -27102 -30355O&M costs 0.8% [$US] -1680 -252 -252 -252 -252 -252 -252 -252 -252total costs [$US] -23425 -24355 -252 -252 -252 -252 -252 -252 -252 -252capacity factor 0.500 [ ]benefit/kWh 0.054 [$/kWh]benefits [GWh/year] 65700 65700 65700 65700 65700 65700 65700 65700
[$US] 23643 3545 3545 3545 3545 3545 3545 3545 3545total flows [$US] 218 -24355 3293 3293 3293 3293 3293 3293 3293 3293ERR [ ] 12.2%
Note: Extract, all ERR calculations done for 20 years of operation.
18. Achieved Capital costs. The completed project costs reported by the Survey of VHS are shown in Figure 2.1, and show an average capital cost of $1,892/kW.
12 This compares to the economic capital cost
assumed at appraisal of $2,023/kW.
19. Capacity factor. As noted, the records of kWh actually produced are sparse, notwithstanding instructions given to the operators by the developers and consultants that monthly readings of the kWh meter should be entered in the station logbooks. Actual meter readings were available for only 7 of 30 VHS systems. The period of operation could be inferred from 17 projects from knowledge of commissioning dates to derive average annual kWh, and hence estimate the average capacity factor. However, even in this case, the capacity factors estimated for two of the VHS are unlikely (0.23 and 0.14) and suggest that meters were reset to zero or replaced at some point since commissioning). Nevertheless, it seems reasonable to infer than the achieved capacity factors are in the range of 80 to 95%. These capacity factors are substantially higher than the 50% estimated at appraisal. However, they are entirely plausible given the design philosophy, which is to match the size of the system to the dry season flows.
20. Clearly, if a village hydro system were only operated at a 50% capacity factor, then diesel backup would be needed to supply year-round power. Because these systems are installed small watersheds, generally well above gauging stations and since none of the VHS maintain records of gauged flows at the intake; the likely monthly variation in flows can only be inferred from precipitation records which are generally available.
13 Data of monthly variation in rainfall at the Ingoya Estate, on which the design flow
for the Handunella-Atulauda VHS is based show clearly that if one matches the design flow to January/February conditions, high annual capacity factors are achievable.
21. Achieved ERR. Based on the VHS beneficiaries’ average monthly expenditure on kerosene, batteries, dry cells of Rs322/month, and setting these equal to the benefit measure; and using the actually achieved capital cost of $1900/kW, then with the GEF grant taken as a benefit, the ERR for the same VHS (15kW, 150 households) as used at appraisal works out at 25.2% (Table 3.9). However, since the grant is not paid until the system is in place, the timing of the grant should be in year 1 (rather than year zero), which results in a reduction of ERR to 23.9%. Without the GEF grant component, the ERR is 19.6%. The implied valuation per kWh is 5.7 UScents/kWh.
- 38 -

___________________________________________12. Where the reported Rs costs are dived by the exchange rate of the year in which the projects were completed. 13. None of the feasibility studies that were sighted contained estimates of monthly flows at site.
- 39 -

Table 3.9: Achieved ERR (sample calculation, no GEF grant)
1996 1997 1998 1999 2000 2001 2002 2003 20040 1 2 3 4 5 6 7 8
capital cost 1900 [$/kW]kW 15.0 [kW] GEF [$US] 0 0capital costs [$US] -25446 -28500O&M costs 0.8% [$US] -1578 -237 -237 -237 -237 -237 -237 -237 -237total costs [$US] -27024 -28500 -237 -237 -237 -237 -237 -237 -237 -237capacity factor 0.800 [ ]benefit/kWh 0.057 [$/kWh]benefits [GWh] 105120 105120 105120 105120 105120 105120 105120 105120
[$US] 39850 5975 5975 5975 5975 5975 5975 5975 5975total flows [$US] 12826 -28500 5739 5739 5739 5739 5739 5739 5739 5739
[ ] 19.6%Household expenditure [Rs/month] 322total expenditure [Rs/year] 579600
[$US/year] 5975.3
Summary assessment
22. Table 3.10 shows the comparisons of ERR and FIRR at appraisal and as achieved to date. The achieved ERR is significantly greater than that estimated at appraisal. The achieved ERR is greater than that estimated at appraisal for three main reasons. First, capacity factors are significantly greater in practice than as estimated at appraisal, a consequence of the design approach followed by the leading consulting firms and developers which calls for systems to be sized on the basis of the available average dry season flow. Second, actual capital costs are slightly lower than estimated. Finally, expenditures for kerosene and battery prior to electric service have increased significantly since 1996 as a consequence of real income gains (and by more than the CPI), and consequently the willingness to pay for electric service is higher. . Economic returns are even higher when additional consumer benefits are taken into account (based on estimates of the demand curve for the first tranche of high-valued electricity used for lighting and TV viewing, as verified for SHS beneficiaries).
Table 3.10: Summary Assessment, village hydro
Appraisal(1) Achieved(benefits at
avoided costs only)
Achieved(with
consumer surplus
benefits)EconomicERR (without GEF) 12% 18 54Costs (NPV at 12%), $USmillion 23400Benefits (NPV at 12%), $USmillion 23316Net benefit, $USmillion -684ERR (with GEF grant) 22 61
- 40 -

Financial (to VHS)FIRR 22% *Costs (NPV at 12%), $USmillion 17,487 *Benefits (NPV at 12%), $USmillion 26,633 *(1) GEF, Republic of Sri Lanka, Energy Service Delivery Project,
Project Document, February 1998.* not possible to estimate actual FIRR.
C. Solar home systems
23. ERR and FIRR at appraisal. The PAD economic and financial analysis is for a subproject that would serve 2200 medium income rural homes (target income greater than Rs3000/month) in the Galle district,
14
with a market share of 30% 30Watt systems, 40Watt systems 40%,15 and 50Watt systems 30%. The
values estimated in the PAD are ERR=12% and FIRR=19%.
24. In the ICR we follow the methodology recently developed for the Philippines Rural Energy Project,16
in which we assess benefits not only as replacement costs, but also on the basis of the gain in consumer surplus. This approach resolves the problem that the financial returns to the homeowner are in fact negative, because the cost of the PV system is invariably greater than the kerosene and battery costs it replaces. Yet homeowners are demonstrably willing to incur the higher financial costs of a solar system, because they place great value on the improved quality of lighting, and the greater convenience of being able to watch TV without the hassle of battery charging.
25. Achieved ERR. Table 3.11 shows the achieved ERR using avoided costs as the measure of benefits. These avoided costs are based on the findings of the AC Nielson survey, which show an average monthly expenditure on kerosene and battery charging prior to installation of SHS at Rs495/month (Rs5940/year). The ERR is 7.7%, and the FIRR (from the perspective of the homeowner) is -4.5%.
17 This result is
consistent with those found elsewhere, when avoided costs are used as the measure of economic benefit: in the Philippines, the ERR of a similar sized (40Wp) SHS was found to be 11.7%, similarly below the hurdle rate (though in the Philippines, 15% rather than 12% is used).
______________________________________ 14. The PAD notes for the financial analysis “given the focus on private sector provision of renewable energy services, the financial analysis incorporated elements of concern to private investors such as inflation, taxes, duties and financing terms and conditions. Present values of benefits and costs are given in nominal terms.” It is not entirely clear from whose perspective the FIRR is calculated.
15. The PAD actually states 42% in 40 Watt systems, but we assume this means 40% to bring the total to 100%.
16. P. Meier, Economic Analysis of Solar Home Systems: A Case Study for the Philippines, World Bank, Asia Alternative Energy program (ASTAE), February 2003.
17. The critical assumptions include: four year loan at 24% interest, with 25% down payment; discount rate 12%; VAT on SHS at 11% of retail price; Tax component of kerosene price limited to National Security Levy (1.23Rs/liter); and Solar home system retail price Rs 46,000 (for a 45Wp system).
- 41 -

Table 3.11: Economic and financial returns based on avoided costs
[unit] NPV 1 2 3 4 5 6 7 8costs of PV systemdown payment [Rs] 10268 11500GEF[to consumer] [Rs] 0 0Govt.Grant[to consumer] [Rs] 0 0loan principal [Rs] 30804 34500finanancial cost [Rs] 41071 46000finance [Rs] 38217 16905 14835 12765 10695loan repayments [Rs] -38217 -16905 -14835 -12765 -10695lessVAT&duties [Rs] -4107 -4600less income tax on margin [Rs] -5252 -5882less transfers [Rs] -4877 -5462economic capital cost [Rs] 26835 30055 0 0 0 0 0
O&M costsbulbs [Rs] 3539 582 582 582 582 582 582 582controller [Rs] 2465 3104battery [Rs] 8566 4753 4753financial cost to consumer [Rs] 14570 0 582 582 5335 582 3686 5335 582less VAT [Rs] -1457 0 -58 -58 -534 -58 -369 -534 -58economic O&M costs [Rs] 13113 0 524 524 4802 524 3317 4802 524Total economic costs [Rs] 39948 30055 524 524 4802 524 3317 4802 524
benefits at avoided costskerosene consumption [litres] 1314 216 216 216 216 216 216 216kerosene [Rs] 32118 5282 5282 5282 5282 5282 5282 5282battery&charging expenditure [Rs] 4006 659 659 659 659 659 659 659dry cell expenditures [Rs] 0 0 0 0 0 0 0 0hurricane lamp [Rs] 0 0 0 0petromax lamp [Rs] 0 0 0wick, gauzes [Rs] 0 0 0 0 0 0 0 0total, financial [Rs] 37437 0 5940 5940 5940 5940 5940 5940 5940kerosene duties [Rs] -1616 -266 -266 -266 -266 -266 -266 -266VAT [Rs] 0avoided costs, economic [Rs] 35822 0 5675 5675 5675 5675 5675 5675 5675
Net economic flows [Rs] -4126 -30055 5151 5151 873 5151 2357 873 5151ERR [ ] 7.7%net financial impact on consumersPV system [Rs] 63054 11500 17487 15417 18100 11277 3686 5335 582Replacement [Rs] 36124 0 5940 5940 5940 5940 5940 5940 5940net flow [Rs] -26930 -11500 -11547 -9477 -12160 -5337 2254 605 5358FRR [ ] -4.5%
Notes: Kerosene duty=National security levy, assumed at average 2002 value of Rs1.23/litre Extract only: Calculations done to 15 year assumed lifetime of SHS
26. Reconciliation of economic and financial flows among the various stakeholders shows that GEF is a source of funds, and shows up as a financier; while Government is a net beneficiary, since the VAT levied on the SHS (paid by the dealers) significantly exceeds any VAT on kerosene lamps and battery charging, and the National Security Levy on Kerosene. The financial flows to the individual homeowner show significantly higher costs during the early years (that require the down payment and the debt service payments).
27. Given the demonstrated willingness-to-pay for SHSs, whose cost is greater than the replacement costs, the economic returns must be higher than those assessed purely on the basis of the replacement costs. This can be captured by assessing the gain in so-called consumer surplus. Figure 3.1 shows the actual demand curve for lighting as estimated for a homeowner purchasing a 45Wp system.
Figure 3.1: Demand curve for lighting (based on 45Wp PV system)
- 42 -

0 200 400 600 800 10000
0.002
0.004
0.006
0.008
0.01
0.012
B=979
D=4303
C=296
E=2955
1000 lumen-hours/year
[Rs/
lum
en-h
r]
28. The corresponding set of consumer surplus calculations are shown in Table 3.12, with the distribution of costs and benefits as shown in Figure 3.2.
Figure 3.2: Distribution of costs and benefits
-10
0
10
20
30
40
11.7 11.8
4.8
-6.8
lighting:7.7
TV/radio:7.8
37.0
NP
V, [
Rs1
000]
consumer dealers govt FIs GEF total
- 43 -

Table 3.12: ERR with consumer surplus benefits
Consumer surplus poor households: 45Wp system[unit] NPV 1 2 3 4 5 6 7 8
Lighting costs, PVsystem[1] Allocated costs 70%[2] PV costs [financial] [Rs] 44138 8050 12241 10792 12670 7894 2580 3735 407[3] . . levelised [Rs] 44138 6329 6329 6329 6329 6329 6329 6329 6329[4] PV lighting [lumen-hours] 5593422 0 919800 919800 919800 919800 919800 919800 919800[5] P[PV] [Rs/lumen-hr] 0.0079[6] area [D+E] [Rs/year] 7258[7] Lighting costs, Kerosene [8] Fuelcost [Rs] 0 5282 5282 5282 5282 5282 5282 5282[9] wick lamp [Rs] 0 0 0 0 0 0 0 0[10] petromax lamp [Rs] 0 0 0 0 0 0 0 0[11] wick, gauzes [Rs] 0 0 0 0 0 0 0[12] total costs [Rs] 32118 0 5282 5282 5282 5282 5282 5282 5282[13] Kerolighting [lumen-hours] 3315928 545282 545282 545282 545282 545282 545282 545282[14] P[KERO] [Rs/litre] 0.0097[15] area [B+D] [Rs/year] 5282[16] Radio/TV: PV system[17] allocated costs 30%[18] PV costs [financial] [Rs] 18916 3450 5246 4625 5430 3383 1106 1601 175[19] .. levelised [Rs] 18916 2712 2712 2712 2712 2712 2712 2712 2712[20] PV non-lighting [VL-hours] 11098 1825 1825 1825 1825 1825 1825 1825[21] P[PV] [Rs/TV-hr] 1.7[22] area [D+E] [Rs/year] 3111[23] Radio/TV: battery[24] total costs [Rs] 4006 0 659 659 659 659 659 659 659[25] PV non-lighting [VL-hours] 1665 274 274 274 274 274 274 274[26] P[battery] [Rs/TV-hr] 2.4[27] area [B+D] [Rs/year] 659[28] Net economic flows[29] Lighting[see chart][30] total benefits [B+C+D+E] [Rs/year] 51887 0 8532 8532 8532 8532 8532 8532 8532[31] total costs [D+E] [Rs/year] 44138 6329 6329 6329 6329 6329 6329 6329 6329[32] net consumer benefits, lighting [Rs/year] 7749 -6329 2203 2203 2203 2203 2203 2203 2203[33] TV/radio[34] total benefits [B+C+D+E] [Rs/year] 26708 4392 4392 4392 4392 4392 4392 4392[35] total costs [D+E] [Rs/year] 18916 3450 5246 4625 5430 3383 1106 1601 175[36] net consumer benefits, TV/Radio [Rs/year] 7792 -3450 -854 -233 -1038 1009 3286 2792 4217[37] total consumer surplus [Rs/year] 15541 -9779 1349 1970 1165 3212 5490 4995 6421[38] [ERR] 30.7%[39] total financial costs [Rs/year] -63054 -11500 -17487 -15417 -18100 -11277 -3686 -5335 -582[40] total CS benefit [Rs/year] 78595 0 12924 12924 12924 12924 12924 12924 12924[41] net financial flows [Rs/year] 15541 -11500 -4563 -2493 -5176 1647 9238 7589 12342[42] [ERR] 21.1%[43] economic cost adjustment [Rs/year] -0 -30055 4413 4413 4413 4413 4413 4413 4413[44] [Rs/year] 15541 -41555 -150 1920 -763 6060 13651 12002 16755[45] [ERR] 16.8%[46] . . less net govt. subsidies [Rs/year] 11795 13211[47] . . less GEF subsidies [Rs/year] -6790 -7605[48] . . plus FI surplus [Rs/year] 4819 5397[49] . . plus dealer surplus [Rs/year] 11667 13067[50] net economic flows [Rs/year] 37032 -17485 -150 1920 -763 6060 13651 12002 16755[51] [ERR] 31.0%[52] with GEF as Economic benefit [Rs/year] 43822 -9881 -150 1920 -763 6060 13651 12002 16755[53] [ERR] 42.6%
source: Extract only, calculations done for the15-year assumed life of the PV system.Notes(1) The “economic cost adjustment” of rows [43]-[45] is required because without it, the series of economic flows has more than one turning point (because the subsidies and other adjustments occur in year one), for which the ERR then becomes indeterminate. The NPV calculations are unaffected. (2) The adjustment for taking the GEF contribution as a benefit in year 1 is as per the World Bank procedures (OP 10.4). In effect one assumes that the global environmental benefit is exactly equal to this contribution, and hence benefits
- 44 -

increase by this amount.
- 45 -

29. Summary assessment. Table 3.13 shows the comparisons of ERR and FIRR at appraisal and as achieved to date. The NPV values at appraisal are converted to a per household value.
18 For the FIRR, it
is impossible to determine the financial returns to the dealers, since the information on their margins and return is confidential. The achieved ERR is significantly higher than estimated at appraisal because we use the gain in consumer surplus to capture the observed willingness to pay for SHS that is far in excess of the replacement costs of kerosene and battery charging equipment.
Table 3.13: Summary Assessment, SHS
Appraisal(1) AchievedEconomicERR(without GEF) Not shown 31%Costs (NPV at 12%), $US. 603 650Benefits(NPV at 12%), $US 610 810ERR(with GEF grant) 12% 42.6%Financial (for NGO subproject)FIRR 19% Cannot be
calculated, likelyto be 20%+
Costs (NPV at 12%), $US 566Benefits(NPV at 12%), $US 638Financial (Household)FIRR Not calculated -4.5%
(1) GEF, Republic of Sri Lanka, Energy Service Delivery Project, Project Document, February 1998
D. Pilot wind farm
30. Capital costs. At appraisal, the capital cost of the wind farm was estimated at $3.44million, or 1,175$/kW,
19 based on a 13 x 225kV configuration. The actual (completed) economic cost was $3.52
million, based on a 5 x 600kW configuration, also at cost of 1,175$/kW. The estimated and actual costs are shown in Table 3.14. Construction costs are therefore satisfactorily close to those estimated at appraisal.
__________________________________18. i.e. the values are divided by the 2,200 homes assumed to be served by the subproject.19. GEF, Republic of Sri Lanka, Energy Service Delivery Project, Project Document, February 1998: Annex 4A (Table 4A.2).
- 46 -

Table 3.14: Capital costs: Appraisal v. Actuals ($US 1000)
Feasibility study(2) Appraisal(3) Actuals(1)configuration 13 x 225 13 x 225 5 x 600Economic costs:Equipment 3039 2,773Civil works (“essential”) 210Civil Works (non-essential) 331Transport 171Other 39Balance of station 755Total 3,654 3,436 3,524(as $/kW) $1,249/kW $1,175/kW $1,175/kWTaxes and dutiesCustoms (on imports) 127GST (on imports) 59Defense levy (on imports) 19GST on local costs 16Other CEB costs 52TtoalTaxes and duties 819(4) (5)Total project cost(financial) 4612 3807(1) CEB, 3MW Pilot Wind Power Project: Analysis on Cost of Generation, PPP Branch, May 2001.(2) RLA Consulting, Feasibility Study for a 3MW Pilot Project in Sri Lanka, Report to CEB, September 1996(3) GEF, Republic of Sri Lanka, Energy Service Delivery Project, Project Document, February 1998.(4) estimated at 27% of equipment cost. (5) estimated at 10% of import cost. However, the import fraction is not given in the PAD, and therefore cannot be estimated.
31. Generation. The monthly and annual capacity factors since start-up are shown in Figure 3.3. It is evident that the annual capacity factors achieved are significantly below the 26.7% used as a basis for estimating the ERR at appraisal.
Figure 3.3: Monthly and annual capacity factors
- 47 -

0
0.1
0.2
0.3
1999avg=17.4%
2000avg=12.7% 2001avg=13.2%2002avg=13.8%
@appraisal=26.7%M
Wh/
mon
th
Apr-99Aug-99
Dec-99Apr-2000
Aug-2000Dec-2000
Apr-2001Aug-2001
Dec-2001Apr-2002
Aug-2002Dec-2002
32. However, overall annual wind speeds are somewhat lower than those assumed in the feasibility study, as shown in Figure 3.4. The long-term average at Hambantota (1986-1995) is 5.74 m/s, as opposed to the actually achieved average of 5.15 m/s at site (from startup to February 2003). This explains largely the difference in the calculated rates of return.
Figure 3.4:Annual average wind speeds
4.5
5
5.5
6
6.5
5.8
5.65.6
6.1
5.75.7
6.1
5.65.6
5.6
5.4
5.3
5.7
4.9
Feasibility Study (Hambantota)
Actual, @site
ann
ual
ave
rag
e w
ind
spee
d, m
/s
1986 1987 1988 1989 1990 1991 1992 1993 1994 1995 1999 2000 2001 2002
33. Economic returns. The estimated economic rates of return (ERR) are shown in Table 3.15, using the avoided cost of 6.3 UScents/kWh assumed in the appraisal report. This value is used in the economic analysis insofar as there are doubts as to whether the CEB tariff reflects the actual avoided costs (an issue discussed in detail in Section 3). The 3.9% ERR (including the GEF grant) is uneconomic and significantly
- 48 -

below the 14.6% ERR estimated at appraisal. This difference is largely contributed to the substantially lower wind speeds during these first years of operation. A sensitive analyses has been done with the long term average wind speeds, the ERR is 12%.
Table 3.15: Estimates of ERR (including GEF)
NPV 1998 1999 2000 2001 2002 2003 2004 2005 20061 2 3 4 5 6 7
A. Feasibility studyenegry [MWh] 6834 6834 6834 6834 6834 6834 6834 6834
Capital Cost -3263 -3655GEF 786 880O&M costs -500 -75 -75 -75 -75 -75 -75 -75 -75total costs -2978 -2775 -75 -75 -75 -75 -75 -75 -75 -75
benefits 0.0634 2891 433 433 433 433 433 433 433 433
total flows -87 -2775 358 358 358 358 358 358 358 358ERR 11.4%B. Appraisal Reportenergy [MWh] 6841 6841 6841 6841 6841 6841 6841 6841
Capital Cost -3069 -3437GEF 786 880O&M costs -229 -34 -34 -34 -34 -34 -34 -34 -34total costs -2512 -2557 -34 -34 -34 -34 -34 -34 -34 -34
benefits 0.0634 2893 434 434 434 434 434 434 434 434
total flows 381 -2557 399 399 399 399 399 399 399 399ERR 14.6%C. Actualsenergy [MWh] 3459 3362 3455 3644 3480 3480 3480 3480
Capital Cost -3069 -3437GEF 786 880O&M costs -229 -34 -34 -34 -34 -34 -34 -34 -34total costs -2512 -2557 -34 -34 -34 -34 -34 -34 -34 -34
benefits 0.0634 1470 219 213 219 231 221 221 221 221
total flows -1042 -2557 185 179 185 197 186 186 186 186ERR 3.9%
34. Financial returns. Table 3.16 shows the financial analysis, based on the actual capital and operating costs (and actual level of GEF grant), actual generation, and financing assumptions as at appraisal: income tax: zero; 50:50 debt equity; 17 year loan term, 2 years grace, 13% interest; depreciation period:3 years; and, tariff at actual CEB avoided cost tariff.
The resulting FIRR, -2.1% is significantly below that estimated at appraisal, again for the obvious reason
- 49 -

of the low achieved capacity factor because of the below average wind speeds.
These are not the most realistic assumptions for purposes of gauging private sector interest. Better would be the assumption of supplier credit financing for equipment, say 7 year loan at 8% with a 30:70 equity:debt ratio; income tax at the concessionary BoI rate, and 20-year SLD depreciation. We may also assume that at least over the next decade, the avoided cost tariff would be around 6 UScents/kWh. Under these assumptions the FIRR compute as shown in Table 3.16.
Table 3.16: Wind-farm FIRR
Capacity factor Achieved(13.9%)
Estimated atappraisal (26.7%)
Good site33%
At actual CEB tariffPAD assumptions -4.3% 8% 12.8%Typical IPP assumptions
-1.1% 9.6% 14.2%
At 6.3UScents/kWhPAD assumptions -2.1% 12.5% 19%Typical IPP assumptions 0.9% 14% 20.4%
35. Clearly, for there to be realistic private sector wind project development, sites with capacity factors of less than 25% are required, and for FIRR around the required 20%, sites will need to be found that allow capacity factors of more than 30%.
36. Summary assessment. Table 3.17 shows the comparisons of ERR and FIRR at appraisal and as achieved to date. The achieved ERR and FIRR are based on the assumption that the long-term average capacity factor is the average achieved to date. The achieved ERR is significantly below that estimated at appraisal. The main reason for this is the mismatch of the machines actually built to the prevailing wind regime. Measured wind speeds are also slightly lower than the long term averages of the feasibility study, which appears to be a consequence of the lower than average wind speeds for the past two years. Actual capital and operating costs are close to those estimated at appraisal.
Table 3.17: Summary Assessment, wind power
Feasibility study(1)
Appraisal(2)
Achieved
13 x 225kW 13 x 225kW 5 x 600kWEconomicERR(without GEF) 7.5% 9.8% 0.8%ERR with GEF 11.4% 14% 3.9%Costs (NPV at 12%), $USm 2.5 2.5Benefits(NPV at 12%), $USm 2.9 1.5Net benefit, $USm 0.4 -1.0FinancialFIRR 11% 0.9%Costs (NPV at 12%), $USm 2.9 2.6Benefits(NPV at 12%), $USm 2.8 1.5(1) RLA Consulting, Feasibility Study for a 3MW Pilot Project in Sri Lanka, Report to CEB, September 1996
- 50 -

(2) GEF, Republic of Sri Lanka, Energy Service Delivery Project, Project Document, February 1998.
- 51 -
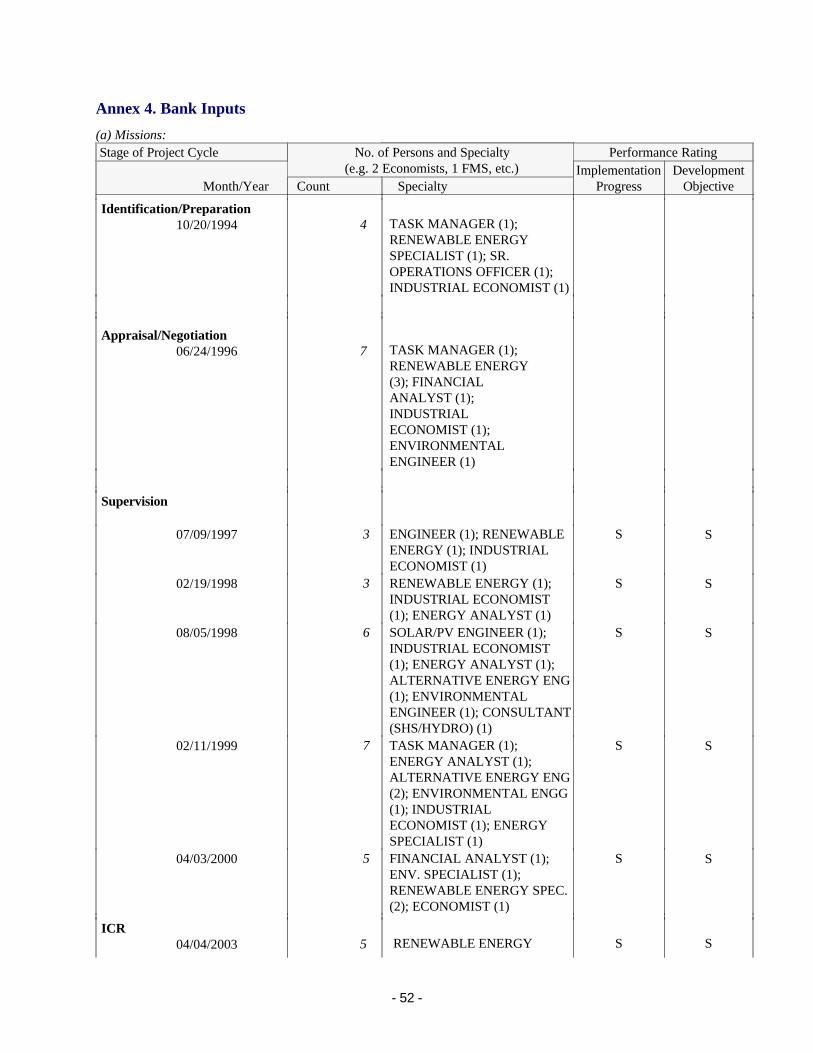
Annex 4. Bank Inputs
(a) Missions:Stage of Project Cycle Performance Rating No. of Persons and Specialty
(e.g. 2 Economists, 1 FMS, etc.)Month/Year Count Specialty
ImplementationProgress
DevelopmentObjective
Identification/Preparation10/20/1994 4 TASK MANAGER (1);
RENEWABLE ENERGY SPECIALIST (1); SR. OPERATIONS OFFICER (1); INDUSTRIAL ECONOMIST (1)
Appraisal/Negotiation06/24/1996 7 TASK MANAGER (1);
RENEWABLE ENERGY (3); FINANCIAL ANALYST (1); INDUSTRIAL ECONOMIST (1); ENVIRONMENTAL ENGINEER (1)
Supervision
07/09/1997 3 ENGINEER (1); RENEWABLE ENERGY (1); INDUSTRIAL ECONOMIST (1)
S S
02/19/1998 3 RENEWABLE ENERGY (1); INDUSTRIAL ECONOMIST (1); ENERGY ANALYST (1)
S S
08/05/1998 6 SOLAR/PV ENGINEER (1); INDUSTRIAL ECONOMIST (1); ENERGY ANALYST (1); ALTERNATIVE ENERGY ENG (1); ENVIRONMENTAL ENGINEER (1); CONSULTANT (SHS/HYDRO) (1)
S S
02/11/1999 7 TASK MANAGER (1); ENERGY ANALYST (1); ALTERNATIVE ENERGY ENG (2); ENVIRONMENTAL ENGG (1); INDUSTRIAL ECONOMIST (1); ENERGY SPECIALIST (1)
S S
04/03/2000 5 FINANCIAL ANALYST (1); ENV. SPECIALIST (1); RENEWABLE ENERGY SPEC. (2); ECONOMIST (1)
S S
ICR04/04/2003 5 RENEWABLE ENERGY S S
- 52 -

SPECIALIST (1); ECONOMIST (1); PROCUREMENT SPECIALIST (1); ENV. SPECIALIST (1); FINANCIAL MANGEMENT (1)
(b) Staff:
Stage of Project Cycle Actual/Latest EstimateNo. Staff weeks US$ ('000)
Identification/Preparation 193.80 524.10Appraisal/Negotiation 243.30 251.80Supervision 161.04 483.1ICR 8.32 25.00Total 606.46 1284.00
- 53 -

Annex 5. Ratings for Achievement of Objectives/Outputs of Components(H=High, SU=Substantial, M=Modest, N=Negligible, NA=Not Applicable)
RatingMacro policies H SU M N NASector Policies H SU M N NAPhysical H SU M N NAFinancial H SU M N NAInstitutional Development H SU M N NAEnvironmental H SU M N NA
SocialPoverty Reduction H SU M N NAGender H SU M N NAOther (Please specify) H SU M N NA
Private sector development H SU M N NAPublic sector management H SU M N NAOther (Please specify) H SU M N NA
- 54 -

Annex 6. Ratings of Bank and Borrower Performance
(HS=Highly Satisfactory, S=Satisfactory, U=Unsatisfactory, HU=Highly Unsatisfactory)
6.1 Bank performance Rating
Lending HS S U HUSupervision HS S U HUOverall HS S U HU
6.2 Borrower performance Rating
Preparation HS S U HUGovernment implementation performance HS S U HUImplementation agency performance HS S U HUOverall HS S U HU
- 55 -
Annex 7. List of Supporting Documents
(1) The World Bank, Sri Lanka Energy Service Delivery Project, Project Document, February 1998(2) The World Bank, Renewable Energy for Rural Energy Development Project, Project Appraisal Document, June 2002.(3) R. Masse, Impact on Poverty and Gender of Rural Electricifcation Programs in Sri Lanka, October 2001.(4) Interantional Resources Group Inc, Sri Lanka Energy Services delivery Project, Impacts Assessment and Lessons Learned, April 2003.(5) AC Nielson Ltd, Statistical Baseline Survey of Renewable Energy projects, Draft Report, April 2003.(6) T. Siyamabalpitiya, Study on Grid Connected Small Power Tariff, Sri Lanka, Final Report, June 2001.(7) Grid Connected Small Power Developers Association (GCCPDA), A Policy Framework for
Accelerated Development of Small Hydro Power, January 2002(8) Consultancy and Professional Services (Pvt), Feasibility Study of the Proposed Village Hydro Project at Handunella-Atulauda, May 1999.(9) Consultancy and Professional Services (Pvt), Feasibility study on the establishment of a new
village hydro project at Pathavita under Sri Lanka Energy services Delivery Project, November 1995.
(10) P. Meier, Economic Analysis of Solar Home Systems: A Case Study for the Philippines, World Bank, Asia Alternative Energy program (ASTAE), February 2003.
(11) Ceylon Electricity Board, Wind Energy Resources Assessment, Southern Lowlands of Sri Lanka, May 1992(12) Ceylon Electricity Board, 3MW Wind Power Pilot Project, Semi-Annual report on Performance, July-December 2000.(13) RLA Consulting, Feasibility Study for a 3MW Pilot Project in Sri Lanka, Report to CEB, September 1996.(14) T. Wiesenthal,T., P. Meier, and D. Milborrow, Statistical Analysis of wind farm costs and policy regimes, ASTAE, Washington, DC, 2001.(15) P. Meier, China Renewable Energy Scaleup Programme (CRESP), Economic Analysis, Volume I, World Bank, 2003.(16) Frontier Economics, Cost Benefit Analysis for Renewable Energy in Croatia, Report to the Government of Croatia and World Bank/GEF, April 2003.(17) European Commission, White Paper on Renewable Energy, 1997.
- 56 -

- 57 -