Embed Size (px)
Citation preview

8/4/2019 The Winds of Change by Mario Ricchio, Director of Research at Paisley Financial
http://slidepdf.com/reader/full/the-winds-of-change-by-mario-ricchio-director-of-research-at-paisley-financial 1/38
8/4/2019 The Winds of Change by Mario Ricchio, Director of Research at Paisley Financial
http://slidepdf.com/reader/full/the-winds-of-change-by-mario-ricchio-director-of-research-at-paisley-financial 2/38
PAISLEY FINANCIAL AUGUST 2011 MACROECONOMIC OUTLOOK
P a i s l e y F i n a n c i a l | 1 . 3 1 2 . 8 7 8 . 8 5 0 0 | w w w . p a i s l e y f i n a n c i a l . c o m 2
THE WINDS OF CHANGE
EXECUTIVE SUMMARY
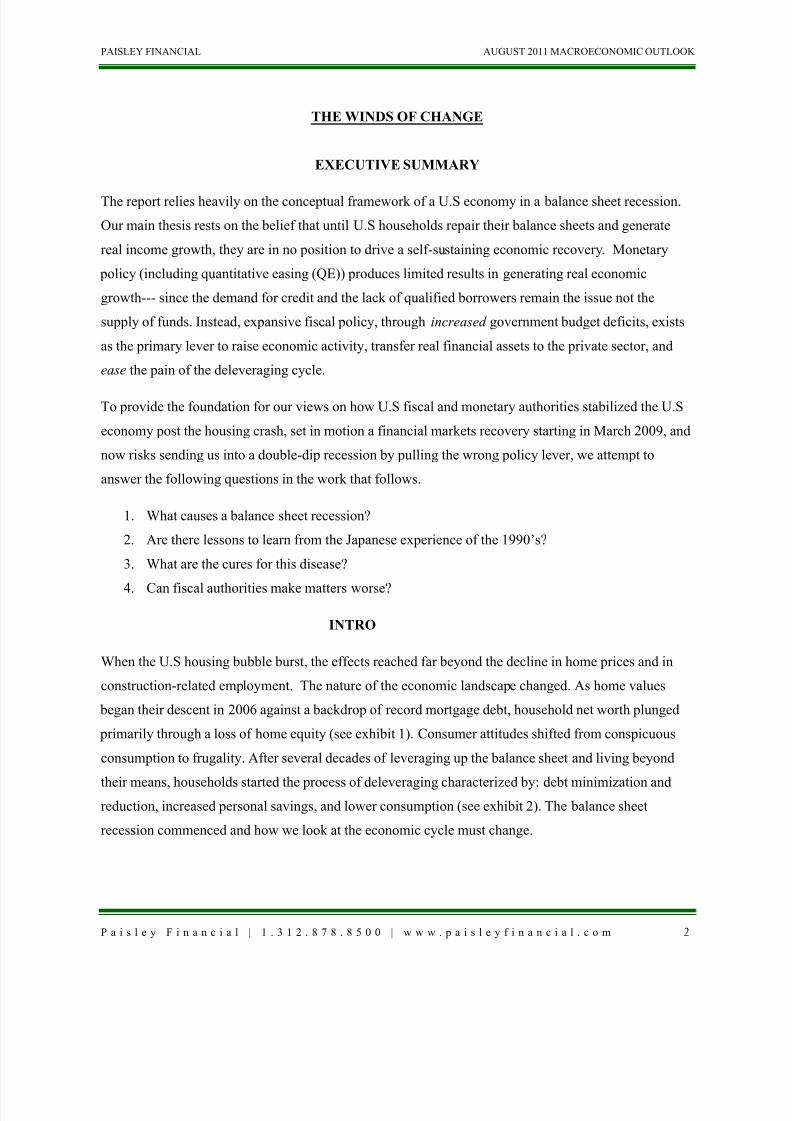
The report relies heavily on the conceptual framework of a U.S economy in a balance sheet recession.
Our main thesis rests on the belief that until U.S households repair their balance sheets and generate
real income growth, they are in no position to drive a self-sustaining economic recovery. Monetary
policy (including quantitative easing (QE)) produces limited results in generating real economic
growth--- since the demand for credit and the lack of qualified borrowers remain the issue not the
supply of funds. Instead, expansive fiscal policy, through increased government budget deficits, exists
as the primary lever to raise economic activity, transfer real financial assets to the private sector, and
ease the pain of the deleveraging cycle.
To provide the foundation for our views on how U.S fiscal and monetary authorities stabilized the U.S
economy post the housing crash, set in motion a financial markets recovery starting in March 2009, and
now risks sending us into a double-dip recession by pulling the wrong policy lever, we attempt to
answer the following questions in the work that follows.
1. What causes a balance sheet recession?
2. Are there lessons to learn from the Japanese experience of the 1990’s?
3. What are the cures for this disease?
4. Can fiscal authorities make matters worse?
INTRO
When the U.S housing bubble burst, the effects reached far beyond the decline in home prices and in
construction-related employment. The nature of the economic landscape changed. As home values
began their descent in 2006 against a backdrop of record mortgage debt, household net worth plunged
primarily through a loss of home equity (see exhibit 1). Consumer attitudes shifted from conspicuous
consumption to frugality. After several decades of leveraging up the balance sheet and living beyond
their means, households started the process of deleveraging characterized by: debt minimization and
reduction, increased personal savings, and lower consumption (see exhibit 2). The balance sheet
recession commenced and how we look at the economic cycle must change.

8/4/2019 The Winds of Change by Mario Ricchio, Director of Research at Paisley Financial
http://slidepdf.com/reader/full/the-winds-of-change-by-mario-ricchio-director-of-research-at-paisley-financial 3/38
PAISLEY FINANCIAL AUGUST 2011 MACROECONOMIC OUTLOOK
P a i s l e y F i n a n c i a l | 1 . 3 1 2 . 8 7 8 . 8 5 0 0 | w w w . p a i s l e y f i n a n c i a l . c o m 3
If we could first know where we are,
And whither we are tending,
We could better judge what to do
And how to do it.
-Abraham Lincoln, 1858
THE PRECURSOR TO A BALANCE SHEET RECESSION
A debt-financed asset bubble precedes a balance sheet recession. Consequently, we begin by
paraphrasing the thoughts of legendary hedge fund manager, Ray Dalio, on the cycle leading up to the
collapse. A healthy economic expansion starts with a private sector (corporate or household) agent
holding minimal debt. The private sector begins to see income rise at the pace of GDP. At this stage of
the economic expansion, the majority of aggregate demand comes from cash-based income.
For example, let’s assume the private sector spends $1,000 of cash income (which contributes to the
economy); now someone else has $1,000 of income. As the economy expands, the private sector feels
more optimistic and decides to leverage up the balance sheet by going to the bank and borrowing $100
per year against $1,000 of income. Now with added funds in hand, the private sector agent decides tospend the full $1,100, which becomes someone else’s income of $1,100, and contributes an added $100
of aggregate demand to the economy relative to a scenario with no borrowing at all. The private sector
agent earning the $1,100 income decides to go to the bank and borrow $150 per year.
35
40
45
50
55
60
65
70
75
80
85
1 / 1 / 1 9 4 6
1 / 1 / 1 9 5 0
1 / 1 / 1 9 5 4
1 / 1 / 1 9 5 8
1 / 1 / 1 9 6 2
1 / 1 / 1 9 6 6
1 / 1 / 1 9 7 0
1 / 1 / 1 9 7 4
1 / 1 / 1 9 7 8
1 / 1 / 1 9 8 2
1 / 1 / 1 9 8 6
1 / 1 / 1 9 9 0
1 / 1 / 1 9 9 4
1 / 1 / 1 9 9 8
1 / 1 / 2 0 0 2
1 / 1 / 2 0 0 6
1 / 1 / 2 0 1 0
P e r c e n t
Owners' Equity as Percentage of Household Real Estate
Source: Federal Reserve: Flow of Funds
At the end of Q1 2011, Owners' Equity
reached a record low of 38%
Exhibit 1
At the end of Q1 2011, Owners' Equity
reached a record low of 38%
Exhibit 1
60%
80%
100%
120%
140%
1 9 7 6 - 0 1 - 0 1
1 9 7 9 - 0 1 - 0 1
1 9 8 2 - 0 1 - 0 1
1 9 8 5 - 0 1 - 0 1
1 9 8 8 - 0 1 - 0 1
1 9 9 1 - 0 1 - 0 1
1 9 9 4 - 0 1 - 0 1
1 9 9 7 - 0 1 - 0 1
2 0 0 0 - 0 1 - 0 1
2 0 0 3 - 0 1 - 0 1
2 0 0 6 - 0 1 - 0 1
2 0 0 9 - 0 1 - 0 1
Total U.S. household liabilities as a share of personal
disposable income
Source: Bureau of Economic Analysis; Federal Reserve Flow of Funds
Exhibit 2

8/4/2019 The Winds of Change by Mario Ricchio, Director of Research at Paisley Financial
http://slidepdf.com/reader/full/the-winds-of-change-by-mario-ricchio-director-of-research-at-paisley-financial 4/38
PAISLEY FINANCIAL AUGUST 2011 MACROECONOMIC OUTLOOK
P a i s l e y F i n a n c i a l | 1 . 3 1 2 . 8 7 8 . 8 5 0 0 | w w w . p a i s l e y f i n a n c i a l . c o m 4
The income and the borrowed funds get spent in full, adds to GDP, and the $1,250 becomes someone
else’s income. The private sector agent earning $1,250 income goes to the bank and borrows $200 per
year. All the funds get spent on goods and services, which add to aggregate demand, and the $1,450
becomes someone else’s income. This becomes a self-reinforcing positive cycle of higher debts andhigher income. Unfortunately, debt begins to rise faster than income.
In the later stages of the business cycle, an asset bubble forms. The private sector borrows funds to buy
financial assets (eg. houses) in anticipation of higher prices. Essentially, the buying becomes
speculative and highly leveraged. The bubble pops when the debt (eg. mortgages) underlying the asset
price (eg. houses) rises beyond the ability of private sector income to service the outstanding loan
obligation. Asset prices collapse and the liabilities remain. This triggers a balance sheet recession and a
long period of deleveraging1
FEATURES OF A BALANCE SHEET RECESSION
.
DEBT MINIMIZATION
Since asset prices decline (eg. house prices) well below the value of corresponding liabilities (eg.
mortgages), balance sheets become impaired (eg. negative equity or negative net worth). In order to
repair balance sheets, the private sector moves away from profit maximization to debt minimization2.
The deleveraging cycle ends up reducing funding needs. Unfortunately, with no borrowers, theeconomy loses aggregate demand equivalent to the sum of un-borrowed savings and debt repayment
3
1 CNBC. (Producer). (2011). Hedge Fund Titan’s Principles (video file). Available from http://video.cnbc.com/gallery/?video=3000008442
.
Even in a zero interest rate environment, the private sector refrains from taking on added liabilities (see
exhibit 3). This outcome renders monetary policy ineffective by creating a liquidity trap.
2 Koo, R. (2009). The Holy Grail of Macroeconomics: Lessons from Japan’s Great Recession. Singapore: John Wiley & Sons (Asia).3 Koo, R. (2010, May). Lessons from Japan: Fighting a Balance Sheet Recession. Tokyo, Japan.

8/4/2019 The Winds of Change by Mario Ricchio, Director of Research at Paisley Financial
http://slidepdf.com/reader/full/the-winds-of-change-by-mario-ricchio-director-of-research-at-paisley-financial 5/38
PAISLEY FINANCIAL AUGUST 2011 MACROECONOMIC OUTLOOK
P a i s l e y F i n a n c i a l | 1 . 3 1 2 . 8 7 8 . 8 5 0 0 | w w w . p a i s l e y f i n a n c i a l . c o m 5
DEBT REDUCTION
Another way to de-lever resides in debt reduction. In the household sector, the majority of income goes
into reducing outstanding liabilities rather than boosting consumption. This translates into a higher
personal savings rate. As for the corporate sector, profits and cash balances are used to pay down debt
rather than being reinvested back into the business. When the Japanese property and stock bubble burst
in 1990, corporations turned into net savers by paying down debt and increasing cash balances (see
exhibit 4). Bankruptcy and mortgage principle write-downs provide two other options to lower system
wide debt.
-25,000
-12,500
0
12,500
25,000
37,500
50,000
1 / 1 / 1 9 8 0
1 / 1 / 1 9 8 2
1 / 1 / 1 9 8 4
1 / 1 / 1 9 8 6
1 / 1 / 1 9 8 8
1 / 1 / 1 9 9 0
1 / 1 / 1 9 9 2
1 / 1 / 1 9 9 4
1 / 1 / 1 9 9 6
1 / 1 / 1 9 9 8
1 / 1 / 2 0 0 0
1 / 1 / 2 0 0 2
1 / 1 / 2 0 0 4
1 / 1 / 2 0 0 6
Japanese non-financial corporations, annual change in
loan liabilities
B i l l i o n o f Y e
n
Rate of change
in loan growth
peaked in 1989
Corporate loan liabilities
shrank in 8 of the 9 years
between 1996-2004
Source: Cabinet Office, Government of Japan
Exhibit 3
-10
-5
0
5
10
1 / 1 / 1 9 8 0
1 / 1 / 1 9 8 3
1 / 1 / 1 9 8 6
1 / 1 / 1 9 8 9
1 / 1 / 1 9 9 2
1 / 1 / 1 9 9 5
1 / 1 / 1 9 9 8
1 / 1 / 2 0 0 1
1 / 1 / 2 0 0 4
1 / 1 / 2 0 0 7
Japanese Corporate Sector turns into net saver
(from 1990-1998)
Corporate
Exhibit 4
From the bubble top
in 1990 thru 1998,
net savings
increased by
14.8% of GDP
Source: Cabinet Office; Government of Japan
P e r c e n t , ( % )
8/4/2019 The Winds of Change by Mario Ricchio, Director of Research at Paisley Financial
http://slidepdf.com/reader/full/the-winds-of-change-by-mario-ricchio-director-of-research-at-paisley-financial 6/38
PAISLEY FINANCIAL AUGUST 2011 MACROECONOMIC OUTLOOK
P a i s l e y F i n a n c i a l | 1 . 3 1 2 . 8 7 8 . 8 5 0 0 | w w w . p a i s l e y f i n a n c i a l . c o m 6
DEFLATIONARY PRESSURES
After an asset bubble collapses, private sectors demand contracts. The economy operates below
potential GDP. Labor and machinery utilization rates fall from peak levels. Excess labor supply
pressures real wages. The output gap naturally exerts downward pressure on inflation. The government
becomes the major source of borrowing and spending to offset the lost private sector demand. If fiscal
authorities withdraw stimulus before the balance sheet recession ends, the economy risks entering a
deflationary environment.
LESSONS FROM THE JAPANESE EXPERIENCE
QE FAILS TO SPUR BANK LENDING IN A ZERO INTEREST RATE ENVIRONMENT
Japan lost a decade of growth after the collapse of its debt-financed bubble economy in 1990.
Politicans grew impatient at the economy’s lack of progress. The pressure intensified for extreme
monetary measures to jumpstart economic growth . Quantitative easing became the tool of choice.
Unfortunately, it failed to increase bank lending. Financial institutions did not attempt to rebalance
their portfolios by shifting away from excess reserves at the BOJ to loans.4
As Richard Koo states,
“The Bank of Japan (BOJ) argued vigorously that such measures would be meaningless, but it was
eventually overidden, and in March 2001 then Governer Masaru Hayami made the decision toimplement quantitative easing. During the period between March 2001 and March 2006, the Bank of
Japan pumped 25 trillion yen of reserves--equivalent of five times banks’ required reserves into the
system. Yet, the money supply grew only by an amount equal to the increase in government borrowing
over private-sector debt repayment during this period”. He goes on to explain why QE fails to work in
a zero interest rate environment, “The central bank’s implementation of quantitative easing at a time of
zero interest rates was similar to a shopkeeper who, unable to sell more than 100 apples a day at 100
Yen each, tries stocking his shelves with 1,000 apples, and when that has no effect, adds another 1,000.
As long as the price remains the same, there is no reason consumer behavior should change--sales willremain stuck about 100 even if the shopkeeper puts 3,000 apples on the display”.
5
4 Suda, M. (2003, April 2). Lecture delivered at Nagoya University. Aichi, Japan.5 Koo. R. The Holy Grail of Macroeconomics: Lessons from Japan’s Great Recession. Pp. 73-74.
8/4/2019 The Winds of Change by Mario Ricchio, Director of Research at Paisley Financial
http://slidepdf.com/reader/full/the-winds-of-change-by-mario-ricchio-director-of-research-at-paisley-financial 7/38
PAISLEY FINANCIAL AUGUST 2011 MACROECONOMIC OUTLOOK
P a i s l e y F i n a n c i a l | 1 . 3 1 2 . 8 7 8 . 8 5 0 0 | w w w . p a i s l e y f i n a n c i a l . c o m 7
QE FAILS TO ALTER LONG-TERM INFLATION EXPECTATIONS
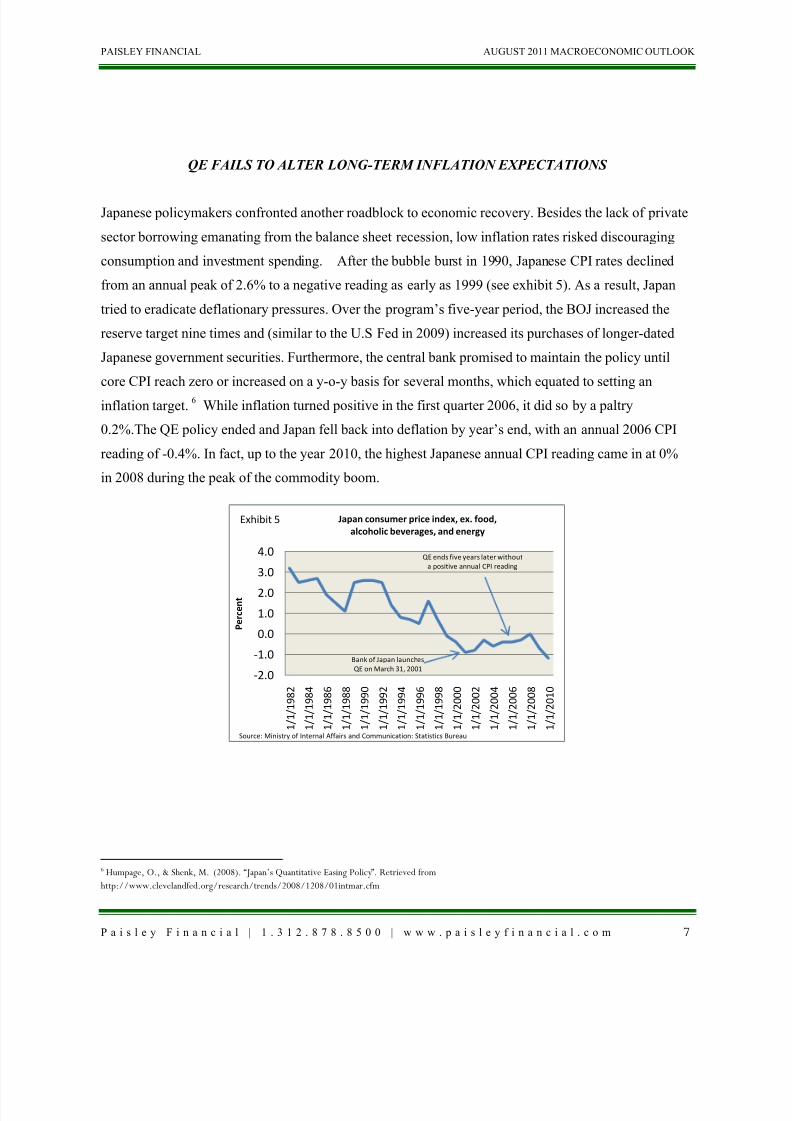
Japanese policymakers confronted another roadblock to economic recovery. Besides the lack of private
sector borrowing emanating from the balance sheet recession, low inflation rates risked discouraging
consumption and investment spending. After the bubble burst in 1990, Japanese CPI rates declined
from an annual peak of 2.6% to a negative reading as early as 1999 (see exhibit 5). As a result, Japan
tried to eradicate deflationary pressures. Over the program’s five-year period, the BOJ increased the
reserve target nine times and (similar to the U.S Fed in 2009) increased its purchases of longer-dated
Japanese government securities. Furthermore, the central bank promised to maintain the policy until
core CPI reach zero or increased on a y-o-y basis for several months, which equated to setting aninflation target.
6
While inflation turned positive in the first quarter 2006, it did so by a paltry
0.2%.The QE policy ended and Japan fell back into deflation by year’s end, with an annual 2006 CPI
reading of -0.4%. In fact, up to the year 2010, the highest Japanese annual CPI reading came in at 0%
in 2008 during the peak of the commodity boom.
6 Humpage, O., & Shenk, M. (2008). “Japan’s Quantitative Easing Policy”. Retrieved from
http://www.clevelandfed.org/research/trends/2008/1208/01intmar.cfm
-2.0
-1.0
0.0
1.0
2.0
3.0
4.0
1 / 1 / 1 9 8 2
1 / 1 / 1 9 8 4
1 / 1 / 1 9 8 6
1 / 1 / 1 9 8 8
1 / 1 / 1 9 9 0
1 / 1 / 1 9 9 2
1 / 1 / 1 9 9 4
1 / 1 / 1 9 9 6
1 / 1 / 1 9 9 8
1 / 1 / 2 0 0 0
1 / 1 / 2 0 0 2
1 / 1 / 2 0 0 4
1 / 1 / 2 0 0 6
1 / 1 / 2 0 0 8
1 / 1 / 2 0 1 0
P e r c e n t
Japan consumer price index, ex. food,
alcoholic beverages, and energy
Source: Ministry of Internal Affairs and Communication: Statistics Bureau
Bank of Japan launches
QE on March 31, 2001
QE ends five years later without
a positive annual CPI reading
Exhibit 5

8/4/2019 The Winds of Change by Mario Ricchio, Director of Research at Paisley Financial
http://slidepdf.com/reader/full/the-winds-of-change-by-mario-ricchio-director-of-research-at-paisley-financial 8/38
PAISLEY FINANCIAL AUGUST 2011 MACROECONOMIC OUTLOOK
P a i s l e y F i n a n c i a l | 1 . 3 1 2 . 8 7 8 . 8 5 0 0 | w w w . p a i s l e y f i n a n c i a l . c o m 8
GOVERNMENT SPENDING PROVIDES A KEY SOURCE OF DEMAND IN A BALANCE
SHEET RECESSION
Being a massive net borrower from 1984 to 1989, the Japanese corporate sector increased their
financial leverage going into 1990. And according to the San Francisco FED, “after Japan’s bubble
burst, private nonfinancial firms undertook a painful deleveraging, reducing their debt-to GDP ratio
from 125% in 1991 to 95% in 2001”.7
From 1991 to 1995, the rate of growth in loan liabilities fell
precipitously, and from 1996 to 2004, net loan liabilities shrank in all but one year (see exhibit 6). As
firms reduced their spending on investment and became net savers, the economy lost a source of
demand—estimated at -15.1% of GDP from the peak in 1990 to 2005 (see exhibit 7).
The government decided to pursue an expansive fiscal policy to alleviate the economic pain from
private sector deleveraging. During the 1990’s, Japan adopted seven different stimulus packages
designed to increase aggregrate demand and enhance economic growth. Government spending on
infrastructure, such as on roads, bridges, and airports, increased substantially8
7 Glick, R., & Lansing, K. (2009). U.S Household Deleveraging and Future Consumption Growth. Retrieved from
http://www.frbsf.org/publications/economics/letter/2009/el2009-16.html
. To give an idea of the
fiscal largesse, general government expenditures rose from more than 31.6% of GDP in 1990 to 42.5%
of GDP in 1998 (see exhibit 8). In eight short years, Japanese government spending rose by 10.9% of
GDP. As borrowing increased to finance fiscal expenditures, the budget went from a surplus of 1.9% in
1990 to a deficit of 6.3% in 2000 (see exhibit 9).
8 South-Western Cengage Learning (2009). Special Topic 7: Lessons from the Japanese experience. Retrieved from
http://www.cengasites.com/academic/assets/sites/Gwartney/ch7.pdf.
-25,000
-12,500
0
12,500
25,000
37,500
50,000
1 / 1 / 1 9 8 0
1 / 1 / 1 9 8 2
1 / 1 / 1 9 8 4
1 / 1 / 1 9 8 6
1 / 1 / 1 9 8 8
1 / 1 / 1 9 9 0
1 / 1 / 1 9 9 2
1 / 1 / 1 9 9 4
1 / 1 / 1 9 9 6
1 / 1 / 1 9 9 8
1 / 1 / 2 0 0 0
1 / 1 / 2 0 0 2
1 / 1 / 2 0 0 4
1 / 1 / 2 0 0 6
Japanese non-financial corporations, annual change
in loan liabilities
B i l l i o n o f Y e n
Rate of change
in loan growth
peaked in 1989
Corporate loan liabilities
shrank in 8 of the 9 years
between 1996-2004
Source: Cabinet Office; Government of Japan
Firms increase
financial leverage
Exhibit 6
-9.1
6.0
-12
-10
-8
-6
-4
-2
0
2
4
6
8
1 / 1 / 1 9 8 0
1 / 1 / 1 9 8 2
1 / 1 / 1 9 8 4
1 / 1 / 1 9 8 6
1 / 1 / 1 9 8 8
1 / 1 / 1 9 9 0
1 / 1 / 1 9 9 2
1 / 1 / 1 9 9 4
1 / 1 / 1 9 9 6
1 / 1 / 1 9 9 8
1 / 1 / 2 0 0 0
1 / 1 / 2 0 0 2
1 / 1 / 2 0 0 4
1 / 1 / 2 0 0 6
1 / 1 / 2 0 0 8
Japan non-financial corporate financial balances
(as share of GDP)
Source: Cabinet Office: Government of Japan
Balance sheet recession turns
non-financial firms into net savers
P e r c e n t a g e ,
( % )
Exhibit 7

8/4/2019 The Winds of Change by Mario Ricchio, Director of Research at Paisley Financial
http://slidepdf.com/reader/full/the-winds-of-change-by-mario-ricchio-director-of-research-at-paisley-financial 9/38
PAISLEY FINANCIAL AUGUST 2011 MACROECONOMIC OUTLOOK
P a i s l e y F i n a n c i a l | 1 . 3 1 2 . 8 7 8 . 8 5 0 0 | w w w . p a i s l e y f i n a n c i a l . c o m 9
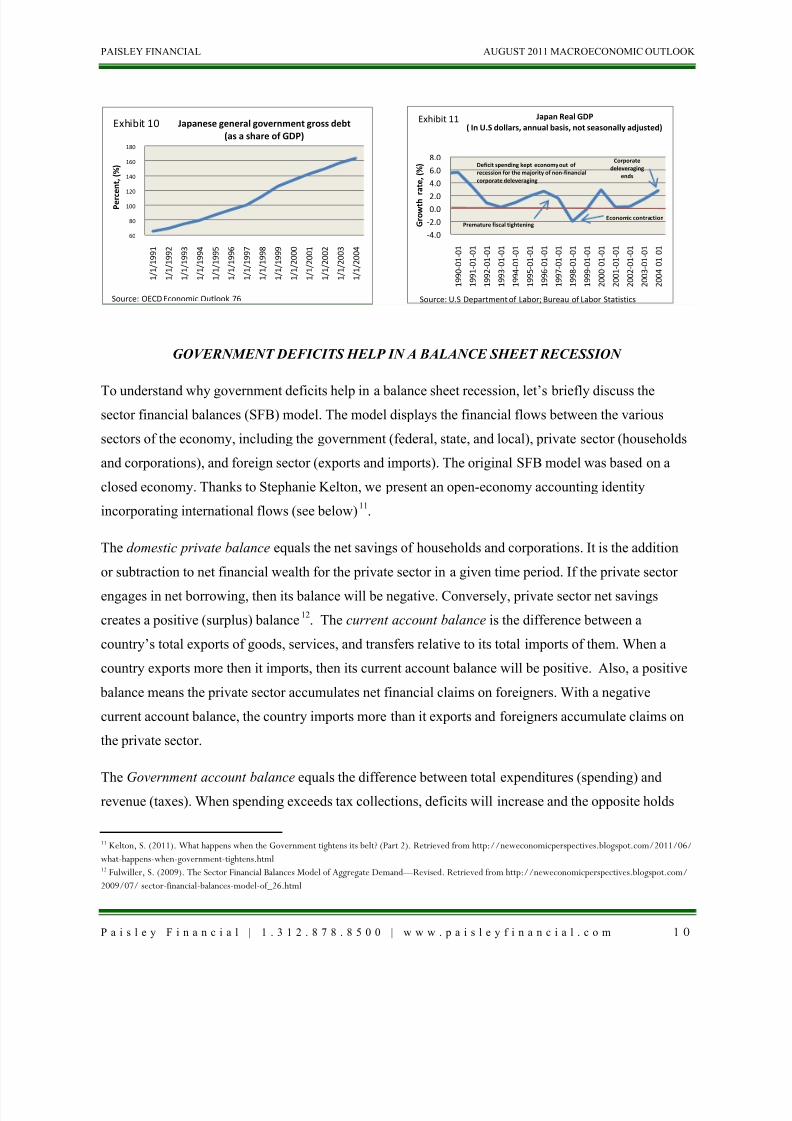
Persistently higher deficits add to national debt levels. Japan’s long-term debt outstanding as a
percentage of GDP soared from 64.8% in 1991 to 163.5% in 2004 (see exhibit 10). But remember after
the bubble burst, the corporate sector undertook a massive deleveraging and the economy lost a big
demand source. The private sector experienced a negative wealth effect from falling land and stock
prices. Since 1990, cumulative capital losses on stock and land totalled $15 trillion, or 3 years worth of
Japanese GDP.9
The banking system, saddled with non-performing loans, turned cautious about
extending new credit. Monetary policy produced nothing more than a liquidity trap— the equivalent to
pushing on a string. To avoid a severe recession and a vicious deflationary cycle, the government was
left with no choice but to borrow and spend the savings of the private sector. Deficit spending kept real
GDP out of negative territory for all but one year, which was an amazing achievement (see exhibit 11).
Without massive fiscal stimulus, Japan’s GDP could have fallen to between one-third to one-half its
peak.10
9 Koo, R. Lessons from Japan: Fighting a balance sheet recession.10 Koo, R. The Holy Grail of Macroeconomics: Lessons from Japan’s Great Recession. p25.
32.7 32.8 33.2 32.431.4 31.6 31.6
32.734.5 35 36
36.735.7
42.5
0
5
10
15
20
25
30
35
40
45
Japanese general government expenditures
(as a percentage of GDP)
Source: OECD Factbook 2010: Economic, Environmental, and Social Statistics
Exhibit 8
1.9
-4.2
-6.3-7
-6
-5
-4
-3
-2-1
0
1
2
3
1/1/1990 1/1/1995 1/1/2000
Japanese budget deficit/surplus
(as share of GDP)
Source: OECD: Outlook 69
Exhibit 9
8/4/2019 The Winds of Change by Mario Ricchio, Director of Research at Paisley Financial
http://slidepdf.com/reader/full/the-winds-of-change-by-mario-ricchio-director-of-research-at-paisley-financial 10/38
PAISLEY FINANCIAL AUGUST 2011 MACROECONOMIC OUTLOOK
P a i s l e y F i n a n c i a l | 1 . 3 1 2 . 8 7 8 . 8 5 0 0 | w w w . p a i s l e y f i n a n c i a l . c o m 1 0
GOVERNMENT DEFICITS HELP IN A BALANCE SHEET RECESSION
To understand why government deficits help in a balance sheet recession, let’s briefly discuss the
sector financial balances (SFB) model. The model displays the financial flows between the various
sectors of the economy, including the government (federal, state, and local), private sector (households
and corporations), and foreign sector (exports and imports). The original SFB model was based on a
closed economy. Thanks to Stephanie Kelton, we present an open-economy accounting identity
incorporating international flows (see below)11
The domestic private balance equals the net savings of households and corporations. It is the addition
or subtraction to net financial wealth for the private sector in a given time period. If the private sector
engages in net borrowing, then its balance will be negative. Conversely, private sector net savings
creates a positive (surplus) balance
.
12
The Government account balance equals the difference between total expenditures (spending) and
revenue (taxes). When spending exceeds tax collections, deficits will increase and the opposite holds
. The current account balance is the difference between a
country’s total exports of goods, services, and transfers relative to its total imports of them. When a
country exports more then it imports, then its current account balance will be positive. Also, a positive
balance means the private sector accumulates net financial claims on foreigners. With a negative
current account balance, the country imports more than it exports and foreigners accumulate claims on
the private sector.
11 Kelton, S. (2011). What happens when the Government tightens its belt? (Part 2). Retrieved from http://neweconomicperspectives.blogspot.com/2011/06/
what-happens-when-government-tightens.html12 Fulwiller, S. (2009). The Sector Financial Balances Model of Aggregate Demand—Revised. Retrieved from http://neweconomicperspectives.blogspot.com/
2009/07/ sector-financial-balances-model-of_26.html
60
80
100
120
140
160
180
1 / 1 / 1 9 9 1
1 / 1 / 1 9 9 2
1 / 1 / 1 9 9 3
1 / 1 / 1 9 9 4
1 / 1 / 1 9 9 5
1 / 1 / 1 9 9 6
1 / 1 / 1 9 9 7
1 / 1 / 1 9 9 8
1 / 1 / 1 9 9 9
1 / 1 / 2 0 0 0
1 / 1 / 2 0 0 1
1 / 1 / 2 0 0 2
1 / 1 / 2 0 0 3
1 / 1 / 2 0 0 4
P e r c e
n t , ( % )
Japanese general government gross debt
(as a share of GDP)
Source: OECD Economic Outlook 76
Exhibit 10
-4.0
-2.0
0.0
2.0
4.0
6.0
8.0
1 9 9 0 - 0 1 - 0 1
1 9 9 1 - 0 1 - 0 1
1 9 9 2 - 0 1 - 0 1
1 9 9 3 - 0 1 - 0 1
1 9 9 4 - 0 1 - 0 1
1 9 9 5 - 0 1 - 0 1
1 9 9 6 - 0 1 - 0 1
1 9 9 7 - 0 1 - 0 1
1 9 9 8 - 0 1 - 0 1
1 9 9 9 - 0 1 - 0 1
2 0 0 0 - 0 1 - 0 1
2 0 0 1 - 0 1 - 0 1
2 0 0 2 - 0 1 - 0 1
2 0 0 3 - 0 1 - 0 1
2 0 0 4 - 0 1 - 0 1
G r o w t h r a t e , ( % )
Japan Real GDP
( In U.S dollars, annual basis, not seasonally adjusted)
Source: U.S Department of Labor; Bureau of Labor Statistics
Deficit spending kept economy out of
recession for the majority of non-financial
corporate deleveraging
Premature fiscal tightening
Corporate
deleveraging
ends
Economic contraction
Exhibit 11

8/4/2019 The Winds of Change by Mario Ricchio, Director of Research at Paisley Financial
http://slidepdf.com/reader/full/the-winds-of-change-by-mario-ricchio-director-of-research-at-paisley-financial 11/38
PAISLEY FINANCIAL AUGUST 2011 MACROECONOMIC OUTLOOK
P a i s l e y F i n a n c i a l | 1 . 3 1 2 . 8 7 8 . 8 5 0 0 | w w w . p a i s l e y f i n a n c i a l . c o m 1 1
true if taxes exceed total spending. As a result, for the private sector to save, the government deficit
must be larger than the current account deficit . If the Government sector reduces the deficit or runs a
surplus, the private sector experiences lower net savings. The chart shows the U.S sector financial
balances as a share of GDP from 1965 to 2010 (see exhibit 12).
Private sector balances display a high inverse correlation to government sector balances. In the data
points chosen, all government deficits resulted in private sector surpluses. Let’s plug the numbers into
the equation below.
Domestic Private Surplus = Government Deficit + Current Account Balance
1975-- 6.50% = 5.29% + 1.21%
*1983-- 4.71% = 5.71% + (-0.99%) * Rounding error
*1992-- 5.18% = 5.88% + (-0.72%)
2009-- 8.59% = 11.28% + (2.69%)
The numbers add up! The key takeaway: Fiscal policy remains the only real tool available to cure a
balance sheet recession. Government deficits larger than current account deficits transfer financial
savings to the private sector. Given the private sector shifts from a net borrowing to a net saving
6.50
4.71 5.18
8.59
-5.29 -5.70 -5.88
-11.28
1.21
-0.99-0.72
-2.69
-15
-10
-5
0
5
10
1 9 6 5
1 9 6 7
1 9 6 9
1 9 7 1
1 9 7 3
1 9 7 5
1 9 7 7
1 9 7 9
1 9 8 1
1 9 8 3
1 9 8 5
1 9 8 7
1 9 8 9
1 9 9 1
1 9 9 3
1 9 9 5
1 9 9 7
1 9 9 9
2 0 0 1
2 0 0 3
2 0 0 5
2 0 0 7
2 0 0 9
Sector Financial Balances as a share of GDP, %
PRIVATE SECTOR GOVERNMENT SECTOR FOREIGN SECTOR
Source: Federal Reserve: Flow of Funds
Exhibit 12
8/4/2019 The Winds of Change by Mario Ricchio, Director of Research at Paisley Financial
http://slidepdf.com/reader/full/the-winds-of-change-by-mario-ricchio-director-of-research-at-paisley-financial 12/38
PAISLEY FINANCIAL AUGUST 2011 MACROECONOMIC OUTLOOK
P a i s l e y F i n a n c i a l | 1 . 3 1 2 . 8 7 8 . 8 5 0 0 | w w w . p a i s l e y f i n a n c i a l . c o m 1 2
position (i.e. pay down debt, retain income, lower consumption) in a balance sheet recession,
increasing government deficits ease the pain from the deleveraging process.
Other balance sheet recession cures include income growth and time. The faster real private (household
or corporate) income growth rises, the sooner leverage ratios return to healthy levels. Obviously, higher
levels of private sector financial leverage take longer to unwind than lower levels. Japan took 15 years
to overcome its balance sheet recession.13
CAN FISCAL AUTHORITIES MAKE MATTERS WORSE?
There is no short-term fix.
Fiscal policy remains the only real tool available to help a country through a balance sheet recession.
With households or firms having no choice but to repair their balance sheets, the only way to prevent a
recession and a money supply contraction centers on the government expanding budget deficits and
borrowing & spending the savings of the private sector . So why would policymakers want to unwind
fiscal stimulus or impose austerity during a balance sheet recession?
First, they believe austerity improves private sector confidence, where households boost spending and
businesses boost investment. Second, they worry bond vigilantes may impose higher sovereign bond
yields as a punishment for no austerity measures. Third, a large percentage of citizens dislike big
government. So when an economy starts to recover, it provides an ideal cover to get rid of excess
government spending. We disagree on all counts. Policymakers assume households and firms will re-
lever an already damaged balance sheet. However, in balance sheet recessions, the private sector stays
in deleveraging mode until balance sheets get healthy. This means less household spending and less
corporate investment. As for fears of a hostile bond market, if the sovereign government issues debt in
its own currency, austerity might actually drive yields sharply lower on fears of a deep economic
contraction. Finally, imposing austerity before the private sector repairs its balance sheet increases the
odds of a major slowdown. A cutback in government spending makes more sense when the private
sector stands ready to carry the economic torch. As Richard Koo states, for deficit reduction to succeed,
“policymakers must make certain that funds left un-borrowed by the government will be borrowed and
13 Koo, R (2010).U.S Economy in Balance Sheet Recession: What the U.S can learn from Japan’s experience in 1990-2005. P.8. Retrieved from
http://www.house.gov/apps/list/hearing/financialsvcs_dem/richardc.koo.pdf

8/4/2019 The Winds of Change by Mario Ricchio, Director of Research at Paisley Financial
http://slidepdf.com/reader/full/the-winds-of-change-by-mario-ricchio-director-of-research-at-paisley-financial 13/38
PAISLEY FINANCIAL AUGUST 2011 MACROECONOMIC OUTLOOK
P a i s l e y F i n a n c i a l | 1 . 3 1 2 . 8 7 8 . 8 5 0 0 | w w w . p a i s l e y f i n a n c i a l . c o m 1 3
spent by the private sector. Otherwise, they risk triggering the kind of economic collapse seen in the
U.S in 1937 and in Japan in 1997”.14
Japan provides a clear example of what happens to an economy when fiscal tightening occurs before private sector deleveraging ends. After a real GDP growth rate of 1.9% in 1995 and 2.6% in 1996, the
government expected the economic recovery to be self-sustaining and turned its attention to belt-
tightening. So in 1997, Japan decided to pursue fiscal consolidation. By increasing the consumption tax
rate from 3% to 5%, increasing taxpayers’ share of social security costs, ending a special income tax,
and shelving a supplementary budget, Prime Minister Hashimoto intended to reduce the fiscal deficit
by 15 trillion yen (stood at 22 trillion yen).15
The consumption tax alone would cost the household
sector upwards of 5 trillion yen. The measures undercut the fragile Japanese recovery. The economy
ended up shrinking for five consecutive quarters, with FY98 real GDP contracting 2% (refer to exhibit11). National revenue from income and corporate taxes dropped to 47 trillion yen in FY99 from 52
trillion Yen in FY96.16
Instead of deficit reduction, the FY99 deficit increased to 38 trillion Yen from
the original starting point of 22 trillion Yen. A couple years later, Prime Minister Junichiro Koizumi
capped new government bond issuance and it led to another economic slowdown in 2001-2002. These
examples illustrate the risks to fiscal consolidation-- amid a balance sheet recession--slower economic
growth, lower tax receipts, and higher budget deficits.
IS THE U.S FOLLOWING IN THE FOOTSTEPS OF JAPAN?
Japanese corporations borrowed heavily to purchase real estate at the height of the real estate bubble.
When commercial property values collapsed from their peak, most firms found themselves “upside
down” on the loans. This left a huge gap on their balance sheet, which required years of deleveraging.
How about the United States?
When the dot-com bubble burst in 2000, the Federal Reserve responded with a series of aggressive
rates cuts, taking the federal funds rate down from 6.5% to 1% by 200317
14 Koo, Richard. The Holy Grail of Macroeconomics: Lessons from Japan’s Great Recession. p.6.
. The 30-year conventionalmortgage rate fell more than 300 basis points (see exhibit 13). With lax lending standards, the rise of
15 Koo, R. pp. 52-53.16 Japan Press Weekly. Consumption Tax Rate at 10%! Retrieved from http://www.japan-press.co.jp/modules/news/indeg.php?id=6117 Federal Reserve Bank of New York. Historical Changes of the Target Federal Funds and Discount Rates. Retrieved from
http://www.newyorkfed.org/markets/statistics/dlyrates/fedrate.html

8/4/2019 The Winds of Change by Mario Ricchio, Director of Research at Paisley Financial
http://slidepdf.com/reader/full/the-winds-of-change-by-mario-ricchio-director-of-research-at-paisley-financial 14/38
PAISLEY FINANCIAL AUGUST 2011 MACROECONOMIC OUTLOOK
P a i s l e y F i n a n c i a l | 1 . 3 1 2 . 8 7 8 . 8 5 0 0 | w w w . p a i s l e y f i n a n c i a l . c o m 1 4
securitization, and the aforementioned lower mortgage rates, the stage was set for a debt-financed asset
bubble.
With many households believing real estate to be the safer investment than stocks, money flowed out
of equities and into the property market. As home prices started to rise at a double-digit annual pace,
homeownership became widely viewed as a one-way ticket to riches. Do you blame them? According
to the S&P/ Case-Shiller Index, between the first quarter of 2000 and the second quarter of 2006 (the
peak), nationwide home prices rose an astonishing 89.93%18
.
Unfortunately, U.S households borrowed heavily to purchase homes during the run-up in prices. From
the years 2000 to 2007, total home mortgage debt increased approximately 120% to $10.54 trillion.
During the same period, total consumer credit increased approximately 47% to $2.56 trillion. In sum,
total household debt increased approximately 98% to $13.81 trillion (see exhibit 14). When the
property bubble burst, many U.S homeowners were turned “upside down” on their loans. This left a
gap in their balance sheet and years of painful deleveraging ahead.
18 Standard & Poor’s. S&P/Case-Shiller Home Price Indices. Data retrieved from http://www.standardandpoors.com/indices/sp-case-shiller-home-price-
indices/en/us/?indexId=spusa-cashpidff--p-us----
5.00
5.50
6.00
6.50
7.00
7.50
8.00
8.509.00
P e r c e n t , ( % )
30 Year Conventional Mortgage Rate
Source:Board of Governers of the Federal Reserve S stem; St. Louis Fed
Exhibit 13

8/4/2019 The Winds of Change by Mario Ricchio, Director of Research at Paisley Financial
http://slidepdf.com/reader/full/the-winds-of-change-by-mario-ricchio-director-of-research-at-paisley-financial 15/38
PAISLEY FINANCIAL AUGUST 2011 MACROECONOMIC OUTLOOK
P a i s l e y F i n a n c i a l | 1 . 3 1 2 . 8 7 8 . 8 5 0 0 | w w w . p a i s l e y f i n a n c i a l . c o m 1 5
U.S HOUSEHOLDS START THE DELEVERAGING PROCESS
From its high of $22.7 trillion, the total value of household real estate assets plunged $5.2 trillion byyear-end 2008 (see exhibit 15). Household net worth fell an astonishing $12.7 trillion between 2006
and year-end 2008 (see exhibit 16). Household mortgage liabilities had fallen a miniscule $44.5 billion
from the peak in 2007. Going into 2009, U.S households carried too much debt relative to the size of
their assets. They began to pull back in typical, balance sheet recession style.
Just like in Japan, debt minimization took hold in the United States. Households went from being major
net borrowers during the height of the bubble to net savers in 2009 and 2010 (see exhibit 17). Between
2006 and 2010, the economy lost approximately $1.4 trillion in private sector demand from lower
household funding needs. Consumers started to reduce consumption and pay down debt. In 2009
alone, households paid down $268.8 billion of total household debt, amounting to $153.6 billion of
mortgage debt and $115.2 billion of consumer credit debt. In addition, they started setting more money
0
2,000
4,000
6,0008,000
10,000
12,000
14,000
16,000
I n B i l l i o n o f D o l l a r s
U.S Household Debt Accumulation
Total Household
Debt
Total Home
Mortgage Debt
Consumer Credit
Source: Federal Reserve; Flow of Funds
Exhibit 14
$22.7 trillion
$16.1 trillion
12,000
14,000
16,000
18,000
20,000
22,000
24,000
1 /1 /2 00 6 1 /1 /2 00 7 1 /1 /2 00 8 1 /1 /2 00 9 1 /1 /2 01 0 1 /1 /2 01 1
i n b i l l i o n s , ( $ )
Household Real Estate AssetsExhibit 15
Source: Federal Reserve: Flow of Funds
$64.1 trillion $64.2 trillion
$51.4 trillion
0
10000
20000
30000
40000
50000
60000
70000
1/1/2006 1/1/2007 1/1/2008
Household Net Worth
Source: Federal Reserve; Flow of Funds
Exhibit 16

8/4/2019 The Winds of Change by Mario Ricchio, Director of Research at Paisley Financial
http://slidepdf.com/reader/full/the-winds-of-change-by-mario-ricchio-director-of-research-at-paisley-financial 16/38
PAISLEY FINANCIAL AUGUST 2011 MACROECONOMIC OUTLOOK
P a i s l e y F i n a n c i a l | 1 . 3 1 2 . 8 7 8 . 8 5 0 0 | w w w . p a i s l e y f i n a n c i a l . c o m 1 6
aside for a rainy day. Between May of 2008 and May of 2009, the personal saving rate increased from
2.5% to 8.2% (see exhibit 18).
THE RESPONSE FROM U.S POLICYMAKERS
TAILWIND # 1: EXPANSIVE FISCAL POLICY
The U.S. government decided to pursue an expansive fiscal policy to alleviate the economic pain from
household sector deleveraging. During the economic and financial crisis, the U.S implemented two
major stimulus packages (costing nearly $1.65 trillion over ten years) designed to increase aggregate
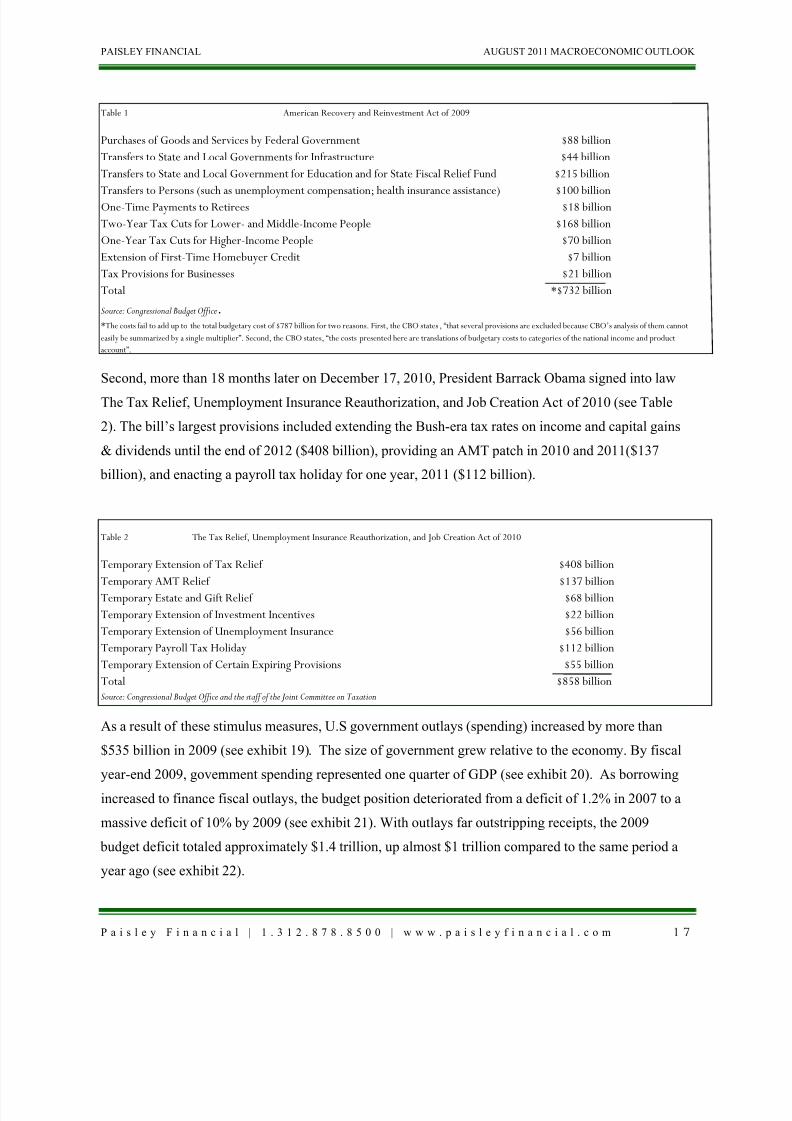
demand, boost economic growth, and promote employment growth. First, on February 17, 2009,President Barrack Obama signed into law the $787 billion American Recovery and Reinvestment Act
of 2009 (ARRA), which contained a broad mixture of increased spending and tax cuts(see Table 1).
Government spending on health care, education, and infrastructure increased substantially under this
bill-- by more than $324 billion.19
The other major provision included $116 billion for the “Making
Work Pay Tax Credit”, which provided a refundable tax credit of up to $400 for working individuals
and up to $800 for married couples filing joint returns.20
Also, Congress temporarily extended five
stimulus provisions from the ARRA at a cost of $61 billion.21
19 Committee for a Responsible Federal Budget. (2009). Analysis of the American Recovery and Reinvestment Act. Retrieved from
http://crfb.org/sites/default/files/imported/documents_1/StimulusAnalysis.pdf 20 Internal Revenue Service. (2011). The Making Work Pay Tax Credit. Retrieved from http://www.irs.gov/newsroom/article/0,,id=204447,00.html21 Committee for a Responsible Federal Budget. (2010). Happy Birthday ARRA: The American Recovery and Reinvestment Act One Year Later. Retrieved from
http://crfb.org/sites/default/files/ARRA_One_Year_Later.pdf
-300
0
300
600
900
1200
2005 2006 2007 2008 2009 2010
Total Household Borrowing
i n b i l l i o n s ,
( $ )
Source: Federal Reserve; Flow of Funds
Exhibit 17
0.0
1.0
2.0
3.0
4.0
5.0
6.0
7.0
8.09.0
2 0 0 6 - 0 1 - 0 1
2 0 0 6 - 0 5 - 0 1
2 0 0 6 - 0 9 - 0 1
2 0 0 7 - 0 1 - 0 1
2 0 0 7 - 0 5 - 0 1
2 0 0 7 - 0 9 - 0 1
2 0 0 8 - 0 1 - 0 1
2 0 0 8 - 0 5 - 0 1
2 0 0 8 - 0 9 - 0 1
2 0 0 9 - 0 1 - 0 1
2 0 0 9 - 0 5 - 0 1
2 0 0 9 - 0 9 - 0 1
2 0 1 0 - 0 1 - 0 1
2 0 1 0 - 0 5 - 0 1
2 0 1 0 - 0 9 - 0 1
2 0 1 1 - 0 1 - 0 1
2 0 1 1 - 0 5 - 0 1
P e r c e n t
U.S. Personal Savings Rate
Source: U.S. Department of Commerce; Bureau of Economic Analysis
Balance sheet recession commences
Householdsboost
savings
Exhibit 18
8/4/2019 The Winds of Change by Mario Ricchio, Director of Research at Paisley Financial
http://slidepdf.com/reader/full/the-winds-of-change-by-mario-ricchio-director-of-research-at-paisley-financial 17/38
PAISLEY FINANCIAL AUGUST 2011 MACROECONOMIC OUTLOOK
P a i s l e y F i n a n c i a l | 1 . 3 1 2 . 8 7 8 . 8 5 0 0 | w w w . p a i s l e y f i n a n c i a l . c o m 1 7
Table 1 American Recovery and Reinvestment Act of 2009
Purchases of Goods and Services by Federal Government $88 billion
Transfers to State and Local Governments for Infrastructure $44 billion
Transfers to State and Local Government for Education and for State Fiscal Relief Fund $215 billion
Transfers to Persons (such as unemployment compensation; health insurance assistance) $100 billionOne-Time Payments to Retirees $18 billion
Two-Year Tax Cuts for Lower- and Middle-Income People $168 billion
One-Year Tax Cuts for Higher-Income People $70 billion
Extension of First-Time Homebuyer Credit $7 billion
Tax Provisions for Businesses $21 billion
Total *$732 billion
Source: Congressional Budget Office.*The costs fail to add up to the total budgetary cost of $787 billion for two reasons. First, the CBO states , “that several provisions are excluded because CBO’s analysis of them cannot
easily be summarized by a single multiplier”. Second, the CBO states, “the costs presented here are translations of budgetary costs to categories of the national income and product
account”.
Second, more than 18 months later on December 17, 2010, President Barrack Obama signed into law
The Tax Relief, Unemployment Insurance Reauthorization, and Job Creation Act of 2010 (see Table
2). The bill’s largest provisions included extending the Bush-era tax rates on income and capital gains
& dividends until the end of 2012 ($408 billion), providing an AMT patch in 2010 and 2011($137
billion), and enacting a payroll tax holiday for one year, 2011 ($112 billion).
Table 2 The Tax Relief, Unemployment Insurance Reauthorization, and Job Creation Act of 2010
Temporary Extension of Tax Relief $408 billion
Temporary AMT Relief $137 billionTemporary Estate and Gift Relief $68 billion
Temporary Extension of Investment Incentives $22 billion
Temporary Extension of Unemployment Insurance $56 billion
Temporary Payroll Tax Holiday $112 billion
Temporary Extension of Certain Expiring Provisions $55 billion
Total $858 billionSource: Congressional Budget Office and the staff of the Joint Committee on Taxation
As a result of these stimulus measures, U.S government outlays (spending) increased by more than
$535 billion in 2009 (see exhibit 19). The size of government grew relative to the economy. By fiscal
year-end 2009, government spending represented one quarter of GDP (see exhibit 20). As borrowing
increased to finance fiscal outlays, the budget position deteriorated from a deficit of 1.2% in 2007 to a
massive deficit of 10% by 2009 (see exhibit 21). With outlays far outstripping receipts, the 2009
budget deficit totaled approximately $1.4 trillion, up almost $1 trillion compared to the same period a
year ago (see exhibit 22).

8/4/2019 The Winds of Change by Mario Ricchio, Director of Research at Paisley Financial
http://slidepdf.com/reader/full/the-winds-of-change-by-mario-ricchio-director-of-research-at-paisley-financial 18/38
PAISLEY FINANCIAL AUGUST 2011 MACROECONOMIC OUTLOOK
P a i s l e y F i n a n c i a l | 1 . 3 1 2 . 8 7 8 . 8 5 0 0 | w w w . p a i s l e y f i n a n c i a l . c o m 1 8
Peristently higher deficits add to national debt levels. The U.S public debt soared from $9.4 trillion in
2008 to $14.0 trillion in 2010, which equates to a 48% gain in alittle over three years (see exhibit 23).
But similar to Japan, when the bubble burst, there was a serious period of deleveraging. From the peak
in 2006 to 2010, the economy lost approximately $1.4 trillion in private sector demand due to the
decline in household borrowing. Households experienced a negative wealth effect from lower home
and stock prices. Monetary policy produced limited results for the real economy. To avoid a severe
recession and a vicious deflationary cycle, the government was left with no choice but to borrow and
spend the savings of the household sector. As Richard Koo states, “ when someone saves money or
pays down debt in a national economy, GDP will shrink unless somone else steps in to borrow and
spend those saved or repaid funds. Unborrowed funds remain trapped, constituting a leakage from the
income stream and a deflationary gap in the economy. If left unchecked, this gap will throw the
economy into a deflationary spiral as the economy loses demand equivalent to the saved but
$254 billion
$535 billion
0
100,000
200,000
300,000400,000
500,000
600,000
2008 2009
U.S Government Outlays (year-over-year change)
Source: The WhiteHouse: Office of Management and Budget
Exhibit 19
18.2 18.2 19.1 19.7 19.6 19.9 20.1 19.620.7
25.0
0.0
5.0
10.0
15.0
20.0
25.0
30.0
2000 2001 2002 2003 2004 2005 2006 2007 2008 2009
U.S Government Outlays as a Percentage of GDP
P e r c e n t ,
( % )
Source: The White House: Office of Management and Budget
Exhibit 20
-12.0
-10.0
-8.0
-6.0
-4.0
-2.0
0.0
2.0
4.0
2000 2001 2002 200320042005200620072008 2009 2010
P e r c e n t , ( % )
U.S Budget Deficit/Surplus
as a Percentage of GDP
Source: The White House: Office of Management and Budget
Exhibit 21
-2,000,000
-1,000,000
0
1,000,000
2,000,000
3,000,000
4,000,000
2 0 0 0
2 0 0 1
2 0 0 2
2 0 0 3
2 0 0 4
2 0 0 5
2 0 0 6
2 0 0 7
2 0 0 8
2 0 0 9
2 0 1 0
i n m i l l i o n s o f d o
l l a r s
U.S Government Budget Receipts,
Outlays, Surplus/Deficit
Receipts
Outlays
Surplus or
Deficit (−)
Source: The White House: Office of Management and Budget
Exhibit 22

8/4/2019 The Winds of Change by Mario Ricchio, Director of Research at Paisley Financial
http://slidepdf.com/reader/full/the-winds-of-change-by-mario-ricchio-director-of-research-at-paisley-financial 19/38
PAISLEY FINANCIAL AUGUST 2011 MACROECONOMIC OUTLOOK
P a i s l e y F i n a n c i a l | 1 . 3 1 2 . 8 7 8 . 8 5 0 0 | w w w . p a i s l e y f i n a n c i a l . c o m 1 9
unborrowed funds each year.”22
Fortunately, U.S government borrowing increased by $1.4 trillion,
providing an offset to household deleveraging during the same period. (see exhibit 24). The expansion
of U.S fiscal deficits limited the annual 2009 U.S GDP contraction to -1.7% (see chart 25). Without
massive government spending, the U.S economy could have fallen much farther from the peak. Goinginto March 2009, the stock market had priced in a worst-case scenario. When expansive fiscal stimulus
took a near-term depression off the table, U.S financial markets found a tailwind behind which to
recover.
TAILWIND #2: MONETARY EASING
By early 2009, the Federal Reserve (FED) had lowered the federal funds rate all the way down to zero.
Yet, the economy remained fragile and financial markets illiquid. Ben Bernanke turned to his policy
22 Koo, R. U.S. Economy in Balance Sheet Recession: What the U.S. can learn from Japan’s experience in 1990-2005. p.3.
9000000
10000000
11000000
12000000
13000000
14000000
15000000
2 0 0 8 - 0 3 - 0 1
2 0 0 8 - 0 5 - 0 1
2 0 0 8 - 0 7 - 0 1
2 0 0 8 - 0 9 - 0 1
2 0 0 8 - 1 1 - 0 1
2 0 0 9 - 0 1 - 0 1
2 0 0 9 - 0 3 - 0 1
2 0 0 9 - 0 5 - 0 1
2 0 0 9 - 0 7 - 0 1
2 0 0 9 - 0 9 - 0 1
2 0 0 9 - 1 1 - 0 1
2 0 1 0 - 0 1 - 0 1
2 0 1 0 - 0 3 - 0 1
2 0 1 0 - 0 5 - 0 1
2 0 1 0 - 0 7 - 0 1
2 0 1 0 - 0 9 - 0 1
2 0 1 0 - 1 1 - 0 1
i n m i l l i
o n s o f d o l l a r s , ( $ )
U.S Public Debt
Source: U.S Department of the Treasury; Financial Management Service
Exhibit 23
-400
-200
0
200
400
600
800
1000
1200
1400
1600
Household
Sector
Federal
Government
2005 2006 2007 2008 2009 2010
Total Borrowing: Household vs. Federal Government
B i l l i o n s o f D o l l a r s
Exhibit 24
Source:Federal Reserve
-1.7-3.0-2.0-1.00.01.02.0
3.04.05.06.07.0
2 0 0 0 - 0 1 - 0 1
2 0 0 1 - 0 1 - 0 1
2 0 0 2 - 0 1 - 0 1
2 0 0 3 - 0 1 - 0 1
2 0 0 4 - 0 1 - 0 1
2 0 0 5 - 0 1 - 0 1
2 0 0 6 - 0 1 - 0 1
2 0 0 7 - 0 1 - 0 1
2 0 0 8 - 0 1 - 0 1
2 0 0 9 - 0 1 - 0 1
2 0 1 0 - 0 1 - 0 1
P e r c e n t , ( % )
U.S GDP
(annual growth rate, seasonally adjusted)
Deficit spending limited the
annual GDP contraction to under -2%
Source: U.S Department of Commerce: Bureau of Economic Analysis
Exhibit 25
8/4/2019 The Winds of Change by Mario Ricchio, Director of Research at Paisley Financial
http://slidepdf.com/reader/full/the-winds-of-change-by-mario-ricchio-director-of-research-at-paisley-financial 20/38
PAISLEY FINANCIAL AUGUST 2011 MACROECONOMIC OUTLOOK
P a i s l e y F i n a n c i a l | 1 . 3 1 2 . 8 7 8 . 8 5 0 0 | w w w . p a i s l e y f i n a n c i a l . c o m 2 0
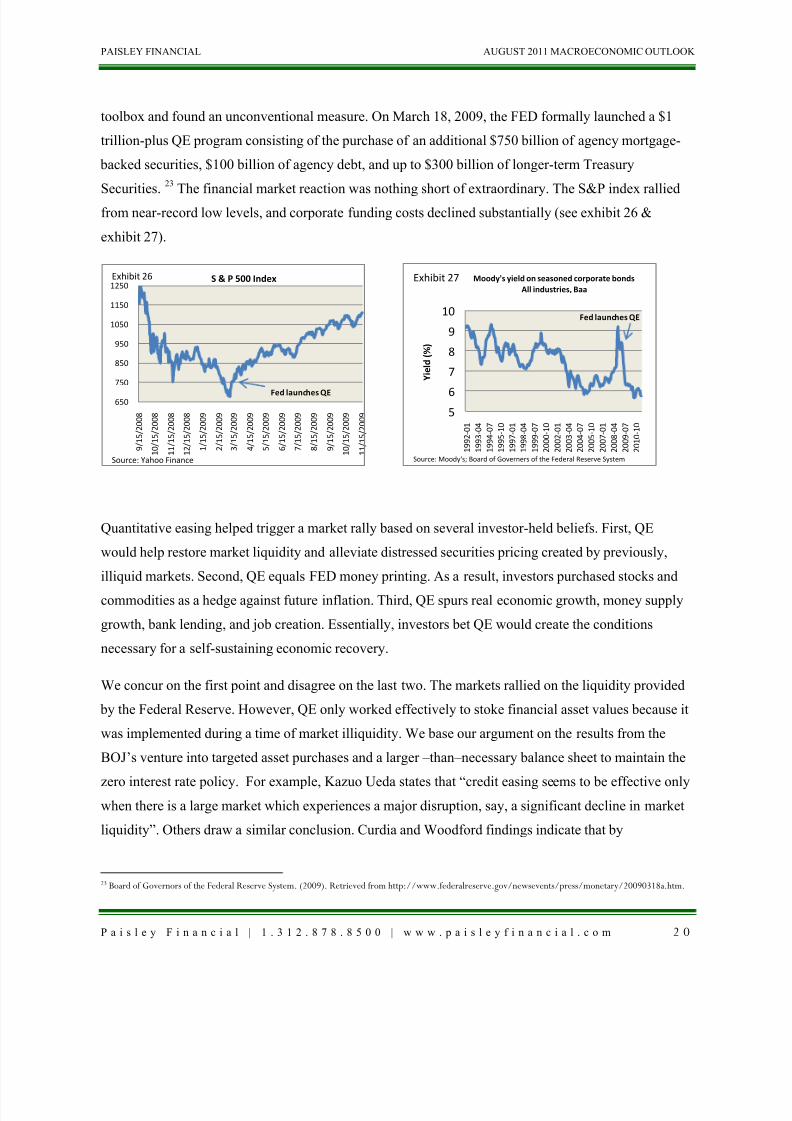
toolbox and found an unconventional measure. On March 18, 2009, the FED formally launched a $1
trillion-plus QE program consisting of the purchase of an additional $750 billion of agency mortgage-
backed securities, $100 billion of agency debt, and up to $300 billion of longer-term Treasury
Securities.
23
The financial market reaction was nothing short of extraordinary. The S&P index ralliedfrom near-record low levels, and corporate funding costs declined substantially (see exhibit 26 &
exhibit 27).
Quantitative easing helped trigger a market rally based on several investor-held beliefs. First, QE
would help restore market liquidity and alleviate distressed securities pricing created by previously,
illiquid markets. Second, QE equals FED money printing. As a result, investors purchased stocks andcommodities as a hedge against future inflation. Third, QE spurs real economic growth, money supply
growth, bank lending, and job creation. Essentially, investors bet QE would create the conditions
necessary for a self-sustaining economic recovery.
We concur on the first point and disagree on the last two. The markets rallied on the liquidity provided
by the Federal Reserve. However, QE only worked effectively to stoke financial asset values because it
was implemented during a time of market illiquidity. We base our argument on the results from the
BOJ’s venture into targeted asset purchases and a larger –than–necessary balance sheet to maintain the
zero interest rate policy. For example, Kazuo Ueda states that “credit easing seems to be effective only
when there is a large market which experiences a major disruption, say, a significant decline in market
liquidity”. Others draw a similar conclusion. Curdia and Woodford findings indicate that by
23 Board of Governors of the Federal Reserve System. (2009). Retrieved from http://www.federalreserve.gov/newsevents/press/monetary/20090318a.htm.
650
750
850
950
1050
1150
1250
9 / 1 5 / 2 0 0 8
1 0 / 1 5 / 2 0 0 8
1 1 / 1 5 / 2 0 0 8
1 2 / 1 5 / 2 0 0 8
1 / 1 5 / 2 0 0 9
2 / 1 5 / 2 0 0 9
3 / 1 5 / 2 0 0 9
4 / 1 5 / 2 0 0 9
5 / 1 5 / 2 0 0 9
6 / 1 5 / 2 0 0 9
7 / 1 5 / 2 0 0 9
8 / 1 5 / 2 0 0 9
9 / 1 5 / 2 0 0 9
1 0 / 1 5 / 2 0 0 9
1 1 / 1 5 / 2 0 0 9
S & P 500 Index
Fed launches QE
Source: Yahoo Finance
Exhibit 26
5
6
7
8
9
10
1 9 9 2 - 0 1
1 9 9 3 - 0 4
1 9 9 4 - 0 7
1 9 9 5 - 1 0
1 9 9 7 - 0 1
1 9 9 8 - 0 4
1 9 9 9 - 0 7
2 0 0 0 - 1 0
2 0 0 2 - 0 1
2 0 0 3 - 0 4
2 0 0 4 - 0 7
2 0 0 5 - 1 0
2 0 0 7 - 0 1
2 0 0 8 - 0 4
2 0 0 9 - 0 7
2 0 1 0 - 1 0
Y i e l d ( % )
Moody's yield on seasoned corporate bonds
All industries, Baa
Fed launches QE
Source: Moody's; Board of Governers of the Federal Reserve System
Exhibit 27
8/4/2019 The Winds of Change by Mario Ricchio, Director of Research at Paisley Financial
http://slidepdf.com/reader/full/the-winds-of-change-by-mario-ricchio-director-of-research-at-paisley-financial 21/38
PAISLEY FINANCIAL AUGUST 2011 MACROECONOMIC OUTLOOK
P a i s l e y F i n a n c i a l | 1 . 3 1 2 . 8 7 8 . 8 5 0 0 | w w w . p a i s l e y f i n a n c i a l . c o m 2 1
introducing financial disruptions, the composition of the central bank balance sheet matters.24
Conversely, QE-driven asset purchases lose effectiveness during normalized financial conditions.
Curdia and Woodford point out that “when there are no frictions in the financial system, or more
precisely, when assets are valued only for their pecuniary returns and when all investors can purchase
arbitrary quantities of the same asset at the same price, neither the size nor the composition of the
central bank balance sheet matters”.
Consequently, the central bank’s decision to target asset purchases and hold more non-traditional assets
on its balance sheet works to ease credit conditions if the asset in question is disrupted by a sharp
decline in liquidity.
25
Does QE equal money printing? Well, many investors purchased financial assets across the board on
the notion of Fed money printing. If the majority of investors perceive QE to be money printing, whichwe believe occurred, perception becomes near-term reality. Financial assets had a strong bid under
them. However, a couple problems arise from this situation. First, if QE results in asset prices rising
higher than fundamentally justified by the underlying cash flow, then a valuation bubble risks
destabilizing an already-fragile financial system. Second, the FED chairman himself says QE is not
money printing. Courtesy of a C-Span video, Ben Bernanke states, “What the purchases do is if you
think of the Fed’s balance sheet, when we buy securities, on the asset side of the balance sheet, we get
the Treasury securities, or in the previous episode, mortgage-backed securities. On the liability side of
the balance sheet, to balance that, we create reserves in the banking system. Now, what these reservesare is essentially deposits that commercial banks hold with the Fed, so sometimes you hear the Fed is
printing money, that’s not really happening, the amount of cash in circulation is not changing. What’s
happening is that banks are holding more and more reserves with the Fed”.26
What did an extraordinary U.S. monetary response do for the money supply, bank lending, and the
labor market? Ironically, while QE acted as a tailwind for a financial markets’ recovery, the policy
In other words, the Fed
conducts an asset swap with the private sector—exchanging non-interest bearing assets (deposits or
reserves) for interest- bearing assets (treasuries or mortgage-related securities). As a result, if market
perception toward QE changes to reflect the true non-inflationary nature of the program, share prices
could trade back down to their underlying fundamental value.
24 Ueda, Kazuo. (2010). The Bank of Japan’s Experience with Non-Traditional Monetary Policy. p.4. Retrieved from
http://www.bos.frb.org/RevisitingMP/papers/Ueda.pdf 25 Ueda, K. P.4.26 C-Span (Producer). (2010). Jacksonville University Finance Discussion (video file). Retrieved from http://pragcap.com/ben-bernanke-explains-fed-qe

8/4/2019 The Winds of Change by Mario Ricchio, Director of Research at Paisley Financial
http://slidepdf.com/reader/full/the-winds-of-change-by-mario-ricchio-director-of-research-at-paisley-financial 22/38
PAISLEY FINANCIAL AUGUST 2011 MACROECONOMIC OUTLOOK
P a i s l e y F i n a n c i a l | 1 . 3 1 2 . 8 7 8 . 8 5 0 0 | w w w . p a i s l e y f i n a n c i a l . c o m 2 2
produced limited results for the real economy. First, in an effort to stabilize short-term funding
markets, the Fed supplied a large quantity of reserves into the banking system. The monetary base
(includes currency in circulation and bank reserves held at the FED) more than tripled from $850
billion in 2007 to the current level of $2.7 trillion (see exhibit 28). Almost immediately, manyobservers expected a soaring money supply and massive inflation. The fears never came to pass. Due
to the plunging money mulitplier ratio, the growth in money supply lagged behind the growth in the
monetary base. Let’s take a look at the numbers.
The money multiplier ratio, which measures the increase in money supply per dollar increase in the
monetary base, fell more than 50% from its 2007 level. In fact, the current M1 money multiplier ratio
has never been this low (see exhibit 29). For the bi-weekly period ending July 13, 2011, a $1 increase
in the monetary base (reserves) resulted in only a $0.73 increase in the money supply. Until households
begin relevering balance sheets, we see limited inflation risk from banks holding excess reserves.
Second, many investors assume an increase in reserves automatically translates into higher loan
growth. But the facts say otherwise in a balance sheet recession. Despite the Fed’s effort in supplying a
massive amount of reserves balances into the banking system, bank lending contracted. When
households choose to deleverage, they take on less debt. Credit demand plunges. On the supply side,
commercial banks find fewer private, creditworthy customers. Hence, banks sit on excess reserves and
monetary policy amounts to nothing more than a modern-day liquidity trap (see exhibit 30). Since the
beginning of QE, commercial bank lending remains under pressure. In 2009, bank credit and consumer
loans declined 6.0% and 3.3%, respectively. And last year, bank credit and consumer loans declined
2.8% and 6.9%, respectively (see exhibit 31).
0
500
1,000
1,500
2,000
2,500
3,000
B i l l i o n s o f d o l l a r s , ( $ )
St. Louis Adjusted Monetary Base
Source: Federal Reserve Bank of St. Louis
Exhibit 28
0.700
0.800
0.900
1.000
1.100
1.200
1.300
1.400
1.500
1.600
1.700
2007-02-28 2008-02-29 2009-02-28 2010-02-28 2011-02-28
R a t i o
M1 Money Multiplier
Source: Federal Reserve Bank of St. Louis
Exhibit 29

8/4/2019 The Winds of Change by Mario Ricchio, Director of Research at Paisley Financial
http://slidepdf.com/reader/full/the-winds-of-change-by-mario-ricchio-director-of-research-at-paisley-financial 23/38
PAISLEY FINANCIAL AUGUST 2011 MACROECONOMIC OUTLOOK
P a i s l e y F i n a n c i a l | 1 . 3 1 2 . 8 7 8 . 8 5 0 0 | w w w . p a i s l e y f i n a n c i a l . c o m 2 3
Even a staff working paper published on the Fed site posed the question of whether or not an increase
in reserve balances leads to an increase in money and lending. The authors state, “ The results in this
paper suggest that the quantity of reserve balances itself is not likely to trigger a rapid increase in
lending. To be sure, the low level of interest rate could stimulate demand for loans and lead to
increased lending, but the narrow, textbook money multiplier does not appear to be a useful means of
assessing the implications of monetary policy for future money growth or bank lending”.27
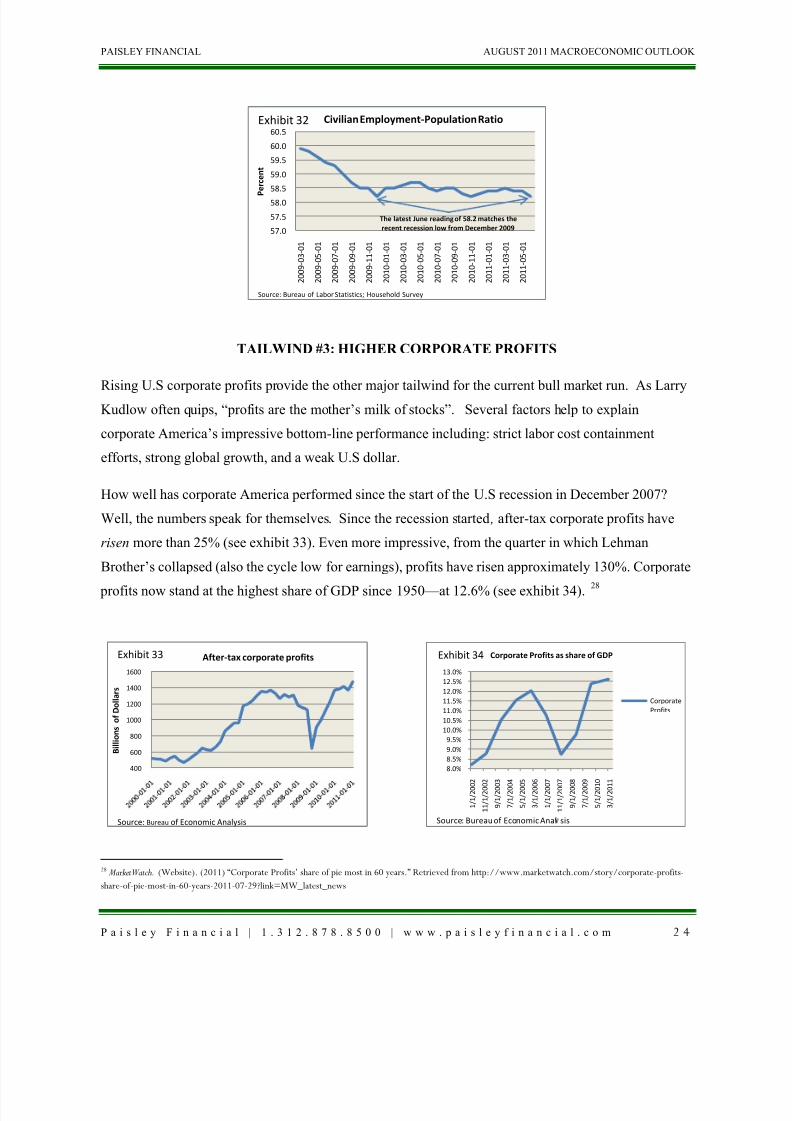
Third, quantitative easing failed to improve the employment picture. The civilian employment-
population ratio measures the ratio of employeed civilians to the total population. Since the start of
QE, there has been no visible improvement in the overall labor market. In fact, the latest June reading
of 58.2 matches the recent recession low from December 2009 (see exhibit 32). With QE unable to
significantly increase the money supply, bank lending, or jobs, we argue monetary policy contributed
very little to the real economy. What it did produce ended up hurting households. As irrational fear
over QE’s inflationary impact gripped financial markets, investors bid up commodity prices and
lowered consumer discretionary spending in the process.
27 Carpenter, S., & Demiralp, S. (2009). Staff working paper from the Finance and Economics Discussion Series. Money, Reserves, and the Transmission of
Monetary Policy: Does the Money Multiplier Exist? Retrieved from http://pragcap.com/your-textbooks-lied-to-you-the-money-multiplier-is-a-myth
0
200
400
600
800
1,000
1,200
1,400
1,600
1 9 5 9 - 0 1 - 0 1
1 9 6 3 - 0 1 - 0 1
1 9 6 7 - 0 1 - 0 1
1 9 7 1 - 0 1 - 0 1
1 9 7 5 - 0 1 - 0 1
1 9 7 9 - 0 1 - 0 1
1 9 8 3 - 0 1 - 0 1
1 9 8 7 - 0 1 - 0 1
1 9 9 1 - 0 1 - 0 1
1 9 9 5 - 0 1 - 0 1
1 9 9 9 - 0 1 - 0 1
2 0 0 3 - 0 1 - 0 1
2 0 0 7 - 0 1 - 0 1
2 0 1 1 - 0 1 - 0 1
B i l l i o n s o f
D o l l a r s
Excess Reserves of Depository InstituitionsExhibit 30
Source: Board of Governors of the Federal Reserve System: St. Louis Fed
-20
-15
-10
-5
0
5
10
15
20
25
2 0 0 1
2 0 0 2
2 0 0 3
2 0 0 4
2 0 0 5
2 0 0 6
2 0 0 7
2 0 0 8
2 0 0 9
2 0 1 0
P e r c e n t
Commercial bank lending
seasonally adjusted, annual growth rate
Bank Credit
Commercial and
industrial loans
Real estate loans
Consumer loans
Source: Board of Governers of the Federal Reserve System
Exhibit 31
8/4/2019 The Winds of Change by Mario Ricchio, Director of Research at Paisley Financial
http://slidepdf.com/reader/full/the-winds-of-change-by-mario-ricchio-director-of-research-at-paisley-financial 24/38
PAISLEY FINANCIAL AUGUST 2011 MACROECONOMIC OUTLOOK
P a i s l e y F i n a n c i a l | 1 . 3 1 2 . 8 7 8 . 8 5 0 0 | w w w . p a i s l e y f i n a n c i a l . c o m 2 4
TAILWIND #3: HIGHER CORPORATE PROFITS
Rising U.S corporate profits provide the other major tailwind for the current bull market run. As Larry
Kudlow often quips, “profits are the mother’s milk of stocks”. Several factors help to explain
corporate America’s impressive bottom-line performance including: strict labor cost containment
efforts, strong global growth, and a weak U.S dollar.
How well has corporate America performed since the start of the U.S recession in December 2007?
Well, the numbers speak for themselves. Since the recession started , after-tax corporate profits have
risen more than 25% (see exhibit 33). Even more impressive, from the quarter in which Lehman
Brother’s collapsed (also the cycle low for earnings), profits have risen approximately 130%. Corporate
profits now stand at the highest share of GDP since 1950—at 12.6% (see exhibit 34).28
28 MarketWatch. (Website). (2011) “Corporate Profits’ share of pie most in 60 years.” Retrieved from http://www.marketwatch.com/story/corporate-profits-
share-of-pie-most-in-60-years-2011-07-29?link=MW_latest_news
57.0
57.5
58.0
58.5
59.0
59.5
60.0
60.5
2 0 0 9 - 0 3 - 0 1
2 0 0 9 - 0 5 - 0 1
2 0 0 9 - 0 7 - 0 1
2 0 0 9 - 0 9 - 0 1
2 0 0 9 - 1 1 - 0 1
2 0 1 0 - 0 1 - 0 1
2 0 1 0 - 0 3 - 0 1
2 0 1 0 - 0 5 - 0 1
2 0 1 0 - 0 7 - 0 1
2 0 1 0 - 0 9 - 0 1
2 0 1 0 - 1 1 - 0 1
2 0 1 1 - 0 1 - 0 1
2 0 1 1 - 0 3 - 0 1
2 0 1 1 - 0 5 - 0 1
P
e r c e n t
Civilian Employment-Population Ratio
The latest June reading of 58.2 matches the
recent recession low from December 2009
Source: Bureau of Labor Statistics; Household Survey
Exhibit 32
400
600
800
1000
1200
1400
1600
B i l l i o n s o f D o l l a r s
After-tax corporate profits
Source: Bureau of Economic Analysis
Exhibit 33
8.0%
8.5%
9.0%
9.5%
10.0%
10.5%
11.0%
11.5%
12.0%
12.5%
13.0%
1 / 1 / 2 0 0 2
1 1 / 1 / 2 0 0 2
9 / 1 / 2 0 0 3
7 / 1 / 2 0 0 4
5 / 1 / 2 0 0 5
3 / 1 / 2 0 0 6
1 / 1 / 2 0 0 7
1 1 / 1 / 2 0 0 7
9 / 1 / 2 0 0 8
7 / 1 / 2 0 0 9
5 / 1 / 2 0 1 0
3 / 1 / 2 0 1 1
Corporate Profits as share of GDP
Corporate
Profits
Source: Bureau of Economic Anal sis
Exhibit 34

8/4/2019 The Winds of Change by Mario Ricchio, Director of Research at Paisley Financial
http://slidepdf.com/reader/full/the-winds-of-change-by-mario-ricchio-director-of-research-at-paisley-financial 25/38
PAISLEY FINANCIAL AUGUST 2011 MACROECONOMIC OUTLOOK
P a i s l e y F i n a n c i a l | 1 . 3 1 2 . 8 7 8 . 8 5 0 0 | w w w . p a i s l e y f i n a n c i a l . c o m 2 5
Corporate America found several ways to boost the bottom line. First, management reduced overhead
costs, primarily through job layoffs. Since the start of the recession, companies laid off a net 7 million
employees (see exhibit 35). More worrisome, fewer than 20% of total job losses (since December
2007) have been recovered. While U.S firms reduce domestic headcount, they have been adding jobsabroad. According to the Commerce Department, companies cut their U.S workforce by 2.9 million
during the 2000’s while increasing their overseas workforce by 2.4 million.29
With the advent of global modern communications networks, broadband, and the Internet, more U.S
jobs can be performed almost anywhere in the world. Moreover, globalization ushers in labor wage
arbitrage. As of 2008, U.S multinational firms could hire a manufacturing worker in China for only
$1.36/ per hour versus a U.S manufacturing worker at $32.26/per hour. Said another way, a U.S
manufacturing employee costs almost 24 times more than the average Chinese manufacturing
employee (see exhibit 36). With such a great labor cost discrepancy and companies out to maximize
shareholder returns, the incentive exists for jobs to move overseas. Other potential reasons may include
creating a new middle class (to replace a diminishing U.S middle class) for its products and re-locating
production closer (to save on transportation costs) to the fast-growing emerging markets.
29 Wessel, D. (2011). “Big U.S. Firms Shift Hiring Abroad.” Retrieved from
http://online.wsj.com/article/SB10001424052748704821704576270783611823972.html
0
2,000
4,000
6,000
8,000
10,000
2 0 0 7 - 1 2 - 0 1
2 0 0 8 - 0 3 - 0 1
2 0 0 8 - 0 6 - 0 1
2 0 0 8 - 0 9 - 0 1
2 0 0 8 - 1 2 - 0 1
2 0 0 9 - 0 3 - 0 1
2 0 0 9 - 0 6 - 0 1
2 0 0 9 - 0 9 - 0 1
2 0 0 9 - 1 2 - 0 1
2 0 1 0 - 0 3 - 0 1
2 0 1 0 - 0 6 - 0 1
2 0 1 0 - 0 9 - 0 1
2 0 1 0 - 1 2 - 0 1
2 0 1 1 - 0 3 - 0 1
2 0 1 1 - 0 6 - 0 1
i n t h o u s a n d s
Net Job Layoffs
Since start of recession,
employers laid off a net
7 million employees
Source: Bureau of Labor Statistics
Exhibit 35

8/4/2019 The Winds of Change by Mario Ricchio, Director of Research at Paisley Financial
http://slidepdf.com/reader/full/the-winds-of-change-by-mario-ricchio-director-of-research-at-paisley-financial 26/38
PAISLEY FINANCIAL AUGUST 2011 MACROECONOMIC OUTLOOK
P a i s l e y F i n a n c i a l | 1 . 3 1 2 . 8 7 8 . 8 5 0 0 | w w w . p a i s l e y f i n a n c i a l . c o m 2 6
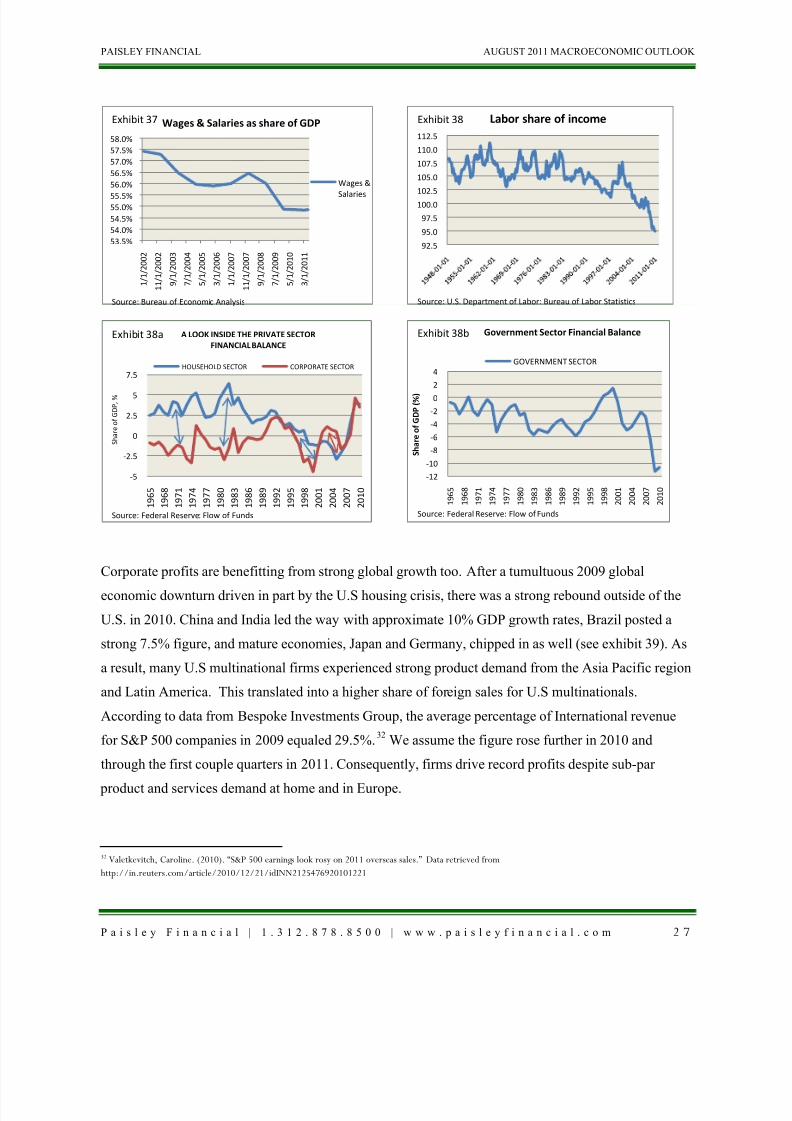
Besides layoffs and outsourcing, companies minimize total labor costs by sharing less of the profits
with employees. Even though corporate profits stand at a record high, second quarter 2011 wages &
salaries constituted the smallest share of GDP since 1955—54.9% (see exhibit 37) .30
Looking at the
same situation from a different perspective, data from the BLS reveals the lowest share of national
income ever earned by labor (see exhibit 38). After the brief-run up in labor’s share of income from
1996 to 1998, it has been straight down ever since. This means productivity gains accrued to capital--at
the expense of labor. Real labor costs have lagged productivity growth. Historically, economic
expansions and tighter labor markets usually see workers claw back some gains.31
30 MarketWatch. “Corporate Profits’ share of pie most in 60 years.”
But from 1999-2006,
the period during the housing boom, labor failed to share in the fruits of higher productivity and profits.
And after the housing bubble burst, creating a slack labor market, employees lost further ground to
capital. It may also explain why the household sector failed to report a record surplus balance as a
percentage of GDP in 2009 despite a record government sector deficit. The corporate sector surplus has
never been higher (see exhibit 38a and exhibit 38b)!
31 Gomme, P., & Rupert, P. (2004). Measuring Labor’s Share of Income. Retrieved from https://www.clevelandfed.org/research/policydis/No7Nov04.pdf
$1.36$1.68
$4.04$8.28$8.68$9.89$10.56
$13.31$27.80
$32.26$43.28
China
Mexico
Taiwan
Eastern Europe
Japan
Euro Area
Hourly Compensation Costs for All Employees in
Manufacturing, 2008
Source: U.S Department of Labor:Bureau of Labor Statistics
Exhibit 36
8/4/2019 The Winds of Change by Mario Ricchio, Director of Research at Paisley Financial
http://slidepdf.com/reader/full/the-winds-of-change-by-mario-ricchio-director-of-research-at-paisley-financial 27/38
PAISLEY FINANCIAL AUGUST 2011 MACROECONOMIC OUTLOOK
P a i s l e y F i n a n c i a l | 1 . 3 1 2 . 8 7 8 . 8 5 0 0 | w w w . p a i s l e y f i n a n c i a l . c o m 2 7
Corporate profits are benefitting from strong global growth too. After a tumultuous 2009 global
economic downturn driven in part by the U.S housing crisis, there was a strong rebound outside of the
U.S. in 2010. China and India led the way with approximate 10% GDP growth rates, Brazil posted a
strong 7.5% figure, and mature economies, Japan and Germany, chipped in as well (see exhibit 39). As
a result, many U.S multinational firms experienced strong product demand from the Asia Pacific region
and Latin America. This translated into a higher share of foreign sales for U.S multinationals.
According to data from Bespoke Investments Group, the average percentage of International revenue
for S&P 500 companies in 2009 equaled 29.5%.32
32 Valetkevitch, Caroline. (2010). “S&P 500 earnings look rosy on 2011 overseas sales.” Data retrieved from
http://in.reuters.com/article/2010/12/21/idINN2125476920101221
We assume the figure rose further in 2010 and
through the first couple quarters in 2011. Consequently, firms drive record profits despite sub-par
product and services demand at home and in Europe.
53.5%
54.0%
54.5%
55.0%55.5%
56.0%
56.5%
57.0%
57.5%
58.0%
1 / 1 / 2 0 0 2
1 1 / 1 / 2 0 0 2
9 / 1 / 2 0 0 3
7 / 1 / 2 0 0 4
5 / 1 / 2 0 0 5
3 / 1 / 2 0 0 6
1 / 1 / 2 0 0 7
1 1 / 1 / 2 0 0 7
9 / 1 / 2 0 0 8
7 / 1 / 2 0 0 9
5 / 1 / 2 0 1 0
3 / 1 / 2 0 1 1
Wages & Salaries as share of GDP
Wages &
Salaries
Source: Bureau of Economic Analysis
Exhibit 37
92.5
95.0
97.5
100.0102.5
105.0
107.5
110.0
112.5
Labor share of income
Source: U.S. Department of Labor: Bureau of Labor Statistics
Exhibit 38
-5
-2.5
0
2.5
5
7.5
1 9 6 5
1 9 6 8
1 9 7 1
1 9 7 4
1 9 7 7
1 9 8 0
1 9 8 3
1 9 8 6
1 9 8 9
1 9 9 2
1 9 9 5
1 9 9 8
2 0 0 1
2 0 0 4
2 0 0 7
2 0 1 0
A LOOK INSIDE THE PRIVATE SECTOR
FINANCIAL BALANCE
HOUSEHOLD SECTOR CORPORATE SECTOR
Source: Federal Reserve: Flow of Funds
S h a r e o f G D P ,
%
Exhibit 38a
-12
-10
-8
-6
-4
-2
02
4
1 9 6 5
1 9 6 8
1 9 7 1
1 9 7 4
1 9 7 7
1 9 8 0
1 9 8 3
1 9 8 6
1 9 8 9
1 9 9 2
1 9 9 5
1 9 9 8
2 0 0 1
2 0 0 4
2 0 0 7
2 0 1 0
S h a r e o f G D P ( % )
Government Sector Financial Balance
GOVERNMENT SECTOR
Exhibit 38b
Source: Federal Reserve: Flow of Funds

8/4/2019 The Winds of Change by Mario Ricchio, Director of Research at Paisley Financial
http://slidepdf.com/reader/full/the-winds-of-change-by-mario-ricchio-director-of-research-at-paisley-financial 28/38
PAISLEY FINANCIAL AUGUST 2011 MACROECONOMIC OUTLOOK
P a i s l e y F i n a n c i a l | 1 . 3 1 2 . 8 7 8 . 8 5 0 0 | w w w . p a i s l e y f i n a n c i a l . c o m 2 8
With relatively unattractive short-term interest rates, a structural current account deficit, QE-related
fears of money printing and inflation, and concerns over future debt monetization, the greenback found
many detractors. The U.S dollar foreign exchange value against a broad group of trading partners
peaked in the first quarter of 2002 and traded lower henceforth, with a brief respite as the carry tradeunwound with full force between August 2008 and March 2009 (see exhibit 40) . Despite increasing
the cost of living for working Americans, the weak U.S dollar positively impacts profits. First, a weak
U.S dollar increases the competitiveness of American products in overseas markets. U.S companies
end up selling more goods and services to foreign customers. Second, those foreign sales translate back
into higher U.S dollar earnings. With the tailwinds of strict cost containment, strong global growth, and
a weak currency at their backs, multinationals have produced terrific bottom-line results.
EXIT STIMULUS AND ENTER AUSTERITY
HEADWIND #1 STATE & LOCAL GOVERNMENTS
When the property bubble burst and households undertook deleveraging, property and sales tax receipts
plunged. State budget surpluses swung promptly to deficits. To achieve a balanced budget status, States
turned to a combination of spending cuts, tax hikes, and borrowing. Between the start of 2008 and the
second quarter of 2011, inflation-adjusted state and local government expenditures and gross
investment sank 5.3% to $1.45 trillion (see exhibit 41).
9.20% 9.10%
-0.60%
-2.70%
0.30%
-6.30%
-4.70%
10.30% 9.70%
7.50%7.00% 6.20%
5.00%3.60%
-8.00%
-6.00%
-4.00%
-2.00%
0.00%
2.00%
4.00%
6.00%
8.00%
10.00%
12.00%
China India Braz il Hong
Kong
Korea Japan Germany
2009
2010
Global GDP Growth Rates
Source: World Bank National Accounts Data; OECD National Accounts Data
Exhibit 39
80
90
100
110
120
130
U.S dollar foreign exchange value versus a broad
group of trading partners
Source: Board of Governors of the Federal Reserve System
Risk-on trade
Carry trade unwinds
Exhibit 40

8/4/2019 The Winds of Change by Mario Ricchio, Director of Research at Paisley Financial
http://slidepdf.com/reader/full/the-winds-of-change-by-mario-ricchio-director-of-research-at-paisley-financial 29/38
PAISLEY FINANCIAL AUGUST 2011 MACROECONOMIC OUTLOOK
P a i s l e y F i n a n c i a l | 1 . 3 1 2 . 8 7 8 . 8 5 0 0 | w w w . p a i s l e y f i n a n c i a l . c o m 2 9
Unfortunately, austerity hampers employment and growth. Over the last 12 months, state and local
governments shed 305,000 employees (see exhibit 42). More worrisome, despite state budgets being
propped up by $215 billion in ARRA-related federal funding, state and local governments detracted
from overall U.S GDP in 11 of the last 14 quarters (see exhibit 43).
State governments must deal with several challenges, including a sluggish domestic economy and the
loss of stimulus funding. Despite these concerns, FY2012 State general fund spending forecasts call for
a 2.6% increase relative to 2011.33
33 The National Governors Association and the National Association of State Budget Officers. (2011). The Fiscal Survey of States: Spring 2011. Retrieved from
http://www.nasbo.org/LinkClick.aspx?fileticket=yNV8Jv3X7Is%3d&tabid=38
We argue potential spending increases to be premature and sorely
mis-timed. Even with the modest economic improvement since 2009, budget gaps still persist.
According to the National Governers Association and the National Association of State Budget
Officers, “Although not all state budget offices have completed forecasts, thus far 33 states are
reporting $75.1 billion in budget gaps for fiscal 2012 and 21 states are reporting $61.8 billion in budget
1,400
1,420
1,440
1,4601,480
1,500
1,520
1,540
3 / 1 / 2 0 0 8
6 / 1 / 2 0 0 8
9 / 1 / 2 0 0 8
1 2 / 1 / 2 0 0 8
3 / 1 / 2 0 0 9
6 / 1 / 2 0 0 9
9 / 1 / 2 0 0 9
1 2 / 1 / 2 0 0 9
3 / 1 / 2 0 1 0
6 / 1 / 2 0 1 0
9 / 1 / 2 0 1 0
1 2 / 1 / 2 0 1 0
3 / 1 / 2 0 1 1
6 / 1 / 2 0 1 1
B i l l i o n s o f d o
l l a r s , ( $ )
State and local government consumption expenditures and
gross investment (Billions of chained 2005 dollars)
Source: U.S. Department of Commerce: Bureau of Economic Analysis
Exhibit 41
19,000
19,10019,20019,30019,40019,50019,600
6 / 1 / 2 0 1 0
7 / 1 / 2 0 1 0
8 / 1 / 2 0 1 0
9 / 1 / 2 0 1 0
1 0 / 1 / 2 0 1 0
1 1 / 1 / 2 0 1 0
1 2 / 1 / 2 0 1 0
1 / 1 / 2 0 1 1
2 / 1 / 2 0 1 1
3 / 1 / 2 0 1 1
4 / 1 / 2 0 1 1
5 / 1 / 2 0 1 1
6 / 1 / 2 0 1 1
i n t h o u s a n d s
Nonfarm payrolls: State
and local government
In last 12 months, state and local governments
shed 305,000 employees
Exhibit 42
Source: Bureau of Labor Statistics: Establishment Data
P e r c e n t , ( % )
Exhibit 43
-0.08
-0.01
0.01
-0.34
-0.08
0.12
-0.19
-0.37-0.49
0.05
-0.06
-0.33
-0.41-0.41-0.60-0.50
-0.40-0.30-0.20-0.100.000.100.20
3 / 1 / 2 0 0 8
6 / 1 / 2 0 0 8
9 / 1 / 2 0 0 8
1 2 / 1 / 2 0 0 8
3 / 1 / 2 0 0 9
6 / 1 / 2 0 0 9
9 / 1 / 2 0 0 9
1 2 / 1 / 2 0 0 9
3 / 1 / 2 0 1 0
6 / 1 / 2 0 1 0
9 / 1 / 2 0 1 0
1 2 / 1 / 2 0 1 0
3 / 1 / 2 0 1 1
6 / 1 / 2 0 1 1
Contribution to percent change in real GDP:
State and Local
(seasonally adjusted at annual rates)
Source: U.S. Department of Commerce; Bureau of Economic Analysis
P e r c e n t , ( % )
Exhibit 43

8/4/2019 The Winds of Change by Mario Ricchio, Director of Research at Paisley Financial
http://slidepdf.com/reader/full/the-winds-of-change-by-mario-ricchio-director-of-research-at-paisley-financial 30/38
PAISLEY FINANCIAL AUGUST 2011 MACROECONOMIC OUTLOOK
P a i s l e y F i n a n c i a l | 1 . 3 1 2 . 8 7 8 . 8 5 0 0 | w w w . p a i s l e y f i n a n c i a l . c o m 3 0
gaps for fiscal 2013.”34
HEADWIND#2: FEDERAL GOVERNMENT
With the national economy at risk for double-dip status in late 2012 (more on
that later), State budgets deficits are likely to widen. Consequently, State and local governments may
be forced into harsh austerity measures at a time of a national recession, intensifying the negative
feedback loop for the economy. With Washington locked into an austerity mindset, Federal stimulus(to States) remains off the table until the economy gets much worse. Given these headwinds, we expect
state and local government to detract almost 0.75% off of third and fourth quarter 2012 GDP as well as
full-year 2013 U.S GDP.
The U.S government sector poses a major risk to economic growth thanks to the intermediate –term
reduction in federal outlays, the signing of the Budget Control Act of 2011, and the withdrawal of previous stimulus efforts. Even before Congress pushed for a deficit-reduction measure in return for
raising the debt ceiling, there was already austerity scheduled to take place. For FY2012 and FY2013,
U.S government outlays are projected to decline $90 billion and $48 billion, respectively, from the
peak level of $3.82 trillion in FY2011 (see exhibit 44). This translates to a spending cut of 2.4% in
FY2012 and 1.3% spending cut in FY2013. Given the tighter control on outlays and an expected
rebound in budgetary receipts, the White House forecasts the budget deficit to shrink as a percentage of
GDP (note: this forecast came before the new Budget Control Act of 2011). The White House forecasts
the budget deficit to shrink from 10.9% in FY2011 to 3.6% in FY2014 (see exhibit 45).
34 The Fiscal Survey of States. p. 9.
3,100
3,200
3,300
3,400
3,500
3,600
3,700
3,800
3,900
4,000
4,100
FY2010 FY2011 *FY2012 *FY2013 *FY2014
U.S Government Outlays
(Fiscal year ends September 30)
B i l l i o n s o f D o l l a r s
Source: Office of Management and Budget; Executive Office of the President of the United States
Government outlays projected to decline
for two years from FY2011 peak
Exhibit 44
10.90%
3.60%
0.00%
2.00%
4.00%
6.00%
8.00%
10.00%
12.00%
FY2010 FY2011 FY2012 FY2013 FY2014
P e r c e n t , ( % )
U.S Budget Deficit as a Percent of GDP
Source: Office of Management andBudg et; Executive Office of the President of the United States
Exhibit 45

8/4/2019 The Winds of Change by Mario Ricchio, Director of Research at Paisley Financial
http://slidepdf.com/reader/full/the-winds-of-change-by-mario-ricchio-director-of-research-at-paisley-financial 31/38
PAISLEY FINANCIAL AUGUST 2011 MACROECONOMIC OUTLOOK
P a i s l e y F i n a n c i a l | 1 . 3 1 2 . 8 7 8 . 8 5 0 0 | w w w . p a i s l e y f i n a n c i a l . c o m 3 1
While curtailing deficits may sound nice in theory, in a deleveraging cycle, deflation becomes a major
risk. As Richard Koo warns us, “When the deficit hawks manage to remove the fiscal stimulus while
the private sector is still deleveraging, the economy collapses and re-enters the deflationary spiral. That
weakness, in turn, prompts another fiscal stimulus, only to see it removed again by the deficit hawksonce the economy stabilizes. This unfortunate cycle can go on for years if the experience of post-1990
Japan is any guide”.35
What’s more, U.S history suggests that drastically reducing budget deficits or
running budget surpluses results in major economic slowdowns. To argue our point, we created a long-
term chart of the U.S budget position relative to GDP and compared it to prior economic cycles (see
exhibit 46). There have been 7 U.S recessions since 1962: in the years 1969, 1973, 1980, 1981, 1990,
2001, and 200736
. In five of the recessions, a drastic reduction in the budget deficit foreshadowed a
contraction, including 1973 (-1.1%), 1979 (-1.6%), 1989 (-2.8%) and 2007 (-1.2%). And in the year
2000, a budget surplus (2.4%) preceded the 2001 recession.
Besides an intermediate-term decline in budgetary outlays, the U.S also decided to implement a long-
term deficit reduction plan. On August 2, 2011, the President signed into law the Budget Control Act of
2011. The bill’s major points include enacting a 10-year cap on discretionary spending (2012-2021),
increasing the debt limit by at least $2.1 trillion in a three-step plan, and creating a fiscal committee to
find an additional $1.5 trillion in deficit reduction by November 23, 2011-- and to vote on it byDecember 23, 2011
37
35 The Economist. (Website). (2010). “Is America facing an increase in structural unemployment?” Retrieved from http://www.economist.com/economics/by-
invitation/guest-contributions/no_america_lacks_necessary_commitment_stimulus
. If the committee enacts legislation failing to achieve at least $1.2 trillion in
36 The National Bureau of Economic Research. U.S Business Cycle Expansions and Contractions. Retrieved from http://www.nber.org/cycles.html37 The White House. (2011). Fact Sheet: Bipartisan Debt Deal: A Win for the Economy and Budget Discipline. Retrieved from
http://www.whitehouse.gov/fact-sheet-victory-bipartisan-compromise-economy-american-people
0.3 -0.4
-1.6-2.8
2.4
-1.2
-12.0
-10.0
-8.0
-6.0
-4.0
-2.0
0.0
2.0
4.0
1 9 6 7
1 9 6 9
1 9 7 1
1 9 7 3
1 9 7 5
1 9 7 7
1 9 7 9
1 9 8 1
1 9 8 3
1 9 8 5
1 9 8 7
1 9 8 9
1 9 9 1
1 9 9 3
1 9 9 5
1 9 9 7
1 9 9 9
2 0 0 1
2 0 0 3
2 0 0 5
2 0 0 7
2 0 0 9
P e r c e n t , ( % )
U.S Budget Surplus/Deficit as a Percentage of GDPExhibit 46
Source: The White House:Office of Budget and Management

8/4/2019 The Winds of Change by Mario Ricchio, Director of Research at Paisley Financial
http://slidepdf.com/reader/full/the-winds-of-change-by-mario-ricchio-director-of-research-at-paisley-financial 32/38
PAISLEY FINANCIAL AUGUST 2011 MACROECONOMIC OUTLOOK
P a i s l e y F i n a n c i a l | 1 . 3 1 2 . 8 7 8 . 8 5 0 0 | w w w . p a i s l e y f i n a n c i a l . c o m 3 2
deficit reduction by January 15, 2012, the bill automatically triggers a reduction of up to $1.2 trillion in
government outlays split evenly between domestic and defense spending. So between the upfront $900
billion of deficit reduction signed into law (see exhibit 47) and the automatic triggers, the baseline for
total budget deficit reduction equals $2.1 trillion over 10 years. On the high side, if the committee does pass a $1.5 trillion deficit reduction plan, the cumulative budgetary savings end up totaling $2.4
trillion.38
While the major spending cuts appear to be back-end loaded, projected savings from
discretionary caps still amount to $60 billion in FY2013, plus the automatic triggers kick in during the
same period. Even though the reduction in FY2012 and FY2013 government outlays appear minor as a
percent of GDP, this stands in stark contrast to the $789 billion of cumulative government spending
increases in FY2008 and FY2009. With U.S households mired in a balance sheet recession, we believe
premature fiscal consolidation increases the risk of a double-dip recession by late 2012.
The withdrawal of previous stimulus efforts constitutes another headwind to future U.S economic
growth. First, ARRA begins to fade starting in FY2012. Of the original $787 billion price tag, only 9%
of total stimulus costs remain left for distribution in the periods FY2012-2019. (see exhibit 48). From
the start of the program in February 2009 to late September 2011, the U.S. Government paid out
approximately $664.2 billion, or more than 84% of ARRA-related stimulus funding39
38 Congressional Budget Office. CBO Analysis of August 1 Budget Control Act. Retrieved from
http://cbo.gov/ftpdocs/123xx/doc12357/BudgetControlActAug1.pdf
. By the end of
FY2011, we expect approximately $674 billion of total stimulus funding to be paid out. Unfortunately,
39Recovery.gov (website). Breakdown of ARRA stimulus retrieved from: http://www.recovery.gov
-21
-42
-59-75
-87
-99-112
-126-141
-156-180
-160
-140
-120
-100
-80
-60
-40
-20
0
FY2012FY2013 FY2014FY2015 FY2016FY2017 FY2018FY2019 FY2020FY2021
Deficit Reduction from Budget Control Act of 2011,
excluding provisions from fiscal committee
Source: Congressional Budget Office
i n b i l l i o n s ,
( $ )
Exhibit 47

8/4/2019 The Winds of Change by Mario Ricchio, Director of Research at Paisley Financial
http://slidepdf.com/reader/full/the-winds-of-change-by-mario-ricchio-director-of-research-at-paisley-financial 33/38
PAISLEY FINANCIAL AUGUST 2011 MACROECONOMIC OUTLOOK
P a i s l e y F i n a n c i a l | 1 . 3 1 2 . 8 7 8 . 8 5 0 0 | w w w . p a i s l e y f i n a n c i a l . c o m 3 3
this leaves only $42 million in ARRA spending in FY2012, down from our FY2011 estimate of $120
billion. As a result, we expect ARRA to detract almost .4% from 2012 GDP.
Second, the Tax Relief, Unemployment Insurance Reauthorization, and Job Creation Act of 2010 (H.R.
4853) has certain provisions expiring in FY2012. The recently passed Budget Control Act of 2011
failed to include an extension of the one-year payroll tax holiday ($112 billion), unemployment
insurance ($56 billion), and investment incentives ($22 billion). For FY2012, the loss of stimulus from
H.R. 4853 totals approximately $190 billion. Combined with the loss of ARRA stimulus funding ($78
billion), we expect the U.S economy to lose net stimulus of approximately $268 billion. Given the
intermediate –term reduction in federal outlays, the spending caps from the Budget Control Act of
2011, and the withdrawal of previous stimulus efforts, we expect fiscal consolidation to subtractapproximately 2.5% from 2012 GDP.
THE HANDOFF FROM THE PUBLIC TO THE PRIVATE SECTOR
After several years of the public sector shoring up the U.S economic and financial system by running
higher budget deficits, the training wheels come off and the question becomes; can the private sector
lead us into a self-sustaining recovery with fiscal austerity looming on the horizon? Essentially, the
baton gets passed from the public to the private sector. With the stock market priced at a 28% premiumto its 62-year average, financial markets have yet to discount the risk of a fumble in the exchange (see
exhibit 49). As we learned from the Japanese experience of the 1990’s, private sector deleveraging
must end before it can lead an economy into a self-sustaining recovery. Any attempt at fiscal
0
100
200
300
400
500
600
700
800
900
9/30/2009 9/30/2010 9/30/2011 Total
ARRA spend-out
( cumulative share dispersed by the end of each fiscal year)
23%
74%
91%
I n b i l l i o n s o f d o l l a r s
$787 billion
Source: Congressional Budget Office
Fiscal stimulus fades into
fiscal year (FY) 2012. Only 9%
of total stimulus costs
left for distribution
in the periods FY2012-2019.
Exhibit 48

8/4/2019 The Winds of Change by Mario Ricchio, Director of Research at Paisley Financial
http://slidepdf.com/reader/full/the-winds-of-change-by-mario-ricchio-director-of-research-at-paisley-financial 34/38
PAISLEY FINANCIAL AUGUST 2011 MACROECONOMIC OUTLOOK
P a i s l e y F i n a n c i a l | 1 . 3 1 2 . 8 7 8 . 8 5 0 0 | w w w . p a i s l e y f i n a n c i a l . c o m 3 4
consolidation plunges an economy into deflation. Will it be different this time? Can the U.S consumer
offset a potential -2.5% loss to 2012 GDP from fiscal austerity?
HEADWIND #3: HOUSEHOLDS
We believe U.S households will be unable to carry the baton thanks in part to further deleveraging, a
weak labor market, and sluggish disposable personal income growth. First, U.S households still carry
too much leverage relative to historical levels. Using the Japanese experience as a guide, household
deleveraging remains far from over. From the bubble peak to the year 2001, Japan’s non-financial
firms reduced their leverage ratios by 30%. If we use household liabilities as a share of personal
disposable income as a comparable metric, U.S households would be only 60% of the way through the
deleveraging process. But we assume household leverage returns back to where it stood in the year
2000, which translates to the initial phase of the debt-financed U.S housing bubble.
So where do U.S households stand in the deleveraging cycle? Up to this point, U.S households have
taken their leverage ratio down from the peak of 132% in 2007 to 114% by the first quarter of 2011
(see exhibit 50). To reach our target level of 95%, with an assumption of no disposable personal
income growth in 2012 and 2013, and 1% growth in 2014 thru 2020, total household liabilities would
need to decline $150 billion on an annual basis between 2012-2020. In the near-term, we expect
household deleveraging to reduce personal consumption expenditures by 1% in 2012 and 2013.
0
0.25
0.5
0.75
1
1.25
1.5
1.75
2
1 9 4 9 - 1 0 - 0 1
1 9 5 2 - 0 1 - 0 1
1 9 5 4 - 0 4 - 0 1
1 9 5 6 - 0 7 - 0 1
1 9 5 8 - 1 0 - 0 1
1 9 6 1 - 0 1 - 0 1
1 9 6 3 - 0 4 - 0 1
1 9 6 5 - 0 7 - 0 1
1 9 6 7 - 1 0 - 0 1
1 9 7 0 - 0 1 - 0 1
1 9 7 2 - 0 4 - 0 1
1 9 7 4 - 0 7 - 0 1
1 9 7 6 - 1 0 - 0 1
1 9 7 9 - 0 1 - 0 1
1 9 8 1 - 0 4 - 0 1
1 9 8 3 - 0 7 - 0 1
1 9 8 5 - 1 0 - 0 1
1 9 8 8 - 0 1 - 0 1
1 9 9 0 - 0 4 - 0 1
1 9 9 2 - 0 7 - 0 1
1 9 9 4 - 1 0 - 0 1
1 9 9 7 - 0 1 - 0 1
1 9 9 9 - 0 4 - 0 1
2 0 0 1 - 0 7 - 0 1
2 0 0 3 - 1 0 - 0 1
2 0 0 6 - 0 1 - 0 1
2 0 0 8 - 0 4 - 0 1
2 0 1 0 - 0 7 - 0 1
Tobin Q ratio from 1949-2011 (quarterly data)
Source: Board of Governers of the Federal Reserve System; Federal Reserve Bank of St. Louis
From the period 1949-2011,
the average Q ratio = 0.75Based on ourcalculation of the Q ratio,
stockprices are 28%
above
the 62-year average
Q ratio as
of 3/31/2011
= 1.03
Exhibit 49

8/4/2019 The Winds of Change by Mario Ricchio, Director of Research at Paisley Financial
http://slidepdf.com/reader/full/the-winds-of-change-by-mario-ricchio-director-of-research-at-paisley-financial 35/38
PAISLEY FINANCIAL AUGUST 2011 MACROECONOMIC OUTLOOK
P a i s l e y F i n a n c i a l | 1 . 3 1 2 . 8 7 8 . 8 5 0 0 | w w w . p a i s l e y f i n a n c i a l . c o m 3 5
The labor market acts as another constraint to a U.S household-driven recovery. While the stock
market may have recovered well of the 2009 lows, the employment situation shows no real signs of
improvement. Let’s take a look at the numbers. In the last 12 months, the U.S workforce lost a net
603,000 full-time workers (see exhibit 51). And in its place, the U.S workforce added a net 835,000
part-time workers (see exhibit 52). Essentially, U.S companies decided to eliminate full-time
employees with benefits and add part-time workers with lower pay and fewer benefits. After taking a
gander at these two charts, is anyone surprised consumer confidence continues to erode?
What’s more, the long-term employment picture reveals a lost decade of non-farm payrolls. In June of
2001, total non-farm payrolls totaled approximately 132 million. Ten years later, in June of 2011, there
were only 131 million non-farm payrolls (see exhibit 53). In one decade, the U.S economy added 1
132%
114%
60%70%80%90%
100%
110%120%130%140%
1 9 7 6 - 0 1 - 0 1
1 9 7 8 - 0 1 - 0 1
1 9 8 0 - 0 1 - 0 1
1 9 8 2 - 0 1 - 0 1
1 9 8 4 - 0 1 - 0 1
1 9 8 6 - 0 1 - 0 1
1 9 8 8 - 0 1 - 0 1
1 9 9 0 - 0 1 - 0 1
1 9 9 2 - 0 1 - 0 1
1 9 9 4 - 0 1 - 0 1
1 9 9 6 - 0 1 - 0 1
1 9 9 8 - 0 1 - 0 1
2 0 0 0 - 0 1 - 0 1
2 0 0 2 - 0 1 - 0 1
2 0 0 4 - 0 1 - 0 1
2 0 0 6 - 0 1 - 0 1
2 0 0 8 - 0 1 - 0 1
2 0 1 0 - 0 1 - 0 1
2 0 1 2 - 0 1 - 0 1
2 0 1 4 - 0 1 - 0 1
2 0 1 6 - 0 1 - 0 1
2 0 1 8 - 0 1 - 0 1
2 0 2 0 - 0 1 - 0 1
P e r c e
n t
Total U.S household liabilities as a share of disposable
personal income
Peak leverage
Current level
Our target level=95%
Exhibit 50
Source: Bureau of Economic Analysis; Federal Reserve Flow of Funds
110,000
110,500
111,000
111,500
112,000
112,500
113,000
6 / 1 / 2 0 1 0
7 / 1 / 2 0 1 0
8 / 1 / 2 0 1 0
9 / 1 / 2 0 1 0
1 0 / 1 / 2 0 1 0
1 1 / 1 / 2 0 1 0
1 2 / 1 / 2 0 1 0
1 / 1 / 2 0 1 1
2 / 1 / 2 0 1 1
3 / 1 / 2 0 1 1
4 / 1 / 2 0 1 1
5 / 1 / 2 0 1 1
6 / 1 / 2 0 1 1
I n T h o u s a n d s
Full-time workers, year-over-year
Net loss of 603,000
full-time workers
Source: Bureau of Labor Statistics; Household Survey
Exhibit 51
26,200
26,400
26,600
26,800
27,000
27,200
27,400
27,600
27,800
6 / 1 / 2 0 1 0
7 / 1 / 2 0 1 0
8 / 1 / 2 0 1 0
9 / 1 / 2 0 1 0
1 0 / 1 / 2 0 1 0
1 1 / 1 / 2 0 1 0
1 2 / 1 / 2 0 1 0
1 / 1 / 2 0 1 1
2 / 1 / 2 0 1 1
3 / 1 / 2 0 1 1
4 / 1 / 2 0 1 1
5 / 1 / 2 0 1 1
6 / 1 / 2 0 1 1
I n t h o u s a n d s
Part-time workers, year-over yearExhibit 52
Source: Bureau of Labor Statistics; Household Survey

8/4/2019 The Winds of Change by Mario Ricchio, Director of Research at Paisley Financial
http://slidepdf.com/reader/full/the-winds-of-change-by-mario-ricchio-director-of-research-at-paisley-financial 36/38
PAISLEY FINANCIAL AUGUST 2011 MACROECONOMIC OUTLOOK
P a i s l e y F i n a n c i a l | 1 . 3 1 2 . 8 7 8 . 8 5 0 0 | w w w . p a i s l e y f i n a n c i a l . c o m 3 6
million fewer non-farm payrolls. The Civilian Employment-Population Ratio shows long-term labor
market deterioration as well. In June of 2011, the Civilian Employment-Population Ratio (EMRATIO)
came in at 58.2. To put it into perspective, EMRATIO is back to levels last seen in August of 1983-
more than 27 years ago (see exhibit 54).
With lackluster job growth and the apparent shift to part-time employment, employees lack the income
growth to drive consumer spending. Private sector wage and salary disbursement remain well below
the peak level (see exhibit 55). In the most recent quarter ending March 31, 2011, wages and salary
disbursement by private industries declined by approximately $133 billion, compared to same period in
2008. Moreover, real disposable personal income (which is income after taxes and inflation), has been
in a steady downward trend since 2006 (see exhibit 56). With the potential expiration of the payroll tax
cut holiday at year-end eroding after-tax income, further weakening in the U.S economy holding down
nominal wages, and the fear of QE3 maintaining a bid under commodity prices, we expect real
disposable personal income to be flat in 2012 and 2013. This puts more than 70% of GDP at risk (see
exhibit 57).
For the full year 2012, we anticipate a 1% reduction in personal consumption expenditures. The other
major contributer to GDP, government expenditures, is also set to detract from economic growth . Less
government and household spending means fewer dollars for Corporate America and for our largest
trading partners. With more than 90% of GDP in contractionary mode, the U.S is likely to be in a
recession by the fourth quarter of 2012.
128,000129,000130,000131,000132,000133,000134,000135,000136,000137,000138,000
2 0 0 0 - 0 6 - 0 1
2 0 0 1 - 0 6 - 0 1
2 0 0 2 - 0 6 - 0 1
2 0 0 3 - 0 6 - 0 1
2 0 0 4 - 0 6 - 0 1
2 0 0 5 - 0 6 - 0 1
2 0 0 6 - 0 6 - 0 1
2 0 0 7 - 0 6 - 0 1
2 0 0 8 - 0 6 - 0 1
2 0 0 9 - 0 6 - 0 1
2 0 1 0 - 0 6 - 0 1
2 0 1 1 - 0 6 - 0 1
T h o u s a n d s
Lost Decade of Non-Farm Payrolls
Source: Bureau of Labor Statistics
Exhibit 53
50.0
52.0
54.0
56.0
58.0
60.0
62.0
64.0
66.0
1 9 4 8 - 0 1 - 0 1
1 9 5 2 - 0 1 - 0 1
1 9 5 6 - 0 1 - 0 1
1 9 6 0 - 0 1 - 0 1
1 9 6 4 - 0 1 - 0 1
1 9 6 8 - 0 1 - 0 1
1 9 7 2 - 0 1 - 0 1
1 9 7 6 - 0 1 - 0 1
1 9 8 0 - 0 1 - 0 1
1 9 8 4 - 0 1 - 0 1
1 9 8 8 - 0 1 - 0 1
1 9 9 2 - 0 1 - 0 1
1 9 9 6 - 0 1 - 0 1
2 0 0 0 - 0 1 - 0 1
2 0 0 4 - 0 1 - 0 1
2 0 0 8 - 0 1 - 0 1
P e r c e n t
Civilian Employment-Population Ratio
EMRATIO back to levels
seen in August 1983
Source: Bureau of Labor Statistics; Household Survey
Exhibit 54

8/4/2019 The Winds of Change by Mario Ricchio, Director of Research at Paisley Financial
http://slidepdf.com/reader/full/the-winds-of-change-by-mario-ricchio-director-of-research-at-paisley-financial 37/38
PAISLEY FINANCIAL AUGUST 2011 MACROECONOMIC OUTLOOK
P a i s l e y F i n a n c i a l | 1 . 3 1 2 . 8 7 8 . 8 5 0 0 | w w w . p a i s l e y f i n a n c i a l . c o m 3 7
CONCLUSION
The U.S economy remains mired in a balance sheet recession. Up to this point, the U.S government
applied the necessary fiscal stimulus to offset private sector deleveraging. But with worries surfacing
about the growing public debt, policymakers now choose to unwind the stimulus and enact austerity.
Unfortunately, history teaches us that curtailing budget deficits prior to the end of a balance sheet
recession leads to a deflationary recession. This time is no different. We expect the U.S economy to be
in a double-dip recession by the fourth quarter of 2012. Investors may want to exit the side door left.
___________________________________________________________________________________
Paisley Financial does not provide legal, tax or accounting advice. Any statement contained in this communication (including any attachments)
concerning US tax matters was not intended or written to be used, and cannot be used, for the purpose of avoiding penalties under the Internal
Revenue Code, and was written to support the promotion or marketing of the transaction(s) or matter(s)addressed. Clients of Paisley Financial
should obtain their own independent tax advice based on their particular circumstances. This material represents the views of the research
group, which performs analysis for the Management Division of Paisley Financial and is not a product of Paisley Financial. This information is
4,000
4,250
4,500
4,750
5,000
5,250
5,500
B i l l i o n s o
f D o l l a r s
Wage and Salary Disbursements by Private
Industries, Quarterly Basis
Source: U.S De artment of Commerce: Bureau of Economic Anal sis
Exhibit 55
0
1
2
3
4
5
P e r c e n t , ( % )
Real Disposable Personal Income
year-over-year basis
U.S Department of Commerce: Bureau of Economic Analysis
Exhibit 56
71%
12%
-3%
20%Personal ConsumptionExpenditure
Fixed Investment
Net Exports
Government
expenditures
2010 U.S GDP Components as Share of Total GDP
Source: Federal Reserve Flow of Funds
Exhibit 57

8/4/2019 The Winds of Change by Mario Ricchio, Director of Research at Paisley Financial
http://slidepdf.com/reader/full/the-winds-of-change-by-mario-ricchio-director-of-research-at-paisley-financial 38/38
PAISLEY FINANCIAL AUGUST 2011 MACROECONOMIC OUTLOOK
provided to discuss general market activity, industry, or sector trends, or other broad-based economic, market, or political conditions. This
information should not be construed as investment advice, and investors are urged to consult with their financial advisors before buying or
selling any securities. This information may not be current and Paisley Financial has no obligation to provide any updates or changes to such
information. The views and opinions expressed herein may differ from the views and opinions expressed by other departments or divisions of
Paisley Financial. This material is intended for educational purposes only and to facilitate your discussions with Paisley Financial as to the
opportunities available to our private clients. This material does not constitute an offer or solicitation with respect to the purchase or sale of any
security in any jurisdiction in which such offer or solicitation is not authorized or to any person to whom it would be unlawful to make such offer
or solicitation. This material is based upon information which we consider reliable, but we do not represent that such information is accurate or
complete, and it should not be relied upon as such. Any historical price(s) or value(s) is as of the date indicated. Information and opinions are as
of the date of this material only and are subject to change without notice.
Economic and market forecasts presented herein reflect our judgment as of the date of this material and are subject to change without notice.
These forecasts do not take into account the specific investment objectives, restrictions, tax and financial situation or other needs of any specific
client. Clients should consider whether any advice or recommendation in this material is suitable for their particular circumstances and, if
appropriate, seek professional advice, including tax advice. References to indices, benchmarks or other measure of relative market performance
over a specified period of time are provided for your information only. Opinions expressed herein are current opinions only as of the date
appearing in this material. No part of his material may be: copied, photocopied or duplicated in any form by any means; or ii) redistributed
without Paisley Financial’ prior written consent © Copyright 2011, Paisley Financial LLC. All rights reserved.