Embed Size (px)
Citation preview

The William T. Small Keynote Lecture
School of Public HealthUniversity of North Carolina-Chapel Hill
March 1, 2002

UNC School of Public Health 1973-74


Social Determinants of Health
Implications for Intervening on Racial and Ethnic Disparities
Sherman A. James, Ph.D.University of Michigan

SOCIAL DETERMINANTS
Life enhancing resources - the food supply, economic and social relationships, educational opportunities, housing, medical care, transportation, the built environment, etc. - whose distribution across populations effectively determines inter-population differences in length and quality of life.

Why is the elimination of racial and ethnic health disparities of such vital importance to the country?
What are some important factors that underlie persistent racial and ethnic disparities in health?
What standards are appropriate for measuring progress in eliminating racial and ethnic health disparities?
How might we organize our work so that real progress toward this goal is made during this decade?


Projected Racial/Ethnic Composition of the U.S. Population
0
10
20
30
40
50
60
70
80
90
100
1995 2000 2005 2010 2015 2020 2025
Year
Per
cen
t
WhitesBlacksLatinosAsians
Source: Smith and Edmonston 1997 (National Research Council Report)


1998
Rate2 RR
855
1136 1.33
705 0.83
517 0.60
596 0.70
and 1998All Cause Age-adjusted1 Death Rates and Rate Ratios by Race/Ethnicity: United States, 1990
Race/Ethnicity 1990
Rate2 RR
White
Black
AmericanIndian/NativeAlaskan
Asian/PacificIslander
Hispanic
910
1250 1.37
716 0.79
582 0.64
692 0.76
1Direct Method, 2000 US population as standard; 2deaths per 100,000 Source: Health, United States 2001


Complications - eye disease, kidney disease,heart disease, and nervous system damage
Preventable through healthy eating, regular exercise and weight control
Costs US economy ~ $100 billion/year
DIABETES MELLITUS
A complex metabolic disorder - poorlyunderstood and poorly managed
Source: J. McKinley, L. Marceau, Lancet 2000; 356: 757-61

Men’s FitnessFebruary 2002, p. 69

Diabetes Age-adjusted1 Death Rates and Rate Ratios by Race/Ethnicity: United States, 1990
Race/Ethnicity 1990
Rate2 RR
White 18.8
Black 40.5 2.15
AmericanIndian/NativeAlaskan
34.1 1.81
Asian/PacificIslander
14.6 0.78
Hispanic 28.2 1.50
1998
Rate2 RR
21.9
48.4 2.21
45.9 2.10
16.9 0.77
32.1 1.47
and 1998
1Direct Method, 2000 US population as standard; 2deaths per 100,000 Source: Health, United States 2001

HEALTHY PEOPLE 2010
“Our goal is to eliminate disparities in
health among all population groups by 2010…”
Hon. Tommy G. ThompsonUS SecretaryHealth and Human Services
Press Release: January 24, 2002

Participating communities will match federal resources to develop coalitions between privateand public organizations... in prevention, medical, social, educational, business, religious and civic services
HEALTHY COMMUNITIES INITIATIVE
...demonstration projects in 5 communities to enhance access to services and encourage positive behavioral changes...
Source: HHS Press Release, February 6, 2002


Census tractSocioenvironmentScore
IncomeEducation
Mortality 50-60%highermortality inpoorer areas
LEVEL
Authors Neighborhood Individual Outcome Findings
Yen &KaplanAJE, 1999
Setting
AlamedaCounty, CA
1983-94follow up
Multi-level Socioeconomic Effects on Health, Health Behaviors and Health Resources

Census BlockSocioenvironmentScore, 1990
IncomeEducationOccupation
CHDincidence
2-3 fold Higherincidencein poorneighborhoods
LEVEL
Authors Neighborhood Individual Outcome Findings
Diez Rouxet alNEJM, 2001
ARICCommunities
Setting
1987-97follow up
Multi-level Socioeconomic Effects on Health,Health Behaviors and Health Resources

LEVEL
Authors Neighborhood Individual Outcome Findings
Diez Rouxet alJECH, 1999
ARICCommunities
Setting
1987-97follow up
Census blockmedian householdincome, 1990
FamilyIncome
Higher incomeassociated withhealthier diets
Daily F/V/M*
consumption
*Fruits/Vegetables/Meat
Multi-level Socioeconomic Effects on Health,Health Behaviors and Health Resources

Census tractmedian homevalue, 1990
NA
Prevalenceof food stores
More foodstores in wealthier areas
AJPM, 2002
Authors Neighborhood Individual Outcome Findings
LEVEL
Morland et al
Setting
216 censustracts in ARICcommunities
Multi-level Socioeconomic Effects on Health,Health Behaviors and Health Resources

Authors Neighborhood Individual Outcome Findings
LEVEL
Morland et alAJPM, 2002
Setting
216 censustracts in ARICcommunities
Census tract% Black residents, 1990
NA
Prevalenceof food stores
Fewer food stores in predominatelyBlack areas
Multi-level Socioeconomic Effects on Health,Health Behaviors and Health Resources


Racial/Ethnic Differences in Access to Medical Care?
Yes YesYes Yes
? ?
1985 2000
CANCER
BreastProstate
DIABETES
HEART DISEASE Yes Yes
Sources: Mayberry et al, 2000; Kaiser Family Foundation Report, October 1999

White
Black
80%
60%
40%
20%
0%Mild Disease
Severe Disease
25%
35%
61%
45%42%
31%
SOURCE: Peterson, et al., 1997
Percent Receiving Coronary Artery Bypass Graft Surgery
>1 Year LifeExtension Expected
with Surgery
Differences in Heart Surgery Rates by Race,Disease Severity, and Survival Benefit


CDC’S REACH1 2010 INITIATIVE
Eliminate Racial/Ethnic Disparities in Six Areas:
Infant Mortality
Cancer Screening and Management
Cardiovascular Disease
Diabetes
HIV Infection/AIDS
Child and Adult Immunizations
1Racial and Ethnic Approaches to Community Health

Washtenaw Co.
C a n a d aCanada
LakeSt. Clair
LakeErie
OaklandOaklandOaklandOaklandOaklandOaklandOaklandOaklandOaklandCounty
MacombMacombMacombMacombMacombMacombMacombMacombMacombCounty
WayneWayneWayneWayneWayneWayneCounty
Detroit
Metro Detroit Area

OAKLAND COUNTY
“Oakland county ranks in the top five in the country in many areas crucial to reading a County’s success. Our mix of economic activity and quality of life programs and resources make Oakland County an ideal destination for families and businesses…Oakland County ranks second in per capita income for counties with over one million people, and we have a coveted triple AAA bond rating by both Standard and Poors and Moody’s, putting the County in the top one percent of all counties…”
Source: http://www.co.oakland.mi.us/aboutcommunity/


Total Number of Jobs by Location in Metro Detroit, 1960 - 1990
0100200300400500600700800900
1,0001,1001,2001,3001,4001,500
City of Detroit
Suburban Ring
Nu
mb
er o
f Jo
bs
(Th
ousa
nd
s)
1960 19801970 1990
Source: Farley et al Detroit Divided, 2000

Majority Race by Census TractMetro Detroit, 2000

Health Status and Health Behaviors, Tri-County Metro Detroit
Oakland Macomb Wayne
%Fair/PoorHealth
9.4 11.6 18.1
Overweight 28.3 33.3 37.1
No LeisureTime PhysicalActivity
18.7 22.8 29.5
Source: Michigan Behavioral Risk Factor Surveys, 1995-99
1
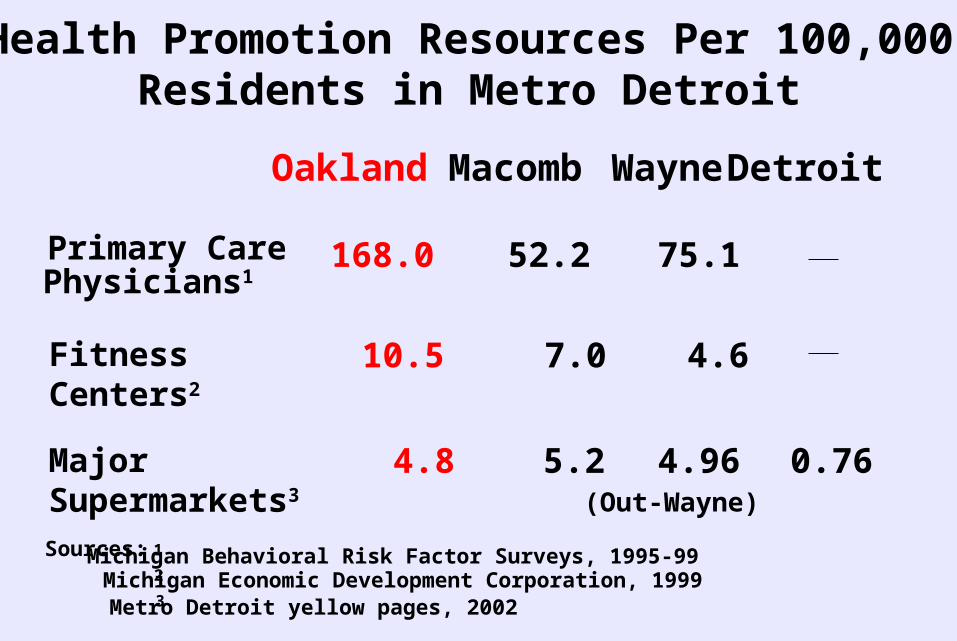
Primary CarePhysicians1
168.0 52.2 75.1
Sources: Michigan Behavioral Risk Factor Surveys, 1995-992
Fitness Centers2
10.5 7.0 4.6
Michigan Economic Development Corporation, 19993
4.8 5.2 4.96(Out-Wayne)
0.76
Metro Detroit yellow pages, 2002
Oakland Macomb Wayne Detroit
Health Promotion Resources Per 100,000Residents in Metro Detroit
MajorSupermarkets3

Men
Suburbs1 Rate2 RRWhite 392
Black 793 2.0
DetroitWhite 968 2.47
Black 1124 2.87
1Oakland, Macomb, and Out-Wayne Counties2Per100,000 Age-adjusted by Direct Method, sex-specific standard population of 25-64 year olds in Tri-County Suburbs
All Cause Death Rates for 25-64 Yr. Old Persons by Race and Place, Metro Detroit 1999/2000
1 2
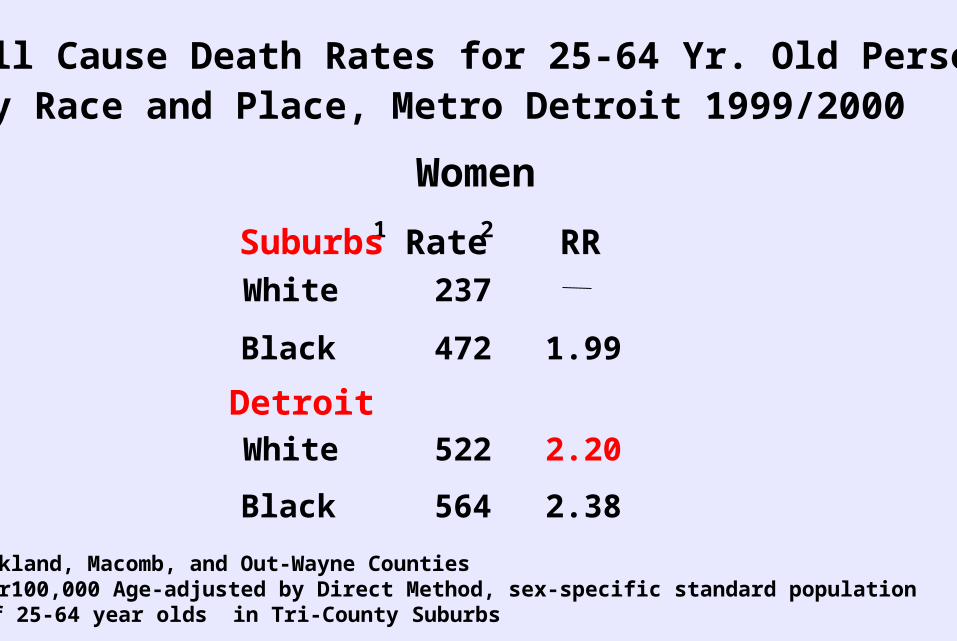
Women
Suburbs Rate RRWhite 237
Black 472 1.99
DetroitWhite 522 2.20
Black 564 2.38
All Cause Death Rates for 25-64 Yr. Old Persons by Race and Place, Metro Detroit 1999/2000
1Oakland, Macomb, and Out-Wayne Counties2Per100,000 Age-adjusted by Direct Method, sex-specific standard population of 25-64 year olds in Tri-County Suburbs

Source: The New Yorker Magazine

COALITIONS WITH MULTI-LEVELPROBLEM SOLVING SKILLS
increase goods and services in poor communities
advocate for healthy public policies
design/evaluate interventions
Source: J. McKinlay and L. Marceau, Lancet, 2000; 356: 757-61
PARTNERS WHO CAN
treat health problems effectively promote healthy behaviors amongindividuals and families

REACH DETROIT*
Towards a Social Ecology of Health
*Funded by CDC grant number CCU517264

Health Care Systems
20 MD’s
CHA’s4 Black4 Hispanics
Detroit Hlth Dept.Education Programs
UMSPHEvaluation
Families 150 Black 150 Hispanics
Communities
FHA’s 5 Black 5 Hispanics

CONCLUSIONS
US racial/ethnic disparities in health remain unacceptably large
These disparities are largely socially determined,reflecting structural inequalities in neighborhood resources and access to quality medical care
Elimination of racial/ethnic health disparities requires broad-based coalitions - including strong governmental leadership - capable of solving problems at multiple levels

ACKNOWLEDGEMENTSUNIVERSITY OF MICHIGAN
School of Public Health
Debbie BarringtonMiwon ChoeLynda FuerstnauArline GeronimusTrevillore RaghunathanAnita VashiAmanda Wobbema
Institute for Social ResearchJohn VanHoewyk
Hatcher Graduate LibraryJoAnn Dionne