Embed Size (px)
Citation preview

The WIID: Update and Some New Results onRedistribution
Jukka Pirttilä (UNU-WIDER)
UNU-WIDER - ICRIER Conference: Inequality - Trends Worldwideand in India
1 / 35

Outline
Introduction
The WIIDThe background for the WIIDWIID evaluationThe latest revision
Redistribution in the worldMethodsDescriptive results
Determinants of redistribution
Replication of an IMF study on redistribution
Conclusion
2 / 35

This talk:
I Introduces the latest update of the World Income InequalityDatabase, the WIID3.3
I Presents �ndings from ongoing research with Markus Jäntti(University of Helsinki) and Risto Rönkkö (University of Tampereand UNU-WIDER)
I What is currently being done to address inequality: The extent ofredistribution across the world
I What are the determinants of redistributionI Whether results from an in�uential study on the impacts of
inequality on growth, conducted using a di�erent dataset, survive ifbased on the WIID data
3 / 35

Outline
Introduction
The WIIDThe background for the WIIDWIID evaluationThe latest revision
Redistribution in the worldMethodsDescriptive results
Determinants of redistribution
Replication of an IMF study on redistribution
Conclusion
4 / 35
Outline
Introduction
The WIIDThe background for the WIIDWIID evaluationThe latest revision
Redistribution in the worldMethodsDescriptive results
Determinants of redistribution
Replication of an IMF study on redistribution
Conclusion
5 / 35

What is the WIID?
I A collection of information on economic inequality in all countriesof the world, freely available on WIDER webpage
I WIID1: World Bank data and additional observations collected fora research project and then made publicly available in 2000
I WIID2: Major revision with more information on the underlyingassumptions regarding the observations, quality rating. Latestupdate in 2008
I WIID3: Data for seven more years, addressed comments by Jenkins(2014), summer 2014
6 / 35

The basic philosophy in the WIID
I A Gini index can mean very di�erent things
I income vs consumptionI gross income (before government intervention) or disposable income
(after government intervention)I use of equivalence scales or notI area, population coverage etc.
I The WIID gives all this information to the users
I enables reasonable comparisons of inequality between countries andacross years
I Inequality data in developing countries only collected ca. every�fth/seventh year
I the WIID does not pretend that there would be observationsbetween the years when actual data have been collected
7 / 35

Evaluation of the WIID
I The Society for the study of Economic Inequality organized anappraisal of cross-country datasets on inequality
I The WIID was rated as a credible source for work on cross-countryinequality (Jenkins, 2015).
I precisely because the user can actually know what data he or she isusing.
I Jenkins also had a number of useful points on how to improve theWIID. All these have been incorporated, see Badgaiyan, Pirttilä,and Tarp (2015).
8 / 35
WIID3.3
I Latest revision is ready, available on the webpage
I Observations now up until 2013, some new sources
I Simpli�ed categorization of some background variable (such as theequivalence scale) also o�ered
I Most importantly, a new query and visualization system, see WIIDuser interface
9 / 35

Outline
Introduction
The WIIDThe background for the WIIDWIID evaluationThe latest revision
Redistribution in the worldMethodsDescriptive results
Determinants of redistribution
Replication of an IMF study on redistribution
Conclusion
10 / 35

Measuring redistribution
I In a work-in-progress project with Markus Jäntti and Risto Rönkkö,we use the WIID to measure the extent of redistribution all over theworld
I 3 measures of absolute redistribution (�gross-net income�)
I gross income Gini - disposable income GiniI gross income Gini - consumption GiniI gross income Gini - either disposable income or consumption Gini
I One can also examine relative redistribution
I absolute redistribution/gross income Gini
I When calculating redistribution, we favour high quality observationswith the adult equivalence scale used
11 / 35
The goals of the study
I To simply describe how much data do we have on redistribution,based on one of the most comprehensive (or the mostcomprehensive) data on inequality across countries
I Characterize the determinants of redistribution, paying specialemphasis on possible problems in the empirical speci�cations usedin earlier analysis.
I this deals with solving a mechanical correlation between thedependent and independent variables
I To take data issues seriously and replicate the analysis in (Ostry,Berg, and Tsangarides, 2014) regarding the impact of redistributionand gross inequality on growth
12 / 35

How many observations?
13 / 35

Obs. if equivalence scale the same
14 / 35
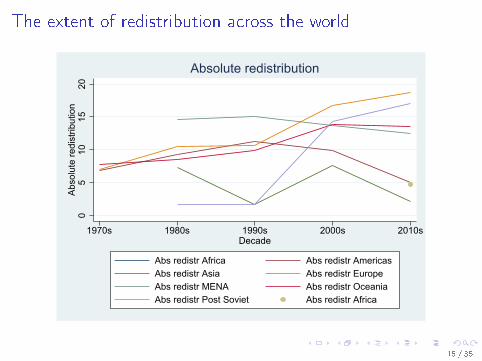
The extent of redistribution across the world
05
1015
20Ab
solu
te re
dist
ribut
ion
1970s 1980s 1990s 2000s 2010sDecade
Abs redistr Africa Abs redistr AmericasAbs redistr Asia Abs redistr EuropeAbs redistr MENA Abs redistr OceaniaAbs redistr Post Soviet Abs redistr Africa
Absolute redistribution
15 / 35

The extent of redistribution across the world
010
2030
40R
elat
ive
redi
strib
utio
n
1970s 1980s 1990s 2000s 2010sDecade
Abs redistr Africa Abs redistr AmericasAbs redistr Asia Abs redistr EuropeAbs redistr MENA Abs redistr OceaniaAbs redistr Post Soviet Abs redistr Africa
Relative redistribution
16 / 35
Outline
Introduction
The WIIDThe background for the WIIDWIID evaluationThe latest revision
Redistribution in the worldMethodsDescriptive results
Determinants of redistribution
Replication of an IMF study on redistribution
Conclusion
17 / 35

What country characteristics are associated withredistribution?
I Using 5-year averages, we explain both absolute and relativeredistribution by some economic and institutional variables as wellas inherent inequality
I only some of the institutional variables can be used to preserve thenumber of observations
I In the model, gross and net income Ginis behind the redistributionuse common equivalence scale
18 / 35

Relation to earlier work
I Some earlier papers on the determinants of redistribution are mainlymotivated by the median voter hypothesis, see for instanceMilanovic (2010) and Luebker (2014)
I Others motivated from a wider view on distributional concerns(Tanninen and Tuomala 2005 and Scervini 2012)
I The value added in our work
I we use data also outside of developed countriesI some additional explanatory variablesI in particular, we point out an estimation problem and its
consequences in the earlier work
19 / 35

An econometric problem
I Much of the earlier work regresses redistribution (gross -net) ongross income inequality
I However, this leads to a mechanical (positive) correlation betweenthe dependent and independent variable
I We rather regress net inequality on gross inequality and deduce thecoe�cients for a redistribution regression
20 / 35

Regression results on redistribution
(1) (2) (3) (4)VARIABLES Abs redist Abs redist Rel redist Rel redist
Log GDP per capita 1.900** 10.18*** 4.667*** 14.19*(0.775) (2.038) (1.660) (7.381)
Log population 0.397 -13.05** 0.220 -47.45**(0.354) (5.256) (0.752) (18.35)
Openness 4.664*** -3.127 8.767*** -11.06(1.198) (2.896) (2.574) (9.176)
Federation 0.592 1.846(0.914) (1.980)
Gross income Gini 0.347*** 0.742*** 0.415*** 1.231***(0.0661) (0.0930) (0.142) (0.227)
Democracy -0.347 -0.0855 -0.728 1.701*(0.264) (0.279) (0.543) (0.867)
Ethnic fractionalization -8.868*** -19.88***(1.965) (4.349)
Observations 119 119 119 109R-squared 0.631 0.798 0.577 0.622Time dummies X X X XCountry dummies X XNumber of countryid 39 38
Robust standard errors in parentheses*** p<0.01, ** p<0.05, * p<0.1
21 / 35

Solving the correlation
I We regress Gneti ,t = α +βG gross
i ,t + cntrlsi ,t + εi ,t
I Manipulating this (see the Appendix): It can be shown that 1−β
gives an estimate of the coe�cient of G gross when regressingredistribution G gross −Gnet
I An estimate of the coe�cient of G gross when regressingredistribution G gross −Gnet is given by (1−β )/G gross
22 / 35

Regression results on net inequality
(1) (2)
VARIABLES Gini_net Gini_net
Log GDP per capita -1.878** -9.968***
(0.768) (2.264)
Log population -0.488 12.42**
(0.347) (5.989)
Openness -4.917*** 3.589
(1.204) (3.119)
Federation -0.676
(0.908)
Gross income Gini 0.657*** 0.251**
(0.0649) (0.0949)
Democracy 0.331 0.331
(0.288) (0.478)
Ethnic fractionalization 9.211***
(1.941)
Observations 118 118
R-squared 0.765 0.495
Implied abs beta 0.343 0.749
Implied rel beta 0.801 1.751
Number of countryid 39
23 / 35

Some observations based on these results
I GDP (in a log log speci�cation: elasticity 0.3) and ethnic unity arestrongly positively linked with redistribution
I The original Mirrlees idea gets strong support: greater inherentinequality leads to more redistribution
I Surprisingly the extent of democracy is not positively correlatedwith redistribution
I The bias created by the mechanical correlation between thedependent and one of the RHS variables which was rather small inthe absolute case but not so in the relative redistribution case
24 / 35
Outline
Introduction
The WIIDThe background for the WIIDWIID evaluationThe latest revision
Redistribution in the worldMethodsDescriptive results
Determinants of redistribution
Replication of an IMF study on redistribution
Conclusion
25 / 35
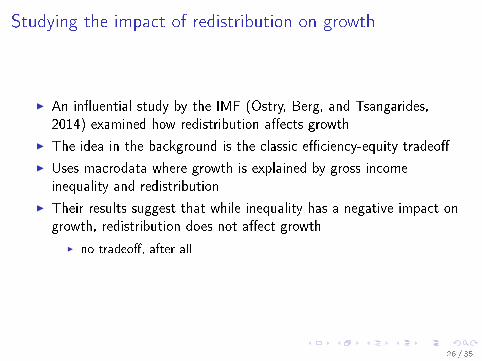
Studying the impact of redistribution on growth
I An in�uential study by the IMF (Ostry, Berg, and Tsangarides,2014) examined how redistribution a�ects growth
I The idea in the background is the classic e�ciency-equity tradeo�
I Uses macrodata where growth is explained by gross incomeinequality and redistribution
I Their results suggest that while inequality has a negative impact ongrowth, redistribution does not a�ect growth
I no tradeo�, after all
26 / 35

The trouble in the study
I The data for inequality and redistribution comes from the SWIID,the Standardized WIID, see Solt (2009)
I In the SWIID, if there is no data for a given country in a given year,both gross and net income inequality values are imputed based onvalues from the same country in di�erent years and from othercountries in the same year
I While we do not have all available data in the WIID, it is likely thata very large proportion of the data used to measure redistribution inthe SWIID are actually imputations (or guesses), especially fordeveloping countries.
27 / 35

Observations on redistribution in the WIID vs. in Ostry,Berg, and Tsangarides (2014)
Income group SWIID, full sample
SWIID, baseline sample
SWIID, restricted sample WIID
Low income 142 104 31 1 Lower middle income 230 146 82 20 Upper middle income 294 229 110 44
High income: nonOECD 128 125 81 21
High income: OECD 279 279 207 197 Not specified 0 0 0 10
Total 1073 883 511 293
28 / 35

Replication using WIID data
I We have replicated the analysis in the (Ostry, Berg, andTsangarides, 2014) paper
I It turns out that some of the results change: growth is not anymorea�ected negatively by gross income inequality
I this happens both with WIID data and with SWIID data for theWIID sample (that is, for 'real' observations)
I The coe�cient of redistribution remains non-signi�cant
I this is important since this result in the original analysis could havebeen an artefact of an attenuation bias caused by measurement error
29 / 35

Replication of Ostry, Berg, and Tsangarides (2014):redistribution regressions
Ostry et. al Ostry et al. with WIID observations WIID
Market inequality 0.483∗∗∗ 0.462∗∗∗ 0.765∗∗∗
(0.0523) (0.1695) (0.1172)Log(initial income) 1.469 1.018 -4.440
(0.9377) (3.3752) (3.3531)Constant -28.392∗∗∗ -21.343 13.298
(8.1707) (30.5103) (29.4042)
Observations 829 143 163R-squared 0.8797 0.9772 0.9239
Standard errors in parenthesesOLS estimation with country and �ve-year period dummies.Clustered Standard errors robust for intragroup (country) correlation.∗ p < 0.10, ∗∗ p < 0.05, ∗∗∗ p < 0.01
30 / 35

Table: Ostry et al. (2014) Table 3, baseline model with controls. Regression of�ve-year economic growth.
Ostry et al. Ostry et al. with WIID observations WIID
Log(initial income) -0.0143∗∗∗ -0.0199 -0.0232(-3.79) (-1.21) (-1.28)
Net inequality -0.000707∗∗∗ 0.000542 -0.00106(-2.64) (0.39) (-0.79)
Redistribution 0.000187 0.00136 0.000281(0.47) (1.06) (0.41)
Log(investment) 0.0231∗∗ 0.0240 0.0539∗
(2.56) (0.84) (1.69)Log(population growth) -0.0232 0.0439 0.00187
(-1.19) (0.70) (0.01)Log(total education) 0.0219∗∗∗ -0.0224 -0.0520
(2.85) (-0.48) (-0.67)Constant 0.102∗∗∗ 0.0987 0.252∗
(2.58) (0.48) (1.83)
Observations 751 78 78Number of countries 110 33 33Sargan 0.0000 0.0153 0.4986Hansen 0.9502 1.0000 1.0000AR1 0.0000 0.8425 0.7165AR2 0.1704 0.8095 0.7862Number of instruments 139 91 73
t statistics in parenthesesSystem GMM estimation.∗ p < 0.10, ∗∗ p < 0.05, ∗∗∗ p < 0.01
31 / 35

Outline
Introduction
The WIIDThe background for the WIIDWIID evaluationThe latest revision
Redistribution in the worldMethodsDescriptive results
Determinants of redistribution
Replication of an IMF study on redistribution
Conclusion
32 / 35

Conclusions
I Data on redistribution very patchy for developing countries
I Earlier research on redistribution and its impact needs to beinterpreted cautiously because of de�ciencies in data and methods
I Based on the data at our disposal, redistributive e�orts stronglylinked with economic development
I World redistribution has only a minor impact on world incomeinequality (Kopczuk, Slemrod, and Yitzhaki 2005, Bourguignon,Levin, and Rosenblatt 2009)
I Clearly a need to build comprehensive social protection systemswithin nation states as countries develop
33 / 35

References I
Badgaiyan, N., J. Pirttilä, and F. Tarp (2015): �Response to ProfessorStephen Jenkins' comments on the World Income Inequality Database(WIID),� The Journal of Economic Inequality, 13(4), 679�682.
Bourguignon, F., V. Levin, and D. Rosenblatt (2009): �InternationalRedistribution of Income,� World Development, 37(1), 1�10.
Jenkins, S. P. (2015): �World income inequality databases: anassessment of WIID and SWIID,� The Journal of Economic Inequality,13(4), 629�671.
Kopczuk, W., J. Slemrod, and S. Yitzhaki (2005): �The limitations ofdecentralized world redistribution: An optimal taxation approach,�European Economic Review, 49(4), 1051 � 1079.
Luebker, M. (2014): �Income Inequality, Redistribution, and Poverty:Contrasting Rational Choice and Behavioral Perspectives,� Review of
Income and Wealth, 60(1), 133�154.
34 / 35

References II
Milanovic, B. (2010): �Four critiques of the redistribution hypothesis:An assessment,� European Journal of Political Economy, 26(1), 147 �154.
Ostry, J. D., A. Berg, and C. G. Tsangarides (2014): �Redistribution,Inequality, and Growth,� Discussion Paper Sta� Discussion Notes No.14/2, International Monetary Fund.
Scervini, F. (2012): �Empirics of the median voter: Democracy,redistribution and the role of the middle class,� Journal of Economic
Inequality, 10(4), 529�550, cited By 0.
Solt, F. (2009): �Standardizing the World Income Inequality Database*,�Social Science Quarterly, 90(2), 231�242.
Tanninen, H., and M. Tuomala (2005): �Inherent inequality and theextent of redistribution in OECD countries,� CESifo DICE Report, 3.
35 / 35