Embed Size (px)
Citation preview
THE WIDGET EFFECTOur National Fai lure to Acknowledge and Act on Differences in Teacher Effectiveness
Daniel Weisberg • Susan Sexton • Jennifer Mulhern • David Keeling
2009
THE WIDGET EFFECT
02 | FOREWORD
03 | EXECUTIVE SUMMARY
09 | THE PROBLEM: Teachers as Interchangeable Parts
10 | CHARACTERISTICS: The Widget Effect In Teacher Evaluation
19 | FLAWS In Evaluation Practice
24 | POLICY IMPLICATIONS Of the Widget Effect
26 | RECOMMENDATIONS: Reversing the Widget Effect
31 | END NOTES
33 | METHODOLOGY
Our National Failure to Acknowledge and Act on Differences in Teacher Effectiveness
authors | Daniel Weisberg • Susan Sexton • Jennifer Mulhern • David Keelingcontributing authors | Joan Schunck • Ann Palcisco • Kelli Morgan
Second Edition

Acknowledgments | This report is the result of invaluable contributions from many individuals across
The New Teacher Project. The authors would especially like to thank Dahlia Constantine, Timothy Daly, Vinh Doquang,
Adele Grundies, Crystal Harmon, Dina Hasiotis, Ellen Hur, Gabrielle Misfeldt, David Osta, Ariela Rozman and Jeffrey Wilson
for their efforts and insights. Additionally, we would like to thank Rachel Grainger, Judith Schiamberg and Andrew Sokatch
for their work on the initial design of the project, and Caryn Fliegler and Elizabeth Vidyarthi for their help in the report’s publication.
We would also like to recognize the advisory panels in each of the four study states for helping us shape the study design,
understand state policy and refine the report’s recommendations.
We are indebted to each of the districts represented in our study and their staff members who provided invaluable assistance to
us with data collection and interpretation. We are grateful for the commitment from district leadership and central office staff as
well as leadership and staff at local teachers unions, all of whom invested many hours of their valuable time to provide us with data,
information and local context.
Finally, we thank each of the approximately 15,000 teachers and 1,300 administrators who dedicated time to completing our surveys.
Your opinions and thoughts continue to inspire us to work to ensure that each and every student has access to outstanding teachers.
Funding Support | Primary funding for this report was provided by the Robertson Foundation, the Bill & Melinda Gates
Foundation and the Joyce Foundation. Additional funding was provided by the Carnegie Corporation of New York, the Laura and John
Arnold Foundation, the Charles and Helen Schwab Foundation and the Walton Family Foundation. We thank all of our funders for
their generous support; however, we acknowledge that the findings and recommendations presented in this report are those of the
The New Teacher Project alone and do not necessarily reflect our funders’ opinions or positions.
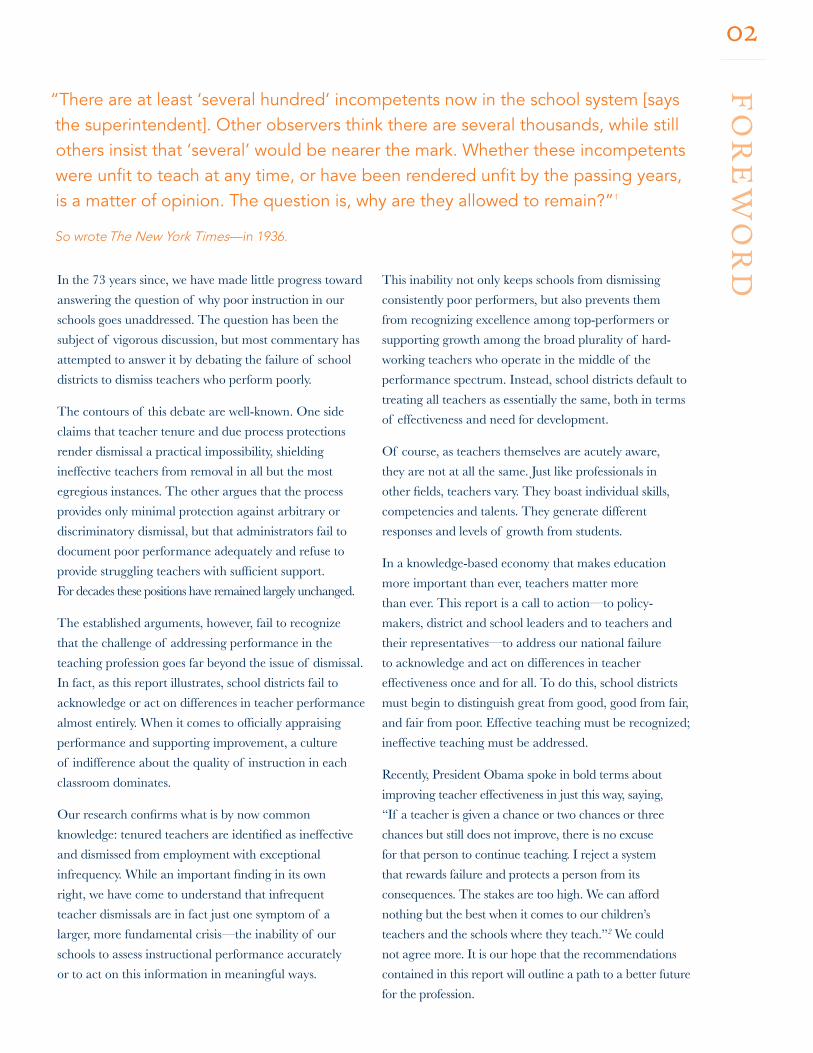
In the 73 years since, we have made little progress toward
answering the question of why poor instruction in our
schools goes unaddressed. The question has been the
subject of vigorous discussion, but most commentary has
attempted to answer it by debating the failure of school
districts to dismiss teachers who perform poorly.
The contours of this debate are well-known. One side
claims that teacher tenure and due process protections
render dismissal a practical impossibility, shielding
ineffective teachers from removal in all but the most
egregious instances. The other argues that the process
provides only minimal protection against arbitrary or
discriminatory dismissal, but that administrators fail to
document poor performance adequately and refuse to
provide struggling teachers with sufficient support.
For decades these positions have remained largely unchanged.
The established arguments, however, fail to recognize
that the challenge of addressing performance in the
teaching profession goes far beyond the issue of dismissal.
In fact, as this report illustrates, school districts fail to
acknowledge or act on differences in teacher performance
almost entirely. When it comes to officially appraising
performance and supporting improvement, a culture
of indifference about the quality of instruction in each
classroom dominates.
Our research confirms what is by now common
knowledge: tenured teachers are identified as ineffective
and dismissed from employment with exceptional
infrequency. While an important finding in its own
right, we have come to understand that infrequent
teacher dismissals are in fact just one symptom of a
larger, more fundamental crisis—the inability of our
schools to assess instructional performance accurately
or to act on this information in meaningful ways.
This inability not only keeps schools from dismissing
consistently poor performers, but also prevents them
from recognizing excellence among top-performers or
supporting growth among the broad plurality of hard-
working teachers who operate in the middle of the
performance spectrum. Instead, school districts default to
treating all teachers as essentially the same, both in terms
of effectiveness and need for development.
Of course, as teachers themselves are acutely aware,
they are not at all the same. Just like professionals in
other fields, teachers vary. They boast individual skills,
competencies and talents. They generate different
responses and levels of growth from students.
In a knowledge-based economy that makes education
more important than ever, teachers matter more
than ever. This report is a call to action—to policy-
makers, district and school leaders and to teachers and
their representatives—to address our national failure
to acknowledge and act on differences in teacher
effectiveness once and for all. To do this, school districts
must begin to distinguish great from good, good from fair,
and fair from poor. Effective teaching must be recognized;
ineffective teaching must be addressed.
Recently, President Obama spoke in bold terms about
improving teacher effectiveness in just this way, saying,
“If a teacher is given a chance or two chances or three
chances but still does not improve, there is no excuse
for that person to continue teaching. I reject a system
that rewards failure and protects a person from its
consequences. The stakes are too high. We can afford
nothing but the best when it comes to our children’s
teachers and the schools where they teach.”2 We could
not agree more. It is our hope that the recommendations
contained in this report will outline a path to a better future
for the profession.
02F
OR
EW
OR
D“There are at least ‘several hundred’ incompetents now in the school system [says the superintendent]. Other observers think there are several thousands, while still others insist that ‘several’ would be nearer the mark. Whether these incompetents were unfit to teach at any time, or have been rendered unfit by the passing years, is a matter of opinion. The question is, why are they allowed to remain?”1
So wrote The New York Times—in 1936.

03E
XE
CU
TIV
E S
UM
MA
RY
EXECUTIVE SUMMARYSuppose you are a parent determined to make sure your child gets the best possible
education. You understand intuitively what an ample body of research proves: that your
child’s education depends to a large extent on the quality of her teachers. Consequently,
as you begin considering local public schools, you focus on a basic question: who are the best
teachers, and where do they teach?
The question is simple enough. There’s just one problem—except for word of mouth from other
parents, no one can tell you the answers.
In fact, you would be dismayed to discover that not only can no one tell you which teachers are
most effective, they also cannot say which are the least effective or which fall in between. Were
you to examine the district’s teacher evaluation records yourself, you would find that, on paper,
almost every teacher is a great teacher, even at schools where the chance of a student succeeding
academically amounts to a coin toss, at best.
In short, the school district would ask you to trust that it can provide your child a quality
education, even though it cannot honestly tell you whether it is providing her a quality teacher.
This is the reality for our public school districts nationwide. Put simply, they fail to distinguish
great teaching from good, good from fair, and fair from poor. A teacher’s effectiveness—the most
important factor for schools in improving student achievement—is not measured, recorded, or
used to inform decision-making in any meaningful way.
A teacher’s effectiveness—the most important factor
for schools in improving student achievement—is
not measured, recorded, or used to inform decision-
making in any meaningful way.
04E
XE
CU
TIV
E S
UM
MA
RY
The Widget EffectThis report examines our pervasive and longstanding failure to recognize and respond to
variations in the effectiveness of our teachers. At the heart of the matter are teacher evaluation
systems, which in theory should serve as the primary mechanism for assessing such variations,
but in practice tell us little about how one teacher differs from any other, except teachers whose
performance is so egregiously poor as to warrant dismissal.
The failure of evaluation systems to provide accurate and credible information about individual
teachers’ instructional performance sustains and reinforces a phenomenon that we have come to
call the Widget Effect. The Widget Effect describes the tendency of school districts to assume
classroom effectiveness is the same from teacher to teacher. This decades-old fallacy fosters an
environment in which teachers cease to be understood as individual professionals, but rather as
interchangeable parts. In its denial of individual strengths and weaknesses, it is deeply disrespectful
to teachers; in its indifference to instructional effectiveness, it gambles with the lives of students.
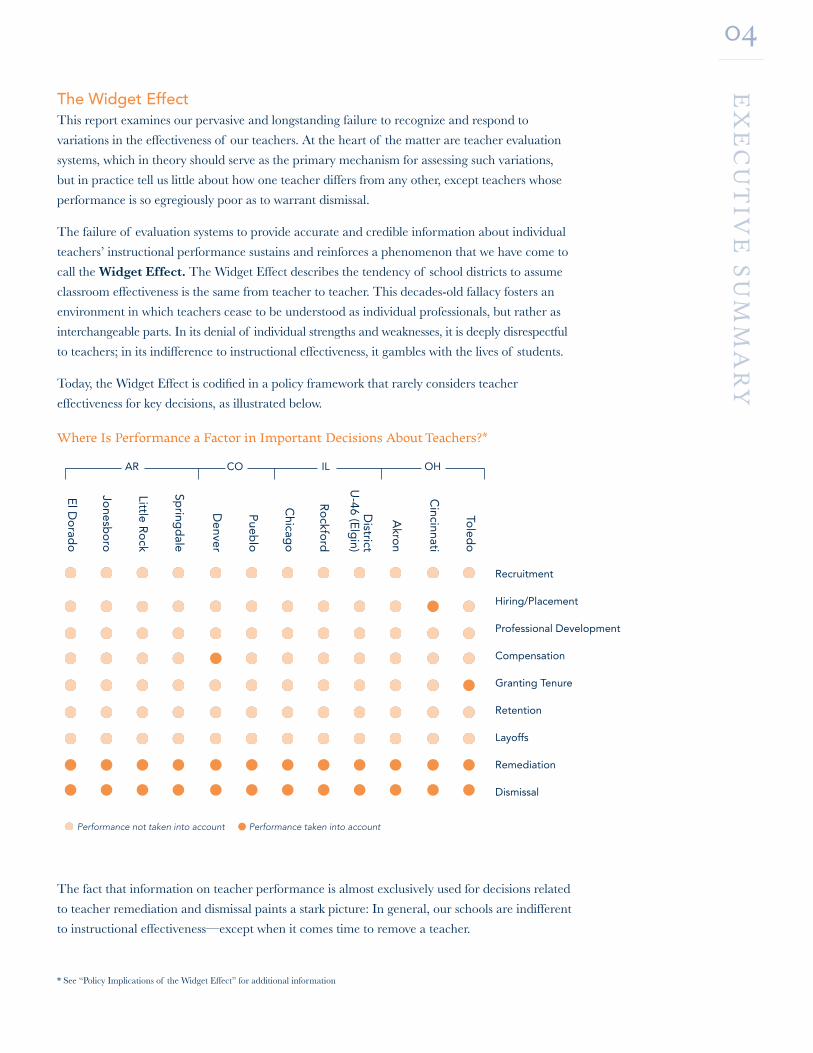
Today, the Widget Effect is codified in a policy framework that rarely considers teacher
effectiveness for key decisions, as illustrated below.
Where Is Performance a Factor in Important Decisions About Teachers?*
The fact that information on teacher performance is almost exclusively used for decisions related
to teacher remediation and dismissal paints a stark picture: In general, our schools are indifferent
to instructional effectiveness—except when it comes time to remove a teacher.
Toled
o
Cincinnati
Akro
n
District
U-46 (E
lgin)
Ro
ckford
Chicag
o
Pueb
lo
Denver
Spring
dale
Little Ro
ck
Jonesb
oro
El D
orad
o
Recruitment
Hiring/Placement
Professional Development
Compensation
Granting Tenure
Retention
Layoffs
Remediation
Dismissal
AR CO IL OH
Performance not taken into account Performance taken into account
* See “Policy Implications of the Widget Effect” for additional information
05E
XE
CU
TIV
E S
UM
MA
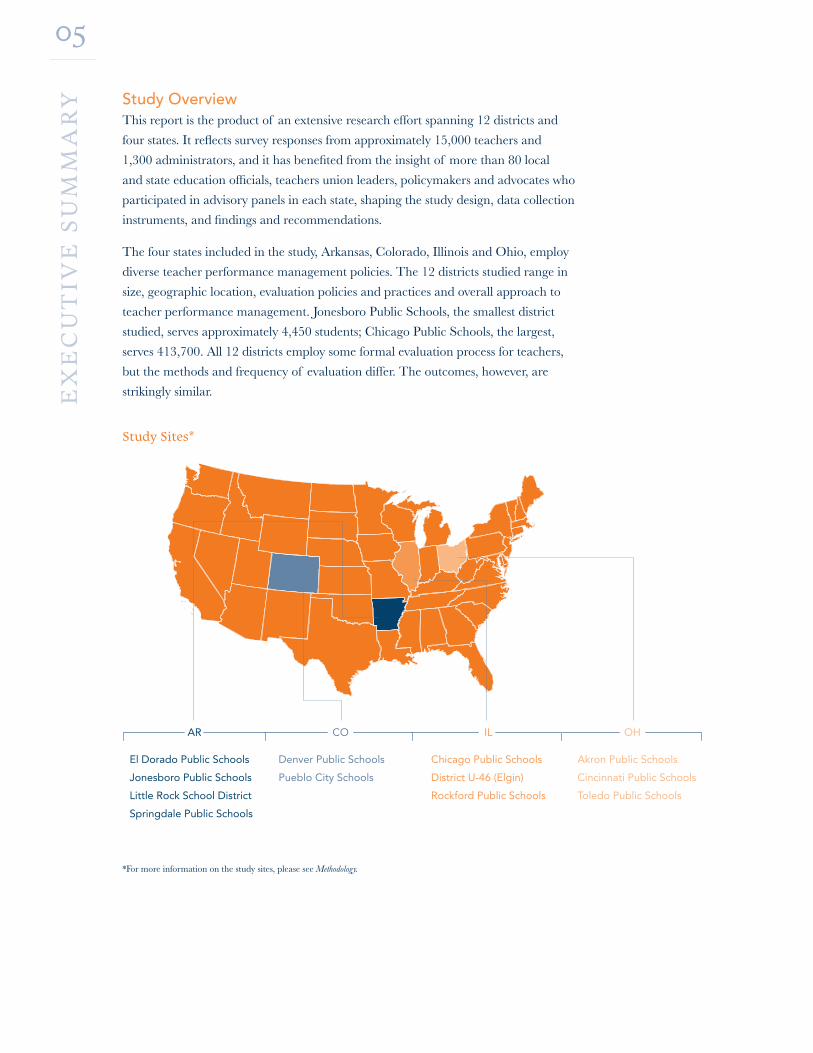
RY Study Overview
This report is the product of an extensive research effort spanning 12 districts and
four states. It reflects survey responses from approximately 15,000 teachers and
1,300 administrators, and it has benefited from the insight of more than 80 local
and state education officials, teachers union leaders, policymakers and advocates who
participated in advisory panels in each state, shaping the study design, data collection
instruments, and findings and recommendations.
The four states included in the study, Arkansas, Colorado, Illinois and Ohio, employ
diverse teacher performance management policies. The 12 districts studied range in
size, geographic location, evaluation policies and practices and overall approach to
teacher performance management. Jonesboro Public Schools, the smallest district
studied, serves approximately 4,450 students; Chicago Public Schools, the largest,
serves 413,700. All 12 districts employ some formal evaluation process for teachers,
but the methods and frequency of evaluation differ. The outcomes, however, are
strikingly similar.
Study Sites*
CO ILAR OH
El Dorado Public Schools
Jonesboro Public Schools
Little Rock School District
Springdale Public Schools
Denver Public Schools
Pueblo City Schools
Chicago Public Schools
District U-46 (Elgin)
Rockford Public Schools
Akron Public Schools
Cincinnati Public Schools
Toledo Public Schools
*For more information on the study sites, please see Methodology.
06E
XE
CU
TIV
E S
UM
MA
RY
All teachers are rated good or great In districts that use binary evaluation ratings (generally
“satisfactory” or “unsatisfactory”), more than
99 percent of teachers receive the satisfactory rating.
Districts that use a broader range of rating options do
little better; in these districts, 94 percent of teachers
receive one of the top two ratings and less than
1 percent are rated unsatisfactory.
Excellence goes unrecognized When all teachers are rated good or great, those who
are truly exceptional cannot be formally identified.
Fifty-nine percent of teachers and 63 percent of
administrators say their district is not doing enough
to identify, compensate, promote and retain the most
effective teachers.
Inadequate professional development The failure to assess variations in instructional
effectiveness also precludes districts from identifying
specific development needs in their teachers. In
fact, 73 percent of teachers surveyed said their most
recent evaluation did not identify any development
areas, and only 45 percent of teachers who did have
development areas identified said they received useful
support to improve.
No special attention to novices Inattention to teacher performance and development
begins from a teacher’s first days in the classroom.
Though it is widely recognized that teachers are
least effective in their beginning years, 66 percent
of novice teachers in districts with multiple ratings
received a rating greater than “satisfactory” on their
most recent performance evaluation. Low expectations
characterize the tenure process as well, with 41 percent
of administrators reporting that they have never “non-
renewed” a probationary teacher for performance
concerns in his or her final probationary year.
Poor performance goes unaddressed Despite uniformly positive evaluation ratings, teachers and
administrators both recognize ineffective teaching in their
schools. In fact, 81 percent of administrators and 57 percent
of teachers say there is a tenured teacher in their school
who is performing poorly, and 43 percent of teachers say
there is a tenured teacher who should be dismissed for poor
performance. Troublingly, the percentages are higher in
high-poverty schools. But district records confirm the
scarcity of formal dismissals; at least half of the districts
studied did not dismiss a single non-probationary teacher
for poor performance in the time period studied (ranging
from two to five years in each district).
Characteristics of the Widget Effect in Teacher EvaluationThe Widget Effect is characterized by institutional indifference to variations in teacher performance.
Teacher evaluation systems reflect and reinforce this indifference in several ways.
Flaws in Evaluation Practice and Implementation
The characteristics above are exacerbated and amplified by cursory evaluation practices and poor implementation.
Evaluations are short and infrequent (most are based on two or fewer classroom observations, each 60 minutes or less),
conducted by administrators without extensive training, and influenced by powerful cultural forces—in particular, an
expectation among teachers that they will be among the vast majority rated as top performers.
While it is impossible to know whether the system drives the culture or the culture the system, the result is clear—
evaluation systems fail to differentiate performance among teachers. As a result, teacher effectiveness is largely ignored.
Excellent teachers cannot be recognized or rewarded, chronically low-performing teachers languish, and the wide
majority of teachers performing at moderate levels do not get the differentiated support and development they need to
improve as professionals.
07E
XE
CU
TIV
E S
UM
MA
RY Reversing the Widget Effect
The Widget Effect is deeply ingrained in the fundamental systems and policies that govern
the teachers in our public schools. Better evaluation systems may offer a partial solution, but
they will not overcome a culture of indifference to classroom effectiveness. Reversing the
Widget Effect depends on better information about instructional quality that can be used to
inform other important decisions that dictate who teaches in our schools.
01 | Adopt a comprehensive performance evaluation system that fairly, accurately and credibly differentiates teachers based on their effectiveness in promoting student achievement. Teachers should be evaluated based on their ability to fulfill their core responsibility as professionals—delivering instruction that helps students learn and succeed. This demands clear performance standards, multiple rating options, regular monitoring of administrator judgments, and frequent feedback to teachers. Furthermore, it requires professional development that is tightly linked to performance standards and differentiated based on individual teacher needs. The core purpose of evaluation must be maximizing teacher growth and effectiveness, not just documenting poor performance as a prelude to dismissal.
02 | Train administrators and other evaluators in the teacher performance evaluation system and hold them accountable for using it effectively. The differentiation of teacher effectiveness should be a priority for school administrators and one for which they are held accountable. Administrators must receive rigorous training and ongoing support so that they can make fair and consistent assessments of performance against established standards and provide constructive feedback and differentiated support to teachers.
08E
XE
CU
TIV
E S
UM
MA
RY
03 | Integrate the performance evaluation system with critical human capital policies and functions such as teacher assignment, professional development, compensation, retention and dismissal. Even the best evaluation system will fail if the information it produces is of no consequence. An effective evaluation system must be fully integrated with other district systems and policies and a primary factor in decisions such as which teachers receive tenure, how teachers are assigned and retained, how teachers are compensated and advanced, what professional development teachers receive, and when and how teachers are dismissed. Only by attaching stakes to evaluation outcomes will teachers and administrators invest in the hard work of creating a truly rigorous and credible evaluation system.
04 | Adopt dismissal policies that provide lower-stakes options for ineffective teachers to exit the district and a system of due process that is fair but efficient. If the evaluation system is implemented effectively, unsatisfactory ratings will not be anomalous, surprising or without clear justification. Likewise, the identification of development areas and the provision of support will be continual. As in other professions, teachers who see significant, credible evidence of their own failure to meet standards are likely to exit voluntarily. Districts can facilitate this process by providing low-stakes options that enable teachers to leave their positions without being exiled. For teachers who must be officially dismissed, an expedited, one-day hearing should be sufficient for an arbitrator to determine if the evaluation and development process was followed and judgments made in good faith.
Our recommendations outline a comprehensive approach to improving teacher effectiveness and
maximizing student learning. If implemented thoroughly and faithfully, we believe they will enable districts
to understand and manage instructional quality with far greater sophistication. Improved evaluation will
not only benefit students by driving the systematic improvement and growth of their teachers, but teachers
themselves, by at last treating them as professionals, not parts.

09T
HE
PR
OB
LE
M THE PROBLEM: TEACHERS AS INTERCHANGEABLE PARTSTeaching is the essence of education, and there is almost universal agreement
among researchers that teachers have an outsized impact on student performance.
We know that improving teacher quality is one of the most powerful ways—if not
the most powerful way—to create better schools. In fact, a student assigned to a very
good teacher for a single school year may gain up to a full year’s worth of additional
academic growth compared to a student assigned to a very poor teacher. Having a series
of strong or weak teachers in consecutive years compounds the impact. Give high-need
students three highly effective teachers in a row and they may outperform students
taught by three ineffective teachers in a row by as much as 50 percentile points.3
The lesson from these decades of research is clear: teachers matter. Some teachers are
capable of generating exceptional learning growth in students; others are not, and a
small group actually hinders their students’ academic progress.
This simple premise—that teachers matter—has driven The New Teacher Project’s
prior research and continues to drive our work today. Our 2003 report, Missed Opportunities:
How We Keep High-Quality Teachers Out of Urban Classrooms, documented how vacancy
notification policies, rigid staffing rules and late budget timelines caused urban
districts to hire too late to capture the highest-quality teacher applicants. Our 2005
report, Unintended Consequences: The Case for Reforming the Staffing Rules in Urban Teachers
Union Contracts, illustrated how contractual staffing rules, built around the assumption
that any teacher could fill any vacancy, forced schools to hire teachers they did not
want and teachers to take positions for which they might not be a good fit.
Each of these reports in its own way documented a flawed assumption that
has pervaded American educational policy for decades—the assumption that
teachers are interchangeable parts. We have come to call this phenomenon the
Widget Effect. In the presence of the Widget Effect, school systems wrongly
conflate educational access with educational quality; the only teacher quality goal
that schools need to achieve is to fill all of their positions. It becomes a foregone
conclusion that, so long as there is an accredited teacher—any teacher—in front of
the classroom, students are being served adequately.
While the Widget Effect pervades many aspects of our education system, it is
in teacher evaluation that both its architecture and its consequences are most
immediately apparent. In this report, we examine the central role that the design
and implementation of teacher evaluation systems play in creating and reinforcing
the Widget Effect; how teacher and administrator beliefs about evaluation illustrate
the Widget Effect at work; and how the Widget Effect fuels a policy framework that
ignores both strong and weak teacher performance. In the absence of meaningful
performance information, teacher effectiveness is treated as a constant, not a variable,
and school districts must instead rely on other considerations—many of them
unrelated to student academic success—to make critical workforce decisions.
In the
presence of the
Widget Effect,
school systems
wrongly conflate
educational
access with
educational
quality.

10C
HA
RA
CT
ER
IST
ICS
CHARACTERISTICS: THE WIDGET EFFECT IN TEACHER EVALUATIONThe Widget Effect is rooted in the failure of teacher evaluation
systems to produce meaningful information about teacher
effectiveness. In theory, an evaluation system should identify
and measure individual teachers’ strengths and weaknesses
accurately and consistently, so that teachers get the feedback
they need to improve their practice and so that schools can
determine how best to allocate resources and provide support.
In practice, teacher evaluation systems devalue instructional
effectiveness by generating performance information that
reflects virtually no variation among teachers at all.
This fundamental failing has a deeply insidious effect on teachers
and schools by institutionalizing indifference when it comes to
performance. As a result, important variations between teachers
vanish. Excellence goes unrecognized, development is neglected
and poor performance goes unaddressed.
All Teachers Are Rated Good or GreatThe disconnect between teacher evaluation systems and
actual teacher performance is most strikingly illustrated by the
wide gap between student outcomes and teacher ratings in
many districts. Though thousands of teachers included in this
report teach in schools where high percentages of students
fail year after year to meet basic academic standards, less than
one percent of surveyed teachers received a negative rating on
their most recent evaluation.4
This is not to say that responsibility for a failing school rests
on the shoulders of teachers alone, or that none of these
teachers demonstrated truly high performance; however, there
can be no doubt that these ratings dramatically overstate the
number of exemplary teachers and understate the number
with moderate and severe performance concerns. These
data simultaneously obscure poor performance and overlook
excellence, as the value of superlative teacher ratings is
rendered meaningless by their overuse.
To a large degree, teacher evaluation systems codify this
whitewashing of performance differences, beginning with
the rating categories themselves. Five of the ten districts in
this study with available teacher evaluation rating data5 use
a binary rating system for assessing teacher performance;
“Poorly performing teachers are rated at the same level as the rest of us. This infuriates those of us who do a good job.”
–Akron Public Schools Teacher
11C
HA
RA
CT
ER
IST
ICS teachers are categorized as either “satisfactory” or
“unsatisfactory.”6 There are no shades of gray to describe
nuances in performance.
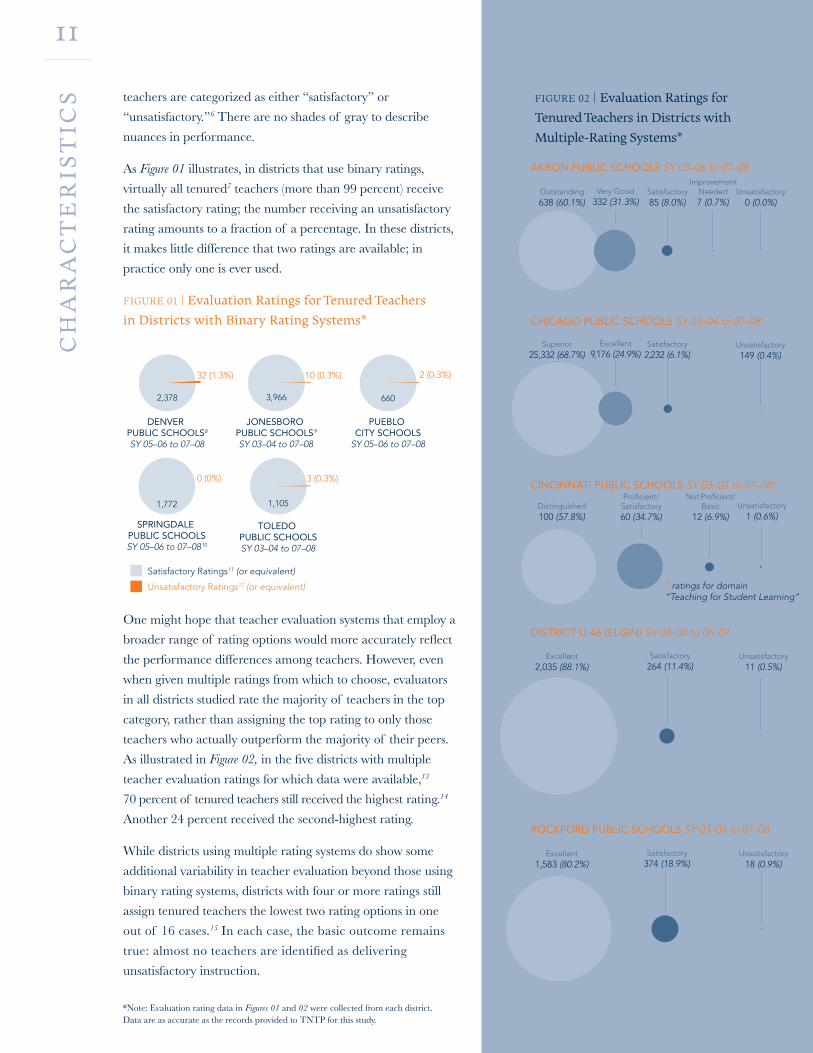
As Figure 01 illustrates, in districts that use binary ratings,
virtually all tenured7 teachers (more than 99 percent) receive
the satisfactory rating; the number receiving an unsatisfactory
rating amounts to a fraction of a percentage. In these districts,
it makes little difference that two ratings are available; in
practice only one is ever used.
FIGURE 01 | Evaluation Ratings for Tenured Teachers in Districts with Binary Rating Systems*
One might hope that teacher evaluation systems that employ a
broader range of rating options would more accurately reflect
the performance differences among teachers. However, even
when given multiple ratings from which to choose, evaluators
in all districts studied rate the majority of teachers in the top
category, rather than assigning the top rating to only those
teachers who actually outperform the majority of their peers.
As illustrated in Figure 02, in the five districts with multiple
teacher evaluation ratings for which data were available,13
70 percent of tenured teachers still received the highest rating.14
Another 24 percent received the second-highest rating.
While districts using multiple rating systems do show some
additional variability in teacher evaluation beyond those using
binary rating systems, districts with four or more ratings still
assign tenured teachers the lowest two rating options in one
out of 16 cases.15 In each case, the basic outcome remains
true: almost no teachers are identified as delivering
unsatisfactory instruction.
FIGURE 02 | Evaluation Ratings for Tenured Teachers in Districts with Multiple-Rating Systems*
AKRON PUBLIC SCHOOLS SY 05–06 to 07–08
CHICAGO PUBLIC SCHOOLS SY 03–04 to 07–08
CINCINNATI PUBLIC SCHOOLS SY 03–04 to 07–08*
DISTRICT U-46 (ELGIN) SY 03–04 to 06–07
ROCKFORD PUBLIC SCHOOLS SY 03–04 to 07–08
Outstanding638 (60.1%)
Very Good332 (31.3%)
Satisfactory85 (8.0%)
ImprovementNeeded7 (0.7%)
Superior25,332 (68.7%)
Excellent9,176 (24.9%)
Satisfactory2,232 (6.1%)
Unsatisfactory149 (0.4%)
Distinguished100 (57.8%)
Proficient/Satisfactory60 (34.7%)
Not Proficient/Basic
12 (6.9%)Unsatisfactory
1 (0.6%)
Excellent2,035 (88.1%)
Satisfactory264 (11.4%)
Unsatisfactory11 (0.5%)
Excellent1,583 (80.2%)
Satisfactory374 (18.9%)
Unsatisfactory18 (0.9%)
Unsatisfactory0 (0.0%)
* ratings for domain “Teaching for Student Learning”
Satisfactory Ratings11 (or equivalent)
Unsatisfactory Ratings12 (or equivalent)
32 (1.3%) 10 (0.3%) 2 (0.3%)
0 (0%) 3 (0.3%)
2,378 3,966 660
1,772 1,105
DENVER PUBLIC SCHOOLS8
SY 05–06 to 07–08
JONESBORO PUBLIC SCHOOLS9
SY 03–04 to 07–08
PUEBLO CITY SCHOOLS
SY 05–06 to 07–08
SPRINGDALE PUBLIC SCHOOLSSY 05–06 to 07–0810
TOLEDO PUBLIC SCHOOLSSY 03–04 to 07–08
*Note: Evaluation rating data in Figures 01 and 02 were collected from each district. Data are as accurate as the records provided to TNTP for this study.
12C
HA
RA
CT
ER
IST
ICS
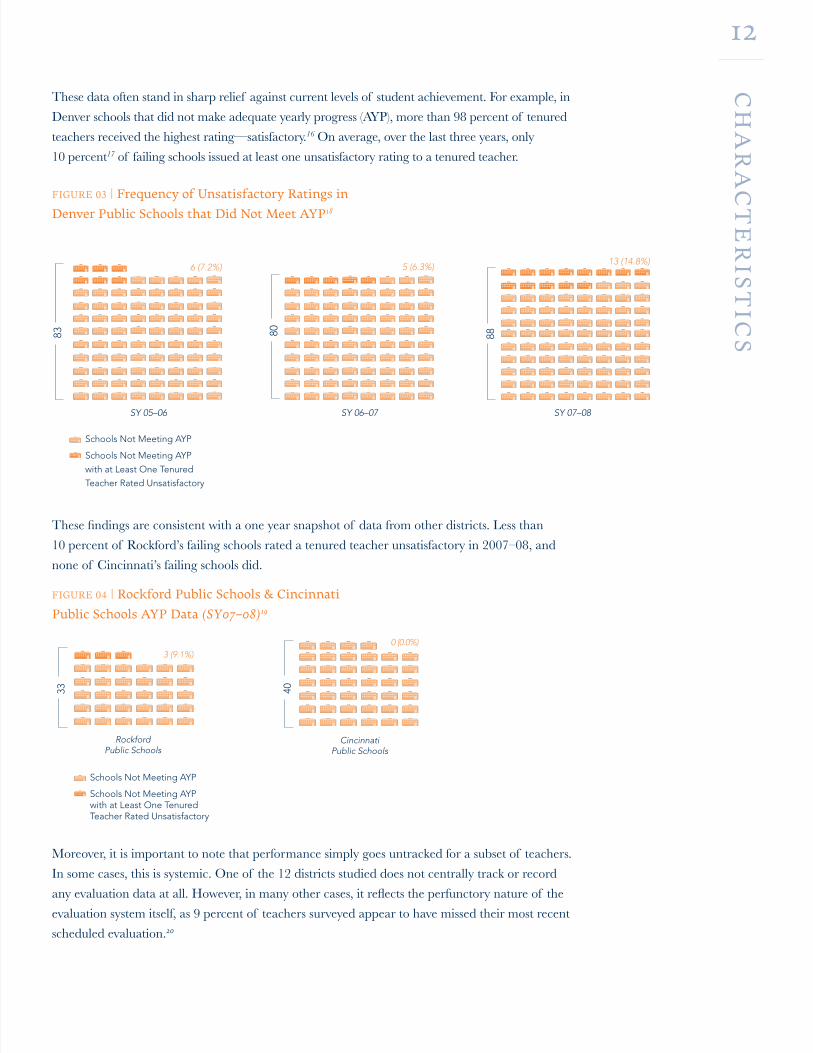
These data often stand in sharp relief against current levels of student achievement. For example, in
Denver schools that did not make adequate yearly progress (AYP), more than 98 percent of tenured
teachers received the highest rating—satisfactory.16 On average, over the last three years, only
10 percent17 of failing schools issued at least one unsatisfactory rating to a tenured teacher.
FIGURE 03 | Frequency of Unsatisfactory Ratings in Denver Public Schools that Did Not Meet AYP18
These findings are consistent with a one year snapshot of data from other districts. Less than
10 percent of Rockford’s failing schools rated a tenured teacher unsatisfactory in 2007–08, and
none of Cincinnati’s failing schools did.
FIGURE 04 | Rockford Public Schools & Cincinnati Public Schools AYP Data (SY07–08)19
Moreover, it is important to note that performance simply goes untracked for a subset of teachers.
In some cases, this is systemic. One of the 12 districts studied does not centrally track or record
any evaluation data at all. However, in many other cases, it reflects the perfunctory nature of the
evaluation system itself, as 9 percent of teachers surveyed appear to have missed their most recent
scheduled evaluation.20
SY 07–08SY 05–06 SY 06–07
Schools Not Meeting AYP
Schools Not Meeting AYP
with at Least One Tenured
Teacher Rated Unsatisfactory888083
13 (14.8%)5 (6.3%)6 (7.2%)
Schools Not Meeting AYP
Schools Not Meeting AYP with at Least One Tenured Teacher Rated Unsatisfactory
33 40
3 (9.1%)0 (0.0%)
RockfordPublic Schools
CincinnatiPublic Schools
13C
HA
RA
CT
ER
IST
ICS
In a world where all teachers are rated as good or great, the truly outstanding
teachers—those who are realizing life-changing academic success for their students—
cannot be formally identified. And if they are not formally identified, schools cannot
prioritize their retention or leverage them to develop and improve their colleagues.
In theory, districts should be able to identify their top performers by awarding them
the highest rating on the evaluation scale, but as previously illustrated, the highest
rating is awarded to many more teachers than can possibly fall into this category.
The dilution of the highest rating category is reflected in teacher and administrator
perceptions about how this category is defined. Nearly a quarter of administrators
(24 percent) and nearly a fifth of teachers (18 percent) equate their district’s highest
rating with a teacher who is merely effective or even somewhat effective, rather than
seeing that rating as reserved for those who are truly exceptional.21
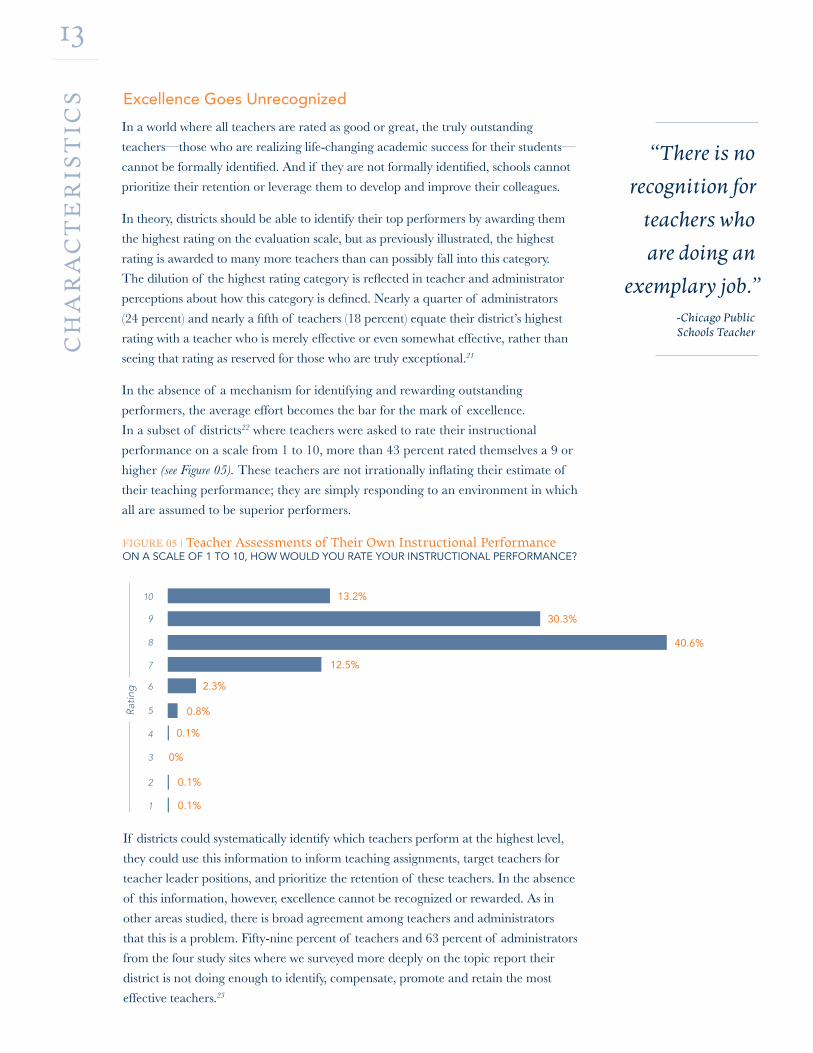
In the absence of a mechanism for identifying and rewarding outstanding
performers, the average effort becomes the bar for the mark of excellence.
In a subset of districts22 where teachers were asked to rate their instructional
performance on a scale from 1 to 10, more than 43 percent rated themselves a 9 or
higher (see Figure 05). These teachers are not irrationally inflating their estimate of
their teaching performance; they are simply responding to an environment in which
all are assumed to be superior performers.
Excellence Goes Unrecognized
FIGURE 05 | Teacher Assessments of Their Own Instructional PerformanceON A SCALE OF 1 TO 10, HOW WOULD YOU RATE YOUR INSTRUCTIONAL PERFORMANCE?
1
Rat
ing
0.1%
0.1%
0.1%
0.8%
2.3%
12.5%
40.6%
30.3%
13.2%
0%
2
3
4
5
6
7
8
9
10
If districts could systematically identify which teachers perform at the highest level,
they could use this information to inform teaching assignments, target teachers for
teacher leader positions, and prioritize the retention of these teachers. In the absence
of this information, however, excellence cannot be recognized or rewarded. As in
other areas studied, there is broad agreement among teachers and administrators
that this is a problem. Fifty-nine percent of teachers and 63 percent of administrators
from the four study sites where we surveyed more deeply on the topic report their
district is not doing enough to identify, compensate, promote and retain the most
effective teachers.23
“There is no
recognition for
teachers who
are doing an
exemplary job.” -Chicago Public Schools Teacher
14C
HA
RA
CT
ER
IST
ICS
The damage of ignoring differences in teacher effectiveness
is not isolated to the limited recognition of excellence;
an equally troubling consequence is that teachers rarely
receive meaningful feedback on their performance through
the formal evaluation system. In the 12 districts studied,
development areas were identified for only 26 percent of
teachers during their most recent evaluations.24
In other words, nearly 3 of 4 teachers went through the
evaluation process but received no specific feedback about
how to improve their practice. This is true even for novice
teachers who are most in need of actionable feedback
as they learn their craft—only 43 percent of teachers
in their first four years had any development areas
identified. It is inconceivable that 74 percent of teachers,
and 57 percent of teachers in their first four years, do not
require improvement in any area of performance.
Some may argue that administrators prefer to give
teachers critical feedback outside the formal evaluation
process. However, 47 percent25 of teachers report not
having participated in a single informal conversation with
their administrator over the last year about improving
aspects of their instructional performance. In addition,
of the relatively small group of teachers who had a
performance area identified as in need of improvement
or unsatisfactory, 62 percent said they were not aware of
performance concerns before their evaluation.26
This suggests that many administrators do not
regularly or proactively offer feedback on instructional
performance outside of the formal evaluation process.
While districts often fail to identify areas where teachers
are in need of improvement, they also fail to provide
targeted support to the subset of teachers who have had
development areas identified. Less than half (45 percent27)
of teachers across all districts who had development
areas identified on their most recent evaluations said they
received useful support to improve those areas.
Constructive feedback that specifies areas for
development is a critical facet of any performance
evaluation, even for strong performers. In theory, even
if virtually all teachers are rated as good or great, their
evaluations could provide them with valuable feedback
they could use to improve their instructional practice.
However, that theoretical potential currently goes
unrealized and teachers are too often denied both the
knowledge and the opportunity to improve.
As a result, it is not surprising that so many teachers
believe that the current evaluation system, and the
absence of meaningful feedback it produces, does them
a disservice. Only 42 percent of teachers agree that
evaluation allows accurate assessment of performance
and only 43 percent of teachers agree that evaluation
helps teachers improve.28
Development Is Limited
“The evaluation process should have teacher development as the primary goal, not just assigning a number on a rubric. As it is set up now, there is no immediate feedback to the teacher in any constructive format. Scores are based on rigid, often meaningless recitations. It is the epitome of poor teaching methods to give a score without discussion.”
–Cincinnati Public Schools Teacher
15C
HA
RA
CT
ER
IST
ICS Novice Teachers Receive
No Special Attention or Scrutiny29
One could argue teacher ratings are so high and development
is so limited because probationary teachers undergo a rigorous
screening process through which weak performers are
weeded out. According to this line of argument, all the poorly
performing teachers were effectively ushered out while they
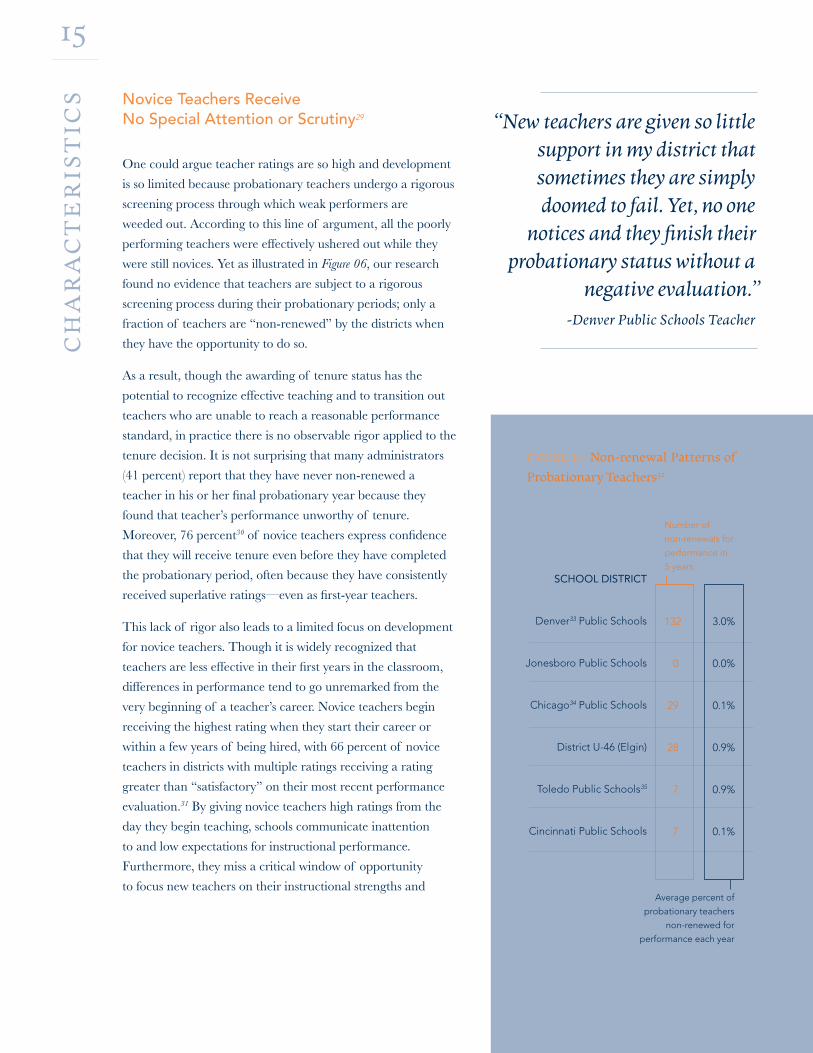
were still novices. Yet as illustrated in Figure 06, our research
found no evidence that teachers are subject to a rigorous
screening process during their probationary periods; only a
fraction of teachers are “non-renewed” by the districts when
they have the opportunity to do so.
As a result, though the awarding of tenure status has the
potential to recognize effective teaching and to transition out
teachers who are unable to reach a reasonable performance
standard, in practice there is no observable rigor applied to the
tenure decision. It is not surprising that many administrators
(41 percent) report that they have never non-renewed a
teacher in his or her final probationary year because they
found that teacher’s performance unworthy of tenure.
Moreover, 76 percent30 of novice teachers express confidence
that they will receive tenure even before they have completed
the probationary period, often because they have consistently
received superlative ratings—even as first-year teachers.
This lack of rigor also leads to a limited focus on development
for novice teachers. Though it is widely recognized that
teachers are less effective in their first years in the classroom,
differences in performance tend to go unremarked from the
very beginning of a teacher’s career. Novice teachers begin
receiving the highest rating when they start their career or
within a few years of being hired, with 66 percent of novice
teachers in districts with multiple ratings receiving a rating
greater than “satisfactory” on their most recent performance
evaluation.31 By giving novice teachers high ratings from the
day they begin teaching, schools communicate inattention
to and low expectations for instructional performance.
Furthermore, they miss a critical window of opportunity
to focus new teachers on their instructional strengths and
FIGURE 06 | Non-renewal Patterns of Probationary Teachers32
“New teachers are given so little support in my district that sometimes they are simply doomed to fail. Yet, no one
notices and they finish their probationary status without a
negative evaluation.” -Denver Public Schools Teacher
132 3.0%
0 0.0%
29 0.1%
28 0.9%
7 0.9%
7 0.1%
Number of
non-renewals for
performance in
5 years
Average percent of
probationary teachers
non-renewed for
performance each year
SCHOOL DISTRICT
Denver33 Public Schools
Jonesboro Public Schools
Chicago34 Public Schools
District U-46 (Elgin)
Toledo Public Schools35
Cincinnati Public Schools
16C
HA
RA
CT
ER
IST
ICS
weaknesses during a formative point in their careers. Instead
of getting meaningful feedback about what they are doing
right and wrong in their instructional practice, new teachers
mostly get the message that their actual performance has little
bearing on how they are rated.
Poor Performance Goes Unaddressed
It goes without saying that teacher dismissal has become a
polarizing issue in the education community; however, we
found that teachers and administrators broadly agree about
the existence and scope of the problem and about what steps
need to be taken to address poor performance in schools.
In fact, an overwhelming majority of both teachers
(68 percent) and administrators (91 percent) agree or
strongly agree that dismissing poor performers is important
to maintaining high-quality instructional teams. This may
seem self-evident, but it suggests a consensus that teacher
performance management should entail accountability, not
just development.
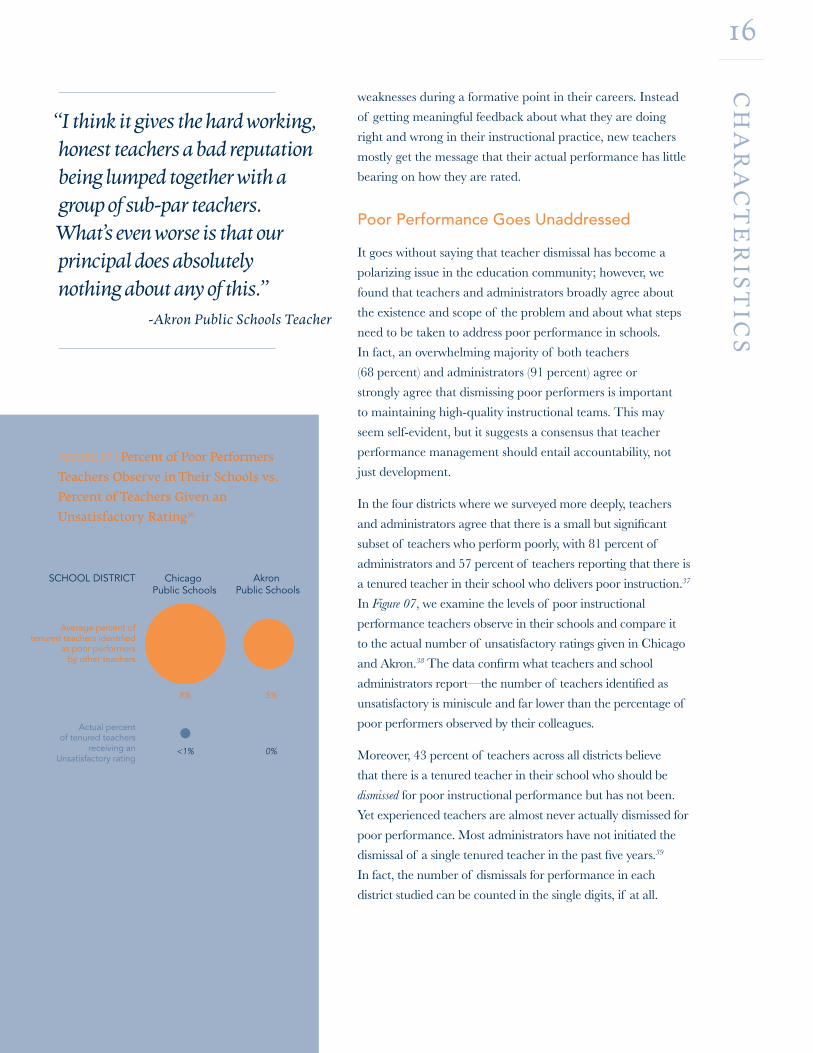
In the four districts where we surveyed more deeply, teachers
and administrators agree that there is a small but significant
subset of teachers who perform poorly, with 81 percent of
administrators and 57 percent of teachers reporting that there is
a tenured teacher in their school who delivers poor instruction.37
In Figure 07, we examine the levels of poor instructional
performance teachers observe in their schools and compare it
to the actual number of unsatisfactory ratings given in Chicago
and Akron.38 The data confirm what teachers and school
administrators report—the number of teachers identified as
unsatisfactory is miniscule and far lower than the percentage of
poor performers observed by their colleagues.
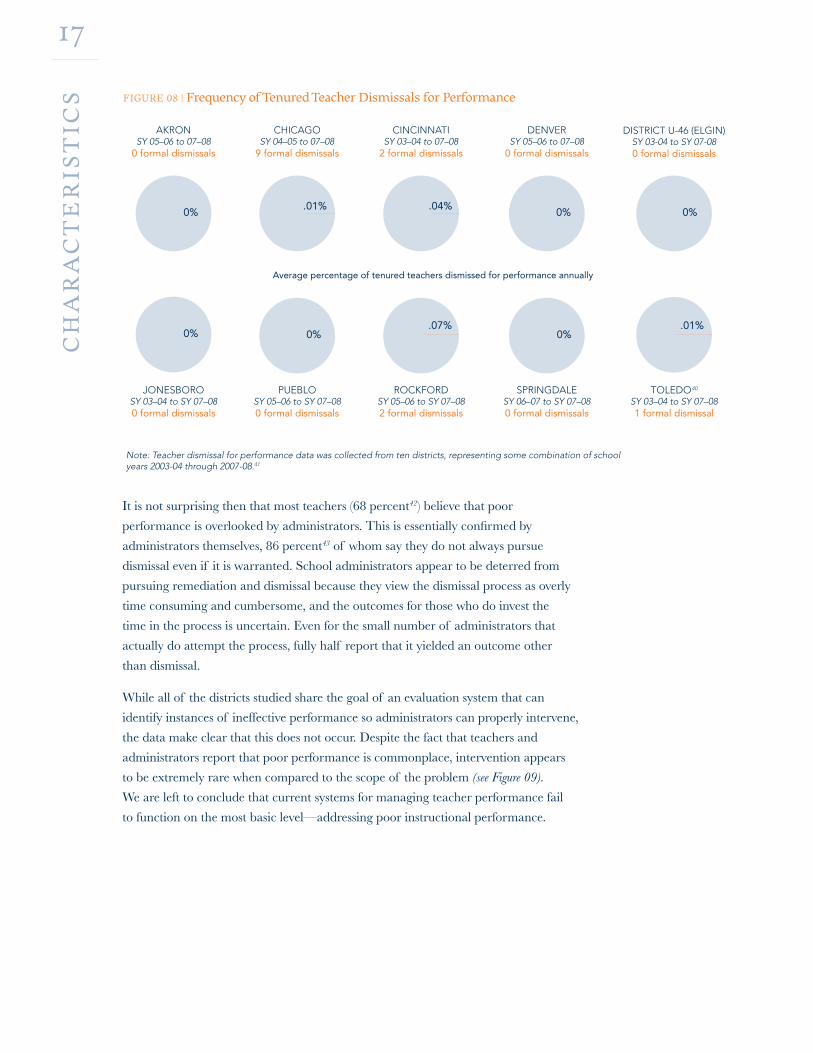
Moreover, 43 percent of teachers across all districts believe
that there is a tenured teacher in their school who should be
dismissed for poor instructional performance but has not been.
Yet experienced teachers are almost never actually dismissed for
poor performance. Most administrators have not initiated the
dismissal of a single tenured teacher in the past five years.39
In fact, the number of dismissals for performance in each
district studied can be counted in the single digits, if at all.
FIGURE 07 | Percent of Poor Performers Teachers Observe in Their Schools vs. Percent of Teachers Given an Unsatisfactory Rating36
“I think it gives the hard working, honest teachers a bad reputation being lumped together with a group of sub-par teachers. What’s even worse is that our principal does absolutely nothing about any of this.”
-Akron Public Schools Teacher
Akron Public Schools
SCHOOL DISTRICT Chicago Public Schools
Average percent oftenured teachers identified
as poor performersby other teachers
Actual percentof tenured teachers
receiving anUnsatisfactory rating
5%
0%
8%
<1%
17C
HA
RA
CT
ER
IST
ICS
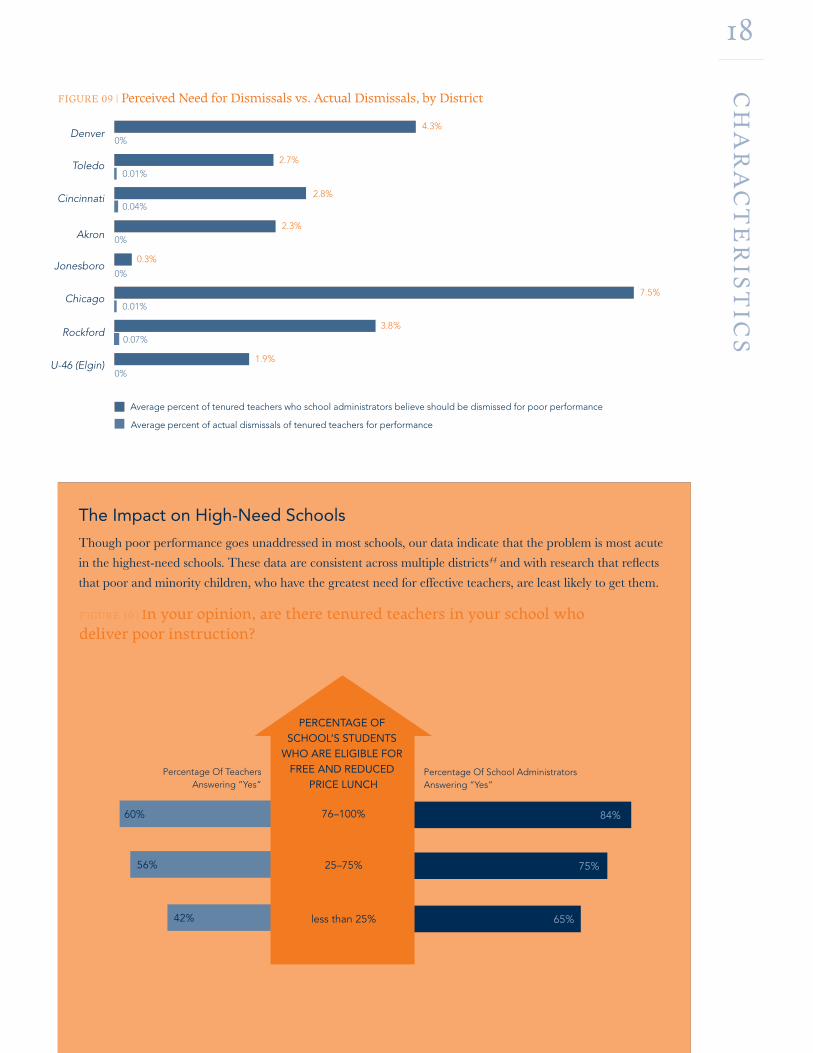
It is not surprising then that most teachers (68 percent42) believe that poor
performance is overlooked by administrators. This is essentially confirmed by
administrators themselves, 86 percent43 of whom say they do not always pursue
dismissal even if it is warranted. School administrators appear to be deterred from
pursuing remediation and dismissal because they view the dismissal process as overly
time consuming and cumbersome, and the outcomes for those who do invest the
time in the process is uncertain. Even for the small number of administrators that
actually do attempt the process, fully half report that it yielded an outcome other
than dismissal.
While all of the districts studied share the goal of an evaluation system that can
identify instances of ineffective performance so administrators can properly intervene,
the data make clear that this does not occur. Despite the fact that teachers and
administrators report that poor performance is commonplace, intervention appears
to be extremely rare when compared to the scope of the problem (see Figure 09).
We are left to conclude that current systems for managing teacher performance fail
to function on the most basic level—addressing poor instructional performance.
AKRONSY 05–06 to 07–08
0 formal dismissals
CHICAGOSY 04–05 to 07–08
9 formal dismissals
CINCINNATISY 03–04 to 07–08
2 formal dismissals
DENVERSY 05–06 to 07–08
0 formal dismissals
0%
0%
0% 0%
.01%
.04%.01%
0%
Average percentage of tenured teachers dismissed for performance annually
Note: Teacher dismissal for performance data was collected from ten districts, representing some combination of school years 2003-04 through 2007-08.41
DISTRICT U-46 (ELGIN)SY 03-04 to SY 07-080 formal dismissals
JONESBORO SY 03–04 to SY 07–080 formal dismissals
PUEBLO SY 05–06 to SY 07–080 formal dismissals
0%
SPRINGDALE SY 06–07 to SY 07–080 formal dismissals
ROCKFORD SY 05–06 to SY 07–082 formal dismissals
TOLEDO40
SY 03–04 to SY 07–081 formal dismissal
.07%
FIGURE 08 | Frequency of Tenured Teacher Dismissals for Performance
18C
HA
RA
CT
ER
IST
ICS
1 2 3 4 5 6 7% of Teachers
Denver
Toledo
Cincinnati
Akron
Jonesboro
Chicago
Rockford
U-46 (Elgin)
Cincinnati
Jonesboro
Rockford
Average percent of tenured teachers who school administrators believe should be dismissed for poor performance
Average percent of actual dismissals of tenured teachers for performance
4.3%
0%
0.04%
0.01%
0.01%
0%
0%
0.07%
0%
2.7%
2.8%
2.3%
0.3%
7.5%
3.8%
1.9%
FIGURE 09 | Perceived Need for Dismissals vs. Actual Dismissals, by District
FIGURE 10 | In your opinion, are there tenured teachers in your school who deliver poor instruction?
The Impact on High-Need Schools
Though poor performance goes unaddressed in most schools, our data indicate that the problem is most acute
in the highest-need schools. These data are consistent across multiple districts44 and with research that reflects
that poor and minority children, who have the greatest need for effective teachers, are least likely to get them.
84%
75%
65%
60%
56%
42%
PERCENTAGE OF SCHOOL’S STUDENTS
WHO ARE ELIGIBLE FOR FREE AND REDUCED
PRICE LUNCH
76–100%
25–75%
less than 25%
Percentage Of School Administrators Answering “Yes”
Percentage Of Teachers Answering “Yes”

19F
LA
WS FLAWS IN
EVALUATION PRACTICE AND IMPLEMENTATIONWhile most teacher evaluation systems espouse grand
intentions for teacher development, assessment and
improvement, the data above show that all too often the
outcome fails to equal the intent. Instead, the process becomes
devalued. Evaluations are perfunctory, school districts do
not invest in administrator capacity to provide meaningful
feedback, and teachers come to expect that they will receive
only positive feedback.
Teacher Evaluations Are Perfunctory
The current evaluation process reflects and codifies the
assumption underlying the Widget Effect —that all teachers are
essentially interchangeable. Operating under a belief system
that one teacher is as good as any other, schools invest very
little time or effort in evaluating teachers. Instead, they apply
a perfunctory process, at best designed to capture a snapshot
of a teacher’s instructional performance at a moment in time.
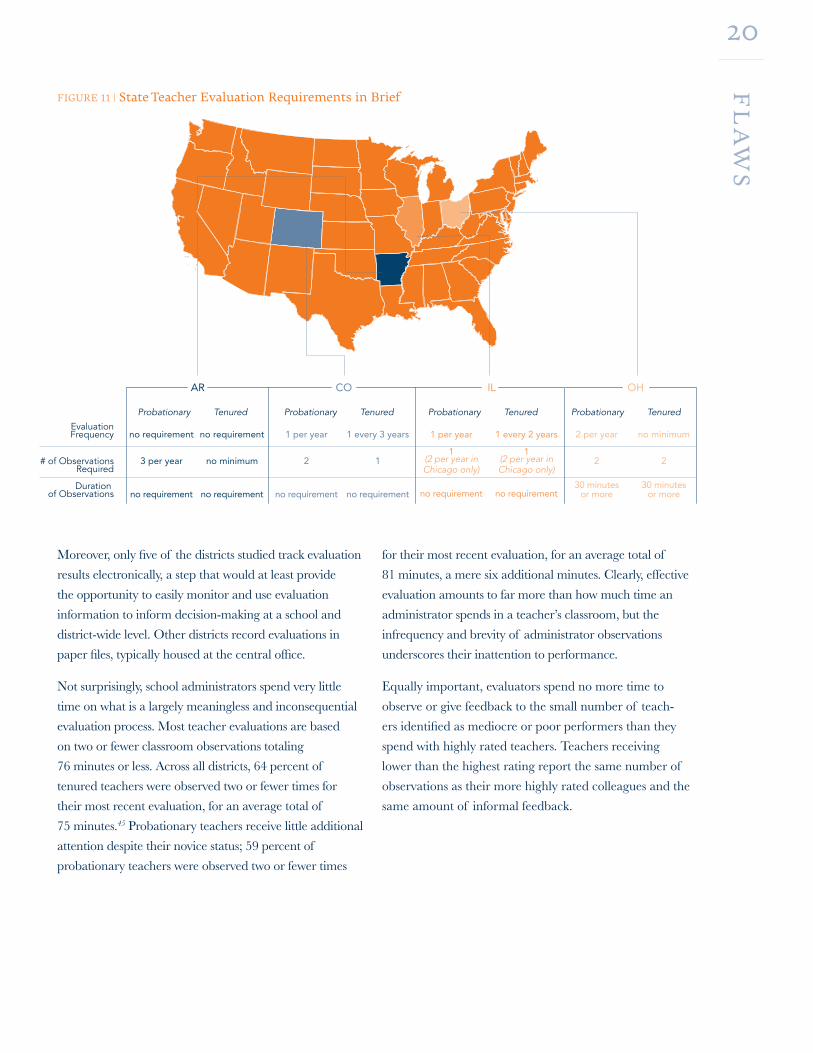
Across the four states studied, all probationary teachers must
be evaluated annually; however, tenured teachers may not be
required to be evaluated at all, or only once every few years.
“It’s the easiest thing for administrators to do. It’s the path of least resistance. They don’t have time or often, even the authority, to coach or correct ineffective teachers. The good teachers remain unrewarded for doing fantastic jobs, while bad teachers get to coast along.”
–Little Rock Public Schools Teacher
20F
LA
WS
Moreover, only five of the districts studied track evaluation
results electronically, a step that would at least provide
the opportunity to easily monitor and use evaluation
information to inform decision-making at a school and
district-wide level. Other districts record evaluations in
paper files, typically housed at the central office.
Not surprisingly, school administrators spend very little
time on what is a largely meaningless and inconsequential
evaluation process. Most teacher evaluations are based
on two or fewer classroom observations totaling
76 minutes or less. Across all districts, 64 percent of
tenured teachers were observed two or fewer times for
their most recent evaluation, for an average total of
75 minutes.45 Probationary teachers receive little additional
attention despite their novice status; 59 percent of
probationary teachers were observed two or fewer times
for their most recent evaluation, for an average total of
81 minutes, a mere six additional minutes. Clearly, effective
evaluation amounts to far more than how much time an
administrator spends in a teacher’s classroom, but the
infrequency and brevity of administrator observations
underscores their inattention to performance.
Equally important, evaluators spend no more time to
observe or give feedback to the small number of teach-
ers identified as mediocre or poor performers than they
spend with highly rated teachers. Teachers receiving
lower than the highest rating report the same number of
observations as their more highly rated colleagues and the
same amount of informal feedback.
EvaluationFrequency
# of Observations Required
Duration of Observations
CO ILAR OH
Probationary Tenured Probationary Tenured Probationary Tenured Probationary Tenured
1 per year
2
no requirement
1 every 3 years
1
no requirement
1 per year
1(2 per year inChicago only)
no requirement
1 every 2 years
1(2 per year inChicago only)
no requirement
no requirement
3 per year
no requirement
no requirement
no minimum
no requirement
2 per year
2
30 minutesor more
no minimum
2
30 minutesor more
FIGURE 11 | State Teacher Evaluation Requirements in Brief
21F
LA
WS
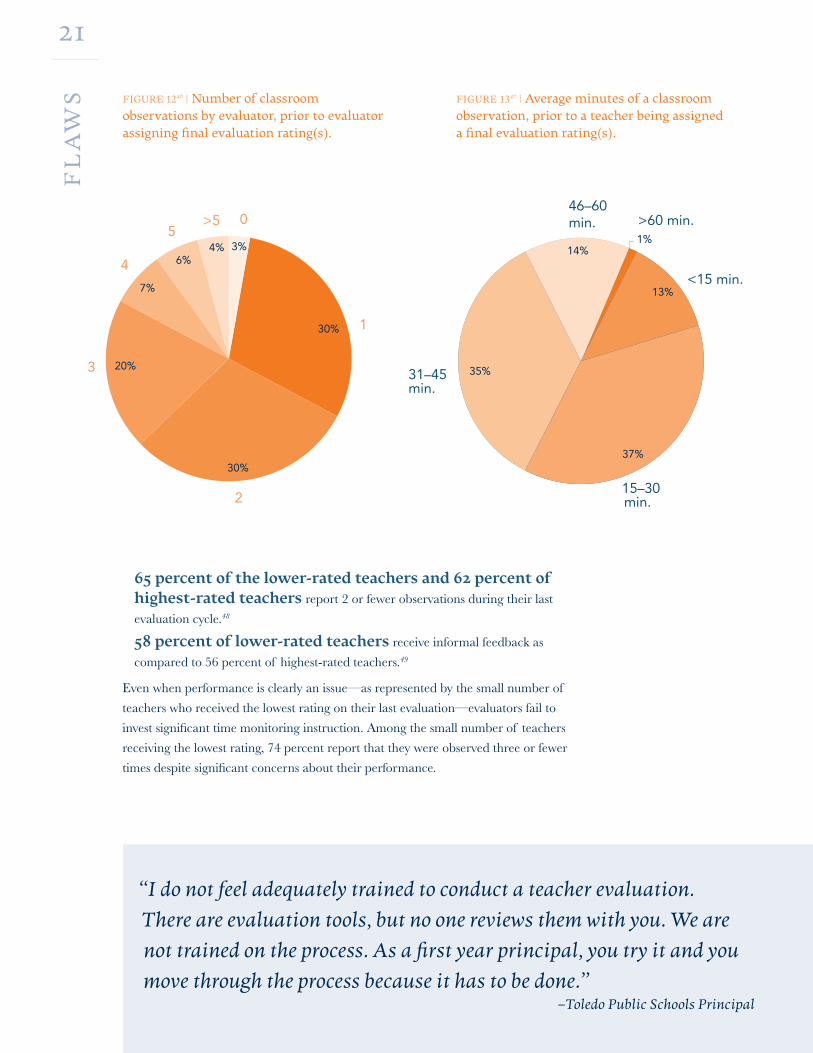
65 percent of the lower-rated teachers and 62 percent of highest-rated teachers report 2 or fewer observations during their last
evaluation cycle.48
58 percent of lower-rated teachers receive informal feedback as
compared to 56 percent of highest-rated teachers.49
Even when performance is clearly an issue—as represented by the small number of
teachers who received the lowest rating on their last evaluation—evaluators fail to
invest significant time monitoring instruction. Among the small number of teachers
receiving the lowest rating, 74 percent report that they were observed three or fewer
times despite significant concerns about their performance.
3%
0
1
<15 min.
15–30min.
31–45min.
46–60min. >60 min.
2
3
4
5>5
30%
30%
20%
7%
6%4%
13%
37%
35%
14%1%
3%
0
1
<15 min.
15–30min.
31–45min.
46–60min. >60 min.
2
3
4
5>5
30%
30%
20%
7%
6%4%
13%
37%
35%
14%1%
FIGURE 1246 | Number of classroom observations by evaluator, prior to evaluator assigning final evaluation rating(s).
FIGURE 1347 | Average minutes of a classroom observation, prior to a teacher being assigned a final evaluation rating(s).
“I do not feel adequately trained to conduct a teacher evaluation. There are evaluation tools, but no one reviews them with you. We are not trained on the process. As a first year principal, you try it and you move through the process because it has to be done.”
–Toledo Public Schools Principal
22F
LA
WS
School Administrators Receive Limited Training
Given the low priority assigned to teacher evaluation, it
comes as no surprise that school districts invest minimally
in evaluation training for school administrators. In many
districts, evaluation training is a one-time endeavor
provided either when an administrator is new in his or her
position or when the district implements a revised teacher
evaluation system. Consequently, school administrators are
ill-equipped to evaluate teachers effectively.
Background conversations conducted with district
staff suggest that, in many of our study sites, school
administrators receive varying levels of training on how
to conduct an effective teacher evaluation. For example,
in the Cincinnati Public Schools, evaluation training can
be provided upon request. In Chicago Public Schools
and District U-46 (Elgin), training may occur once a year
for a limited number of principals, but not all. In other
districts, including El Dorado Public Schools and Akron
Public Schools, it simply does not occur.
As a result, across all study sites, 51 percent of school
administrators describe their level of training in how
to conduct an effective evaluation as “very extensive”
or “extensive”50 and school administrators with more
evaluation training are more likely to report that they
enforce a high standard for instructional performance.
Yet, it is important to note that extensive training alone
did not produce a significant change in evaluation
outcomes. School administrators with more extensive
training report increased percentages of teachers enrolled
in remediation or dismissed for delivering poor instruction
than school administrators with less training. Yet even
among those who report “very extensive” training, only
36 percent have recommended dismissal of a tenured
teacher for poor instruction in the last five years.
Teacher Expectations Are Skewed
It is tempting to believe that simply requiring more
frequent and thorough evaluations would result in
more rigorous and accurate assessments of teacher
performance and increase teachers’ confidence in and
esteem for the evaluation process. However, we believe
these reforms, while necessary, would be insufficient
because the minimal nature of the process speaks to a far
deeper problem in the culture of schools: the assumption
that not only are all teachers the same, but that they are
all performing at a high level.
Our research reflects that there is a strong and logical
expectation among teachers that they will receive
outstanding performance ratings. While the vast
majority of teachers receive the highest rating, those
teachers who do not receive it tend to believe that the
higher rating was warranted.
In the six districts with multiple-rating scales for which
survey data were available,51 49 percent of probationary
teachers and 77 percent of tenured teachers indicated that
they believe they should have received the highest rating
on their most recent evaluation. In the four districts with
binary rating scales for which survey data were available,52
99 percent of probationary and 100 percent of tenured
teachers think they should have received the highest rating
(Satisfactory) on their most recent evaluation.
Even teachers who are just beginning their careers believe
they deserve the highest performance ratings and are
dissatisfied if they are rated good, not great. This inflated
sense of performance is evident in the self-assessment ratings
of novice teachers. In a subset of districts53 where teachers
were asked to assess their own instructional performance on
a scale of 1 to 10, 69 percent of novice teachers rated their
instructional performance an 8 or higher.
“Many teachers are accustomed to receiving a ‘superior’ rating and simply do not accept anything lower. It also seems to be an easier way out for the administrators, rather than have a confrontation with the teacher.”
–Chicago Public Schools Teacher
23F
LA
WS
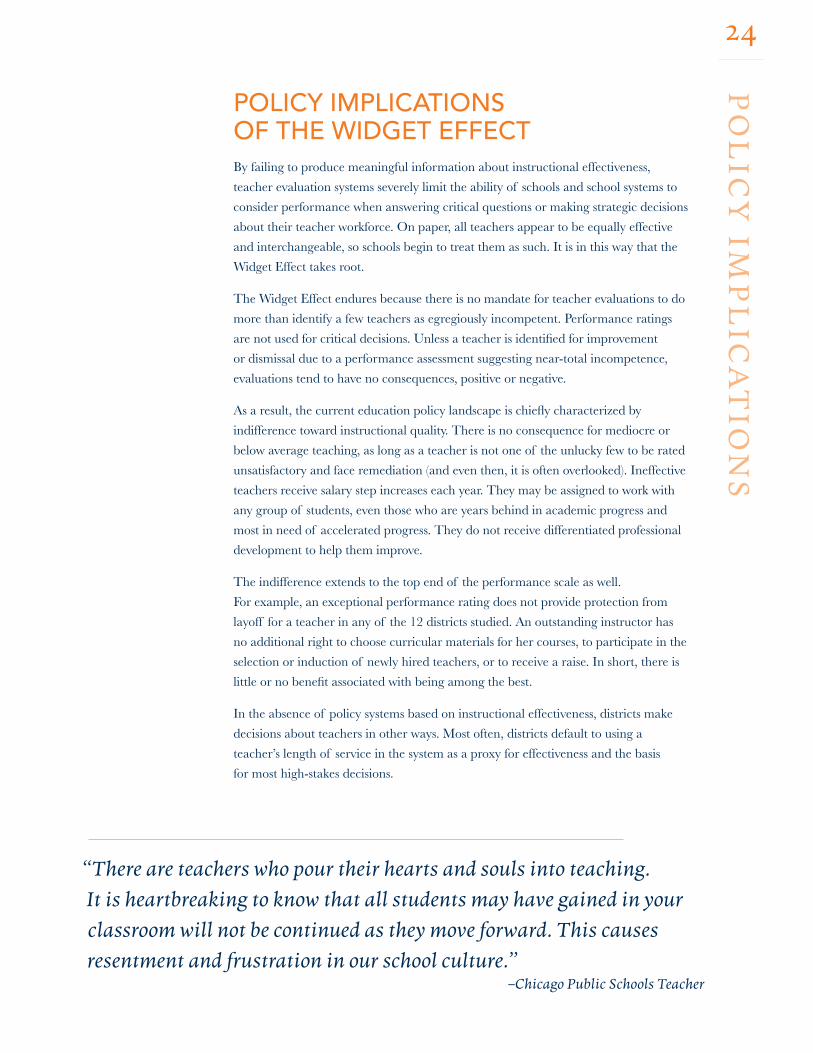
In a system where negative or even less than perfect
performance ratings are given only rarely, teachers
naturally develop an expectation that they will be among
the large majority considered top performers. In this
context, teachers perceive low or negative ratings not in
terms of what they communicate about performance but
as a personally-directed insult or attack. The response
is understandable in the context of the current system,
where so few teachers get critical feedback of any kind.
When their evaluation does include criticism, they feel as
though they have been singled out while other examples
of poor performance go unaddressed.
This creates a culture in which teachers are strongly
resistant to receiving an evaluation rating that suggests
their practice needs improvement. Schools then find
themselves in a vicious cycle; administrators generally
do not accurately evaluate poor performance, leading
to an expectation of high performance ratings, which,
in turn, cause administrators to face stiff cultural
resistance when they do issue even marginally negative
evaluations. The result is a dysfunctional school
community in which performance problems cannot be
openly identified or addressed.
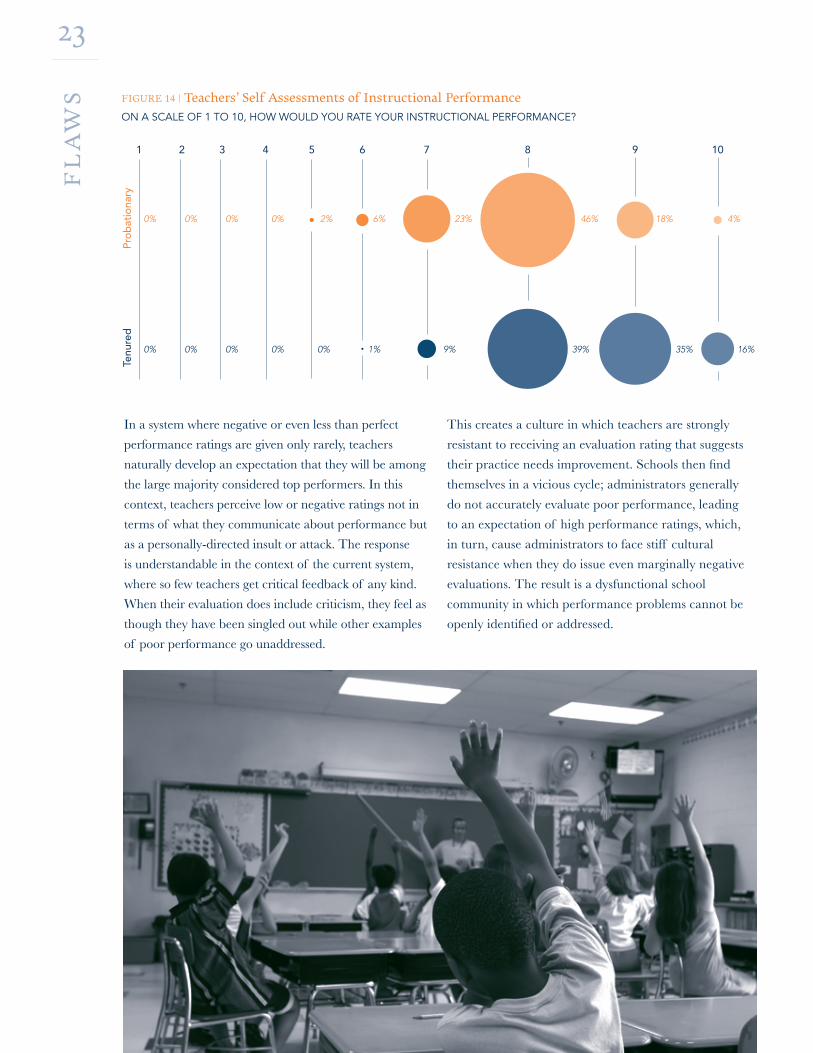
1 2 3 4 5 6 7 8 9 10
0% 0% 0% 0% 2% 6% 23% 46% 18% 4%
0% 0% 0% 0% 0% 1% 9% 39% 35% 16%
Pro
bat
iona
ryTe
nure
d
FIGURE 14 | Teachers’ Self Assessments of Instructional PerformanceON A SCALE OF 1 TO 10, HOW WOULD YOU RATE YOUR INSTRUCTIONAL PERFORMANCE?
24P
OL
ICY
IMP
LIC
AT
ION
SPOLICY IMPLICATIONS OF THE WIDGET EFFECTBy failing to produce meaningful information about instructional effectiveness,
teacher evaluation systems severely limit the ability of schools and school systems to
consider performance when answering critical questions or making strategic decisions
about their teacher workforce. On paper, all teachers appear to be equally effective
and interchangeable, so schools begin to treat them as such. It is in this way that the
Widget Effect takes root.
The Widget Effect endures because there is no mandate for teacher evaluations to do
more than identify a few teachers as egregiously incompetent. Performance ratings
are not used for critical decisions. Unless a teacher is identified for improvement
or dismissal due to a performance assessment suggesting near-total incompetence,
evaluations tend to have no consequences, positive or negative.
As a result, the current education policy landscape is chiefly characterized by
indifference toward instructional quality. There is no consequence for mediocre or
below average teaching, as long as a teacher is not one of the unlucky few to be rated
unsatisfactory and face remediation (and even then, it is often overlooked). Ineffective
teachers receive salary step increases each year. They may be assigned to work with
any group of students, even those who are years behind in academic progress and
most in need of accelerated progress. They do not receive differentiated professional
development to help them improve.
The indifference extends to the top end of the performance scale as well.
For example, an exceptional performance rating does not provide protection from
layoff for a teacher in any of the 12 districts studied. An outstanding instructor has
no additional right to choose curricular materials for her courses, to participate in the
selection or induction of newly hired teachers, or to receive a raise. In short, there is
little or no benefit associated with being among the best.
In the absence of policy systems based on instructional effectiveness, districts make
decisions about teachers in other ways. Most often, districts default to using a
teacher’s length of service in the system as a proxy for effectiveness and the basis
for most high-stakes decisions.
“There are teachers who pour their hearts and souls into teaching. It is heartbreaking to know that all students may have gained in your classroom will not be continued as they move forward. This causes resentment and frustration in our school culture.”
–Chicago Public Schools Teacher
25P
OL
ICY
IM
PL
ICA
TIO
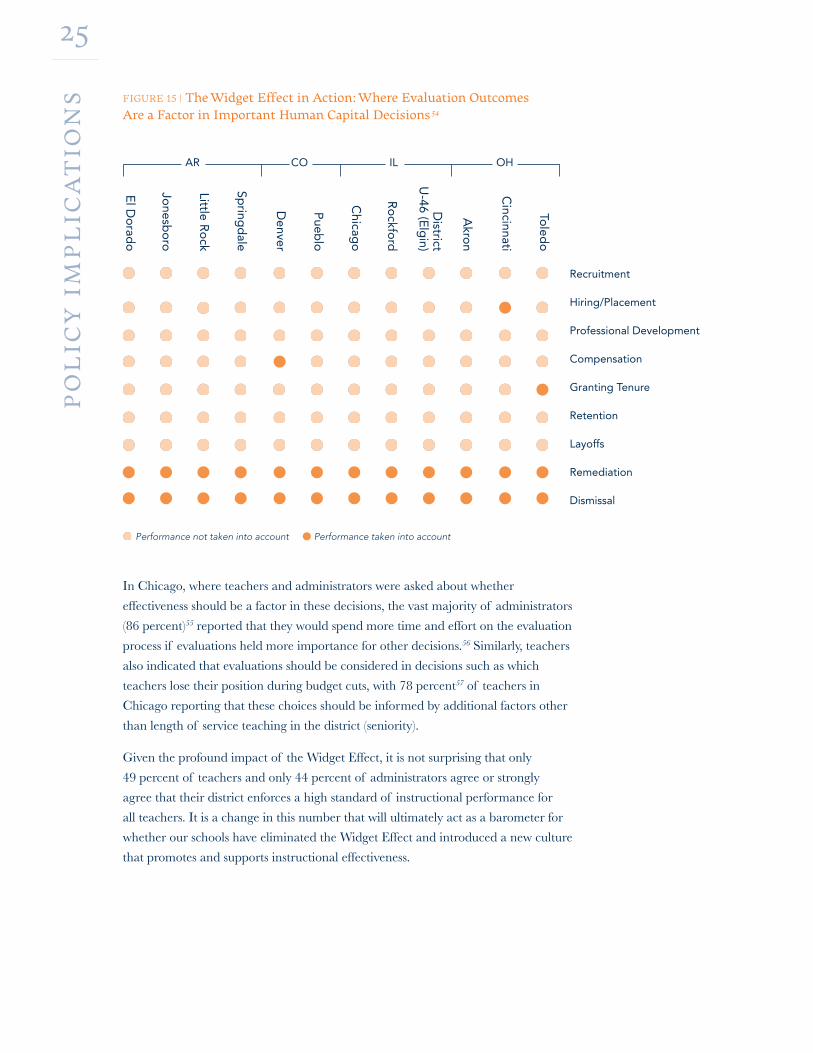
NS FIGURE 15 | The Widget Effect in Action: Where Evaluation Outcomes
Are a Factor in Important Human Capital Decisions 54
In Chicago, where teachers and administrators were asked about whether
effectiveness should be a factor in these decisions, the vast majority of administrators
(86 percent)55 reported that they would spend more time and effort on the evaluation
process if evaluations held more importance for other decisions.56 Similarly, teachers
also indicated that evaluations should be considered in decisions such as which
teachers lose their position during budget cuts, with 78 percent57 of teachers in
Chicago reporting that these choices should be informed by additional factors other
than length of service teaching in the district (seniority).
Given the profound impact of the Widget Effect, it is not surprising that only
49 percent of teachers and only 44 percent of administrators agree or strongly
agree that their district enforces a high standard of instructional performance for
all teachers. It is a change in this number that will ultimately act as a barometer for
whether our schools have eliminated the Widget Effect and introduced a new culture
that promotes and supports instructional effectiveness.
Toled
o
Cincinnati
Akro
n
District
U-46 (E
lgin)
Ro
ckford
Chicag
o
Pueb
lo
Denver
Spring
dale
Little Ro
ck
Jonesb
oro
El D
orad
o
Recruitment
Hiring/Placement
Professional Development
Compensation
Granting Tenure
Retention
Layoffs
Remediation
Dismissal
AR CO IL OH
Performance not taken into account Performance taken into account

26R
EC
OM
ME
ND
AT
ION
S
RECOMMENDATIONS: REVERSING THE WIDGET EFFECTThe Widget Effect is deeply ingrained in the fundamental systems and policies that determine the
quality and effectiveness of the teachers in our public schools. While high-functioning evaluation
systems alone may be an insufficient antidote, it is clear that reversing the Widget Effect depends
on the ability of such systems to produce accurate and credible information on instructional
performance that can be connected to other high-stakes decisions.
Overcoming the Widget Effect will require the commitment and investment of all stakeholders in
public education today. Taken together, the recommendations below represent a comprehensive
approach to improving instructional effectiveness and maximizing student learning. We believe
they will enable our nation’s schools to recognize, reward and retain their most effective teachers;
to provide useful and differentiated support and development to teachers who have not yet
achieved their potential; and to ensure that those who do not improve despite receiving support
are not permitted to remain in the classroom.
“We’re…making an unprecedented commitment to
ensure that anyone entrusted with educating our
children is doing the job as well as it can be done…
[T]hat commitment means…treating teachers like
the professionals they are while also holding them
more accountable. New teachers will be mentored by
experienced ones. Good teachers will be rewarded with
more money for improved student achievement, and
asked to accept more responsibilities for lifting up their
schools. Teachers throughout a school will benefit from
guidance and support to help them improve.”-President Barack Obama
27R
EC
OM
ME
ND
AT
ION
S These recommendations are interlinked and co-dependent;
adopting one or two while ignoring others will not eliminate
the Widget Effect or produce the quantum leaps in student
achievement our children deserve.
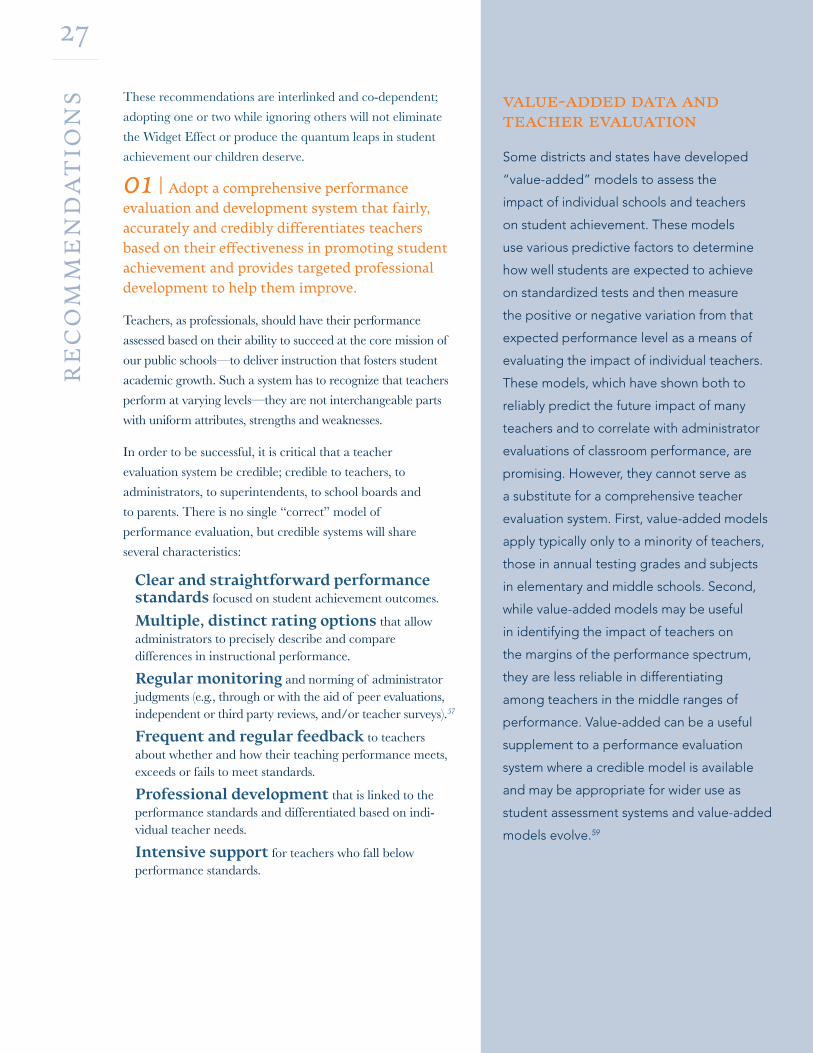
01 | Adopt a comprehensive performance evaluation and development system that fairly, accurately and credibly differentiates teachers based on their effectiveness in promoting student achievement and provides targeted professional development to help them improve.
Teachers, as professionals, should have their performance
assessed based on their ability to succeed at the core mission of
our public schools—to deliver instruction that fosters student
academic growth. Such a system has to recognize that teachers
perform at varying levels—they are not interchangeable parts
with uniform attributes, strengths and weaknesses.
In order to be successful, it is critical that a teacher
evaluation system be credible; credible to teachers, to
administrators, to superintendents, to school boards and
to parents. There is no single “correct” model of
performance evaluation, but credible systems will share
several characteristics:
Clear and straightforward performance standards focused on student achievement outcomes.
Multiple, distinct rating options that allow administrators to precisely describe and compare differences in instructional performance.
Regular monitoring and norming of administrator judgments (e.g., through or with the aid of peer evaluations, independent or third party reviews, and/or teacher surveys).57
Frequent and regular feedback to teachers about whether and how their teaching performance meets, exceeds or fails to meet standards.
Professional development that is linked to the performance standards and differentiated based on indi-vidual teacher needs.
Intensive support for teachers who fall below performance standards.
value-added data and teacher evaluation
Some districts and states have developed
“value-added” models to assess the
impact of individual schools and teachers
on student achievement. These models
use various predictive factors to determine
how well students are expected to achieve
on standardized tests and then measure
the positive or negative variation from that
expected performance level as a means of
evaluating the impact of individual teachers.
These models, which have shown both to
reliably predict the future impact of many
teachers and to correlate with administrator
evaluations of classroom performance, are
promising. However, they cannot serve as
a substitute for a comprehensive teacher
evaluation system. First, value-added models
apply typically only to a minority of teachers,
those in annual testing grades and subjects
in elementary and middle schools. Second,
while value-added models may be useful
in identifying the impact of teachers on
the margins of the performance spectrum,
they are less reliable in differentiating
among teachers in the middle ranges of
performance. Value-added can be a useful
supplement to a performance evaluation
system where a credible model is available
and may be appropriate for wider use as
student assessment systems and value-added
models evolve.59
28R
EC
OM
ME
ND
AT
ION
S
02 | Train administrators and other evaluators
in the teacher performance evaluation system and hold them accountable for using it effectively.
In order for a performance evaluation system to fairly and
accurately reflect variations in teacher effectiveness, those
who are conducting the evaluations—principals, assistant
principals, peers or third parties—must be well trained in
setting rigorous but achievable performance standards,
objectively measuring teacher performance against those
standards, providing constructive and actionable feedback
to teachers and designing and providing the differentiated
support teachers need to meet or exceed the standards.
The training must be intensive and ongoing. Evaluators
will need to become expert on the performance evaluation
system before it is launched, but just as importantly, will need
ongoing guidance as they use the system. District officials
must recognize that principals and assistant principals will be
chiefly responsible not just for implementing a new evaluation
process, but for leading a change in culture.
District officials also have an important role to play in
ensuring that teachers are fairly and accurately differentiated
based on their effectiveness in the classroom. They must
ensure that differentiation through the performance
evaluation system remains a priority for administrators by
investing in ongoing support and holding them accountable
for this process. Administrators who cannot effectively
evaluate teacher performance will be unable to reward and
retain top performers, improve or remove poor performers,
or help all teachers to understand and respond to their own
strengths and weaknesses. This fundamental failure translates
to an inability to ensure that students receive consistently
high-quality instruction, a failing that administrators’ own
evaluations must reflect.
unprecedented opportunities for implementation and support
These recommendations are ambitious
and comprehensive, befitting the
demonstrable need for dramatic change
in our schools. However, they are also
pragmatic and achievable. While there
will clearly be significant transition costs
associated with the implementation
of our recommendations, there are
also unprecedented opportunities for
schools to obtain external funding for
this purpose. Major philanthropies are
investing in human capital reform in K-12
education at historic levels,60 and the
American Recovery and Reinvestment
Act includes substantial new funding
for teacher effectiveness reform.61
In addition, school districts may be
able to reallocate the substantial
funding they currently dedicate
to undifferentiated professional
development to provide better
evaluation systems and more relevant
professional development to meet the
needs of their teachers.62
29R
EC
OM
ME
ND
AT
ION
S 03 | Use performance evaluations to inform key decisions such as teacher assignment, professional development, compensation, retention and dismissal.
The production of accurate information that can inform important human capital
decisions in districts and schools is one of the clear advantages of utilizing a robust
teacher performance evaluation system. At present, decisions about how much to
pay teachers, where to assign them, what professional development to provide and
whom to exit are based on information that generally has little or no relationship to
effectiveness in the classroom.
Once districts fairly and accurately assess teacher effectiveness, they can and should
put this information to broader use. For example, it might be used to match teachers
who provide particularly effective instruction to English Language Learners with
students in that category, or to determine which teachers to target for retention
through recognition, additional responsibility, compensation or promotion.
Modify teacher compensation systems, most of which are exclusively based on years of service and attainment of educational credits, so that they also reward high-performing teachers and withhold step increases for low-performing teachers.
Factor teacher effectiveness into layoff and excessing (displacement) decisions, rather than basing such decisions solely on seniority.
Target professional development to identified teacher needs so that it helps teachers address areas where they can improve.
Recognize consistently excellent teachers through additional compensation and career ladder opportunities as well as opportunities to employ innovative instructional approaches and share best practices with novices and other colleagues.
Fairly but swiftly remove consistently low-performing teachers who are identified as such through a fair, credible evaluation process and who fail to meet performance standards despite receiving individualized support.
Attaching “stakes” to performance evaluation outcomes for teachers and school
administrators is not merely advisable, it is essential. Basing these critical decisions on
accurate measures of teacher effectiveness will help to create cultures of excellence
in schools, where the focus is on achieving individual, group and school performance
goals related to student achievement. In addition, administrators will have to invest
substantial time in the performance evaluation system, and will be required to have
the difficult conversations about performance with their teachers that so rarely
occur in schools today. Without attaching stakes to evaluation outcomes, it would be
unrealistic to expect that administrators will continue to do the hard work to ensure
that the performance evaluation system remains rigorous and credible.
30R
EC
OM
ME
ND
AT
ION
S
04 | Adopt dismissal policies that provide lower-stakes options for ineffective teachers to exit the district and a system of due process that is fair but streamlined and efficient.
When virtually all teachers are rated as satisfactory or better, a teacher identified
as unsatisfactory may justifiably wonder whether he or she is the subject of a witch
hunt. But under a system with clear performance standards, frequent constructive
feedback and ample support for teachers failing to meet the standards, unsatisfactory
ratings will not be anomalous, surprising or without clear justification. As a result, it
is far more likely that teachers identified as unsatisfactory will accept the appraisal of
their performance and voluntarily exit the district (as is common in other professions)
rather than challenge the decision through formal processes.
Districts and states can facilitate the voluntary departure of unsatisfactory performers
by providing low-stakes options such as multi-year unpaid sabbaticals (without
job guarantees upon return). Districts can also motivate unsatisfactory teachers
to voluntarily exit by denying them salary increases unless and until they meet
performance standards, and by allowing pension plan portability so that veteran
teachers who need a change can accept positions in other districts without sacrificing
pension benefits.
Regardless of whether teachers leave voluntarily or through a streamlined due process
system, they should not face license revocation unless they are a danger to children.
Just as in other professions, those who fail to meet performance standards of a particular
employer should not be barred from the profession, because “fit” matters and an
effective match with a new school may lead to improved instructional performance.
Formal dismissal processes should no longer determine whether teachers can
continue to practice their chosen profession, but, rather, should be a check on
arbitrary decisions by administration. This much more narrow focus, coupled with
a transparent evaluation system and process, should permit a dismissal process that
does not involve protracted and expensive quasi-judicial hearings in which arbitrators
substitute their judgment about teacher competence for that of school or district
leaders. There should be no necessity, in fact, for schools and districts to invest
hundreds of hours and hundreds of thousands of dollars seeking the dismissal of a
single unsatisfactory-rated teacher.63
Nor will extensive remediation processes be necessary in cases of unsatisfactory
performance. Teachers failing to meet performance standards will receive fair
notice of performance problems, guidance on how to improve and time to do so,
all within the context of the performance evaluation system. On the heels of such a
process, dismissal should not require extensive additional documentation or lengthy
testimony about performance problems or remediation. In the context of a credible
performance evaluation system, an expedited hearing of one day’s duration should
be sufficient for an arbitrator to determine if the performance evaluation and
development process were followed and that the judgments of schools administrators
were made in good faith.
At present,
decisions about
how much to pay
teachers, where
to assign them,
what professional
development
to provide and
whom to exit
are based on
information
that generally
has little or no
relationship to
effectiveness in
the classroom.
31 N
OT
ES
1 Victor H. Bernstein, “Security of the Teacher in his Job,” The New York Times, May 24, 1936.2 Remarks by President Barack Obama to the U.S. Hispanic Chamber of Commerce on a Complete and Competitive American Education, March 10, 2009.3 For information about the impact of teacher effectiveness on student outcomes, see Rivkin, S., E. Hanushek, and J. Kain (2005). “Teachers, Schools, and Academic Achievement,” Econometrica, 73(2), 417-458. Also see Sanders, W.L. and Rivers, J.C. (1996). “Research Project Report: Cumulative and Residual Effects of Teachers on Future Student Academic Achievement,” University of Tennessee Value-Added Research and Assessment Center; and Rockoff, J. E. (2004). “The Impact of Indi-vidual Teachers on Students’ Achievement: Evidence from Panel Data.” American Economic Review 94(2), 247-52.4 Teacher survey data from Akron Public Schools, Chicago Public Schools, Denver Public Schools, District U-46 (Elgin), Little Rock School District, Pueblo City Schools, Rockford Public Schools, Springdale Public Schools and Toledo Public Schools. A “negative” evaluation constitutes the lowest evaluation rating possible, per each dis-trict’s evaluation system/tool.5 Evaluation data from El Dorado Public Schools and Little Rock School District were unavailable for manual collection. In these instances, the districts are represented by survey data alone.6 Districts that use a binary rating system to evaluate teachers include Denver Public Schools, Jonesboro Public Schools, Pueblo City Schools, Toledo Public Schools and Springdale Public Schools. Springdale Public Schools uses a binary evaluation system for most non-probationary teachers and a multiple rating system for probationary teachers and some non-probationary teachers. 7 Throughout this report, the generic term “tenured” is used to refer to teachers who have tenure, non-probationary status or continuing-contract status. 8 Denver Public Schools uses a multiple rating system for various indicators, and then a final summative rating of “satisfactory” or “unsatisfactory.”9 In Jonesboro Public Schools, teachers receive either “Meets Expectations” or “Needs Improvement” on each of the eight domains that comprise the district’s evaluation tool. In compiling the data, teachers were given one point for each of the eight domains in which they received a rating of “Meets Expectations” box checked for more than half of the sub-domains in a particular domain. Rating totals represent the sum of ratings across all eight domains. 10 Rating data for teachers evaluated using the Professional Development Model only, an option available only to teachers with non-probationary status. (Teacher contract status data was unavailable for Springdale Public Schools, so data regarding the use of the Professional Development Model to evaluate a teacher was used as a proxy to identify teachers with non-probationary status.)11 Satisfactory ratings represent all ratings given during the period specified by district in Figure 01. 12 Unsatisfactory ratings represent all ratings given during the period specified by district in Figure 01.13 Districts that use a multiple rating system to evaluate teachers include Akron Public Schools, Chicago Public Schools, Cincinnati Public Schools, District U-46 (Elgin) and Rockford Public Schools. Throughout this report, evaluation rating data from Cincinnati Public Schools refer only to the domain “Teaching for Student Learning.”14 Highest ratings were assigned within the last three to five school years, depending upon district. See Figure 2 for the time periods associated with each district. 15 Based on percent of teachers that receive one of the lowest two ratings in Akron Public Schools, Chicago Public Schools and Cincinnati Public Schools.16 As defined by the federal No Child Left Behind Act. Schools with grade configurations that include both elementary and secondary grade levels, such as K-8 schools, receive multiple AYP ratings. If a school received at least one AYP rating of “Not Meeting,” we counted the school in the set of those schools not meeting AYP.17 Average calculated using the number of schools not meeting AYP in each school year as the unit of analysis.18 Denver Public Schools Adequate Yearly Progress data was collected from the Colorado Department of Education website, located at http://www.cde.state.co.us/FedPrograms/ayp/results.asp, in March 2009. Charter schools were omitted from the data included in Figure 3. 19 Rockford Public Schools Adequate Yearly Progress data was collected from the Illinois State Board of Education website, located at http://webprod.isbe.net/ereport-card/publicsite/getSearchCriteria.aspx in March 2009. Cincinnati Public Schools Adequate Yearly Progress Data was collected from the Ohio Department of Education website, located at http://www.ode.state.oh.us/GD/Templates/Pages/ODE/ODEPrimary.aspx?page=2&TopicRelationID=130 in December 2008. 20 Teachers were asked to report when their instructional performance was last evaluated. 21 Expanded surveys were issued in Akron Public Schools, Chicago Public Schools, Little Rock School District and Springdale Public Schools. Teachers and administra-tors in these districts were asked how their respective district’s evaluation ratings translate to varying levels of effectiveness, including an exemplary teacher, an effective teacher, a somewhat effective teacher or an ineffective teacher. 22 Expanded surveys were issued in Akron Public Schools, Chicago Public Schools, Little Rock School District, and Springdale Public Schools to survey teachers on additional topics including teacher development and the recognition of excellence. Data taken from these expanded surveys issued in four study sites are noted as such throughout the report.23 Expanded surveys were issued in Akron Public Schools, Chicago Public Schools, Little Rock School District and Springdale Public Schools to survey teachers on ad-ditional topics including teacher development and the recognition of excellence. 24 Teachers in all 12 districts were asked if their evaluator identified any areas of unsatisfactory performance or performance in need of improvement on their most recent evaluation. 25 Expanded surveys were issued in Akron Public Schools, Chicago Public Schools, Little Rock School District and Springdale Public Schools. Teachers were asked if they had participated in an informal conversation with their principal or evaluator in school year 2008-09, to discuss aspects of their instruction that could be improved. 26 Expanded surveys were issued in Akron Public Schools, Chicago Public Schools, Little Rock School District and Springdale Public Schools. Teachers who had a performance area identified as in need of improvement or unsatisfactory were asked if they were made aware of concerns about the quality of their instruction prior to their most recent evaluation. 27 Respondents answering “Strongly agree” or “Agree.”28 Respondents answering “Strongly agree” or “Agree.”29 Novice is defined by the probationary teaching period, which depends on state policy and in some cases, district practice. Districts in our study range from a three to four year novice period. 30 Respondents answering “Very confident” or “Confident.”31 Percent of novice teachers in Akron Public Schools, Cincinnati Public Schools, Chicago Public Schools, District U-46, Little Rock School District, Rockford Public Schools and Springdale Public Schools who indicated they received a greater than satisfactory rating on their most recent performance evaluation. Cincinnati includes evaluation ratings for the “Teaching for Student Learning” domain only.32 Teacher non-renewals were counted based on extant data provided by the districts included in Figure 06. Data are as accurate as the records provided to TNTP for this study. 33 Data from SY05–06 through SY07–08. 34 Data available only for SY04-05 through SY07-08. 35 During the time period 2003-04 through 2007-08, Toledo Public Schools had five informal dismissals of probationary teachers (i.e., probationary teachers who were recommended for non-renewal but elected to resign instead). Data on informal dismissals were not available for all districts studied.36 Percent of teachers identified as poor performers was collected from teacher surveys in Chicago and Akron. Data regarding the actual percent of teachers receiving an unsatisfactory rating was provided by each district.
32N
OT
ES
37 Expanded surveys were issued in Akron Public Schools, Chicago Public Schools, Little Rock School District and Springdale Public Schools. Respondents were asked if there are tenured teachers in their school who deliver poor instruction. 38 Expanded surveys were issued in Akron Public Schools and Chicago Public Schools, which asked teachers if they are aware of poor performers in their school. Evaluation rating data was also available for these districts, allowing for the comparison of reported poor performers and number of unsatisfactory ratings.39 Respondents across all districts except Rockford Public Schools who indicated they have not initiated a dismissal proceeding for a poorly performing tenured teacher in the past five years.40 During the time period 2003-04 through 2007-08, Toledo Public Schools had five informal dismissals of tenured teachers (i.e., tenured teachers who were recommended for dismissal but elected to resign or retire instead). Data on informal dismissals were not available for all districts studied.41 Teacher dismissal for performance data was collected from ten districts representing some combination of school years 2003–04 through 2007–2008 as noted in Figure 08. A formal dismissal is defined as a case of poor instructional performance whereby the district initiated dismissal proceedings against a teacher and those proceedings resulted in a dismissal. Akron Public Schools, Cincinnati Public Schools, Denver Public Schools, Jonesboro Public Schools, Pueblo City Schools, Springdale Public Schools and Toledo Public Schools each supplied a code that identified which teachers were dismissed for poor performance. Chicago Public Schools, District U-49 (Elgin) and Rockford Public Schools sup-plied remediation data and a code detailing remediation outcome, which equates to dismissal. 42 Respondents who said that they believe that administrators fail to dismiss tenured teachers who are poor instructional performers. 43 Survey data from Akron Public Schools, Little Rock School District, and Springdale Public Schools. 44 Expanded surveys were issued in Akron Public Schools, Chicago Public Schools, Little Rock School District and Springdale Public Schools. Teachers and administrators were asked if there are tenured teachers in their school who deliver poor instruction.45 Respondents were asked how many classroom observations their evaluator conducted prior to issuing their most recent evaluation rating, as well as the amount of time the evaluator spent, on average, in their classroom while conducting this (these) observation(s). 46 Respondents in all districts were asked to identify the number of classroom observations conducted prior to their evaluator assigning their most recent evaluation rating. 47 Respondents in all districts were asked to identify the average number of minutes their evaluator spent observing them prior to assigning their most recent evaluation rating(s). 48 Survey respondents were asked to identify their most recent performance evaluation rating. These data were then analyzed against the number of classroom observa-tions conducted for the most recent evaluation. Data from Akron Public Schools, Chicago Public Schools, District U-46 (Elgin), Little Rock School District, Rockford Public Schools and Springdale Public Schools.49 Survey respondents in Akron Public Schools, Chicago Public Schools, Little Rock School District and Springdale Public Schools were asked to identify their most recent performance evaluation rating. These data were then analyzed against teacher reports of informal feedback. 50 Respondents were asked to describe the extent of training they have received on how to conduct an effective evaluation of a teacher’s instructional performance.51 Akron Public Schools, Chicago Public Schools, District U-46 (Elgin), Little Rock School District, Rockford Public Schools and Springdale Public Schools.52 Denver Public Schools, Jonesboro Public Schools, Pueblo City Schools and Toledo Public Schools. These data do not include Springdale Public Schools, which uses a multiple rating evaluation system for probationary teachers and some non-probationary teachers and a binary evaluation rating system for most non-probationary teachers.53 Akron Public Schools, Chicago Public Schools, Little Rock School District and Springdale Public Schools.54 Definitions used in determining significance:
Recruitment: District uses instructional effectiveness outcomes to determine and target likely sources of high-potential teacher candidates.
Hiring/Placement: District uses instructional effectiveness outcomes to determine which teachers are hired into which schools and/or placed in particular positions, e.g. hard-to-staff schools, lead teacher position, lead mentor, etc.
Professional Development: District uses instructional effectiveness outcomes to determine what types of specific development and support an individual teacher needs in order to continuously improve their teaching performance.
Compensation: District uses instructional effectiveness outcomes to determine compensation decisions, e.g., advance on salary schedule, pay-for-performance programs, merit pay, etc.
Granting Non-Probationary Status/Tenure: District uses instructional effectiveness outcomes to determine which teachers are awarded non-probationary status or tenure.
Retention: District uses instructional effectiveness outcomes to identify outstanding teachers, recognize their efforts and reward them for their performance, through preferred placement, greater autonomy, etc.
Layoffs: District uses instructional effectiveness outcomes to determine which teachers are retained and/or released during layoff situations.
Remediation: District uses instructional effectiveness outcomes to determine which teachers receive remediation support and what type of remediation they need.
Dismissal: District uses instructional effectiveness outcomes to determine which teachers should be dismissed because their influence on student learning is less than satisfactory.
55 Respondents from the Chicago Public Schools administrator survey only.56 Expanded surveys were issued in Chicago Public Schools to survey teachers on additional topics including teacher development and the recognition of excellence. 57 Respondents from the Chicago Public Schools teacher survey only.58 A critical part of ensuring that teachers accept any performance evaluation system as fair and credible is monitoring administrator judgments to ensure they are fair and objective. There are several mechanisms that can be used for this purpose. Peer evaluators can be deployed to provide input on administrator evaluations. District officials can independently review administrator judgments. Outside firms can be retained to provide objective third party assessments of the fidelity of administrators to performance evaluation standards. Teachers can be surveyed confidentially to assess their views of the accuracy of performance evaluations in their schools. These mechanisms will allow district officials to identify administrators who are not being fair or objective and instill confidence among teachers in the fairness of the process.59 Various researchers have explored the strengths and weaknesses of using value added data as an indicator of teacher effectiveness. See Goldhaber, D. and M. Hansen (2008). “Assessing the potential of using value-added estimates of teacher job performance for making tenure decisions.” National Center for Analysis of Longitudinal Data in Education Research. Retrieved April 27, 2009, from http://www.urban.org/UploadedPDF/1001265_Teacher_Job_Performance.pdf. See Rothstein, J. (2008). “Teacher quality in educational production: tracking, decay, and student achievement.” NBER. Retrieved April 27, 2009, from http://www.nber.org/papers/w14442. See McCaffrey, D., Lockwood, J.R., Koretz, D., & Hamilton L.S. (2003). Evaluating value-added models for teacher accountability. Santa Monica, CA: RAND60 Erik Robelen. “Gates Revamps its Strategy for Giving in Education.” Education Week, November 11, 2008.61 See U.S. Department of Education http://www.ed.gov/news/pressreleases/2009/04/04012009.html. 62 Shields, R., & Hawley Miles, K. (2008). “Finding Resources and Organizing to Build Teaching Capacity: The Professional Development Strategic Review.” 63 New York State School Boards Association (2007). “Accountability for All.”64 Non-probationary teachers in Springdale Public Schools can be evaluated using one of two models. Under the Professional Development Model, which is used for most non-probationary teachers, there is no required minimum number of observations and there are two possible ratings. Under the Clinical Model, which non-proba-tionary teachers can opt to use and is also used for non-probationary teachers with performance concerns, there are two required observations for teachers who opt to use the model, three for teachers with performance concerns, and four possible ratings.
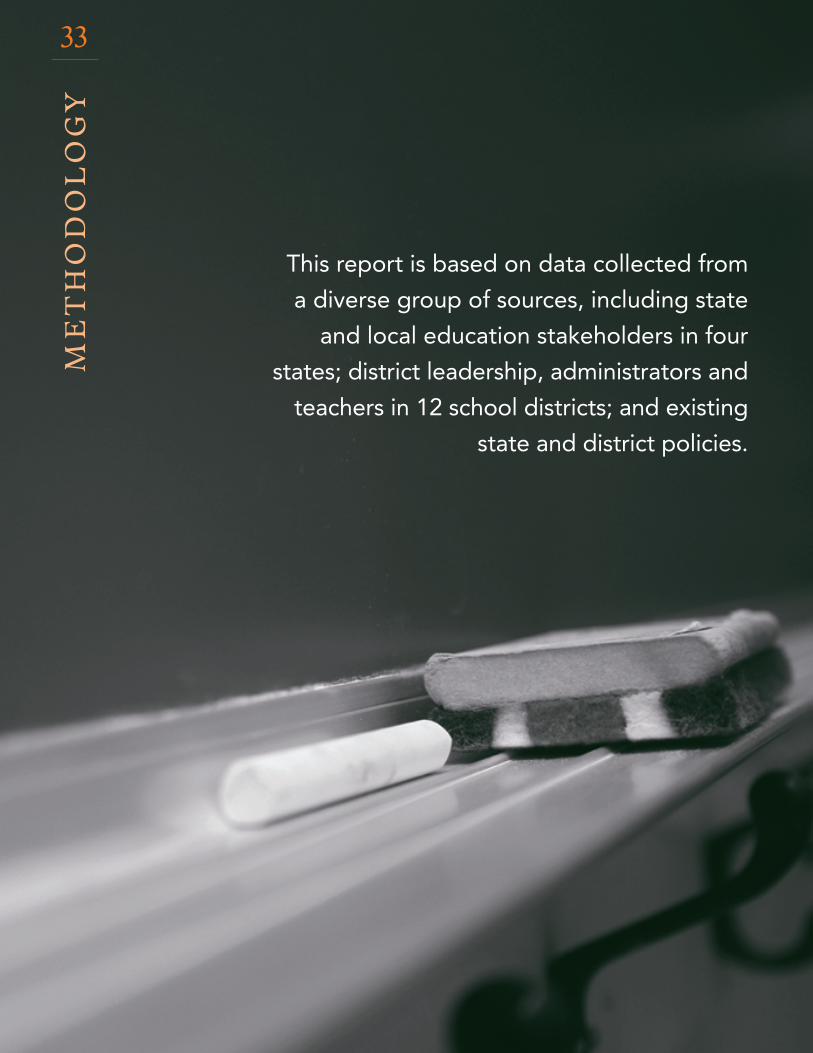
33M
ET
HO
DO
LO
GY
This report is based on data collected from
a diverse group of sources, including state
and local education stakeholders in four
states; district leadership, administrators and
teachers in 12 school districts; and existing
state and district policies.
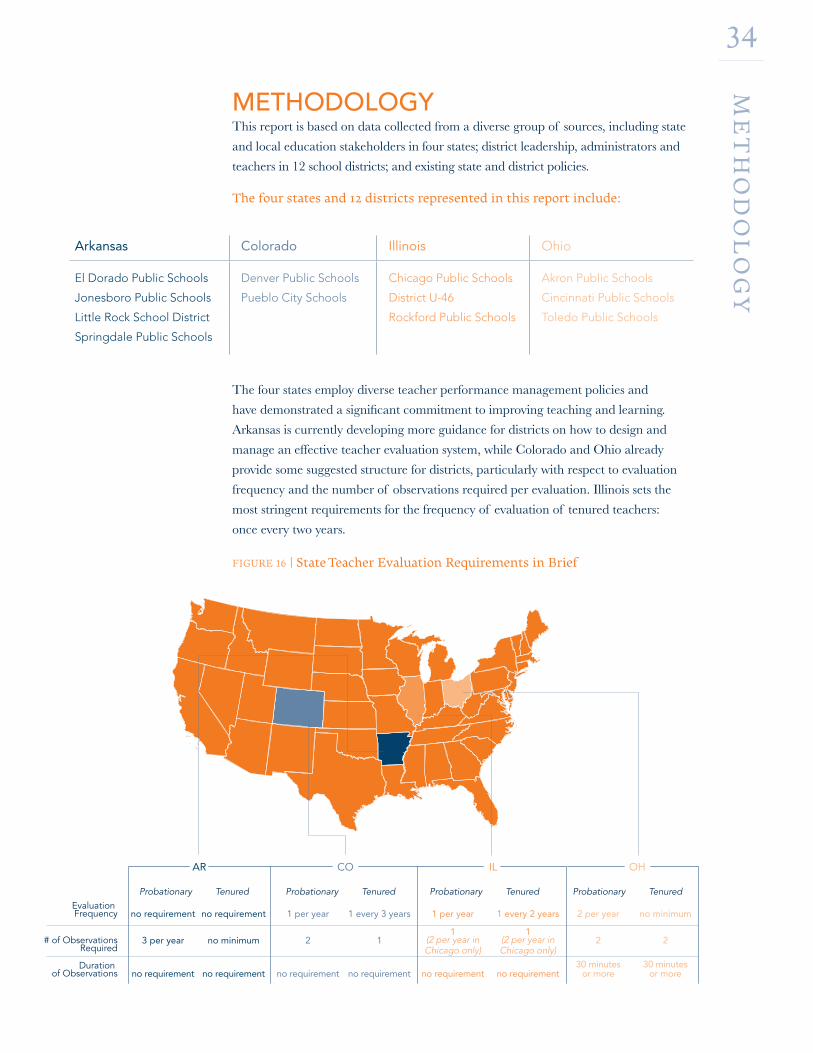
METHODOLOGYThis report is based on data collected from a diverse group of sources, including state
and local education stakeholders in four states; district leadership, administrators and
teachers in 12 school districts; and existing state and district policies.
The four states and 12 districts represented in this report include:
The four states employ diverse teacher performance management policies and
have demonstrated a significant commitment to improving teaching and learning.
Arkansas is currently developing more guidance for districts on how to design and
manage an effective teacher evaluation system, while Colorado and Ohio already
provide some suggested structure for districts, particularly with respect to evaluation
frequency and the number of observations required per evaluation. Illinois sets the
most stringent requirements for the frequency of evaluation of tenured teachers:
once every two years.
FIGURE 16 | State Teacher Evaluation Requirements in Brief
Evaluation Frequency
# of Observations Required
Duration of Observations
CO ILAR OH
Probationary Tenured Probationary Tenured Probationary Tenured Probationary Tenured
1 per year
2
no requirement
1 every 3 years
1
no requirement
1 per year
1(2 per year inChicago only)
no requirement
1 every 2 years
1(2 per year inChicago only)
no requirement
no requirement
3 per year
no requirement
no requirement
no minimum
no requirement
2 per year
2
30 minutesor more
no minimum
2
30 minutesor more
34M
ET
HO
DO
LO
GY
Arkansas Colorado Illinois Ohio
El Dorado Public Schools Denver Public Schools Chicago Public Schools Akron Public Schools
Jonesboro Public Schools Pueblo City Schools District U-46 Cincinnati Public Schools
Little Rock School District Rockford Public Schools Toledo Public Schools
Springdale Public Schools
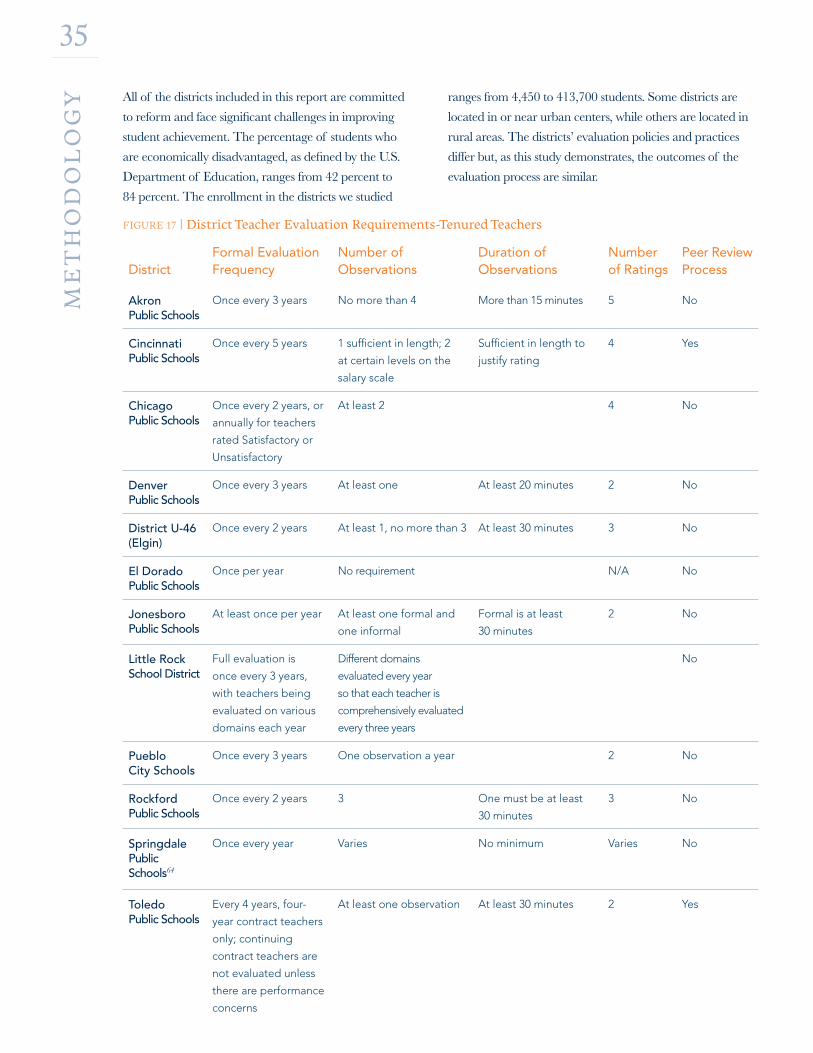
DistrictFormal Evaluation Frequency
Number of Observations
Duration of Observations
Number of Ratings
Peer Review Process
Akron Public Schools
Once every 3 years No more than 4 More than 15 minutes 5 No
Cincinnati Public Schools
Once every 5 years 1 sufficient in length; 2
at certain levels on the
salary scale
Sufficient in length to
justify rating
4 Yes
Chicago Public Schools
Once every 2 years, or
annually for teachers
rated Satisfactory or
Unsatisfactory
At least 2 4 No
Denver Public Schools
Once every 3 years At least one At least 20 minutes 2 No
District U-46 (Elgin)
Once every 2 years At least 1, no more than 3 At least 30 minutes 3 No
El Dorado Public Schools
Once per year No requirement N/A No
Jonesboro Public Schools
At least once per year At least one formal and
one informal
Formal is at least
30 minutes
2 No
Little Rock School District
Full evaluation is
once every 3 years,
with teachers being
evaluated on various
domains each year
Different domains
evaluated every year
so that each teacher is
comprehensively evaluated
every three years
No
Pueblo City Schools
Once every 3 years One observation a year 2 No
Rockford Public Schools
Once every 2 years 3 One must be at least
30 minutes
3 No
Springdale Public Schools64
Once every year Varies No minimum Varies No
Toledo Public Schools
Every 4 years, four-
year contract teachers
only; continuing
contract teachers are
not evaluated unless
there are performance
concerns
At least one observation At least 30 minutes 2 Yes
All of the districts included in this report are committed
to reform and face significant challenges in improving
student achievement. The percentage of students who
are economically disadvantaged, as defined by the U.S.
Department of Education, ranges from 42 percent to
84 percent. The enrollment in the districts we studied
ranges from 4,450 to 413,700 students. Some districts are
located in or near urban centers, while others are located in
rural areas. The districts’ evaluation policies and practices
differ but, as this study demonstrates, the outcomes of the
evaluation process are similar.
FIGURE 17 | District Teacher Evaluation Requirements-Tenured Teachers
35M
ET
HO
DO
LO
GY

36M
ET
HO
DO
LO
GY
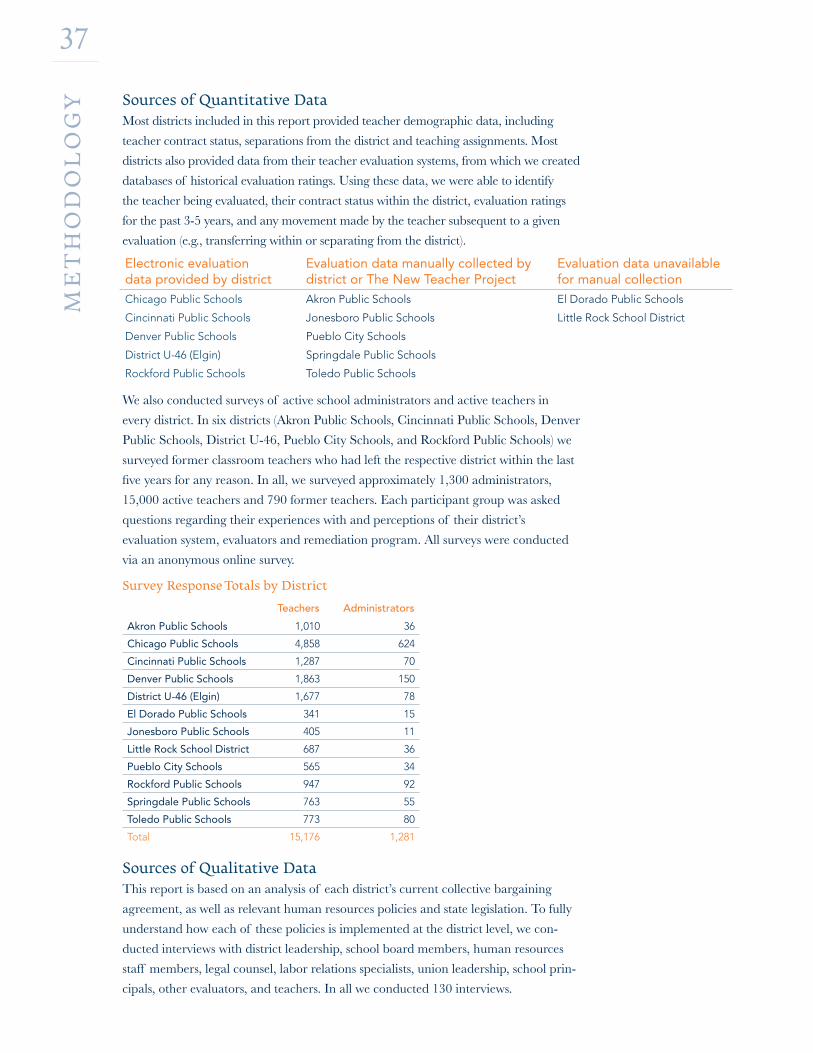
37M
ET
HO
DO
LO
GY Sources of Quantitative Data
Most districts included in this report provided teacher demographic data, including
teacher contract status, separations from the district and teaching assignments. Most
districts also provided data from their teacher evaluation systems, from which we created
databases of historical evaluation ratings. Using these data, we were able to identify
the teacher being evaluated, their contract status within the district, evaluation ratings
for the past 3-5 years, and any movement made by the teacher subsequent to a given
evaluation (e.g., transferring within or separating from the district).
We also conducted surveys of active school administrators and active teachers in
every district. In six districts (Akron Public Schools, Cincinnati Public Schools, Denver
Public Schools, District U-46, Pueblo City Schools, and Rockford Public Schools) we
surveyed former classroom teachers who had left the respective district within the last
five years for any reason. In all, we surveyed approximately 1,300 administrators,
15,000 active teachers and 790 former teachers. Each participant group was asked
questions regarding their experiences with and perceptions of their district’s
evaluation system, evaluators and remediation program. All surveys were conducted
via an anonymous online survey.
Survey Response Totals by District
Sources of Qualitative DataThis report is based on an analysis of each district’s current collective bargaining
agreement, as well as relevant human resources policies and state legislation. To fully
understand how each of these policies is implemented at the district level, we con-
ducted interviews with district leadership, school board members, human resources
staff members, legal counsel, labor relations specialists, union leadership, school prin-
cipals, other evaluators, and teachers. In all we conducted 130 interviews.
Electronic evaluation data provided by district
Evaluation data manually collected by district or The New Teacher Project
Evaluation data unavailable for manual collection
Chicago Public Schools Akron Public Schools El Dorado Public Schools
Cincinnati Public Schools Jonesboro Public Schools Little Rock School District
Denver Public Schools Pueblo City Schools
District U-46 (Elgin) Springdale Public Schools
Rockford Public Schools Toledo Public Schools
Teachers Administrators
Akron Public Schools 1,010 36
Chicago Public Schools 4,858 624
Cincinnati Public Schools 1,287 70
Denver Public Schools 1,863 150
District U-46 (Elgin) 1,677 78
El Dorado Public Schools 341 15
Jonesboro Public Schools 405 11
Little Rock School District 687 36
Pueblo City Schools 565 34
Rockford Public Schools 947 92
Springdale Public Schools 763 55
Toledo Public Schools 773 80
Total 15,176 1,281
38M
ET
HO
DO
LO
GY
Four-State Advisory Panel ProcessThis report benefits from the involvement of four advisory
panels, one in each of our study states of Arkansas, Colorado,
Illinois and Ohio.
We established the advisory panels because we believed
strongly that it would have been impossible to author a high-
quality report without incorporating the many perspectives
of the various local education stakeholders. In the end, the
advisory panels brought to bear participants’ substantial
experience and expertise to inform the study methodology,
findings and recommendations.
Advisory panel membership varied from state to state but,
in general, these panels were comprised of representatives
from the state education agencies, state teachers unions or
associations, school district superintendents and human
resources staff, local teachers union or association leaders,
and state-level professional organizations, such as the
school administrators associations, personnel administrators
associations, and school boards associations. In total,
approximately 80 stakeholders participated in the four
advisory panels.
Advisory panels met three times from June 2008 to April 2009
to discuss the study and its progress. The first meeting helped
us to formulate and refine hypotheses and identify
data sources, as well as build knowledge of local contexts.
The second meeting allowed us to showcase portions of
our data with the advisory panels, demonstrate what we
were learning and test our arguments. The third and final
meeting provided us with an opportunity to share our draft
recommendations and gauge their viability.
In the end, advisory panel members were given the
opportunity to provide a written response to the process and
recommendations—a feature that we believe adds needed
context to a challenging issue. Those responses can be found
on our website at www.widgeteffect.org. Participation in an
advisory panel does not suggest agreement with our findings
and recommendations; the views of advisory panel members
are presented first-hand in their written responses.
View the Advisory Panel members’ responses to this report at www.widgeteffect.org

Shirley Billingly Assistant Superintendent, El Dorado Public Schools
Ginny Blankenship Research and Fiscal Policy Director, Arkansas Advocates for Children and Families
Sue Castleberry Assistant Superintendent, Jonesboro Public School District
Barbara Culpepper Unit Coordinator—Office of Teacher Quality, Arkansas Department of Education
Luke Gordy Executive Director, Arkansans for Education Reform Foundation
Kristen Craig Gould Staff Attorney, Arkansas School Boards Association
David Hartz Associate Superintendent Human Resources / Governmental Liaison, Little Rock School District
Kenneth James Commissioner of Education, Arkansas Department of Education
Hartzell Jones Deputy Superintendent for Personnel, Springdale Public Schools
Cathy Koehler President, Little Rock Classroom Teachers Association
Renee Kovach Director of Certified Personnel, Little Rock School District
David Leonard President, Jonesboro Faculty and Staff Association
Daniel N. Marzoni President, Arkansas Education Association
Michael Mertens Assistant Executive Director, Arkansas Association of Educational Administrators
Rich Nagel Executive Director, Arkansas Education Association
Dale Query Superintendent, Arkansas Rural Education Association
Jim Rollins Superintendent, Springdale Public Schools
Don Sharp Superintendent of Schools, Cotter Public Schools / Vice President, Arkansas Rural Education Association
Scott Smith Executive Director, Arkansas Public School Resource Center
Beverly Williams Assistant Commissioner, Arkansas Department of Education
We are grateful to all of our advisory panel members for their unique contributions and insights.
39M
ET
HO
DO
LO
GY
“We need to develop a succinct performance appraisal system that
recognizes good work, helps marginal employees get better and
identifies employees who should be dismissed due to their inability to
improve. Student performance must be the driving force to improve our
current systems.” -Springdale Public Schools (AR)
ARKANSAS

Linda Barker Director of Teaching & Learning, Colorado Education Association
Pamela Constuble Teacher–Pueblo City Schools, Pueblo Education Association
Randy DeHoff Board Member, Colorado State Board of Education
Mark Fermanich Research Director, Colorado Children’s Campaign
Jami Goetz Director of Office of Professional Services and Educator Licensing, Colorade Department of Education
Patricia Gonzalez Assistant Superintendent of Human Resources, Pueblo City Schools
Chris Gramstorff Human Resources Director, Aurora Public Schools
Beverly Ingle President, Colorado Education Association
Brenna Isaacs President, Aurora Education Association
Brad Jupp Academic Policy Advisor, Denver Public Schools
Tony Lewis Executive Director, Donnell-Kay Foundation
Richard Lloyd President, Denver Federation of Teachers
Carole Partin President, Pueblo Education Association
Van Schoales Program Officer, Urban Education, Piton Foundation
Shayne Spalten Chief Human Resources Officer, Denver Public Schools
Kim Ursetta President, Denver Classroom Teachers Association
Terry Whitney Senate Majority Legislative Director, Colorado Legislature
40M
ET
HO
DO
LO
GY
“I believe that all stakeholders should come together to create a more
credible, meaningful, and productive system for teacher, administrator,
and school effectiveness evaluations. Teachers are professionals who
value their chosen career and would like to work with colleagues who are
excited and knowledgeable about their fields and teaching in general.
Teachers and administrators working together in a system which
promotes teachers as professionals and supports their professional
development to meet the needs of their students, increase instructional
quality, and develop effective curriculum is a benefit to all.”-Pueblo Education Association (CO)
COLORADO
David Alexander IEA UniServ Director, Illinois Education Association
Jo Anderson Executive Director, Illinois Education Association
Karen Bieschke Vice President, Rockford Education Association
Bob Corder Director, Human Resources, Rockford Public Schools
Beth Dalton President, Illinois Association of School Personnel Administrators
Tim Davis President, Elgin Teachers Association
Mark Doan Superintendent, Farmington Central Community Schools / Representative, Illinois Association of School Administators
Lisa Jensen Human Resources Director, School District U-46
Ascencion Juarez Chief Human Resources Officer, Chicago Public Schools
John Luczak Senior Program Officer, Joyce Foundation
Cordelia (Dea) Meyer Executive Vice President, Civic Committee of The Commercial Club of Chicago
Molly Phalen President, Rockford Education Association
Elliot Regenstein Partner, EducationCounsel LLC
Rachel Resnick Chief Labor Relations Officer, Chicago Public Schools
Charles P. Rose Partner, Franczek Sullivan P.C.
Angela Rudolph Program Officer, Joyce Foundation
Brian Schwartz Associate Director & General Counsel, Illinois Principals Association
Nancy Slavin Director, Recruitment and Workforce Development, Chicago Public Schools
Audrey Soglin Director, Center for Educational Innovation, Illinois Education Association–NEA
Robin Steans Executive Director, Advance Illinois
Linda Tomlinson Assistant Superintendent, Illinois State Board of Education
Lisa Vahey Director, Chicago New Teacher Center
Cynthia S. Woods Director for Advocacy, Illinois Association of School Boards
41M
ET
HO
DO
LO
GY
“The impact of reviewing how teachers and administrators are evaluated,
as well as the impact of evaluations and decisions made about pay and
retention need to be discussed openly so that questions can be raised and
concerns addressed. Illinois is a very diverse state and decisions about
hiring, teacher evaluations, and retention are decided at the local level.
Therefore, it is paramount that unions, professional associations, teachers,
administrators, and representatives from business and the community
be involved as we collaborate and work toward ensuring that all students
have effective teachers.”
-Illinois State Board of Education (IL)
ILLINOIS

Tony Bagshaw Senior Director of Knowledge Management, Battelle for Kids
Kenneth (Ken) Baker Associate Executive Director, The Ohio Association of Secondary School Administrators
Ann Bischoff Senior Policy Analyst, KidsOhio.org
Patricia Frost-Brooks President, Ohio Education Association
Lesley-Ann Gracey Professional Issues Representative, Cincinnati Federation of Teachers
Kirk Hamilton Deputy Executive Director, Buckeye Association of School Administrators
Julia Indalecio Teacher Programs Manager, Cincinnati Public Schools
Rhonda Johnson President, Columbus Education Association
Jerry Klenke Executive Director, Buckeye Association of School Administrators
Tim Kraus President, Cincinnati Federation of Teachers
Francine Lawrence President, Toledo Federation of Teachers
Kathy McVey Human Resources, Akron Public Schools
Bill Siegferth President, Akron Education Association
Sue Taylor President, Ohio Federation of Teachers
Debra Tully Director of Professional Issues, Ohio Federation of Teachers
William Wendling Executive Director, The Ohio 8
Michelle Winship Education Reform Consultant, Ohio Education Association
Cynthia L. Yoder Executive Director, Center for the Teaching Profession, Ohio Department of Education
42M
ET
HO
DO
LO
GY
“I agree that all stakeholders need to come together to create a more
effective teacher evaluation system. Cincinnati did try to do just that
when we created our Teacher Evaluation System. Our system is a
living, breathing structure that has changed for the better over time.
We are constantly looking for ways to improve and build upon our
evaluation system. The difficulty for us is that we do not have many
other national examples to follow that have as detailed or as
comprehensive of an approach to teacher evaluation. Comprehensive
evaluation systems like ours are very expensive to run and we can only
evaluate 1/5 of the teachers each year. If this is where our country is going
we will need to find many, many more dollars to do this, particularly if
every teacher is comprehensively evaluated every year. Again, I caution
us all to consider changing the larger context of school structure first.”
-Cincinnati Federation of Teachers (OH)
OHIO
About The New Teacher Project | The New Teacher Project (TNTP) is a national
nonprofit dedicated to closing the achievement gap by ensuring that poor and minority
students get outstanding teachers. Founded by teachers in 1997, TNTP partners with
school districts and states to implement scalable responses to their most acute teacher
quality challenges. TNTP recruits and trains thousands of exceptional new teachers
annually, supports school principals in staffing their classrooms, provides teacher
certification in high-need subjects, and documents the policy barriers that keep students
from getting the teachers they need. Since its inception, TNTP has trained or hired
approximately 33,000 teachers, benefiting an estimated 4.8 million students nationwide.
This report is part of an ongoing series of studies on the policies and practices that
determine the composition and quality of the nation’s teacher workforce.
For more information, please visit www.tntp.org.
The report, graphics and figures were designed by Cricket Design Works in Madison, Wisconsin.
The text face is Baskerville Regular, originally designed by John Baskerville in England in the mid-18th century, revived in the early 20th century.
Fonts used for subheads, pull quotes and figure headers include Elmhurst Regular, Small Caps and Italic designed by Christopher Slye and issued by Font Bureau.
Headers, graphics, figures and pull quotes are set in Avenir, part of a family of type designed by Adrian Frutiger in 1988, published by Linotype.


tntp.org
Learn more at www.widgeteffect.org
Second Edition