Embed Size (px)
Citation preview

The Wider Role and Benefits of Investors in PeopleMark Cox and Rod SpiresPACEC
Research Report RR360
RESEARCH

Research Report No 360
The Wider Role and Benefits of Investors in People
Mark Cox and Rod Spires
PACEC
The views expressed in this report are the authors' and do not necessarily reflect those of the Department for Education and Skills. © Queen’s Printer 2002. Published with the permission of DfES on behalf of the Controller of Her Majesty's Stationery Office. Applications for reproduction should be made in writing to The Crown Copyright Unit, Her Majesty's Stationery Office, St Clements House, 2-16 Colegate, Norwich NR3 1BQ. ISBN 1 84185 756 4 June 2002
Page 1
Contents
Executive Summary .....................................................................................3 Background 3 Aims and objectives of the research 3 The findings of the research 3 1. Introduction.......................................................................................6 1.1. Background 6 1.2. Aim and objectives of the research 6 1.3. Approach and methodology 8 1.4. Structure of the report and presentation of survey results 11 2. Involvement with Investors in People .............................................13 2.1. Introduction 13 2.2. Objectives in pursuing the Standard 13 2.3. Barriers to best practice in HR management 15 2.4. Financial and other support received in pursuing the Standard 16 2.5. Awareness and understanding of Investors in People amongst Non-
Investors 17 2.6. Barriers to involvement 19 3. Intermediate Effects of Investors in People ....................................22 3.1. Introduction 22 3.2. Achievement of objectives in participating 22 3.3. Effects on Recognised Organisations' HR management and practices 26 3.4. Effects on Committed Organisations' HR management and practices 28 3.5. HR practices in Non-investor organisations 29 3.6. Additionality 30 3.7. Effects on internal resources 33 4. Business Performance Effects .......................................................35 4.1. Introduction 35 4.2. Comparison of business performance 35 4.3. Subjective views of the impact of Investors in People on performance 39 5. Wider Effects ..................................................................................42 5.1. Introduction 42 5.2. Findings from the Surveys of employees 42 5.3. Employers' perceptions of wider effects 51 6. Investors in People Compared to Other Standards and
Accreditations.................................................................................55 6.1. Introduction 55 6.2. Involvement with other standards and accreditations 55 6.3. Relative usefulness of Investors in People 56 6.4. Use of other good practices 57 7. Maintaining and pursuing the standard ..........................................59 7.1. Introduction 59 7.2. Overall assessment of Investors in People 59 7.3. Re-assessment amongst accredited organisations 62 7.4. Progress of Committed Organisations 63 8. The Costs and Benefits of Investors in People...............................65 8.1. Introduction 65
Contents
Page 2
8.2. Definition of cost-benefit analysis and of rates of return 65 8.3. The approach adopted 66 8.4. The results 67 8.5. Lessons to be learned for future cost-benefit analysis and /or
measurement of rates of return 68 9. Conclusions....................................................................................71 9.1. General conclusions 71 9.2. Conclusions on the specified research issues 72 Appendix A: ....Backgrounds and Characteristics of Organisations Surveyed 75 A1 Introduction 75 A2 Type, sector, age etc 75 A3 Growth objectives and culture 77 A4 Management of training and development 80 Appendix B:Disaggregated Results from the Survey of Recognised Organisations 83 Appendix C:Disaggregated Results from the Survey of Committed Organisations 127 Appendix D:...............Disaggregated Results from the Survey of Non-Users 164

Page 3
The Wider Role and Benefits of Investors in People
Executive Summary
Background
For more than ten years, Investors in People has been the Government's flagship workforce development initiative, providing a framework for good practice and investment in the development of employees at all levels within an organisation. Achievement of the (Investors in People) Standard is open to all organisations, irrespective of size, sector, and ownership. The Standard serves as a benchmark against which organisations are assessed.
Since its inception, the number of organisations becoming recognised Investors in People has grown steadily to total over 26,000 by the end of 2001, with a further 20,000 or so formally committed to achieving the Standard. Within the medium-sized and large employer sector, around 35% of organisations are now recognised Investors in People. However, a smaller proportion of small organisations (less than 50 employees) have sought recognition.
Aims and objectives of the research
Previous research on the effects of Investors in People has shown that the Standard has a positive impact on training and development strategy within committed organisations. Although the recognition process and the internal, immediate effects of Investors in People have been widely researched, the wider role and benefits of the Standard (e.g. persistence and diffusion of effects within organisations, effects on the workforce and on organisations not directly involved) are less well understood. This research was, therefore, undertaken in the context of the need to understand the wider contribution of Investors in People more fully. Key underlying aims of the research were: (a) To derive information that 'positions' Investors in People both within organisations and in terms of its wider impact on participating and non-participating firms, on individuals and on the economy more generally; and (b) To serve as a precursor to a fuller cost-benefit analysis and / or to identification of returns and rates of return to individuals, employers, and society from workforce development.
The findings of the research
Analysis of the results of surveys of Recognised Organisations, Committed Organisations and Non-Investors (involving interviews with 1,012 employers) and of Employees of Recognised and Committed Organisations (involving feedback from 278 employees) led to the following broad conclusions:
Effect on organisations' operations and performance This research confirmed the finding from previous research that Investors in People has a clear and positive impact on Recognised and Committed Organisations' approaches and dedication to training and development. It showed that participating organisations generally achieve their objectives in pursuing the Standard; and are largely satisfied with their experiences of the Standard and the benefits it provides. It also showed that the changes
The Wider Role and Benefits of Investors in People - Executive Summary
Page 4
organisations make in pursuit of the Standard and after they have reached it, and the other intermediate effects and performance benefits they experience as a result, are additional to a large extent. Moreover, comparison with the findings of previous research indicates that the objectives in pursuing Investors have widened in recent years. For instance, only 10% of organisations involved with Investors surveyed in 19951 anticipated increased quality of goods and services as a result of their involvement, while the current (2001) survey found that nearly a half of organisations pursued this as a broad objective. Likewise, only 8% saw Investors improving their financial performance in 1995, compared with 25-30% that now see Investors as a means to increased profitability and/or business growth.
Wider effects This research has also demonstrated that there are wider effects of organisations' participation: • The majority of organisations continue to develop their HR plans, systems
and processes post-recognition (and not simply in order to gain re-recognition). There is also evidence that the effects of the Standard persist and, if anything, accumulate rather than fade over time.
• The increase in adoption of formal training plans, structures etc. across all organisations, including non-Investors, since the mid 1990s seems at least in part to have been due to the growing awareness of Investors in People and the need for effective HR management, albeit that most non-Investors do not appear to fully understand what Investors actually involves.
• It is unclear to what extent employees benefit from organisations'
participation in Investors in People in terms of the net additional amount of training received. However, employees of organisations involved in Investors in People indicate that there is a net positive impact on their attitudes towards education and training (both related and unrelated to their jobs) and their performance at work. Employers tend to share these views.
• A few organisations recognise that their involvement affects their
customers, suppliers and competitors (but it has to be admitted that most do not know whether there have been any effects).
However, the results of the survey would indicate that progress from commitment to recognition and beyond is important for the achievement of wider benefits, internal and external, and while the majority of employers report satisfactory progress towards recognition, up to 45% of organisations had either abandoned or suspended their commitment or were making slower than expected progress towards recognition.
The market position of Investors in People
1 The Return On Investors. Institute for Employment Studies. Report 314, 1996.

The Wider Role and Benefits of Investors in People - Executive Summary
Page 5
In terms of the overall 'position' of Investors in People, this research suggests that the Standard appeals to organisations that are relatively ambitious to grow, and that already attach relatively great importance to human resource management and development. These factors should be taken into account in the assessment of the wider role and benefits of the Standard and its marketing. Recognised Organisations are more likely than other organisations to have achieved other externally accredited standards. However, Investors in People and other standards are generally seen as complementary; and there is no clear evidence that Investors in People leads to the pursuit of other standards, or vice versa. Recognised and Committed Organisations tend to use other good practices, but the practices they follow do not obviously mark them out as being at in the vanguard of the leading edge in HR management and development.
Towards a cost-benefit analysis of Investors in People The experimental approach towards the measurement of rates of return associated with Investors in People adopted by this research proved to have disappointing outcomes, but it did cast light on what might be a feasible (albeit longer-term) method of identifying the cost-benefit balance.

Page 6
1. Introduction
1.1. Background
1.1.1. This report presents the results of research into the wider role and benefits of the Investors in People standard. The research was undertaken by Public and Corporate Economic Consultants Ltd (PACEC), for the Department for Education and Skills (DfES).
1.1.2. For more than ten years, Investors in People has been the Government's flagship workforce development initiative, providing a framework for good practice and investment in the development of employees at all levels within an organisation. However, it is about more than simply training. Rather, it is intended to be a dynamic and flexible tool which focuses on the enrichment of human capital as a means of enabling organisations to pursue a range of business or organisational aims and objectives. 1.1.3. Achievement of the (Investors in People) Standard is open to all organisations, irrespective of size, sector, and ownership. The Standard serves as a benchmark against which organisations are assessed and is maintained and promoted by Investors in People UK, a non-departmental public body. The Standard is assessed and delivered by the Learning and Skills Councils (formerly TECs) in England and Wales, and LECs in Scotland. 1.1.4. Since its inception in the late 1980s, the number of organisations becoming recognised Investors in People has grown steadily to total over 26,000 by the end of 2001, with a further 20,000 or so formally committed to achieving the Standard. Within the medium-sized and large employer sector (i.e. those with more than 50 employees), more than 12,000 employers are now recognised Investors in People, equivalent to around 35% of the population of those employers. However, a much smaller proportion of small businesses (less than 50 employees) have sought recognition2.
1.2. Aim and objectives of the research
1.2.1. Previous research on the effects of Investors in People has shown that the Standard has a positive impact on training and development strategies and practices within organisations involved with Investors in People3. Although the recognition
2 In part due to the greater focus until recently on attracting larger organisations into Investors in
People. 3 See “Review Of Research and Evaluation on Investors in People” DfES Research Brief, RBX
18-01, October 2001.
Introduction
Page 7
process and the internal, immediate effects of Investors in People have been widely researched, the wider role and benefits of the Standard (e.g. the persistence of impacts, effects on the workforce and on organisations not directly involved) are less well understood. This research was, therefore, undertaken in the context of the need to understand the wider contribution of Investors in People more fully.
1.2.2. The research leading to the production of this report was, therefore, concerned with obtaining evidence that would support identification of potential strategies towards workforce development. Key underlying aims of the research were:
(a) To derive information that 'positions' Investors in People both within organisations and more broadly, within the economy and the 'learning society' more generally; and
(b) To serve as a precursor to a fuller cost-benefit analysis and / or to identification of returns and rates of return to individuals, employers, and society from workforce development.
1.2.3. Associated with these two aims, important research issues included the following:
(a) The extent to which Investors in People has impacted on organisations involved with the Standard. In particular, for recognised organisations, has the process of achieving the Standard stimulated ongoing changes and development within the organisations, with regard to HR practices, structure and culture, especially post-recognition? In other words, have the benefits persisted and widened, or has Investors in People been a one-off, leading to little on-going development? Was Investors in People a necessary condition for these changes? Do these changes differ across sectors and types of organisation?
(b) Are recognised organisations generally in the vanguard of 'leading-edge' HR practice? What do employers generally now expect from HR initiatives? And where and how large are the gaps between practices and expectations on the part of the recognised organisations and organisations more generally?
(c) The nature and scale of 'spillover' impacts amongst employers, including Non-Investors. How far has Investors in People permeated the approach to HR to organisations more generally; in raising the profile of human capital; in realising wider economic benefits, besides those to the organisations involved with the Standard?
(d) The nature and scale of additionality, and the indirect impacts Investors in People may have had on individuals employed within recognised organisations, in particular in the impact on individuals' take-up of, and attitudes to learning and training; on the returns to training for individuals that Investors in People may have instigated; and on their employability and social 'inclusivity'.
1.3. Approach and methodology
1.3.1. In order to address the aims and to explore the issues above, a large scale programme of survey based-research was

Introduction
Page 8
undertaken. The programme had five main components: 1. A survey of organisations which have achieved the Standard (referred
to hereafter as the Survey of Recognised Organisations). 2. A survey of organisations which have committed to achieving the
Standard, but which have not yet done so (referred to hereafter as the Survey of Committed Organisations).
3. A survey of organisations which have had no involvement with the standard; i.e. have neither achieved the Standard nor are committed to it (referred to hereafter as the Survey of Non-Investors).
4. A survey of employees of organisations which have achieved the Standard (referred to hereafter as the Survey of Employees of Recognised Organisations).
5. A survey of employees of organisations which have committed to achieving the Standard (referred to hereafter as the Survey of Employees of Committed Organisations).
1.3.2. The surveys of Recognised Organisations, Committed Organisations and Non-Investors were all based mainly on telephone interviews using structured questionnaires. These telephone interviews were supplemented by a number of face to face interviews which followed the same broad structure as the telephone interviews, but which were designed to enable organisations' responses to particular questions to be examined in greater depth. In all three surveys the samples were stratified to ensure a significant number of interviews with organisations in different employment size bands4. In the cases of the surveys of Recognised Organisations and Committed Organisations the samples were also stratified to ensure broadly equal numbers of interviews with organisations which had achieved, or committed to, the Standard before 1998 and from 1998 onwards5. 1.3.3. The questionnaires for the surveys of Recognised Organisations, Committed Organisations and Non-Investors were designed to ensure as far as possible that the three groups were asked the same questions. Thus, all three types of organisation were asked about:
• their background characteristics and culture (e.g. sector, age, growth
objectives, importance attached to training and development and approach to HR management)
• their use of other (i.e. Non-Investors in People) standards and accreditations
• trends in their business / organisational performance.
Similarly, both Recognised Organisations and Committed Organisations were
4 Four employment size bands were used: i) fewer than 10 employees, i.e. micro-organisations; ii) 10-49 employees, i.e. small organisations; iii) 50-249 employees, i.e. medium-sized organisations; and iv) 250+ employees, i.e. large organisations.
5 The before 1998 / 1998 onwards cut-off was used to distinguish short and medium term effects of achieving the standard, or committing to it, from longer term effects. In the case of Investors, the cut-off date is also significant because organisations that achieved the standard before 1998 should have been through the process of re-recognition.
Introduction
Page 9
asked about: • their reasons for, or objectives in, pursuing the Standard • the intermediate and performance effects, or effects to date, of
achieving, or pursuing, the Standard • the wider effects (e.g. on employees and other organisations), or
effects to date, of achieving, or pursuing, the Standard • usefulness of other standards and accreditations, compared to
Investors in People • barriers, if any, to re-recognition or achieving the Standard.
The Non-Investors were asked about their awareness and understanding of the Standard and the barriers to their involvement.
1.3.4. The surveys of Employees of Recognised Organisations and of Committed Organisations were based on self-fill questionnaires, which were distributed amongst their staff members by Recognised Organisations and Committed Organisations which were interviewed face to face6. The questionnaires for both surveys were designed to cover the following issues:
• job satisfaction and perceptions of employer commitment to training and devlopment
• job-related and unrelated education and training in the last year • awareness of organisation's involvement in Investors in People and
understanding of the Standard • perceptions of the effects of Investors in People on the organisation
and the individual.
1.3.5. Table 1.1 shows the target and achieved sample sizes for the five surveys undertaken.
6 It was not possible, therefore, to impose response quotas to ensure that the samples achieved
were representative.

Introduction
Page 10
Table 1.1 Target and achieved survey samples Survey: Target Sample Size Achieved Sample Size
Recognised Organisations 500 telephone interviews plus 100 face
to face
493 telephone interviews plus 100 face to face
Committed Organisations 300 telephone interviews plus 60 face
to face
297 telephone interviews plus 60 face to face
Non-Investors 200 telephone interviews plus 40 face
to face
222 telephone interviews plus 40 face to face
Employees of Recognised Organisations
Approximately 300 self-fill returned by mail
193 returned
Employees of Committed Organisations
Approximately 300 self-fill returned by mail
85 returned
Source: All surveys, PACEC
1.3.6 Appendix A provides a backdrop to the analysis in the subsequent chapters of this report by examining and comparing the backgrounds and characteristics of the three groups of organisations surveyed. However, in summary, it shows that there were some significant differences in the characteristics of the organisation surveyed in terms of their size, business activity, growth objectives and approaches to human resource management. For example:
• Recognised Organisations were more likely to be public sector organisations and less likely to be businesses than Committed Organisations or Non-Investors.
• Recognised Organisations were, on average, larger than Committed Organisations, which, in turn, were larger than the Non-Investors.
• Two thirds of Recognised Organisations and Committed Organisations wanted to grow moderately, but Non-Investors were more likely to want to stay the same size.
There were also differences in the importance the three groups attached to, or approached, human resource management:
• Investors and Committed Organisations perceived human resources management and development as more important for organisational success than did Non-Investors.
• Non-Investors were considerably less likely than the Investors and Committed Organisations to have an HR department or an HR manager, or to have a specific training and development budget.
• Few Investors and Committed Organisations had dedicated Investors in People champions or Investors in People managers. A small minority of Committed Organisations had no one responsible for Investors in People.
• Most with an Investors in People champion or manager had considered what would happen if this person left the organisation, but a significant minority had not.
Introduction
Page 11
1.3.7 Some additional work was undertaken in order to address the particular aim that the research should serve as a precursor to a fuller cost-benefit analysis and / or to identification of returns and rates of return to individuals, employers, and society from workforce development. This involved a brief desk based review of previous relevant research, coupled with follow-up interviews with a sub-sample of Recognised Organisations mainly intended to explore the flow of costs and benefits over time. This additional work and its findings are described in more detail in Chapter 8.
1.4. Structure of the report and presentation of survey results
1.4.1. The report is structured as follows: • Chapter 2 mainly analyses Recognised Organisations' and Committed
Organisations' objectives in pursuing the Standard; and Non-Investors' awareness and understanding of Investors in People.
• Chapter 3 considers whether organisations satisfy their objectives in pursuing the Standard; and looks at the intermediate effects (e.g. changes in HR management and practices) the Standard brings about.
• Chapter 4 assesses the business performance effects of committing to and achieving the Standard.
• Chapter 5 examines the wider "external" effects of Investors in People, including an assessment of how it impacts on employees of organisations involved.
• Chapter 6 uses the survey data to compare Investors in People with other externally accredited standards and other good practices that Recognised Organisations and Committed Organisations have adopted.
• Chapter 7 reports organisations' views on the overall usefulness of Investors in People; and addresses the issues of what, if anything, prevents Committed Organisations achieving the Standard and what, if anything, prevents Recognised Organisations seeking re-recognition.
• Chapter 8 sets out the results of the additional work designed to serve as a precursor to a fuller cost-benefit analysis and / or to identification of returns and rates of return to individuals, employers, and society from workforce development.
• Lastly, Chapter 9 draws conclusions from the research and highlights the implications for policy development.
1.4.2. Reflecting the fact that the Recognised Organisations, Committed Organisations and Non-Investors were asked the same survey questions as far as possible, the data tabulations in the main body of the report directly compare the responses of the three groups. However, Appendix B also shows how survey responses varied within the groups, i.e. by breaking down the results according to size of organisation, broad sector and type of organisation (for all three groups) and according to date of commitment or achieving the Standard (for Recognised Organisations and Committed Organisations). The text in the

Introduction
Page 12
main body of the report also notes where there were large and statistically significant differences in the survey results according to size of organisation. The data from the two surveys of employees are treated in the same way, i.e. in the main part of the report employees of Recognised Organisations are compared with employees of Committed Organisations and differences within the two groups are examined in Appendix B.

Page 13
2. Involvement with Investors in People
2.1. Introduction
2.1.1. Mainly as a prelude to the analysis in the subsequent chapters of the various outputs, outcomes and effects of Investors in People, this chapter examines:
• Recognised Organisations' and Committed Organisations' objectives in pursuing the Standard;
• Barriers to the implementation of best practices in human resource management outside the Investors in People framework; and
• Whether and to what extent Recognised Organisations received, and Committed Organisations have received, external financial and other support to help them to achieve the Standard.
2.1.2 Awareness and understanding of the Standard amongst Non-Investors is also examined as a means of assessing the barriers to its more widespread use. And comparison with previous research findings7 allows us to assess the extent to which the objectives and appreciation/awareness of the benefits and barriers of participation have widened in recent years.
2.2. Objectives in pursuing the Standard
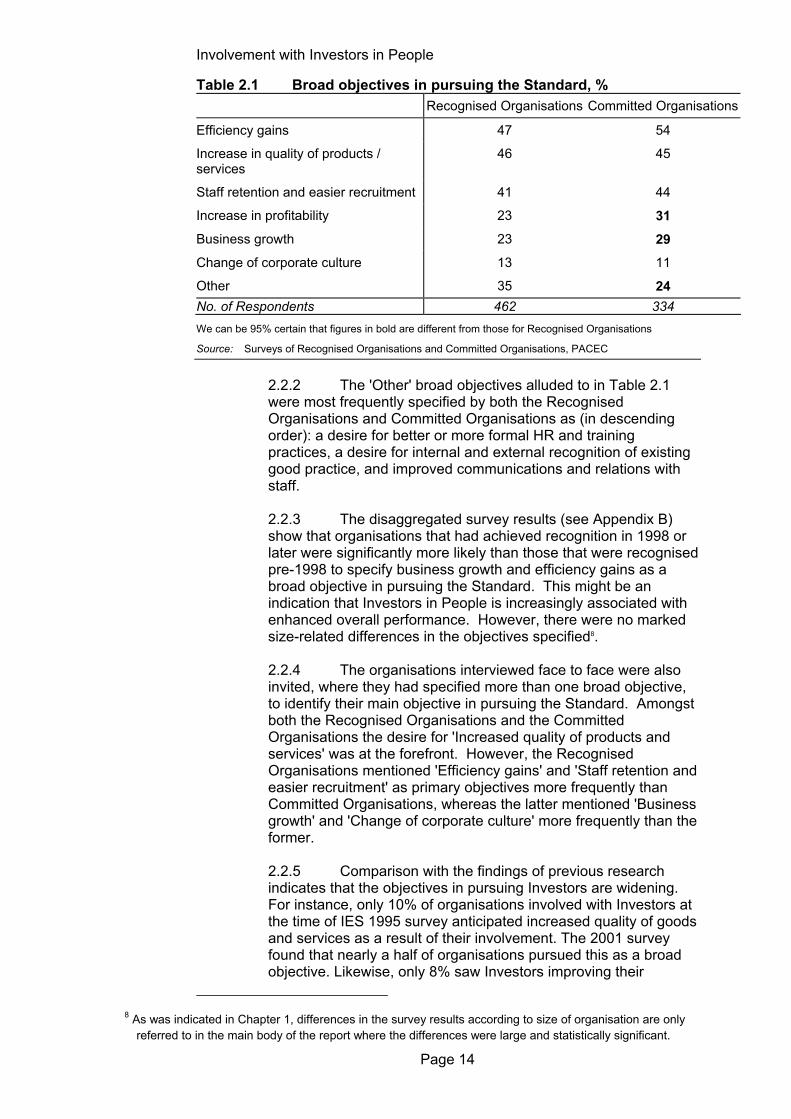
2.2.1 The Recognised Organisations and Committed Organisations had a similar set of broad objectives in pursuing the Standard. As Table 2.1 shows, both groups implicitly ranked 'Efficiency gains', 'Increased quality products and services' and 'Staff retention and easier recruitment' as their top three objectives, some way ahead of the business performance indicators listed. The Committed Organisations were statistically significantly more likely than the Recognised Organisations to specify business performance objectives, but the differences were not great.
7 Principally “The Return on Investors”. Institute for Employment Studies (IES), Report 314. 1996.
Involvement with Investors in People
Page 14
Table 2.1 Broad objectives in pursuing the Standard, % Recognised Organisations Committed Organisations
Efficiency gains 47 54
Increase in quality of products / services
46 45
Staff retention and easier recruitment 41 44
Increase in profitability 23 31 Business growth 23 29 Change of corporate culture 13 11
Other 35 24 No. of Respondents 462 334 We can be 95% certain that figures in bold are different from those for Recognised Organisations
Source: Surveys of Recognised Organisations and Committed Organisations, PACEC
2.2.2 The 'Other' broad objectives alluded to in Table 2.1 were most frequently specified by both the Recognised Organisations and Committed Organisations as (in descending order): a desire for better or more formal HR and training practices, a desire for internal and external recognition of existing good practice, and improved communications and relations with staff. 2.2.3 The disaggregated survey results (see Appendix B) show that organisations that had achieved recognition in 1998 or later were significantly more likely than those that were recognised pre-1998 to specify business growth and efficiency gains as a broad objective in pursuing the Standard. This might be an indication that Investors in People is increasingly associated with enhanced overall performance. However, there were no marked size-related differences in the objectives specified8. 2.2.4 The organisations interviewed face to face were also invited, where they had specified more than one broad objective, to identify their main objective in pursuing the Standard. Amongst both the Recognised Organisations and the Committed Organisations the desire for 'Increased quality of products and services' was at the forefront. However, the Recognised Organisations mentioned 'Efficiency gains' and 'Staff retention and easier recruitment' as primary objectives more frequently than Committed Organisations, whereas the latter mentioned 'Business growth' and 'Change of corporate culture' more frequently than the former. 2.2.5 Comparison with the findings of previous research indicates that the objectives in pursuing Investors are widening. For instance, only 10% of organisations involved with Investors at the time of IES 1995 survey anticipated increased quality of goods and services as a result of their involvement. The 2001 survey found that nearly a half of organisations pursued this as a broad objective. Likewise, only 8% saw Investors improving their
8 As was indicated in Chapter 1, differences in the survey results according to size of organisation are only
referred to in the main body of the report where the differences were large and statistically significant.

Involvement with Investors in People
Page 15
financial performance in 1995, compared with 25-30% that now see Investors as a means to increased profitability and/or business growth. Conversely, relatively few mentioned improved training practices as a broad objective in 2001 whereas in 1995 "improved training system" was regarded as the most important anticipated benefit (mentioned by a third of those involved). 2.2.6 These findings indicate that Investors has become embedded within organisations' wider product and financial strategies, beyond the HR function.
2.3. Barriers to best practice in HR management
2.3.1. When they were asked what had prevented them from implementing best practices in human resources management before they became a Recognised or Committed Organisation, small majorities of both groups indicated that there were no particular barriers and that they already pursued best practice (Table 2.2). Indeed, the most frequently mentioned barrier (lack of time) was mentioned by only 6% of Recognised Organisations and 10% of Committed Organisations. However, the face to face interviews (which provided better opportunities for probing and considered responses) found that the most significant barriers were conservatism / traditionalism / reluctance to change (amongst the Recognised Organisations) and a lack of time or a lack of understanding / knowledge of HR management (amongst the Committed Organisations).
Table 2.2 Barriers to implementation of best HR practices before achieving or committing to the Standard, % Recognised
Organisations Committed
Organisations
Lack of time 6 10 Conservatism / traditionalism / reluctance to change
4 2
Lack of understanding / knowledge of HR mgt. 4 5
Cost / finance generally 3 5
Lack of awareness of Investors in People 3 5
Lack of skill 2 2
Lack of external advice and support 2 1
Risks involved 1 0
Unaware of financial support from local TEC / BL 1 0
Other 7 4 None - already pursued best practice 59 51 None- other 5 4
Don't know 15 20 No. of Respondents 563 349 We can be 95% certain that figures in bold are different from those for Recognised Organisations
Source: Surveys of Recognised Organisations and Committed Organisations, PACEC
Involvement with Investors in People
Page 16
2.4. Financial and other support received in pursuing the Standard
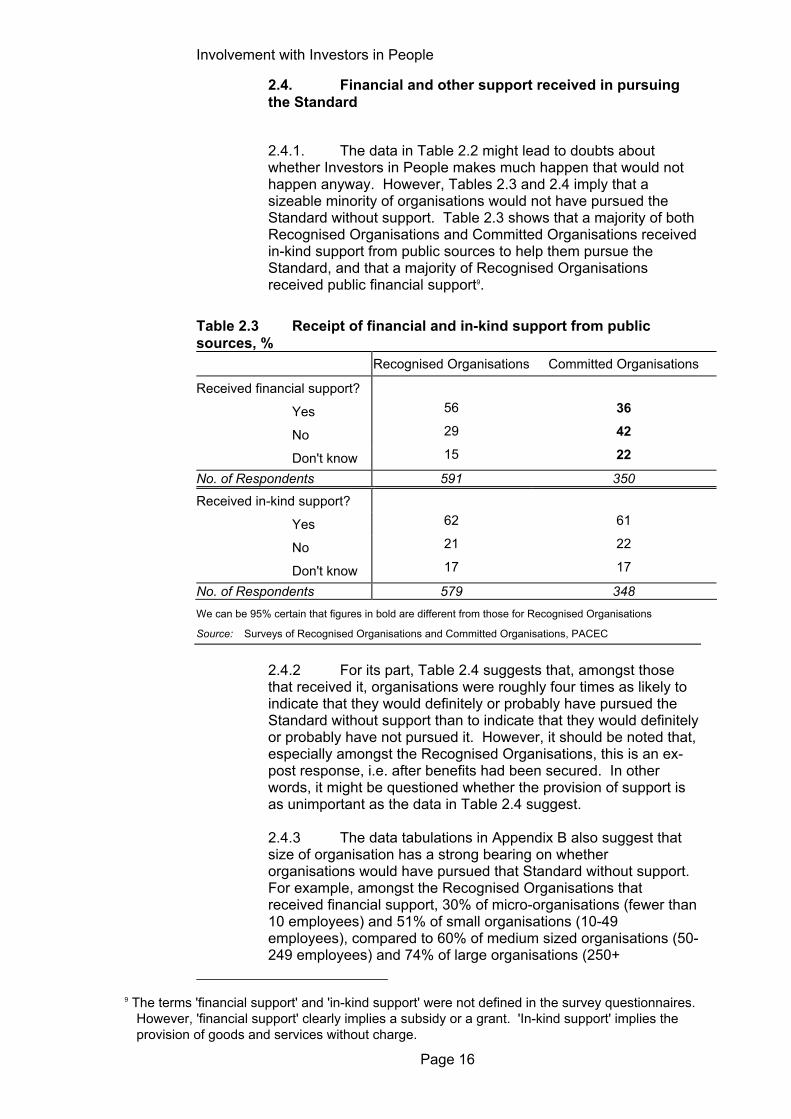
2.4.1. The data in Table 2.2 might lead to doubts about whether Investors in People makes much happen that would not happen anyway. However, Tables 2.3 and 2.4 imply that a sizeable minority of organisations would not have pursued the Standard without support. Table 2.3 shows that a majority of both Recognised Organisations and Committed Organisations received in-kind support from public sources to help them pursue the Standard, and that a majority of Recognised Organisations received public financial support9.
Table 2.3 Receipt of financial and in-kind support from public sources, % Recognised Organisations Committed Organisations
Received financial support?
Yes 56 36
No 29 42
Don't know 15 22
No. of Respondents 591 350 Received in-kind support?
Yes 62 61
No 21 22
Don't know 17 17
No. of Respondents 579 348 We can be 95% certain that figures in bold are different from those for Recognised Organisations
Source: Surveys of Recognised Organisations and Committed Organisations, PACEC
2.4.2 For its part, Table 2.4 suggests that, amongst those that received it, organisations were roughly four times as likely to indicate that they would definitely or probably have pursued the Standard without support than to indicate that they would definitely or probably have not pursued it. However, it should be noted that, especially amongst the Recognised Organisations, this is an ex-post response, i.e. after benefits had been secured. In other words, it might be questioned whether the provision of support is as unimportant as the data in Table 2.4 suggest. 2.4.3 The data tabulations in Appendix B also suggest that size of organisation has a strong bearing on whether organisations would have pursued that Standard without support. For example, amongst the Recognised Organisations that received financial support, 30% of micro-organisations (fewer than 10 employees) and 51% of small organisations (10-49 employees), compared to 60% of medium sized organisations (50-249 employees) and 74% of large organisations (250+
9 The terms 'financial support' and 'in-kind support' were not defined in the survey questionnaires.
However, 'financial support' clearly implies a subsidy or a grant. 'In-kind support' implies the provision of goods and services without charge.

Involvement with Investors in People
Page 17
employees), indicated that they would definitely or probably have pursued the Standard anyway. The findings for the Recognised Organisations in relation to in-kind support showed a similarly strong size correlation. However, the responses of the Committed Organisations did not appear to be influenced in the same way.
Table 2.4 Effect of support on the pursuit of the Standard, (% organisations which received support) Recognised Organisations Committed Organisations
Would have pursued Standard
without financial support?
Definitely 20 27
Probably 36 35
Possibly 29 26
Probably not 13 12
Definitely not 2 0 No. of Respondents 315 113 Would have pursued
Standard without in-kind support?
Definitely 20 20
Probably 41 41
Possibly 24 26
Probably not 12 11
Definitely not 3 2 No. of Respondents 339 197 Source: Surveys of Recognised Organisations and Committed Organisations, PACEC
2.5. Awareness and understanding of Investors in People amongst Non-Investors
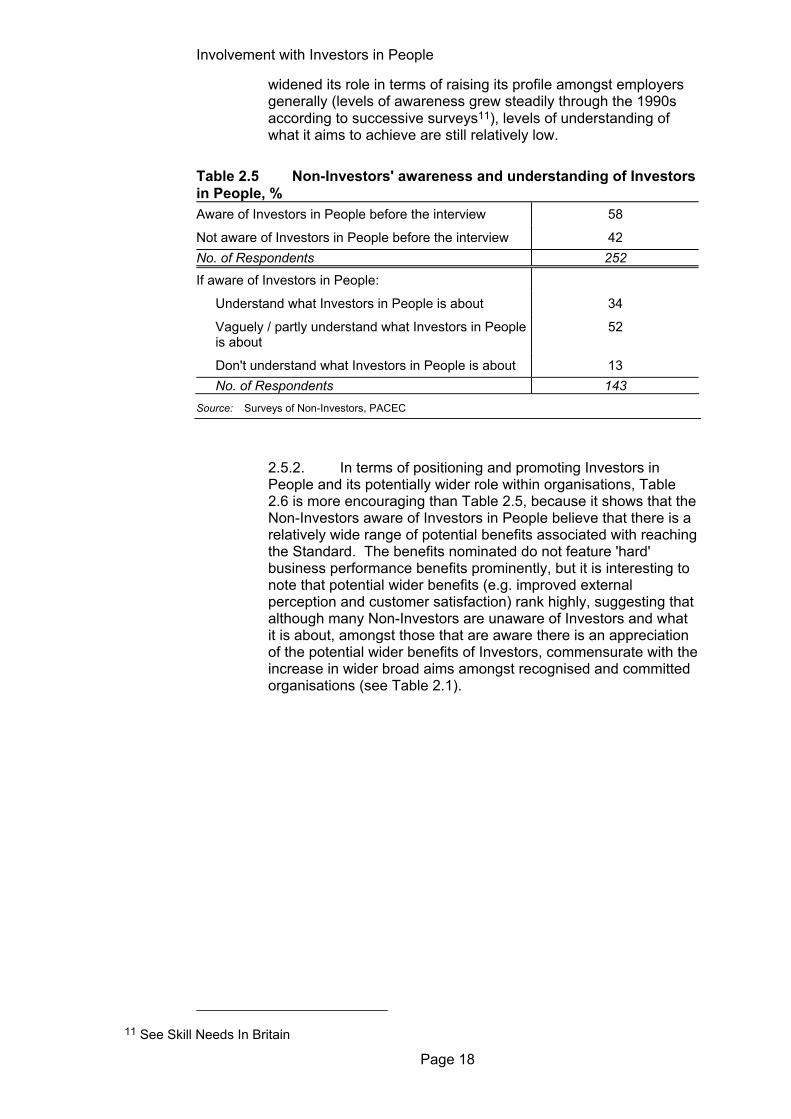
2.5.1. In terms of increasing the penetration of the Standard amongst non-Investors, Table 2.5 includes an important finding from the current research, in that it highlights that there are considerable obstacles to the increased uptake of the Standard, and therefore of widening its role. In particular, it shows not only that around 40% of the Non-Investors interviewed were previously unaware of Investors in People, but also that only one third of those aware of Investors in People claimed to understand what it is about10. In other words, the table implies that only 20% of Non-Investors are aware of the Standard and understand it. The other 80% have either not heard of Investors in People or do not understand it well, or at all. Thus, while Investors seems to have
10 The 1998 Skill Needs in Britain report found that 76% of organisations surveyed were aware of
the Standard. However, this included only organisations with more than 25 employees, whereas half of the non-Investor organisations surveyed for the current research had fewer than this number.
Involvement with Investors in People
Page 18
widened its role in terms of raising its profile amongst employers generally (levels of awareness grew steadily through the 1990s according to successive surveys11), levels of understanding of what it aims to achieve are still relatively low.
Table 2.5 Non-Investors' awareness and understanding of Investors in People, % Aware of Investors in People before the interview 58
Not aware of Investors in People before the interview 42 No. of Respondents 252 If aware of Investors in People:
Understand what Investors in People is about 34
Vaguely / partly understand what Investors in People is about
52
Don't understand what Investors in People is about 13 No. of Respondents 143
Source: Surveys of Non-Investors, PACEC
2.5.2. In terms of positioning and promoting Investors in People and its potentially wider role within organisations, Table 2.6 is more encouraging than Table 2.5, because it shows that the Non-Investors aware of Investors in People believe that there is a relatively wide range of potential benefits associated with reaching the Standard. The benefits nominated do not feature 'hard' business performance benefits prominently, but it is interesting to note that potential wider benefits (e.g. improved external perception and customer satisfaction) rank highly, suggesting that although many Non-Investors are unaware of Investors and what it is about, amongst those that are aware there is an appreciation of the potential wider benefits of Investors, commensurate with the increase in wider broad aims amongst recognised and committed organisations (see Table 2.1).
11 See Skill Needs In Britain

Involvement with Investors in People
Page 19
Table 2.6 Non-Investors' perceptions of the potential benefits from achieving the Standard, (% of Non-Investors aware)
More effective training and development 31
Improved external perception of the organisation 23
Improved customer satisfaction 22
Improved recruitment and retention of staff 21
Improved quality of products / services 19
More formal HR / personnel systems 15
Improved business growth or performance 14
More business development opportunities 5
Improved productivity 5
Other 9 No. of Respondents 149 Source: Surveys of Non-Investors, PACEC
2.6. Barriers to involvement
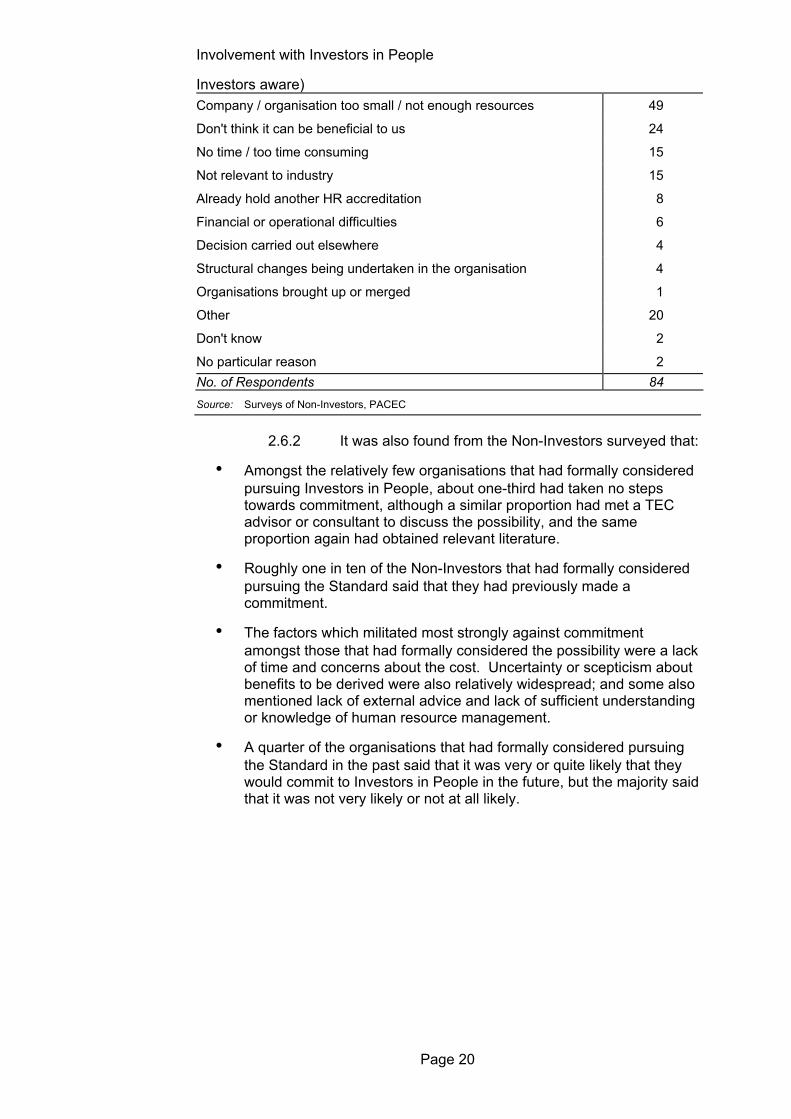
2.6.1. As Table 2.7 shows, roughly one in six Non-Investors aware of Investors in People said that they had formally considered pursuing the Standard12, but nearly twice as many did not know whether they had considered the issue or not. Table 2.8 reveals that, amongst the majority who said that they had not formally considered pursuing Investors in People, the chief reason was the belief that the company / organisation was too small and / or lacked the resources. Of greater concern perhaps, a substantial minority indicated that they believed there would be no benefits. Thus although Non-Investors seem to be aware of the potentially wide range of benefits (see 2.5.2), many are not convinced enough to translate this into behaviour.
Table 2.7 Non-Investors who have formally considered pursuing the Standard, % (Non-Investors aware of Investors in People) Yes, considered pursuing Investors in People 16
No, have not considered pursuing Investors in People 55
Don't know 29 No. of Respondents 148 Source: Surveys of Non-Investors, PACEC
Table 2.8 Reasons for not considering Investors in People, % (Non-
12 The 1998 Skills Needs in Britain report showed the same proportion.
Involvement with Investors in People
Page 20
Investors aware) Company / organisation too small / not enough resources 49
Don't think it can be beneficial to us 24
No time / too time consuming 15
Not relevant to industry 15
Already hold another HR accreditation 8
Financial or operational difficulties 6
Decision carried out elsewhere 4
Structural changes being undertaken in the organisation 4
Organisations brought up or merged 1
Other 20
Don't know 2
No particular reason 2 No. of Respondents 84 Source: Surveys of Non-Investors, PACEC
2.6.2 It was also found from the Non-Investors surveyed that:
• Amongst the relatively few organisations that had formally considered pursuing Investors in People, about one-third had taken no steps towards commitment, although a similar proportion had met a TEC advisor or consultant to discuss the possibility, and the same proportion again had obtained relevant literature.
• Roughly one in ten of the Non-Investors that had formally considered pursuing the Standard said that they had previously made a commitment.
• The factors which militated most strongly against commitment amongst those that had formally considered the possibility were a lack of time and concerns about the cost. Uncertainty or scepticism about benefits to be derived were also relatively widespread; and some also mentioned lack of external advice and lack of sufficient understanding or knowledge of human resource management.
• A quarter of the organisations that had formally considered pursuing the Standard in the past said that it was very or quite likely that they would commit to Investors in People in the future, but the majority said that it was not very likely or not at all likely.

Involvement with Investors in People
Page 21
Summary of key findings
• Amongst both Recognised and Committed Organisations, the main objectives in pursuing the Standard were 'Efficiency gains', 'Increased quality products and services' and 'Staff retention and easier recruitment' (Table 2.1). Comparison with the findings of previous research indicates that the objectives in pursuing Investors are widening i.e Investors in People has assumed a wider role within organisations in recent years.
• Many Recognised and Committed Organisations indicated that they faced no particular barriers to the implementation of HR best practices before their involvement in Investors in People; and that they already pursued best practice. The most frequently mentioned barrier (lack of time) was mentioned by only 6% of Recognised Organisations and 10% of Committed Organisations (Table 2.2).
• A majority of both Recognised Organisations and Committed Organisations received financial or in-kind support from public sources to help them pursue the Standard. Many organisations suggested that they would have pursued the Standard anyway without this support, but support is important to smaller organisations (Tables 2.3 and 2.4, Paragraph 2.4.3).
• Nearly half of the Non-Investors surveyed were previously unaware of Investors in People, and only one fifth claimed to understand what it is about (Table 2.5).
• Although Non-Investors who are aware of Investors in People believe that there is a wide range of benefits associated with reaching the Standard, few have formally considered committing (Tables 2.6 and 2.7).
• The principal reason for not committing was the belief that the company / organisation was too small and / or lacked the resources. A minority indicated believed there would be no benefits (Table 2.8).
• Amongst those who had considered, but decided against, committing to the Standard, the main concerns were lack of time and concerns about the cost. Uncertainty or scepticism about benefits to be derived were also relatively widespread (Paragraph 2.6.1).

Page 22
3. Intermediate Effects of Investors in People
3.1. Introduction
3.1.1. Chapter 2 showed what objectives Recognised and Committed Organisations had in pursuing the Investors in People standard. It was shown that these were relatively wide compared to the objectives of organisations of a few years ago. This chapter starts by reporting the extent to which these objectives were, or have been, satisfied (and by implication, whether the wider objectives of recent years have been realised). It then examines whether, and in what ways, Recognised and Committed Organisations' human resource plans, systems, practices and processes have been affected. The durability and additionality of effects, regarded as 'wider benefits' as part of this research, are then considered. Lastly, it explores the impacts of the Standard on organisations' cash expenditure on, and other resource inputs to, HR development.
3.2. Achievement of objectives in participating
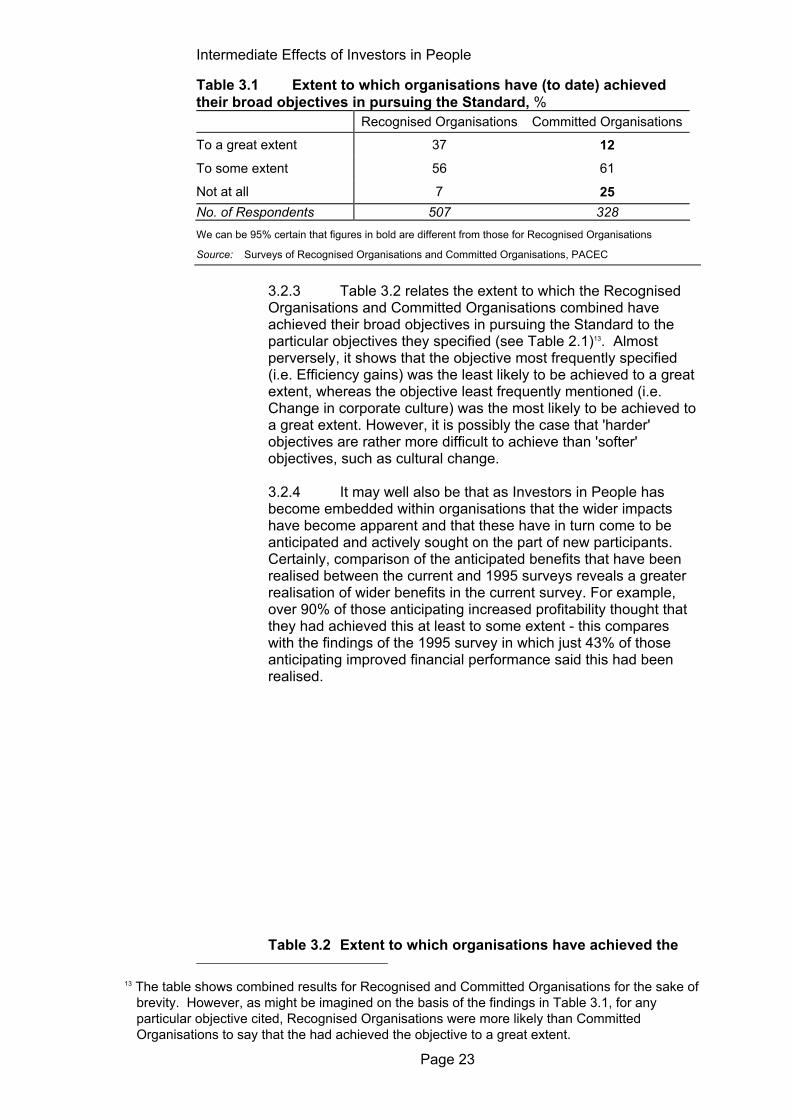
3.2.1. Table 3.1 reveals an interesting contrast between Recognised Organisations and Committed Organisations in terms of the extent to which they have achieved their objectives in pursuing the Investors in People Standard. The majority amongst both groups said that they had achieved their objectives to some extent. However, whereas more than five times as many Recognised Organisations said that they had achieved their objectives to a great extent as said they had not achieved their objectives at all, more of the Committed Organisations said they had not achieved their objectives at all (to date) than said they had achieved them to a great extent.
3.2.2 It is likely that the situation will change amongst the Committed Organisations surveyed as they get nearer to reaching the Standard. Nonetheless, it is possible that a significant proportion will never achieve their objectives fully, especially if (for the sorts of reasons to be examined in Chapter 7) they cease to make progress, or make only slow progress, towards the Standard. These findings suggest either that the wider objectives of the sort sought by organisations take longer to accrue and that they are more difficult to attain without pursuing full accreditation
Intermediate Effects of Investors in People
Page 23
Table 3.1 Extent to which organisations have (to date) achieved their broad objectives in pursuing the Standard, % Recognised Organisations Committed Organisations
To a great extent 37 12 To some extent 56 61
Not at all 7 25 No. of Respondents 507 328 We can be 95% certain that figures in bold are different from those for Recognised Organisations
Source: Surveys of Recognised Organisations and Committed Organisations, PACEC
3.2.3 Table 3.2 relates the extent to which the Recognised Organisations and Committed Organisations combined have achieved their broad objectives in pursuing the Standard to the particular objectives they specified (see Table 2.1)13. Almost perversely, it shows that the objective most frequently specified (i.e. Efficiency gains) was the least likely to be achieved to a great extent, whereas the objective least frequently mentioned (i.e. Change in corporate culture) was the most likely to be achieved to a great extent. However, it is possibly the case that 'harder' objectives are rather more difficult to achieve than 'softer' objectives, such as cultural change. 3.2.4 It may well also be that as Investors in People has become embedded within organisations that the wider impacts have become apparent and that these have in turn come to be anticipated and actively sought on the part of new participants. Certainly, comparison of the anticipated benefits that have been realised between the current and 1995 surveys reveals a greater realisation of wider benefits in the current survey. For example, over 90% of those anticipating increased profitability thought that they had achieved this at least to some extent - this compares with the findings of the 1995 survey in which just 43% of those anticipating improved financial performance said this had been realised. Table 3.2 Extent to which organisations have achieved the
13 The table shows combined results for Recognised and Committed Organisations for the sake of
brevity. However, as might be imagined on the basis of the findings in Table 3.1, for any particular objective cited, Recognised Organisations were more likely than Committed Organisations to say that the had achieved the objective to a great extent.

Intermediate Effects of Investors in People
Page 24
objectives they stated, (% of Recognised and Committed Organisations combined - see footnote)
Proportion
of which, proportion saying objective has been satisfied ...
Objective:
citing objective
... to a great extent
... to some extent
... not at all
Efficiency gains 50 17 74 9
Increase in quality of products / services
46 25 67 7
Staff retention and easier recruitment 42 28 62 10
Business growth 26 26 68 6
Increase in profitability 26 18 74 7
Change in corporate culture 12 42 52 6
All objectives 100 27 58 14 No. of Respondents 835 Source: Surveys of Recognised Organisations and Committed Organisations, PACEC
3.2.5 Nearly two-thirds of the Recognised Organisations surveyed (63%) said that they had evaluated the impact that Investors in People has had on the way in which they operated and performed. However, even during the course of face-to-face interviews relatively few of the Recognised Organisations (i.e. fewer than four in ten) could describe what the impacts had been. Nonetheless, some of the impacts on operations and performance reported were:
"Staff turnover down / Improved staff satisfaction" "Help with business growth / stability" "Better internal and external communications" "Improvement in customer satisfaction" "More business development opportunities" "Increased efficiency" "Improved image" "More structured approach to training and development" "Improved products / services".
3.2.6 All of the Recognised and Committed Organisations were then invited to indicate the extent to which they had felt they had achieved each of a specified set of possible effects of reaching or working towards the Standard. Their responses are summarised in Table 3.3 and, not unsurprisingly, it shows that the Recognised Organisations were more likely than the Committed Organisations to acknowledge a great or fair effect in every case.
Table 3.3 Extent to which Investors in People has affected

Intermediate Effects of Investors in People
Page 25
organisations to date, % saying they have been affected in the ways shown to a great or fair extent Recognised
OrganisationsCommitted
Organisations
More effective training and development 62 50 Improved external perception of the organisation
58 40
Improved recruitment and retention of staff 56 30 Improved quality of products and services 53 34 More formal HR / personnel systems 50 48 Improved customer satisfaction 50 24 Improved productivity 47 26 Improved business growth and performance 45 26 Improved business development opportunities 43 25 No. of Respondents 505 215 We can be 95% certain that figures in bold are different from those for Recognised Organisations
Source: Surveys of Recognised Organisations and Committed Organisations, PACEC
3.2.7 Interestingly, there appears to be a strong relationship between organisations' broad objectives in pursuing the Standard (see Table 2.1) and the extent to which they had experienced the effects shown in Table 3.3. Thus, the proportion of Recognised Organisations saying that the effects shown in Table 3.3 had happened to a great or fair extent was always larger amongst organisations that specified 'change in corporate culture' as a broad objective in pursuing the Standard than amongst organisations specifying any other broad objective. Precisely the opposite was true of organisations that had specified 'efficiency gains' as a broad objective. 3.2.8 Unfortunately, however, this finding does not have a clear interpretation, although it will be recalled from Table 3.2 that 'change in corporate culture' and 'efficiency gains' were at opposite ends of the scale in terms of the extent to which they had been satisfied as broad objectives. This might mean that satisfaction of broad objectives was equated with the experience of a wide range of intermediate effects, whereas failure to satisfy broad objectives was equated with the absence of effects. Or it may be that some broad objectives may not be associated with such intermediate effects. One would also have to take into account the 'starting point' of organisations pursuing particular objectives. Clearly, the relationship between cause and effect here is difficult to disentangle. 3.2.9 Another interesting feature of Table 3.3 is that it strongly suggests that some effects are felt earlier than others along the road to achieving the Standard. Amongst the Recognised Organisations the proportion of respondents saying that they had been affected to a great or fair extent did not vary substantially according to type of effect. However, there was more clear variation according to type of effect amongst the Committed Organisations (who committed to the Standard at

Intermediate Effects of Investors in People
Page 26
different dates and who are likely to have made differing progress). Thus, the Table suggests that more formal HR and personnel systems and more effective training and development are relatively early stage effects, whereas wider benefits such as improved business performance and improved client satisfaction come later.
3.3. Effects on Recognised Organisations' HR management and practices
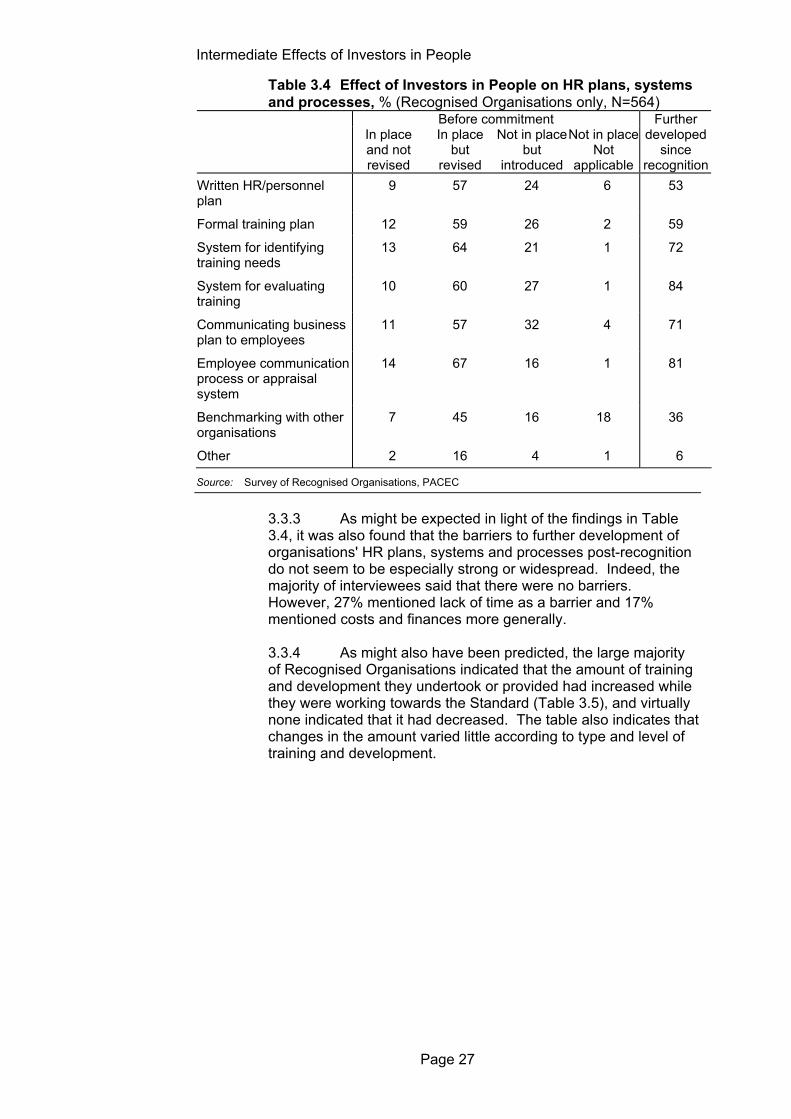
3.3.1. Table 3.4 provides an especially clear view of the added value associated with Investors in People. The second column of numbers, for example, shows that just over half of the Recognised Organisations surveyed had a written HR or personnel plan in place before commitment, but then revised it. The third column shows that nearly a quarter of Recognised Organisations did not previously have a written HR or personnel plan of any kind before commitment, but then introduced one.
3.3.2 The final column shows that over half of the Recognised Organisations have further developed their HR or personnel plans since achieving the Standard, indicating that recognition has stimulated ongoing change within organisations, regarded as a 'wider benefit' of Investors in People for purposes of the current research. Overall, the table indicates that Investors in People has a profound across-the-board impact on organisations' HR plans, systems and processes. Appendix B also shows that micro- and small organisations (i.e. with fewer than 50 employees) were more likely than medium and large organisations to say that they did not have HR plans, systems and processes in place before their involvement with Investors in People, but that they introduced them as a result.
Intermediate Effects of Investors in People
Page 27
Table 3.4 Effect of Investors in People on HR plans, systems and processes, % (Recognised Organisations only, N=564)
Before commitment Further In place
and not revised
In place but
revised
Not in place but
introduced
Not in place Not
applicable
developed since
recognition Written HR/personnel plan
9 57 24 6 53
Formal training plan 12 59 26 2 59
System for identifying training needs
13 64 21 1 72
System for evaluating training
10 60 27 1 84
Communicating business plan to employees
11 57 32 4 71
Employee communication process or appraisal system
14 67 16 1 81
Benchmarking with other organisations
7 45 16 18 36
Other 2 16 4 1 6
Source: Survey of Recognised Organisations, PACEC
3.3.3 As might be expected in light of the findings in Table 3.4, it was also found that the barriers to further development of organisations' HR plans, systems and processes post-recognition do not seem to be especially strong or widespread. Indeed, the majority of interviewees said that there were no barriers. However, 27% mentioned lack of time as a barrier and 17% mentioned costs and finances more generally. 3.3.4 As might also have been predicted, the large majority of Recognised Organisations indicated that the amount of training and development they undertook or provided had increased while they were working towards the Standard (Table 3.5), and virtually none indicated that it had decreased. The table also indicates that changes in the amount varied little according to type and level of training and development.

Intermediate Effects of Investors in People
Page 28
Table 3.5 Effects of working towards the Standard on amounts of training and development, % (Recognised Organisations only, N=554) Amount of:
Increased substantially
Increased slightly
No change
Decreased slightly
Decreased substantially
Training & development overall 28 45 27 1 0
Management training & development
25 43 30 1 0
Non-mgt. training & development 26 45 28 1 1
On-the-job training & development 27 44 28 0 0
Off-the-job training & development 25 44 30 1 0
Source: Survey of Recognised Organisations, PACEC
3.3.5 Table 3.6 also represents a key finding with respect to the wider role and benefits of Investors in People, in that it indicates that the effects and impacts on Recognised Organisations, as outlined earlier in this chapter, have often accumulated and have rarely faded.
Table 3.6 Changes in effects and impacts since recognition, % of Recognised Organisations acknowledging effects and impacts Effects and impacts have accumulated 39
Effects and impacts have stayed the same 46
Effects and impacts have faded 5
Don't know / not sure 10 No. of Respondents 556 Source: Survey of Recognised Organisations, PACEC
3.4. Effects on Committed Organisations' HR management and practices
3.4.1. Table 3.7 shows the effect of Investors in People on Committed Organisations' HR plans, systems and processes to date. The table is directly comparable to Table 3.4, and the comparison shows that there are few significant differences between the Committed Organisations and Recognised Organisations in terms of the frequency with which they reported effects. This tends to confirm the earlier conclusion (see paragraph 3.2.6) that impacts on organisations' systems and activities associated with Investors in People tend to be felt relatively soon after commitment. In contrast with the findings for Recognised Organisations, the effects of involvement in Investors in People on Committed Organisations' HR plans, systems and processes did not appear to be clearly size-related.

Intermediate Effects of Investors in People
Page 29
Table 3.7 Effect of Investors in People on HR plans, systems and processes, % (Committed Organisations only, N=276) In place
and not revised
In place but revised
Not in place but
introduced
Not in place Not
applicable
Written HR/personnel plan 10 52 30 7
Formal training plan 11 56 26 5
System for identifying training needs
11 64 21 4
System for evaluating training
10 59 26 5
Communicating business plan to employees
10 56 28 5
Employee communication process or appraisal system
12 71 14 4
Benchmarking with other organisations
7 40 11 33
Other 1 3 1 2
We can be 95% certain that figures in bold are different from the equivalent for Recognised Organisations
Source: Survey of Committed Organisations, PACEC
3.5. HR practices in Non-investor organisations
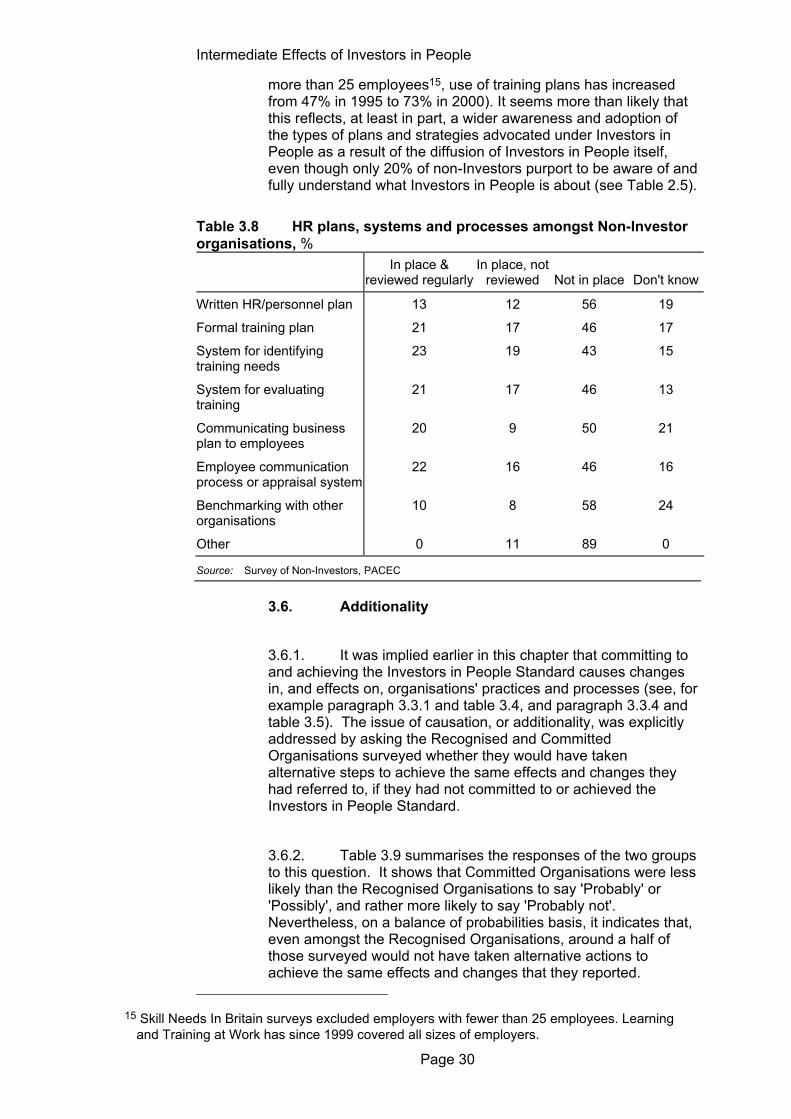
3.5.1. Table 3.8, showing the extent to which Non-Investors have HR plans, systems and processes, and whether they review them, should be compared with the similar tables for Recognised Organisations (Table 3.4) and Committed Organisations (Table 3.7). The comparison reveals that Non-Investors are much less likely than Recognised Organisations and Committed Organisations to say that they have particular plans, systems and processes in place. For example, less than half of the Non-Investors have written HR / personnel plans, but more than 90% of both Recognised Organisations and Committed Organisations have them. Similarly, fewer than half of the Non-Investors, but virtually all of the Recognised and Committed Organisations, have systems for evaluating training. Overall, it is clear that Non-Investors are rather less formal than Recognised Organisations and Committed Organisations in their management of human resources (if they manage them at all).
3.5.2 A key question relates to the extent to which the adoption and use of HR plans etc. have come about as a result of increasing awareness of HR practices and/or competition with Investors in People organisations. Comparison with previous surveys on Investors and non-Investors specifically is difficult and the only evidence is from successive surveys of employers generally14. These show large increases in the use of written training plans and training budgets amongst employers generally between 1995 and 2001 ( for example, amongst employers with
14 See for example, ‘Skill Needs In Britain 1995’. Public Attitude Surveys 1995 and ‘Learning and
Training At Work 2000’. IFF Research Ltd. 2001.
Intermediate Effects of Investors in People
Page 30
more than 25 employees15, use of training plans has increased from 47% in 1995 to 73% in 2000). It seems more than likely that this reflects, at least in part, a wider awareness and adoption of the types of plans and strategies advocated under Investors in People as a result of the diffusion of Investors in People itself, even though only 20% of non-Investors purport to be aware of and fully understand what Investors in People is about (see Table 2.5).
Table 3.8 HR plans, systems and processes amongst Non-Investor organisations, % In place &
reviewed regularly In place, not
reviewed
Not in place
Don't know
Written HR/personnel plan 13 12 56 19
Formal training plan 21 17 46 17
System for identifying training needs
23 19 43 15
System for evaluating training
21 17 46 13
Communicating business plan to employees
20 9 50 21
Employee communication process or appraisal system
22 16 46 16
Benchmarking with other organisations
10 8 58 24
Other 0 11 89 0
Source: Survey of Non-Investors, PACEC
3.6. Additionality
3.6.1. It was implied earlier in this chapter that committing to and achieving the Investors in People Standard causes changes in, and effects on, organisations' practices and processes (see, for example paragraph 3.3.1 and table 3.4, and paragraph 3.3.4 and table 3.5). The issue of causation, or additionality, was explicitly addressed by asking the Recognised and Committed Organisations surveyed whether they would have taken alternative steps to achieve the same effects and changes they had referred to, if they had not committed to or achieved the Investors in People Standard.
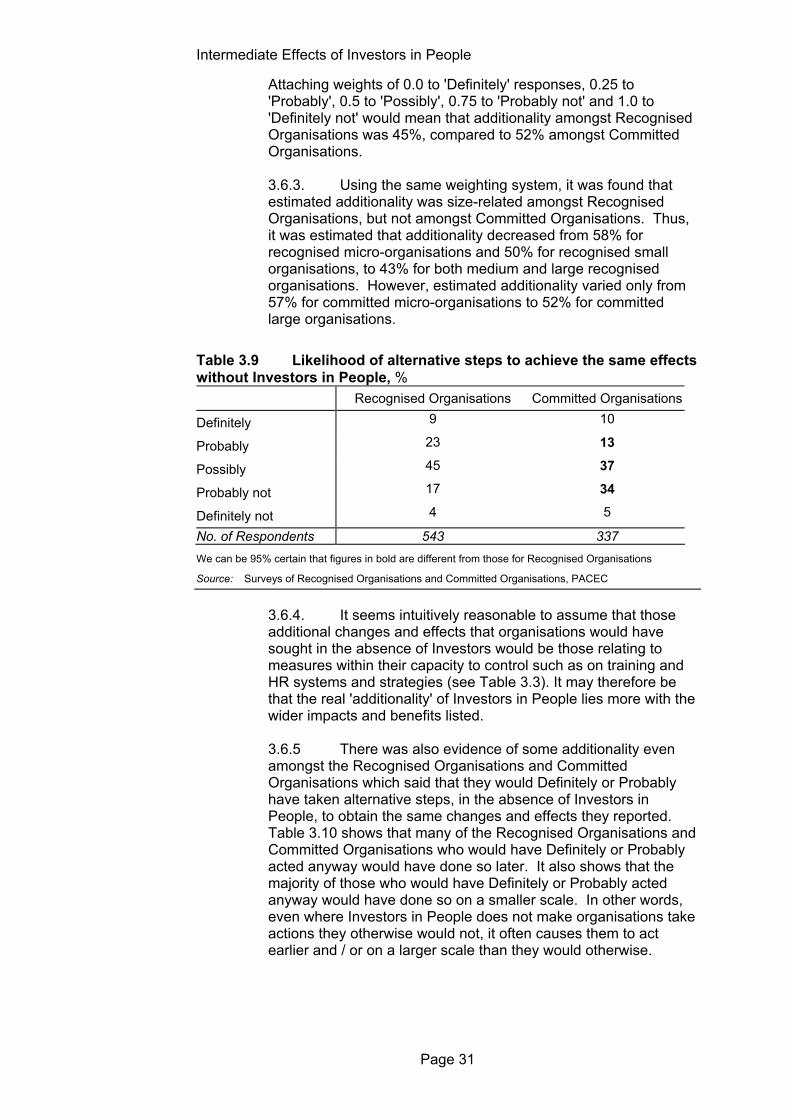
3.6.2. Table 3.9 summarises the responses of the two groups to this question. It shows that Committed Organisations were less likely than the Recognised Organisations to say 'Probably' or 'Possibly', and rather more likely to say 'Probably not'. Nevertheless, on a balance of probabilities basis, it indicates that, even amongst the Recognised Organisations, around a half of those surveyed would not have taken alternative actions to achieve the same effects and changes that they reported.
15 Skill Needs In Britain surveys excluded employers with fewer than 25 employees. Learning
and Training at Work has since 1999 covered all sizes of employers.
Intermediate Effects of Investors in People
Page 31
Attaching weights of 0.0 to 'Definitely' responses, 0.25 to 'Probably', 0.5 to 'Possibly', 0.75 to 'Probably not' and 1.0 to 'Definitely not' would mean that additionality amongst Recognised Organisations was 45%, compared to 52% amongst Committed Organisations. 3.6.3. Using the same weighting system, it was found that estimated additionality was size-related amongst Recognised Organisations, but not amongst Committed Organisations. Thus, it was estimated that additionality decreased from 58% for recognised micro-organisations and 50% for recognised small organisations, to 43% for both medium and large recognised organisations. However, estimated additionality varied only from 57% for committed micro-organisations to 52% for committed large organisations.
Table 3.9 Likelihood of alternative steps to achieve the same effects without Investors in People, % Recognised Organisations Committed Organisations
Definitely 9 10
Probably 23 13
Possibly 45 37
Probably not 17 34
Definitely not 4 5
No. of Respondents 543 337 We can be 95% certain that figures in bold are different from those for Recognised Organisations
Source: Surveys of Recognised Organisations and Committed Organisations, PACEC
3.6.4. It seems intuitively reasonable to assume that those additional changes and effects that organisations would have sought in the absence of Investors would be those relating to measures within their capacity to control such as on training and HR systems and strategies (see Table 3.3). It may therefore be that the real 'additionality' of Investors in People lies more with the wider impacts and benefits listed. 3.6.5 There was also evidence of some additionality even amongst the Recognised Organisations and Committed Organisations which said that they would Definitely or Probably have taken alternative steps, in the absence of Investors in People, to obtain the same changes and effects they reported. Table 3.10 shows that many of the Recognised Organisations and Committed Organisations who would have Definitely or Probably acted anyway would have done so later. It also shows that the majority of those who would have Definitely or Probably acted anyway would have done so on a smaller scale. In other words, even where Investors in People does not make organisations take actions they otherwise would not, it often causes them to act earlier and / or on a larger scale than they would otherwise.

Intermediate Effects of Investors in People
Page 32
Table 3.10 Likely timing and scale of alternative steps (% of respondents who would definitely or probably have taken alternative steps) Recognised
Organisations Committed
Organisations In the absence of Investors, alternative steps would have been taken:
sooner 2 10 later 38 41
at the same time 59 49 No. of Respondents 133 68 In the absence of Investors, alternative steps would have been:
on a greater scale 4 0
on a smaller scale 64 74
no different 32 26 No. of Respondents 50 27 We can be 95% certain that figures in bold are different from those for Recognised Organisations
Source: Surveys of Recognised Organisations and Committed Organisations, PACEC
3.6.6 Furthermore, the Recognised and Committed Organisations which said that they would Definitely or Probably have taken alternative steps often gave unclear or unconvincing replies when they were asked to specify what the alternative steps would have been, as Table 3.11 indicates. It might be questioned, for example, whether those which said that they would have acted independently and alone to implement best practices and systems in HR would have been as steadfast and disciplined in their approach as working towards the Investors in People Standard actually requires.
Table 3.11 Likely alternative steps taken (% of respondents who would definitely or probably have taken alternative steps) Recognised
Organisations Committed
Organisations
Self-adoption of best practices / systems in HR 53 66
Would work towards other accreditation (eg: EFQM)
19 25
Would improve position with other accreditations 9 0
Would employ consultants to implement HR practices
2 3
Would recruit in HR / strengthen the HR team 2 0
Don't know / Not sure 19 9 No. of Respondents 58 32 Source: Surveys of Recognised Organisations and Committed Organisations, PACEC
3.6.7 It should be emphasised that an important implication of Tables 3.10 and 3.11 is that, even if organisations would really have taken alternative steps to obtain the same changes and effects they associated with Investors in People, these alternative steps would not necessarily have produced the same outputs as

Intermediate Effects of Investors in People
Page 33
Investors in People. This is because the alternative steps would often have been later and / or on a smaller scale than the steps actually taken in pursuit of the Investors in People standard, and because they would often have been taken in the absence of a framework for action.
3.7. Effects on internal resources
3.7.1. The opportunity was taken during the face to face interviews with Recognised Organisations and Committed Organisations to examine the effect of the Standard on the allocation of organisations' resources for HR development. Table 3.12 suggests that working towards the Standard has a widespread positive effect on the amount of management time spent on HR development and a lesser, but still positive, effect on the amount of cash expenditure. It was also found that much of the extra management time was spent on formalising, setting up and 'putting on paper' practices, processes and systems.
Table 3.12 Effect of working towards the Standard on resources for HR Development, % (Face to face interviews only) Recognised
Organisations Committed
Organisations Cash expenditure on HR development
Increased 43 61
No change 53 39
Decreased 4 0 No. of Respondents 98 56 Management time spent on HR development
Increased 74 79
No change 26 18
Decreased 0 4 No. Respondents 100 56 Other resource inputs for HR development
Increased 28 27
No change 72 69
Decreased 0 4 No. of Respondents 94 52 Source: Surveys of Recognised Organisations and Committed Organisations, PACEC
3.7.2. It was also found from the organisations interviewed face-to-face that there tends to be a decrease in management and other resource inputs into HR development, once the Standard has been reached. However, this is taken to signify that there is a reduced need for resource inputs following recognition, rather than a case of organisations resting on their laurels. The basis for this conclusion is that, as Table 3.4 made clear, the majority of Recognised Organisations continue to develop their HR plans, systems and processes after they have achieved the Standard.

Intermediate Effects of Investors in People
Page 34
Summary of key findings
• An overwhelming majority of Recognised Organisations and a large majority of Committed Organisations have achieved their broad objectives in pursuing the Investors in People standard at least to some extent (Table 3.1). However, it appears that 'hard' performance-related objectives, such as efficiency gains and increased profitability, are more difficult to achieve than 'softer' objectives, such as cultural change (Table 3.2)
• Comparison with earlier surveys suggests that wider benefits are
anticipated, sought and achieved more than was the case a few years ago (para. 3.2.4)
• The pursuit of the Standard affects organisations in a wide variety of ways, but it appears that some types of effect (e.g. more formal HR systems and more effective training and development) occur earlier than others e.g. improved business performance and client satisfaction (Table 3.3 and paragraph 3.2.9).
• Investors in People has a clear impact on organisations' HR management and practices, especially amongst organisations with fewer than 50 employees (Table 3.4 and paragraph 3.3.1).
• The effects and changes identified by Recognised Organisations tend to persist post-recognition, and they are more likely to accumulate than to fade (Table 3.6).
• Non-Investors are less formal in their HR management than both Recognised and Committed Organisations (Table 3.8). The increase in adoption of formal training plans, structures etc. across all organisations since the mid 1990s seems at least in part to have been due to the growing awareness of Investors in People (albeit that most non-Investors do not fully understand what Investors involves) (paragraph 3.5.2)
• The wider changes and effects associated with the pursuit of the Standard seem to be largely 'additional'. In the absence of the Investors in People framework, most organisations would not have taken alternative steps to achieve the same changes or effects, or they would have acted later and / or on a smaller scale, or they would have acted without a framework (Tables 3.9-3.11).
• Management and other resource inputs into HR development increase as organisations pursue the Standard (Table 3.12). They tend to decrease again once the Standard had been reached, but this is taken to signify a reduced need, rather than an increase in complacency (paragraph 3.7.2).

Page 35
4. Business Performance Effects
4.1. Introduction
4.1.1. Whereas the previous chapter was concerned with the extent and the ways in which involvement with Investors in People changed, or has changed, Recognised Organisations' and Committed Organisations' approaches to HR development, this chapter is concerned with whether and to what extent the Standard affects organisations' performance, a key wider benefit of involvement with the Standard. The effect is measured in terms of organisations' turnover, employment and turnover per employee, although the key indicators organisations themselves use to measure their performance are also shown. The difference that Investors in People makes to performance is assessed by means of several different comparisons between Recognised Organisations', Committed Organisations' and Non-Investors' growth.
4.2. Comparison of business performance
4.2.1. As Table 4.1 implies, the organisations interviewed face to face were asked which indicators they use to measure their performance, and which of these was the main indicator. Amongst Recognised Organisations the number of clients served was mentioned most frequently as one of the indicators, reflecting the substantial proportion of public service organisations in the sample. Sales turnover (for businesses) and income (for voluntary and public sector organisations) combined were mentioned more frequently than anything else as one of the indicators, but these two individually did not match the number of clients served or profits as the main indicator used. The pattern was broadly similar to Recognised Organisations amongst the Committed Organisations, but (reflecting the relative lack of voluntary and public sector organisations in the sample) the Non-Investors used the number of clients served as a performance indicator comparatively infrequently, and profits and turnover comparatively frequently.
4.2.2 Table 4.1 clearly indicates differing business strategies and objectives on the part of Investors in People organisations, which are more likely to compete on non-price factors than non-Investors. It is difficult to say to what extent these differences have arisen as a result of involvement in Investors were sought prior to that involvement, with involvement sought as a means to furthering those objectives.
4.2.3 What is interesting from Table 4.1 is the contrast in experience of Investors organisations and perceptions of non-Investors - thus, despite the relative lack of focus on profits and sales on the part of Investors organisations as objectives (Table 2.1), virtually all those that sought improved profitability thought they had done so to at least some extent (Table 3.2). And

Business Performance Effects
Page 36
amongst non-Investors there is a clear distinction between their perceptions of potential benefits of Investors in People (Table 2.6) and their focus on profits and sales. 4.2.4 Amongst the other indicators specified were customer satisfaction (mentioned by both Recognised Organisations and Committed Organisations), local authority and other public sector performance measures, and health and safety record.
Table 4.1 Indicators used to measure performance, (% of organisations interviewed face to face) Recognised
Organisations Committed Non-Investors
Used as indicator
Main indicator
Used as indicator
Main indicator
Used as indicator
Main indicator
No. of clients (firms / people served)
47 34 45 28 20 5
Profits 40 36 52 28 70 47
Sales turnover 30 7 52 12 60 37 Income 28 11 31 20 40 11
Market penetration in UK 17 5 14 0 15 0
Total employment 11 0 14 0 0 0
Share value 9 2 3 0 0 0
Total value of assets 6 0 3 0 0 0
Exports 2 0 3 0 0 0
No. of new products/services 2 0 3 0 0 0
Other 15 5 14 12 0 0
Nothing 2 0 0 0 0 0
Don't know 0 0 0 0 5 0 No. of Respondents 94 58 40 We can be 95% certain that figures in bold are different from those for Recognised Organisations
Source: Surveys of Recognised Organisations, Committed Organisations and Non-Investors, PACEC
4.2.5 All three types of organisation surveyed were asked for information on their turnover and employment during their latest financial year; and for the same information three years previously. As one of the ways of examining to what extent Investors in People affects business performance, Tables 4.2 - 4.4 compare average turnover, employment and turnover per employee growth rates for the three groups. Voluntary and public sector organisations are excluded form this analysis because they are not necessarily free to grow in the same way that businesses are. 4.2.6 Taken at face value, the tables suggest that Investors in People does not contribute towards business growth. Table 4.2 indicates that, regardless of whether the turnover growth rates are based on the means or medians, Non-Investors grew faster during the last three years than both Recognised and Committed Organisations. Table 4.3 indicates that the Non-Investors also

Business Performance Effects
Page 37
grew faster than both the Recognised and Committed Organisations in terms of employment. Table 4.4, however, indicates that the Non-Investors were out-performed by the Recognised and Committed Organisations in terms of turnover per employee. 4.2.7 It is emphasised that the data in Tables 4.2 - 4.4 should be interpreted with caution, for two reasons. First, it is clear that the Non-investor sample was extremely skewed, as compared with the Recognised and Committed Organisation samples (i.e. mean Non-investor turnover and employment were larger than the equivalents for Recognised and Committed Organisations, but the Non-investor medians were lower than for the other two groups). Secondly, it will be noted that the response rates were relatively low (especially in relation to turnover data and amongst Non-Investors as compared with the other groups). 4.2.8 It is also worth mentioning that the results in Tables 4.2 - 4.4 conflict with the findings from research for the DfEE by the Hambleden Group16, which found that organisations that had achieved the Investors in People standard out-performed their Non-investor peers across a range of measures. However, in contrast with the current research, the Hambleden research excluded organisations with fewer than 50 employees.
Table 4.2 Changes in Turnover Recognised
Organisations Committed
Organisations
Non-Investors
Mean in latest year, £m 14.2 12.1 34.2
Mean 3 years previously, £m 10.7 10.9 24.4
% change 33 11 40
Median in latest year, £m 2.0 1.8 1.0
Median 3 years previously, £m
2.0 1.5 0.8
% change 0 20 25 No. of Respondents 181 119 81 Response rate, % 40 40 33 Note: Uses data only from businesses which could provide information for both years. Source: Surveys of Recognised Organisations, Committed Organisations and Non-Investors, PACEC
16 Hambleden Group (2000), 'Corporate Financial Performance Observed Before and After
Investors in People Recognition' DfEE RR222

Business Performance Effects
Page 38
Table 4.3 Changes in Employment Recognised
Organisations Committed
Organisations
Non-Investors
Mean in latest year, Jobs 164.4 183.9 287.4
Mean 3 years previously, Jobs 146.0 178.3 220.4
% change 13 3 30
Median in latest year, Jobs 50.0 40.0 15.0
Median 3 years previously, Jobs
45.0 36.5 12.0
% change 11 10 25 No. of Respondents 295 240 141 Response rate, % 66 80 58 Note: Uses data only from businesses which could provide information for both years. Source: Surveys of Recognised Organisations, Committed Organisations and Non-Investors, PACEC
Table 4.4 Changes in Turnover per Employee Recognised
Organisations Committed
Organisations
Non-Investors
Mean in latest year, £k/head 93.0 90.0 134.4
Mean 3 years previously, £k/head
84.8 76.3 122.4
% change 10 18 10
Median in latest year, £k/head 52.6 54.2 62.5
Median 3 years previously, £k/head
48.3 50.0 66.7
% change 9 8 -6 No. of Respondents 179 115 79 Response rate, % 40 38 33 Note: Uses data only from businesses which could provide information for both years. Source: Surveys of Recognised Organisations, Committed Organisations and Non-Investors, PACEC
4.2.9 As is shown in Appendix B, measured rates of change in business turnover were not closely related to size of organisation, although it appears that large organisations (250+ employees) grew faster than other sizes combined. However, rates of change in employment were size-related, with the smallest organisations growing fastest and the largest organisations growing slowest. 4.2.10 Multiple regression was also used to examine whether involvement in Investors in People affects growth; and, in summary, it was found that involvement has neither a positive or negative effect on turnover / income. In fact, the only significant variables explaining growth, in the case of both turnover / income and employment, were 'established after 1989' (showing that young organisations tend to grow more rapidly) and 'overall objective is to grow' (showing that organisations which want to grow generally do so)17.
17 Alongside 'established after 1989' and 'overall objective is to grow' in an equation to explain
Business Performance Effects
Page 39
4.2.11 It is, of course, possible in a statistical analysis to control for only a limited range of variables which may affect performance. It is an important complementary step, therefore, to combine univariate and multivariate analysis of objective outcomes (i.e. as reported in paragraphs 4.2.3 - 4.2.7 and Tables 4.2 - 4.4 above) with the more subjective and comprehensive evaluation of the next section, which is intended to show what might have happened, if the companies surveyed had not reached or committed to the Investors in People standard.
4.3. Subjective views of the impact of Investors in People on performance
4.3.1. On the grounds that only the Recognised Organisations and Committed Organisations themselves would have a complete picture of all the factors and variables which affected their performance alongside their involvement in Investors in People, the organisations surveyed were asked (again in terms of turnover and employment) how much larger or smaller Investors in People had made them. Their responses are summarised in Tables 4.5 and 4.6, and it should be explained that the findings shown in these tables are preferred to those shown in Tables 4.2 and 4.3 because they implicitly isolate the Investors in People effect, taking into account all factors which may have had a bearing on business performance.
4.3.2. Table 4.5 shows that, although almost all Committed Organisations thought that the Standard had made them no different in terms of turnover, a total of 27% of Recognised Organisations thought that Investors in People had made them larger, if only marginally. Amongst the organisations which were able to quantify the Investors in People effect, the mean increase in turnover / income attributable to Investors in People was just over £20,000 amongst Recognised Organisations and just under £4,000 amongst Committed Organisations. It should be understood, however, that these mean quantified impacts are skewed towards zero (i.e. misleadingly low) because it was easier for those perceiving no impact to quantify (i.e. to say there was zero difference in turnover) than it was for those perceiving some positive impact to do the same. Nonetheless, the impact of Investors in People on turnover appears to be very small, especially when it is recalled (from Table 4.2) that Recognised Organisations and Committed Organisations had mean turnovers of £14.2 million and £12.1 million, respectively, in their latest financial years. 4.3.3. Table 4.6 paints a very similar picture with respect to the perceived employment impact of Investors in People. Very few Committed Organisations, but a sizeable minority of Recognised Organisations thought that the Standard had made a
turnover / income growth, a dummy variable representing Investor status had a negative coefficient (implying a negative impact on growth, but an insignificant t-ratio, and a dummy variable representing Committed status had a positive coefficient and an insignificant t-ratio. In an similar equation to explain employment growth both dummy variables had negative coefficients and extremely low t-ratio.

Business Performance Effects
Page 40
positive difference to their employment. Again, however, the size of impact, where quantified appears to be very small, especially in relation to the latest mean employment size of the organisations (see Table 4.3). 4.3.4. Organisations' perceptions of how Investors in People had affected their turnover and employment did not appear to vary according to size of organisation.
Table 4.5 Perceptions of effect of Investors in People on turnover (Businesses only) % saying Investors in People has made turnover in current year....
Recognised Organisations
Committed Organisations
... much larger 3 0 ... a little larger 8 0 ... marginally larger 16 3 ... no different 72 96 ... marginally smaller 0 0
... a little smaller 0 0
... much smaller 0 0 No. of Respondents 277 272 Mean change, where quantified, £k 20.6 3.6 No. of Respondents 226 264 We can be 95% certain that figures in bold are different from those for Recognised Organisations
Source: Surveys of Recognised Organisations and Committed Organisations, PACEC
Table 4.6 Perceptions of effect of Investors in People on employment (Businesses only) % saying Investors in People has made employment in current year....
Recognised Organisations
Committed Organisations
... much larger 2 0 ... a little larger 8 1 ... marginally larger 14 3 ... no different 72 95 ... marginally smaller 2 1
... a little smaller 1 0
... much smaller 0 0 No. of Respondents 284 270 Mean change, where quantified, Jobs 3.6 0.0 No. of Respondents 226 264 We can be 95% certain that figures in bold are different from those for Recognised Organisations Source: Surveys of Recognised Organisations, and of Committed Organisations, PACEC

Business Performance Effects
Page 41
Summary of key findings
• A simple comparison of changes in business turnover, employment and turnover per employee in the last three years indicates that, if anything, Non-Investors grew faster than Recognised Organisations and Committed Organisations (Tables 4.2 - 4.4).
• The survey revealed an interesting contrast in the experiences and
perceptions of Investors and non-Investors organisations with regard to bottom-line performance (paragraph 4.2.3)
• Regression analysis of changes in turnover and employment suggests that involvement in Investors in People has neither a positive or negative effect on growth (Paragraph 4.2.8).
• The subjective views of respondents showed that a quarter of Recognised Organisations, but very few Committed Organisations, thought that Investors in People had made them larger in terms of turnover and employment, if only marginally (Tables 4.5 and 4.6).

Page 42
5. Wider Effects
5.1. Introduction
5.1.1. Although noting that the role and benefits of Investors in People seems to have widened and become more persistent in recent years in terms of impacts on organisations, little has hitherto been said about the role and benefits beyond the level of the organisation. The examination in this chapter of the wider effects of Investors in People therefore focuses initially on the effects of the Standard on the employees of Recognised and Committed Organisations, principally to consider whether the Standard contributes towards the broad policy objective of creating a 'learning society'. It then considers whether the customers, suppliers and competitors of Recognised Organisations and Committed Organisations have been affected by the Standard.
5.1.2. As was implied by the research issues set out in Chapter 1 (see paragraph 1.2.3), the wider effects of Investors in People also encompass effects on recognised organisations that occur or accumulate post-recognition. However, this type of wider effect was explored in Chapter 3, which showed that, amongst other things:
• The majority of organisations do continue to develop their HR plans, systems and processes post-recognition (Table 3.4); and that
• The various intermediate effects of pursuing the Standard are most frequently maintained post recognition, but they accumulate more often than they fade (Table 3.6).
5.2. Findings from the Surveys of employees
Characteristics of Employees Surveyed 5.2.1. As was stated in Chapter 1 self-completed questionnaires were received from 193 employees of Recognised Organisations and 85 employees of Committed Organisations. Tables 5.1 to 5.4 summarise the background characteristics of the respondents; and they show that, occupational group apart, there were few major differences between the two samples. Amongst the employees of both Recognised Organisations and Committed Organisations, the modal (i.e. 'typical') respondent was:
• a permanent employee • employed at the same workplace for 2-5 years • female18 • in the 30-49 year old age group
18 Although it is known that just over half of all employees are female, it is not clear whether the
finding that around two-thirds of respondents were female means that the samples were untypical of all organisations involved with Investors in People.

Wider effects
Page 43
• educated to O-level (or equivalent) and with a recognised professional or vocational qualification.
5.2.2. However, Employees of Recognised Organisations were most likely to be in the Clerical and secretarial occupations, whereas the Employees of Committed Organisations were most likely to describe themselves as being in one of the Managerial or senior administrative occupations. The Employees of Recognised Organisations were also less likely than the Employees of Committed Organisations to be in one of the Personal and protective service occupations.
Table 5.1 Job status and length of work at the same workplace, % Employees of
Recognised Organisations
Employees of Committed
Organisations Job status Permanent job 93 93
Temporary job 2 1
Fixed-term job 5 6 No. of Respondents 193 85 Time at the same workplace Less than a year 12 11
1 to less than 2 years 16 18
2 to less than 5 years 32 35
5 to less than 10 years 24 29
10 years or more 15 8 No. of Respondents 193 84 Source: Surveys of Employees of Recognised and Committed Organisations, PACEC
Table 5.2 Sex and age group, % Employees of
Recognised Organisations
Employees of Committed
Organisations Sex: Male 36 33 Female 64 67 No. of Respondents 191 85 Age group: Less than 20 years old 2 5 20-29 years old 26 34 30-49 years old 53 44 50 or more years old 19 18 No. of Respondents 193 85 Source: Surveys of Employees of Recognised and Committed Organisations, PACEC
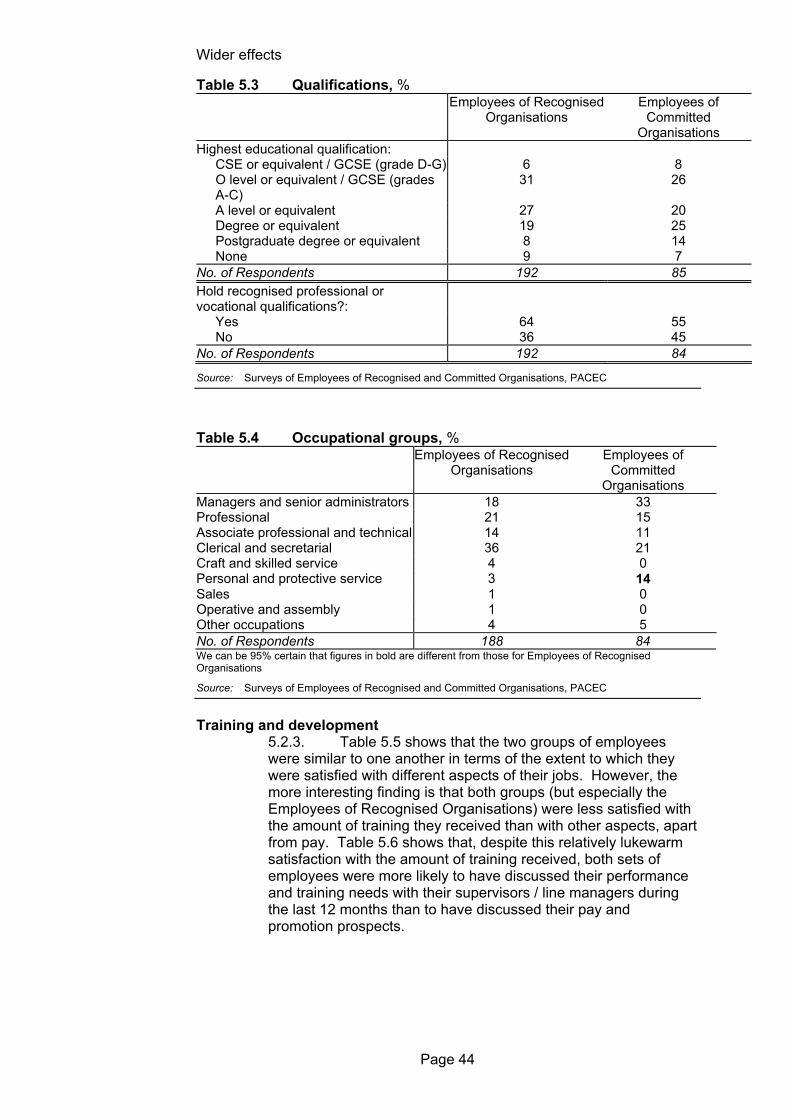
Wider effects
Page 44
Table 5.3 Qualifications, % Employees of Recognised
Organisations Employees of
Committed Organisations
Highest educational qualification: CSE or equivalent / GCSE (grade D-G) 6 8 O level or equivalent / GCSE (grades A-C)
31 26
A level or equivalent 27 20 Degree or equivalent 19 25 Postgraduate degree or equivalent 8 14 None 9 7
No. of Respondents 192 85 Hold recognised professional or vocational qualifications?:
Yes 64 55 No 36 45
No. of Respondents 192 84
Source: Surveys of Employees of Recognised and Committed Organisations, PACEC
Table 5.4 Occupational groups, % Employees of Recognised
Organisations Employees of
Committed Organisations
Managers and senior administrators 18 33 Professional 21 15 Associate professional and technical 14 11 Clerical and secretarial 36 21 Craft and skilled service 4 0 Personal and protective service 3 14 Sales 1 0 Operative and assembly 1 0 Other occupations 4 5 No. of Respondents 188 84 We can be 95% certain that figures in bold are different from those for Employees of Recognised Organisations
Source: Surveys of Employees of Recognised and Committed Organisations, PACEC
Training and development
5.2.3. Table 5.5 shows that the two groups of employees were similar to one another in terms of the extent to which they were satisfied with different aspects of their jobs. However, the more interesting finding is that both groups (but especially the Employees of Recognised Organisations) were less satisfied with the amount of training they received than with other aspects, apart from pay. Table 5.6 shows that, despite this relatively lukewarm satisfaction with the amount of training received, both sets of employees were more likely to have discussed their performance and training needs with their supervisors / line managers during the last 12 months than to have discussed their pay and promotion prospects.

Wider effects
Page 45
Table 5.5 Satisfaction with aspects of the job, % satisfied or very satisfied Employees of
Recognised Organisations
Employees of Committed
Organisations
Amount of influence over own job 66 65
Amount of pay received 34 32
Amount of training received 52 60
Sense of achievement from the job 67 68
Respect from supervisors / line managers
63 68
No. of Respondents 193 85 Source: Surveys of Employees of Recognised and Committed Organisations, PACEC
Table 5.6 Proportion of employees who have discussed the following with their supervisor / line manager in the last year, % Employees of Recognised
Organisations Employees of Committed
Organisations
How they get on with their job 86 93
Their chances of promotion 30 31
Their training needs 78 84
Their pay 42 59
None of these 6 2 No. of Respondents 189 85 Source: Surveys of Employees of Recognised and Committed Organisations, PACEC
5.2.4. As is shown in Appendix B, the more highly qualified employees of Recognised Organisations were generally slightly more satisfied with different aspects of their jobs than were their lower qualified colleagues19. The more highly qualified employees of Committed Organisations were more satisfied than their lower qualified colleagues with the amount of training they received and with the respect they received from their supervisors / line managers. These findings might reflect the fact that the more highly qualified employees of both types of organisation were generally more likely than their less qualified colleagues to have discussed their performance, pay etc. with their supervisors / line managers during the last year. 5.2.5. It is also interesting to note that the 1998 Workplace Employee Relations Survey (WERS) found that 52% of employees of Recognised Organisations had discussed their training needs with their supervisor during the last year, as compared with 78% in the current research (see Table 5.6). However, it is not clear whether this difference is due to inherent differences between the two samples, or whether it reflects an upward trend between 1998 and the latter part of 2001 (when the current research was carried
19 In this context, a more highly qualified employee is one whose highest educational qualification
is A-level / equivalent or higher, and a lower qualified employee is one whose highest educational qualification is GCSE / O-level or lower.

Wider effects
Page 46
out). 5.2.6. Table 5.7 shows that (perhaps reflecting the extra effort required to reach the Standard) the Employees of Committed Organisations were more likely than the Employees of Recognised Organisations to have received off-the-job training in the last year. It also shows that they were less likely to say that they had received no training at all. However, for both groups the modal and median amount of training was in the 3-5 day range. 5.2.7. It is also shown in Appendix B that higher qualified employees of Recognised Organisations were less likely than their less qualified colleagues to say that they received no training during the last year. They were also more likely to say that they had received 3 days or more training. 5.2.8. It should also be noted that the Learning and Training at Work survey for 2000 found that 26% of all employees had received some off-the-job training during the last 12 months, as compared with the 62% of employees of Recognised Organisations shown in Table 5.7. However, a special run of data from the Labour Force Survey (LFS) for employees with the same sex, age, employment etc. characteristics as those captured by the current research found that the proportion that had received off-the-job training during the last 12 months was exactly the same for LFS subjects as amongst employees of Recognised Organisations. The effect of Investors in People on the amount of off-the-job training individuals receive is, therefore, not entirely clear.
Table 5.7 Method and amount of training received in last year, % Employees of
Recognised Organisations
Employees of Committed
Organisations Method of training: On the job training 63 71
Off the job training 62 76
None 12 6 No. of Respondents 191 85 Amount of training: None 17 4 Less than 1 day 4 0
1-2 days 22 13
3-5 days 30 40
6-10 days 16 22
More than 10 days 15 22 No. of Respondents 191 83
We can be 95% certain that figures in bold are different from those for Employees of Recognised Organisations
Source: Surveys of Employees of Recognised and Committed Organisations, PACEC
5.2.9. Table 5.8 reveals that employees of Recognised

Wider effects
Page 47
Organisations and employees of Committed Organisations were equally likely (or, rather, unlikely) to have trained towards a recognised qualification in the last year. Table 5.9 shows that a quarter of both groups of employees had undergone education or training unrelated to their jobs in the last 12 months; and that this was organised, or paid for, by the employer in a substantial minority of cases. The disaggregated data from the survey of employees of Recognised Organisations also show that more highly qualified employees were more likely than their less qualified colleagues both to have trained towards a recognised qualification during the previous 12 months and to have undergone education or training unrelated to their jobs.
Table 5.8 Proportion of employees training towards a recognised qualification in the last year, % Employees of Recognised
Organisations Employees of Committed
Organisations Yes 34 33
No 65 63
Don't know 2 4 Respondents 191 84 Source: Surveys of Employees of Recognised and Committed Organisations, PACEC
Table 5.9 Proportion of employees undergoing education or training unrelated to their job in the last year, % Employees of Recognised
Organisations Employees of Committed
Organisations Yes 24 25 No. of Respondents 190 84 of which: Organised / paid for by the employer
47
35
Organised / paid for by the employee
53 65
No. of Respondents 45 23 Source: Surveys of Employees of Recognised and Committed Organisations, PACEC
Awareness of Investor in People and perceptions of its effects 5.2.10. Table 5.10 shows that almost all Employees of Recognised Organisations and the large majority of Employees of Committed Organisations were aware that their organisation had achieved, or was working towards the Investors in People standard. Table 5.11 suggests that there is imperfect understanding of what Investors in People is about amongst employees aware that their organisation was involved. However, this would not be considered a critical problem, especially as the table also shows that the proportion of employees with no understanding of what the Standard aims to achieve is small. It was also found that less highly qualified employees of Committed Organisations were considerably less likely than their more highly qualified colleagues to indicate that they were aware of, and understood, Investors in People. Again, however, it does not

Wider effects
Page 48
follow that this is a critical problem.
Table 5.10 Awareness of Investors in People, % Employees of
Recognised Organisations
Employees of Committed
Organisations Aware before receiving questionnaire that organisation has achieved / is working towards Investors in People standard?
Yes 91 83
Vaguely 6 15
No 3 1 No. of Respondents 193 84 Source: Surveys of Employees of Recognised and Committed Organisations, PACEC
Table 5.11 Understanding of Investors in People, % of employees aware of their organisation's involvement with Investors in People Employees of
Recognised Organisations
Employees of Committed Organisations
Understand what the Investors in People standard aims to achieve?
Yes 56 59
Vaguely 36 34
No 8 7 No. of Respondents 187 82 Source: Surveys of Employees of Recognised and Committed Organisations, PACEC
5.2.11. The upper part of Table 5.12 indicates that employees were most likely to be unaware of any change in the amount of training they had received (or were receiving) as their organisation progressed (or was progressing) towards achieving the Standard. However, virtually all employees who thought there had been a change believed that there had been an increase. The lower part of the table also suggests that Employees of Recognised Organisations were often unaware of any post-accreditation effect on the amount of training they received. However, those aware of some change, on balance, perceived a slight increase.
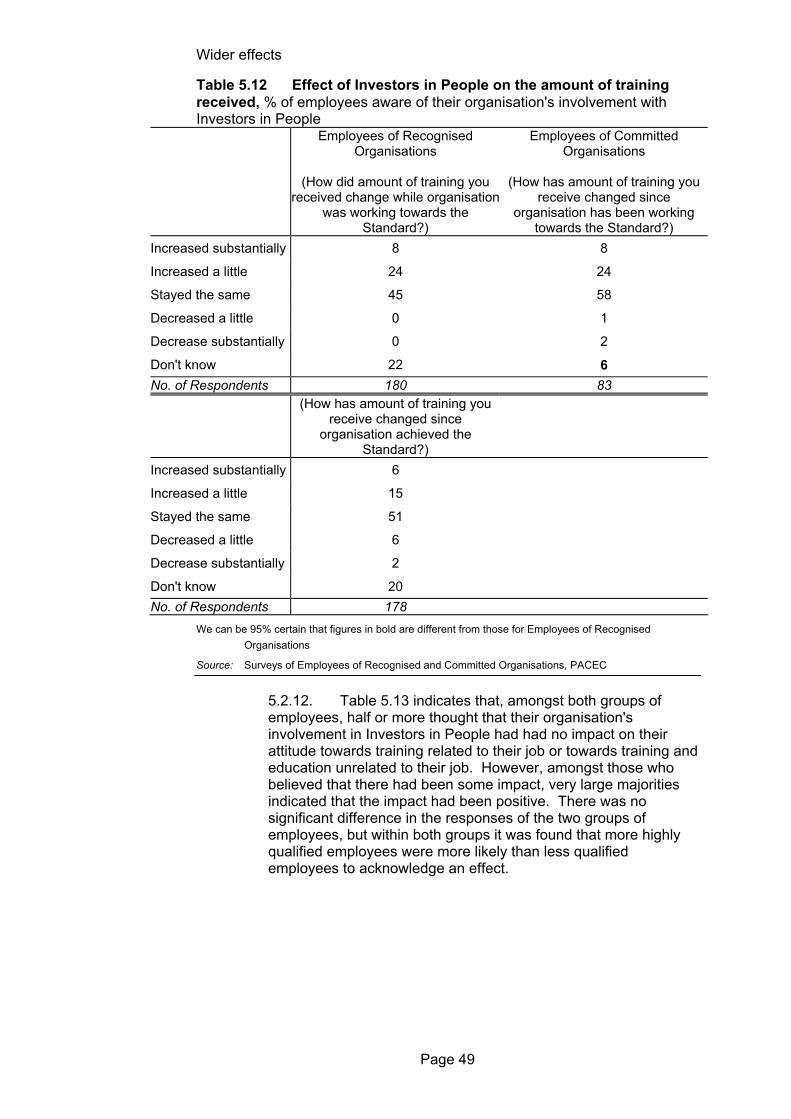
Wider effects
Page 49
Table 5.12 Effect of Investors in People on the amount of training received, % of employees aware of their organisation's involvement with Investors in People
Employees of Recognised Organisations
(How did amount of training you
received change while organisation was working towards the
Standard?)
Employees of Committed Organisations
(How has amount of training you
receive changed since organisation has been working
towards the Standard?) Increased substantially 8 8
Increased a little 24 24
Stayed the same 45 58
Decreased a little 0 1
Decrease substantially 0 2
Don't know 22 6 No. of Respondents 180 83 (How has amount of training you
receive changed since organisation achieved the
Standard?)
Increased substantially 6
Increased a little 15
Stayed the same 51
Decreased a little 6
Decrease substantially 2
Don't know 20 No. of Respondents 178
We can be 95% certain that figures in bold are different from those for Employees of Recognised Organisations
Source: Surveys of Employees of Recognised and Committed Organisations, PACEC
5.2.12. Table 5.13 indicates that, amongst both groups of employees, half or more thought that their organisation's involvement in Investors in People had had no impact on their attitude towards training related to their job or towards training and education unrelated to their job. However, amongst those who believed that there had been some impact, very large majorities indicated that the impact had been positive. There was no significant difference in the responses of the two groups of employees, but within both groups it was found that more highly qualified employees were more likely than less qualified employees to acknowledge an effect.

Wider effects
Page 50
Table 5.13 Influence of Investors in People standard on employees' attitudes towards training and education, % of employees aware of their organisation's involvement in Investors in People Employees of
Recognised Organisations
Employees of Committed
Organisations Effect of Investors in People on attitude towards training related to their job:
Positive impact 37 41
No impact 52 49
Negative impact 4 1
Don't know / not sure 7 8 No. of Respondents 180 83 Effect of Investors in People on attitude towards training & education unrelated to their job:
Positive impact 23 25
No impact 65 66
Negative impact 2 0
Don't know / not sure 10 8 No. of Respondents 181 83 Source: Surveys of Employees of Recognised and Committed Organisations, PACEC
5.2.13. Similarly, the first part of Table 5.14 shows that the majority of both groups of employees thought that their organisation's involvement in Investors in People had had no effect on their performance in their job. However, around 40% of both groups thought that Investors in People had led them to perform a little or substantially better, whereas almost none thought it had led them to perform worse. The second and third parts of the table show broadly the same pattern of response, albeit slightly less positive overall, with respect to motivation in the job and staying on with the same employer. Interestingly, and in contrast to many of the other survey results, it was found that less highly qualified employees of Recognised Organisations were more likely than their more highly qualified colleagues to say that they had become more motivated towards their jobs because of Investors in People.

Wider effects
Page 51
Table 5.14 Effects of Investors in People on employees' performance, motivation and commitment to their employer, % of employees aware of their organisation's commitment to Investors in People or Investors in People accreditation Employees of
Recognised Organisations
Employees of Committed
Organisations Effect of Investors in People on performance in their job:
Substantially better 15 7
A little better 23 34
No better or worse 61 58
A little worse 1 1
Substantially worse 0 0 No. of Respondents 179 83 Effect of Investors in People on motivation towards their job:
Substantially more motivated 10 4
A little more motivated 19 29
Stayed the same 69 66
A little less motivated 3 0
Substantially less motivated 0 1 No. of Respondents 178 83 Effect of Investors in People on likelihood of staying with current employer:
Substantially more likely 9 10
A little more likely 23 22
No more or less likely 62 66
A little less likely 4 1
Substantially less likely 1 1 No. of Respondents 179 83 Source: Surveys of Employees of Recognised and Committed Organisations, PACEC
5.3. Employers' perceptions of wider effects
5.3.1. The Recognised and Committed Organisations surveyed were also asked for their views on how they thought their involvement in Investors in People had affected their employees. Table 5.15 indicates that both sets of organisations felt that the greatest impact had been on staff morale, and the least had been on absenteeism (although many organisations explained that absenteeism was not really a problem anyway). It is noteworthy that, unlike the employees, there was a difference in the responses according to whether the organisation had achieved, or was still working towards, the Standard. Recognised Organisations were more likely than Committed Organisations to indicate that each of the impacts shown had been felt to a great extent. Conversely, they were less likely to report that there had

Wider effects
Page 52
been no impact at all. However, it should also be noted that many Committed Organisations commented that it was too early for impacts to be felt. It was also found (see Appendix B) that smaller Recognised Organisations (i.e. with fewer than 50 employees) were more likely than their larger counterparts to say that Investors in People had impacted on their staff to a great or fair in the ways shown in the table.
Table 5.15 Organisations' view of the impact on employees, % replying as shown Great extent Fair extent Small extent Not at all N=
Recognised Organisations
Increased staff morale
21 40 26 12 544
Reduced absenteeism
12 18 22 49 530
Higher self esteem 18 34 34 15 537
Increased well being 17 33 34 16 528
Committed Organisations
Increased staff morale
13 33 26 28 222
Reduced absenteeism
4 14 23 59 203
Higher self esteem 11 29 28 33 218
Increased well being 11 32 26 31 218 We can be 95% certain that figures in bold are different from those for Recognised Organisations Source: Surveys of Recognised and Committed Organisations, PACEC
5.3.2. Table 5.16 shows, qualitatively, a very similar pattern of response to Table 5.15. A clear majority of Recognised Organisations reported that involvement in Investors in People had had a great or fair impact on: staff involvement in, and commitment to, business objectives; the organisation's culture, and; working relationships. Around half reported a great or fair impact on returns to investment in HR and the organisation's position relative to the leading edge in HR development. However, in each case, Committed Organisations were less likely, by a margin of between 11 and 24 percentage points respectively , to report a great or fair impact. Again, however, a number of Committed Organisations commented that it was simply too early to expect much of an impact on the factors in question. It was also found that smaller Recognised Organisations were more likely than others to acknowledge the effects shown.

Wider effects
Page 53
Table 5.16 Other internal wider effects, % of organisations saying effect has occurred to a great or fair extent Recognised
Organisations Committed
Organisations
Staff more involved & committed to business objectives
64 48
Positive change in organisation's culture 61 42 Improved working relationships 59 48
Improved returns on investment in HR 52 33 Became leading-edge with respect to HR development
47 23
No. of Respondents 533 217 We can be 95% certain that figures in bold are different from those for Recognised Organisations
Source: Surveys of Recognised Organisations and Committed Organisations, PACEC
5.3.3. Lastly, the Recognised Organisations were asked whether there had been any effect of their involvement in Investors in People on their customers, suppliers and competitors. Table 5.17 suggests that there had been very little by way of transmission or demonstration effects. However, those interviewed face to face tended to say that they could not tell what these effects might have been, rather than to say that these effects had been absent.
Table 5.17 External effects of Investors in People, % of Recognised Organisations only The organisation's customers have improved their.......
......HR practices 7
......products / services 3
......processes 5
......business performance 8
The organisation's suppliers have improved their....... ......HR practices 8 ......products / services 4 ......processes 5 ......business performance 8
The organisation's competitors have improved their....... ......HR practices 12 ......products / services 4 ......processes 5 ......business performance 10
No. of Respondents 553 Source: Surveys of Recognised Organisations, PACEC
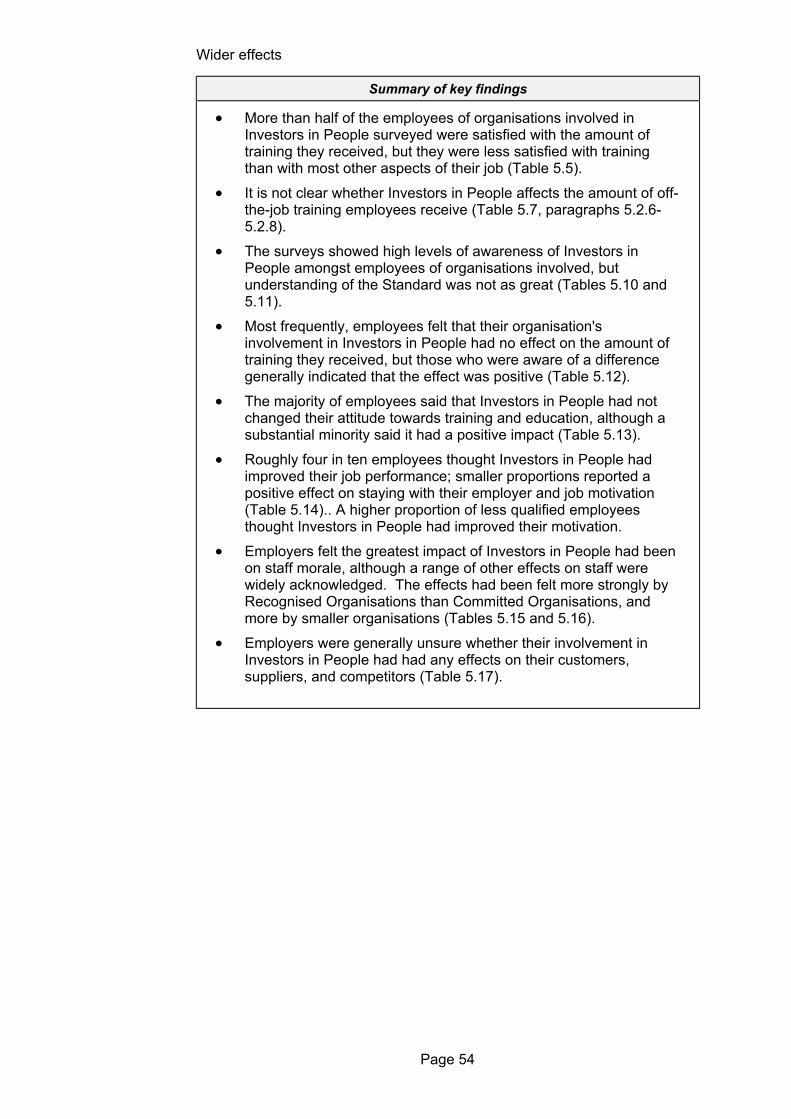
Wider effects
Page 54
Summary of key findings
• More than half of the employees of organisations involved in Investors in People surveyed were satisfied with the amount of training they received, but they were less satisfied with training than with most other aspects of their job (Table 5.5).
• It is not clear whether Investors in People affects the amount of off-the-job training employees receive (Table 5.7, paragraphs 5.2.6-5.2.8).
• The surveys showed high levels of awareness of Investors in People amongst employees of organisations involved, but understanding of the Standard was not as great (Tables 5.10 and 5.11).
• Most frequently, employees felt that their organisation's involvement in Investors in People had no effect on the amount of training they received, but those who were aware of a difference generally indicated that the effect was positive (Table 5.12).
• The majority of employees said that Investors in People had not changed their attitude towards training and education, although a substantial minority said it had a positive impact (Table 5.13).
• Roughly four in ten employees thought Investors in People had improved their job performance; smaller proportions reported a positive effect on staying with their employer and job motivation (Table 5.14).. A higher proportion of less qualified employees thought Investors in People had improved their motivation.
• Employers felt the greatest impact of Investors in People had been on staff morale, although a range of other effects on staff were widely acknowledged. The effects had been felt more strongly by Recognised Organisations than Committed Organisations, and more by smaller organisations (Tables 5.15 and 5.16).
• Employers were generally unsure whether their involvement in Investors in People had had any effects on their customers, suppliers, and competitors (Table 5.17).
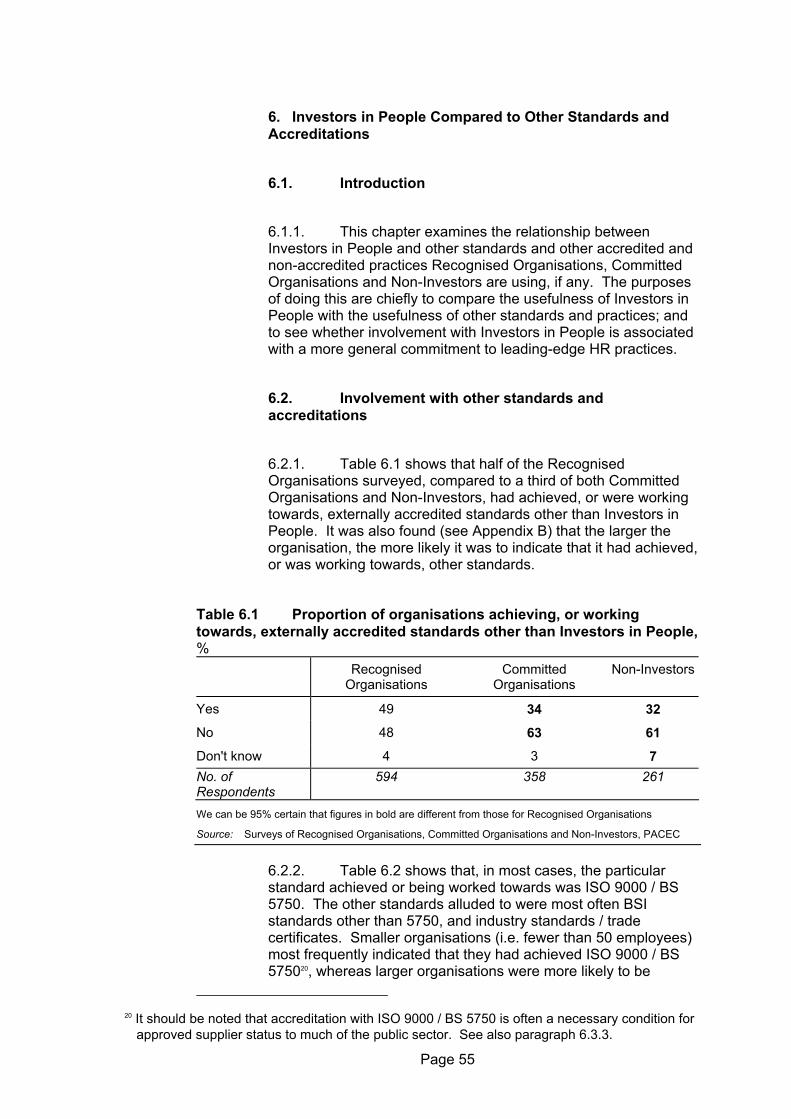
Page 55
6. Investors in People Compared to Other Standards and Accreditations
6.1. Introduction
6.1.1. This chapter examines the relationship between Investors in People and other standards and other accredited and non-accredited practices Recognised Organisations, Committed Organisations and Non-Investors are using, if any. The purposes of doing this are chiefly to compare the usefulness of Investors in People with the usefulness of other standards and practices; and to see whether involvement with Investors in People is associated with a more general commitment to leading-edge HR practices.
6.2. Involvement with other standards and accreditations
6.2.1. Table 6.1 shows that half of the Recognised Organisations surveyed, compared to a third of both Committed Organisations and Non-Investors, had achieved, or were working towards, externally accredited standards other than Investors in People. It was also found (see Appendix B) that the larger the organisation, the more likely it was to indicate that it had achieved, or was working towards, other standards.
Table 6.1 Proportion of organisations achieving, or working towards, externally accredited standards other than Investors in People, % Recognised
Organisations Committed
Organisations Non-Investors
Yes 49 34 32 No 48 63 61 Don't know 4 3 7 No. of Respondents
594 358 261
We can be 95% certain that figures in bold are different from those for Recognised Organisations
Source: Surveys of Recognised Organisations, Committed Organisations and Non-Investors, PACEC
6.2.2. Table 6.2 shows that, in most cases, the particular standard achieved or being worked towards was ISO 9000 / BS 5750. The other standards alluded to were most often BSI standards other than 5750, and industry standards / trade certificates. Smaller organisations (i.e. fewer than 50 employees) most frequently indicated that they had achieved ISO 9000 / BS 575020, whereas larger organisations were more likely to be
20 It should be noted that accreditation with ISO 9000 / BS 5750 is often a necessary condition for
approved supplier status to much of the public sector. See also paragraph 6.3.3.

Investors in People compared to other standards and accreditations
Page 56
accredited with the Charter Mark or EQFM / EQA / BEM.
Table 6.2 Other standards achieved or being worked towards, % of those accredited with or working towards another standard, Recognised
Organisations Committed
Organisations
Non-Investors
Achieved
Working towards
Achieved
Working towards
Achieved
Working towards
National Training Award
3 2 4 0 2 0
ISO 9000 / BS5750 75 49 73 60 39 20
EFQM /EQA / Business Excellence
8 22 2 0 0 0
Charter Mark 8 7 9 0 2 0
Partnerships with People
0 0 1 0 0 0
King's Fund (NHS) 0 2 1 0 5 0
Other 22 22 38 44 55 87 No. of Respondents 170 106 77 We can be 95% certain that figures in bold are different from those for Recognised Organisations
Source: Surveys of Recognised Organisations, Committed Organisations and Non-Investors, PACEC
6.2.3. The Recognised and Committed Organisations interviewed face-to-face that said they had achieved, or were working towards, other standards were asked whether their involvement in Investors in People had led to their involvement with the other standards, or whether involvement in other standards had led to involvement in Investors in People. However, virtually all of them indicated that there was no causal relationship; and many of them said that they regarded Investors in People and other standards as serving different, but complementary purposes.
6.3. Relative usefulness of Investors in People
6.3.1. Although it later transpired that they tended to be seen as complementary, rather than substitutes for one another, an original intention of the survey work had been to compare, in the eyes of Recognised Organisations and Committed Organisations, the overall usefulness of Investors in People with the overall usefulness of a range of other standards. However, as might be guessed from Table 6.2, a meaningful comparison was only possible in the case of ISO 9000 / BS 5750.
6.3.2. Table 6.3 shows that a large majority of Recognised Organisations also accredited with or working towards ISO 9000 / BS 5750 thought that the two standards were about the same in terms of usefulness, although those who thought that the was a difference were more likely to say that Investors in People was more useful than to say the opposite. However, the Committed Organisations were much less likely to say that there was no difference and much more likely to say that Investors in People

Investors in People compared to other standards and accreditations
Page 57
was more useful. 6.3.3. Investors in People was most frequently described as more useful than ISO 9000 / BS 5750 because the latter was often a requirement of customers, rather than something the organisations in question would necessarily pursue of their own volition. Less frequently, Investors in People was described as being better at bringing about cultural change within organisations; and for formalising procedures and processes. On the other hand, ISO 9000 / BS 5750 was sometimes regarded as being better because it involved less paperwork.
Table 6.3 Comparison of overall usefulness of Investors in People with overall usefulness of ISO 9000 / BS 5750, % Recognised
Organisations Committed
Organisations
Investors in People is more useful 12 38 Investors in People is about the same
69 36
Investors in People is less useful 6 6
Don't know 13 20 No. of Respondents 90 66 We can be 95% certain that figures in bold are different from those for Recognised Organisations
Source: Surveys of Recognised and Committed Organisations, PACEC
6.4. Use of other good practices
6.4.1. As shown in Chapter 1, a specific research issue was whether Recognised Organisations are generally in the vanguard of 'leading-edge' HR practice. Chapter 3 demonstrated that Recognised Organisations (and Committed Organisations) were significantly more likely than Non-Investors to have formal HR plans, systems and processes in place. However, in order to explore the issue further, the Recognised Organisations and Committed Organisations were also asked if they used or followed a range of other specified 'good practices'.
6.4.2. Table 6.4 shows that the two groups were very similar to one another in terms of their responses, but it is probably fair to say that the practices most frequently adhered to (such as multi-skilling, flexi-time and job sharing) would no longer be regarded as 'leading edge'. Relatively few organisations identified other good practices not specifically identified in the table, but the one mentioned most often were interchange of secondees, focus groups on quality of service and home working.
Table 6.4 Use of other good practices, %

Investors in People compared to other standards and accreditations
Page 58
Recognised Organisations Committed Organisations
Multi-skilling 69 64
Flexi-time 53 54
Job sharing 46 48
Performance pay 38 33
Job rotation 33 25
Total Quality Management 27 23
Quality Circles 17 11
Other 8 5 No. of Respondents 362 174 Source: Surveys of Recognised Organisations and Committed Organisations, PACEC
Summary of key findings
• Half of Recognised Organisations, but only a third of Committed Organisations and Non-Investors, have achieved / are working towards other standards. The other standard most frequently used was ISO 9000 / BS 5750 accreditation (Tables 6.1 and 6.2).
• Investors in People and other standards are generally seen as complementary; and there is no clear evidence that Investors in People leads to the pursuit of other standards, or vice versa (Paragraph 6.2.3).
• A large majority of Recognised Organisations thought that Investors in People and other standards were of similar usefulness, but a substantial minority of Committed Organisations said Investors in People was more useful. (Table 6.3).
• A variety of other 'good practices' are followed by Recognised and Committed Organisations, but the practices they follow do not obviously mark them out as being at in the vanguard of leading edge HR practices (paragraph 6.4.2)

Page 59
7. Maintaining and pursuing the standard
7.1. Introduction
7.1.1. This chapter is chiefly concerned with ways in which the Investors in People standard could be, or might need to be, developed. It starts by showing how Recognised Organisations and Committed Organisations view the overall usefulness of Investors in People to themselves. It then examines how they would approach Investors in People differently, if they were to start again; and the reasons why they would, or would not, recommend the Standard to others. Lastly, possible barriers to re-recognition amongst organisations that have already achieved the Standard, and to achievement of the Standard by organisations which are not yet Recognised Organisations, are considered.
7.1.2 These considerations are important in the context of achieving wider benefits of Investors in People given the findings previously that many of these benefits tend to occur later (Table 3.3 and paragraph 3.2.9) and often accumulate post-recognition.
7.2 Overall assessment of Investors in People
7.2.1 Table 7.1 shows that Investors in People was rated very highly by the Recognised Organisations surveyed, with two-thirds describing the Standard as extremely or very useful in relation to their organisation's objectives, compared to only one in twenty five describing it as not very or not at all useful. Understandably, given the fact that they are by and large still undergoing the changes that are intended to deliver benefits, the Committed Organisations were less likely than the Recognised Organisations to describe the Standard as extremely or very useful, and more likely to describe it as not very or not at all useful. Nonetheless, the Committed Organisations were, on balance, more positive than negative in their assessments.
Table 7.1 Usefulness of Investors in People in the light of organisations' overall objectives, % Recognised Organisations Committed Organisations
Extremely useful 17 7
Very useful 50 33
Fairly useful 30 43
Not very useful 3 15
Not at all useful 1 3
No. of Respondents 563 343 We can be 95% certain that figures in bold are different from those for Recognised Organisations
Source: Surveys of Recognised and Committed Organisations, PACEC
7.2.2 The Recognised and Committed Organisations

Maintaining and pursuing the Standard
Page 60
interviewed face to face were asked whether, having experienced Investors in People, they would now approach the Standard differently. Just over a quarter of the Recognised Organisations said they would; and most frequently they specified that they would like to take a less paperwork-orientated approach and / or an assessment process that was more output-orientated. For their part, 40% of the Committed Organisations said that they would approach things differently and, of these, most mentioned the need to involve their whole organisation more fully in the processes. It should also be noted that a handful of the Committed Organisations said that, starting from scratch, they would not commit to Investors in People at all, but would implement changes and improvements independently of the Investors in People framework.
7.2.3 Table 7.2 shows that virtually all Recognised Organisations and the large majority of Committed Organisations interviewed face to face would recommend Investors in People to other organisations, and that none would actually recommend against the Standard. The reasons provided were diverse, but overall they suggest that the main reasons for recommending the Standard are that it brings business benefits and that it provides a disciplined framework for improvements and developments in HR management. 7.2.4 A striking feature of Tables 7.1 and 7.2 is that, in combination, they imply very high levels of satisfaction with Investors in People, even though, as was reported in Chapter 4, the business performance benefits of the Standard are muted. This in turn implies that the business benefits referred to are not 'bottom-line' benefits, but are more likely to be process or operational benefits. Nevertheless, the finding that the perceived objectives and impacts of Investors in People appear to have widened is also reflected in Table 7.2, with a focus on general business benefits rather than on HR systems specifically.
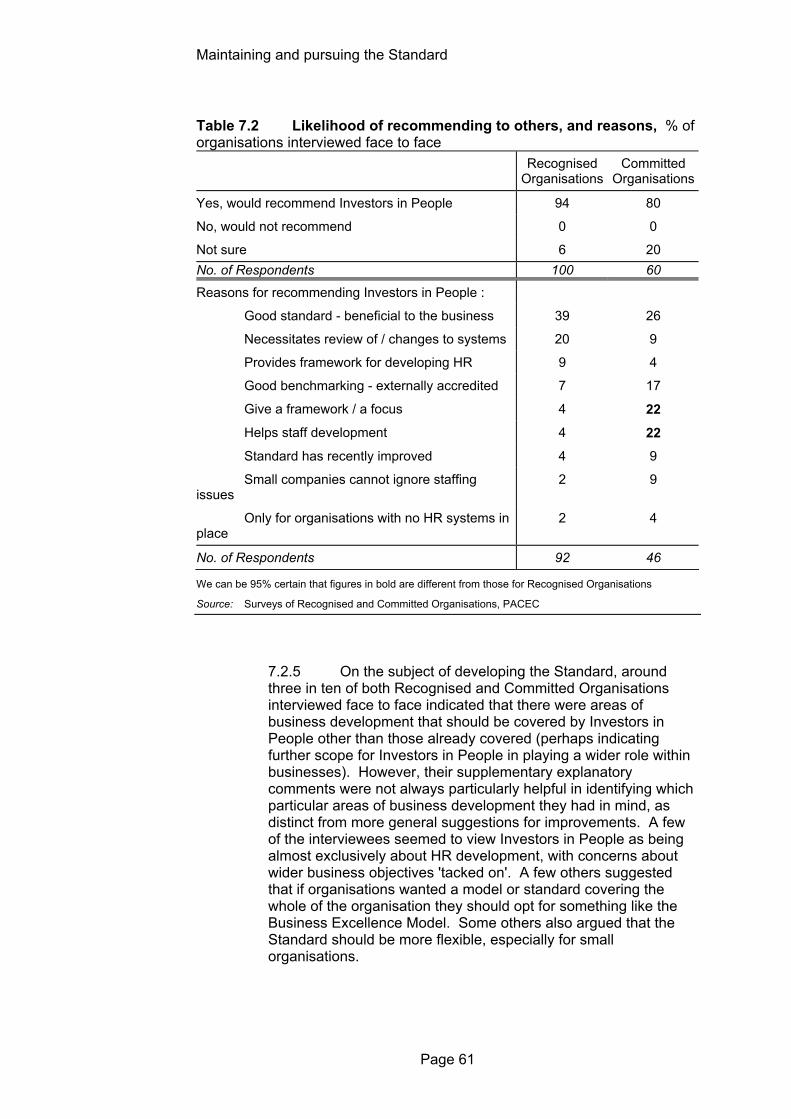
Maintaining and pursuing the Standard
Page 61
Table 7.2 Likelihood of recommending to others, and reasons, % of organisations interviewed face to face Recognised
Organisations Committed
Organisations
Yes, would recommend Investors in People 94 80
No, would not recommend 0 0
Not sure 6 20 No. of Respondents 100 60 Reasons for recommending Investors in People :
Good standard - beneficial to the business 39 26
Necessitates review of / changes to systems 20 9
Provides framework for developing HR 9 4
Good benchmarking - externally accredited 7 17
Give a framework / a focus 4 22 Helps staff development 4 22 Standard has recently improved 4 9
Small companies cannot ignore staffing issues
2 9
Only for organisations with no HR systems in place
2 4
No. of Respondents 92 46
We can be 95% certain that figures in bold are different from those for Recognised Organisations
Source: Surveys of Recognised and Committed Organisations, PACEC
7.2.5 On the subject of developing the Standard, around three in ten of both Recognised and Committed Organisations interviewed face to face indicated that there were areas of business development that should be covered by Investors in People other than those already covered (perhaps indicating further scope for Investors in People in playing a wider role within businesses). However, their supplementary explanatory comments were not always particularly helpful in identifying which particular areas of business development they had in mind, as distinct from more general suggestions for improvements. A few of the interviewees seemed to view Investors in People as being almost exclusively about HR development, with concerns about wider business objectives 'tacked on'. A few others suggested that if organisations wanted a model or standard covering the whole of the organisation they should opt for something like the Business Excellence Model. Some others also argued that the Standard should be more flexible, especially for small organisations.

Maintaining and pursuing the Standard
Page 62
7.3 Re-assessment amongst accredited organisations
7.3.1. When they were asked about their experiences of, or intentions towards, re-assessment against the Standard, more than half of the Recognised Organisations (see Table 7.3) indicated that they had been through the process at least once already; and most of the remainder said that they would seek re-accreditation in due course. The very small proportion indicating that they would not seek reassessment explained variously that they :
• believed they had already gained the benefits;
• thought the costs were too great;
• had undergone a change of ownership or management;
• had experienced no real benefits from involvement, or;
• were pursuing other standards.
Table 7.3 Re-assessment amongst Recognised Organisations, % Have been through re-assessment process once 40
Have been through re-assessment process twice or more 18
Currently going through re-assessment process for the first time
3
Not yet re-assessed - but will seek re-accreditation in due course
31
Have chosen not to be reassessed 3
Other 2
Don't know 4 No. of Respondents 563 Source: Surveys of Recognised Organisations, PACEC
7.3.2 Very few organisations that had been through the process said that re-accreditation per se had affected their operations and development, including HR and training practices21. However, where there had been changes, they were generally slight, involving only fine tuning. In addition, the large majority of organisations (80%) that had been re-assessed said that they were aware of recent changes to the Standard. The face to face interviews showed that these changes are generally welcomed; and that they may have a small positive influence on re-recognition decisions.
21 It will be recalled from Chapter 3, however, that the majority of Recognised Organisations said
that they had developed their HR plans, systems and processes further since recognition. Evidently, these developments occurred independently of re-recognition.

Maintaining and pursuing the Standard
Page 63
7.4 Progress of Committed Organisations
7.4.1 The survey of Committed Organisations found that nearly three in ten had either suspended their commitment for the time being22, or had abandoned it altogether23 (Table 7.4). The face to face interviews revealed no dominant explanations for suspension or abandonment, but the most frequent explanations were: lack of time and resources; cost; and, the volume of paperwork required. Small proportions also indicated that: belief in the benefits had disappeared; the Standard was no longer required, and; the organisation was closing down or being taken over by a management less favourable to Investors in People.
Table 7.4 Progress towards achieving the Standard amongst committed organisations, % Still progressing 70
Commitment suspended for the time being 14
Commitment abandoned 15
Don't know 1 No. of Respondents 355 Source: Survey of Committed Organisations, PACEC
7.4.2 Most of the Committed Organisations shown in Table 7.4 as still making progress towards the Standard indicated that they were progressing satisfactorily; and broadly according to the timetable they had set themselves. However, 15% indicated that they were making less or slower progress than they had hoped. Nearly half of these blamed pressure of time and work generally, and a sizeable minority blamed costs or financial problems. 7.4.3 Thus, while progress from commitment to recognition and beyond is important for the achievement of wider benefits, and the majority of employers report satisfactory progress, up to 45% of organisations seem to be, at best, making slower than expected progress.
22 Nearly half of these indicated that they would definitely or probably renew their commitment in
due course, compared to fewer than one in five who indicated that they would definitely or probably not.
23 Officially, there is no such thing as a suspended or abandoned commitment, but it is useful to distinguish these categories informally.

Maintaining and pursuing the Standard
Page 64
Summary of key findings
• Two thirds of Recognised Organisations said that Investors in People had been extremely or very useful to them in light of their business objectives (Table 7.1).
• Overwhelming majorities of Recognised and Committed Organisations would recommend Investors in People to others, mainly because it brings business benefits and provides a framework for human resources management (Table 7.2)
• There is a preference among Recognised Organisations for a more output-oriented process. A substantial proportion of Recognised and Committed Organisations also thought other areas of business development should be covered by the Standard (Paragraphs 7.2.2 and 7.2.5).
• Very few Recognised Organisations have chosen not to be reassessed (Table7.3).
• Progress from commitment to recognition and beyond is important for the achievement of wider benefits, internal and external, and while the majority of employers report satisfactory progress, up to 45% of organisations had either abandoned or suspended their commitment or were making slower than expected progress (Table 7.4, paragraphs 7.4.1 and 7.4.2.

Page 65
8. The Costs and Benefits of Investors in People
8.1. Introduction
8.1.1. It will be recalled from Chapter 1 (paragraph 1.2.2) that one of the two key underlying aims of the current research was to serve as a precursor to a fuller cost-benefit analysis and / or to identification of returns and rates of return to individuals, employers, and society from workforce development. The purpose of this chapter is to report how this aim was addressed and to show what was achieved. Before this, however, it might be useful to clarify what is meant by cost-benefit analysis and rates of return; and to discuss some of the inherent difficulties.
8.2. Definition of cost-benefit analysis and of rates of return
8.2.1. Cost-benefit analysis compares all social and private costs and benefits of a programme with a view to determining whether the benefits exceed the costs; and, if so, by how much. A key difficulty encountered in this approach is in the valuation of social costs and benefits. Social costs and social benefits usually have to be measured by some indirect means and converted into monetary values, so that a comparison can be made with private costs and benefits. Furthermore, it is often necessary to use shadow prices for cost and benefit items whose real value is not accurately represented by market prices. In addition, once monetary values for all private and social costs and benefits have been established, they all have to be discounted to a common point in time; and the appropriate interest rate which can be used to discount the various costs and benefits has to be chosen very carefully.24
8.2.2. It should be emphasised that cost-benefit analysis differs from the more simple and more commonly used cost-effectiveness analysis, which seeks to quantify the costs and benefits associated with a programme without the requirement to transfer costs and benefits into the same monetary units. A cost-effectiveness analysis of Investors in People would be possible by comparing the business performance effects data from the current research (see Chapter 4) with data on the costs of the programme25. This would yield information on cost per increment in turnover, employment and turnover per employee, but it would not provide a clear cost-benefit balance. Thus, whilst cost-effectiveness analysis would avoid the many practical and conceptual difficulties associated with cost-benefit analysis, it would fall some way short of satisfying the underlying aim. In any
24 European Commission DG XIX: Evaluating EU Expenditure Programmes: A guide. 1997 25 See for example: Research on the costs of Investors in People and related activities, DfES
Research Report 274, 2001

The Costs and Benefits of Investors in People
Page 66
case, the DfES has already reviewed a range of research and evaluation evidence which might feed into a cost-effectiveness analysis, or a more judgmental multi-criteria analysis, of Investors in People26. 8.2.3. Measuring rates of return to individuals, employers, and society from workforce development comes closer, than cost-effectiveness analysis does, to the ideal of a cost-benefit balance implied by the aim; and it is more practicable than cost-benefit analysis, at least with reference to individuals and employers. The rate of return is derived by comparing discounted cost and benefit streams, where costs and benefits are expressed in the same monetary units. As part of the current research, PACEC therefore adopted an experimental approach to the measurement of rates of return associated with Investors in People.
8.3. The approach adopted
8.3.1. Although the research involved surveys of employees of Recognised and Committed Organisations, there was no direct contact with them; and the self-fill employee questionnaires were returned anonymously in order to encourage a greaterresponse. Therefore, the additional information gathering necessary for estimation of rates of return needed to be focused on what could be obtained from the organisations interviewed. In light of this, it was decided that the costs to be taken into account should be the organisations' cash expenditure and value of in-kind expenditure associated with Investors in People. Benefits to employers (or more broadly, shareholders) were defined as increments of profits attributable to Investors in People. Benefits to individuals were defined as increments to income from employment per employee (i.e. wage / salary, plus pensions and other remuneration costs per employee). It was not considered possible to obtain data from the organisations surveyed which might define, or serve as a proxy for, social benefits. However, an attempt was made to assess whether benefits were externalised by asking organisations about the extent to which their customers benefited from their involvement in Investors in People, relative to the extent to which their employees and shareholders benefited.
8.3.2. Accordingly, a supplementary questionnaire was designed, which asked for information and data on:
• year of commitment / recognition
• cash expenditure, cost of staff time and cost of other inputs related to Investors in People, broken down by year since date of commitment
• value of any grants or other public support received
• all and main objectives in pursuing the Standard
• nature of business performance benefits derived
26 Department for Education and Skills: Review of Research and Evaluation on Investors in People, Research Brief No:RBX 18-01, October 2001.
The Costs and Benefits of Investors in People
Page 67
• extent to which customers, employees and shareholders benefited relative to one another
• increments to turnover, profits, employment and wage bill attributable to Investors in People, broken down by year since date of commitment
• nature and size of other benefits not covered elsewhere.
8.3.3 A year-by-year breakdown of costs and benefits was requested to enable discounting to produce net present values. The questions on the objectives in pursuing the Standard and the nature of performance benefits derived were included to focus attention on what might have monetary values attached. It was found from the earlier surveys of Recognised and Committed Organisations that 'bottom-line' and other performance effects (of the sort shown in Chapter 4) are often not directly sought and are often overlooked in favour of intermediate effects and changes (of the sort shown in Chapter 3). 8.3.4 It was also decided to request information only from Recognised Organisations because the earlier survey work clearly indicated that business performance effects tended to occur somewhat later than intermediate effects; and were, consequently, comparatively rare amongst Committed Organisations. In addition, because it was anticipated that organisations might find the supplementary information and data requests difficult to comply with, it was decided to restrict the requests to Recognised Organisations that had been amenable to face-to-face (i.e. more in-depth) interviews earlier in the research and that had been able to provide quantitative point-in-time information on their turnover and employment; and, at minimum, a qualitative indication of how Investors in People had affected these variables. In other words, only 'good prospects' were to be targeted for the supplementary research.
8.4. The results
8.4.1. Twenty 'good prospects' were identified from the 100 Recognised Organisations interviewed face-to-face as part of the earlier research. All were telephoned and asked to co-operate further, after it had been outlined what additional information and data would be requested from them. At this stage, nine organisations indicated that they could not assist, chiefly because they did not feel that they would be able to provide data in the form requested (especially the year-by-year cost and benefit data). 8.4.2. The remaining eleven organisations were then sent the questionnaires outlined above. Eight returned them partially completed, mainly after prompting and reassurances that approximations of the value of costs and benefits would be acceptable. The other three indicated that they had completed the questionnaires and had posted them, although none of the three was actually received.

The Costs and Benefits of Investors in People
Page 68
8.4.3. On the issue of costs, six of the eight organisations that returned the questionnaires were able to identify cash expenditure on training related to Investors in People and they were able to show how the expenditure was spread over time. The amounts varied from just £1,600 in one year only, to an average of £109,000 a year over three years. None could estimate the cost or distribution of managerial and other staff time, although one estimated the cost of one director's time spent on re-accreditation at £8,000. Only two could identify other costs (mainly for consumables and other incidental expenses). Five were able to specify how much they had received in grants and other support (i.e. an average of £2,500). 8.4.4. All of the respondents indicated that there had been some business performance benefits, although two of them volunteered that they would find it impossible to provide hard evidence to prove this. However, only half were able to indicate how they thought the benefits had been distributed between employees, shareholders and customers. None actually indicated a shareholder benefit; but employees were thought to have benefited slightly more than customers. 8.4.5. It transpired that the provision of time series information on the value of benefits was highly problematic. Half of the respondents indicated that they did not wish to divulge information on turnover, employment costs and profits; and another said that a purchase and a sale affecting part of the business made meaningful data impossible to provide. Five showed how their employment numbers had changed over time, but only one attributed an effect on employment to Investors in People.
8.5. Lessons to be learned for future cost-benefit analysis and /or measurement of rates of return
8.5.1. On the face of it, the results of the attempt to measure rates of return from involvement in Investors in People using the approach adopted were very disappointing, especially as 'good prospects' were targeted for the experiment. However, potentially valuable lessons for any future attempts to compare the cost and benefits of the Standard can be identified.
8.5.2. The first is that time series costs seem to be more easily identifiable than time series benefits. However, this really only includes cash costs, rather than the 'in-kind' costs of management and other staff time devoted to the pursuit and maintenance of the Standard. Based on feedback from the organisations involved in the supplementary research, only cash costs can be reliably identified because, especially in the case of managerial input, time spent in relation to training and development for the purposes of pursuing or maintaining the Standard is not consciously distinguished from other training and development. This other training and development most commonly includes activities driven by legislation (e.g. on health and safety), which must occur if the organisation is to function at
The Costs and Benefits of Investors in People
Page 69
all. 8.5.3. The second is that usable data on the distribution of business performance benefits over time was almost impossible to obtain. This might prompt the question of whether there were any performance benefits to measure, but this would be to misdiagnose the problem, given that three quarters of the organisations targeted for the supplementary research had earlier indicated that they had enjoyed business performance benefits. Nor is it because data on performance is inherently difficult to obtain using the methodology implemented, given that all the organisations targeted had earlier been able to provide at least some data on their performance in the latest financial year and three years previously. Rather, it appears from the feedback that there are two problems:
(a) That organisations perceive performance benefits in the round (e.g. including such things as improved staff morale and easier recruitment), but not necessarily in a way that might be reflected in standard financial statements; and
(b) That organisations find it difficult to trace how performance benefits unfold over time.
8.5.4. It is possible that the organisations selected as 'good prospects' for the supplementary research comprised a rogue sample, but this is unlikely. Both the problems discussed above, and the fact that some types of costs are difficult to separate and evaluate, therefore, seem to point towards the overall conclusion that any attempt to assess cost and benefit balances associated with Investors in People has a high probability of failure. However, this is not necessarily the case; and it is believed that an alternative to ex-post collection of data should be considered. 8.5.5. The alternative proposed is real-time data collection, based on a case study approach. This would involve engaging the co-operation of a number of organisations at, or around, the time of commitment. At the outset, the organisations would be told what type of information and data would be requested; and they would be given guidance on how to collect or identify what is needed. The organisations would also be interviewed on a regular basis (perhaps annually) up to the time of recognition and beyond. The interviews would comprise structured discussions, designed to enable costs and benefits to be defined, measured and ultimately converted into monetary units. In particular, the discussions would be vital in exploring the link between performance benefits 'in-the-round' (of the variety alluded to above) and benefits that are reflected in financial statements. The key problems encountered in the current research (i.e. separating and valuing costs and benefits and identifying their distribution over time) would be circumvented.
Summary of key findings

The Costs and Benefits of Investors in People
Page 70
• Full cost-benefit analysis of Investors in People would be fraught with conceptual and practical problems (Paragraph 8.2.1).
• Cost-effectiveness analysis of the programme would be simpler, but it would not clarify the cost-benefit balance (Paragraph 8.2.2).
• An experimental approach to measuring rates of return associated with Investors in People was adopted (Paragraphs 8.3.1-8.3.3).
• It proved to be especially difficult to obtain time series data on the benefits of involvement with the Standard (Paragraph 8.4.5).
• Although the results of the experiment seemed disappointing, important lessons for future attempts to compare the costs and benefits of Investors in People could be learned (Paragraphs 8.5.1-8.5.4).
• An alternative approach based on real-time data collection from case study organisations should be considered (Paragraph 8.5.5).

Page 71
9. Conclusions
9.1. General conclusions
9.1.1. This report has confirmed the finding from previous research that Investors in People has a clear and positive impact on Recognised and Committed Organisations' approaches and dedication to training and development. It has shown that participating organisations generally achieve their objectives in pursuing the standard; and are largely satisfied with their experiences of the Standard and the benefits it provides. It has also shown that the changes organisations make in pursuit of the Standard and after they have reached it, and the other intermediate effects and performance benefits they experience as a result, are additional to a large extent. Nonetheless, it is still not entirely clear whether, or to what extent, Investors in People has a significant impact on 'hard' business performance measures that might be included in standard financial statements and economic impact research.
9.1.2. However, as was intended, this research has gone beyond previous research into Investors in People. In particular, it has demonstrated that there has been an increased focus and growing awareness on the wider effects of organisations' participation:
• comparison with the findings of previous research indicates that the objectives in pursuing Investors are widening. For instance, only 10% of organisations involved with Investors at the time of IES 1995 survey "The Return on Investors" anticipated increased quality of goods and services as a result of their involvement. The current (2001) survey found that nearly a half of organisations pursued this as a broad objective. Likewise, only 8% saw Investors improving their financial performance in 1995, compared with 25-30% that now see Investors as a means to increased profitability and/or business growth;
• comparison based on the current and 1995 surveys of the anticipated benefits that have been realised reveals a greater realisation of wider benefits in the current survey. For example, over 90% of those anticipating increased profitability thought that they had achieved this at least to some extent - this compares with the findings of the 1995 survey in which just 43% of those anticipating improved financial performance said this had been realised;
• the increase in adoption of formal training plans, structures etc. across all organisations since the mid 1990s seems at least in part to have been due to the growing awareness of Investors in People, albeit that most non-Investors do not fully understand what Investors actually involves;
• the results of the survey would indicate that progress from

Conclusions
Page 72
commitment to recognition and beyond is important for the achievement of wider benefits, internal and external, and while the majority of employers report satisfactory progress towards recognition, up to 45% of organisations had either abandoned or suspended their commitment or were making slower than expected progress;
• the majority of organisations continue to develop their HR plans, systems and processes post-recognition (and not simply in order to gain re-recognition). There is also evidence that the effects of the Standard persist and, if anything, accumulate rather than fade over time However, the research suggests that involvement in Investors in People creates its own momentum and that it is not the process of re-recognition per se that prompts ongoing changes.;
• It is unclear to what extent employees benefit from organisations' participation in Investors in People in terms of the net additional amount of training received. However, employees of organisations involved in Investors in People indicate that there is a net positive impact on their attitudes towards education and training (both related and unrelated to their jobs) and their performance at work. Employers tend to share these views;
• a few organisations recognise that their involvement affects their customers, suppliers and competitors (but it has to be admitted that most do not know whether there has been any effects).
9.1.3 In terms of the overall 'position' of Investors in People, this research has also suggested that the Standard appeals to organisations which are relatively ambitious to grow, and which already attach relatively great importance to human resource management and development. These factors should be taken into account in the assessment of the wider role and benefits of the Standard and its marketing. 9.1.4 Recognised Organisations are more likely than other organisations to have achieved other externally accredited standards. However, Investors in People and other standards are generally seen as complementary; and there is no clear evidence that Investors in People leads to the pursuit of other standards, or vice versa. Recognised and Committed Organisations tend to use other good practices, but the practices they follow do not obviously mark them out as being in the vanguard of the leading edge in HR management and development. 9.1.5 The experimental approach towards the measurement of rates of return associated with Investors in People adopted by this research proved to have disappointing outcomes, but it did cast light on what might be a feasible (albeit longer-term) method of identifying the cost-benefit balance.
9.2. Conclusions on the specified research issues
9.2.1. A number of specific research issues were listed in
Conclusions
Page 73
Chapter 1. Several of the questions have already been answered in the general conclusions above, but for the sake of clarity the questions and answers are as follows. The key point summaries at the end of the chapters referred to will be helpful in finding precise evidence required.
9.2.2. To what extent has Investors in People impacted on organisations involved with the Standard?
Chapter 3 pointed to a range of widely occurring intermediate effects. However, Chapter 4 showed that these did not necessarily translate into clear business performance impacts.
9.2.3. Has the process of achieving the Standard stimulated ongoing changes and development within the organisations, with regard to HR practices, structure and culture?
Chapter 3 (see especially Table 3.4) indicated that ongoing changes and developments very frequently continue post-recognition. Chapter 7 implied that involvement in Investors in People creates its own momentum and that it is not the process of re-recognition that prompts ongoing changes.
9.2.4. Have the benefits persisted and widened, or has Investors in People had one-off effects?
Chapter 3 (see especially Table 3.6) showed that the effects and benefits generally persist; and that they accumulate more often than they fade. Wider impacts within the organisation are felt, but wider impacts external to involved organisations are difficult to discern (Chapter 5).
9.2.5. Was Investors in People a necessary condition for these changes?
Investors in People can be described as a necessary condition for these changes in the majority of cases. Chapter 3 showed that around half of the Recognised and Committed Organisations would not have taken alternative actions in the absence of the Standard to achieve the same effects. Furthermore, many organisations that claimed they would have taken alternative actions would have acted later and / or on a smaller scale; and some could not say what they would have done otherwise.
9.2.6. Do the changes differ across sectors and types of organisation?
It does not appear from Appendix B that the changes vary across sectors and types of organisation in a clear and consistent fashion. However, Chapter 2 indicated that smaller organisations are less likely than larger organisations to become involved in Investors in People without public sector support. Chapter 3 indicated that the Standard had a greater effect on smaller organisations', than on larger organisations', HR plans systems and processes. Estimated additionality of effects was also greater amongst smaller organisations than amongst larger organisations.
9.2.7. Are Recognised Organisations generally in the vanguard of 'leading-edge' HR practice?
Recognised Organisations tend to use other good HR practices in addition to conforming with the Standard, but the other good practices used are not such as to mark out the Recognised Organisations as being leading edge (Chapter

Conclusions
Page 74
6).
9.2.8. What do employers generally now expect from HR initiatives?
It is not clear from the research findings what employers generally now expect from HR initiatives. However, it is clear (see chapter 7) that the organisations involved with Investors in People are generally satisfied with the Standard the way it is. Relatively few of them indicated that they would like to see changes to the Standard per se.
9.2.9. And where and how large are the gaps between practices and expectations on the part of Recognised Organisations and organisations more generally?
Recognised Organisations attach greater importance than other organisations to HR management and development (Appendix A), although it is not clear whether this is the result of their involvement with the Standard or whether their attitudes pre-dispose them to it.
9.2.10. What has been the impact of Investors in People on employees of Recognised Organisations?
Chapter 5 showed that employees of Recognised Organisations tend to become more positive in their attitudes towards education and training generally (i.e. not just directly related to their jobs). They also perform better at work and are more motivated.

Page 75
Appendix A: Backgrounds and Characteristics of Organisations Surveyed
A1 Introduction
A1.1 Largely as an aid to the analysis in the main body of the report, this appendix describes the backgrounds and characteristics of the Recognised Organisations, Committed Organisations and Non-Investors surveyed. As far as possible, survey findings from the three groups are shown alongside one another and statistically significant differences are highlighted.
A2 Type, sector, age etc
A2.1 Table A.1 reveals that the Recognised Organisations surveyed were less likely than the Committed Organisations and the Non-Investors to be businesses; and that they were, correspondingly, more likely to be public sector bodies / organisations. Recognised Organisations were also more likely than Non-Investors to be voluntary / non-profit organisations. The fact that relatively many Recognised Organisations are in the public sector might reflect the fact that these organisations are more amenable than private businesses to influence or encouragement to 'sign-up' to what is, after all, a flagship public policy measure.
Table A.1 Status of the organisations surveyed, % Recognised
Organisations Committed
Organisations
Non-Investors
Businesses 76 84 92 Public sector bodies / organisations
12 7 2
Voluntary / non-profit organisations
9 7 5
Other 2 1 1 No. of Respondents 594 358 262 We can be 95% certain that figures in bold are different from those for Recognised Organisations
Source: Surveys of Recognised Organisations, Committed Organisations and Non-Investors, PACEC
A2.2 Table A.2 shows, for businesses only, date of start-up. Interestingly, it reveals that, aside from the fact that relatively few Committed businesses started-up pre-war, the three types of organisations surveyed were not significantly different from one another in terms of their age distribution.
Page 76
Table A.2 Starting date of businesses, % (businesses only) Recognised
Organisations Committed
Organisations
Non-Investors
Pre 1940 15 9 11
1940-59 7 6 6
1960-79 19 21 24
1980-89 32 31 26
1990 onwards 27 32 32 No. of Respondents 423 290 235 We can be 95% certain that figures in bold are different from those for Recognised Organisations
Source: Surveys of Recognised Organisations, Committed Organisations and Non-Investors, PACEC
A2.3 Table A.3, however, shows that the three groups were different from one another in terms of their broad sectoral distribution. As compared with Recognised Organisations, Committed Organisations were more likely to be in one of the production industries and, correspondingly, less likely to be in the mainly private services (e.g. distributive trades and financial and business services). Also compared to Recognised Organisations, Non-Investors were considerably more likely to be in the mainly private services and considerably less likely to be in the mainly public services (i.e. education, health and public administration).
Table A.3 Organisations' main products and services, % Recognised
Organisations Committed
Organisations
Non-Investors
Production industries (SIC A-E) 18 28 20 Mainly Private services (SIC F-K & O)
49 38 68
Mainly Public services (SIC L-N) 33 34 12 No. of Respondents 269 160 99 We can be 95% certain that figures in bold are different from those for Recognised Organisations
Source: Surveys of Recognised Organisations, Committed Organisations and Non-Investors, PACEC
A2.4 Table A.4 indicates that Recognised Organisations were less likely than both Committed Organisations and Non-Investors to be single site entities and, as a consequence of this, less likely to say that the site covered by the interview performed all corporate or organisational functions. Non-Investors, in particular, were more likely to say that they were simply a branch of a larger organisation. It was also found that, amongst the Recognised Organisations and Committed Organisations which were part of a multi-site operation, the accreditation or commitment covered the whole organisation in just over six in ten cases (62% amongst Recognised Organisations and 63% amongst Committed Organisations).

Page 77
Table A.4 Status and function of sites surveyed, % Recognised
Organisations Committed
Organisations
Non-Investors
Status of site: Single-site organisations 45 53 57 Part of multi-site organisation
55 47 43
No. of Respondents 587 350 258 Function of site:
All functions (i.e. single site) 48 56 58 Head office 22 21 17
Regional or divisional office 17 9 3 Branch 9 13 22 Other 3 1 0
No. of Respondents 547 335 252 We can be 95% certain that figures in bold are different from those for Recognised Organisations
Source: Surveys of Recognised Organisations, Committed Organisations and Non-Investors, PACEC
A2.5 Table A.5 reveals that the Recognised Organisations were larger, in terms of number of employees, than the Committed Organisations; and that the latter were, in turn, larger than the Non-Investors.
Table A.5 Average size of organisations surveyed Recognised
Organisations Committed
Organisations
Non-Investors
Mean No. of employees 350 234 218 Median No. of employees 60 40 18 No. of Respondents 453 316 221 We can be 95% certain that figures in bold are different from those for Recognised Organisations
Source: Surveys of Recognised Organisations, Committed Organisations and Non-Investors, PACEC
A3 Growth objectives and culture
A3.1 The businesses amongst the organisations surveyed were asked about their overall growth objectives, in part to examine whether ambition to grow is particularly associated with involvement with Investors in People. Table A.6 shows the businesses' responses and it contains several notable features. First, it shows that the Recognised Organisations and Committed Organisations were almost identical in terms of their overall growth objectives, but that they were different in terms of the particular aspects of the business they wanted to grow. The Committed Organisations were more likely than Recognised Organisations to specify that they wanted to grow market share and profits, whereas the Recognised Organisations were more likely to say that they wanted to grow all aspects of the

Page 78
businesses. The reasons for this are not immediately clear. However, it might be speculated that during the process of working towards the Standard organisations tend to focus on just one or two particular objectives, whereas they feel able to widen their objectives once they have become Recognised Organisations.
Table A.6 Growth objectives, % (businesses only) Recognised
Organisations Committed
Organisations
Non-Investors At the time of commitment:
Grow smaller 1 1 n/a
Stay the same size 27 27 n/a
Grow moderately 64 66 n/a
Grow rapidly 8 6 n/a No. of Respondents 420 294 n/a
Now: Grow smaller 2 4 3
Stay the same size 27 26 36 Grow moderately 64 63 50 Grow rapidly 7 7 11 No. of Respondents 422 298 240
Particular aspects businesses want to grow: (more than one answer possible)
Sales 30 34 28
Market share 36 50 13 Profits 33 47 17 Patients / clients / contracts 1 2 1
Other 7 8 10
All aspects 50 22 57 No. of Respondents 309 206 141 We can be 95% certain that figures in bold are different from those for Recognised Organisations
Source: Surveys of Recognised Organisations, Committed Organisations and Non-Investors, PACEC
A3.2 The second key feature of Table A.6 is that it shows that the Non-Investors were more likely than the Recognised Organisations and Committed Organisations to indicate that they aimed to stay the same size. In addition, those Non-Investors indicating that they wanted to grow were less likely than growth-orientated Recognised Organisations and Committed Organisations to specify market share and profits as the focus of their ambitions. A3.3 All organisations, regardless of type, were asked to rate possible factors in their success, in order to gauge how they perceived the relative importance of human resource management and development. Table A.7 shows that Recognised Organisations and Committed Organisations assigned greater importance than Non-Investors to each organisational function rated. The table also suggests that Recognised Organisations and Committed Organisations implicitly

Page 79
ranked human resource management and development more highly than Non-Investors. Moreover, it appears that, in the eyes of Non-Investors, human resource management and development is of considerably less importance than the top-rated functions, whereas there is less of a gap in the case of Recognised Organisations and Committed Organisations.
Table A.7 Rating of factors in organisations' success, mean ratings on a scale from 1 to 10, where 1= not important at all ..... 10= crucially important Recognised
Organisations Committed
Organisations
Non-Investors
Financial management 9.7 9.5 8.9 Operational management 9.7 9.2 8.5 HR management and development 9.6 9.3 7.5 Marketing 8.6 8.1 7.7 Design, innovation and creativity 8.4 7.4 6.9 Corporate and internal communications
9.2 8.7 6.8
No. of Respondents 554 349 248 We can be 95% certain that figures in bold are different from those for Recognised Organisations
Source: Surveys of Recognised Organisations, Committed Organisations and Non-Investors, PACEC
A3.4 The organisations interviewed face to face were also asked why human resource management and development was important to them; and, for the most part, the broad pattern of response was the same for Recognised Organisations, Committed Organisations and Non-Investors. All three groups most frequently associated organisational success and good business performance with a motivated and satisfied workforce. All three groups also tended to make a connection between staff development and client satisfaction. However, the Non-Investors did not directly associate human resource management and development with staff retention, whereas the other two groups did. The Non-Investors were also notable for implying simply that staff development was something that had to be done without associating it with any particular outputs or benefits. A3.5 The results in Table A.7 indicating the importance attached to HR management and development by Recognised and Committed Organisations might be taken to signify that these organisations are pre-disposed to the implementation of good practices in this field; and that they did not need Investors in People to introduce the sort of changes described in Chapter 3 of the main part of the report (e.g. new or improved HR plans, systems and practices). However, the same chapter showed that many of the changes in question were additional (i.e. would not have happened without the Standard). Moreover, it is possible that the importance attached to HR management and development by Recognised and Committed Organisations is partly an effect of involvement with Investors in People (i.e. is in itself an effect of involvement, rather than simply a cause).

Page 80
A4 Management of training and development
A4.1 All three groups were then asked a number of questions to examine how they approached human resource management and development; and some major differences were found. Table A.8 indicates that Non-Investors were very dissimilar from Recognised Organisations and Committed Organisations, even allowing for the fact that they were smaller in terms of employment (see Table A.5). Most notably, the Non-Investors were considerably less likely than the Recognised Organisations and Committed Organisations to have an HR department or an HR manager. Almost as notably, nearly one-fifth of Non-Investors said that no one in their organisation was responsible for the function because it was not necessary27.
Table A.8 Responsibility for HR management and development, % Recognised
Organisations
Committed Organisation
s
Non-Investors
Part of MD / director / manager's job 46 53 56 Separate HR department 28 22 4 Employ HR manager(s) but no separate HR dept.
17 15 2
Responsibility of the Head Office 4 4 17 Use other approach to HR management 5 6 3
No one responsible - HR management not necessary
n/a n/a 18
No. of Respondents 562 349 259 We can be 95% certain that figures in bold are different from those for Recognised Organisations
Source: Surveys of Recognised Organisations, Committed Organisations and Non-Investors, PACEC
A4.2 As Table A.9 shows, the Non-Investors were very much less likely than the Recognised Organisations to have a specific budget for training and HR development. However, it will be noted that a sizeable proportion of the Committed Organisations also lacked a budget. Organisations that indicated they had a budget were rather more likely to say that it had increased than to say it had decreased during the last three years, but in all three groups the budget was most likely not to have changed. A surprisingly large proportion of the Non-Investors claiming to have a budget for training and HR development did not know how the budget had changed.
27 It was assumed that, almost by definition, Investors and Committed Organisations would have
designated responsibility for HR management and development.
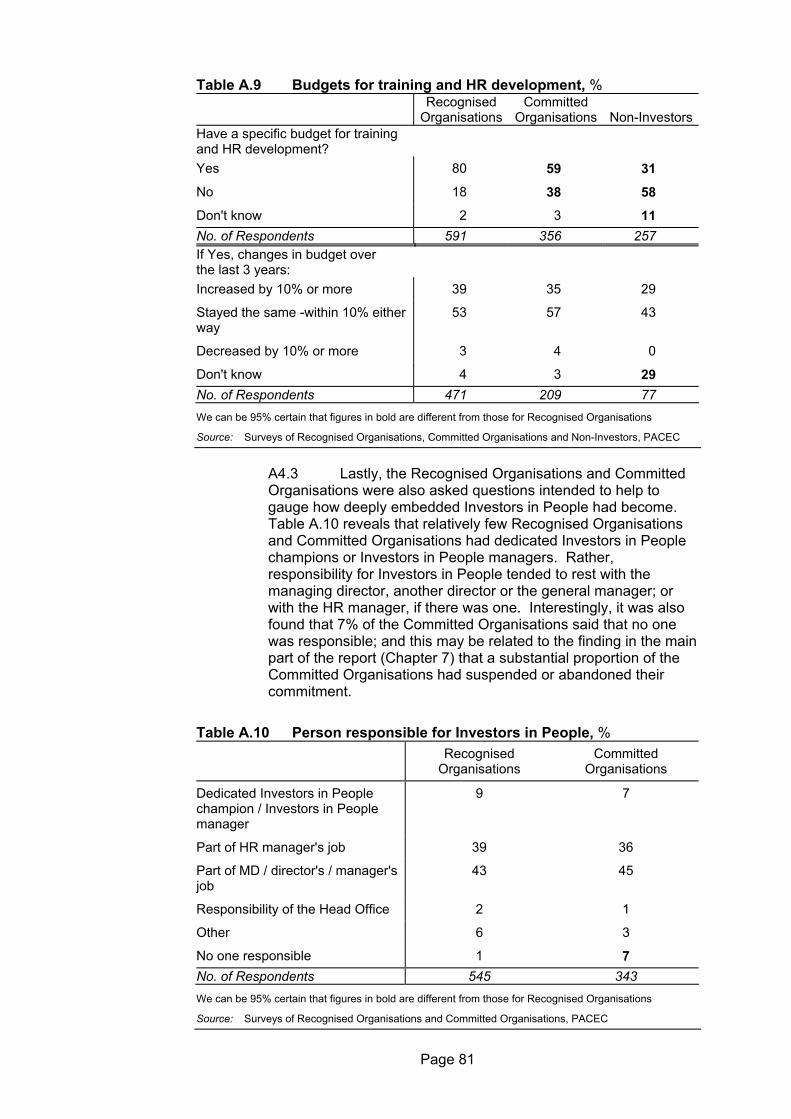
Page 81
Table A.9 Budgets for training and HR development, % Recognised
Organisations Committed
Organisations
Non-Investors Have a specific budget for training and HR development? Yes 80 59 31 No 18 38 58 Don't know 2 3 11 No. of Respondents 591 356 257 If Yes, changes in budget over the last 3 years: Increased by 10% or more 39 35 29
Stayed the same -within 10% either way
53 57 43
Decreased by 10% or more 3 4 0
Don't know 4 3 29 No. of Respondents 471 209 77 We can be 95% certain that figures in bold are different from those for Recognised Organisations
Source: Surveys of Recognised Organisations, Committed Organisations and Non-Investors, PACEC
A4.3 Lastly, the Recognised Organisations and Committed Organisations were also asked questions intended to help to gauge how deeply embedded Investors in People had become. Table A.10 reveals that relatively few Recognised Organisations and Committed Organisations had dedicated Investors in People champions or Investors in People managers. Rather, responsibility for Investors in People tended to rest with the managing director, another director or the general manager; or with the HR manager, if there was one. Interestingly, it was also found that 7% of the Committed Organisations said that no one was responsible; and this may be related to the finding in the main part of the report (Chapter 7) that a substantial proportion of the Committed Organisations had suspended or abandoned their commitment.
Table A.10 Person responsible for Investors in People, % Recognised
Organisations Committed
Organisations
Dedicated Investors in People champion / Investors in People manager
9 7
Part of HR manager's job 39 36
Part of MD / director's / manager's job
43 45
Responsibility of the Head Office 2 1
Other 6 3
No one responsible 1 7 No. of Respondents 545 343 We can be 95% certain that figures in bold are different from those for Recognised Organisations
Source: Surveys of Recognised Organisations and Committed Organisations, PACEC

Page 82
A4.4 Previous research by PACEC for the TECs had revealed that a key reason for Committed Organisations failing to reach the Standard, and for Recognised Organisations failing to maintain the Standard, was that there was one person chiefly responsible for Investors in People, who was not necessarily replaced when he or she left the organisation. Accordingly, those organisations which indicated that they had a dedicated Investors in People champion or manager were asked whether they had considered what would happen if this individual left for whatever reason. As Table A.11 shows, the majority of such organisations had given the matter some thought and generally suggested that the Investors in People champion or manager would be replaced by external or internal recruitment. However, the table also suggests that a large minority of the Recognised Organisations had not given the matter much thought, implying that maintenance of the Standard was not necessarily guaranteed.
Table A.11 What would happen without the Investors in People champion or manager, % of organisations employing an Investors in People champion/manager Recognised
Organisations Committed
Organisations Considered what would be done if Investors in People champion / manager were to leave? Yes 71 89
No 19 11
Don't know 10 0 No. of Respondents 31 9 If Yes, What would happen? Re-appointment 69 17 Role taken over by another member of staff 15 67 Responsibility shared across organisation 0 17
HR systems /practices embedded in the organisation
23 17
No. of Respondents 13 6 We can be 95% certain that figures in bold are different from those for Recognised Organisations Source: Surveys of Recognised Organisations and Committed Organisations, PACEC

Page 83
APPENDIX B: DISAGGREGATED RESULTS FROM THE SURVEY OF RECOGNISED ORGANISATIONS
Table B.1 Which of the following best describes your organisation? Percentage of all respondents Year of
recognition Employment Sector Organisation type
Total Pre-1998
1998 onward
s
<10 10-49 50-249
250+ Production
Private service
s
Public service
s
Business
Public sector
Voluntary/ non-profit
A business 76 75 76 85 81 74 62 97 90 63 100 0 0 A public sector body/organisation
12 13 12 4 8 14 26 0 3 20 0 100 0
A voluntary/non-profit organisation
9 8 11 12 10 9 8 1 2 15 0 0 100
Other 2 5 1 0 1 3 4 2 5 1 0 0 0 Respondents 593 238 353 26 235 257 73 100 144 339 450 73 56 A bold figure indicates a 95% confidence that that category differs from the other categories in that particular disaggregation Source: PACEC survey of recognised organisations (Inv6, Com6, Non6)

Page 84
Table B.2 (Businesses only) When did your business start trading?
Percentage of all respondents Year of
recognition Employment Sector Organisation type
Total Pre-1998
1998 onward
s
<10 10-49 50-249 250+ Production
Private service
s
Public service
s
Business
Public sector
Voluntary/ non-profit
Pre war 36 38 36 17 27 42 55 16 25 46 15 100 100 40s, 50s 5 4 6 0 4 6 6 14 2 3 7 0 0 60s, 70s 14 15 14 8 15 15 11 23 24 8 19 0 0 80s 24 26 23 29 30 21 15 27 29 21 32 0 0 1990+ 20 18 22 46 25 16 12 20 20 21 27 0 0 Respondents 566 224 340 24 226 249 65 97 133 327 423 73 56 A bold figure indicates a 95% confidence that that category differs from the other categories in that particular disaggregation Source: PACEC survey of recognised organisations (Inv7, Com7, Non7) Table B.3 What is your organisation's main product or service?

Page 85
Percentage of all respondents Year of
recognition Employment Sector Organisation type
Total Pre-1998
1998 onward
s
<10 10-49 50-249 250+ Production
Private service
s
Public service
s
Business
Public sector
Voluntary/ non-profit
Production 17 20 15 4 14 20 21 100 0 0 22 0 2 Private services 25 25 25 24 23 25 28 0 100 0 29 5 5 Public services 58 55 61 72 62 55 51 0 0 100 49 95 93 Respondents 583 231 350 25 231 253 72 100 144 339 442 73 55 A bold figure indicates a 95% confidence that that category differs from the other categories in that particular disaggregation Source: PACEC survey of recognised organisations (Inv8, Com8, Non8) Table B.4 Is the place where you work...?
Percentage of all respondents Year of
recognition Employment Sector Organisation type
Total Pre-1998
1998 onward
s
<10 10-49 50-249 250+ Production
Private service
s
Public service
s
Business
Public sector
Voluntary/ non-profit
One of a no of different sites within a larger org'n
55 58 53 17 33 72 79 56 58 54 52 72 53
Single independent site not part of a larger org'n
45 42 47 83 67 28 21 44 42 46 48 28 47
Respondents 587 236 349 24 234 255 72 99 144 335 447 71 55 A bold figure indicates a 95% confidence that that category differs from the other categories in that particular disaggregation Source: PACEC survey of recognised organisations (Inv9, Com9, Non9)

Page 86
Table B.5 (If more than one site) Is the place where you work...?
Percentage of all respondents Year of
recognition Employment Sector Organisation type
Total Pre-1998
1998 onward
s
<10 10-49 50-249 250+ Production
Private service
s
Public service
s
Business
Public sector
Voluntary/ non-profit
Single site 48 46 50 83 70 32 21 44 45 51 51 33 48 The head office 22 23 22 4 17 25 39 19 22 23 20 37 26 A regional or divisional office
17 20 16 4 9 25 20 27 16 15 17 18 15
A branch (incl. warehouse, and call centre)
9 7 10 8 3 13 17 8 14 8 9 8 7
Other 3 4 2 0 0 5 3 1 3 3 2 3 4 Respondents 547 218 327 24 223 228 70 99 136 304 424 60 54 A bold figure indicates a 95% confidence that that category differs from the other categories in that particular disaggregation Source: PACEC survey of recognised organisations (Inv10, Com10, Non10)
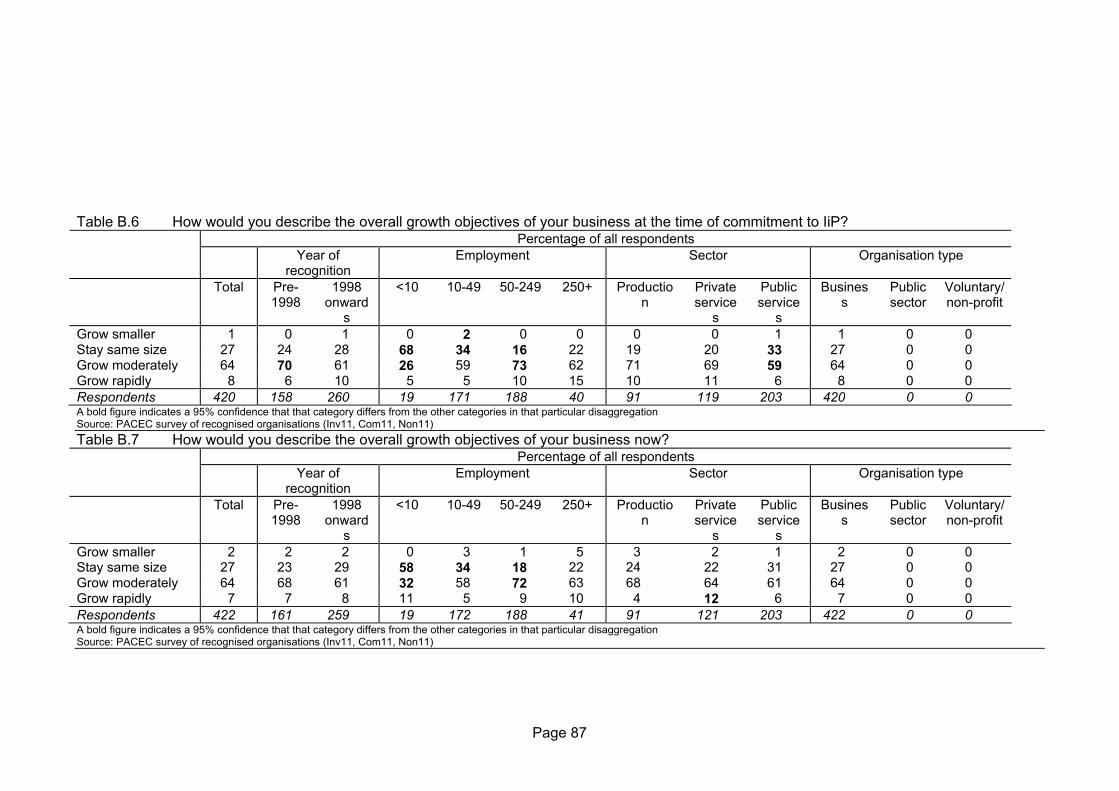
Page 87
Table B.6 How would you describe the overall growth objectives of your business at the time of commitment to IiP?
Percentage of all respondents Year of
recognition Employment Sector Organisation type
Total Pre-1998
1998 onward
s
<10 10-49 50-249 250+ Production
Private service
s
Public service
s
Business
Public sector
Voluntary/ non-profit
Grow smaller 1 0 1 0 2 0 0 0 0 1 1 0 0 Stay same size 27 24 28 68 34 16 22 19 20 33 27 0 0 Grow moderately 64 70 61 26 59 73 62 71 69 59 64 0 0 Grow rapidly 8 6 10 5 5 10 15 10 11 6 8 0 0 Respondents 420 158 260 19 171 188 40 91 119 203 420 0 0 A bold figure indicates a 95% confidence that that category differs from the other categories in that particular disaggregation Source: PACEC survey of recognised organisations (Inv11, Com11, Non11) Table B.7 How would you describe the overall growth objectives of your business now?
Percentage of all respondents Year of
recognition Employment Sector Organisation type
Total Pre-1998
1998 onward
s
<10 10-49 50-249 250+ Production
Private service
s
Public service
s
Business
Public sector
Voluntary/ non-profit
Grow smaller 2 2 2 0 3 1 5 3 2 1 2 0 0 Stay same size 27 23 29 58 34 18 22 24 22 31 27 0 0 Grow moderately 64 68 61 32 58 72 63 68 64 61 64 0 0 Grow rapidly 7 7 8 11 5 9 10 4 12 6 7 0 0 Respondents 422 161 259 19 172 188 41 91 121 203 422 0 0 A bold figure indicates a 95% confidence that that category differs from the other categories in that particular disaggregation Source: PACEC survey of recognised organisations (Inv11, Com11, Non11)

Page 88
Table B.8 What particular aspect(s) of your business do you especially want to grow? Percentage of all respondents Year of
recognition Employment Sector Organisation type
Total Pre-1998
1998 onward
s
<10 10-49 50-249 250+ Production
Private service
s
Public service
s
Business
Public sector
Voluntary/ non-profit
Sales 32 20 40 38 26 36 30 31 43 25 32 0 0 Market share 39 14 55 25 29 48 27 30 36 44 39 0 0 Profits 35 20 45 25 26 43 30 25 42 36 35 0 0 Other 4 2 5 12 6 1 7 3 7 2 4 0 0 All 52 76 35 62 50 49 67 64 42 51 52 0 0 Respondents 283 114 168 8 98 146 30 64 88 126 283 0 0 A bold figure indicates a 95% confidence that that category differs from the other categories in that particular disaggregation Source: PACEC survey of recognised organisations (Inv11, Com11, Non11) Table B.9 Can you indicate on a scale of 1-10, where 1 is not at all important and 10 is crucially important, how you see the following in terms of their importance to the success of your organisation? (Mean ratings)

Page 89
Average of all respondents Total Pre-
1998 1998
onwards
<10 10-49 50-249 250+ Production
Private service
s
Public service
s
Business
Public sector
Voluntary/ non-profit
Financial management
9.7 9.7 9.7 9.8 9.7 9.7 9.5 9.6 9.6 9.7 9.7 9.7 9.5
Operational management
9.7 9.6 9.8 9.7 9.7 9.8 9.5 9.4 9.5 9.9 9.8 9.6 9.4
Human resource management and development
9.6 9.6 9.6 9.4 9.6 9.6 9.5 9.3 9.5 9.7 9.5 9.7 9.7
Marketing 8.6 8.9 8.4 9.4 8.6 8.5 8.8 8.8 9.2 8.3 9.0 7.0 7.3 Design, Innovation and Creativity
8.4 8.7 8.2 8.8 8.2 8.5 9.0 8.6 8.9 8.2 8.6 7.5 7.6
Corporate and internal communications
9.2 9.1 9.3 9.1 9.2 9.2 9.1 8.9 9.3 9.2 9.3 9.1 8.9
Respondents 554 221 331 25 219 246 62 94 133 318 423 63 54 Source: PACEC survey of recognised organisations (Inv12, Com12, Non12) Table B.10 Which of the following applies to your organisation?

Page 90
Percentage of all respondents Year of
recognition Employment Sector Organisation type
Total Pre-1998
1998 onward
s
<10 10-49 50-249
250+ Production
Private service
s
Public service
s
Business
Public sector
Voluntary/ non-profit
HR management part of the MD/Director/Manager's job
46 51 42 83 70 30 10 42 40 50 49 23 49
Separate HR department
28 27 30 4 14 31 76 30 35 25 25 55 24
Employ own HR manager(s) without separate HR department
17 12 20 4 10 28 4 20 18 15 18 9 16
HR management is the responsibility of the Head Office
4 4 4 0 3 4 6 3 3 4 4 5 2
Use other approach to HR management
5 6 5 9 3 7 4 5 4 5 4 8 9
Respondents 562 224 336 23 230 237 70 97 139 316 432 64 55 A bold figure indicates a 95% confidence that that category differs from the other categories in that particular disaggregation Source: PACEC survey of recognised organisations (Inv13, Com13, Non13)

Page 91
Table B.11 Who is the person responsible for IiP in your organisation?
Percentage of all respondents Year of
recognition Employment Sector Organisation type
Total Pre-1998
1998 onward
s
<10 10-49 50-249 250+ Production
Private service
s
Public service
s
Business
Public sector
Voluntary/ non-profit
Dedicated IiP champion/IiP Manager
9 14 5 8 5 13 6 5 11 7 7 15 8
Part of HR manager's job
39 31 46 17 23 51 62 43 44 37 40 40 31
Part of the MD / Director / Manager's job
43 44 42 71 65 26 19 39 38 47 45 32 45
Responsibility of Head Office
2 3 2 4 2 1 6 2 4 2 2 2 6
Other 6 8 4 0 5 8 4 9 3 6 5 10 8 No one responsible 1 1 1 0 0 1 3 1 1 1 1 2 2 Respondents 545 225 318 24 220 230 69 95 141 300 418 62 51 A bold figure indicates a 95% confidence that that category differs from the other categories in that particular disaggregation Source: PACEC survey of recognised organisations (Inv14 Com14)
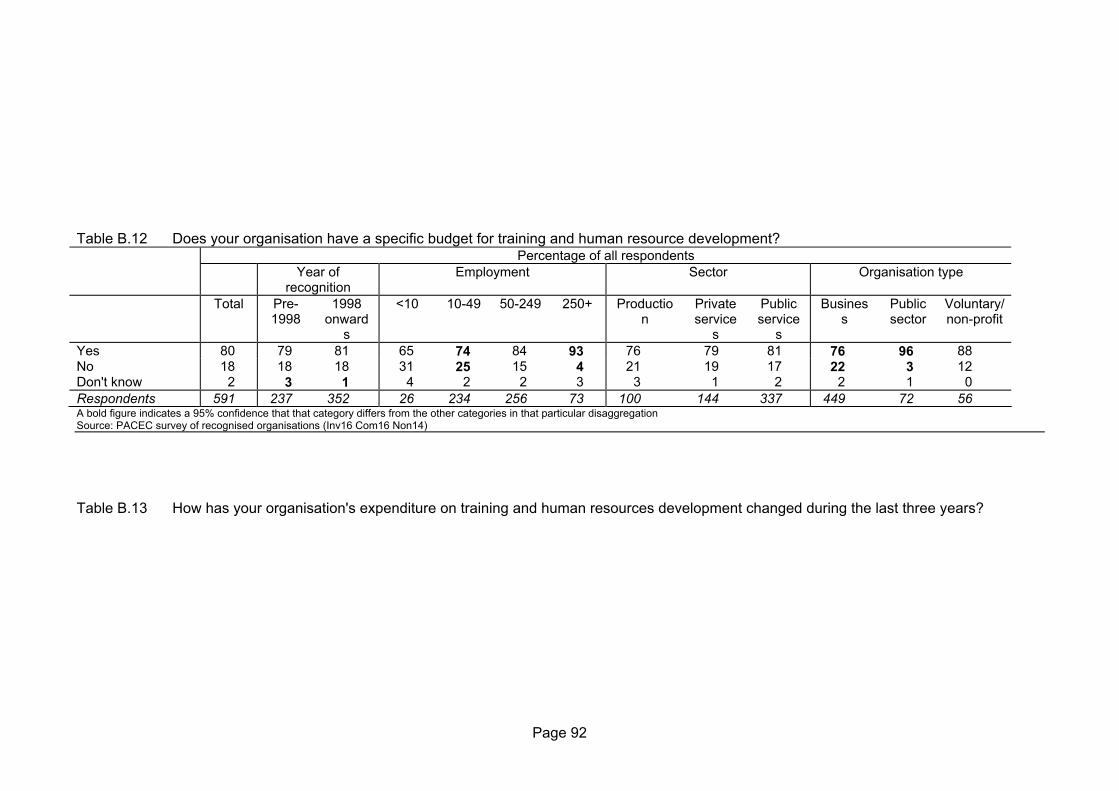
Page 92
Table B.12 Does your organisation have a specific budget for training and human resource development?
Percentage of all respondents Year of
recognition Employment Sector Organisation type
Total Pre-1998
1998 onward
s
<10 10-49 50-249 250+ Production
Private service
s
Public service
s
Business
Public sector
Voluntary/ non-profit
Yes 80 79 81 65 74 84 93 76 79 81 76 96 88 No 18 18 18 31 25 15 4 21 19 17 22 3 12 Don't know 2 3 1 4 2 2 3 3 1 2 2 1 0 Respondents 591 237 352 26 234 256 73 100 144 337 449 72 56 A bold figure indicates a 95% confidence that that category differs from the other categories in that particular disaggregation Source: PACEC survey of recognised organisations (Inv16 Com16 Non14) Table B.13 How has your organisation's expenditure on training and human resources development changed during the last three years?

Page 93
Percentage of all respondents Year of
recognition Employment Sector Organisation type
Total Pre-1998
1998 onward
s
<10 10-49 50-249 250+ Production
Private service
s
Public service
s
Business
Public sector
Voluntary/ non-profit
Increased by 10% or more
39 44 36 12 40 41 37 30 49 37 40 26 47
Same - within 10% either way
53 46 58 76 53 54 44 63 45 54 55 51 47
Decreased by 10% or more
3 4 2 0 3 2 7 1 4 3 3 7 2
Don't know 4 6 4 12 4 2 12 5 2 6 2 15 4 Respondents 471 186 283 17 171 213 68 76 114 271 342 68 49 A bold figure indicates a 95% confidence that that category differs from the other categories in that particular disaggregation Source: PACEC survey of recognised organisations (Inv17 Com17 Non15) Table B.14 Does your organisation's commitment to achieving the IiP standard cover the entire organisation?
Percentage of all respondents Year of
recognition Employment Sector Organisation type
Total Pre-1998
1998 onward
s
<10 10-49 50-249 250+ Production
Private service
s
Public service
s
Business
Public sector
Voluntary/ non-profit
Yes 62 64 60 100 72 57 60 52 66 62 64 51 75 No 30 26 33 0 23 32 35 31 26 32 29 38 25 Don't know 8 10 7 0 4 11 5 17 8 6 7 11 0 Respondents 303 130 173 4 69 173 57 54 80 166 218 47 28 A bold figure indicates a 95% confidence that that category differs from the other categories in that particular disaggregation Source: PACEC survey of recognised organisations (Inv18 Com18) Table B.15 What were your organisation's broad objective(s) in pursuing IiP recognition?

Page 94
Percentage of all respondents Year of
recognition Employment Sector Organisation type
Total Pre-1998
1998 onward
s
<10 10-49 50-249 250+ Production
Private service
s
Public service
s
Business
Public sector
Voluntary/ non-profit
Business growth 23 12 29 29 19 27 12 27 23 21 27 10 8 Efficiency gains 48 38 53 24 35 63 36 42 42 52 47 41 51 Increase in profitability
23 20 24 6 18 29 16 32 18 22 26 10 12
Increase quality of products / services
46 43 47 24 28 64 38 33 37 54 43 55 49
Staff retention and easier recruitment
41 46 38 12 44 38 48 38 35 43 42 39 29
Change of corporate culture
13 8 16 6 12 12 20 14 15 12 14 8 12
Other 35 38 34 59 47 19 52 36 47 30 35 45 33 Respondents 461 178 282 17 176 211 56 81 130 243 351 49 49 A bold figure indicates a 95% confidence that that category differs from the other categories in that particular disaggregation Source: PACEC survey of recognised organisations (Inv19 Com19)

Page 95
Percentage of all respondents Table B.16 What, if anything, prevented your organisation from working towards best practices in human resources management outside the Investors in People framework?
Year of recognition
Employment Sector Organisation type
Total Pre-1998
1998 onwards
<10 10-49
50-249
250+ Production
Private service
s
Public service
s
Business
Public sector
Voluntary/ non-profit
At least one 22 18 25 25 25 20 20 25 28 19 21 20 36 Lack of skill 2 1 3 8 3 1 3 4 1 2 3 2 2 Lack of time 6 4 7 8 7 4 6 3 8 5 5 5 9 Risks involved 1 0 1 4 0 0 0 0 1 1 0 0 2 High cost / low return 0 1 0 0 0 0 0 0 1 0 0 0 0 Cost / finance generally 3 3 4 8 6 0 1 2 6 3 3 2 4 Lack of financial support from local TEC / BL
0 1 0 0 0 0 0 0 1 0 0 0 0
Unaware of financial support from local TEC / BL
1 1 1 4 1 1 0 1 1 1 1 0 0
No clear / tangible rewards 0 0 0 0 0 0 0 1 0 0 0 0 0 Uncertainty about the benefits 0 0 0 0 0 0 0 0 0 0 0 0 0 Conservatism / traditionalism / reluctance to change
4 1 5 0 2 6 0 7 2 3 3 8 5
Lack of understanding / knowledge of HR management
4 3 4 0 5 4 3 4 4 4 4 5 5
Lack of external advice and support
2 1 2 0 2 1 3 2 3 1 2 2 2
Lack of awareness of IiP 3 4 2 4 3 3 3 4 6 1 3 0 7 Other 7 5 9 8 8 6 12 9 7 7 7 3 13 None - already pursued best practice
59 59 60 42 53 69 52 53 54 63 59 62 49
None - wanted to consider alternative to IiP
1 1 1 0 1 2 1 1 3 1 2 0 0
None- other 4 6 2 0 4 3 4 3 4 4 3 6 4 Don't know 15 19 13 33 19 8 23 20 14 15 16 14 13 Respondents 563 221 341 24 224 245 69 96 140 317 432 64 55

Page 96
A bold figure indicates a 95% confidence that that category differs from the other categories in that particular disaggregation Source: PACEC survey of recognised organisations (Inv20 Com20) Table B.17 Did your organisation receive any financial support from public funds (mainly your local TEC or Business Link) to help it to achieve the IiP standard?
Percentage of all respondents Year of
recognition Employment Sector Organisation type
Total Pre-1998
1998 onward
s
<10 10-49 50-249 250+ Production
Private service
s
Public service
s
Business
Public sector
Voluntary/ non-profit
Yes 56 51 59 62 63 55 37 57 54 56 56 53 57 No 29 30 28 19 22 32 42 31 29 29 29 30 29 Don't know 15 19 13 19 15 14 21 12 17 16 15 16 14 Respondents 591 237 352 26 234 256 73 100 143 338 448 73 56 A bold figure indicates a 95% confidence that that category differs from the other categories in that particular disaggregation Source: PACEC survey of recognised organisations (Inv21 Com21) Table B.18 Did your organisation receive any financial support from public funds (mainly your local TEC or Business Link) to help it to achieve the IiP standard?

Page 97
Percentage of all respondents Year of
recognition Employment Sector Organisation type
Total Pre-1998
1998 onward
s
<10 10-49 50-249 250+ Production
Private service
s
Public service
s
Business
Public sector
Voluntary/ non-profit
<1k 98 98 98 100 97 98 99 99 94 99 98 100 96 1-19k 2 2 2 0 3 2 0 1 4 1 2 0 4 20-49k 0 0 1 0 0 0 1 0 1 0 0 0 0 Respondents 593 238 353 26 235 257 73 100 144 339 450 73 56 A bold figure indicates a 95% confidence that that category differs from the other categories in that particular disaggregation Source: PACEC survey of recognised organisations (Inv21 Com21) Table B.19 Would your organisation have pursued the standard without the financial support it received?
Percentage of all respondents Year of
recognition Employment Sector Organisation type
Total Pre-1998
1998 onward
s
<10 10-49 50-249 250+ Production
Private service
s
Public service
s
Business
Public sector
Voluntary/ non-profit
Definitely 20 19 19 13 19 17 37 25 17 20 20 26 16 Probably 36 41 34 20 32 43 37 38 31 38 35 39 31 Possibly 29 23 32 13 28 33 22 31 30 25 29 24 34 Probably not 13 13 14 53 18 6 4 5 19 14 14 8 12 Definitely not 2 4 1 0 3 2 0 0 3 3 2 3 6 Respondents 315 118 196 15 145 127 27 55 70 181 235 38 32 A bold figure indicates a 95% confidence that that category differs from the other categories in that particular disaggregation Source: PACEC survey of recognised organisations (Inv22 Com22) Table B.20 Did your organisation receive any non-financial support from public sources to help it achieve the IiP standard?

Page 98
Percentage of all respondents Year of
recognition Employment Sector Organisation type
Total Pre-1998
1998 onward
s
<10 10-49 50-249 250+ Production
Private service
s
Public service
s
Business
Public sector
Voluntary/ non-profit
Yes 62 55 67 81 69 56 56 58 61 63 62 62 65 No 21 21 21 8 16 27 21 26 21 20 22 17 25 Don't know 17 24 12 12 15 17 24 16 19 16 16 21 9 Respondents 579 231 346 26 227 252 72 97 140 334 440 71 55 A bold figure indicates a 95% confidence that that category differs from the other categories in that particular disaggregation Source: PACEC survey of recognised organisations (Inv23 Com23) Table B.21 Would your organisation have pursued the standard without the non-financial support it received?
Percentage of all respondents Year of
recognition Employment Sector Organisation type
Total Pre-1998
1998 onward
s
<10 10-49 50-249 250+ Production
Private service
s
Public service
s
Business
Public sector
Voluntary/ non-profit
Definitely 20 24 17 14 19 19 28 22 13 23 17 33 26 Probably 41 48 37 24 38 45 50 43 49 36 43 40 20 Possibly 24 15 30 38 25 24 18 24 25 24 25 12 34 Probably not 12 11 12 24 14 10 2 7 9 14 10 14 17 Definitely not 3 2 4 0 5 2 2 4 4 3 4 0 3 Respondents 339 124 214 21 154 123 40 54 79 200 258 42 35 A bold figure indicates a 95% confidence that that category differs from the other categories in that particular disaggregation Source: PACEC survey of recognised organisations (Inv24 Com24)
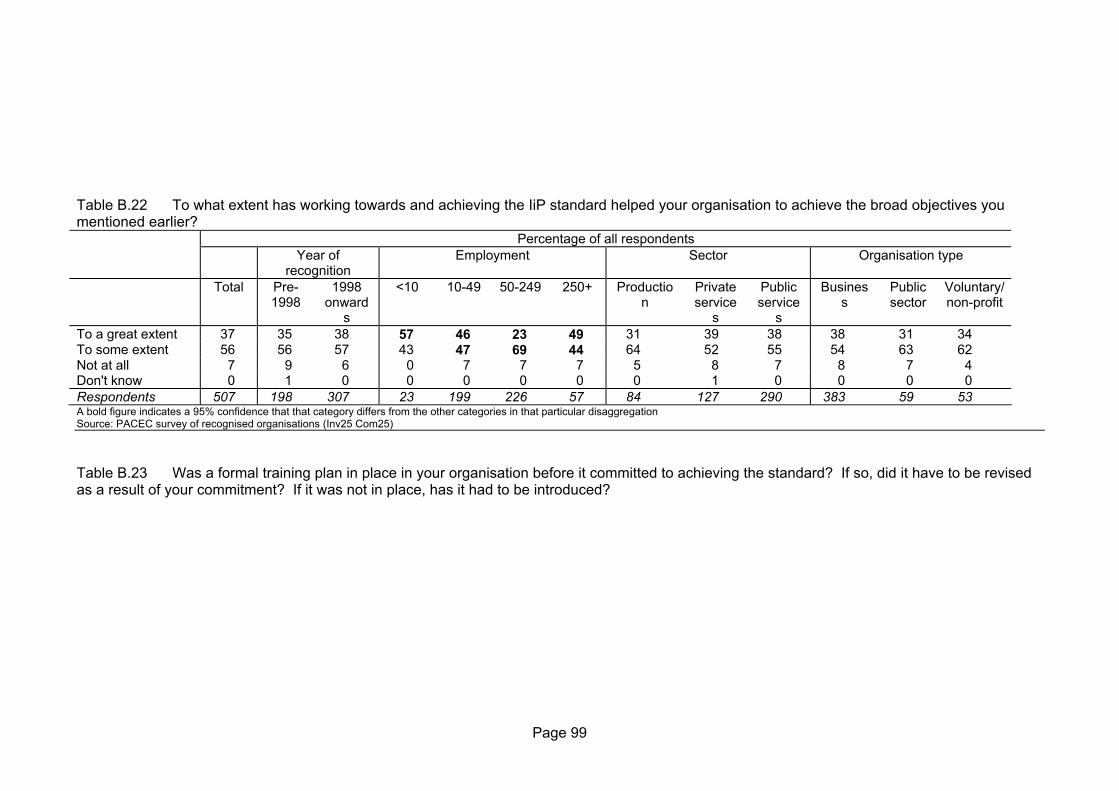
Page 99
Table B.22 To what extent has working towards and achieving the IiP standard helped your organisation to achieve the broad objectives you mentioned earlier?
Percentage of all respondents Year of
recognition Employment Sector Organisation type
Total Pre-1998
1998 onward
s
<10 10-49 50-249 250+ Production
Private service
s
Public service
s
Business
Public sector
Voluntary/ non-profit
To a great extent 37 35 38 57 46 23 49 31 39 38 38 31 34 To some extent 56 56 57 43 47 69 44 64 52 55 54 63 62 Not at all 7 9 6 0 7 7 7 5 8 7 8 7 4 Don't know 0 1 0 0 0 0 0 0 1 0 0 0 0 Respondents 507 198 307 23 199 226 57 84 127 290 383 59 53 A bold figure indicates a 95% confidence that that category differs from the other categories in that particular disaggregation Source: PACEC survey of recognised organisations (Inv25 Com25) Table B.23 Was a formal training plan in place in your organisation before it committed to achieving the standard? If so, did it have to be revised as a result of your commitment? If it was not in place, has it had to be introduced?

Page 100
Percentage of all respondents Year of
recognition Employment Sector Organisation type
Total Pre-1998
1998 onward
s
<10 10-49 50-249 250+ Production
Private service
s
Public service
s
Business
Public sector
Voluntary/ non-profit
Don't know 2 2 1 12 1 2 0 3 2 1 2 1 0 In place and not revised
12 14 10 12 11 9 24 12 13 11 11 19 5
In place, but revised
59 52 63 42 50 69 56 49 55 63 59 64 53
Not in place but introduced
26 27 25 35 36 19 19 32 29 23 27 14 38
Not in place, not applicable
2 4 0 0 2 2 1 3 1 2 2 1 4
Respondents 564 223 339 26 220 248 68 93 141 321 426 69 55 A bold figure indicates a 95% confidence that that category differs from the other categories in that particular disaggregation Source: PACEC survey of recognised organisations (Inv28/26 Com36/35 Non16/16) Table B.24 Was a system for identifying training needs in place in your organisation before it committed to achieving the standard? If so, did it

Page 101
have to be revised as a result of your commitment? If it was not in place, has it had to be introduced? Percentage of all respondents Year of
recognition Employment Sector Organisation type
Total Pre-1998
1998 onward
s
<10 10-49 50-249 250+ Production
Private service
s
Public service
s
Business
Public sector
Voluntary/ non-profit
Don't know 2 3 1 8 2 2 0 3 2 1 2 1 0 In place and not revised
13 18 9 12 14 8 26 12 14 12 13 20 5
In place, but revised
64 57 69 42 56 75 57 51 61 69 62 64 69
Not in place but introduced
21 20 21 38 28 14 15 30 22 17 22 13 24
Not in place, not applicable
1 3 0 0 0 2 1 4 1 0 1 1 2
Respondents 564 223 339 26 220 248 68 93 141 321 426 69 55 A bold figure indicates a 95% confidence that that category differs from the other categories in that particular disaggregation Source: PACEC survey of recognised organisations (Inv28/26 Com36/35 Non16/16)

Page 102
Table B.25 Was a system for evaluating training in place in your organisation before it committed to achieving the standard? If so, did it have to be revised as a result of your commitment? If it was not in place, has it had to be introduced?
Percentage of all respondents Year of
recognition Employment Sector Organisation type
Total Pre-1998
1998 onward
s
<10 10-49 50-249 250+ Production
Private service
s
Public service
s
Business
Public sector
Voluntary/ non-profit
Don't know 2 3 1 8 3 1 0 3 2 1 2 1 0 In place and not revised
10 17 6 8 11 6 24 8 11 11 10 14 11
In place, but revised
60 53 64 42 49 72 57 54 58 63 59 62 60
Not in place but introduced
27 26 28 42 37 19 19 34 27 25 28 22 29
Not in place, not applicable
1 0 1 0 0 2 0 1 1 0 1 0 0
Respondents 564 223 339 26 220 248 68 93 141 321 426 69 55 A bold figure indicates a 95% confidence that that category differs from the other categories in that particular disaggregation Source: PACEC survey of recognised organisations (Inv28/26 Com36/35 Non16/16)

Page 103
Table B.26 Was your business plan communicated to employees in your organisation before it committed to achieving the standard? If so, did this have to be revised as a result of your commitment? If this was not in place, has it had to be introduced?
Percentage of all respondents Year of
recognition Employment Sector Organisation type
Total Pre-1998
1998 onward
s
<10 10-49 50-249 250+ Production
Private service
s
Public service
s
Business
Public sector
Voluntary/ non-profit
Don't know 4 6 2 15 4 3 0 4 6 2 4 4 2 In place and not revised
11 18 7 8 12 7 25 8 15 10 10 17 11
In place, but revised
57 49 63 27 47 71 53 52 54 61 55 67 56
Not in place but introduced
23 22 24 38 32 15 19 31 21 22 25 12 27
Not in place, not applicable
4 4 4 12 5 3 3 5 4 4 5 0 4
Respondents 564 223 339 26 220 248 68 93 141 321 426 69 55 A bold figure indicates a 95% confidence that that category differs from the other categories in that particular disaggregation Source: PACEC survey of recognised organisations (Inv28/26 Com36/35 Non16/16)

Page 104
Table B.27 Was an employee communication process or appraisal system in place in your organisation before it committed to achieving the standard? If so, did it have to be revised as a result of your commitment? If it was not in place has it had to be introduced?
Percentage of all respondents Year of
recognition Employment Sector Organisation type
Total Pre-1998
1998 onward
s
<10 10-49 50-249 250+ Production
Private service
s
Public service
s
Business
Public sector
Voluntary/ non-profit
Don't know 2 3 1 8 1 2 0 2 3 1 2 3 0 In place and not revised
14 20 11 12 15 8 34 11 16 15 13 25 15
In place, but revised
67 58 73 54 64 74 54 59 70 69 68 64 62
Not in place but introduced
16 17 15 27 20 13 12 26 11 15 17 7 22
Not in place, not applicable
1 2 0 0 0 2 0 2 1 1 1 1 2
Respondents 564 223 339 26 220 248 68 93 141 321 426 69 55 A bold figure indicates a 95% confidence that that category differs from the other categories in that particular disaggregation Source: PACEC survey of recognised organisations (Inv28/26 Com36/35 Non16/16)

Page 105
Table B.28 Was benchmarking with other organisations in place in your organisation before it committed to achieving the standard? If so, did it have to be revised as a result of your commitment? If it was not in place, has it had to be introduced?
Percentage of all respondents Year of
recognition Employment Sector Organisation type
Total Pre-1998
1998 onward
s
<10 10-49 50-249 250+ Production
Private service
s
Public service
s
Business
Public sector
Voluntary/ non-profit
Don't know 13 19 10 35 18 8 12 10 14 14 14 14 7 In place and not revised
7 10 5 15 5 6 13 5 9 7 7 7 9
In place, but revised
45 40 49 19 32 62 40 47 43 46 45 48 44
Not in place but introduced
16 11 19 23 16 12 21 19 13 16 16 17 15
Not in place, not applicable
18 21 17 8 29 11 15 18 21 17 18 13 25
Respondents 564 223 339 26 220 248 68 93 141 321 426 69 55 A bold figure indicates a 95% confidence that that category differs from the other categories in that particular disaggregation Source: PACEC survey of recognised organisations (Inv28/26 Com36/35 Non16/16)

Page 106
Table B.29 Which of these processes, if any, have been further developed since your organisation achieved the standard?
Percentage of all respondents Year of
recognition Employment Sector Organisation type
Total Pre-1998
1998 onward
s
<10 10-49 50-249 250+ Production
Private service
s
Public service
s
Business
Public sector
Voluntary/ non-profit
A written HR personnel plan
53 62 46 39 68 36 74 55 57 50 55 48 47
A formal training plan
59 73 49 78 71 45 67 57 63 57 60 51 60
A system for identifying training needs
72 84 65 83 76 66 78 71 78 70 74 63 64
Systems for evaluating training
84 88 82 70 84 87 79 90 85 83 85 81 82
Communicating business plan to employees
71 76 67 48 72 72 72 77 75 67 72 73 60
Employee communication process or appraisal system
81 81 80 87 85 77 81 82 80 81 81 86 73
Benchmarking with other organisations
36 47 28 43 35 34 45 33 35 37 37 38 29
Other 6 8 6 9 6 7 5 6 5 7 6 3 9 Respondents 502 199 302 23 191 229 58 82 126 286 370 63 55 A bold figure indicates a 95% confidence that that category differs from the other categories in that particular disaggregation
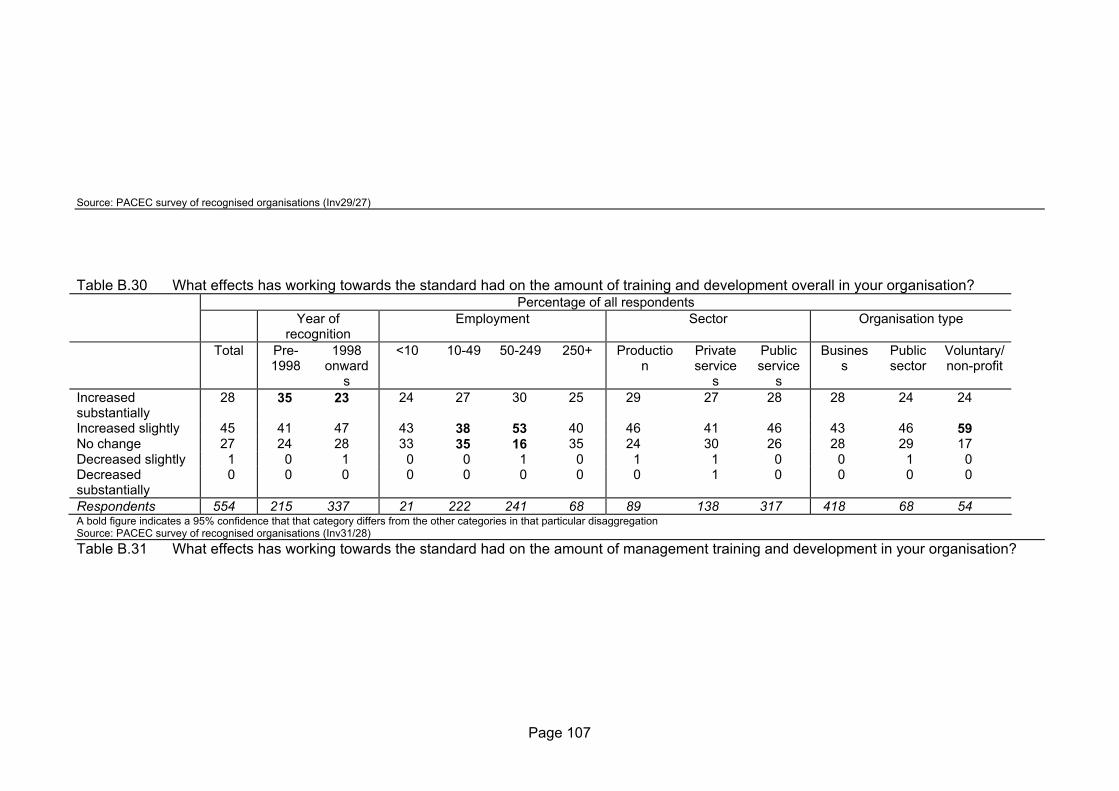
Page 107
Source: PACEC survey of recognised organisations (Inv29/27) Table B.30 What effects has working towards the standard had on the amount of training and development overall in your organisation?
Percentage of all respondents Year of
recognition Employment Sector Organisation type
Total Pre-1998
1998 onward
s
<10 10-49 50-249 250+ Production
Private service
s
Public service
s
Business
Public sector
Voluntary/ non-profit
Increased substantially
28 35 23 24 27 30 25 29 27 28 28 24 24
Increased slightly 45 41 47 43 38 53 40 46 41 46 43 46 59 No change 27 24 28 33 35 16 35 24 30 26 28 29 17 Decreased slightly 1 0 1 0 0 1 0 1 1 0 0 1 0 Decreased substantially
0 0 0 0 0 0 0 0 1 0 0 0 0
Respondents 554 215 337 21 222 241 68 89 138 317 418 68 54 A bold figure indicates a 95% confidence that that category differs from the other categories in that particular disaggregation Source: PACEC survey of recognised organisations (Inv31/28) Table B.31 What effects has working towards the standard had on the amount of management training and development in your organisation?

Page 108
Percentage of all respondents Year of
recognition Employment Sector Organisation type
Total Pre-1998
1998 onward
s
<10 10-49 50-249 250+ Production
Private service
s
Public service
s
Business
Public sector
Voluntary/ non-profit
Increased substantially
25 34 19 24 21 30 22 27 27 24 26 22 13
Increased slightly 43 41 45 33 41 48 40 45 39 45 41 41 63 No change 30 25 33 43 36 21 37 25 32 31 31 35 22 Decreased slightly 1 0 1 0 1 1 1 2 1 0 1 1 0 Decreased substantially
0 0 1 0 1 0 0 0 1 0 0 0 2
Respondents 551 214 335 21 221 239 68 88 139 314 415 68 54 A bold figure indicates a 95% confidence that that category differs from the other categories in that particular disaggregation Source: PACEC survey of recognised organisations (Inv31/28) Table B.32 What effects has working towards the standard had on the amount of non-management training and development in your organisation?
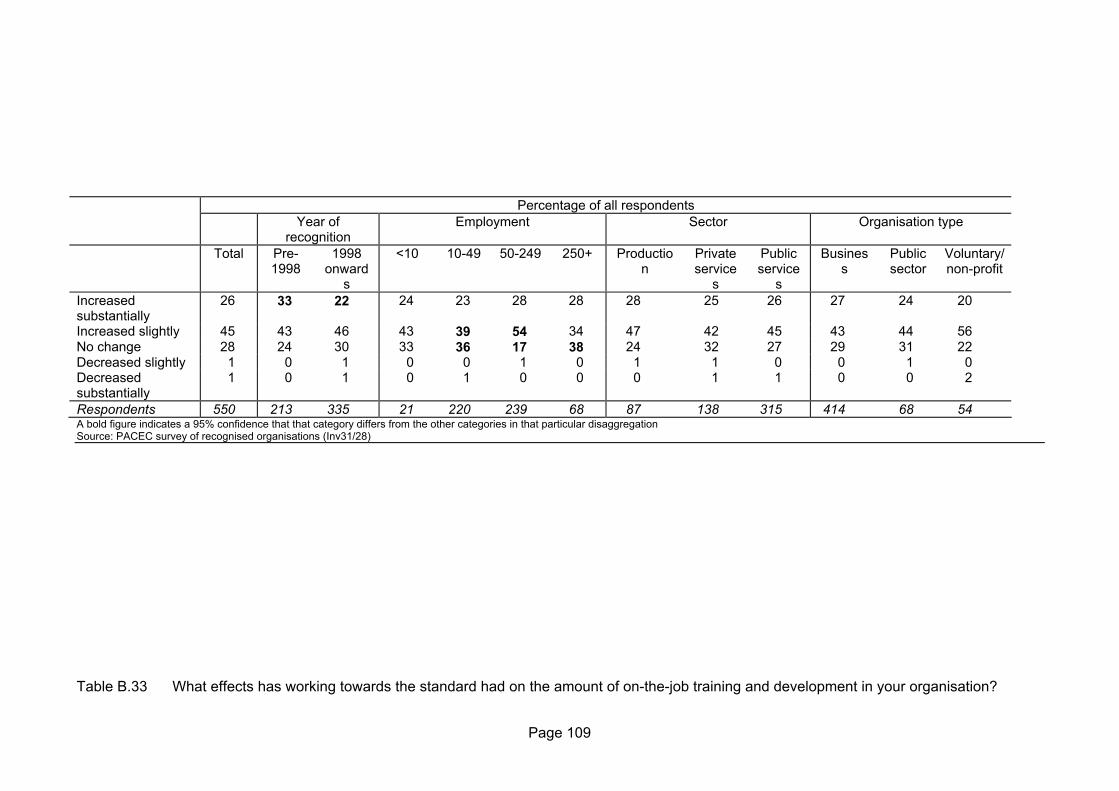
Page 109
Percentage of all respondents Year of
recognition Employment Sector Organisation type
Total Pre-1998
1998 onward
s
<10 10-49 50-249 250+ Production
Private service
s
Public service
s
Business
Public sector
Voluntary/ non-profit
Increased substantially
26 33 22 24 23 28 28 28 25 26 27 24 20
Increased slightly 45 43 46 43 39 54 34 47 42 45 43 44 56 No change 28 24 30 33 36 17 38 24 32 27 29 31 22 Decreased slightly 1 0 1 0 0 1 0 1 1 0 0 1 0 Decreased substantially
1 0 1 0 1 0 0 0 1 1 0 0 2
Respondents 550 213 335 21 220 239 68 87 138 315 414 68 54 A bold figure indicates a 95% confidence that that category differs from the other categories in that particular disaggregation Source: PACEC survey of recognised organisations (Inv31/28) Table B.33 What effects has working towards the standard had on the amount of on-the-job training and development in your organisation?

Page 110
Percentage of all respondents Year of
recognition Employment Sector Organisation type
Total Pre-1998
1998 onward
s
<10 10-49 50-249 250+ Production
Private service
s
Public service
s
Business
Public sector
Voluntary/ non-profit
Increased substantially
27 33 24 24 26 29 26 30 27 27 28 24 19
Increased slightly 44 43 45 43 38 52 37 44 41 46 42 46 61 No change 28 23 30 33 35 18 37 25 31 27 29 29 19 Decreased slightly 0 0 1 0 0 0 0 1 0 0 0 1 0 Decreased substantially
0 0 1 0 1 0 0 0 1 0 0 0 2
Respondents 550 214 334 21 220 239 68 88 138 314 414 68 54 A bold figure indicates a 95% confidence that that category differs from the other categories in that particular disaggregation Source: PACEC survey of recognised organisations (Inv31/28)

Page 111
Table B.34 What effects has working towards the standard had on the amount of off-the-job training and development in your organisation? Percentage of all respondents Year of
recognition Employment Sector Organisation type
Total Pre-1998
1998 onward
s
<10 10-49 50-249 250+ Production
Private service
s
Public service
s
Business
Public sector
Voluntary/ non-profit
Increased substantially
25 33 19 25 22 28 21 25 24 24 25 23 17
Increased slightly 44 42 45 35 38 51 43 47 42 44 43 42 58 No change 30 25 34 40 39 19 37 26 32 31 31 34 25 Decreased slightly 1 0 1 0 0 1 0 2 1 0 1 2 0 Decreased substantially
0 0 0 0 0 0 0 0 1 0 0 0 0
Respondents 542 212 328 20 216 236 68 85 139 308 410 65 53 A bold figure indicates a 95% confidence that that category differs from the other categories in that particular disaggregation Source: PACEC survey of recognised organisations (Inv31/28) Table B.35 Has your organisation evaluated the impact that IiP has had on the way it operates and performs?
Percentage of all respondents Year of
recognition Employment Sector Organisation type
Total Pre-1998
1998 onward
s
<10 10-49 50-249 250+ Production
Private service
s
Public service
s
Business
Public sector
Voluntary/ non-profit
Yes 63 64 63 37 63 70 55 68 60 63 64 65 55 No 25 19 28 42 28 19 22 15 30 25 24 25 36 Don't know 12 18 8 21 9 11 23 16 10 12 12 11 10 Respondents 461 188 271 19 191 189 60 79 120 256 353 57 42 A bold figure indicates a 95% confidence that that category differs from the other categories in that particular disaggregation Source: PACEC survey of recognised organisations (Inv32/29)

Page 112
Table B.36 Has your organisation evaluated the impact that IiP has had on the way it operates and performs?
Percentage of all respondents Year of
recognition Employment Sector Organisation type
Total Pre-1998
1998 onward
s
<10 10-49 50-249 250+ Production
Private service
s
Public service
s
Business
Public sector
Voluntary/ non-profit
Don't know 9 13 7 15 11 7 10 12 8 8 10 7 4 Some benefit 84 79 88 69 82 89 77 82 84 85 83 79 95 To early to say 5 5 4 4 4 3 11 4 4 5 4 12 0 No benefit 2 4 1 12 2 1 3 2 3 2 3 1 2 Respondents 593 238 353 26 235 257 73 100 144 339 450 73 56 A bold figure indicates a 95% confidence that that category differs from the other categories in that particular disaggregation Source: PACEC survey of recognised organisations (Non18) Table B.37 To what extent has participating in IiP affected your organisation in terms of more formal HR/Personnel systems?
Percentage of all respondents Year of
recognition Employment Sector Organisation type
Total Pre-1998
1998 onward
s
<10 10-49 50-249 250+ Production
Private service
s
Public service
s
Business
Public sector
Voluntary/ non-profit
Not at all 13 14 12 24 8 15 13 10 9 15 13 9 16 Small extent 27 23 30 5 20 38 20 27 22 30 26 36 33 Fair extent 37 42 35 38 42 32 45 41 37 37 38 43 27 Great extent 23 22 23 33 30 14 22 23 32 19 24 12 24 Respondents 486 182 302 21 194 214 55 79 120 281 371 56 51 A bold figure indicates a 95% confidence that that category differs from the other categories in that particular disaggregation Source: PACEC survey of recognised organisations (Inv33/30 Com37/36 Non20)

Page 113
Table B.38 To what extent has participating in IiP affected your organisation in terms of more effective training and development?
Percentage of all respondents Year of
recognition Employment Sector Organisation type
Total Pre-1998
1998 onward
s
<10 10-49 50-249 250+ Production
Private service
s
Public service
s
Business
Public sector
Voluntary/ non-profit
Not at all 8 9 7 24 7 6 14 8 9 8 9 3 11 Small extent 30 24 35 5 27 37 29 29 24 34 29 38 34 Fair extent 40 44 37 48 41 39 33 41 41 38 40 43 36 Great extent 22 22 22 24 26 18 24 22 26 20 23 16 19 Respondents 505 192 311 21 196 228 58 83 125 291 382 58 53 A bold figure indicates a 95% confidence that that category differs from the other categories in that particular disaggregation Source: PACEC survey of recognised organisations (Inv33/30 Com37/36 Non20) Table B.39 To what extent has participating in IiP affected your organisation in terms of improved quality of products and services?

Page 114
Percentage of all respondents Year of
recognition Employment Sector Organisation type
Total Pre-1998
1998 onward
s
<10 10-49 50-249 250+ Production
Private service
s
Public service
s
Business
Public sector
Voluntary/ non-profit
Not at all 14 16 12 19 14 9 25 22 15 10 14 9 17 Small extent 34 28 38 24 32 38 27 27 28 39 33 42 31 Fair extent 39 41 37 43 38 39 39 41 40 38 39 39 39 Great extent 14 15 13 14 16 13 9 10 17 13 14 11 13 Respondents 500 191 307 21 195 226 56 82 123 289 378 57 54 A bold figure indicates a 95% confidence that that category differs from the other categories in that particular disaggregation Source: PACEC survey of recognised organisations (Inv33/30 Com37/36 Non20) Table B.40 To what extent has participating in IiP affected your organisation in terms of improved recruitment and retention of staff?
Percentage of all respondents Year of
recognition Employment Sector Organisation type
Total Pre-1998
1998 onward
s
<10 10-49 50-249 250+ Production
Private service
s
Public service
s
Business
Public sector
Voluntary/ non-profit
Not at all 16 15 16 24 18 13 18 17 12 17 15 18 28 Small extent 28 25 30 14 21 37 21 21 19 34 26 36 32 Fair extent 39 43 37 43 37 39 47 48 47 34 40 38 34 Great extent 17 17 17 19 24 12 14 14 22 15 19 9 6 Respondents 500 192 306 21 194 226 57 84 124 286 379 56 53 A bold figure indicates a 95% confidence that that category differs from the other categories in that particular disaggregation

Page 115
Source: PACEC survey of recognised organisations (Inv33/30 Com37/36 Non20)
Table B.41 To what extent has participating in IiP affected your organisation in terms of improved business growth performance?
Percentage of all respondents Year of
recognition Employment Sector Organisation type
Total Pre-1998
1998 onward
s
<10 10-49 50-249 250+ Production
Private service
s
Public service
s
Business
Public sector
Voluntary/ non-profit
Not at all 20 22 18 21 19 14 42 20 22 18 16 25 37 Small extent 35 31 38 11 34 44 16 29 32 39 36 40 35 Fair extent 33 33 33 53 32 32 32 37 34 31 36 22 23 Great extent 12 14 11 16 15 10 11 13 11 12 12 13 6 Respondents 493 189 302 19 191 224 57 83 122 282 374 55 52 A bold figure indicates a 95% confidence that that category differs from the other categories in that particular disaggregation Source: PACEC survey of recognised organisations (Inv33/30 Com37/36 Non20) Table B.42 To what extent has participating in IiP affected your organisation in terms of external perception of the organisation?

Page 116
Percentage of all respondents Year of
recognition Employment Sector Organisation type
Total Pre-1998
1998 onward
s
<10 10-49 50-249 250+ Production
Private service
s
Public service
s
Business
Public sector
Voluntary/ non-profit
Not at all 10 12 9 15 10 9 12 16 11 8 10 15 8 Small extent 32 26 35 10 28 39 25 22 32 35 31 41 31 Fair extent 37 43 34 40 34 39 42 42 37 36 38 31 38 Great extent 21 19 22 35 29 12 21 20 19 21 22 13 23 Respondents 493 190 301 20 189 225 57 83 124 280 375 54 52 A bold figure indicates a 95% confidence that that category differs from the other categories in that particular disaggregation Source: PACEC survey of recognised organisations (Inv33/30 Com37/36 Non20) Table B.43 To what extent has participating in IiP affected your organisation in terms of improved customer satisfaction?
Percentage of all respondents Year of
recognition Employment Sector Organisation type
Total Pre-1998
1998 onward
s
<10 10-49 50-249 250+ Production
Private service
s
Public service
s
Business
Public sector
Voluntary/ non-profit
Not at all 16 17 14 20 12 17 22 16 17 15 14 23 19 Small extent 35 31 37 15 32 40 33 37 33 35 34 34 42 Fair extent 40 41 39 50 43 36 38 39 38 41 41 36 32 Great extent 10 11 9 15 13 8 7 9 11 10 10 8 8 Respondents 490 190 298 20 189 224 55 82 123 279 372 53 53 A bold figure indicates a 95% confidence that that category differs from the other categories in that particular disaggregation Source: PACEC survey of recognised organisations (Inv33/30 Com37/36 Non20) Table B.44 To what extent has participating in IiP affected your organisation in terms of improved business development opportunities?

Page 117
Percentage of all respondents Year of
recognition Employment Sector Organisation type
Total Pre-1998
1998 onward
s
<10 10-49 50-249 250+ Production
Private service
s
Public service
s
Business
Public sector
Voluntary/ non-profit
Not at all 23 32 17 25 23 19 41 18 25 23 20 36 29 Small extent 34 22 41 10 32 41 20 33 30 37 34 30 37 Fair extent 33 35 31 50 30 34 30 40 31 31 34 28 31 Great extent 10 11 10 15 15 6 9 9 14 9 12 6 4 Respondents 483 187 294 20 185 222 54 82 122 273 372 50 49 A bold figure indicates a 95% confidence that that category differs from the other categories in that particular disaggregation Source: PACEC survey of recognised organisations (Inv33/30 Com37/36 Non20) Table B.45 To what extent has participating in IiP affected your organisation in terms of improved productivity?
Percentage of all respondents Year of
recognition Employment Sector Organisation type
Total Pre-1998
1998 onward
s
<10 10-49 50-249 250+ Production
Private service
s
Public service
s
Business
Public sector
Voluntary/ non-profit
Not at all 16 22 12 20 15 14 28 14 18 15 13 22 32 Small extent 36 33 39 15 33 44 30 31 37 39 36 42 40 Fair extent 38 33 41 50 40 37 31 44 36 38 41 28 25 Great extent 9 11 8 15 12 6 11 10 9 8 10 8 2 Respondents 450 183 265 20 170 204 54 77 117 250 348 50 40 A bold figure indicates a 95% confidence that that category differs from the other categories in that particular disaggregation Source: PACEC survey of recognised organisations (Inv33/30 Com37/36 Non20)

Page 118
Table B.46 Effects of the impacts
Percentage of all respondents Year of
recognition Employment Sector Organisation type
Total Pre-1998
1998 onward
s
<10 10-49 50-249 250+ Production
Private service
s
Public service
s
Business
Public sector
Voluntary/ non-profit
Accumulated 39 40 39 30 42 40 30 40 37 40 39 34 45 Stayed the same 46 42 48 52 42 51 39 48 47 45 47 42 47 Faded 5 6 4 9 6 2 9 3 5 5 5 4 4 Don't know 10 13 9 9 11 7 22 9 11 11 10 19 4 Respondents 556 217 337 23 216 248 67 93 133 321 420 67 55 A bold figure indicates a 95% confidence that that category differs from the other categories in that particular disaggregation Source: PACEC survey of recognised organisations (Inv34/31) Table B.47 If it had not committed to IiP, would your organisation have taken alternative steps to achieve the same effects we have just been talking about?
Percentage of all respondents Year of
recognition Employment Sector Organisation type
Total Pre-1998
1998 onward
s
<10 10-49 50-249 250+ Production
Private service
s
Public service
s
Business
Public sector
Voluntary/ non-profit
Definitely 9 10 9 10 10 9 10 7 12 9 9 13 9 Probably 23 23 23 19 23 24 22 28 21 23 23 23 28 Possibly 45 46 45 10 34 57 49 49 43 45 45 51 40 Probably not 17 17 18 57 25 8 16 14 17 19 18 13 19 Definitely not 4 3 5 5 8 2 1 2 8 4 5 1 4 Respondents 543 210 331 21 207 246 67 90 136 309 406 71 53 A bold figure indicates a 95% confidence that that category differs from the other categories in that particular disaggregation Source: PACEC survey of recognised organisations (Inv35/32 Com38/37)

Page 119
Table B.48 In the absence of IiP, the steps would have been taken..
Percentage of all respondents Year of
recognition Employment Sector Organisation type
Total Pre-1998
1998 onward
s
<10 10-49 50-249 250+ Production
Private service
s
Public service
s
Business
Public sector
Voluntary/ non-profit
Sooner 2 2 2 0 0 3 7 4 0 3 2 0 6 Later 38 33 40 100 37 36 43 60 23 37 36 24 62 At the same time 59 65 57 0 63 61 50 36 77 60 62 76 31 Respondents 133 43 89 1 43 74 14 25 31 75 99 17 16 A bold figure indicates a 95% confidence that that category differs from the other categories in that particular disaggregation Source: PACEC survey of recognised organisations (Inv36/33 Com39/38) Table B.49 In the absence of IiP, the steps would have been..
Percentage of all respondents Year of
recognition Employment Sector Organisation type
Total Pre-1998
1998 onward
s
<10 10-49 50-249 250+ Production
Private service
s
Public service
s
Business
Public sector
Voluntary/ non-profit
Greater 2 0 3 0 5 1 0 0 3 3 2 0 7 Smaller 30 28 31 0 32 28 36 42 29 26 33 7 36 No different 68 72 66 100 62 70 64 58 68 71 65 93 57 Respondents 127 39 87 1 40 74 11 24 31 70 97 15 14 A bold figure indicates a 95% confidence that that category differs from the other categories in that particular disaggregation Source: PACEC survey of recognised organisations (Inv36/33 Com39/38)

Page 120
Table B.50 What alternative steps would your organisation have taken?
Percentage of all respondents Year of
recognition Employment Sector Organisation type
Total Pre-1998
1998 onward
s
<10 10-49 50-249 250+ Production
Private service
s
Public service
s
Business
Public sector
Voluntary/ non-profit
Self-adoption of best practices / systems in HR
53 53 51 0 50 57 50 64 54 45 56 25 62
Would employ consultants to implement HR practices
2 5 0 0 5 0 0 0 4 0 2 0 0
Would recruit in HR / strengthen the HR team
2 0 3 0 0 4 0 0 4 0 2 0 0
Would work towards other accreditation (eg: EFQM)
19 11 23 50 18 14 33 9 18 25 14 25 38
Would improve position with other accreditations
8 5 10 0 9 11 0 9 7 10 9 12 0
Don't know / Not sure
20 32 15 50 23 18 17 18 18 25 19 50 0
Respondents 59 19 39 2 22 28 6 11 28 20 43 8 8 A bold figure indicates a 95% confidence that that category differs from the other categories in that particular disaggregation
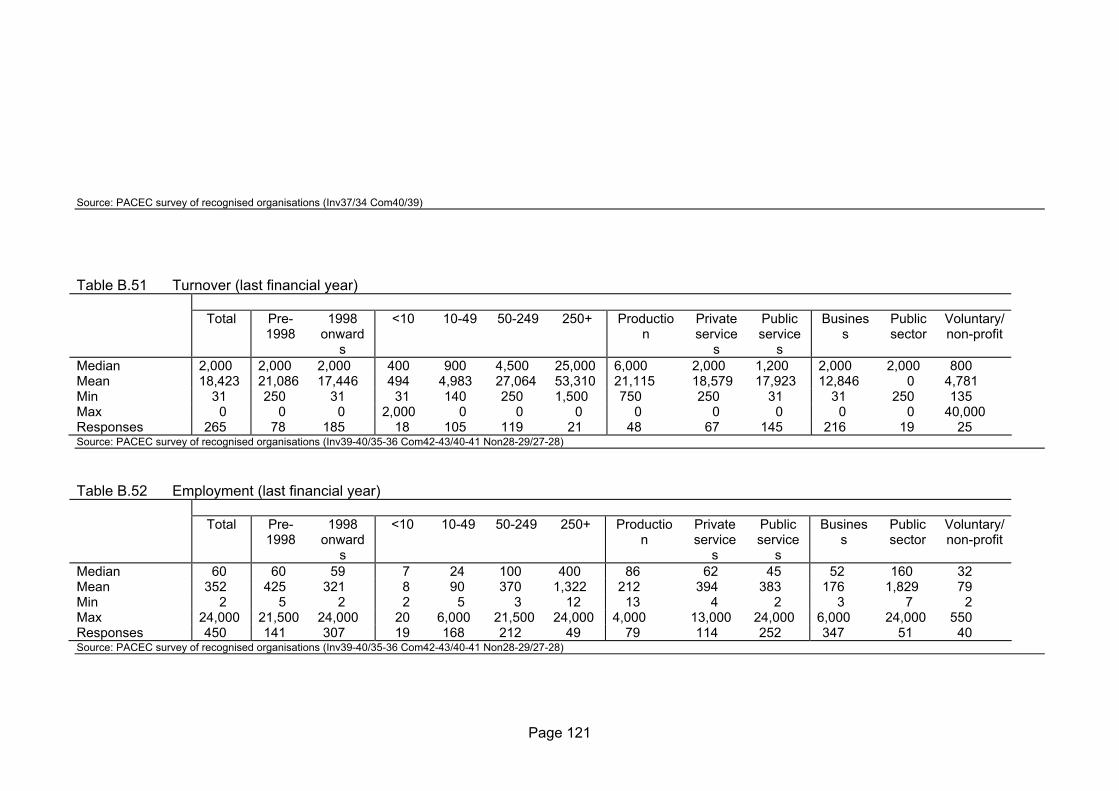
Page 121
Source: PACEC survey of recognised organisations (Inv37/34 Com40/39) Table B.51 Turnover (last financial year)
Total Pre-
1998 1998
onwards
<10 10-49 50-249 250+ Production
Private service
s
Public service
s
Business
Public sector
Voluntary/ non-profit
Median 2,000 2,000 2,000 400 900 4,500 25,000 6,000 2,000 1,200 2,000 2,000 800 Mean 18,423 21,086 17,446 494 4,983 27,064 53,310 21,115 18,579 17,923 12,846 0 4,781 Min 31 250 31 31 140 250 1,500 750 250 31 31 250 135 Max 0 0 0 2,000 0 0 0 0 0 0 0 0 40,000 Responses 265 78 185 18 105 119 21 48 67 145 216 19 25 Source: PACEC survey of recognised organisations (Inv39-40/35-36 Com42-43/40-41 Non28-29/27-28) Table B.52 Employment (last financial year)
Total Pre-
1998 1998
onwards
<10 10-49 50-249 250+ Production
Private service
s
Public service
s
Business
Public sector
Voluntary/ non-profit
Median 60 60 59 7 24 100 400 86 62 45 52 160 32 Mean 352 425 321 8 90 370 1,322 212 394 383 176 1,829 79 Min 2 5 2 2 5 3 12 13 4 2 3 7 2 Max 24,000 21,500 24,000 20 6,000 21,500 24,000 4,000 13,000 24,000 6,000 24,000 550 Responses 450 141 307 19 168 212 49 79 114 252 347 51 40 Source: PACEC survey of recognised organisations (Inv39-40/35-36 Com42-43/40-41 Non28-29/27-28)

Page 122
Table B.53 Looking at your organisation today, how much larger or smaller do you think being an Investor in People has made you in terms of turnover or income?
Percentage of all respondents Year of
recognition Employment Sector Organisation type
Total Pre-1998
1998 onward
s
<10 10-49 50-249 250+ Production
Private service
s
Public service
s
Business
Public sector
Voluntary/ non-profit
Much larger 2 3 2 0 4 2 0 3 0 3 3 0 0 A little larger 10 18 5 0 12 10 3 12 6 9 8 12 8 Marginally larger 15 16 15 24 14 15 18 17 19 13 16 7 18 No different 72 62 78 76 71 72 79 68 74 75 72 81 74 A little smaller 0 1 0 0 0 1 0 0 1 0 0 0 0 Respondents 367 131 234 17 137 177 34 65 90 204 277 42 38 A bold figure indicates a 95% confidence that that category differs from the other categories in that particular disaggregation Source: PACEC survey of recognised organisations (Inv41/37 Com44/42) Table B.54 Change due to IIP - mean

Page 123
Average of all respondents Total Pre-
1998 1998
onwards
<10 10-49 50-249 250+ Production
Private service
s
Public service
s
Business
Public sector
Voluntary/ non-profit
How much Change in Turnover/Income (œ000s)
17.1 36.4 7.8 0.0 3.0 32.3 0.0 56.9 8.7 6.0 20.6 0.0 5.0
Change in employment (including part time)
2.3 2.4 2.3 0.0 0.3 4.0 1.9 2.8 2.3 2.0 2.8 1.0 0.3
Respondents 299 101 197 13 105 151 29 51 80 165 226 34 32 Source: PACEC survey of recognised organisations (Inv41/37 Com44/42) Table B.55 To what extent has participating in IiP affected your organisation in terms of increased staff morale?
Percentage of all respondents Year of
recognition Employment Sector Organisation type
Total Pre-1998
1998 onward
s
<10 10-49 50-249 250+ Production
Private service
s
Public service
s
Business
Public sector
Voluntary/ non-profit
Great extent 21 21 21 39 29 12 21 19 26 20 23 16 18 Fair extent 40 44 38 43 43 38 38 38 37 43 40 36 42 Small extent 26 21 30 9 19 36 20 29 27 26 26 31 29 Not at all 12 13 11 9 8 13 21 14 10 11 11 17 11 Respondents 544 214 328 23 217 241 61 90 134 311 411 64 55 A bold figure indicates a 95% confidence that that category differs from the other categories in that particular disaggregation

Page 124
Source: PACEC survey of recognised organisations (Inv43/38 Com46/43) Table B.56 To what extent has participating in IiP affected your organisation in terms of reduced absenteeism?
Percentage of all respondents Year of
recognition Employment Sector Organisation type
Total Pre-1998
1998 onward
s
<10 10-49 50-249 250+ Production
Private service
s
Public service
s
Business
Public sector
Voluntary/ non-profit
Great extent 12 9 13 32 17 4 14 12 15 10 13 7 8 Fair extent 18 19 17 18 16 21 10 18 16 18 18 13 12 Small extent 22 21 23 18 12 33 15 26 22 21 23 18 23 Not at all 49 50 47 32 55 42 61 44 47 51 46 62 58 Respondents 530 210 318 22 212 235 59 90 131 300 403 61 52 A bold figure indicates a 95% confidence that that category differs from the other categories in that particular disaggregation Source: PACEC survey of recognised organisations (Inv43/38 Com46/43) Table B.57 To what extent has participating in IiP affected your organisation in terms of higher self-esteem?
Percentage of all respondents Year of
recognition Employment Sector Organisation type
Total Pre-1998
1998 onward
s
<10 10-49 50-249 250+ Production
Private service
s
Public service
s
Business
Public sector
Voluntary/ non-profit
Great extent 18 17 18 30 27 8 15 17 21 16 19 10 13 Fair extent 34 35 33 35 33 37 22 34 33 34 36 23 30 Small extent 34 31 35 22 28 39 37 31 33 35 31 44 43 Not at all 15 17 13 13 11 16 25 18 13 14 14 24 15 Respondents 537 212 323 23 215 238 59 88 132 308 407 62 54 A bold figure indicates a 95% confidence that that category differs from the other categories in that particular disaggregation Source: PACEC survey of recognised organisations (Inv43/38 Com46/43)

Page 125
Table B.58 To what extent has participating in IiP affected your organisation in terms of increased well-being? Percentage of all respondents Year of
recognition Employment Sector Organisation type
Total Pre-1998
1998 onward
s
<10 10-49 50-249 250+ Production
Private service
s
Public service
s
Business
Public sector
Voluntary/ non-profit
Great extent 17 15 19 35 27 8 16 17 20 17 19 10 13 Fair extent 33 35 32 35 32 38 19 34 35 32 36 23 23 Small extent 34 31 35 17 28 39 39 31 32 36 31 44 42 Not at all 16 19 14 13 14 15 26 18 13 16 14 23 21 Respondents 528 208 318 23 211 235 57 88 128 303 402 61 52 A bold figure indicates a 95% confidence that that category differs from the other categories in that particular disaggregation Source: PACEC survey of recognised organisations (Inv43/38 Com46/43) Table B.59 Summary of effects
Percentage of all respondents Year of
recognition Employment Sector Organisation type
Total Pre-1998
1998 onward
s
<10 10-49 50-249 250+ Production
Private service
s
Public service
s
Business
Public sector
Voluntary/ non-profit
Too early to say 6 7 6 12 4 5 16 7 6 6 6 15 2 No effect 3 6 2 12 4 3 1 1 6 3 4 1 4 Some effect 90 87 92 76 92 92 83 92 89 91 91 83 95 Respondents 573 226 345 25 227 249 70 97 140 326 432 72 55 A bold figure indicates a 95% confidence that that category differs from the other categories in that particular disaggregation Source: PACEC survey of recognised organisations (Inv44/39 Com47/44)

Page 126
Table B.60 Looking at the wider impacts, to what extent has participating in IiP affected your organisation in terms of becoming a leading-edge organisation with respect to HR development?
Percentage of all respondents Year of
recognition Employment Sector Organisation type
Total Pre-1998
1998 onward
s
<10 10-49 50-249 250+ Production
Private service
s
Public service
s
Business
Public sector
Voluntary/ non-profit
Great extent 15 14 16 36 22 7 17 15 17 15 18 3 10 Fair extent 32 39 28 18 35 31 36 32 36 31 33 29 36 Small extent 31 24 36 27 21 40 34 37 22 34 29 46 28 Not at all 21 23 20 18 23 22 14 16 25 21 21 22 26 Respondents 520 204 314 22 208 229 59 87 130 295 398 59 50 A bold figure indicates a 95% confidence that that category differs from the other categories in that particular disaggregation Source: PACEC survey of recognised organisations (Inv44/39 Com47/44) Table B.61 Looking at the wider impacts, to what extent has participating in IiP affected your organisation in terms of improved returns on your investment in HR?
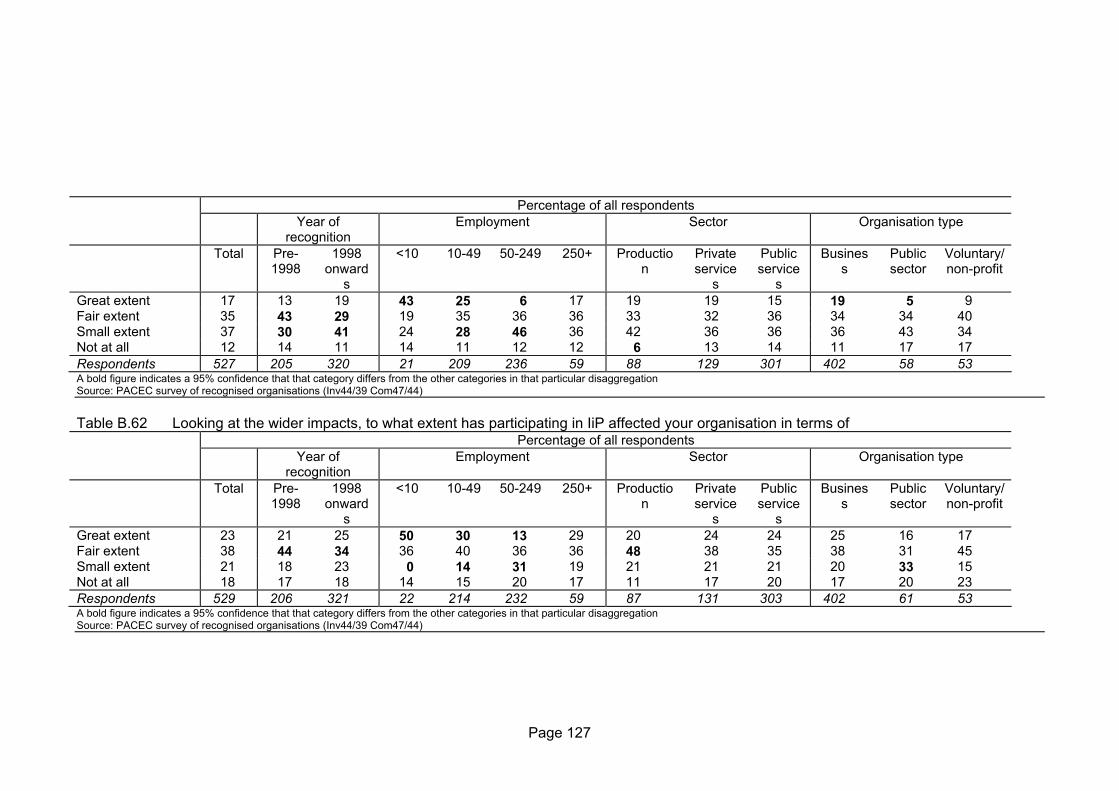
Page 127
Percentage of all respondents Year of
recognition Employment Sector Organisation type
Total Pre-1998
1998 onward
s
<10 10-49 50-249 250+ Production
Private service
s
Public service
s
Business
Public sector
Voluntary/ non-profit
Great extent 17 13 19 43 25 6 17 19 19 15 19 5 9 Fair extent 35 43 29 19 35 36 36 33 32 36 34 34 40 Small extent 37 30 41 24 28 46 36 42 36 36 36 43 34 Not at all 12 14 11 14 11 12 12 6 13 14 11 17 17 Respondents 527 205 320 21 209 236 59 88 129 301 402 58 53 A bold figure indicates a 95% confidence that that category differs from the other categories in that particular disaggregation Source: PACEC survey of recognised organisations (Inv44/39 Com47/44) Table B.62 Looking at the wider impacts, to what extent has participating in IiP affected your organisation in terms of
Percentage of all respondents Year of
recognition Employment Sector Organisation type
Total Pre-1998
1998 onward
s
<10 10-49 50-249 250+ Production
Private service
s
Public service
s
Business
Public sector
Voluntary/ non-profit
Great extent 23 21 25 50 30 13 29 20 24 24 25 16 17 Fair extent 38 44 34 36 40 36 36 48 38 35 38 31 45 Small extent 21 18 23 0 14 31 19 21 21 21 20 33 15 Not at all 18 17 18 14 15 20 17 11 17 20 17 20 23 Respondents 529 206 321 22 214 232 59 87 131 303 402 61 53 A bold figure indicates a 95% confidence that that category differs from the other categories in that particular disaggregation Source: PACEC survey of recognised organisations (Inv44/39 Com47/44)

Page 128
Table B.63 Looking at the wider impacts, to what extent has participating in IiP affected your organisation in terms of Percentage of all respondents Year of
recognition Employment Sector Organisation type
Total Pre-1998
1998 onward
s
<10 10-49 50-249 250+ Production
Private service
s
Public service
s
Business
Public sector
Voluntary/ non-profit
Great extent 19 20 19 50 25 12 15 18 20 19 21 12 9 Fair extent 40 43 38 18 43 40 36 42 42 37 40 33 43 Small extent 32 27 34 18 21 40 41 33 30 32 29 45 35 Not at all 9 10 9 14 11 8 8 7 8 11 9 10 13 Respondents 533 208 323 22 215 235 59 90 132 303 406 60 54 A bold figure indicates a 95% confidence that that category differs from the other categories in that particular disaggregation Source: PACEC survey of recognised organisations (Inv44/39 Com47/44) Table B.64 Looking at the wider impacts, to what extent has participating in IiP affected your organisation in terms of
Percentage of all respondents Year of
recognition Employment Sector Organisation type
Total Pre-1998
1998 onward
s
<10 10-49 50-249 250+ Production
Private service
s
Public service
s
Business
Public sector
Voluntary/ non-profit
Great extent 21 19 22 50 28 11 20 19 21 21 22 11 12 Fair extent 43 47 40 18 43 47 32 47 45 40 44 38 48 Small extent 29 22 34 14 22 36 36 28 26 31 27 44 29 Not at all 8 12 5 18 7 6 12 6 9 7 7 7 12 Respondents 526 206 318 22 212 231 59 88 128 302 400 61 52 A bold figure indicates a 95% confidence that that category differs from the other categories in that particular disaggregation Source: PACEC survey of recognised organisations (Inv44/39 Com47/44)

Page 129

Page 130
Percentage of all respondents B65 – Which, if any, of the following have
been the external effects of your organisation achieving the
standard ?
Year of recognition
Employment Sector Organisation type
Total Pre-1998
1998 onward
s
<10 10-49 50-249 250+ Production
Private service
s
Public service
s
Business
Public sector
Voluntary/ non-profit
Customers' HR practices
7 9 6 4 5 11 3 8 9 6 7 6 6
Customers' products 3 6 1 4 2 4 3 2 4 3 3 1 2 Customers' processes
5 9 2 0 4 7 3 6 5 4 5 4 6
Customers' business performance
8 10 6 8 5 12 3 8 9 7 8 6 4
Suppliers' HR practices
8 10 7 8 4 12 6 11 11 7 8 4 11
Suppliers' products 4 7 2 4 3 5 5 9 5 2 4 4 2 Suppliers' processes 5 9 3 4 4 7 5 9 8 4 6 3 6 Suppliers' business performance
8 12 6 4 3 15 5 9 12 7 10 4 6
Competitors' HR practices
12 13 11 0 9 18 3 8 13 12 11 10 11
Competitors' products
4 8 2 0 3 7 2 6 6 3 4 4 4
Competitors' processes
5 9 2 0 3 8 3 9 6 3 5 4 4
Competitors' business
10 12 10 0 7 17 3 8 11 11 11 9 9

Page 131
performance Any of the above 20 20 21 17 15 29 8 19 22 20 20 16 23 None of the above 80 80 79 83 85 71 92 81 78 80 80 84 77 Respondents 553 219 333 24 220 242 66 93 129 321 417 69 53 A bold figure indicates a 95% confidence that that category differs from the other categories in that particular disaggregation Source: PACEC survey of recognised organisations (Inv45/40) Table B.65 If your firm were to cease trading tomorrow, what proportion of its sales would be taken by its competitors in the following areas?
Average of all respondents Total Pre-
1998 1998
onwards
<10 10-49 50-249 250+ Production
Private service
s
Public service
s
Business
Public sector
Voluntary/ non-profit
Same region 70.7 73.3 69.5 76.4 75.5 68.6 58.4 45.7 74.9 78.5 70.7 0.0 0.0 Elsewhere in UK 24.1 22.3 24.9 19.9 21.6 25.4 29.5 38.6 21.7 19.6 24.1 0.0 0.0 Overseas 4.6 4.2 4.9 3.7 1.9 5.7 12.2 15.2 2.8 1.4 4.6 0.0 0.0 Total 99.5 99.7 99.3 100.0 99.0 99.7 100.0 99.5 99.4 99.5 99.5 0.0 0.0 Respondents 380 142 236 18 162 161 37 77 119 178 380 0 0 Source: PACEC survey of recognised organisations (Inv46/41) Table B.66 In terms of your organisation's overall objectives, how useful would you say the IiP standard has been?

Page 132
Percentage of all respondents Year of
recognition Employment Sector Organisation type
Total Pre-1998
1998 onward
s
<10 10-49 50-249 250+ Production
Private service
s
Public service
s
Business
Public sector
Voluntary/ non-profit
Not at all useful 1 1 0 0 1 0 0 1 1 0 1 0 0 Not very useful 3 3 2 10 4 1 3 3 5 1 4 0 0 Fairly useful 30 24 33 5 23 39 25 36 24 31 29 28 41 Very useful 50 55 47 71 53 44 56 46 48 51 49 61 44 Extremely useful 17 17 17 14 19 16 15 13 22 16 18 12 15 Respondents 563 227 335 21 223 247 71 97 139 317 426 69 54 A bold figure indicates a 95% confidence that that category differs from the other categories in that particular disaggregation Source: PACEC survey of recognised organisations (Inv51/46 Com52/49) Table B.67 Has your organisation been through reassessment?

Page 133
Percentage of all respondents Year of
recognition Employment Sector Organisation type
Total Pre-1998
1998 onward
s
<10 10-49 50-249 250+ Production
Private service
s
Public service
s
Business
Public sector
Voluntary/ non-profit
Yes, been through process once
40 48 34 38 36 47 31 40 36 41 39 35 49
Yes, been through process twice
18 30 9 12 20 16 24 20 18 17 18 22 9
Yes, currently going through process for the first time
3 3 3 0 3 3 4 2 1 4 3 7 2
No, but will seek re accreditation in due course
31 8 46 38 34 26 32 27 31 32 31 31 35
No and have chosen not to be reassessed
3 3 2 0 4 2 3 2 6 2 4 1 0
Don't Know 4 5 4 4 3 5 6 6 6 3 4 3 4 Other 2 2 2 8 1 2 1 3 1 1 2 0 2 Respondents 563 233 328 26 225 238 72 96 136 321 427 68 55 A bold figure indicates a 95% confidence that that category differs from the other categories in that particular disaggregation Source: PACEC survey of recognised organisations (Inv52/47)

Page 134
Table B.68 Did going through the re-accreditation process affect your organisation's operations and development, including changes in its HR and training practices?
Percentage of all respondents Year of
recognition Employment Sector Organisation type
Total Pre-1998
1998 onward
s
<10 10-49 50-249 250+ Production
Private service
s
Public service
s
Business
Public sector
Voluntary/ non-profit
Yes 36 36 35 20 39 35 37 38 48 31 36 32 33 No 58 54 63 80 56 60 50 56 45 63 59 59 59 Don't know 6 9 2 0 5 5 13 6 7 6 5 8 7 Respondents 288 160 128 10 101 139 38 52 67 161 215 37 27 A bold figure indicates a 95% confidence that that category differs from the other categories in that particular disaggregation Source: PACEC survey of recognised organisations (Inv53/48)

Page 135
APPENDIX C: DISAGGREGATED RESULTS FROM THE SURVEY OF COMMITTED ORGANISATIONS
Table C.1 Which of the following best describes your organisation? Percentage of all respondents Year of
recognition Employment Sector Organisation type
Total Pre-1998
1998 onward
s
<10 10-49 50-249
250+ Production
Private service
s
Public service
s
Business
Public sector
Voluntary/ non-profit
A business 84 81 88 83 85 89 78 100 92 76 100 0 0 A public sector body/organisation
7 9 4 0 9 4 11 0 0 11 0 100 0
A voluntary/non-profit organisation
8 9 7 15 5 7 8 0 5 11 0 0 100
Other 1 1 2 2 1 0 3 0 3 1 0 0 0 Respondents 357 150 179 47 149 97 36 76 65 214 301 24 27 A bold figure indicates a 95% confidence that that category differs from the other categories in that particular disaggregation Source: PACEC survey of committed organisations (Inv6, Com6, Non6) Table C.2 (Businesses only) When did your business start trading?
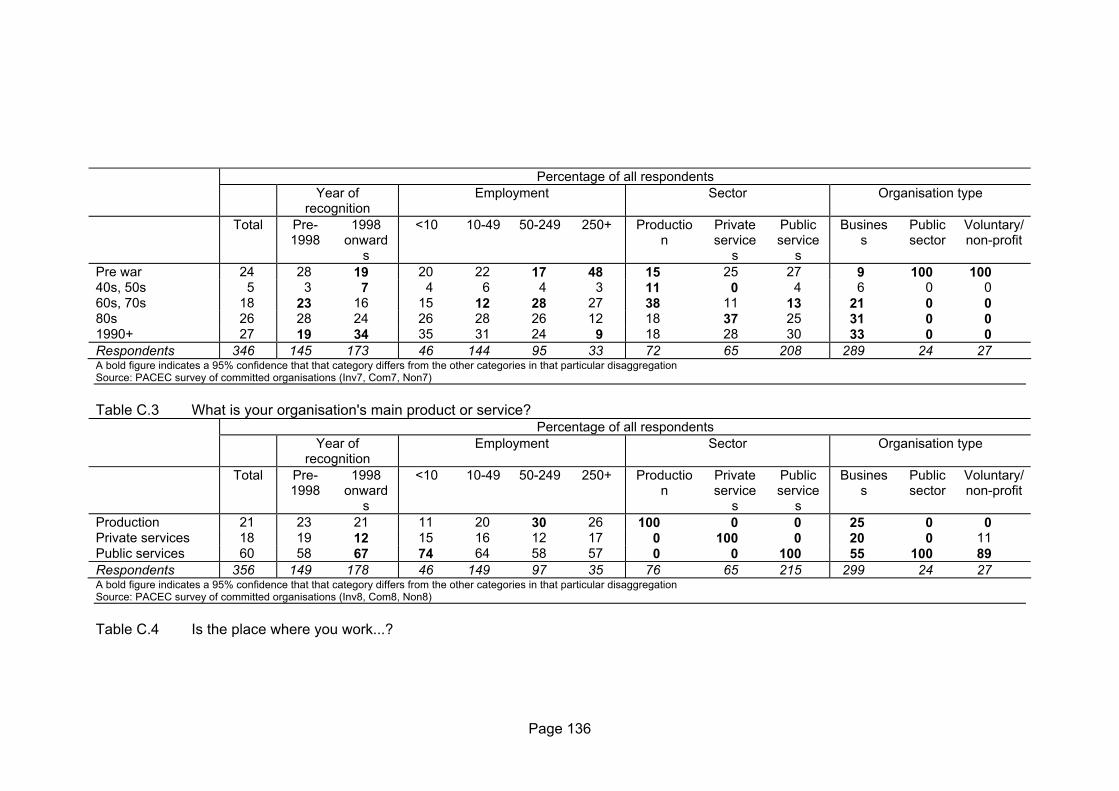
Page 136
Percentage of all respondents Year of
recognition Employment Sector Organisation type
Total Pre-1998
1998 onward
s
<10 10-49 50-249 250+ Production
Private service
s
Public service
s
Business
Public sector
Voluntary/ non-profit
Pre war 24 28 19 20 22 17 48 15 25 27 9 100 100 40s, 50s 5 3 7 4 6 4 3 11 0 4 6 0 0 60s, 70s 18 23 16 15 12 28 27 38 11 13 21 0 0 80s 26 28 24 26 28 26 12 18 37 25 31 0 0 1990+ 27 19 34 35 31 24 9 18 28 30 33 0 0 Respondents 346 145 173 46 144 95 33 72 65 208 289 24 27 A bold figure indicates a 95% confidence that that category differs from the other categories in that particular disaggregation Source: PACEC survey of committed organisations (Inv7, Com7, Non7) Table C.3 What is your organisation's main product or service?
Percentage of all respondents Year of
recognition Employment Sector Organisation type
Total Pre-1998
1998 onward
s
<10 10-49 50-249 250+ Production
Private service
s
Public service
s
Business
Public sector
Voluntary/ non-profit
Production 21 23 21 11 20 30 26 100 0 0 25 0 0 Private services 18 19 12 15 16 12 17 0 100 0 20 0 11 Public services 60 58 67 74 64 58 57 0 0 100 55 100 89 Respondents 356 149 178 46 149 97 35 76 65 215 299 24 27 A bold figure indicates a 95% confidence that that category differs from the other categories in that particular disaggregation Source: PACEC survey of committed organisations (Inv8, Com8, Non8) Table C.4 Is the place where you work...?
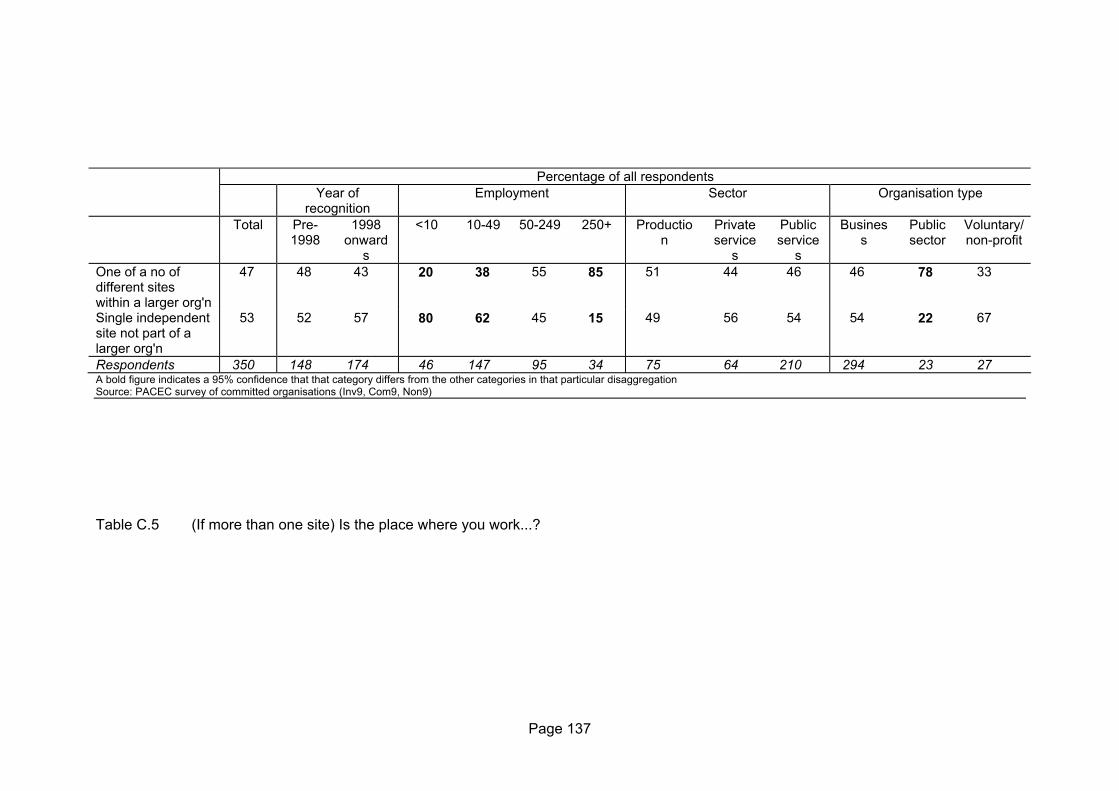
Page 137
Percentage of all respondents Year of
recognition Employment Sector Organisation type
Total Pre-1998
1998 onward
s
<10 10-49 50-249 250+ Production
Private service
s
Public service
s
Business
Public sector
Voluntary/ non-profit
One of a no of different sites within a larger org'n
47 48 43 20 38 55 85 51 44 46 46 78 33
Single independent site not part of a larger org'n
53 52 57 80 62 45 15 49 56 54 54 22 67
Respondents 350 148 174 46 147 95 34 75 64 210 294 23 27 A bold figure indicates a 95% confidence that that category differs from the other categories in that particular disaggregation Source: PACEC survey of committed organisations (Inv9, Com9, Non9) Table C.5 (If more than one site) Is the place where you work...?

Page 138
Percentage of all respondents Year of
recognition Employment Sector Organisation type
Total Pre-1998
1998 onward
s
<10 10-49 50-249 250+ Production
Private service
s
Public service
s
Business
Public sector
Voluntary/ non-profit
Single site 56 56 58 80 64 49 15 51 57 57 56 24 72 The head office 21 20 20 13 13 25 45 21 29 19 22 24 20 A regional or divisional office
9 7 11 4 9 8 15 12 5 9 8 19 4
A branch (incl. warehouse, and call centre)
13 17 9 2 13 15 18 15 10 13 13 24 4
Other 1 1 2 0 1 2 6 0 0 3 1 10 0 Respondents 335 137 171 46 142 87 33 72 63 199 283 21 25 A bold figure indicates a 95% confidence that that category differs from the other categories in that particular disaggregation Source: PACEC survey of committed organisations (Inv10, Com10, Non10) Table C.6 How would you describe the overall growth objectives of your business at the time of commitment to IiP?
Percentage of all respondents Year of
recognition Employment Sector Organisation type
Total Pre-1998
1998 onward
s
<10 10-49 50-249 250+ Production
Private service
s
Public service
s
Business
Public sector
Voluntary/ non-profit
Grow smaller 1 1 2 0 2 1 0 4 2 0 1 0 0 Stay same size 27 34 23 39 22 33 19 27 32 26 27 0 0 Grow moderately 66 62 68 50 70 62 78 68 56 68 66 0 0 Grow rapidly 6 3 7 11 6 4 4 1 11 6 6 0 0 Respondents 293 118 154 38 122 85 27 75 57 160 293 0 0 A bold figure indicates a 95% confidence that that category differs from the other categories in that particular disaggregation Source: PACEC survey of committed organisations (Inv11, Com11, Non11)

Page 139
Table C.7 How would you describe the overall growth objectives of your business now?
Percentage of all respondents Year of
recognition Employment Sector Organisation type
Total Pre-1998
1998 onward
s
<10 10-49 50-249 250+ Production
Private service
s
Public service
s
Business
Public sector
Voluntary/ non-profit
Grow smaller 4 4 4 3 2 7 4 7 7 2 4 0 0 Stay same size 26 31 22 41 24 22 26 24 29 26 26 0 0 Grow moderately 63 63 64 49 67 65 67 66 54 65 63 0 0 Grow rapidly 7 2 10 8 6 6 4 4 10 7 7 0 0 Respondents 297 121 154 39 124 85 27 76 59 161 297 0 0 A bold figure indicates a 95% confidence that that category differs from the other categories in that particular disaggregation Source: PACEC survey of committed organisations (Inv11, Com11, Non11) Table C.8 What particular aspect(s) of your business do you especially want to grow?
Percentage of all respondents Year of
recognition Employment Sector Organisation type
Total Pre-1998
1998 onward
s
<10 10-49 50-249 250+ Production
Private service
s
Public service
s
Business
Public sector
Voluntary/ non-profit
Sales 34 35 32 32 26 39 53 36 39 31 34 0 0 Market share 52 44 59 50 65 39 47 36 50 60 52 0 0 Profits 47 51 47 41 45 60 42 55 42 45 47 0 0 Other 7 5 6 5 6 5 11 4 8 7 7 0 0 All 23 21 24 23 26 18 26 34 28 17 23 0 0 Respondents 198 75 108 22 85 57 19 53 36 108 198 0 0 A bold figure indicates a 95% confidence that that category differs from the other categories in that particular disaggregation Source: PACEC survey of committed organisations (Inv11, Com11, Non11)

Page 140
Table C.9 Can you indicate on a scale of 1-10, where 1 is not at all important and 10 is crucially important, how you see the following in terms of their importance to the success of your organisation? (Mean ratings)
Average of all respondents Total Pre-
1998 1998
onwards
<10 10-49 50-249 250+ Production
Private service
s
Public service
s
Business
Public sector
Voluntary/ non-profit
Financial management
9.5 9.6 9.5 9.5 9.6 9.4 9.6 9.5 9.5 9.5 9.5 9.6 9.7
Operational management
9.2 9.3 9.2 9.3 9.1 9.4 9.4 9.2 9.0 9.3 9.3 9.0 9.1
Human resource management and development
9.3 9.4 9.3 9.2 9.3 9.5 9.6 9.1 9.2 9.5 9.3 9.1 9.4
Marketing 8.1 8.1 8.0 8.6 7.8 8.2 8.4 8.7 8.5 7.7 8.3 6.3 7.4 Design, Innovation and Creativity
7.4 7.6 7.3 7.6 7.3 7.6 7.9 8.3 7.4 7.1 7.6 6.7 6.5
Corporate and internal communications
8.7 8.7 8.8 8.6 8.7 8.7 9.2 8.4 8.7 8.8 8.8 8.5 8.7
Respondents 349 146 175 46 147 93 35 73 64 211 293 23 27 Source: PACEC survey of committed organisations (Inv12, Com12, Non12)
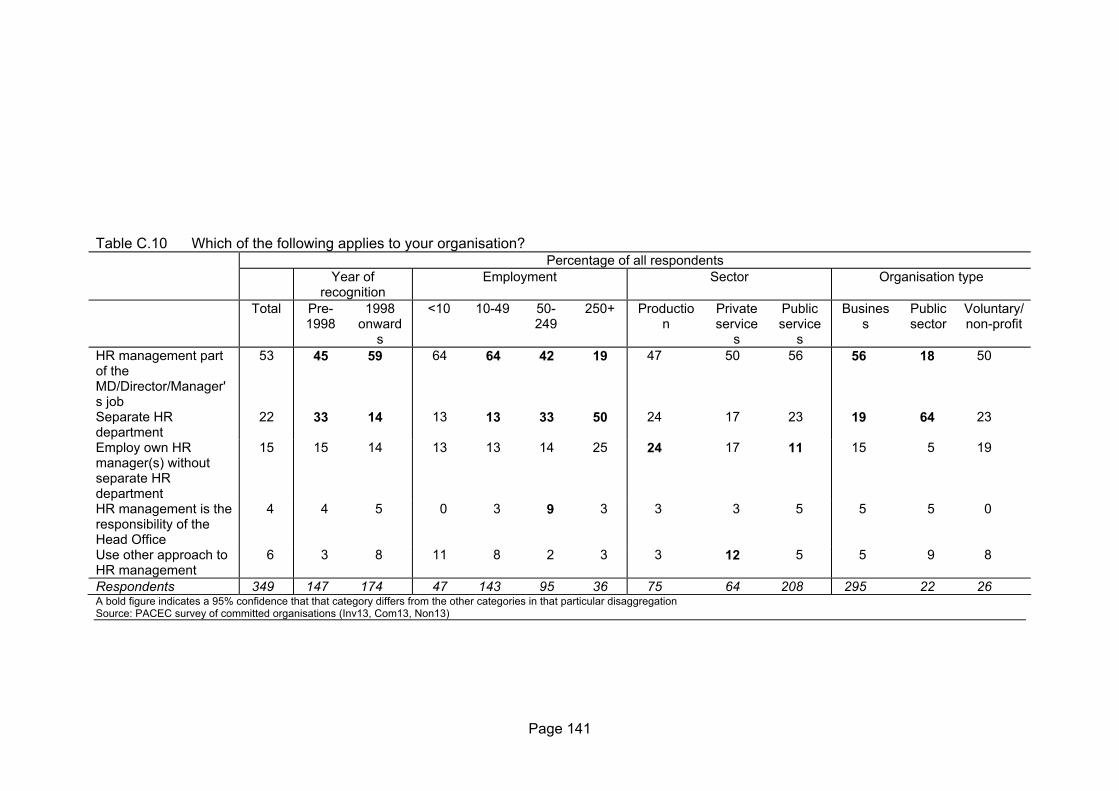
Page 141
Table C.10 Which of the following applies to your organisation?
Percentage of all respondents Year of
recognition Employment Sector Organisation type
Total Pre-1998
1998 onward
s
<10 10-49 50-249
250+ Production
Private service
s
Public service
s
Business
Public sector
Voluntary/ non-profit
HR management part of the MD/Director/Manager's job
53 45 59 64 64 42 19 47 50 56 56 18 50
Separate HR department
22 33 14 13 13 33 50 24 17 23 19 64 23
Employ own HR manager(s) without separate HR department
15 15 14 13 13 14 25 24 17 11 15 5 19
HR management is the responsibility of the Head Office
4 4 5 0 3 9 3 3 3 5 5 5 0
Use other approach to HR management
6 3 8 11 8 2 3 3 12 5 5 9 8
Respondents 349 147 174 47 143 95 36 75 64 208 295 22 26 A bold figure indicates a 95% confidence that that category differs from the other categories in that particular disaggregation Source: PACEC survey of committed organisations (Inv13, Com13, Non13)
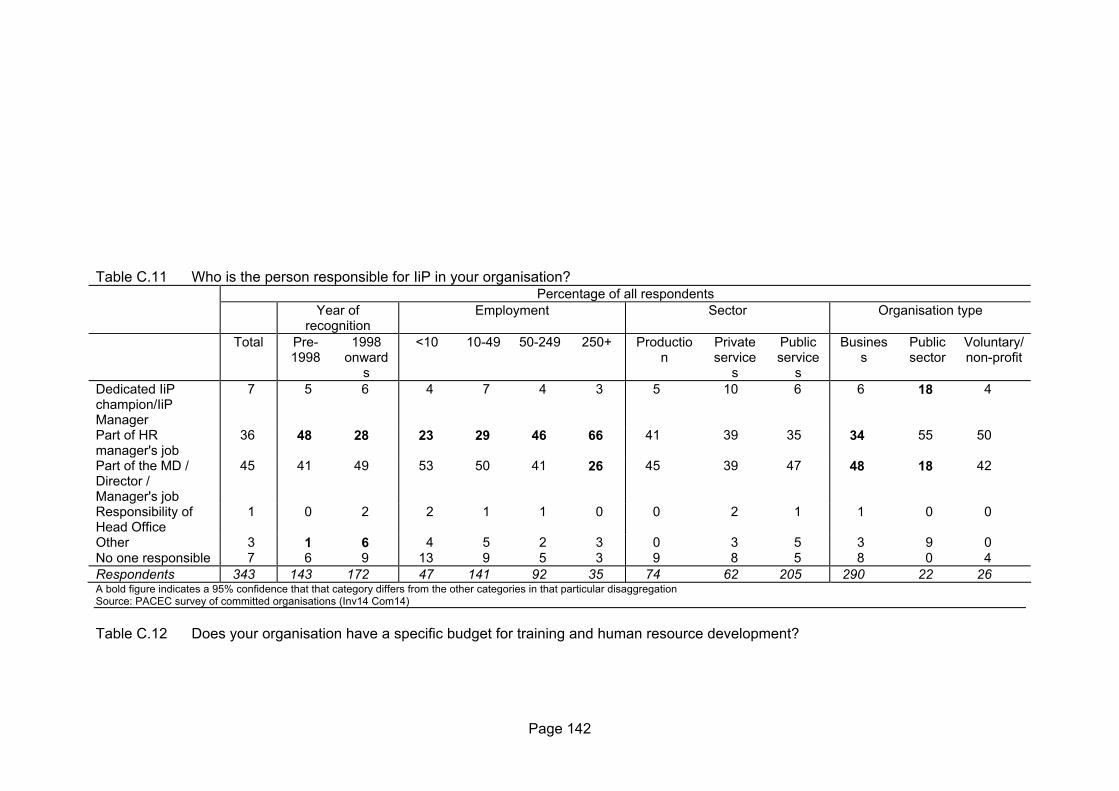
Page 142
Table C.11 Who is the person responsible for IiP in your organisation?
Percentage of all respondents Year of
recognition Employment Sector Organisation type
Total Pre-1998
1998 onward
s
<10 10-49 50-249 250+ Production
Private service
s
Public service
s
Business
Public sector
Voluntary/ non-profit
Dedicated IiP champion/IiP Manager
7 5 6 4 7 4 3 5 10 6 6 18 4
Part of HR manager's job
36 48 28 23 29 46 66 41 39 35 34 55 50
Part of the MD / Director / Manager's job
45 41 49 53 50 41 26 45 39 47 48 18 42
Responsibility of Head Office
1 0 2 2 1 1 0 0 2 1 1 0 0
Other 3 1 6 4 5 2 3 0 3 5 3 9 0 No one responsible 7 6 9 13 9 5 3 9 8 5 8 0 4 Respondents 343 143 172 47 141 92 35 74 62 205 290 22 26 A bold figure indicates a 95% confidence that that category differs from the other categories in that particular disaggregation Source: PACEC survey of committed organisations (Inv14 Com14) Table C.12 Does your organisation have a specific budget for training and human resource development?
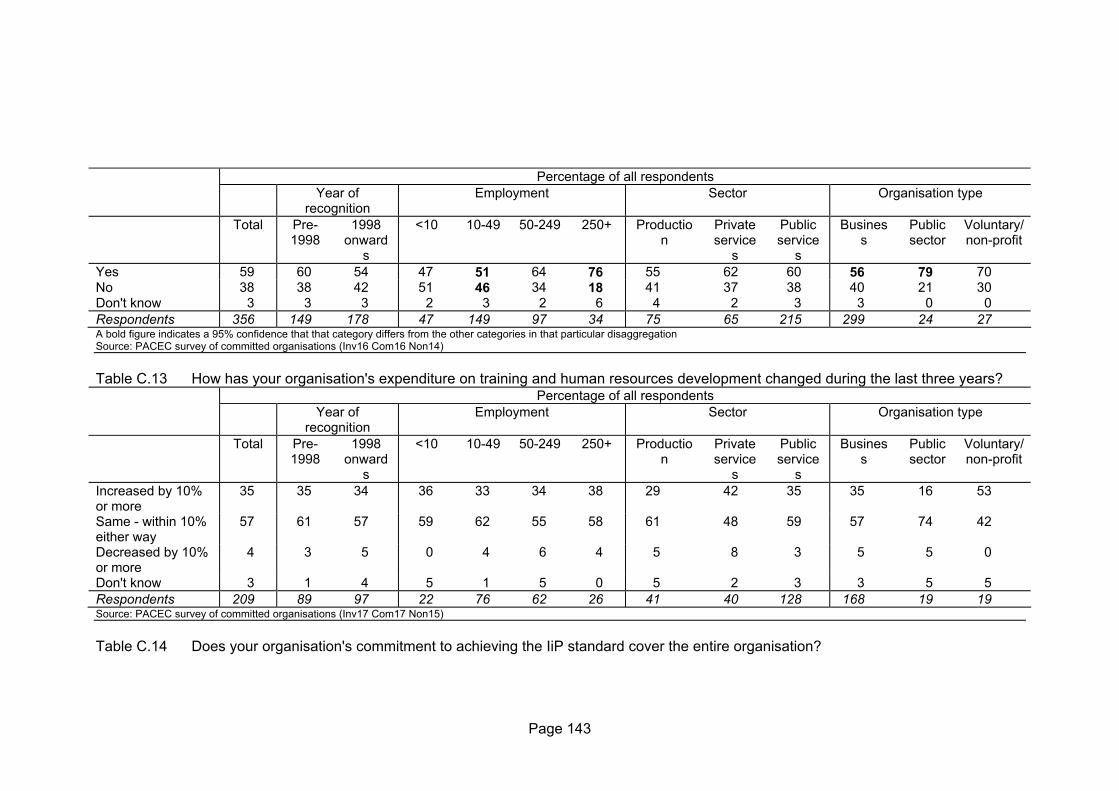
Page 143
Percentage of all respondents Year of
recognition Employment Sector Organisation type
Total Pre-1998
1998 onward
s
<10 10-49 50-249 250+ Production
Private service
s
Public service
s
Business
Public sector
Voluntary/ non-profit
Yes 59 60 54 47 51 64 76 55 62 60 56 79 70 No 38 38 42 51 46 34 18 41 37 38 40 21 30 Don't know 3 3 3 2 3 2 6 4 2 3 3 0 0 Respondents 356 149 178 47 149 97 34 75 65 215 299 24 27 A bold figure indicates a 95% confidence that that category differs from the other categories in that particular disaggregation Source: PACEC survey of committed organisations (Inv16 Com16 Non14) Table C.13 How has your organisation's expenditure on training and human resources development changed during the last three years?
Percentage of all respondents Year of
recognition Employment Sector Organisation type
Total Pre-1998
1998 onward
s
<10 10-49 50-249 250+ Production
Private service
s
Public service
s
Business
Public sector
Voluntary/ non-profit
Increased by 10% or more
35 35 34 36 33 34 38 29 42 35 35 16 53
Same - within 10% either way
57 61 57 59 62 55 58 61 48 59 57 74 42
Decreased by 10% or more
4 3 5 0 4 6 4 5 8 3 5 5 0
Don't know 3 1 4 5 1 5 0 5 2 3 3 5 5 Respondents 209 89 97 22 76 62 26 41 40 128 168 19 19 Source: PACEC survey of committed organisations (Inv17 Com17 Non15) Table C.14 Does your organisation's commitment to achieving the IiP standard cover the entire organisation?
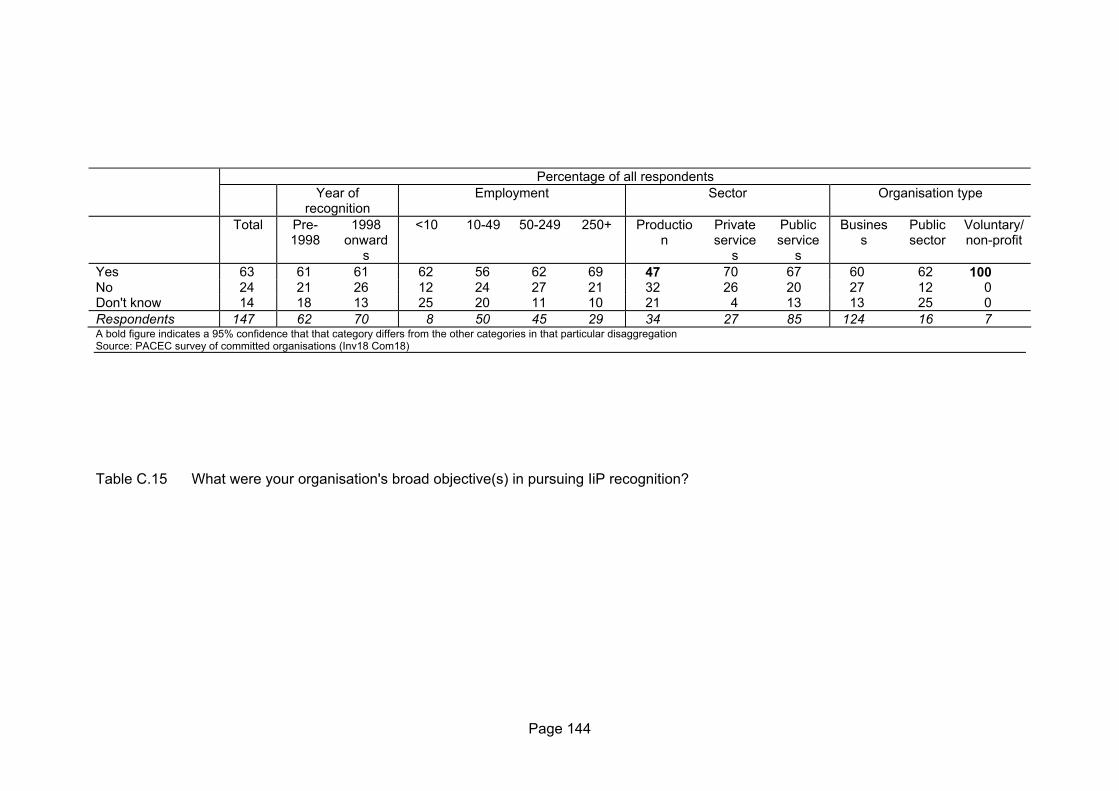
Page 144
Percentage of all respondents Year of
recognition Employment Sector Organisation type
Total Pre-1998
1998 onward
s
<10 10-49 50-249 250+ Production
Private service
s
Public service
s
Business
Public sector
Voluntary/ non-profit
Yes 63 61 61 62 56 62 69 47 70 67 60 62 100 No 24 21 26 12 24 27 21 32 26 20 27 12 0 Don't know 14 18 13 25 20 11 10 21 4 13 13 25 0 Respondents 147 62 70 8 50 45 29 34 27 85 124 16 7 A bold figure indicates a 95% confidence that that category differs from the other categories in that particular disaggregation Source: PACEC survey of committed organisations (Inv18 Com18) Table C.15 What were your organisation's broad objective(s) in pursuing IiP recognition?

Page 145
Percentage of all respondents Year of
recognition Employment Sector Organisation type
Total Pre-1998
1998 onward
s
<10 10-49 50-249 250+ Production
Private service
s
Public service
s
Business
Public sector
Voluntary/ non-profit
Business growth 29 25 34 30 28 34 24 32 26 28 32 12 15 Efficiency gains 54 60 54 53 58 56 59 52 39 59 55 62 38 Increase in profitability
31 34 31 26 28 40 41 34 23 32 35 8 8
Increase quality of products / services
45 45 47 49 39 52 59 49 24 50 43 50 65
Staff retention and easier recruitment
44 48 42 44 45 45 44 38 42 46 46 29 27
Change of corporate culture
11 9 11 12 11 8 9 15 11 10 11 12 8
Other 24 20 22 21 23 23 6 27 37 18 22 29 31 Any of the above 100 100 100 100 100 100 100 100 100 100 100 100 100 Respondents 334 138 167 43 137 91 34 71 62 200 278 24 26 A bold figure indicates a 95% confidence that that category differs from the other categories in that particular disaggregation Source: PACEC survey of committed organisations (Inv19 Com19)
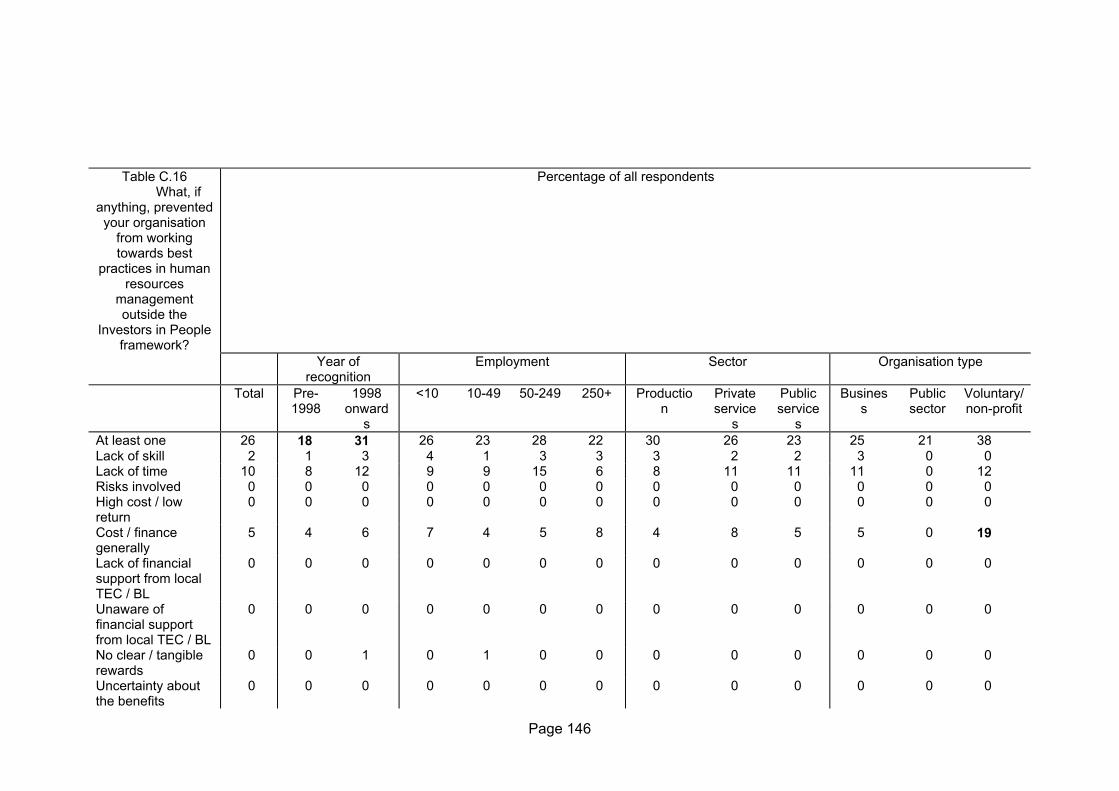
Page 146
Table C.16 What, if
anything, prevented your organisation
from working towards best
practices in human resources
management outside the
Investors in People framework?
Percentage of all respondents
Year of recognition
Employment Sector Organisation type
Total Pre-1998
1998 onward
s
<10 10-49 50-249 250+ Production
Private service
s
Public service
s
Business
Public sector
Voluntary/ non-profit
At least one 26 18 31 26 23 28 22 30 26 23 25 21 38 Lack of skill 2 1 3 4 1 3 3 3 2 2 3 0 0 Lack of time 10 8 12 9 9 15 6 8 11 11 11 0 12 Risks involved 0 0 0 0 0 0 0 0 0 0 0 0 0 High cost / low return
0 0 0 0 0 0 0 0 0 0 0 0 0
Cost / finance generally
5 4 6 7 4 5 8 4 8 5 5 0 19
Lack of financial support from local TEC / BL
0 0 0 0 0 0 0 0 0 0 0 0 0
Unaware of financial support from local TEC / BL
0 0 0 0 0 0 0 0 0 0 0 0 0
No clear / tangible rewards
0 0 1 0 1 0 0 0 0 0 0 0 0
Uncertainty about the benefits
0 0 0 0 0 0 0 0 0 0 0 0 0

Page 147
Conservatism / traditionalism / reluctance to change
2 2 2 4 3 1 0 3 2 2 2 4 4
Lack of understanding / knowledge of HR management
5 1 8 0 7 4 3 5 8 4 5 0 8
Lack of external advice and support
1 1 1 0 2 0 0 0 0 2 1 4 0
Lack of awareness of IiP
5 3 7 7 4 8 3 7 8 4 6 4 4
Other 4 3 4 2 3 4 6 7 5 2 3 8 4 None - already pursued best practice
51 48 52 52 57 41 47 37 43 59 48 71 50
None - wanted to consider alternative to IiP
0 1 0 2 0 0 0 0 0 0 0 0 0
None- other 4 3 5 4 3 6 3 7 5 2 4 8 0 Don't know 20 31 13 15 18 27 28 27 26 16 23 4 12 Respondents 349 146 174 46 145 93 36 73 65 209 293 24 26 A bold figure indicates a 95% confidence that that category differs from the other categories in that particular disaggregation Source: PACEC survey of committed organisations (Inv20 Com20) Table C.17 Did your organisation receive any financial support from public funds (mainly your local TEC or Business Link) to help it to achieve the IiP standard?
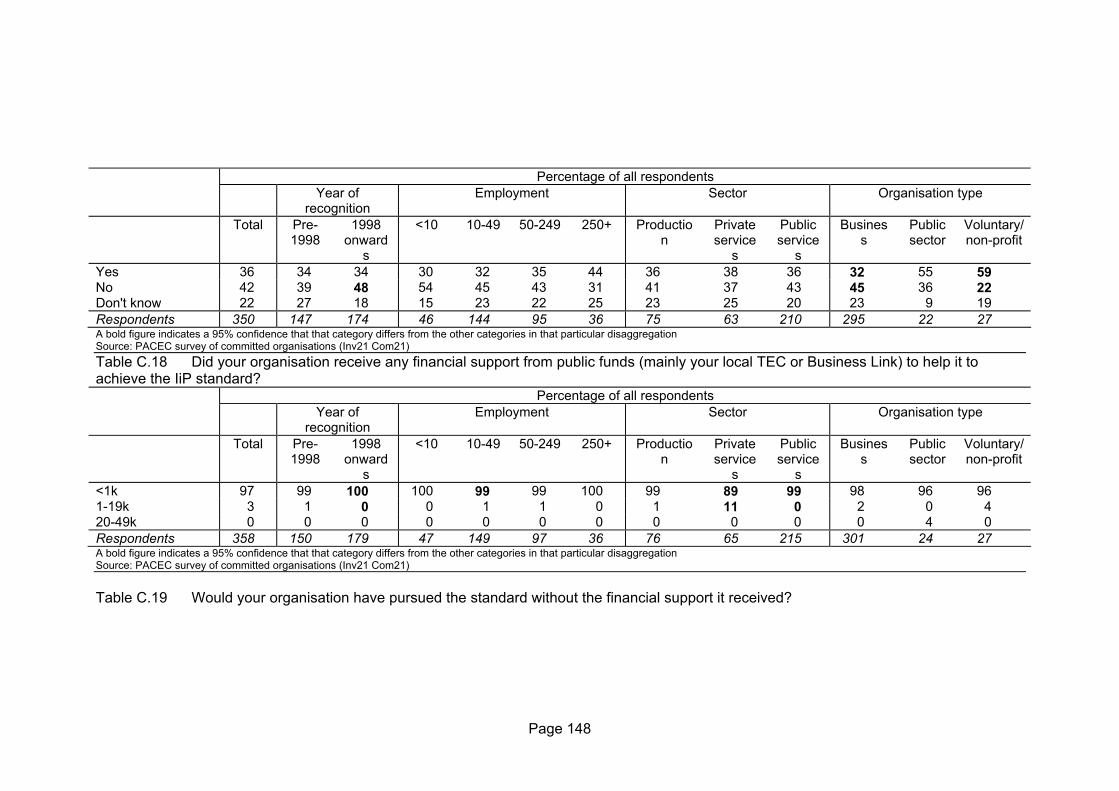
Page 148
Percentage of all respondents Year of
recognition Employment Sector Organisation type
Total Pre-1998
1998 onward
s
<10 10-49 50-249 250+ Production
Private service
s
Public service
s
Business
Public sector
Voluntary/ non-profit
Yes 36 34 34 30 32 35 44 36 38 36 32 55 59 No 42 39 48 54 45 43 31 41 37 43 45 36 22 Don't know 22 27 18 15 23 22 25 23 25 20 23 9 19 Respondents 350 147 174 46 144 95 36 75 63 210 295 22 27 A bold figure indicates a 95% confidence that that category differs from the other categories in that particular disaggregation Source: PACEC survey of committed organisations (Inv21 Com21) Table C.18 Did your organisation receive any financial support from public funds (mainly your local TEC or Business Link) to help it to achieve the IiP standard?
Percentage of all respondents Year of
recognition Employment Sector Organisation type
Total Pre-1998
1998 onward
s
<10 10-49 50-249 250+ Production
Private service
s
Public service
s
Business
Public sector
Voluntary/ non-profit
<1k 97 99 100 100 99 99 100 99 89 99 98 96 96 1-19k 3 1 0 0 1 1 0 1 11 0 2 0 4 20-49k 0 0 0 0 0 0 0 0 0 0 0 4 0 Respondents 358 150 179 47 149 97 36 76 65 215 301 24 27 A bold figure indicates a 95% confidence that that category differs from the other categories in that particular disaggregation Source: PACEC survey of committed organisations (Inv21 Com21) Table C.19 Would your organisation have pursued the standard without the financial support it received?

Page 149
Percentage of all respondents Year of
recognition Employment Sector Organisation type
Total Pre-1998
1998 onward
s
<10 10-49 50-249 250+ Production
Private service
s
Public service
s
Business
Public sector
Voluntary/ non-profit
Definitely 27 25 24 15 26 20 38 32 25 27 26 89 7 Probably 35 45 27 46 44 20 38 24 38 38 35 11 36 Possibly 26 27 29 31 21 43 15 32 25 23 28 0 29 Probably not 12 2 20 8 10 17 8 12 12 12 12 0 29 Respondents 113 44 51 13 39 30 13 25 24 64 86 9 14 A bold figure indicates a 95% confidence that that category differs from the other categories in that particular disaggregation Source: PACEC survey of committed organisations (Inv22 Com22) Table C.20 Did your organisation receive any non-financial support from public sources to help it achieve the IiP standard?
Percentage of all respondents Year of
recognition Employment Sector Organisation type
Total Pre-1998
1998 onward
s
<10 10-49 50-249 250+ Production
Private service
s
Public service
s
Business
Public sector
Voluntary/ non-profit
Yes 61 59 60 57 53 66 74 57 60 64 59 75 68 No 22 19 26 32 26 17 14 24 18 21 23 10 20 Don't know 17 22 14 11 22 17 11 20 22 14 18 15 12 Respondents 348 143 176 47 144 93 35 76 65 205 297 20 25 A bold figure indicates a 95% confidence that that category differs from the other categories in that particular disaggregation Source: PACEC survey of committed organisations (Inv23 Com23)

Page 150
Table C.21 Would your organisation have pursued the standard without the non-financial support it received? Percentage of all respondents Year of
recognition Employment Sector Organisation type
Total Pre-1998
1998 onward
s
<10 10-49 50-249 250+ Production
Private service
s
Public service
s
Business
Public sector
Voluntary/ non-profit
Definitely 20 23 16 33 18 8 38 12 11 25 18 64 19 Probably 41 52 34 33 41 46 46 44 45 38 44 18 25 Possibly 26 17 36 21 26 34 17 34 13 28 26 18 38 Probably not 11 8 12 8 13 12 0 10 29 6 12 0 12 Definitely not 2 0 2 4 1 0 0 0 3 3 1 0 6 Respondents 197 83 92 24 68 59 24 41 38 118 164 11 16 A bold figure indicates a 95% confidence that that category differs from the other categories in that particular disaggregation Source: PACEC survey of committed organisations (Inv24 Com24) Table C.22 To what extent has working towards and achieving the IiP standard helped your organisation to achieve the broad objectives you mentioned earlier?

Page 151
Percentage of all respondents Year of
recognition Employment Sector Organisation type
Total Pre-1998
1998 onward
s
<10 10-49 50-249 250+ Production
Private service
s
Public service
s
Business
Public sector
Voluntary/ non-profit
To a great extent 12 11 11 18 11 12 0 8 12 14 10 26 32 To some extent 61 62 61 57 62 60 72 60 53 64 63 63 48 Not at all 25 25 28 25 26 27 28 31 34 21 26 11 20 Don't know 1 2 0 0 1 1 0 1 2 1 1 0 0 Respondents 328 133 167 44 135 89 32 72 59 196 278 19 25 A bold figure indicates a 95% confidence that that category differs from the other categories in that particular disaggregation Source: PACEC survey of committed organisations (Inv25 Com25) Table C.23 Please explain any increase or decrease (in resource inputs for HR development)
Percentage of all respondents Year of
recognition Employment Sector Organisation type
Total Pre-1998
1998 onward
s
<10 10-49 50-249 250+ Production
Private service
s
Public service
s
Business
Public sector
Voluntary/ non-profit
Yes, still progressing
70 70 69 70 70 72 60 57 65 76 68 87 81
No, commitment suspended for the time being
14 16 13 15 14 10 26 24 6 13 14 13 11
No, abandoned 15 13 17 13 16 16 14 18 26 10 16 0 7 Don't know 1 2 0 2 1 1 0 1 3 1 2 0 0 Respondents 355 148 178 46 148 97 35 76 65 212 299 23 27 A bold figure indicates a 95% confidence that that category differs from the other categories in that particular disaggregation Source: PACEC survey of committed organisations (Com27/26)

Page 152
Table C.24 Please explain any increase or decrease (in resource inputs for HR development) Percentage of all respondents Year of
recognition Employment Sector Organisation type
Total Pre-1998
1998 onward
s
<10 10-49 50-249 250+ Production
Private service
s
Public service
s
Business
Public sector
Voluntary/ non-profit
No target 12 22 3 17 9 12 15 10 16 12 12 6 21 Don't know 17 20 14 10 13 23 25 13 5 21 18 11 5 1999 1 0 2 0 1 2 0 3 0 1 1 0 5 2000 4 6 3 3 3 6 5 3 5 5 4 11 0 2001 28 27 30 31 33 23 25 28 32 27 28 33 21 2002 35 24 44 38 39 32 25 36 42 33 34 33 47 2003 2 0 3 0 2 2 5 8 0 1 2 6 0 Respondents 228 94 115 29 95 65 20 39 38 151 190 18 19 A bold figure indicates a 95% confidence that that category differs from the other categories in that particular disaggregation Source: PACEC survey of committed organisations (Com31/30) Table C.25 Please explain any increase or decrease (in resource inputs for HR development)
Percentage of all respondents Year of
recognition Employment Sector Organisation type
Total Pre-1998
1998 onward
s
<10 10-49 50-249 250+ Production
Private service
s
Public service
s
Business
Public sector
Voluntary/ non-profit
Yes 71 59 80 88 82 58 45 69 55 76 71 79 65 No, will be reached later than planned
21 34 12 12 14 33 25 25 39 15 21 14 24
Not sure 8 7 9 0 4 9 30 6 6 9 8 7 12 Respondents 190 74 103 24 78 55 20 36 33 121 159 14 17 A bold figure indicates a 95% confidence that that category differs from the other categories in that particular disaggregation Source: PACEC survey of committed organisations (Com32/31)

Page 153
Table C.26 Please explain any increase or decrease (in resource inputs for HR development)
Percentage of all respondents Year of
recognition Employment Sector Organisation type
Total Pre-1998
1998 onward
s
<10 10-49 50-249 250+ Production
Private service
s
Public service
s
Business
Public sector
Voluntary/ non-profit
<6 months 93 89 97 96 97 88 89 93 85 95 93 96 85 6-11 months 4 9 0 2 2 8 6 7 8 3 5 0 0 12-17 months 2 1 3 2 1 3 6 0 6 1 1 0 15 18-23 months 1 1 0 0 0 1 0 0 2 0 0 4 0 Respondents 358 150 179 47 149 97 36 76 65 215 301 24 27 A bold figure indicates a 95% confidence that that category differs from the other categories in that particular disaggregation Source: PACEC survey of committed organisations (Com33/32) Table C.27 Please explain any increase or decrease (in resource inputs for HR development)
Percentage of all respondents Year of
recognition Employment Sector Organisation type
Total Pre-1998
1998 onward
s
<10 10-49 50-249 250+ Production
Private service
s
Public service
s
Business
Public sector
Voluntary/ non-profit
Yes 15 17 11 12 13 16 15 19 19 12 16 8 7 No 85 83 89 88 87 84 85 81 81 88 84 92 93 Respondents 163 65 87 24 70 45 13 31 31 101 136 13 14 Source: PACEC survey of committed organisations (Com34/33)
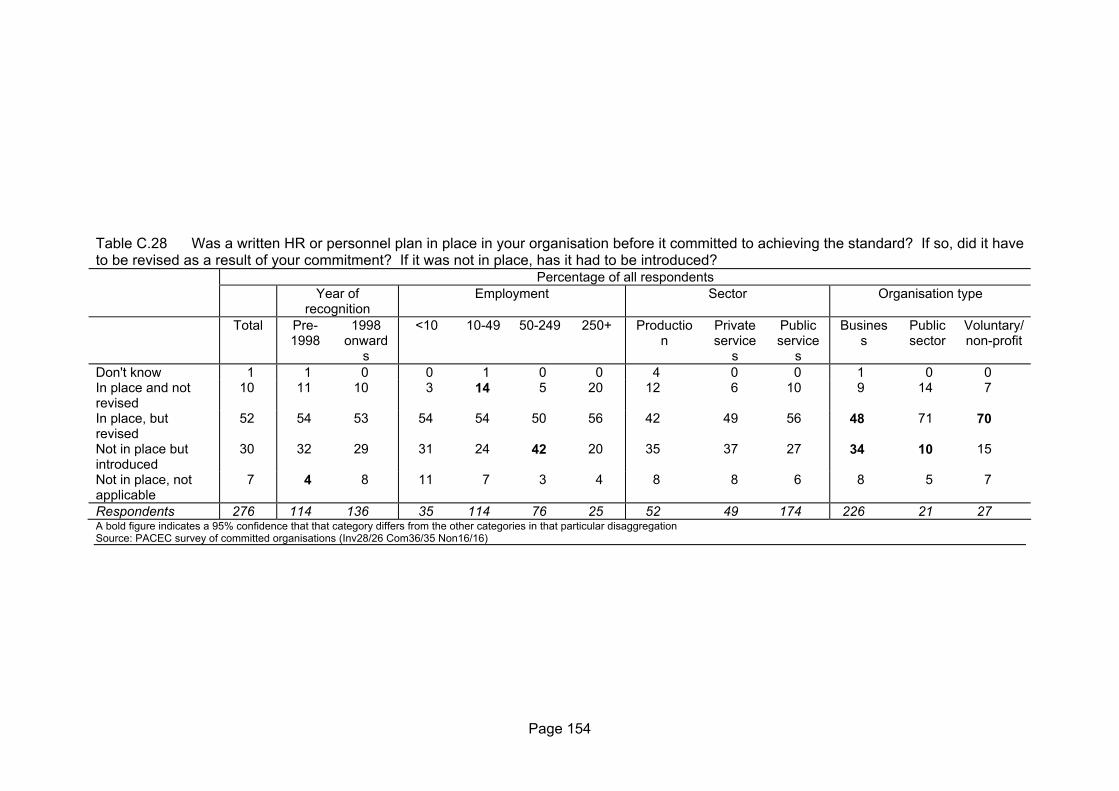
Page 154
Table C.28 Was a written HR or personnel plan in place in your organisation before it committed to achieving the standard? If so, did it have to be revised as a result of your commitment? If it was not in place, has it had to be introduced?
Percentage of all respondents Year of
recognition Employment Sector Organisation type
Total Pre-1998
1998 onward
s
<10 10-49 50-249 250+ Production
Private service
s
Public service
s
Business
Public sector
Voluntary/ non-profit
Don't know 1 1 0 0 1 0 0 4 0 0 1 0 0 In place and not revised
10 11 10 3 14 5 20 12 6 10 9 14 7
In place, but revised
52 54 53 54 54 50 56 42 49 56 48 71 70
Not in place but introduced
30 32 29 31 24 42 20 35 37 27 34 10 15
Not in place, not applicable
7 4 8 11 7 3 4 8 8 6 8 5 7
Respondents 276 114 136 35 114 76 25 52 49 174 226 21 27 A bold figure indicates a 95% confidence that that category differs from the other categories in that particular disaggregation Source: PACEC survey of committed organisations (Inv28/26 Com36/35 Non16/16)
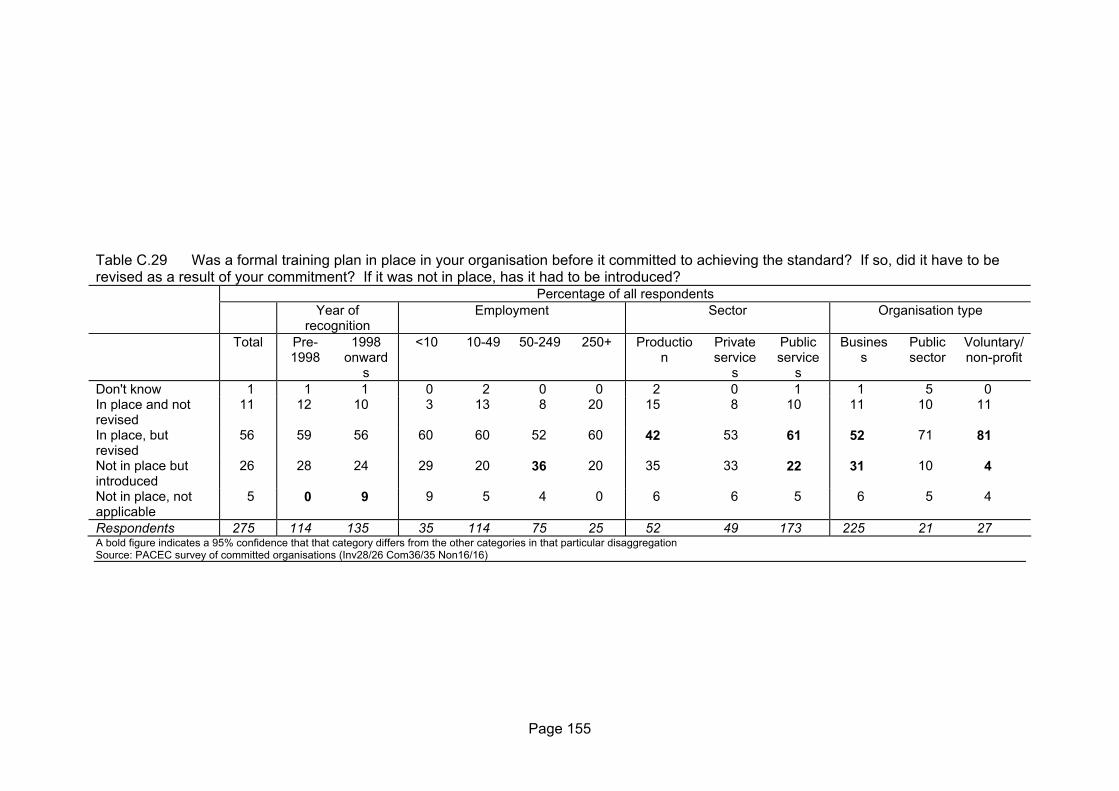
Page 155
Table C.29 Was a formal training plan in place in your organisation before it committed to achieving the standard? If so, did it have to be revised as a result of your commitment? If it was not in place, has it had to be introduced?
Percentage of all respondents Year of
recognition Employment Sector Organisation type
Total Pre-1998
1998 onward
s
<10 10-49 50-249 250+ Production
Private service
s
Public service
s
Business
Public sector
Voluntary/ non-profit
Don't know 1 1 1 0 2 0 0 2 0 1 1 5 0 In place and not revised
11 12 10 3 13 8 20 15 8 10 11 10 11
In place, but revised
56 59 56 60 60 52 60 42 53 61 52 71 81
Not in place but introduced
26 28 24 29 20 36 20 35 33 22 31 10 4
Not in place, not applicable
5 0 9 9 5 4 0 6 6 5 6 5 4
Respondents 275 114 135 35 114 75 25 52 49 173 225 21 27 A bold figure indicates a 95% confidence that that category differs from the other categories in that particular disaggregation Source: PACEC survey of committed organisations (Inv28/26 Com36/35 Non16/16)

Page 156
Table C.30 Was a system for identifying training needs in place in your organisation before it committed to achieving the standard? If so, did it have to be revised as a result of your commitment? If it was not in place, has it had to be introduced?
Percentage of all respondents Year of
recognition Employment Sector Organisation type
Total Pre-1998
1998 onward
s
<10 10-49 50-249 250+ Production
Private service
s
Public service
s
Business
Public sector
Voluntary/ non-profit
In place and not revised
11 11 10 3 14 7 16 13 8 10 9 14 11
In place, but revised
64 72 59 60 62 68 76 58 71 64 64 62 74
Not in place but introduced
21 16 24 29 18 23 8 27 16 20 22 24 11
Not in place, not applicable
4 1 7 9 5 3 0 2 4 5 5 0 4
Respondents 275 114 135 35 114 75 25 52 49 173 225 21 27 A bold figure indicates a 95% confidence that that category differs from the other categories in that particular disaggregation Source: PACEC survey of committed organisations (Inv28/26 Com36/35 Non16/16) Table C.31 Was a system for evaluating training in place in your organisation before it committed to achieving the standard? If so, did it have to be revised as a result of your commitment? If it was not in place, has it had to be introduced?

Page 157
Percentage of all respondents Year of
recognition Employment Sector Organisation type
Total Pre-1998
1998 onward
s
<10 10-49 50-249 250+ Production
Private service
s
Public service
s
Business
Public sector
Voluntary/ non-profit
In place and not revised
10 11 9 0 14 7 16 13 6 10 9 14 7
In place, but revised
59 65 59 57 61 63 68 48 63 62 58 67 67
Not in place but introduced
26 23 25 34 21 28 12 35 27 23 27 19 22
Not in place, not applicable
5 1 7 9 4 3 4 4 4 5 5 0 4
Respondents 275 114 135 35 114 75 25 52 49 173 225 21 27 A bold figure indicates a 95% confidence that that category differs from the other categories in that particular disaggregation Source: PACEC survey of committed organisations (Inv28/26 Com36/35 Non16/16) Table C.32 Was your business plan communicated to employees in your organisation before it committed to achieving the standard? If so, did this have to be revised as a result of your commitment? If this was not in place, has it had to be introduced?

Page 158
Percentage of all respondents Year of
recognition Employment Sector Organisation type
Total Pre-1998
1998 onward
s
<10 10-49 50-249 250+ Production
Private service
s
Public service
s
Business
Public sector
Voluntary/ non-profit
Don't know 2 1 2 0 2 3 0 4 0 2 2 0 4 In place and not revised
10 12 9 3 14 9 8 13 4 10 9 14 11
In place, but revised
56 57 56 49 59 52 72 46 57 58 54 67 63
Not in place but introduced
28 30 24 43 20 32 20 33 31 25 30 19 19
Not in place, not applicable
5 0 8 6 5 4 0 4 8 5 6 0 4
Respondents 275 114 135 35 114 75 25 52 49 173 225 21 27 A bold figure indicates a 95% confidence that that category differs from the other categories in that particular disaggregation Source: PACEC survey of committed organisations (Inv28/26 Com36/35 Non16/16) Table C.33 Was an employee communication process or appraisal system in place in your organisation before it committed to achieving the

Page 159
standard? If so, did it have to be revised as a result of your commitment? If it was not in place has it had to be introduced? Percentage of all respondents Year of
recognition Employment Sector Organisation type
Total Pre-1998
1998 onward
s
<10 10-49 50-249 250+ Production
Private service
s
Public service
s
Business
Public sector
Voluntary/ non-profit
In place and not revised
12 11 10 3 13 8 16 15 8 12 12 10 11
In place, but revised
71 78 68 71 70 75 80 60 80 72 69 71 81
Not in place but introduced
14 10 16 20 11 15 4 21 8 13 15 19 4
Not in place, not applicable
4 1 7 6 5 3 0 4 4 4 4 0 4
Respondents 275 114 135 35 114 75 25 52 49 173 225 21 27 A bold figure indicates a 95% confidence that that category differs from the other categories in that particular disaggregation Source: PACEC survey of committed organisations (Inv28/26 Com36/35 Non16/16)

Page 160
Table C.34 Was benchmarking with other organisations in place in your organisation before it committed to achieving the standard? If so, did it have to be revised as a result of your commitment? If it was not in place, has it had to be introduced?
Percentage of all respondents Year of
recognition Employment Sector Organisation type
Total Pre-1998
1998 onward
s
<10 10-49 50-249 250+ Production
Private service
s
Public service
s
Business
Public sector
Voluntary/ non-profit
Don't know 9 11 8 6 11 5 16 13 8 8 8 19 11 In place and not revised
7 7 6 0 7 7 12 6 8 8 7 14 7
In place, but revised
40 41 41 44 49 29 36 29 39 43 39 52 37
Not in place but introduced
11 6 13 12 10 12 4 17 4 10 10 10 19
Not in place, not applicable
33 35 31 38 23 47 32 35 41 31 37 5 26
Respondents 274 113 135 34 114 75 25 52 49 172 224 21 27 A bold figure indicates a 95% confidence that that category differs from the other categories in that particular disaggregation Source: PACEC survey of committed organisations (Inv28/26 Com36/35 Non16/16) Table C.35 To what extent has participating in IiP affected your organisation overall?
Percentage of all respondents Year of
recognition Employment Sector Organisation type
Total Pre-1998
1998 onward
s
<10 10-49 50-249 250+ Production
Private service
s
Public service
s
Business
Public sector
Voluntary/ non-profit
Don't know 6 10 4 4 7 7 8 1 5 8 6 17 0 Some benefit 51 55 45 55 41 61 47 47 51 53 50 50 74 To early to say 33 27 39 30 43 20 36 37 28 33 33 33 19 No benefit 10 8 12 11 9 12 8 14 17 7 11 0 7 Respondents 358 150 179 47 149 97 36 76 65 215 301 24 27 A bold figure indicates a 95% confidence that that category differs from the other categories in that particular disaggregation Source: PACEC survey of committed organisations (Inv33/30 Com37/36 Non20)
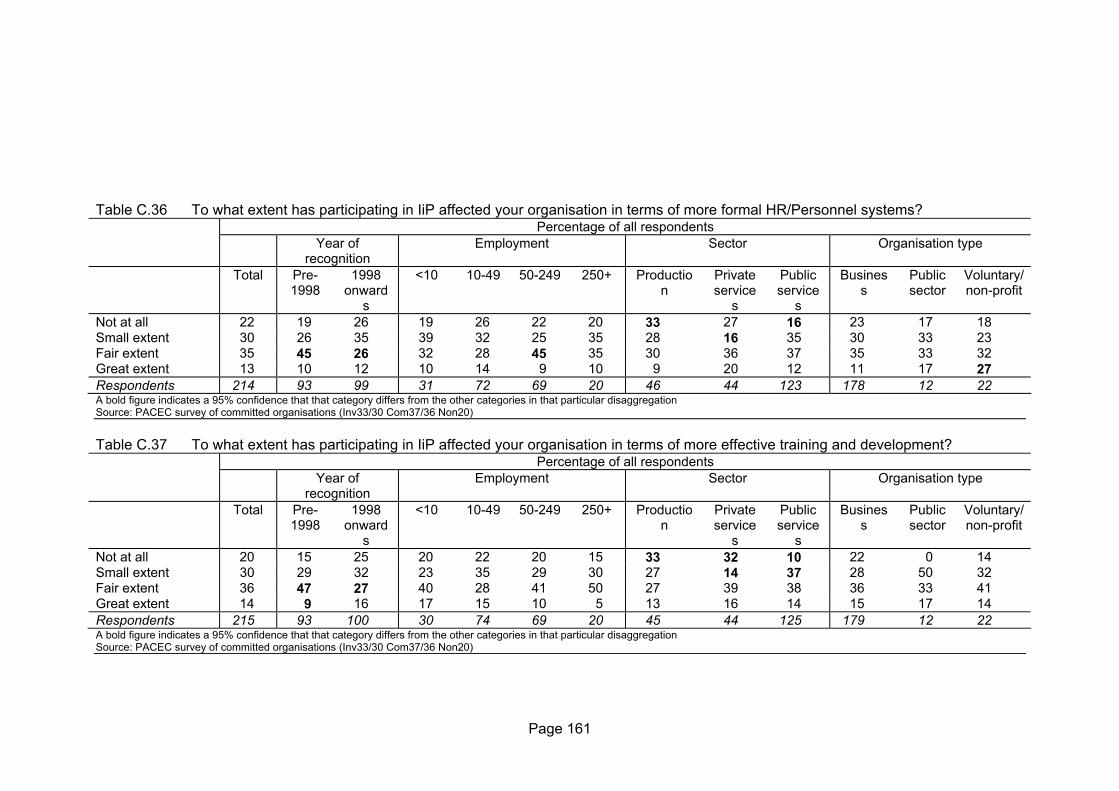
Page 161
Table C.36 To what extent has participating in IiP affected your organisation in terms of more formal HR/Personnel systems?
Percentage of all respondents Year of
recognition Employment Sector Organisation type
Total Pre-1998
1998 onward
s
<10 10-49 50-249 250+ Production
Private service
s
Public service
s
Business
Public sector
Voluntary/ non-profit
Not at all 22 19 26 19 26 22 20 33 27 16 23 17 18 Small extent 30 26 35 39 32 25 35 28 16 35 30 33 23 Fair extent 35 45 26 32 28 45 35 30 36 37 35 33 32 Great extent 13 10 12 10 14 9 10 9 20 12 11 17 27 Respondents 214 93 99 31 72 69 20 46 44 123 178 12 22 A bold figure indicates a 95% confidence that that category differs from the other categories in that particular disaggregation Source: PACEC survey of committed organisations (Inv33/30 Com37/36 Non20) Table C.37 To what extent has participating in IiP affected your organisation in terms of more effective training and development?
Percentage of all respondents Year of
recognition Employment Sector Organisation type
Total Pre-1998
1998 onward
s
<10 10-49 50-249 250+ Production
Private service
s
Public service
s
Business
Public sector
Voluntary/ non-profit
Not at all 20 15 25 20 22 20 15 33 32 10 22 0 14 Small extent 30 29 32 23 35 29 30 27 14 37 28 50 32 Fair extent 36 47 27 40 28 41 50 27 39 38 36 33 41 Great extent 14 9 16 17 15 10 5 13 16 14 15 17 14 Respondents 215 93 100 30 74 69 20 45 44 125 179 12 22 A bold figure indicates a 95% confidence that that category differs from the other categories in that particular disaggregation Source: PACEC survey of committed organisations (Inv33/30 Com37/36 Non20)
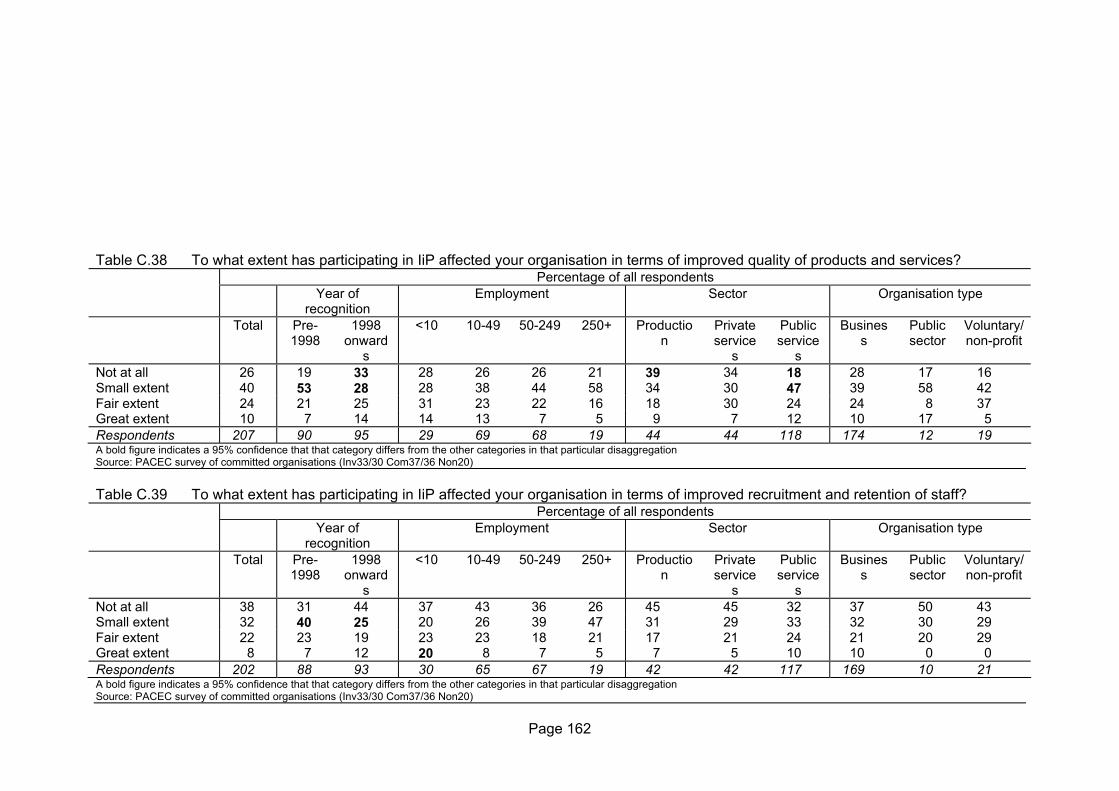
Page 162
Table C.38 To what extent has participating in IiP affected your organisation in terms of improved quality of products and services?
Percentage of all respondents Year of
recognition Employment Sector Organisation type
Total Pre-1998
1998 onward
s
<10 10-49 50-249 250+ Production
Private service
s
Public service
s
Business
Public sector
Voluntary/ non-profit
Not at all 26 19 33 28 26 26 21 39 34 18 28 17 16 Small extent 40 53 28 28 38 44 58 34 30 47 39 58 42 Fair extent 24 21 25 31 23 22 16 18 30 24 24 8 37 Great extent 10 7 14 14 13 7 5 9 7 12 10 17 5 Respondents 207 90 95 29 69 68 19 44 44 118 174 12 19 A bold figure indicates a 95% confidence that that category differs from the other categories in that particular disaggregation Source: PACEC survey of committed organisations (Inv33/30 Com37/36 Non20) Table C.39 To what extent has participating in IiP affected your organisation in terms of improved recruitment and retention of staff?
Percentage of all respondents Year of
recognition Employment Sector Organisation type
Total Pre-1998
1998 onward
s
<10 10-49 50-249 250+ Production
Private service
s
Public service
s
Business
Public sector
Voluntary/ non-profit
Not at all 38 31 44 37 43 36 26 45 45 32 37 50 43 Small extent 32 40 25 20 26 39 47 31 29 33 32 30 29 Fair extent 22 23 19 23 23 18 21 17 21 24 21 20 29 Great extent 8 7 12 20 8 7 5 7 5 10 10 0 0 Respondents 202 88 93 30 65 67 19 42 42 117 169 10 21 A bold figure indicates a 95% confidence that that category differs from the other categories in that particular disaggregation Source: PACEC survey of committed organisations (Inv33/30 Com37/36 Non20)

Page 163
Table C.40 To what extent has participating in IiP affected your organisation in terms of improved business growth performance?
Percentage of all respondents Year of
recognition Employment Sector Organisation type
Total Pre-1998
1998 onward
s
<10 10-49 50-249 250+ Production
Private service
s
Public service
s
Business
Public sector
Voluntary/ non-profit
Not at all 34 32 38 40 38 30 32 33 43 32 33 45 43 Small extent 39 43 34 23 37 45 47 42 36 40 40 36 33 Fair extent 20 20 18 20 18 21 16 21 17 20 20 18 19 Great extent 6 4 10 17 7 3 5 5 5 8 7 0 5 Respondents 203 90 93 30 68 66 19 43 42 117 169 11 21 A bold figure indicates a 95% confidence that that category differs from the other categories in that particular disaggregation Source: PACEC survey of committed organisations (Inv33/30 Com37/36 Non20) Table C.41 To what extent has participating in IiP affected your organisation in terms of external perception of the organisation?

Page 164
Percentage of all respondents Year of
recognition Employment Sector Organisation type
Total Pre-1998
1998 onward
s
<10 10-49 50-249 250+ Production
Private service
s
Public service
s
Business
Public sector
Voluntary/ non-profit
Not at all 36 23 46 33 42 30 26 44 42 30 37 44 24 Small extent 24 28 22 20 24 27 26 28 23 23 24 33 24 Fair extent 30 39 21 23 28 30 42 21 26 35 30 11 33 Great extent 10 10 12 23 6 12 5 7 9 12 9 11 19 Respondents 202 90 92 30 67 66 19 43 43 115 170 9 21 A bold figure indicates a 95% confidence that that category differs from the other categories in that particular disaggregation Source: PACEC survey of committed organisations (Inv33/30 Com37/36 Non20) Table C.42 To what extent has participating in IiP affected your organisation in terms of improved customer satisfaction?
Percentage of all respondents Year of
recognition Employment Sector Organisation type
Total Pre-1998
1998 onward
s
<10 10-49 50-249 250+ Production
Private service
s
Public service
s
Business
Public sector
Voluntary/ non-profit
Not at all 43 34 53 45 53 35 37 45 43 43 41 60 52 Small extent 33 41 22 17 26 40 42 31 36 33 34 20 24 Fair extent 19 20 19 28 15 22 16 21 19 17 20 10 19 Great extent 5 4 7 10 6 3 5 2 2 7 5 10 5 Respondents 200 90 91 29 68 65 19 42 42 115 167 10 21 A bold figure indicates a 95% confidence that that category differs from the other categories in that particular disaggregation Source: PACEC survey of committed organisations (Inv33/30 Com37/36 Non20)
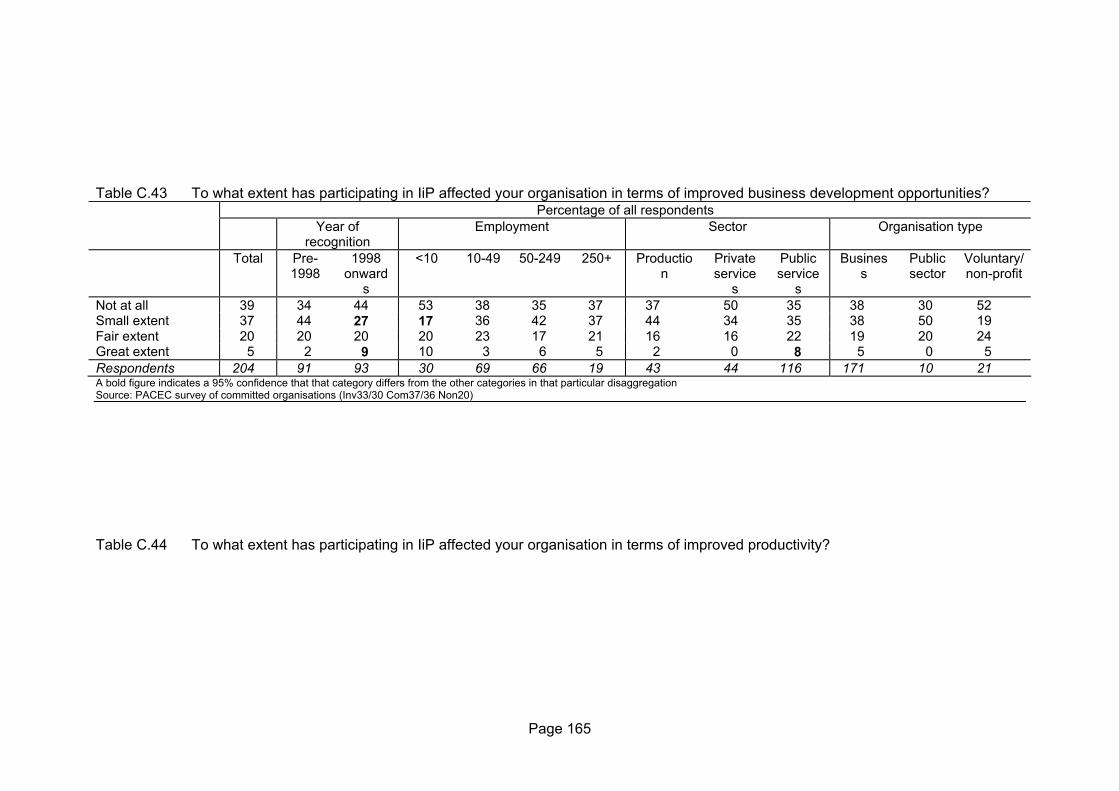
Page 165
Table C.43 To what extent has participating in IiP affected your organisation in terms of improved business development opportunities?
Percentage of all respondents Year of
recognition Employment Sector Organisation type
Total Pre-1998
1998 onward
s
<10 10-49 50-249 250+ Production
Private service
s
Public service
s
Business
Public sector
Voluntary/ non-profit
Not at all 39 34 44 53 38 35 37 37 50 35 38 30 52 Small extent 37 44 27 17 36 42 37 44 34 35 38 50 19 Fair extent 20 20 20 20 23 17 21 16 16 22 19 20 24 Great extent 5 2 9 10 3 6 5 2 0 8 5 0 5 Respondents 204 91 93 30 69 66 19 43 44 116 171 10 21 A bold figure indicates a 95% confidence that that category differs from the other categories in that particular disaggregation Source: PACEC survey of committed organisations (Inv33/30 Com37/36 Non20) Table C.44 To what extent has participating in IiP affected your organisation in terms of improved productivity?
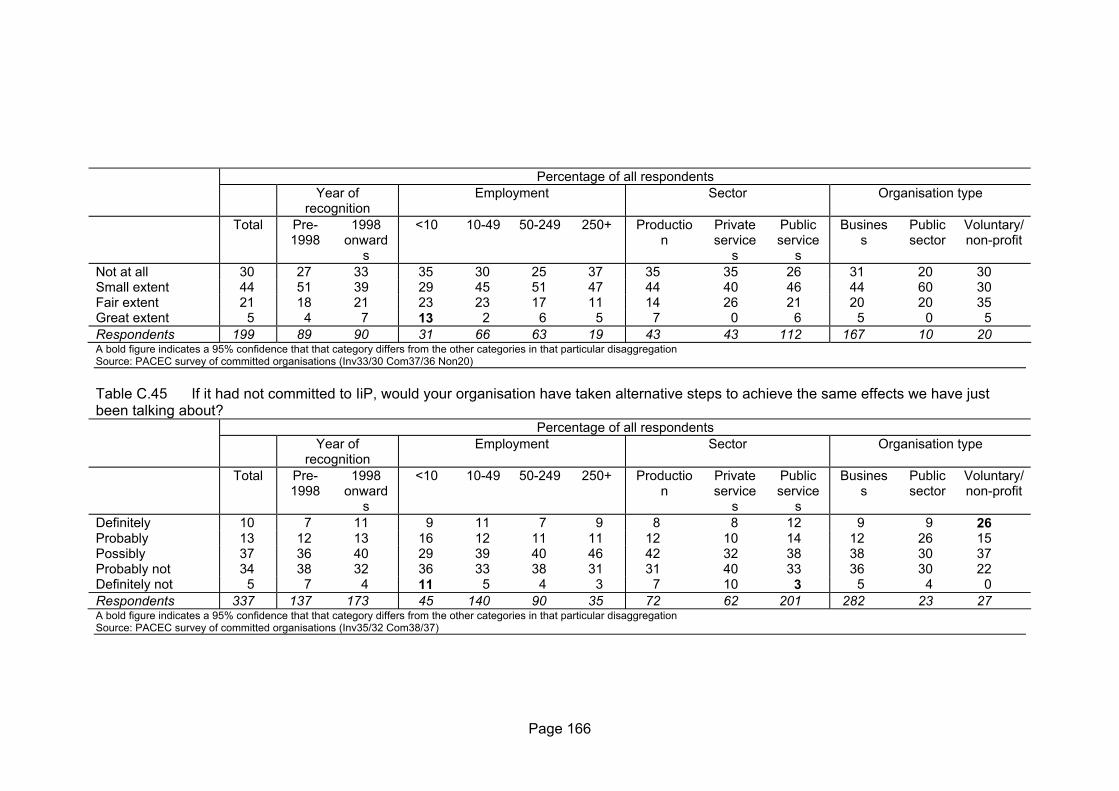
Page 166
Percentage of all respondents Year of
recognition Employment Sector Organisation type
Total Pre-1998
1998 onward
s
<10 10-49 50-249 250+ Production
Private service
s
Public service
s
Business
Public sector
Voluntary/ non-profit
Not at all 30 27 33 35 30 25 37 35 35 26 31 20 30 Small extent 44 51 39 29 45 51 47 44 40 46 44 60 30 Fair extent 21 18 21 23 23 17 11 14 26 21 20 20 35 Great extent 5 4 7 13 2 6 5 7 0 6 5 0 5 Respondents 199 89 90 31 66 63 19 43 43 112 167 10 20 A bold figure indicates a 95% confidence that that category differs from the other categories in that particular disaggregation Source: PACEC survey of committed organisations (Inv33/30 Com37/36 Non20) Table C.45 If it had not committed to IiP, would your organisation have taken alternative steps to achieve the same effects we have just been talking about?
Percentage of all respondents Year of
recognition Employment Sector Organisation type
Total Pre-1998
1998 onward
s
<10 10-49 50-249 250+ Production
Private service
s
Public service
s
Business
Public sector
Voluntary/ non-profit
Definitely 10 7 11 9 11 7 9 8 8 12 9 9 26 Probably 13 12 13 16 12 11 11 12 10 14 12 26 15 Possibly 37 36 40 29 39 40 46 42 32 38 38 30 37 Probably not 34 38 32 36 33 38 31 31 40 33 36 30 22 Definitely not 5 7 4 11 5 4 3 7 10 3 5 4 0 Respondents 337 137 173 45 140 90 35 72 62 201 282 23 27 A bold figure indicates a 95% confidence that that category differs from the other categories in that particular disaggregation Source: PACEC survey of committed organisations (Inv35/32 Com38/37)

Page 167
Table C.46 Turnover (last financial year)
Total Pre-
1998 1998
onwards
<10 10-49 50-249 250+ Production
Private service
s
Public service
s
Business
Public sector
Voluntary/ non-profit
Median 1,500 2,000 1,500 700 1,000 3,000 36,000 3,000 2,000 1,000 2,000 5,000 500 Mean 17,025 18,779 7,031 1,369 3,672 5,561 74,129 13,351 6,378 22,955 11,017 0 2,920 Min 15 15 17 100 17 15 75 17 75 15 17 60 15 Max 0 0 0 5,000 25,000 25,000 0 0 81,500 0 0 0 32,000 Responses 173 66 89 24 69 44 18 48 33 91 143 7 20 Source: PACEC survey of committed organisations (Inv39-40/35-36 Com42-43/40-41 Non28-29/27-28) Table C.47 Employment (last financial year)
Total Pre-
1998 1998
onwards
<10 10-49 50-249 250+ Production
Private service
s
Public service
s
Business
Public sector
Voluntary/ non-profit
Median 40 65 32 10 26 70 350 74 25 35 40 130 25 Mean 234 298 187 40 146 107 1,363 403 48 230 176 1,296 95 Min 1 1 4 1 4 2 8 8 2 1 1 4 6 Max 14,000 5,000 14,000 420 5,000 1,200 14,000 14,000 300 5,000 14,000 5,000 1,500 Responses 316 129 160 42 130 89 28 68 56 191 265 19 26 Source: PACEC survey of committed organisations (Inv39-40/35-36 Com42-43/40-41 Non28-29/27-28) Table C.48 Looking at your organisation today, how much larger or smaller do you think being an Investor in People has made you in terms of turnover or income?

Page 168
Percentage of all respondents Year of
recognition Employment Sector Organisation type
Total Pre-1998
1998 onward
s
<10 10-49 50-249 250+ Production
Private service
s
Public service
s
Business
Public sector
Voluntary/ non-profit
Much larger 0 1 0 0 0 1 0 0 0 1 0 0 0 A little larger 0 0 1 2 0 0 0 0 0 1 0 0 0 Marginally larger 4 5 2 9 3 3 0 3 4 4 3 5 12 No different 95 94 97 88 97 95 100 97 96 95 96 95 88 Respondents 322 135 161 43 136 87 30 71 57 192 272 19 25 A bold figure indicates a 95% confidence that that category differs from the other categories in that particular disaggregation Source: PACEC survey of committed organisations (Inv41/37 Com44/42) Table C.49 Effect on staff
Percentage of all respondents Year of
recognition Employment Sector Organisation type
Total Pre-1998
1998 onward
s
<10 10-49 50-249 250+ Production
Private service
s
Public service
s
Business
Public sector
Voluntary/ non-profit
Too early to say 34 29 40 30 43 25 36 41 31 33 36 30 15 No effect 17 16 18 24 17 15 12 20 25 14 18 9 19 Some effect 49 55 42 46 40 60 52 39 44 53 46 61 65 Respondents 340 138 173 46 139 93 33 75 61 203 285 23 26 A bold figure indicates a 95% confidence that that category differs from the other categories in that particular disaggregation Source: PACEC survey of committed organisations (Inv43/38 Com46/43)
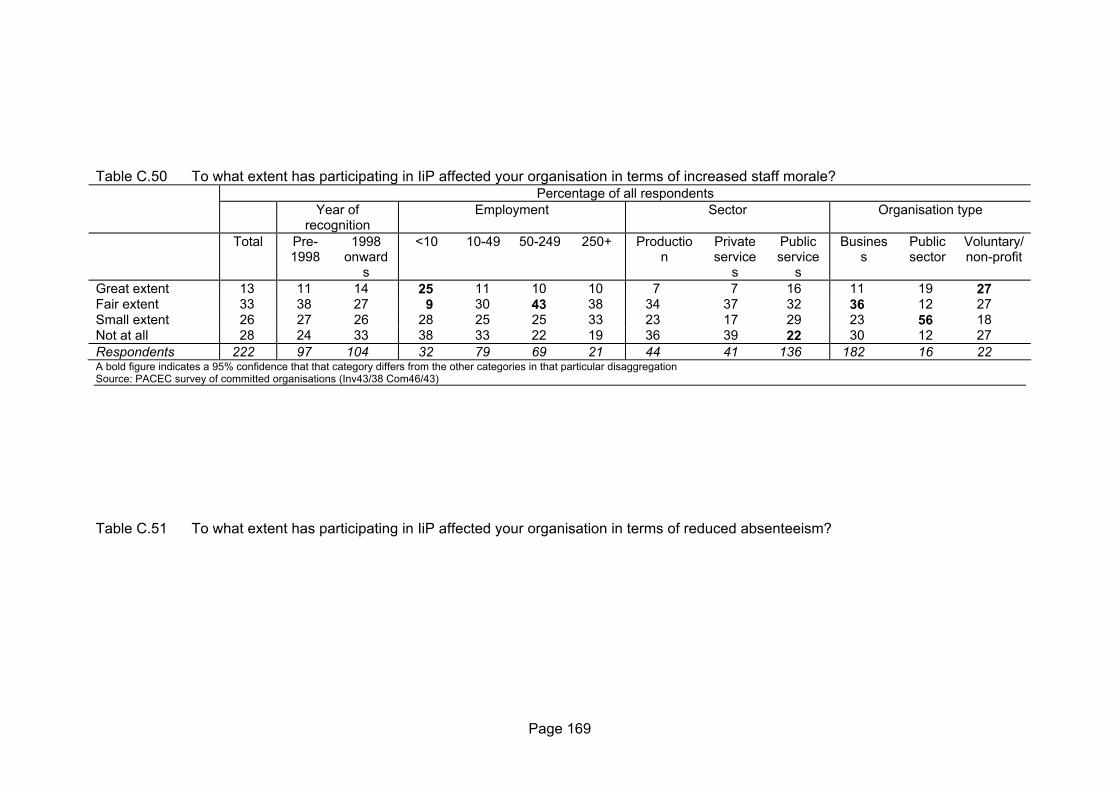
Page 169
Table C.50 To what extent has participating in IiP affected your organisation in terms of increased staff morale? Percentage of all respondents Year of
recognition Employment Sector Organisation type
Total Pre-1998
1998 onward
s
<10 10-49 50-249 250+ Production
Private service
s
Public service
s
Business
Public sector
Voluntary/ non-profit
Great extent 13 11 14 25 11 10 10 7 7 16 11 19 27 Fair extent 33 38 27 9 30 43 38 34 37 32 36 12 27 Small extent 26 27 26 28 25 25 33 23 17 29 23 56 18 Not at all 28 24 33 38 33 22 19 36 39 22 30 12 27 Respondents 222 97 104 32 79 69 21 44 41 136 182 16 22 A bold figure indicates a 95% confidence that that category differs from the other categories in that particular disaggregation Source: PACEC survey of committed organisations (Inv43/38 Com46/43) Table C.51 To what extent has participating in IiP affected your organisation in terms of reduced absenteeism?
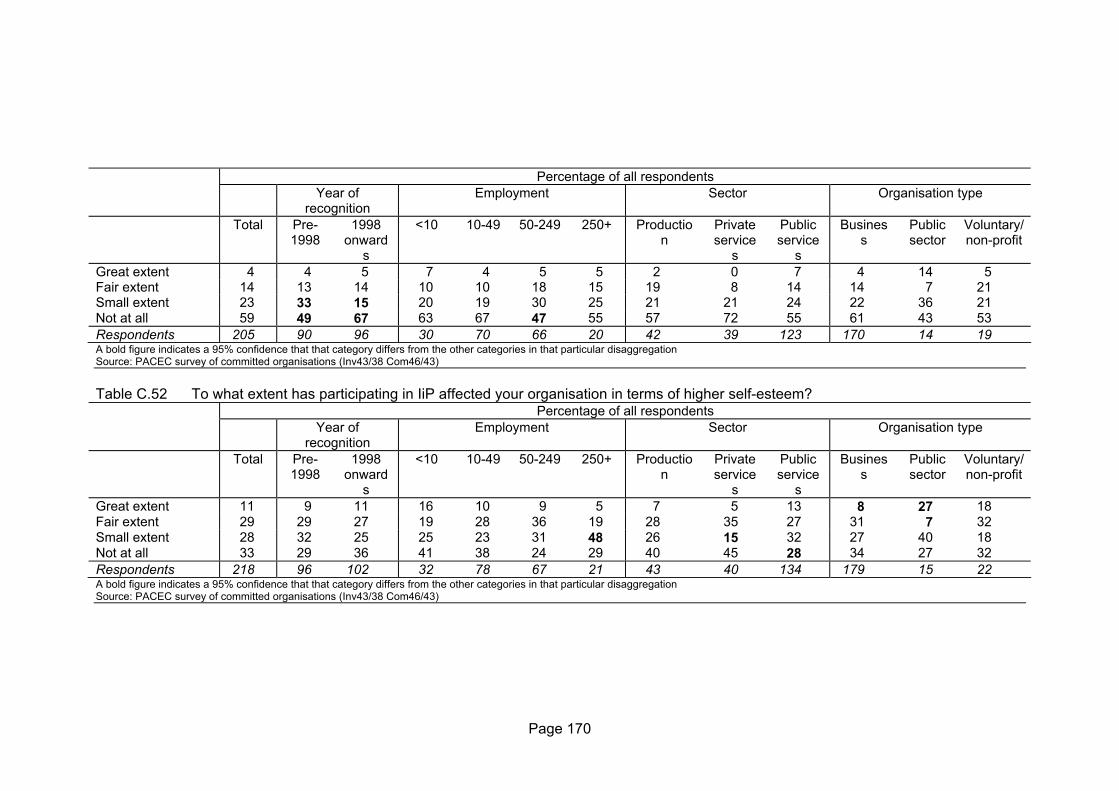
Page 170
Percentage of all respondents Year of
recognition Employment Sector Organisation type
Total Pre-1998
1998 onward
s
<10 10-49 50-249 250+ Production
Private service
s
Public service
s
Business
Public sector
Voluntary/ non-profit
Great extent 4 4 5 7 4 5 5 2 0 7 4 14 5 Fair extent 14 13 14 10 10 18 15 19 8 14 14 7 21 Small extent 23 33 15 20 19 30 25 21 21 24 22 36 21 Not at all 59 49 67 63 67 47 55 57 72 55 61 43 53 Respondents 205 90 96 30 70 66 20 42 39 123 170 14 19 A bold figure indicates a 95% confidence that that category differs from the other categories in that particular disaggregation Source: PACEC survey of committed organisations (Inv43/38 Com46/43) Table C.52 To what extent has participating in IiP affected your organisation in terms of higher self-esteem?
Percentage of all respondents Year of
recognition Employment Sector Organisation type
Total Pre-1998
1998 onward
s
<10 10-49 50-249 250+ Production
Private service
s
Public service
s
Business
Public sector
Voluntary/ non-profit
Great extent 11 9 11 16 10 9 5 7 5 13 8 27 18 Fair extent 29 29 27 19 28 36 19 28 35 27 31 7 32 Small extent 28 32 25 25 23 31 48 26 15 32 27 40 18 Not at all 33 29 36 41 38 24 29 40 45 28 34 27 32 Respondents 218 96 102 32 78 67 21 43 40 134 179 15 22 A bold figure indicates a 95% confidence that that category differs from the other categories in that particular disaggregation Source: PACEC survey of committed organisations (Inv43/38 Com46/43)

Page 171
Table C.53 To what extent has participating in IiP affected your organisation in terms of increased well-being?
Percentage of all respondents Year of
recognition Employment Sector Organisation type
Total Pre-1998
1998 onward
s
<10 10-49 50-249 250+ Production
Private service
s
Public service
s
Business
Public sector
Voluntary/ non-profit
Great extent 11 10 13 22 10 10 5 5 7 14 9 27 14 Fair extent 32 36 28 12 32 43 24 35 29 31 33 13 36 Small extent 26 27 26 25 23 25 43 26 22 28 26 33 18 Not at all 31 27 34 41 34 22 29 35 41 27 31 27 32 Respondents 218 97 101 32 77 68 21 43 41 133 179 15 22 A bold figure indicates a 95% confidence that that category differs from the other categories in that particular disaggregation Source: PACEC survey of committed organisations (Inv43/38 Com46/43) Table C.54 Summary of effects
Percentage of all respondents Year of
recognition Employment Sector Organisation type
Total Pre-1998
1998 onward
s
<10 10-49 50-249 250+ Production
Private service
s
Public service
s
Business
Public sector
Voluntary/ non-profit
Too early to say 34 28 40 25 43 27 37 38 32 34 35 35 12 No effect 13 13 14 16 13 13 14 19 18 9 15 0 8 Some effect 53 59 46 59 44 60 49 42 50 57 50 65 81 Respondents 337 136 173 44 137 93 35 73 62 201 282 23 26 A bold figure indicates a 95% confidence that that category differs from the other categories in that particular disaggregation Source: PACEC survey of committed organisations (Inv44/39 Com47/44)

Page 172
Table C.55 Looking at the wider impacts, to what extent has participating in IiP affected your organisation in terms of becoming a leading-edge organisation with respect to HR development?
Percentage of all respondents Year of
recognition Employment Sector Organisation type
Total Pre-1998
1998 onward
s
<10 10-49 50-249 250+ Production
Private service
s
Public service
s
Business
Public sector
Voluntary/ non-profit
Great extent 6 5 6 6 5 6 5 2 2 8 4 7 18 Fair extent 17 18 18 28 13 20 14 14 19 17 18 7 18 Small extent 39 43 33 31 35 44 41 40 21 44 37 67 32 Not at all 39 34 43 34 47 30 41 44 57 31 41 20 32 Respondents 217 95 102 32 77 66 22 43 42 131 179 15 22 A bold figure indicates a 95% confidence that that category differs from the other categories in that particular disaggregation Source: PACEC survey of committed organisations (Inv44/39 Com47/44) Table C.56 Looking at the wider impacts, to what extent has participating in IiP affected your organisation in terms of improved returns on your investment in HR?
Percentage of all respondents Year of
recognition Employment Sector Organisation type
Total Pre-1998
1998 onward
s
<10 10-49 50-249 250+ Production
Private service
s
Public service
s
Business
Public sector
Voluntary/ non-profit
Great extent 8 6 10 13 8 7 5 5 5 11 7 7 22 Fair extent 25 29 21 35 17 30 24 21 21 27 27 7 22 Small extent 41 45 37 29 42 42 52 37 33 44 37 87 39 Not at all 26 19 33 23 34 21 19 37 41 18 30 0 17 Respondents 214 95 101 31 77 67 21 43 39 131 175 15 23 A bold figure indicates a 95% confidence that that category differs from the other categories in that particular disaggregation Source: PACEC survey of committed organisations (Inv44/39 Com47/44)

Page 173
Table C.57 Looking at the wider impacts, to what extent has participating in IiP affected your organisation in terms of
Percentage of all respondents Year of
recognition Employment Sector Organisation type
Total Pre-1998
1998 onward
s
<10 10-49 50-249 250+ Production
Private service
s
Public service
s
Business
Public sector
Voluntary/ non-profit
Great extent 12 9 15 26 9 9 14 7 5 15 11 7 23 Fair extent 30 39 19 19 23 39 29 26 39 28 31 27 23 Small extent 29 25 31 23 29 28 33 30 20 32 26 53 36 Not at all 29 26 36 32 39 24 24 37 37 24 32 13 18 Respondents 216 95 101 31 77 67 21 43 41 131 178 15 22 A bold figure indicates a 95% confidence that that category differs from the other categories in that particular disaggregation Source: PACEC survey of committed organisations (Inv44/39 Com47/44) Table C.58 Looking at the wider impacts, to what extent has participating in IiP affected your organisation in terms of
Percentage of all respondents Year of
recognition Employment Sector Organisation type
Total Pre-1998
1998 onward
s
<10 10-49 50-249 250+ Production
Private service
s
Public service
s
Business
Public sector
Voluntary/ non-profit
Great extent 12 9 14 30 8 7 14 7 7 15 11 7 24 Fair extent 36 40 28 13 33 49 19 30 34 37 37 27 33 Small extent 29 29 29 23 32 24 48 30 24 29 26 60 29 Not at all 24 21 28 33 28 19 19 33 34 19 27 7 14 Respondents 214 95 99 30 76 67 21 43 41 129 177 15 21 A bold figure indicates a 95% confidence that that category differs from the other categories in that particular disaggregation Source: PACEC survey of committed organisations (Inv44/39 Com47/44)
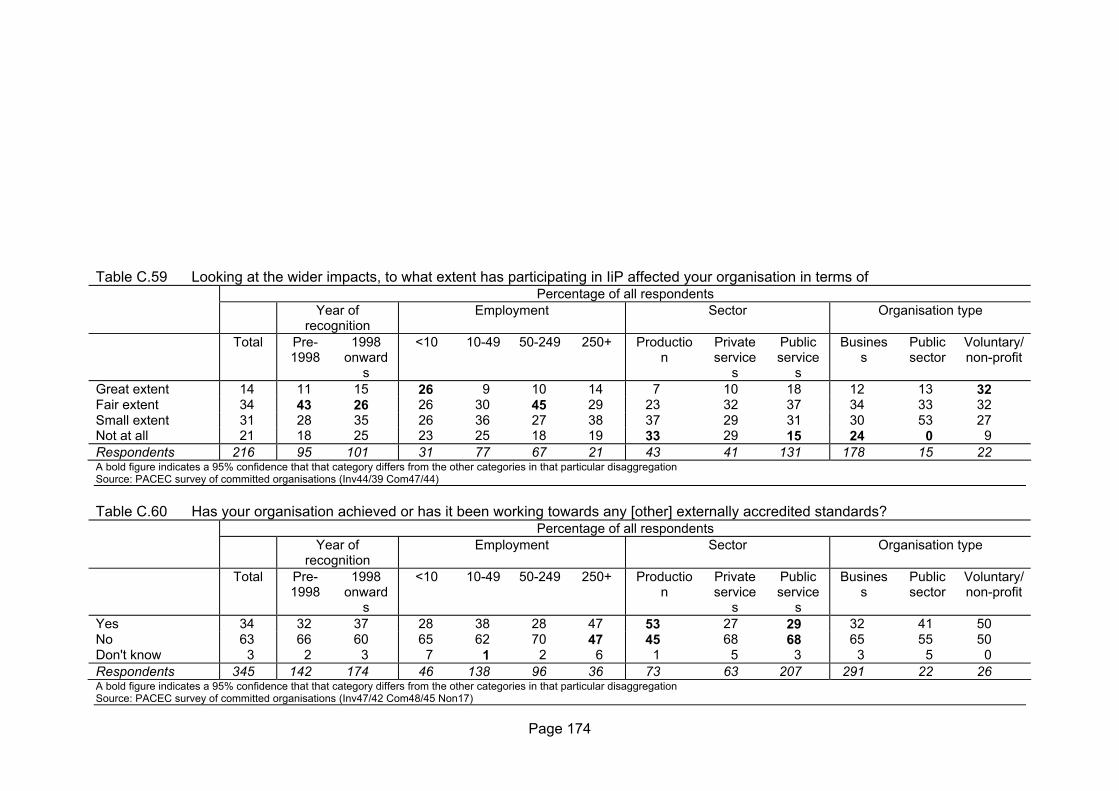
Page 174
Table C.59 Looking at the wider impacts, to what extent has participating in IiP affected your organisation in terms of
Percentage of all respondents Year of
recognition Employment Sector Organisation type
Total Pre-1998
1998 onward
s
<10 10-49 50-249 250+ Production
Private service
s
Public service
s
Business
Public sector
Voluntary/ non-profit
Great extent 14 11 15 26 9 10 14 7 10 18 12 13 32 Fair extent 34 43 26 26 30 45 29 23 32 37 34 33 32 Small extent 31 28 35 26 36 27 38 37 29 31 30 53 27 Not at all 21 18 25 23 25 18 19 33 29 15 24 0 9 Respondents 216 95 101 31 77 67 21 43 41 131 178 15 22 A bold figure indicates a 95% confidence that that category differs from the other categories in that particular disaggregation Source: PACEC survey of committed organisations (Inv44/39 Com47/44) Table C.60 Has your organisation achieved or has it been working towards any [other] externally accredited standards?
Percentage of all respondents Year of
recognition Employment Sector Organisation type
Total Pre-1998
1998 onward
s
<10 10-49 50-249 250+ Production
Private service
s
Public service
s
Business
Public sector
Voluntary/ non-profit
Yes 34 32 37 28 38 28 47 53 27 29 32 41 50 No 63 66 60 65 62 70 47 45 68 68 65 55 50 Don't know 3 2 3 7 1 2 6 1 5 3 3 5 0 Respondents 345 142 174 46 138 96 36 73 63 207 291 22 26 A bold figure indicates a 95% confidence that that category differs from the other categories in that particular disaggregation Source: PACEC survey of committed organisations (Inv47/42 Com48/45 Non17)
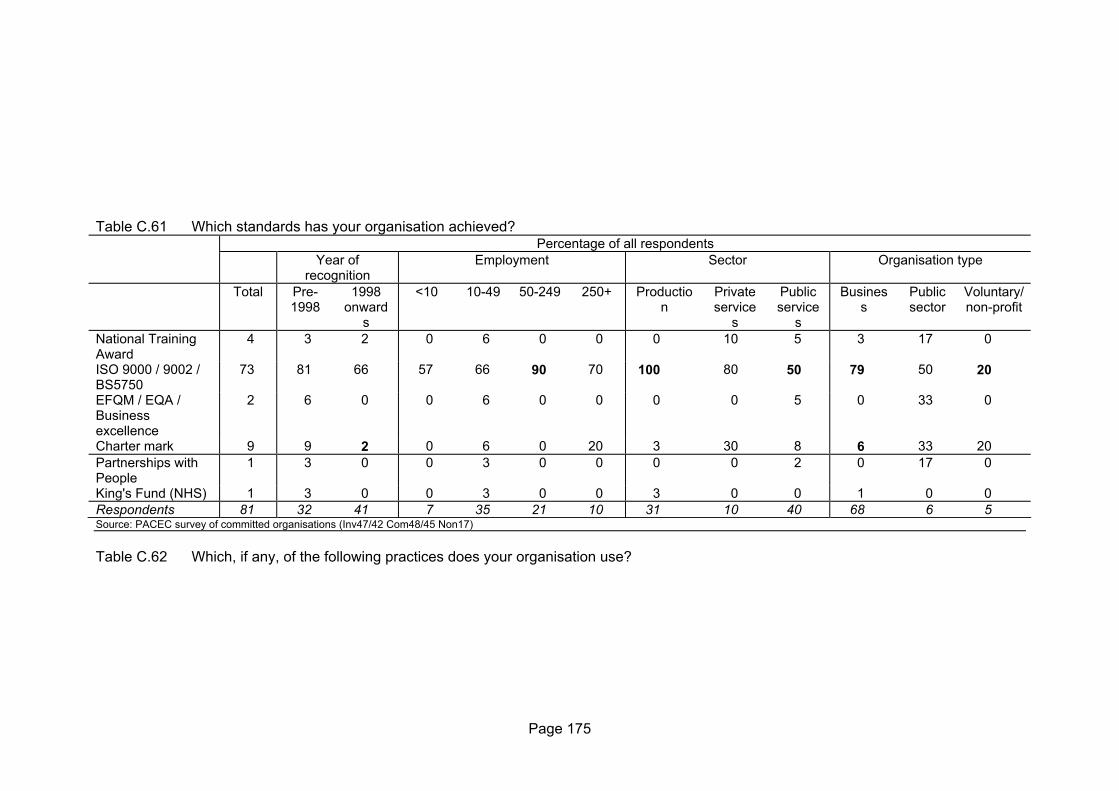
Page 175
Table C.61 Which standards has your organisation achieved?
Percentage of all respondents Year of
recognition Employment Sector Organisation type
Total Pre-1998
1998 onward
s
<10 10-49 50-249 250+ Production
Private service
s
Public service
s
Business
Public sector
Voluntary/ non-profit
National Training Award
4 3 2 0 6 0 0 0 10 5 3 17 0
ISO 9000 / 9002 / BS5750
73 81 66 57 66 90 70 100 80 50 79 50 20
EFQM / EQA / Business excellence
2 6 0 0 6 0 0 0 0 5 0 33 0
Charter mark 9 9 2 0 6 0 20 3 30 8 6 33 20 Partnerships with People
1 3 0 0 3 0 0 0 0 2 0 17 0
King's Fund (NHS) 1 3 0 0 3 0 0 3 0 0 1 0 0 Respondents 81 32 41 7 35 21 10 31 10 40 68 6 5 Source: PACEC survey of committed organisations (Inv47/42 Com48/45 Non17) Table C.62 Which, if any, of the following practices does your organisation use?
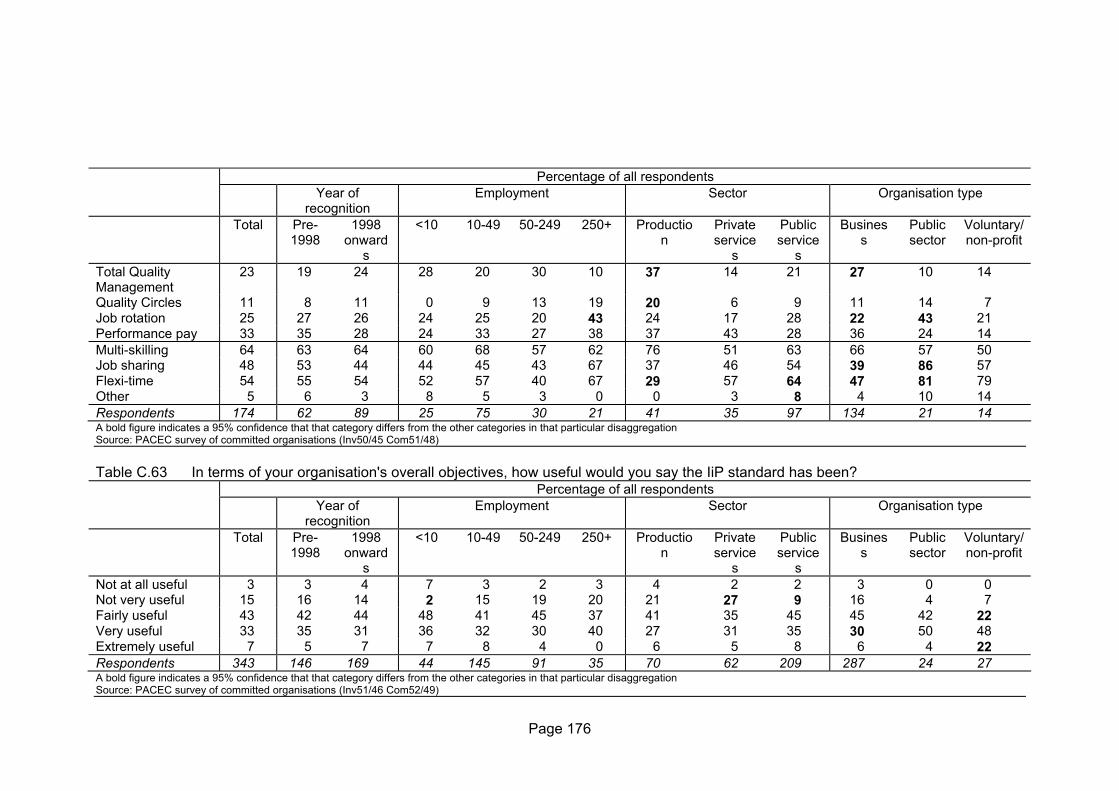
Page 176
Percentage of all respondents Year of
recognition Employment Sector Organisation type
Total Pre-1998
1998 onward
s
<10 10-49 50-249 250+ Production
Private service
s
Public service
s
Business
Public sector
Voluntary/ non-profit
Total Quality Management
23 19 24 28 20 30 10 37 14 21 27 10 14
Quality Circles 11 8 11 0 9 13 19 20 6 9 11 14 7 Job rotation 25 27 26 24 25 20 43 24 17 28 22 43 21 Performance pay 33 35 28 24 33 27 38 37 43 28 36 24 14 Multi-skilling 64 63 64 60 68 57 62 76 51 63 66 57 50 Job sharing 48 53 44 44 45 43 67 37 46 54 39 86 57 Flexi-time 54 55 54 52 57 40 67 29 57 64 47 81 79 Other 5 6 3 8 5 3 0 0 3 8 4 10 14 Respondents 174 62 89 25 75 30 21 41 35 97 134 21 14 A bold figure indicates a 95% confidence that that category differs from the other categories in that particular disaggregation Source: PACEC survey of committed organisations (Inv50/45 Com51/48) Table C.63 In terms of your organisation's overall objectives, how useful would you say the IiP standard has been?
Percentage of all respondents Year of
recognition Employment Sector Organisation type
Total Pre-1998
1998 onward
s
<10 10-49 50-249 250+ Production
Private service
s
Public service
s
Business
Public sector
Voluntary/ non-profit
Not at all useful 3 3 4 7 3 2 3 4 2 2 3 0 0 Not very useful 15 16 14 2 15 19 20 21 27 9 16 4 7 Fairly useful 43 42 44 48 41 45 37 41 35 45 45 42 22 Very useful 33 35 31 36 32 30 40 27 31 35 30 50 48 Extremely useful 7 5 7 7 8 4 0 6 5 8 6 4 22 Respondents 343 146 169 44 145 91 35 70 62 209 287 24 27 A bold figure indicates a 95% confidence that that category differs from the other categories in that particular disaggregation Source: PACEC survey of committed organisations (Inv51/46 Com52/49)

Page 177
APPENDIX D: DISAGGREGATED RESULTS FROM THE SURVEY OF NON-INVESTORS
Table D.1 Which of the following best describes your organisation? Percentage of all respondents Sector Organisation type Total Production Private services Public services Business Public sector Voluntary / non-
profit A business 93 100 94 71 100 0 0 A public sector body/organisation
2 0 0 16 0 100 0
A voluntary/non-profit organisation
5 0 5 13 0 0 100
Other 1 0 1 0 0 0 0 Respondents 261 59 170 31 242 5 12 A bold figure indicates a 95% confidence that that category differs from the other categories in that particular disaggregation Source: PACEC survey of non-investors (Inv6, Com6, Non6) Table D.2 (Businesses only) When did your business start trading?
Percentage of all respondents Sector Organisation type Total Production Private services Public services Business Public sector Voluntary / non-
profit Pre war 18 16 17 30 11 100 100 40s, 50s 6 7 5 7 6 0 0 60s, 70s 22 26 23 10 24 0 0 80s 24 24 23 30 26 0 0 1990+ 30 28 32 23 32 0 0 Respondents 254 58 165 30 235 5 12 A bold figure indicates a 95% confidence that that category differs from the other categories in that particular disaggregation Source: PACEC survey of non-investors (Inv7, Com7, Non7)
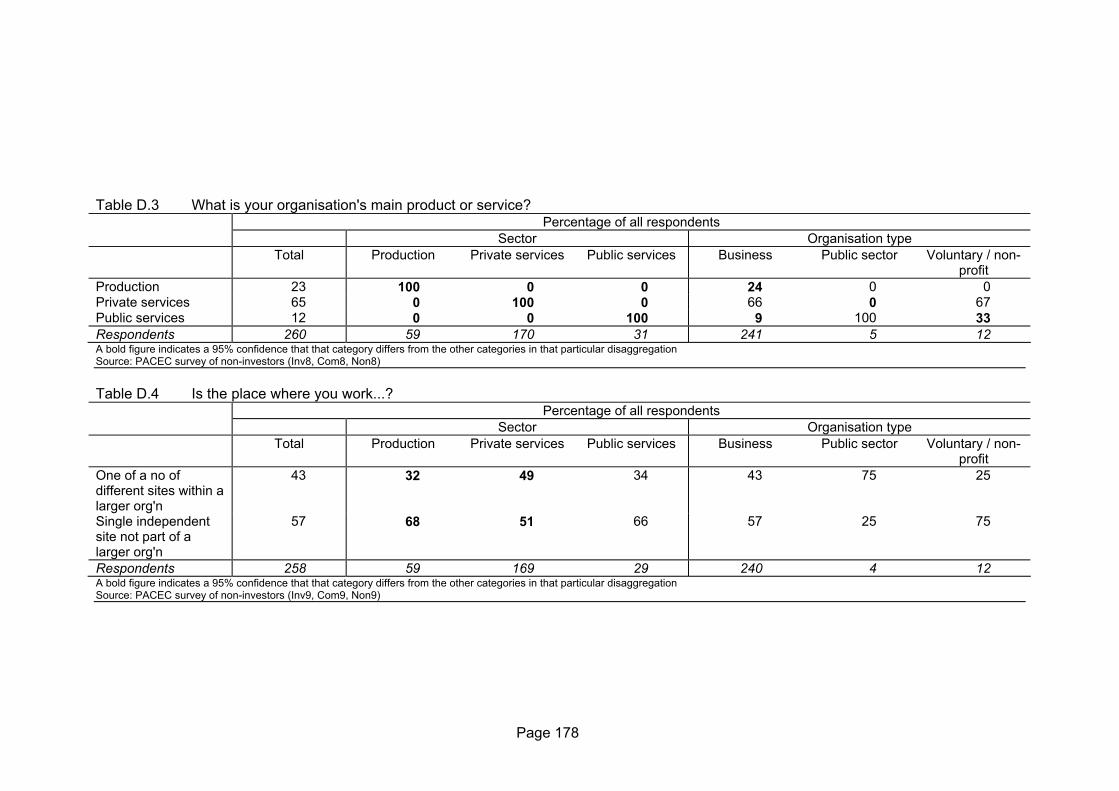
Page 178
Table D.3 What is your organisation's main product or service? Percentage of all respondents Sector Organisation type Total Production Private services Public services Business Public sector Voluntary / non-
profit Production 23 100 0 0 24 0 0 Private services 65 0 100 0 66 0 67 Public services 12 0 0 100 9 100 33 Respondents 260 59 170 31 241 5 12 A bold figure indicates a 95% confidence that that category differs from the other categories in that particular disaggregation Source: PACEC survey of non-investors (Inv8, Com8, Non8) Table D.4 Is the place where you work...?
Percentage of all respondents Sector Organisation type Total Production Private services Public services Business Public sector Voluntary / non-
profit One of a no of different sites within a larger org'n
43 32 49 34 43 75 25
Single independent site not part of a larger org'n
57 68 51 66 57 25 75
Respondents 258 59 169 29 240 4 12 A bold figure indicates a 95% confidence that that category differs from the other categories in that particular disaggregation Source: PACEC survey of non-investors (Inv9, Com9, Non9)

Page 179
Table D.5 (If more than one site) Is the place where you work...?
Percentage of all respondents Sector Organisation type Total Production Private services Public services Business Public sector Voluntary / non-
profit Single site 58 68 53 66 58 25 75 The head office 17 19 15 17 18 25 0 A regional or divisional office
3 2 3 7 2 25 17
A branch (incl. warehouse, and call centre)
22 12 28 10 22 25 8
Respondents 252 59 163 29 234 4 12 A bold figure indicates a 95% confidence that that category differs from the other categories in that particular disaggregation Source: PACEC survey of non-investors (Inv10, Com10, Non10) Table D.6 How would you describe the overall growth objectives of your business now?
Percentage of all respondents Sector Organisation type Total Production Private services Public services Business Public sector Voluntary / non-
profit Grow smaller 3 5 3 0 3 0 0 Stay same size 36 37 35 41 36 0 0 Grow moderately 50 49 51 45 50 0 0 Grow rapidly 11 8 11 14 11 0 0 Respondents 240 59 158 22 240 0 0 Source: PACEC survey of non-investors (Inv11, Com11, Non11)

Page 180
Table D.7 What particular aspect(s) of your business do you especially want to grow? Percentage of all respondents Sector Organisation type Total Production Private services Public services Business Public sector Voluntary / non-
profit Sales 28 21 32 15 28 0 0 Market share 13 6 13 23 13 0 0 Profits 17 9 20 15 17 0 0 Other 9 6 6 38 9 0 0 All 57 79 54 31 57 0 0 Respondents 140 33 93 13 140 0 0 A bold figure indicates a 95% confidence that that category differs from the other categories in that particular disaggregation Source: PACEC survey of non-investors (Inv11, Com11, Non11)

Page 181
Table D.8 Can you indicate on a scale of 1-10, where 1 is not at all important and 10 is crucially important, how you see the following in terms of their importance to the success of your organisation? (Mean ratings)
Average of all respondents Total Production Private services Public services Business Public sector Voluntary / non-
profit Financial management
8.9 8.9 9.0 8.2 9.0 7.0 8.1
Operational management
8.5 8.5 8.5 8.5 8.6 7.0 8.0
Human resource management and development
7.5 7.4 7.5 7.9 7.6 7.0 6.8
Marketing 7.7 8.0 8.0 5.9 7.9 4.7 5.3 Design, Innovation and Creativity
6.9 7.3 7.0 5.6 6.9 5.7 6.4
Corporate and internal communications
6.8 6.8 6.8 6.8 6.9 7.7 5.3
Respondents 248 57 162 28 231 3 12 Source: PACEC survey of non-investors (Inv12, Com12, Non12)

Page 182
Table D.9 Which of the following applies to your organisation? Percentage of all respondents Sector Organisation type Total Production Private services Public services Business Public sector Voluntary / non-
profit HR management part of the MD/Director/Manager's job
56 63 52 66 58 0 42
Separate HR department
4 2 4 7 3 50 0
Employ own HR manager(s) without separate HR department
2 3 2 0 2 0 0
HR management is the responsibility of the Head Office
17 14 19 10 17 25 0
Use other approach to HR management
3 3 4 3 2 25 17
No one responsibility - HR not necessary
18 15 19 14 17 0 42
Respondents 259 59 170 29 241 4 12 A bold figure indicates a 95% confidence that that category differs from the other categories in that particular disaggregation Source: PACEC survey of non-investors (Inv13, Com13, Non13)

Page 183
Table D.10 Does your organisation have a specific budget for training and human resource development?
Percentage of all respondents Sector Organisation type Total Production Private services Public services Business Public sector Voluntary / non-
profit Yes 31 21 28 60 29 75 33 No 58 70 59 33 59 25 67 Don't know 11 9 13 7 12 0 0 Respondents 257 57 169 30 239 4 12 A bold figure indicates a 95% confidence that that category differs from the other categories in that particular disaggregation Source: PACEC survey of non-investors (Inv16 Com16 Non14) Table D.11 How has your organisation's expenditure on training and human resources development changed during the last three years?
Percentage of all respondents Sector Organisation type Total Production Private services Public services Business Public sector Voluntary / non-
profit Increased by 10% or more
29 27 21 44 28 0 50
Same - within 10% either way
43 45 40 50 44 67 25
Don't know 29 27 38 6 28 33 25 Respondents 77 11 47 18 68 3 4 A bold figure indicates a 95% confidence that that category differs from the other categories in that particular disaggregation Source: PACEC survey of non-investors (Inv17 Com17 Non15)
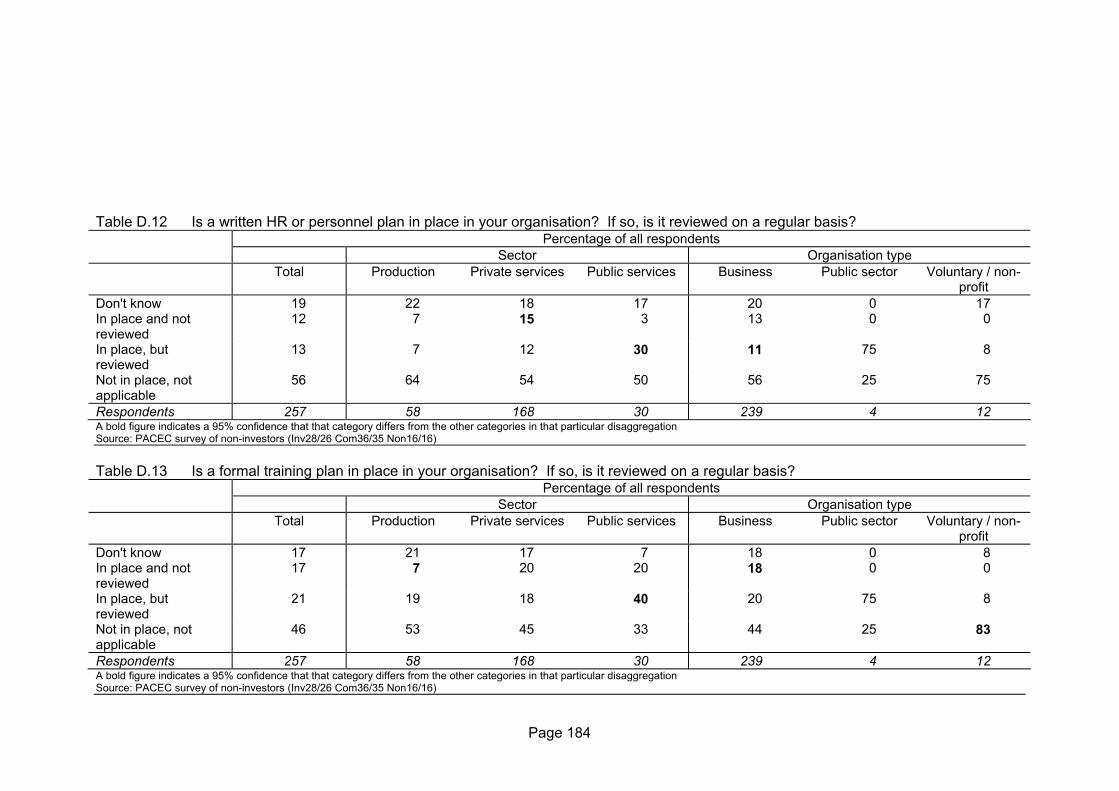
Page 184
Table D.12 Is a written HR or personnel plan in place in your organisation? If so, is it reviewed on a regular basis?
Percentage of all respondents Sector Organisation type Total Production Private services Public services Business Public sector Voluntary / non-
profit Don't know 19 22 18 17 20 0 17 In place and not reviewed
12 7 15 3 13 0 0
In place, but reviewed
13 7 12 30 11 75 8
Not in place, not applicable
56 64 54 50 56 25 75
Respondents 257 58 168 30 239 4 12 A bold figure indicates a 95% confidence that that category differs from the other categories in that particular disaggregation Source: PACEC survey of non-investors (Inv28/26 Com36/35 Non16/16) Table D.13 Is a formal training plan in place in your organisation? If so, is it reviewed on a regular basis?
Percentage of all respondents Sector Organisation type Total Production Private services Public services Business Public sector Voluntary / non-
profit Don't know 17 21 17 7 18 0 8 In place and not reviewed
17 7 20 20 18 0 0
In place, but reviewed
21 19 18 40 20 75 8
Not in place, not applicable
46 53 45 33 44 25 83
Respondents 257 58 168 30 239 4 12 A bold figure indicates a 95% confidence that that category differs from the other categories in that particular disaggregation Source: PACEC survey of non-investors (Inv28/26 Com36/35 Non16/16)

Page 185
Table D.14 Is a system for identifying training needs in place in your organisation? If so, is it reviewed on a regular basis?
Percentage of all respondents Sector Organisation type Total Production Private services Public services Business Public sector Voluntary / non-
profit Don't know 15 17 16 7 16 0 8 In place and not reviewed
19 14 21 20 21 0 8
In place, but reviewed
23 17 20 43 21 100 17
Not in place, not applicable
43 52 42 30 43 0 67
Respondents 257 58 168 30 239 4 12 A bold figure indicates a 95% confidence that that category differs from the other categories in that particular disaggregation Source: PACEC survey of non-investors (Inv28/26 Com36/35 Non16/16) Table D.15 Is a system for evaluating training in place in your organisation? If so, is it reviewed on a regular basis?

Page 186
Percentage of all respondents Sector Organisation type Total Production Private services Public services Business Public sector Voluntary / non-
profit Don't know 16 17 17 7 17 0 8 In place and not reviewed
17 16 16 27 18 0 0
In place, but reviewed
21 16 20 37 20 75 8
Not in place, not applicable
46 52 47 30 45 25 83
Respondents 257 58 168 30 239 4 12 A bold figure indicates a 95% confidence that that category differs from the other categories in that particular disaggregation Source: PACEC survey of non-investors (Inv28/26 Com36/35 Non16/16) Table D.16 Is your business plan communicated to employees in your organisation? If so, is this policy reviewed on a regular basis?
Percentage of all respondents Sector Organisation type Total Production Private services Public services Business Public sector Voluntary / non-
profit Don't know 21 19 21 23 21 25 17 In place and not reviewed
9 9 10 3 9 0 0
In place, but reviewed
20 21 20 20 21 50 8
Not in place, not applicable
50 52 49 53 50 25 75
Respondents 257 58 168 30 239 4 12 Source: PACEC survey of non-investors (Inv28/26 Com36/35 Non16/16)
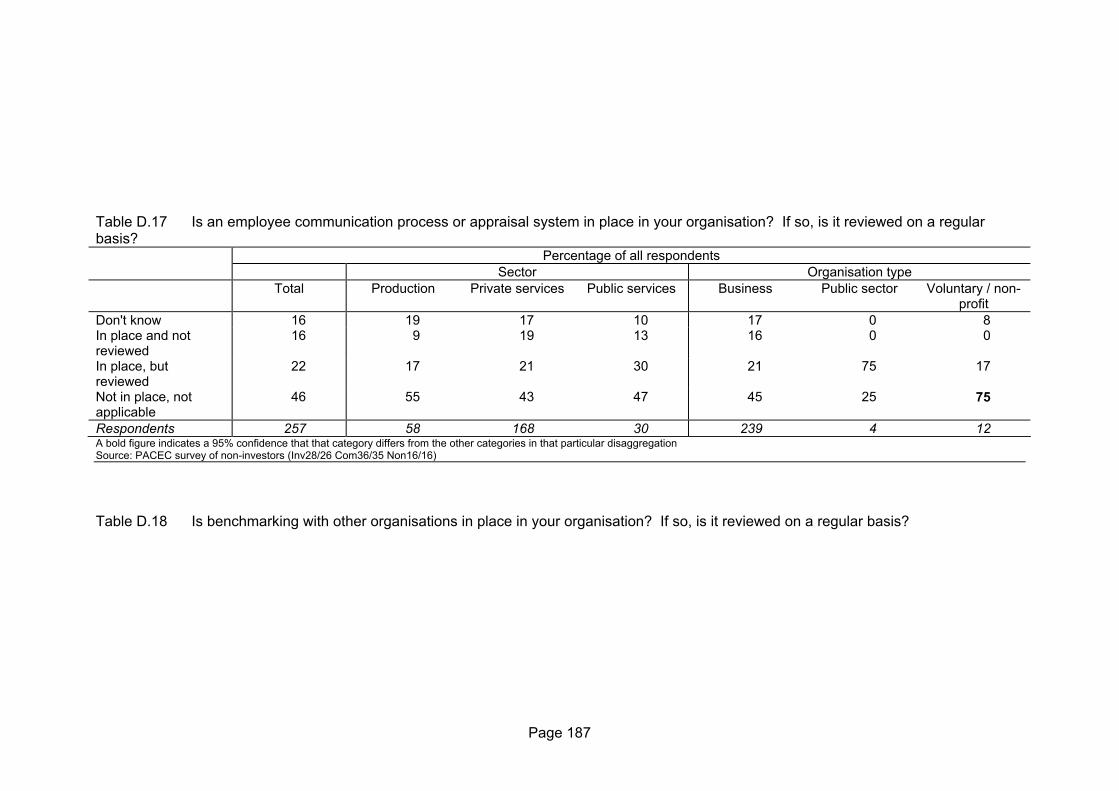
Page 187
Table D.17 Is an employee communication process or appraisal system in place in your organisation? If so, is it reviewed on a regular basis?
Percentage of all respondents Sector Organisation type Total Production Private services Public services Business Public sector Voluntary / non-
profit Don't know 16 19 17 10 17 0 8 In place and not reviewed
16 9 19 13 16 0 0
In place, but reviewed
22 17 21 30 21 75 17
Not in place, not applicable
46 55 43 47 45 25 75
Respondents 257 58 168 30 239 4 12 A bold figure indicates a 95% confidence that that category differs from the other categories in that particular disaggregation Source: PACEC survey of non-investors (Inv28/26 Com36/35 Non16/16) Table D.18 Is benchmarking with other organisations in place in your organisation? If so, is it reviewed on a regular basis?
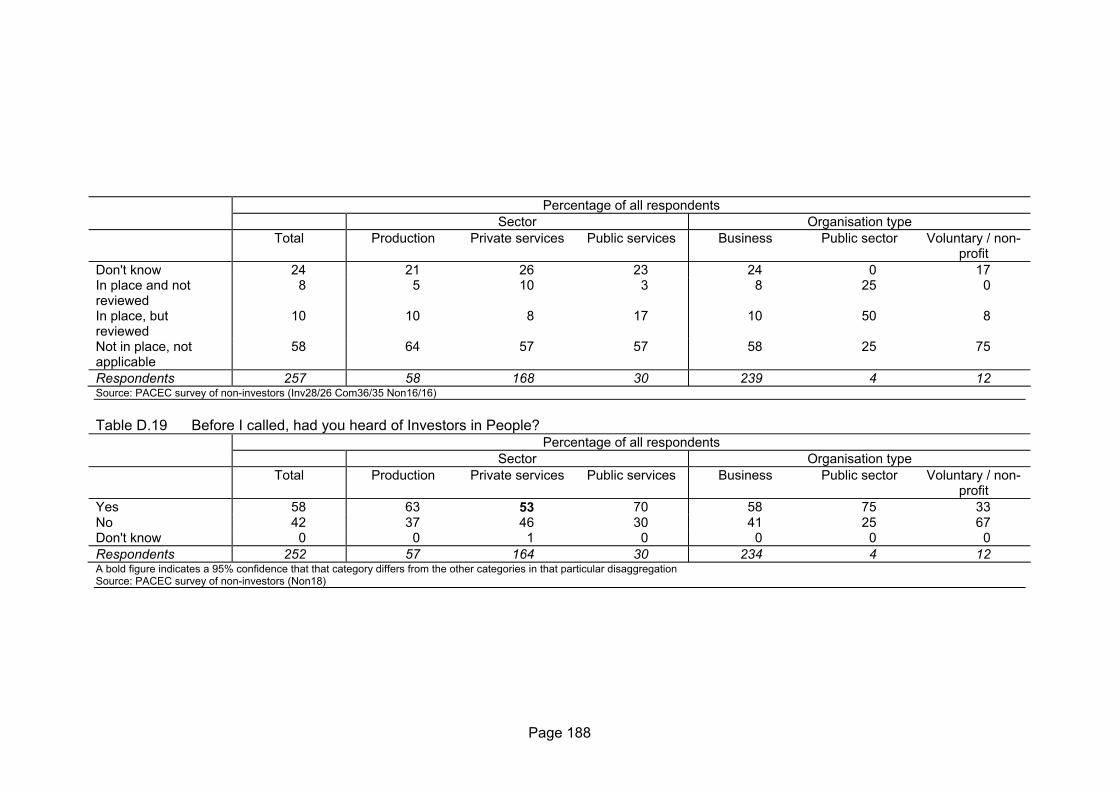
Page 188
Percentage of all respondents Sector Organisation type Total Production Private services Public services Business Public sector Voluntary / non-
profit Don't know 24 21 26 23 24 0 17 In place and not reviewed
8 5 10 3 8 25 0
In place, but reviewed
10 10 8 17 10 50 8
Not in place, not applicable
58 64 57 57 58 25 75
Respondents 257 58 168 30 239 4 12 Source: PACEC survey of non-investors (Inv28/26 Com36/35 Non16/16) Table D.19 Before I called, had you heard of Investors in People?
Percentage of all respondents Sector Organisation type Total Production Private services Public services Business Public sector Voluntary / non-
profit Yes 58 63 53 70 58 75 33 No 42 37 46 30 41 25 67 Don't know 0 0 1 0 0 0 0 Respondents 252 57 164 30 234 4 12 A bold figure indicates a 95% confidence that that category differs from the other categories in that particular disaggregation Source: PACEC survey of non-investors (Non18)

Page 189
Table D.20 Do you feel you understand what IiP is about?? Percentage of all respondents Sector Organisation type Total Production Private services Public services Business Public sector Voluntary / non-
profit Yes 34 34 31 45 35 67 0 Partially / vaguely 52 54 54 45 51 33 100 Not at all 13 11 15 10 14 0 0 Respondents 143 35 87 20 134 3 4 Source: PACEC survey of non-investors (Non19) Table D.21 In your opinion, are there any potential benefits arising from achieving the Investors in People standard?
Percentage of all respondents Sector Organisation type Total Production Private services Public services Business Public sector Voluntary / non-
profit Don't know 5 5 4 5 4 25 0 Some benefit 52 42 51 68 51 50 50 No benefit 44 53 45 27 45 25 50 Respondents 155 38 94 22 145 4 4 Source: PACEC survey of non-investors (Inv33/30 Com37/36 Non20) Table D.22 In your opinion, are there potential benefits arising from achieving the Investors in People standard in terms of more formal HR/Personnel systems?
Percentage of all respondents Sector Organisation type Total Production Private services Public services Business Public sector Voluntary / non-
profit No 85 83 88 76 86 33 75 Yes 15 17 12 24 14 67 25 Respondents 149 36 91 21 140 3 4 Source: PACEC survey of non-investors (Inv33/30 Com37/36 Non20)

Page 190
Table D.23 In your opinion, are there potential benefits arising from achieving the Investors in People standard in terms of more effective training and development?
Percentage of all respondents Sector Organisation type Total Production Private services Public services Business Public sector Voluntary / non-
profit No 69 72 69 62 70 67 75 Yes 31 28 31 38 30 33 25 Respondents 149 36 91 21 140 3 4 Source: PACEC survey of non-investors (Inv33/30 Com37/36 Non20) Table D.24 In your opinion, are there potential benefits arising from achieving the Investors in People standard in terms of improved quality of products and services?
Percentage of all respondents Sector Organisation type Total Production Private services Public services Business Public sector Voluntary / non-
profit No 81 89 79 76 81 100 100 Yes 19 11 21 24 19 0 0 Respondents 149 36 91 21 140 3 4 Source: PACEC survey of non-investors (Inv33/30 Com37/36 Non20) Table D.25 In your opinion, are there potential benefits arising from achieving the Investors in People standard in terms of improved recruitment and retention of staff?
Percentage of all respondents Sector Organisation type Total Production Private services Public services Business Public sector Voluntary / non-
profit No 79 81 80 67 80 33 75 Yes 21 19 20 33 20 67 25 Respondents 149 36 91 21 140 3 4 Source: PACEC survey of non-investors (Inv33/30 Com37/36 Non20)

Page 191
Table D.26 In your opinion, are there potential benefits arising from achieving the Investors in People standard in terms of improved business growth performance?
Percentage of all respondents Sector Organisation type Total Production Private services Public services Business Public sector Voluntary / non-
profit No 86 89 84 90 86 100 100 Yes 14 11 16 10 14 0 0 Respondents 149 36 91 21 140 3 4 Source: PACEC survey of non-investors (Inv33/30 Com37/36 Non20) Table D.27 In your opinion, are there potential benefits arising from achieving the Investors in People standard in terms of external perception of the organisation?
Percentage of all respondents Sector Organisation type Total Production Private services Public services Business Public sector Voluntary / non-
profit No 77 81 79 67 77 33 100 Yes 23 19 21 33 23 67 0 Respondents 149 36 91 21 140 3 4 Source: PACEC survey of non-investors (Inv33/30 Com37/36 Non20) Table D.28 In your opinion, are there potential benefits arising from achieving the Investors in People standard in terms of improved customer satisfaction?
Percentage of all respondents Sector Organisation type Total Production Private services Public services Business Public sector Voluntary / non-
profit No 78 86 79 62 79 67 100 Yes 22 14 21 38 21 33 0 Respondents 149 36 91 21 140 3 4 Source: PACEC survey of non-investors (Inv33/30 Com37/36 Non20)

Page 192
Table D.29 In your opinion, are there potential benefits arising from achieving the Investors in People standard in terms of improved business development opportunities?
Percentage of all respondents Sector Organisation type Total Production Private services Public services Business Public sector Voluntary / non-
profit No 95 97 92 100 94 100 100 Yes 5 3 8 0 6 0 0 Respondents 149 36 91 21 140 3 4 Source: PACEC survey of non-investors (Inv33/30 Com37/36 Non20) Table D.30 In your opinion, are there potential benefits arising from achieving the Investors in People standard in terms of improved productivity?
Percentage of all respondents Sector Organisation type Total Production Private services Public services Business Public sector Voluntary / non-
profit No 95 97 95 95 97 67 100 Yes 5 3 5 5 3 33 0 Respondents 149 36 91 21 140 3 4 Source: PACEC survey of non-investors (Inv33/30 Com37/36 Non20) Table D.31 Has your organisation ever considered pursuing the IiP standard?
Percentage of all respondents (by type of scheme) Total Production Private services Public services Business Public sector Voluntary / non-
profit Yes 16 19 10 33 14 67 25 No 55 47 59 52 58 33 25 Don't know 29 33 31 14 28 0 50 Respondents 148 36 90 21 139 3 4 A bold figure indicates a 95% confidence that that category differs from the other categories in that particular disaggregation Source: PACEC survey of non-investors (Non21)

Page 193
Table D.32 (If no to Q21) Would you mind saying why not? Percentage of all respondents (by type of scheme) Total Production Private services Public services Business Public sector Voluntary / non-
profit No time / too time consuming
15 18 11 27 15 0 100
Company too small / not enough resources
49 47 49 55 49 0 100
Not relevant to industry
15 6 18 9 16 0 0
Decision carried out elsewhere (eg: Head office)
4 0 4 0 4 0 0
Already hold other HR accreditation
8 12 9 0 9 0 0
Don't think it can be beneficial to us
24 47 20 9 24 0 0
Financial or operational difficulties
6 12 2 18 6 0 0
Organisation bought out or merged
1 0 0 9 1 0 0
Structural changes being undertaken in the organisation
4 0 5 0 4 0 0
Other 20 29 18 18 20 100 0 Don't know 4 6 4 0 4 0 0 No particular reason 2 0 2 9 2 0 0 Respondents 84 17 55 11 82 1 1 A bold figure indicates a 95% confidence that that category differs from the other categories in that particular disaggregation Source: PACEC survey of non-investors (Non22)
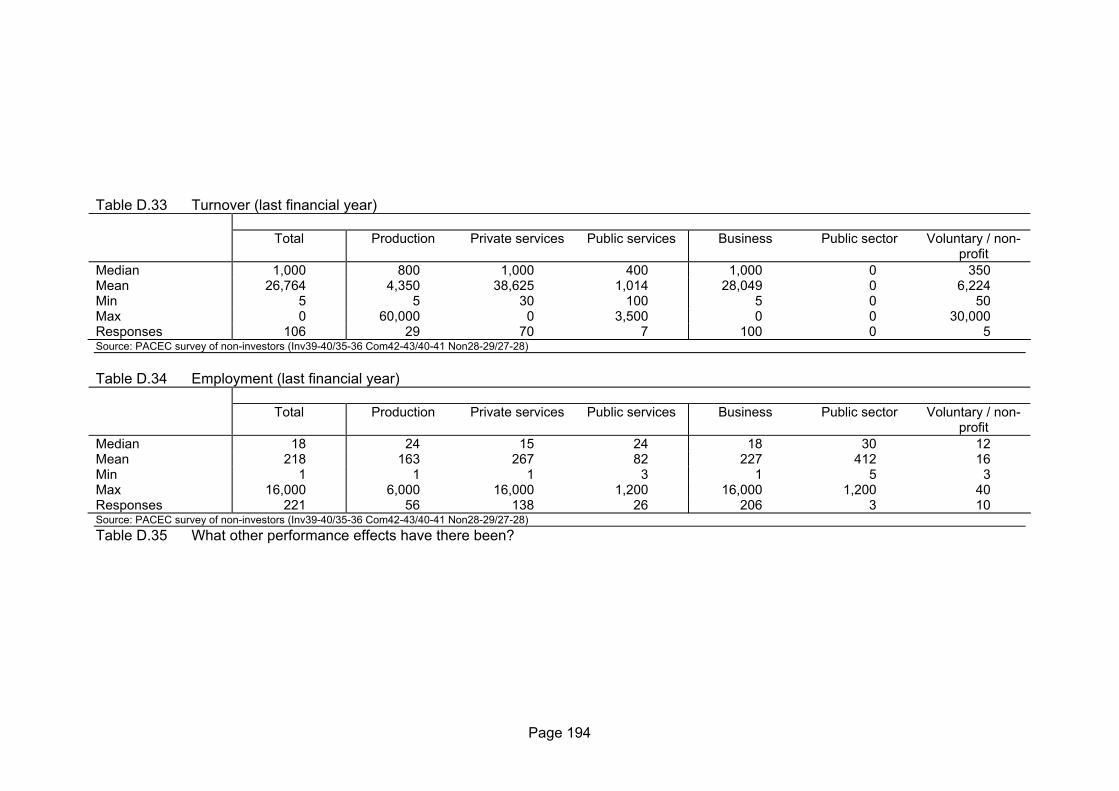
Page 194
Table D.33 Turnover (last financial year) Total Production Private services Public services Business Public sector Voluntary / non-
profit Median 1,000 800 1,000 400 1,000 0 350 Mean 26,764 4,350 38,625 1,014 28,049 0 6,224 Min 5 5 30 100 5 0 50 Max 0 60,000 0 3,500 0 0 30,000 Responses 106 29 70 7 100 0 5 Source: PACEC survey of non-investors (Inv39-40/35-36 Com42-43/40-41 Non28-29/27-28) Table D.34 Employment (last financial year)
Total Production Private services Public services Business Public sector Voluntary / non-
profit Median 18 24 15 24 18 30 12 Mean 218 163 267 82 227 412 16 Min 1 1 1 3 1 5 3 Max 16,000 6,000 16,000 1,200 16,000 1,200 40 Responses 221 56 138 26 206 3 10 Source: PACEC survey of non-investors (Inv39-40/35-36 Com42-43/40-41 Non28-29/27-28) Table D.35 What other performance effects have there been?

Page 195
Percentage of all respondents Sector Organisation type Total Production Private services Public services Business Public sector Voluntary / non-
profit Information covers just one site
72 78 67 80 71 0 100
Information covers whole organisation
28 22 33 20 29 100 0
Respondents 75 18 46 10 69 1 3 Source: PACEC survey of non-investors (N30/29) Table D.36 Has your organisation achieved or has it been working towards any [other] externally accredited standards?
Percentage of all respondents Sector Organisation type Total Production Private services Public services Business Public sector Voluntary / non-
profit Yes 32 31 29 52 31 33 25 No 61 66 62 48 62 67 67 Don't know 7 3 10 0 7 0 8 Respondents 257 59 168 29 240 3 12 A bold figure indicates a 95% confidence that that category differs from the other categories in that particular disaggregation Source: PACEC survey of non-investors (Inv47/42 Com48/45 Non17) Table D.37 Which standards has your organisation achieved?

Page 196
Percentage of all respondents Sector Organisation type Total Production Private services Public services Business Public sector Voluntary / non-
profit National Training Award
3 0 7 0 4 0 0
ISO 9000 / 9002 / BS5750
83 100 73 50 89 0 0
EFQM / EQA / Business excellence
0 0 0 0 0 0 0
Charter mark 3 0 7 0 4 0 0 Partnerships with People
0 0 0 0 0 0 0
King's Fund (NHS) 10 0 13 50 4 0 0 Respondents 29 12 15 2 27 0 0 A bold figure indicates a 95% confidence that that category differs from the other categories in that particular disaggregation Source: PACEC survey of non-investors (Inv47/42 Com48/45 Non17)

Page 156