Embed Size (px)
Citation preview
June 2007
The Wholesale Electricity Market in Australia A report to the Australian Energy Market Commission
Project Team
Greg Houston
Adrian Kemp
Daniel Young
Shane Anderson
Tara D’Souza
Adam Rakich
Katherine Lowe
NERA Economic Consulting Darling Park Tower 3 201 Sussex Street Sydney NSW 2000 Tel: +61 2 8864 6500 Fax: +61 2 8864 6549 www.nera.com
Contents
Contents
1. Introduction 1 1.1. Structure of this report 1
2. Overview of the National Electricity Market 3
2.1. Structure of the NEM 5 2.2. Electricity consumption in the NEM 10 2.3. Prices in the NEM 12
3. Generation, transmission and distribution in the NEM 16
3.1. NEM structure in aggregate 16 3.2. New South Wales 21 3.3. Queensland 25 3.4. South Australia 31 3.5. Snowy 36 3.6. Tasmania 37 3.7. Victoria 40 3.8. Proposed generation investments 45
4. Electricity retail in the NEM 47 4.1. Costs faced by retailers 48 4.2. Structure of electricity retailers in the NEM 49
5. Vertical integration in the NEM 62 5.1. AGL 62 5.2. Origin Energy 63 5.3. TRUenergy 64 5.4. International Power 64
6. Operation of the NEM 66 6.1. Pre-dispatch 66 6.2. Dispatch process and the spot price 67 6.3. Settlement of transactions 69 6.4. Maintaining the demand and supply balance in the
wholesale market 70 6.5. Planning and development of the wholesale electricity
market 70 6.6. Energy Losses 70 6.7. Constraints 73
Contents
7. Risk management 74 7.1. Overview 74 7.2. Tools to manage market risk 75 7.3. Effectiveness of Market Risk Tools 81 7.4. Managing Settlement Risk and Credit Risk 88
8. Recent reviews of the wholesale electricity market 91
9. Issues for retail competition 94 9.1. Observations on the extent of wholesale competition 95 9.2. Sources of wholesale market price variations 96 9.3. Implications for retail electricity competition 98
Appendix A: Analysis of regional NEM prices, 2005 and 2006 101
List of Tables
Table 2.1 Average yearly regional spot price, 2002 to 2007 ($/MWh) 12 Table 2.2 Average yearly standard deviation of spot prices, 2002 to 2007 ($/MWh) 13 Table 3.1 Generation capacity by fuel type, NEM aggregate 16 Table 3.2 Interconnector capacity and throughput (GWh) 18 Table 3.3 Hours of system normal binding constraints 19 Table 3.4 Generation capacity by owner, New South Wales 23 Table 3.5 Electricity supplied by owner, New South Wales 23 Table 3.6 Generation capacity by owner, Queensland 29 Table 3.7 Electricity supplied by owner, Queensland 30 Table 3.8 Generation capacity by owner, South Australia 34 Table 3.9 Electricity supplied by owner, South Australia 35 Table 3.10 Generation capacity by owner, Victoria 43 Table 3.11 Electricity supplied by owner, Victoria 44 Table 4.1 Summary of retail competition introductions 47 Table 4.2 Summary of electricity customers by jurisdiction and retailer 50 Table 4.3: Licensed electricity retailers in eastern Australia 52 Table 7.1 Implied direct bilateral trade volumes (TWh) 84 Table 7.2 NEM Demand vs trading volume 85 Table 9.1 NEM and regional capacity and electricity supply shares, by generator 96
Contents
List of Figures
Figure 2.1 Interconnector capacity in the NEM 4 Figure 2.2 Structure of the National Electricity Market 6 Figure 2.3 Australian consumption of electricity by State, 1997-98 to 2004-05 10 Figure 2.4 Share of electricity consumption, 1997-98 and 2004-05 11 Figure 2.5 Forecast terminal demand, 2007 to 2020 12 Figure 2.6 Average daily NEM electricity spot price, 2006 and 2007 14 Figure 2.7 National Electricity Market interval prices, Victoria 15 Figure 3.1 Supplied electricity by fuel type, NEM aggregate, 2005/06 17 Figure 3.2 Snapshot of the National Electricity Market, 2005-06 20 Figure 3.3 Location of major generation in New South Wales 22 Figure 3.4 Major generation in Queensland 26 Figure 3.5 Generation capacity and electricity supplied by fuel type, Queensland 27 Figure 3.6 Major generation in South Australia 32 Figure 3.7 Generation capacity and electricity supplied by fuel type, South Australia 33 Figure 3.8 Major generation in the Snowy region 36 Figure 3.9 Major generation in Tasmania 38 Figure 3.10 Major generation in Victoria 41 Figure 3.11 Generation capacity and electricity supplied by fuel type, Victoria 42 Figure 4.1 Electricity customers by jurisdiction and retailer 51 Figure 6.1 Bid Structure 67 Figure 6.2 Scheduling and dispatch prices 68 Figure 6.3 Generator dispatch cycle 69 Figure 7.1 Swap arrangements 76 Figure 7.2 OTC instruments 78 Figure 7.3 Settlement residue auction process 79 Figure 7.4 Volume of derivatives traded through brokers 82 Figure 7.5 Volume of derivatives traded through SFE 83 Figure 7.6 Estimated derivative trading volumes 84 Figure 7.7 NEM demand and contracted volumes, 2003-04 to 2005-06 85 Figure 7.8 Volume of futures contract open at 25 Sep 2006 86 Figure 7.9 SRA Payout versus Inter-regional Swap Payout: Victoria to New South Wales 87 Figure A.9.1 - Avg NSW Electricity Price 101 Figure A.9.2 - Avg Vic Electricity Price 101 Figure A.9.3 - Avg SA Electricity Price 102 Figure A.9.4 - Avg Snowy Electricity Price 102 Figure A.9.5 - Avg Tas Electricity Price 103 Figure A.9.6 - Avg Qld Electricity Price 103
Glossary
Glossary
ACCC Australian Competition and Consumer Commission
AEMC Australian Energy Markets Commission
AER Australian Energy Regulator
APRA Australian Prudential Regulation Authority
ASX Australian Stock Exchange
CCGT Combined Cycle Gas Turbine
CRA Charles River Associates
COAG Council of Australian Governments
DC Direct Current
DLF Distribution Loss Factor
DNSP Distribution Network Service Provider
ERIG Energy Reform Implementation Group
ERAA Energy Retailers Association of Australia
ESAA Energy Supply Association of Australia
ESC Essential Services Commission (Victoria)
ESCOSA Essential Services Commission of South Australia
ETEF Electricity Tariff Equalisation Fund (New South Wales)
FRC Full Retail Contestability/Competition
GW Gigawatt
IPART Independent Pricing and Regulatory Tribunal (New South Wales)
LEP Long-Term Energy Procurement
MCE Ministerial Council of Energy
MNSP Market Network Service Provider
MRET Mandatory Renewable Energy Target
Glossary
NCC National Competition Council
NCP National Competition Policy
NEL National Electricity Law
NEM National Electricity Market
NEMMCO National Electricity Market Management Company
NER National Electricity Rules (‘the Rules’)
NGF National Generators Forum
MW Megawatt
OCGT Open Cycle Gas Turbine
OTC Over-the-Counter
PC Productivity Commission
QCA Queensland Competition Authority
QNI Queensland to New South Wales Interconnector
RLMS Resource and Land Management Services
SFE Sydney Futures Exchange
TLF Transmission Loss Factor
TNSP Transmission Network Service Provider
TWh Terawatt-hours
VENCorp Victorian Energy Networks Corporation
The Wholesale Electricity Market Introduction
NERA Economic Consulting 1
1. Introduction
NERA Economic Consulting has been asked by the Australian Energy Market Commission (AEMC) to provide a high-level overview of the wholesale electricity and gas market structures and operation within the National Electricity Market (NEM) jurisdictions. This report focuses on the wholesale electricity market and its sister report undertakes a similar analysis for the wholesale gas market in Australia. These reports will provide a basis of information for the review of the effectiveness of retail electricity and gas markets, which is currently being undertaken by the Commission.
Our approach in this report has been to provide a snap shot of the electricity market structure as it operates currently in each of the NEM regions. This involves a discussion of:
§ electricity generators in each region, including generator capacity, fuel type, energy supply and ownership structure;
§ the transmission and distribution system as it operates in each region; and
§ the electricity retail segment, including market share information.
In so doing we also examine electricity supply and demand, the interconnection of the network between NEM regions and identify the extent of vertical aggregation that is arising between generators and retailers in some regions.
In addition to a discussion of the market structure, we also describe the operation of the wholesale market including the roles of market institutions, the approach to bidding, settlement and dispatch, and the important role that financial risk management possesses in the efficient operation of the NEM.
Finally, we provide a brief outline of the policy issues arising from the current reforms, particularly those raised in the recent report by the Energy Reform Implementation Group (ERIG). We also provide some observations arising from the descriptions of market structure as it relates to a consideration of the effectiveness of retail electricity competition.
1.1. Structure of this report
The remainder of this report is structured as follows:
§ Section 2 provides an overview of the NEM, its participants and electricity consumption;
§ Section 3 discusses the structure of the NEM, focusing on generation capacity, location, ownership, and electricity supply; transmission and distribution; and interconnection between each NEM region;
§ Section 4 outlines the retail segment of the market, including the structure of electricity retailers in each of the NEM regions;
§ Section 5 discusses the extent of vertical integration between retailers and generators which has occurred in recent years;
The Wholesale Electricity Market Introduction
NERA Economic Consulting 2
§ Section 6 discusses the operation of the market including price formulation, dispatch procedures, settlement and treatment of electricity losses;
§ Section 7 discusses the approaches to risk management, including the types of risks that arise, and the tools for managing those risks;
§ Section 8 provides a brief summary of recent reviews of the wholesale electricity market; and
§ Section 9 considers issues arising from the structure and operation of the wholesale electricity market for retail competition.
The Wholesale Electricity Market Overview of the National Electricity Market
NERA Economic Consulting 3
2. Overview of the National Electricity Market
In the 1990’s Australia’s electricity market underwent a period of structural reform that led to the establishment of a common wholesale market for the supply of electricity to retailers and end users. This market, the NEM, was eventually established in 1998, linking Victoria, New South Wales, Queensland, the Australian Capital Territory and South Australia. In 2005 Tasmania joined the NEM as the sixth region.
The NEM was designed to include six distinct regions, represented by the five states, with the addition of the Snowy Mountains Hydro-Electricity Scheme as the sixth region (the Australian Capital Territory is incorporated into New South Wales).1 Each of these regions operates their own market for the supply and demand of electricity. However, every region is connected through at least one interconnector that allows for electricity to be imported or exported between regions.
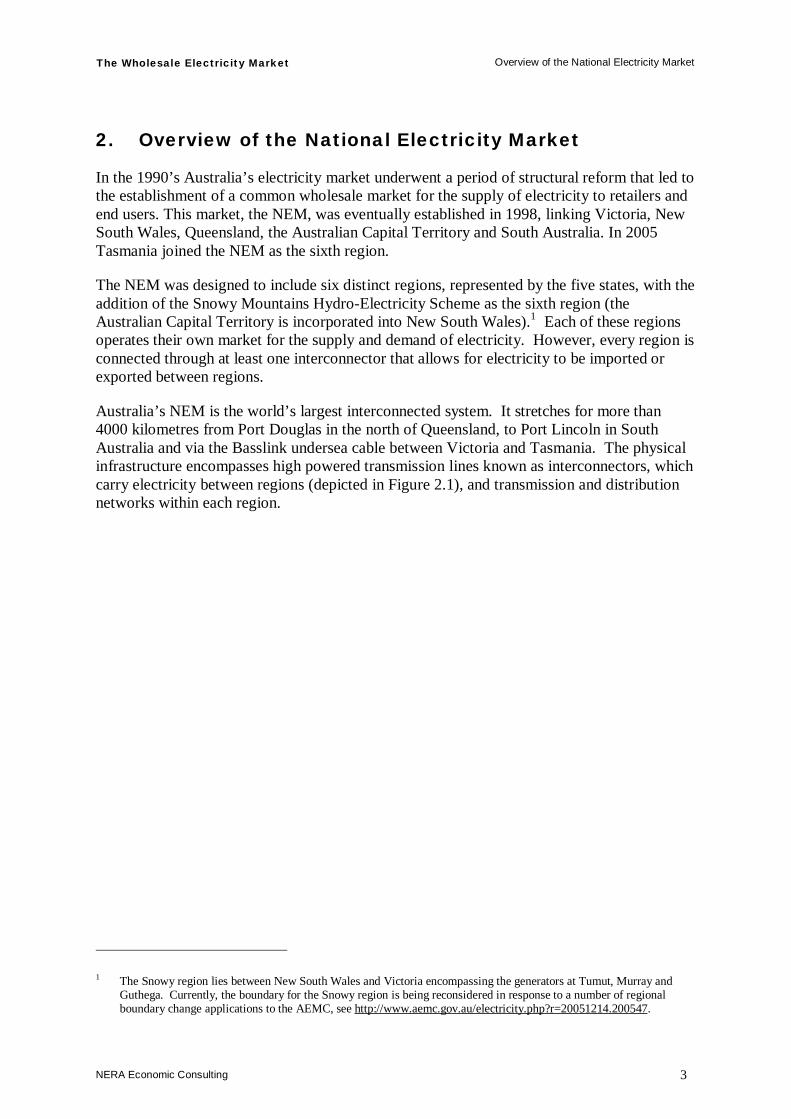
Australia’s NEM is the world’s largest interconnected system. It stretches for more than 4000 kilometres from Port Douglas in the north of Queensland, to Port Lincoln in South Australia and via the Basslink undersea cable between Victoria and Tasmania. The physical infrastructure encompasses high powered transmission lines known as interconnectors, which carry electricity between regions (depicted in Figure 2.1), and transmission and distribution networks within each region.
1 The Snowy region lies between New South Wales and Victoria encompassing the generators at Tumut, Murray and
Guthega. Currently, the boundary for the Snowy region is being reconsidered in response to a number of regional boundary change applications to the AEMC, see http://www.aemc.gov.au/electricity.php?r=20051214.200547.
The Wholesale Electricity Market Overview of the National Electricity Market
NERA Economic Consulting 4
Figure 2.1 Interconnector capacity in the NEM
Source: RLMS and Australian Electricity Market Study 2020 Outlook (2007), Core Collaborative, p.7-7, annotated by NERA.
The NEM operates in accordance with the National Electricity Rules (‘the Rules’) that govern all aspects of the operation of the market. These include the dispatch rules, provision of obligations on market participants and service providers, the responsibilities of the system operator, the National Electricity Market Management Company (NEMMCO), and the operation of the spot market, prudential requirements and the procedures for dealing with network losses and constraints.
As independent system operator, NEMMCO has responsibility for the implementation and continued operation of the wholesale market, and a mandate to continually improve its functions whilst maintaining system security. It functions as a non-profit body corporate whose members are the state governments of the NEM.
The AEMC is responsible for the Rules and considers rule change proposals. In assessing rule change applications, it is required to be satisfied that the NEM Objective will, or is likely to be promoted. Under section 7 of the National Electricity Law, the NEM Objective is:
To promote efficient investment in, and efficient use of, electricity services for the long-term interests of consumers of electricity with respect to price, quality, reliability, and
l
l
l
l
l
l
QNINSW to QLD 300MW
QLD to NSW 1080 MW
QNINSW to QLD 300MW
QLD to NSW 1080 MW
Directlink/TerranoraNSW to QLD 80 MW
QLD to NSW 180 MW
Directlink/TerranoraNSW to QLD 80 MWQLD to NSW 180 MW
SNO-NSW3000 MW
SNO-NSW3000 MW
SNO-VIC1900 MW
SNO-VIC1900 MW
BasslinkTAS to VIC 600 MWVIC to TAS 480 MW
BasslinkTAS to VIC 600 MWVIC to TAS 480 MW
VIC-SAVIC to SA 460 MWSA to VIC 300 MW
VIC-SAVIC to SA 460 MWSA to VIC 300 MW
MurraylinkVIC to SA 220 MWSA to VIC 150 MW
MurraylinkVIC to SA 220 MWSA to VIC 150 MW
Hobart
Melbourne
Adelaide
Brisbane
Sydney
Canberra
The Wholesale Electricity Market Overview of the National Electricity Market
NERA Economic Consulting 5
security of supply of electricity and the reliability, safety and security of the national electricity system.
The Australian Energy Regulator (AER) is responsible for enforcing and implementing the Rules.2 In addition, it is responsible for the economic regulation of transmission and distribution services, in accordance with the Rules.3
Market structures differ significantly across each NEM region. The New South Wales and Queensland regions are characterised by state-owned generation, transmission, distribution and retail companies. However, in early 2007, the Queensland government sold the retail businesses of Energex and Ergon.4 In Victoria and South Australia government ownership was divested earlier in the reform phase.5,6
2.1. Structure of the NEM
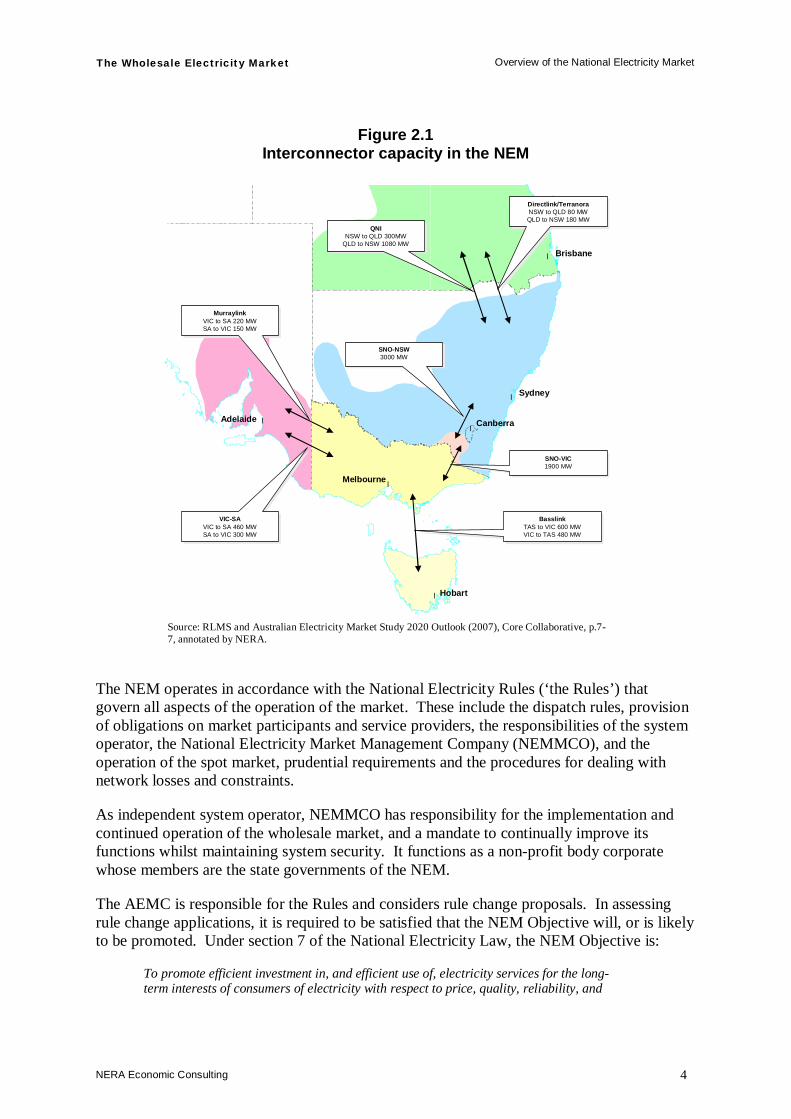
The NEM market participants consist of generators, retailers, large end-users, traders, special participants, transmission network service providers (TNSPs) and distribution network service providers (DNSPs). All market participants are required to be registered with NEMMCO and pay the appropriate fee. Figure 2.2 below provides an overview of the interrelationship between the principal market participants, NEMMCO and the associated regulators discussed above.
2 AER website, http://www.aer.gov.au/content/index.phtml/tag/aerAboutUs/ 3 However, the distribution businesses are still in a period of transition and thus some are regulated by the jurisdictional
regulators, it is expected all responsibility will be transferred to the AER by 1 January 2008 (AER News Release, 7 September 2006).
4 Queensland Government, Joint Ministerial Media Statement, 19 February 2007. Note that only the contestable customers of Ergon were packaged for sale.
5 ESC, Review of Effectiveness of Retail Competition in Gas and Electricity – Public Draft Report, 30 March 2004, p.24. 6 Auditor-General of South Australia, Report for the Auditor-General for the year ended 30 June 2001, asset disposals
section.
The Wholesale Electricity Market Overview of the National Electricity Market
NERA Economic Consulting 6
Figure 2.2 Structure of the National Electricity Market
NEMMCO(receives spot price from retailers and
large customers and forwards to generators and recovers
fees from all market participants)
Generators(produces energy
for users)
AER Regulation of
Transmission and DistributionNetworks
AEMC via NERRule Making
Retailer
Distribution Network Service Provider
(provides non-discriminatoryaccess to assets)
End users
Large customer
Generators(produces energy
for users)
Generators(produces energy
for users)
Electricity
End users End users
Electricity Flows
Large customer
Transmission Network Service
Provider(provides non-discriminatory
access to assets)
Retailer
Fees$
($)
End users End users End users
Spot Price ($)
Regulation
Spot Price ($)
Spot Price ($)
Market participant fees ($)End user price ($)
Fees$
Source: NERA analysis
An overview of the principal market participants is provided below.
Generators Generators own and operate electricity plants to convert energy from a fuel source into electricity. In Australia, the main fuel types used are coal, water, natural gas and wind. Box 2.1 describes the characteristics of the different types of load these fuel sources dictate and how NEMMCO classifies generators for scheduling purposes.
The Wholesale Electricity Market Overview of the National Electricity Market
NERA Economic Consulting 7
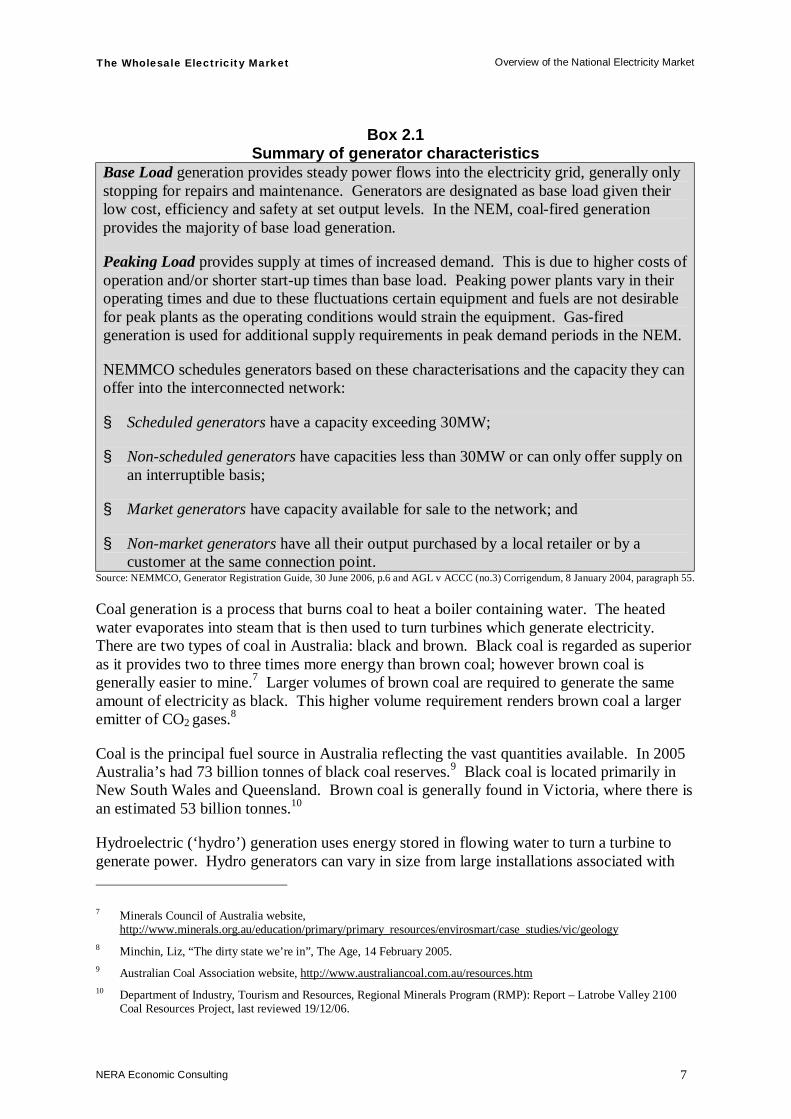
Box 2.1 Summary of generator characteristics
Base Load generation provides steady power flows into the electricity grid, generally only stopping for repairs and maintenance. Generators are designated as base load given their low cost, efficiency and safety at set output levels. In the NEM, coal-fired generation provides the majority of base load generation.
Peaking Load provides supply at times of increased demand. This is due to higher costs of operation and/or shorter start-up times than base load. Peaking power plants vary in their operating times and due to these fluctuations certain equipment and fuels are not desirable for peak plants as the operating conditions would strain the equipment. Gas-fired generation is used for additional supply requirements in peak demand periods in the NEM.
NEMMCO schedules generators based on these characterisations and the capacity they can offer into the interconnected network:
§ Scheduled generators have a capacity exceeding 30MW;
§ Non-scheduled generators have capacities less than 30MW or can only offer supply on an interruptible basis;
§ Market generators have capacity available for sale to the network; and
§ Non-market generators have all their output purchased by a local retailer or by a customer at the same connection point.
Source: NEMMCO, Generator Registration Guide, 30 June 2006, p.6 and AGL v ACCC (no.3) Corrigendum, 8 January 2004, paragraph 55.
Coal generation is a process that burns coal to heat a boiler containing water. The heated water evaporates into steam that is then used to turn turbines which generate electricity. There are two types of coal in Australia: black and brown. Black coal is regarded as superior as it provides two to three times more energy than brown coal; however brown coal is generally easier to mine.7 Larger volumes of brown coal are required to generate the same amount of electricity as black. This higher volume requirement renders brown coal a larger emitter of CO2 gases.8
Coal is the principal fuel source in Australia reflecting the vast quantities available. In 2005 Australia’s had 73 billion tonnes of black coal reserves.9 Black coal is located primarily in New South Wales and Queensland. Brown coal is generally found in Victoria, where there is an estimated 53 billion tonnes.10
Hydroelectric (‘hydro’) generation uses energy stored in flowing water to turn a turbine to generate power. Hydro generators can vary in size from large installations associated with 7 Minerals Council of Australia website,
http://www.minerals.org.au/education/primary/primary_resources/envirosmart/case_studies/vic/geology 8 Minchin, Liz, “The dirty state we’re in”, The Age, 14 February 2005. 9 Australian Coal Association website, http://www.australiancoal.com.au/resources.htm 10 Department of Industry, Tourism and Resources, Regional Minerals Program (RMP): Report – Latrobe Valley 2100
Coal Resources Project, last reviewed 19/12/06.
The Wholesale Electricity Market Overview of the National Electricity Market
NERA Economic Consulting 8
dams on large rivers, such as with the Snowy Hydro Scheme, or micro generators fixed to in-stream weirs as part of the rural or urban water system. Hydro generation is the second largest proportion of total generation capacity in the NEM.11
Natural gas-fired generators turn turbines in one of two ways to produce electricity.12 Open cycle gas turbines (OCGT) burn gas mixed with air to rotate a turbine without a steam intermediary. Combined cycle gas turbines (CCGT) extend this process by using the gas turbine exhaust to heat a boiler that releases steam into a second turbine. Natural gas plants produce comparatively smaller volumes of CO2 than their coal fired counterparts.13 However, due to the relatively high cost of natural gas, especially compared with coal, they are generally operated only during peak demand periods, when the market price is at its highest.
Wind generation utilises modern versions of windmill propellers to turn a turbine directly for electricity generation. A significant drawback however is that it relies on an intermittent source of energy and so cannot be relied upon to supply at required periods. However, significant recent increases in wind generating capacity spurred by the Federal Government’s Mandatory Renewable Energy Target (MRET) have led the MCE to consider better scheduling processes to incorporate this intermittent source.14
Generators must sell their entire electricity output through the spot market, as the NEM operates a gross pool market.15 It is also an ‘energy-only market’, in that the revenue earned by generators is a function of the quantity of electricity it sells and not the capacity of its plant. In the absence of a separate capacity market or a capacity payment mechanism, holding additional capacity is only profitable if, when the capacity is dispatched, it is dispatched at a price that exceeds its marginal cost.
To limit its exposure to the spot market, a generator can enter into hedge contracts directly with retailers and/or large customers. In addition to limiting its exposure to the spot market the use of derivatives may provide the revenue required to maintain reserve capacity, as discussed below in section 7.2.1. The absence of a capacity payment mechanism in the energy-only market model denotes that investment in additional generation will be inextricably linked to a generator’s expectations about future spot prices and the degree to which exposure to those prices can be mitigated.16
Capacity and output also affect the fees generators pay as participants in the NEM. Fees are structured such that 50 per cent of the charges are allocated on the basis of energy supplied in
11 Electricity Gas Australia (2006), ESAA. 12 Met Office, UK, http://www.metoffice.gov.uk/consulting/casestudies/06_0281c_DSheet_3.pdf 13 Roarty, M., “Natural Gas: Energy for the New Millennium”, Parliamentary Library Research Paper 5 1998-99,
Parliament of Australia, (1998). 14 MCE SCO Wind Energy Policy WG, “Integrating Wind Farms into the National Electricity Market: Discussion Paper”,
March 2005. 15 A gross pool market does not permit participants to contract directly with each other for the physical delivery of a good.
In the NEM, NEMMCO aggregates the entire production of electricity into a pool from which retailers and large market customers can purchase their electricity requirements.
16 NEMMCO, Australia’s National Electricity Market: Wholesale Market Operations, p. 8.
The Wholesale Electricity Market Overview of the National Electricity Market
NERA Economic Consulting 9
the previous calendar year, whilst the remaining 50 per cent is levied based on the higher of a generators’ registered capacity or notified maximum capacity.17
Network service providers The electricity network consists of high voltage transmission lines that transport electricity from generators to consumers via a local distribution network. This network structure reflects the economies of scale associated with large scale electricity generation, compared with localised generation. Generators can also be embedded within distribution networks, both as a way of providing additional electricity during peak periods, but also to address network congestion problems.18 Distributed generation is projected to increase over 100 per cent by the year 2020.19
TNSPs provide access to the high-voltage cables that move electricity from large generators to load centres. Transmission networks operate at high voltages to allow for the movement of a greater amount of electricity for a given size, compared to local distribution networks.20 As well, the higher voltages minimise losses in the network.21
DNSPs receive electricity from the transmission network and transform it to lower voltages that are more suitable for use by electricity consumers. They are responsible for the operation and maintenance of their local distribution network. Both TNSPs and DNSPs are responsible for maintaining system security on their portion of the network and facilitating new connections.
Retailers and large end users Retailers act as the intermediary between generators and smaller electricity consumers, such as households and small businesses. They purchase electricity from the NEM pool and on-sell to customers charging a price that reflects the generation, transmission and distribution costs, as well as its own retail costs. Large end users participate directly in the NEM by purchasing their own electricity requirements from the pool.
Retail competition has been introduced progressively across the regions such that retailers are able to service customers throughout the NEM. However, default regulated tariffs are currently available in all regions. The Ministerial Council on Energy (MCE) has agreed that once effective competition exists, these default regulated tariffs will be removed.22
The electricity costs incurred by retailers and large end-use customers are subject to the volatility of the spot market. To ameliorate this exposure, hedge contracts may be entered into directly with generators coinciding with a generator’s interest to avoid undue volatility. Alternatively, a large customer may elect to withdraw from the market if it considers the spot
17 NEMMCO, Structure of Participant Fees - Final Determination and Report 2006, p. 5-6. 18 PB Associates, A National Code of Practice for Embedded Generation Consultation Paper, February 2006, pp 6-7. 19 MCE SCO R&DG WG, “Impediments to the Uptake of Renewable and Distributed Energy: Discussion Paper”,
February 2006, p.15. 20 ActewAGL, http://www.actewagl.com.au/education/Energy/Electricity/ElectricityDistribution/default.aspx 21 Western Power, http://www.worldofenergy.com.au/factsheet_electricity/07_fact_electricity_transmission.html 22 Australian Energy Markets Agreement, clause 14.11.
The Wholesale Electricity Market Overview of the National Electricity Market
NERA Economic Consulting 10
price to be higher than the short-run costs of not using electricity, and enter again only when the price falls below that level.
2.2. Electricity consumption in the NEM
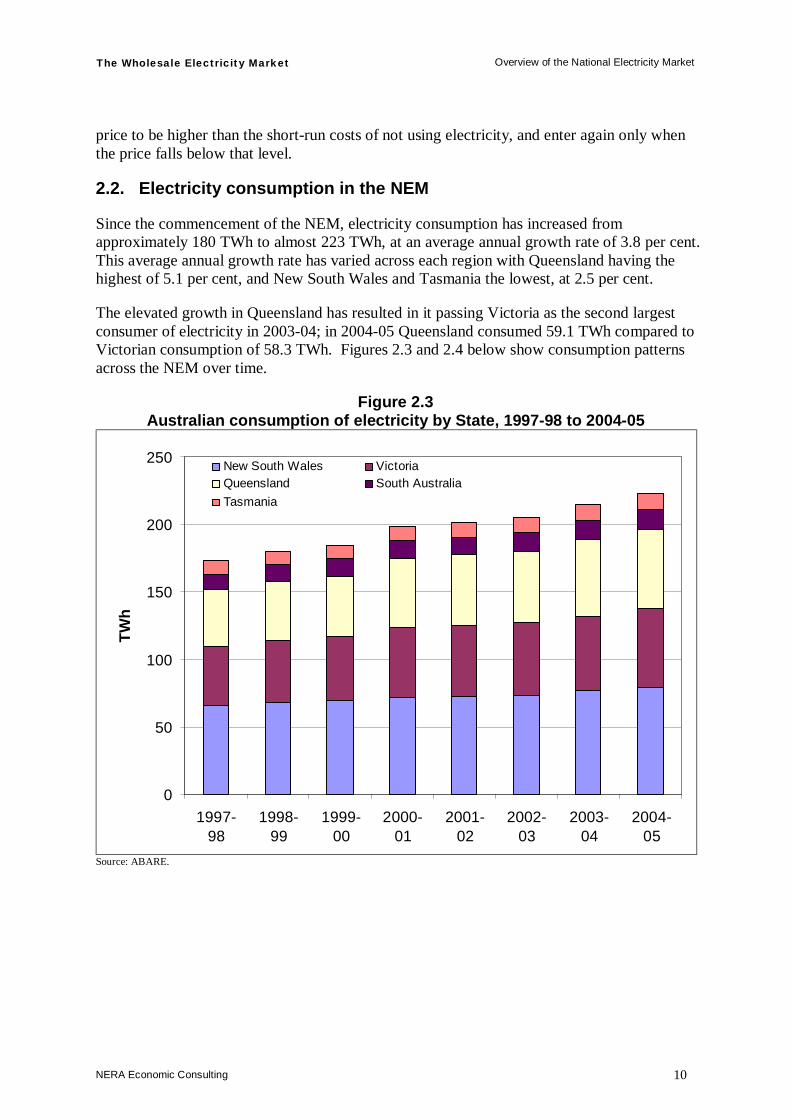
Since the commencement of the NEM, electricity consumption has increased from approximately 180 TWh to almost 223 TWh, at an average annual growth rate of 3.8 per cent. This average annual growth rate has varied across each region with Queensland having the highest of 5.1 per cent, and New South Wales and Tasmania the lowest, at 2.5 per cent.
The elevated growth in Queensland has resulted in it passing Victoria as the second largest consumer of electricity in 2003-04; in 2004-05 Queensland consumed 59.1 TWh compared to Victorian consumption of 58.3 TWh. Figures 2.3 and 2.4 below show consumption patterns across the NEM over time.
Figure 2.3 Australian consumption of electricity by State, 1997-98 to 2004-05
0
50
100
150
200
250
1997-98
1998-99
1999-00
2000-01
2001-02
2002-03
2003-04
2004-05
TWh
New South Wales VictoriaQueensland South AustraliaTasmania
Source: ABARE.
The Wholesale Electricity Market Overview of the National Electricity Market
NERA Economic Consulting 11
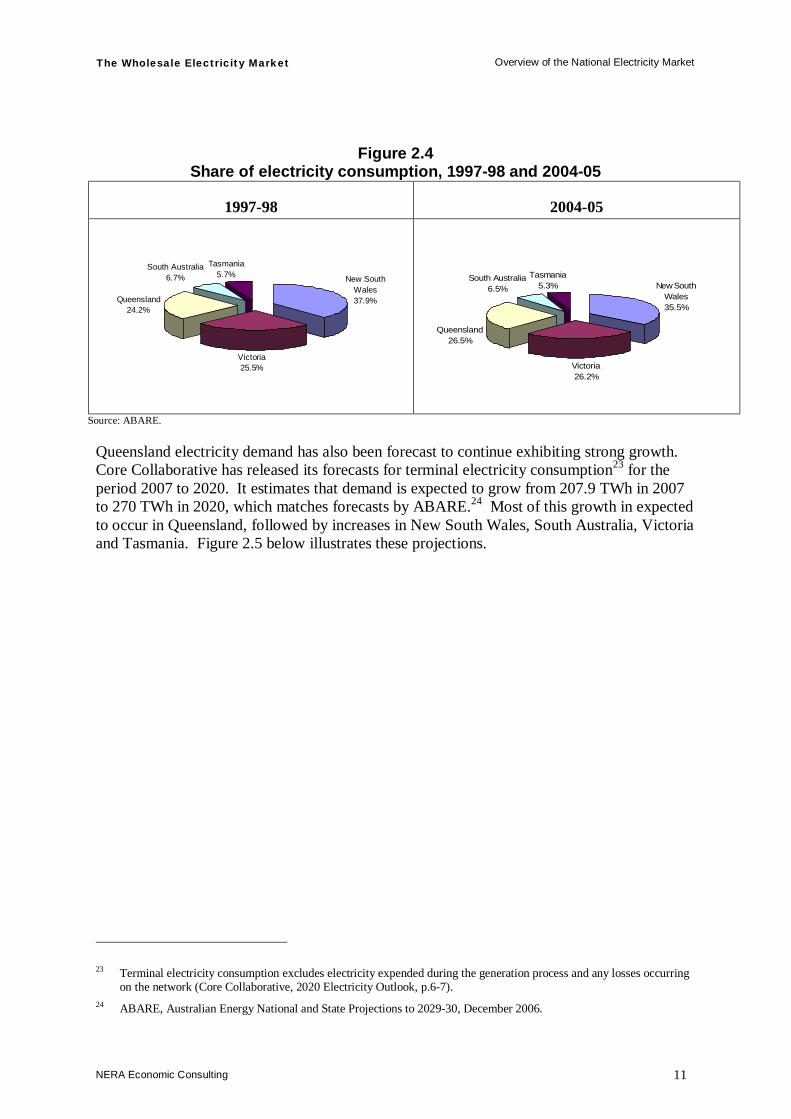
Figure 2.4
Share of electricity consumption, 1997-98 and 2004-05
1997-98 2004-05
New South Wales37.9%
Victoria25.5%
Queensland24.2%
South Australia6.7%
Tasmania5.7%
New South Wales35.5%
Victoria26.2%
Queensland26.5%
South Australia6.5%
Tasmania5.3%
Source: ABARE.
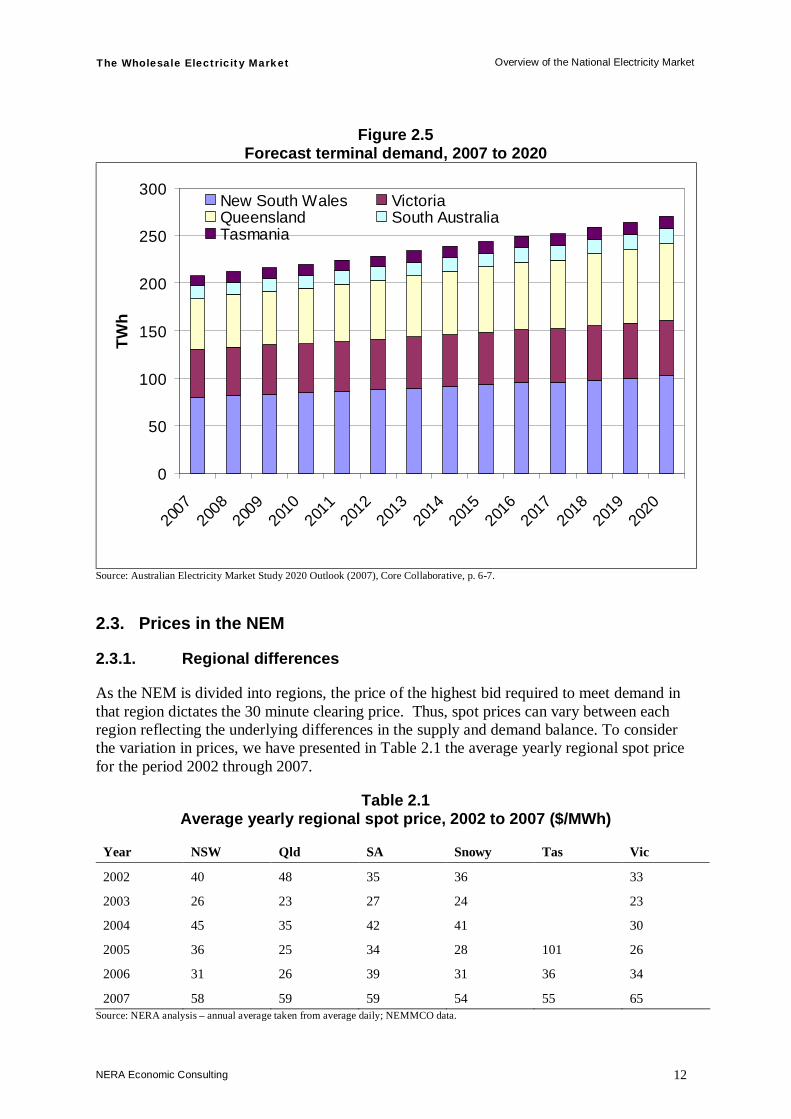
Queensland electricity demand has also been forecast to continue exhibiting strong growth. Core Collaborative has released its forecasts for terminal electricity consumption23 for the period 2007 to 2020. It estimates that demand is expected to grow from 207.9 TWh in 2007 to 270 TWh in 2020, which matches forecasts by ABARE.24 Most of this growth in expected to occur in Queensland, followed by increases in New South Wales, South Australia, Victoria and Tasmania. Figure 2.5 below illustrates these projections.
23 Terminal electricity consumption excludes electricity expended during the generation process and any losses occurring
on the network (Core Collaborative, 2020 Electricity Outlook, p.6-7). 24 ABARE, Australian Energy National and State Projections to 2029-30, December 2006.
The Wholesale Electricity Market Overview of the National Electricity Market
NERA Economic Consulting 12
Figure 2.5 Forecast terminal demand, 2007 to 2020
0
50
100
150
200
250
300
2007
2008
2009
2010
2011
2012
2013
2014
2015
2016
2017
2018
2019
2020
TWh
New South Wales VictoriaQueensland South AustraliaTasmania
Source: Australian Electricity Market Study 2020 Outlook (2007), Core Collaborative, p. 6-7.
2.3. Prices in the NEM
2.3.1. Regional differences
As the NEM is divided into regions, the price of the highest bid required to meet demand in that region dictates the 30 minute clearing price. Thus, spot prices can vary between each region reflecting the underlying differences in the supply and demand balance. To consider the variation in prices, we have presented in Table 2.1 the average yearly regional spot price for the period 2002 through 2007.
Table 2.1 Average yearly regional spot price, 2002 to 2007 ($/MWh)
Year NSW Qld SA Snowy Tas Vic
2002 40 48 35 36 33
2003 26 23 27 24 23
2004 45 35 42 41 30
2005 36 25 34 28 101 26
2006 31 26 39 31 36 34
2007 58 59 59 54 55 65 Source: NERA analysis – annual average taken from average daily; NEMMCO data.
The Wholesale Electricity Market Overview of the National Electricity Market
NERA Economic Consulting 13
It can be observed in the above table that the average spot price for electricity in each region varies considerably across the NEM. In particular, Tasmania experienced a price of electricity that was twice as high as the other regions prior to the establishment of the Basslink interconnector.
Table 2.2 presents the standard deviation25 of the average daily price for each region on an annual basis. These results demonstrate that the variability of spot prices can differ substantially between regions. For example, in 2004 the price of electricity was distributed in a much wider range around the mean in New South Wales compared to South Australia, despite the observation that the average price of electricity only differed by $3 per MWh.
Table 2.2 Average yearly standard deviation of spot prices, 2002 to 2007 ($/MWh)
Year NSW Qld SA Snowy Tas Vic
2002 42 85 27 29 27
2003 42 30 16 27 22
2004 118 67 54 84 23
2005 83 47 27 36 228 21
2006 65 47 38 34 18 47
2007 41 54 76 25 25 135 Source: NERA analysis; NEMMCO data.
The existence of these differences reflects the underlying market characteristics of the NEM and the physical capacity of the system.
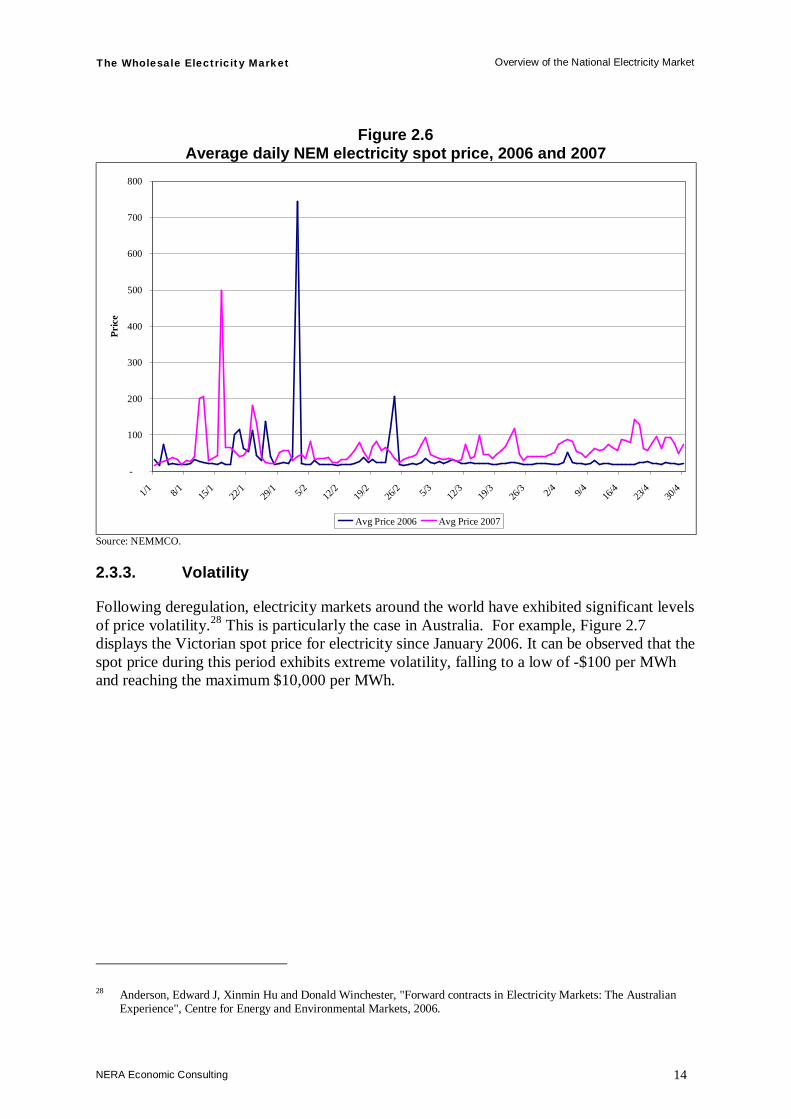
2.3.2. Price growth
Figure 2.6 shows the average daily price of electricity for the entire NEM.26 The average spot price in 2007 is, for the most part, higher than the average price over the corresponding period in 2006. In particular, over March and April the difference in the price of electricity between the two years has grown considerably, with the price in 2007 trending towards $100 per MWh, whilst the 2006 price consistently remains below $30 per MWh except for one day in February.27
25 The standard deviation is a measure of the statistical dispersion of a data set which represents how tightly clustered the
data set is around the mean. 26 This is calculated by determining the value of all NEM trades in each region for every day and dividing the total value
by the total level of NEM demand. 27 This analysis is replicated in Appendix 1 on a region by region basis.
The Wholesale Electricity Market Overview of the National Electricity Market
NERA Economic Consulting 14
Figure 2.6 Average daily NEM electricity spot price, 2006 and 2007
-
100
200
300
400
500
600
700
800
1/1 8/1 15/1
22/1
29/1 5/2 12
/219
/226
/2 5/3 12/3
19/3
26/3 2/4 9/4 16
/423
/430
/4
Pric
e
Avg Price 2006 Avg Price 2007 Source: NEMMCO.
2.3.3. Volatility
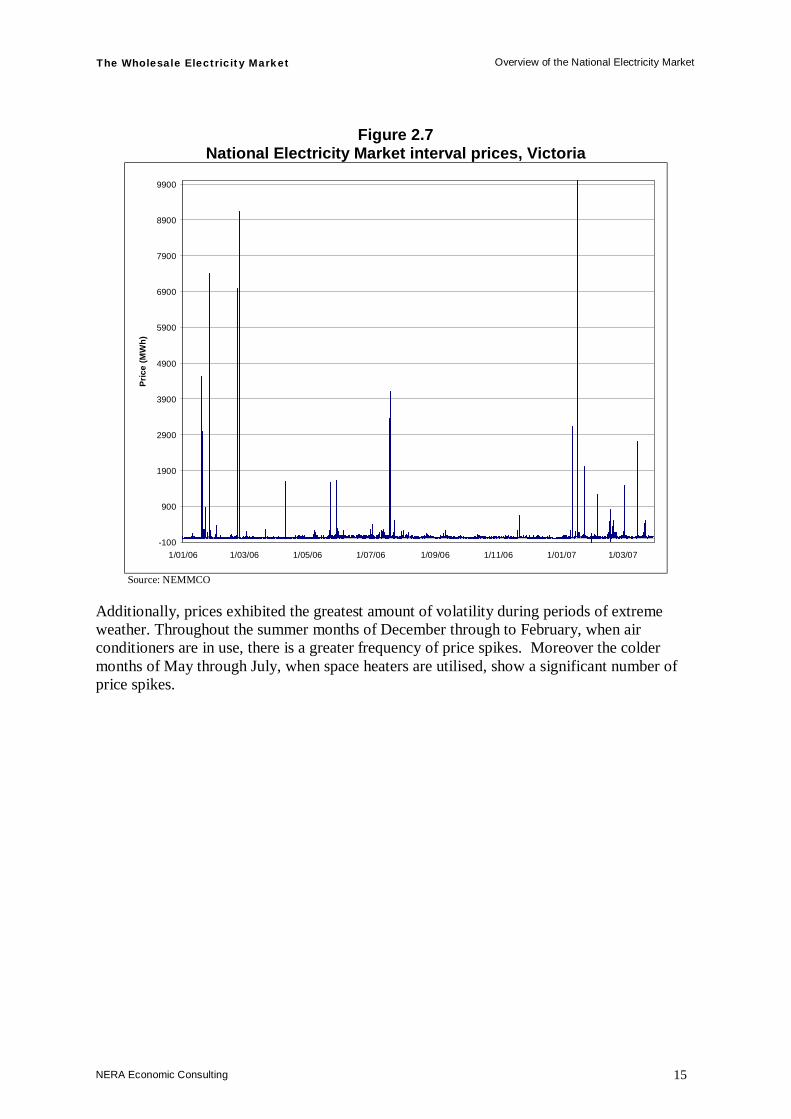
Following deregulation, electricity markets around the world have exhibited significant levels of price volatility.28 This is particularly the case in Australia. For example, Figure 2.7 displays the Victorian spot price for electricity since January 2006. It can be observed that the spot price during this period exhibits extreme volatility, falling to a low of -$100 per MWh and reaching the maximum $10,000 per MWh.
28 Anderson, Edward J, Xinmin Hu and Donald Winchester, "Forward contracts in Electricity Markets: The Australian
Experience", Centre for Energy and Environmental Markets, 2006.
The Wholesale Electricity Market Overview of the National Electricity Market
NERA Economic Consulting 15
Figure 2.7 National Electricity Market interval prices, Victoria
-100
900
1900
2900
3900
4900
5900
6900
7900
8900
9900
1/01/06 1/03/06 1/05/06 1/07/06 1/09/06 1/11/06 1/01/07 1/03/07
Pric
e (M
Wh)
Source: NEMMCO
Additionally, prices exhibited the greatest amount of volatility during periods of extreme weather. Throughout the summer months of December through to February, when air conditioners are in use, there is a greater frequency of price spikes. Moreover the colder months of May through July, when space heaters are utilised, show a significant number of price spikes.
wholesale electricity Generation, transmission and distribution in the NEM
NERA Economic Consulting 16
3. Generation, transmission and distribution in the NEM
In the following sections we provide an overview of the generation, transmission and distribution functions of market participants, initially for the NEM as a whole, and then for each NEM region. Our focus is on:
§ identifying generation capacity, by ownership and fuel type in each NEM region;
§ total electricity supply, within region or imported/exported outside the region; and
§ providing a brief overview of transmission and distribution network service providers in each region.
3.1. NEM structure in aggregate
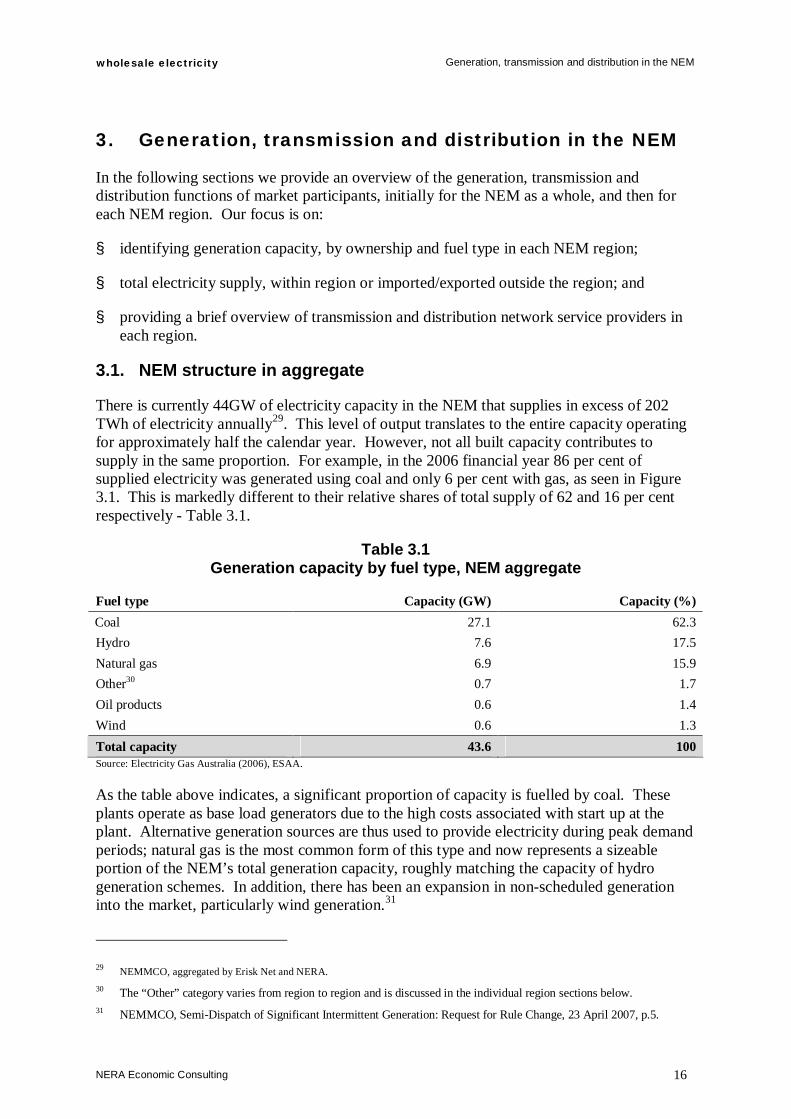
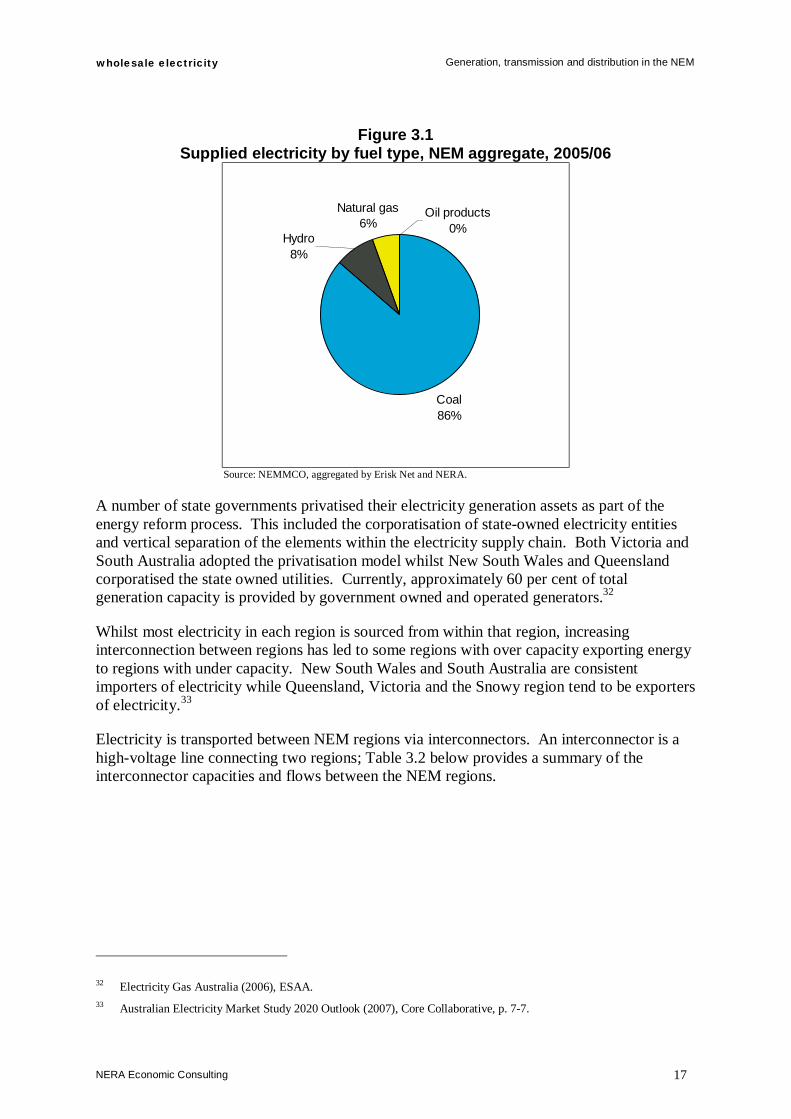
There is currently 44GW of electricity capacity in the NEM that supplies in excess of 202 TWh of electricity annually29. This level of output translates to the entire capacity operating for approximately half the calendar year. However, not all built capacity contributes to supply in the same proportion. For example, in the 2006 financial year 86 per cent of supplied electricity was generated using coal and only 6 per cent with gas, as seen in Figure 3.1. This is markedly different to their relative shares of total supply of 62 and 16 per cent respectively - Table 3.1.
Table 3.1 Generation capacity by fuel type, NEM aggregate
Fuel type Capacity (GW) Capacity (%) Coal 27.1 62.3 Hydro 7.6 17.5 Natural gas 6.9 15.9 Other30 0.7 1.7 Oil products 0.6 1.4 Wind 0.6 1.3 Total capacity 43.6 100 Source: Electricity Gas Australia (2006), ESAA.
As the table above indicates, a significant proportion of capacity is fuelled by coal. These plants operate as base load generators due to the high costs associated with start up at the plant. Alternative generation sources are thus used to provide electricity during peak demand periods; natural gas is the most common form of this type and now represents a sizeable portion of the NEM’s total generation capacity, roughly matching the capacity of hydro generation schemes. In addition, there has been an expansion in non-scheduled generation into the market, particularly wind generation.31
29 NEMMCO, aggregated by Erisk Net and NERA. 30 The “Other” category varies from region to region and is discussed in the individual region sections below. 31 NEMMCO, Semi-Dispatch of Significant Intermittent Generation: Request for Rule Change, 23 April 2007, p.5.
wholesale electricity Generation, transmission and distribution in the NEM
NERA Economic Consulting 17
Figure 3.1 Supplied electricity by fuel type, NEM aggregate, 2005/06
Coal86%
Natural gas6%
Hydro8%
Oil products0%
Source: NEMMCO, aggregated by Erisk Net and NERA.
A number of state governments privatised their electricity generation assets as part of the energy reform process. This included the corporatisation of state-owned electricity entities and vertical separation of the elements within the electricity supply chain. Both Victoria and South Australia adopted the privatisation model whilst New South Wales and Queensland corporatised the state owned utilities. Currently, approximately 60 per cent of total generation capacity is provided by government owned and operated generators.32
Whilst most electricity in each region is sourced from within that region, increasing interconnection between regions has led to some regions with over capacity exporting energy to regions with under capacity. New South Wales and South Australia are consistent importers of electricity while Queensland, Victoria and the Snowy region tend to be exporters of electricity.33
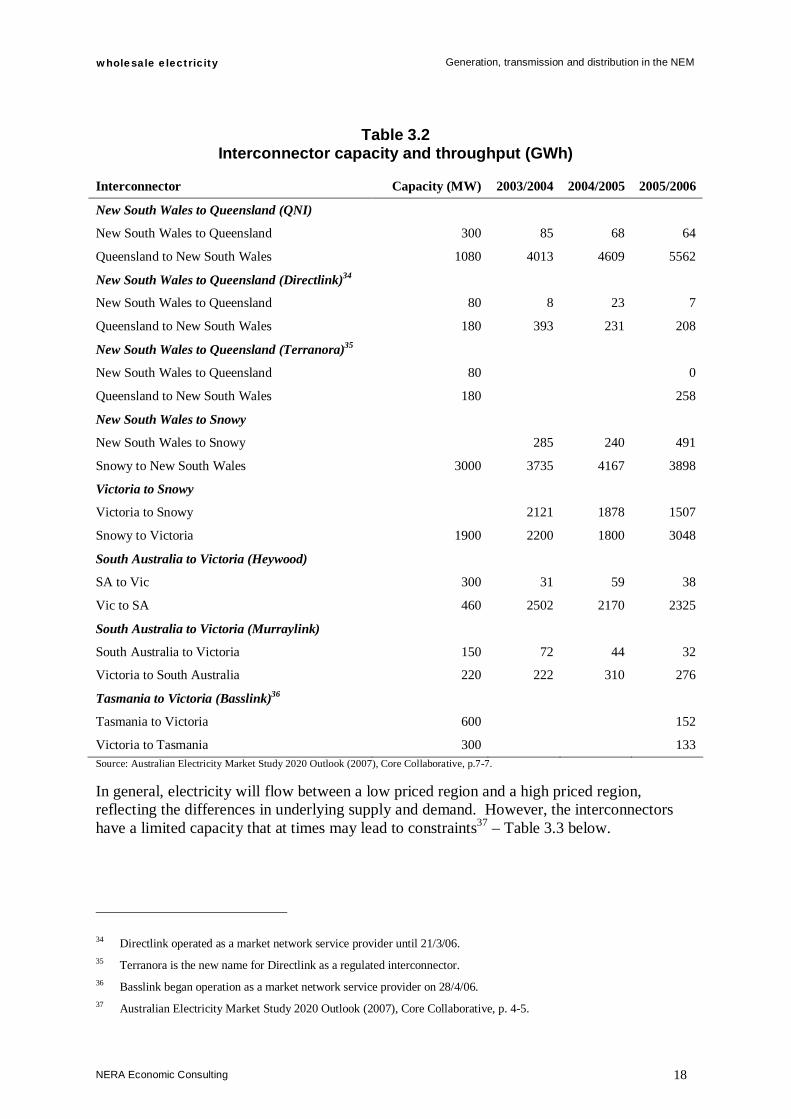
Electricity is transported between NEM regions via interconnectors. An interconnector is a high-voltage line connecting two regions; Table 3.2 below provides a summary of the interconnector capacities and flows between the NEM regions.
32 Electricity Gas Australia (2006), ESAA. 33 Australian Electricity Market Study 2020 Outlook (2007), Core Collaborative, p. 7-7.
wholesale electricity Generation, transmission and distribution in the NEM
NERA Economic Consulting 18
Table 3.2 Interconnector capacity and throughput (GWh)
Interconnector Capacity (MW) 2003/2004 2004/2005 2005/2006
New South Wales to Queensland (QNI)
New South Wales to Queensland 300 85 68 64
Queensland to New South Wales 1080 4013 4609 5562
New South Wales to Queensland (Directlink)34
New South Wales to Queensland 80 8 23 7
Queensland to New South Wales 180 393 231 208
New South Wales to Queensland (Terranora)35
New South Wales to Queensland 80 0
Queensland to New South Wales 180 258
New South Wales to Snowy
New South Wales to Snowy 285 240 491
Snowy to New South Wales 3000 3735 4167 3898
Victoria to Snowy
Victoria to Snowy 2121 1878 1507
Snowy to Victoria 1900 2200 1800 3048
South Australia to Victoria (Heywood)
SA to Vic 300 31 59 38
Vic to SA 460 2502 2170 2325
South Australia to Victoria (Murraylink)
South Australia to Victoria 150 72 44 32
Victoria to South Australia 220 222 310 276
Tasmania to Victoria (Basslink)36
Tasmania to Victoria 600 152
Victoria to Tasmania 300 133 Source: Australian Electricity Market Study 2020 Outlook (2007), Core Collaborative, p.7-7. In general, electricity will flow between a low priced region and a high priced region, reflecting the differences in underlying supply and demand. However, the interconnectors have a limited capacity that at times may lead to constraints37 – Table 3.3 below.
34 Directlink operated as a market network service provider until 21/3/06. 35 Terranora is the new name for Directlink as a regulated interconnector. 36 Basslink began operation as a market network service provider on 28/4/06. 37 Australian Electricity Market Study 2020 Outlook (2007), Core Collaborative, p. 4-5.
wholesale electricity Generation, transmission and distribution in the NEM
NERA Economic Consulting 19
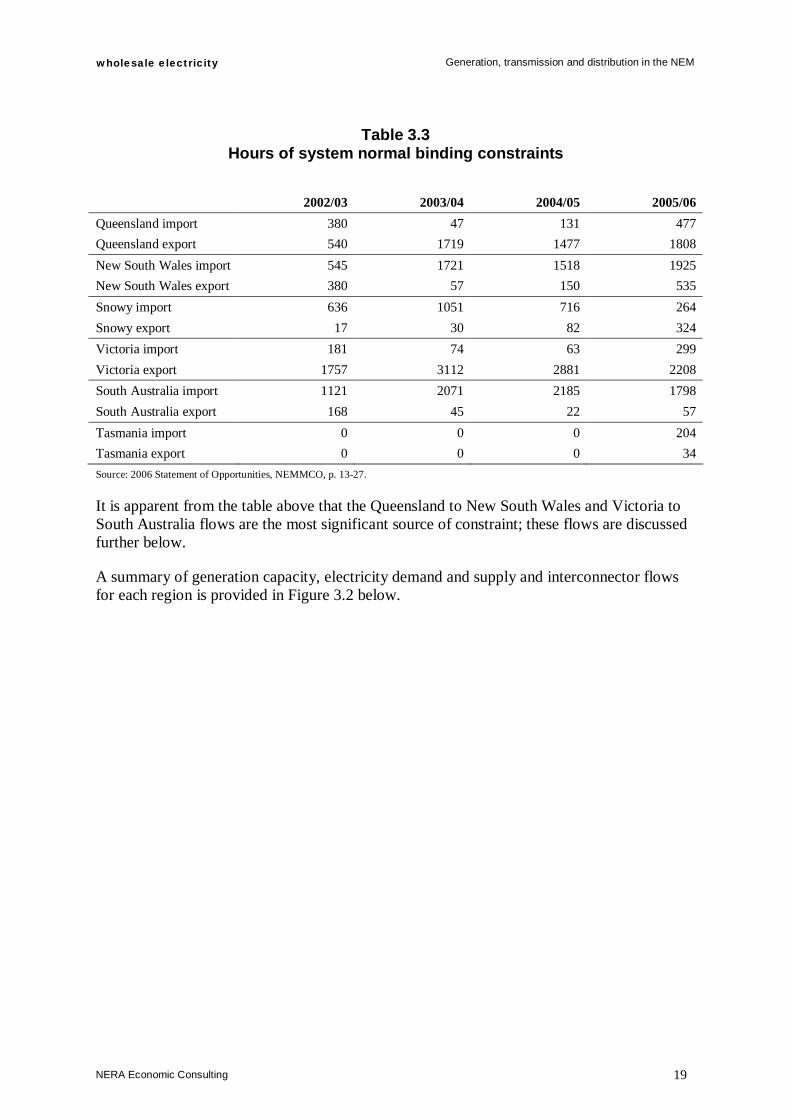
Table 3.3 Hours of system normal binding constraints
2002/03 2003/04 2004/05 2005/06 Queensland import 380 47 131 477 Queensland export 540 1719 1477 1808 New South Wales import 545 1721 1518 1925 New South Wales export 380 57 150 535 Snowy import 636 1051 716 264 Snowy export 17 30 82 324 Victoria import 181 74 63 299 Victoria export 1757 3112 2881 2208 South Australia import 1121 2071 2185 1798 South Australia export 168 45 22 57 Tasmania import 0 0 0 204 Tasmania export 0 0 0 34 Source: 2006 Statement of Opportunities, NEMMCO, p. 13-27.
It is apparent from the table above that the Queensland to New South Wales and Victoria to South Australia flows are the most significant source of constraint; these flows are discussed further below.
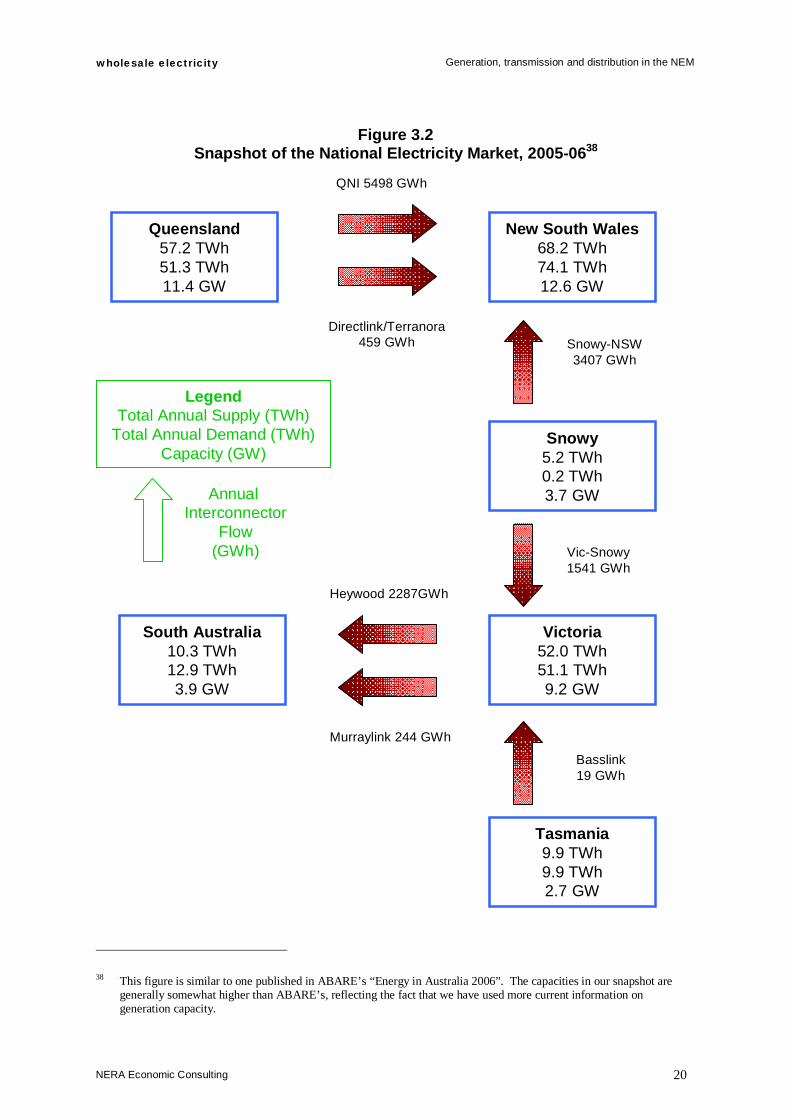
A summary of generation capacity, electricity demand and supply and interconnector flows for each region is provided in Figure 3.2 below.
wholesale electricity Generation, transmission and distribution in the NEM
NERA Economic Consulting 20
Figure 3.2 Snapshot of the National Electricity Market, 2005-0638
38 This figure is similar to one published in ABARE’s “Energy in Australia 2006”. The capacities in our snapshot are
generally somewhat higher than ABARE’s, reflecting the fact that we have used more current information on generation capacity.
LegendTotal Annual Supply (TWh)
Total Annual Demand (TWh)Capacity (GW)
Queensland57.2 TWh51.3 TWh11.4 GW
New South Wales68.2 TWh74.1 TWh12.6 GW
Snowy5.2 TWh0.2 TWh3.7 GW
Victoria52.0 TWh51.1 TWh9.2 GW
Tasmania9.9 TWh9.9 TWh2.7 GW
South Australia10.3 TWh12.9 TWh3.9 GW
QNI 5498 GWh
Directlink/Terranora459 GWh Snowy-NSW
3407 GWh
Annual Interconnector
Flow(GWh)
Basslink19 GWh
Vic-Snowy1541 GWh
Heywood 2287GWh
Murraylink 244 GWh
wholesale electricity Generation, transmission and distribution in the NEM
NERA Economic Consulting 21
3.2. New South Wales
3.2.1. Generation
There are three main generation companies in New South Wales that operate predominately coal-fired facilities located close to the main coal sources. These three companies, Macquarie Generation, Delta Electricity, and Eraring Energy are owned by the state government. Most of the electricity generated is provided by seven generators ranging in size from 600MW (Munmorah) to 2640MW (Eraring and Bayswater).
Total generation capacity in New South Wales is currently 12.6 GW, which represents 29 per cent of total NEM capacity. Almost 93 per cent of total capacity in the state is provided by black coal-fired generators which source coal from five major coalfields in the Sydney-Gunnedah Basin, which extends from the south of Wollongong to north of Newcastle and north-westerly through Narrabri into Queensland. This proximity to coal has been one of the major factors in the state’s economic development.39 It has been estimated that Australia has enough black coal to last for 200 years at current rates of production.40
The prevalence of existing coal-fired generation and a lack of appropriate water sources results in a relatively small portion of remaining capacity for hydro generation at 3.8 per cent. Currently, gas-fired generation accounts for 1.3 per cent of capacity and there is no wind based generation.41 Accordingly, in the last financial year hydro only accounted for 1.5 per cent of electricity supplied in New South Wales and gas was 0.6 per cent, while coal-fired plant supplied almost 98 per cent.42
In addition, New South Wales is a consistent importer of electricity. In the 2006 financial year approximately 8 per cent of New South Wales electricity was sourced from Queensland and 4 per cent from the Snowy region.43
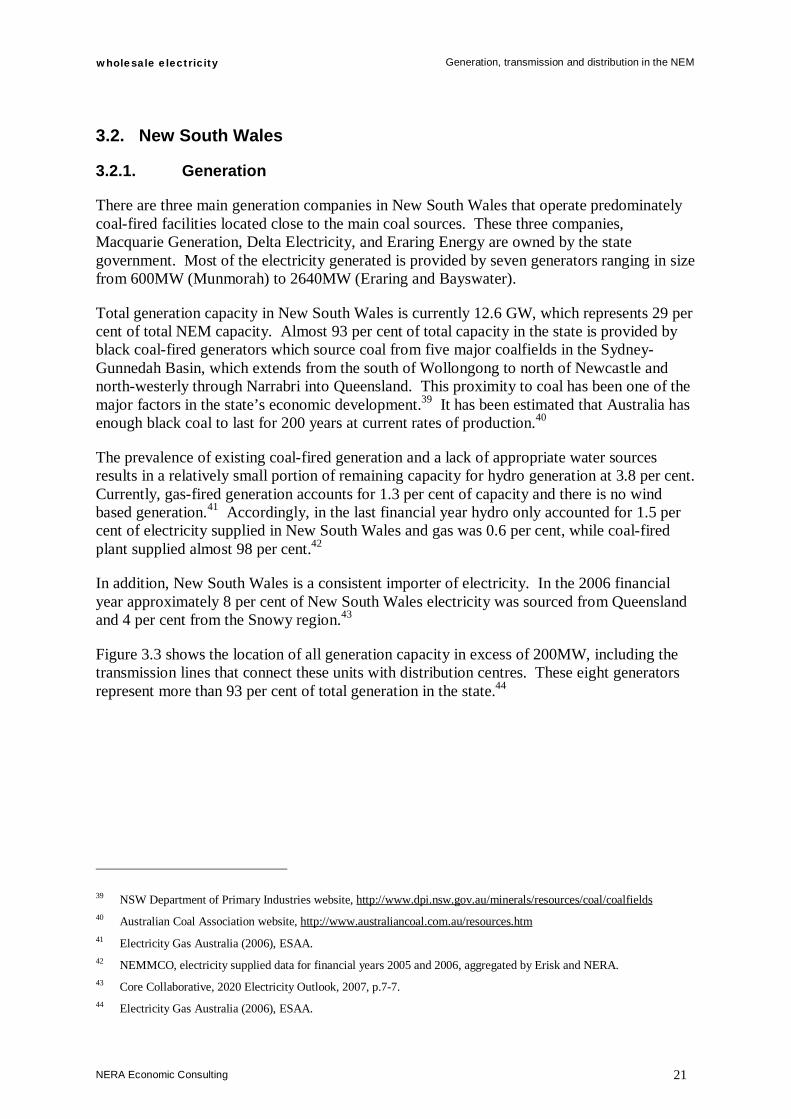
Figure 3.3 shows the location of all generation capacity in excess of 200MW, including the transmission lines that connect these units with distribution centres. These eight generators represent more than 93 per cent of total generation in the state.44
39 NSW Department of Primary Industries website, http://www.dpi.nsw.gov.au/minerals/resources/coal/coalfields 40 Australian Coal Association website, http://www.australiancoal.com.au/resources.htm 41 Electricity Gas Australia (2006), ESAA. 42 NEMMCO, electricity supplied data for financial years 2005 and 2006, aggregated by Erisk and NERA. 43 Core Collaborative, 2020 Electricity Outlook, 2007, p.7-7. 44 Electricity Gas Australia (2006), ESAA.
wholesale electricity Generation, transmission and distribution in the NEM
NERA Economic Consulting 22
Figure 3.3 Location of major generation in New South Wales
Source: RLMS, annotated by NERA.
l
l
l
l
Shoalhaven 240MWEraring EnergyPump Storage
Shoalhaven 240MWEraring EnergyPump Storage
Sydney
Canberra
Munmorah 600MWDelta Electricity
Coal
Munmorah 600MWDelta Electricity
CoalWallerang C 1000MWDelta Electricity
Coal
Wallerang C 1000MWDelta Electricity
Coal
Mt Piper 1320MWDelta Electricity
Coal
Mt Piper 1320MWDelta Electricity
Coal
Vales Point B1320MW
Delta ElectricityCoal
Vales Point B1320MW
Delta ElectricityCoal
Liddell 2000MWMacquarie Generation
Coal
Liddell 2000MWMacquarie Generation
CoalEraring 2640MWEraring Energy
Coal
Eraring 2640MWEraring Energy
Coal
Bayswater 2640MWMacquarie Generation
Coal
Bayswater 2640MWMacquarie Generation
Coal
Brisbane
Melbourne
500kV
330kV
275kV
220kV
132/110kV
66kV
Transmission Lines
500kV
330kV
275kV
220kV
132/110kV
66kV
Transmission Lines
wholesale electricity Generation, transmission and distribution in the NEM
NERA Economic Consulting 23
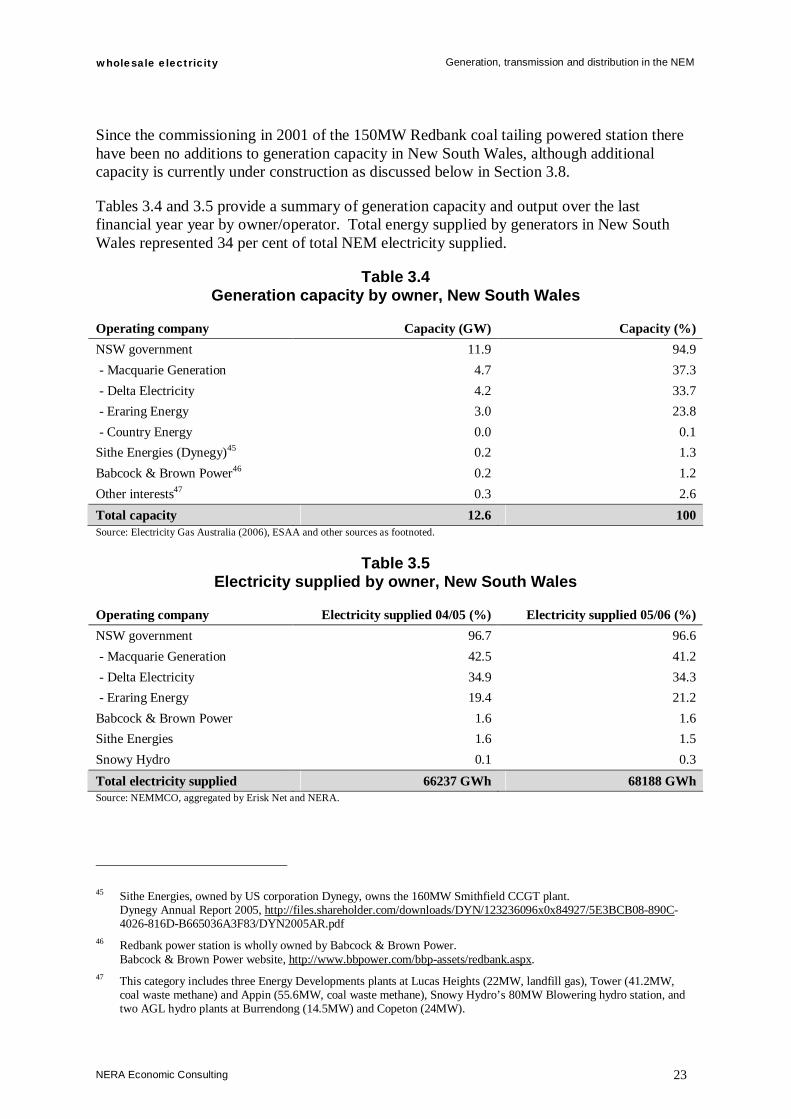
Since the commissioning in 2001 of the 150MW Redbank coal tailing powered station there have been no additions to generation capacity in New South Wales, although additional capacity is currently under construction as discussed below in Section 3.8.
Tables 3.4 and 3.5 provide a summary of generation capacity and output over the last financial year year by owner/operator. Total energy supplied by generators in New South Wales represented 34 per cent of total NEM electricity supplied.
Table 3.4 Generation capacity by owner, New South Wales
Operating company Capacity (GW) Capacity (%) NSW government 11.9 94.9 - Macquarie Generation 4.7 37.3 - Delta Electricity 4.2 33.7 - Eraring Energy 3.0 23.8 - Country Energy 0.0 0.1 Sithe Energies (Dynegy)45 0.2 1.3 Babcock & Brown Power46 0.2 1.2 Other interests47 0.3 2.6 Total capacity 12.6 100 Source: Electricity Gas Australia (2006), ESAA and other sources as footnoted.
Table 3.5 Electricity supplied by owner, New South Wales
Operating company Electricity supplied 04/05 (%) Electricity supplied 05/06 (%) NSW government 96.7 96.6 - Macquarie Generation 42.5 41.2 - Delta Electricity 34.9 34.3 - Eraring Energy 19.4 21.2 Babcock & Brown Power 1.6 1.6 Sithe Energies 1.6 1.5 Snowy Hydro 0.1 0.3 Total electricity supplied 66237 GWh 68188 GWh Source: NEMMCO, aggregated by Erisk Net and NERA.
45 Sithe Energies, owned by US corporation Dynegy, owns the 160MW Smithfield CCGT plant. Dynegy Annual Report 2005, http://files.shareholder.com/downloads/DYN/123236096x0x84927/5E3BCB08-890C-
4026-816D-B665036A3F83/DYN2005AR.pdf 46 Redbank power station is wholly owned by Babcock & Brown Power. Babcock & Brown Power website, http://www.bbpower.com/bbp-assets/redbank.aspx. 47 This category includes three Energy Developments plants at Lucas Heights (22MW, landfill gas), Tower (41.2MW,
coal waste methane) and Appin (55.6MW, coal waste methane), Snowy Hydro’s 80MW Blowering hydro station, and two AGL hydro plants at Burrendong (14.5MW) and Copeton (24MW).
wholesale electricity Generation, transmission and distribution in the NEM
NERA Economic Consulting 24
3.2.2. Transmission and distribution
The entire high voltage transmission network is owned and operated by TransGrid. TransGrid is a state-owned corporation that is responsible for the maintenance and continued upgrading required to operate the 12,000 kilometre network.48
Distribution in New South Wales is divided between three state-owned corporations: EnergyAustralia, Integral Energy, and Country Energy. EnergyAustralia operates a network of approximately 22,275 square kilometres in the Sydney, Central Coast and Hunter regions.49 Integral Energy covers, among other areas, Sydney’s Greater West, the Southern Highlands and the Illawarra, an area of some 24,500 square kilometres.50 Australia’s largest electricity network of 195,000 kilometres of powerlines is operated by Country Energy which services the remaining, predominately regional, areas of New South Wales, covering approximately 95 per cent of the state’s land mass.51
The New South Wales NEM region also encompasses the Australian Capital Territory, which does not have its own generation capacity. The distribution network in the Australian Capital Territory is owned and operated by ActewAGL, a joint venture between Actew, an Australian Capital Territory government owned corporation and formerly AGL.52
48 TransGrid website, http://www.transgrid.com.au/ 49 EnergyAustralia website, http://www.energy.com.au/energy/ea.nsf/Content/NSW+Who+is+EnergyAustralia 50 Integral Energy website,
http://www.integral.com.au/wps/wcm/connect/integralenergy/NSW/NSW+Homepage/ourNetworkNav/Our+network+area/Our+network+area.html
51 Country Energy website, http://www.countryenergy.com.au/internet/cewebpub.nsf/Content/AboutUs_cover 52 In 2006 AGL merged its infrastructure assets with Alinta and separated the AGL Energy business; however, Alinta is
currently under agreement to sell this asset to Singapore Power International and Babcock & Brown International (SPI press release 11 May 2007, AGL press release 31 October 2005 and 11 October 2006).
wholesale electricity Generation, transmission and distribution in the NEM
NERA Economic Consulting 25
3.3. Queensland
3.3.1. Generation
There are three main generation companies in Queensland that provide the majority of electricity supplied to the region. These companies, CS Energy, Tarong Energy and Stanwell Corporation, are state-owned corporations and represented approximately 20 per cent of electricity supplied to the NEM in the 2006 financial year, and 70.8 per cent of the 57 TWh of electricity supplied in Queensland.
However, the largest generator is the 1680MW Gladstone power station, which was purchased from the Queensland Government in 1994 by a joint venture comprising Rio Tinto Aluminium, three of its Japanese partners in Boyne Smelters Limited, and NRG, a US-based energy provider.53 Approximately 50 per cent of its electricity is provided to Boyne Smelters, which operates Australia’s largest aluminium smelter in Gladstone.54,55
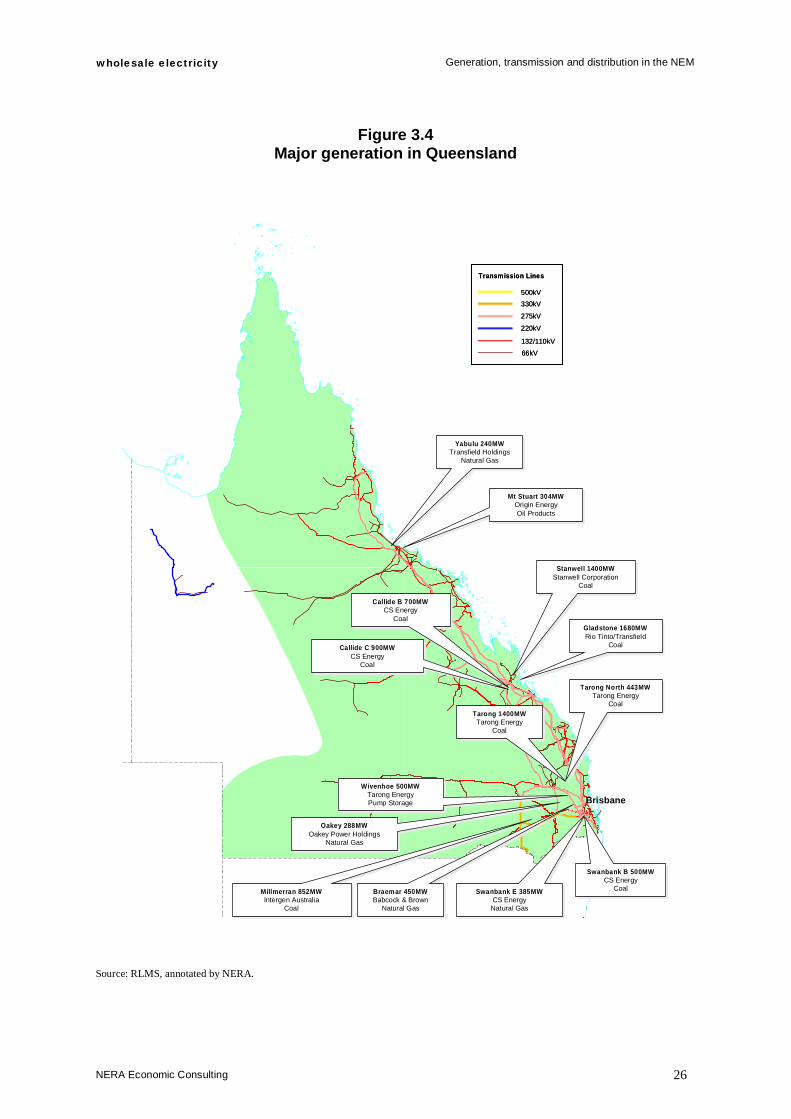
Generation in Queensland is characterised by a larger number of smaller capacity generators compared with New South Wales. Capacity for the largest fourteen generators ranges from 240 MW (Yabula) to 1680MW (Gladstone). The locations of the major generators and linking transmission lines are shown on the map in Figure 3.5 below.
Queensland is a consistent net exporter of electricity to New South Wales through its two interconnectors; in 2005/06 Queensland exported around 10 per cent of its total electricity supply.
53 Comalco website, http://www.comalco.com/freedom.aspx?pid=408. 54 Ibid. 55 Comalco website, http://www.riotintoaluminium.com/freedom.aspx?pid=224.
wholesale electricity Generation, transmission and distribution in the NEM
NERA Economic Consulting 26
Figure 3.4 Major generation in Queensland
Source: RLMS, annotated by NERA.
lBrisbane
Yabulu 240MWTransfield Holdings
Natural Gas
Yabulu 240MWTransfield Holdings
Natural Gas
Oakey 288MWOakey Power Holdings
Natural Gas
Oakey 288MWOakey Power Holdings
Natural Gas
Mt Stuart 304MWOrigin EnergyOil Products
Mt Stuart 304MWOrigin EnergyOil Products
Swanbank E 385MWCS EnergyNatural Gas
Swanbank E 385MWCS EnergyNatural Gas
Tarong North 443MWTarong Energy
Coal
Tarong North 443MWTarong Energy
Coal
Swanbank B 500MWCS Energy
Coal
Swanbank B 500MWCS Energy
Coal
Callide B 700MWCS Energy
Coal
Callide B 700MWCS Energy
Coal
Wivenhoe 500MWTarong EnergyPump Storage
Wivenhoe 500MWTarong EnergyPump Storage
Millmerran 852MWIntergen Australia
Coal
Millmerran 852MWIntergen Australia
Coal
Callide C 900MWCS Energy
Coal
Callide C 900MWCS Energy
Coal
Stanwell 1400MWStanwell Corporation
Coal
Stanwell 1400MWStanwell Corporation
Coal
Tarong 1400MWTarong Energy
Coal
Tarong 1400MWTarong Energy
Coal
Gladstone 1680MWRio Tinto/Transfield
Coal
Gladstone 1680MWRio Tinto/Transfield
Coal
Braemar 450MWBabcock & Brown
Natural Gas
Braemar 450MWBabcock & Brown
Natural Gas
500kV330kV
275kV
220kV
132/110kV
66kV
Transmission Lines
500kV330kV
275kV
220kV
132/110kV
66kV
Transmission Lines
wholesale electricity Generation, transmission and distribution in the NEM
NERA Economic Consulting 27
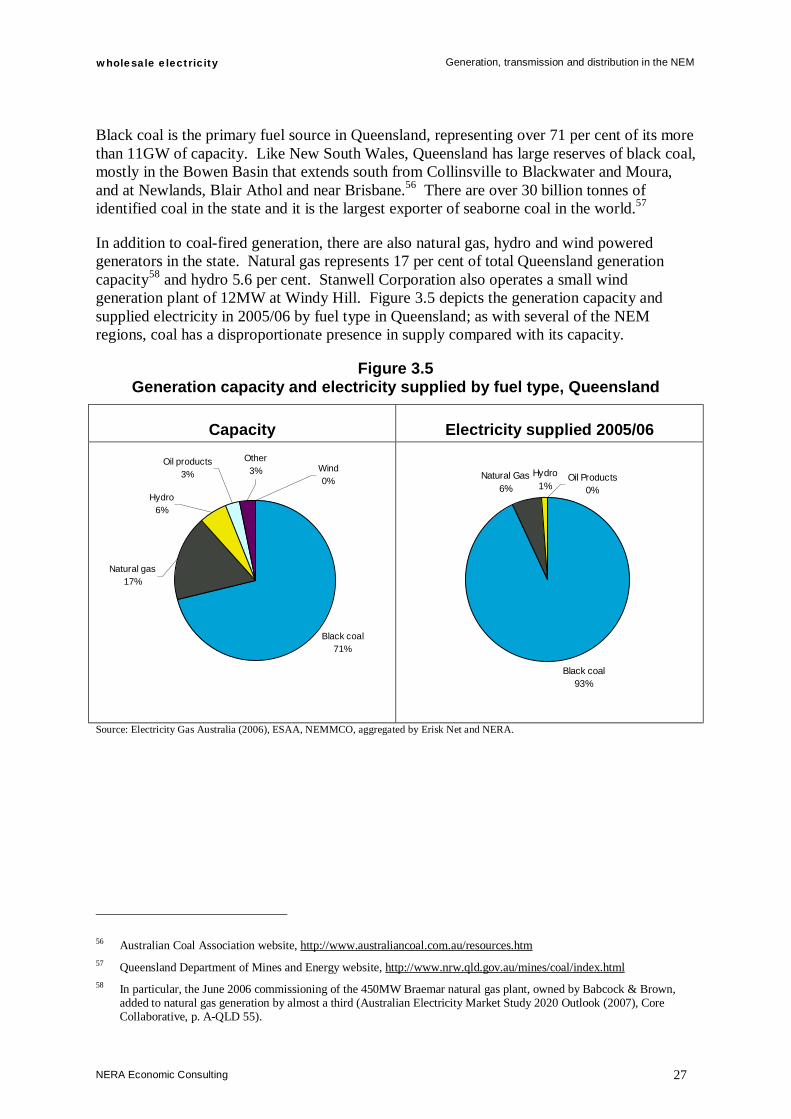
Black coal is the primary fuel source in Queensland, representing over 71 per cent of its more than 11GW of capacity. Like New South Wales, Queensland has large reserves of black coal, mostly in the Bowen Basin that extends south from Collinsville to Blackwater and Moura, and at Newlands, Blair Athol and near Brisbane.56 There are over 30 billion tonnes of identified coal in the state and it is the largest exporter of seaborne coal in the world.57
In addition to coal-fired generation, there are also natural gas, hydro and wind powered generators in the state. Natural gas represents 17 per cent of total Queensland generation capacity58 and hydro 5.6 per cent. Stanwell Corporation also operates a small wind generation plant of 12MW at Windy Hill. Figure 3.5 depicts the generation capacity and supplied electricity in 2005/06 by fuel type in Queensland; as with several of the NEM regions, coal has a disproportionate presence in supply compared with its capacity.
Figure 3.5 Generation capacity and electricity supplied by fuel type, Queensland
Capacity Electricity supplied 2005/06
Black coal71%
Hydro6%
Other3% Wind
0%
Oil products3%
Natural gas17%
Black coal93%
Natural Gas6%
Hydro1%
Oil Products0%
Source: Electricity Gas Australia (2006), ESAA, NEMMCO, aggregated by Erisk Net and NERA.
56 Australian Coal Association website, http://www.australiancoal.com.au/resources.htm 57 Queensland Department of Mines and Energy website, http://www.nrw.qld.gov.au/mines/coal/index.html 58 In particular, the June 2006 commissioning of the 450MW Braemar natural gas plant, owned by Babcock & Brown,
added to natural gas generation by almost a third (Australian Electricity Market Study 2020 Outlook (2007), Core Collaborative, p. A-QLD 55).
wholesale electricity Generation, transmission and distribution in the NEM
NERA Economic Consulting 28
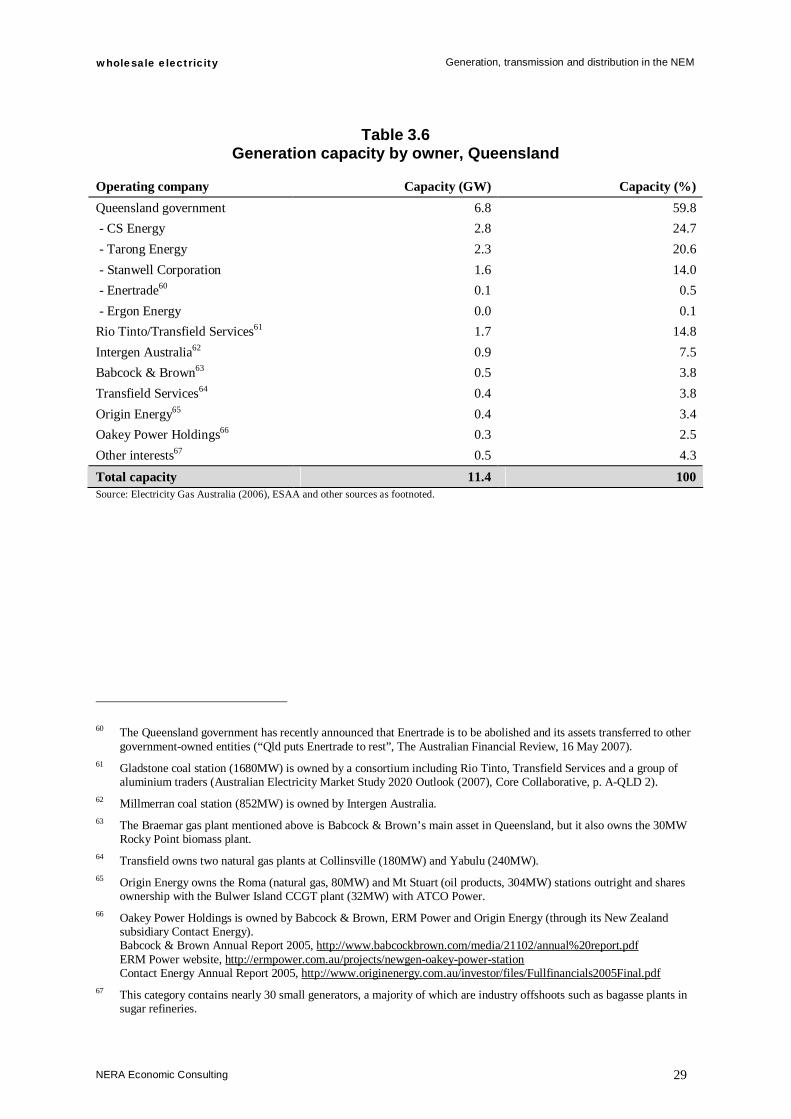
Of the total electricity generation capacity in Queensland, 60 per cent is owned and operated by state-owned entities. Of the remainder, in addition to the Gladstone plant (15 per cent of capacity), the Singapore based Intergen operates the Milmerran (852MW) plant, representing almost 8 per cent of installed capacity. The remaining generation capacity is split amongst smaller generation players such as Transfield Services and Origin Energy, with a sizeable generation capacity in industry.59
Total energy supplied by Queensland generators into the NEM for the year ending 30 June 2006 was over 57 TWh, representing 28 per cent of total NEM electricity supply. For the same period, the Queensland government-owned generators supplied over 70 per cent of dispatched energy in Queensland. Tables 3.5 and 3.6 below summarise the capacity and output of generators in Queensland by owner.
59 These are either mining operations which own some of their own generation or plants built to use the bagasse by-
product of sugar milling.
wholesale electricity Generation, transmission and distribution in the NEM
NERA Economic Consulting 29
Table 3.6 Generation capacity by owner, Queensland
Operating company Capacity (GW) Capacity (%) Queensland government 6.8 59.8 - CS Energy 2.8 24.7 - Tarong Energy 2.3 20.6 - Stanwell Corporation 1.6 14.0 - Enertrade60 0.1 0.5 - Ergon Energy 0.0 0.1 Rio Tinto/Transfield Services61 1.7 14.8 Intergen Australia62 0.9 7.5 Babcock & Brown63 0.5 3.8 Transfield Services64 0.4 3.8 Origin Energy65 0.4 3.4 Oakey Power Holdings66 0.3 2.5 Other interests67 0.5 4.3 Total capacity 11.4 100 Source: Electricity Gas Australia (2006), ESAA and other sources as footnoted.
60 The Queensland government has recently announced that Enertrade is to be abolished and its assets transferred to other
government-owned entities (“Qld puts Enertrade to rest”, The Australian Financial Review, 16 May 2007). 61 Gladstone coal station (1680MW) is owned by a consortium including Rio Tinto, Transfield Services and a group of
aluminium traders (Australian Electricity Market Study 2020 Outlook (2007), Core Collaborative, p. A-QLD 2). 62 Millmerran coal station (852MW) is owned by Intergen Australia. 63 The Braemar gas plant mentioned above is Babcock & Brown’s main asset in Queensland, but it also owns the 30MW
Rocky Point biomass plant. 64 Transfield owns two natural gas plants at Collinsville (180MW) and Yabulu (240MW). 65 Origin Energy owns the Roma (natural gas, 80MW) and Mt Stuart (oil products, 304MW) stations outright and shares
ownership with the Bulwer Island CCGT plant (32MW) with ATCO Power. 66 Oakey Power Holdings is owned by Babcock & Brown, ERM Power and Origin Energy (through its New Zealand
subsidiary Contact Energy). Babcock & Brown Annual Report 2005, http://www.babcockbrown.com/media/21102/annual%20report.pdf ERM Power website, http://ermpower.com.au/projects/newgen-oakey-power-station Contact Energy Annual Report 2005, http://www.originenergy.com.au/investor/files/Fullfinancials2005Final.pdf 67 This category contains nearly 30 small generators, a majority of which are industry offshoots such as bagasse plants in
sugar refineries.
wholesale electricity Generation, transmission and distribution in the NEM
NERA Economic Consulting 30
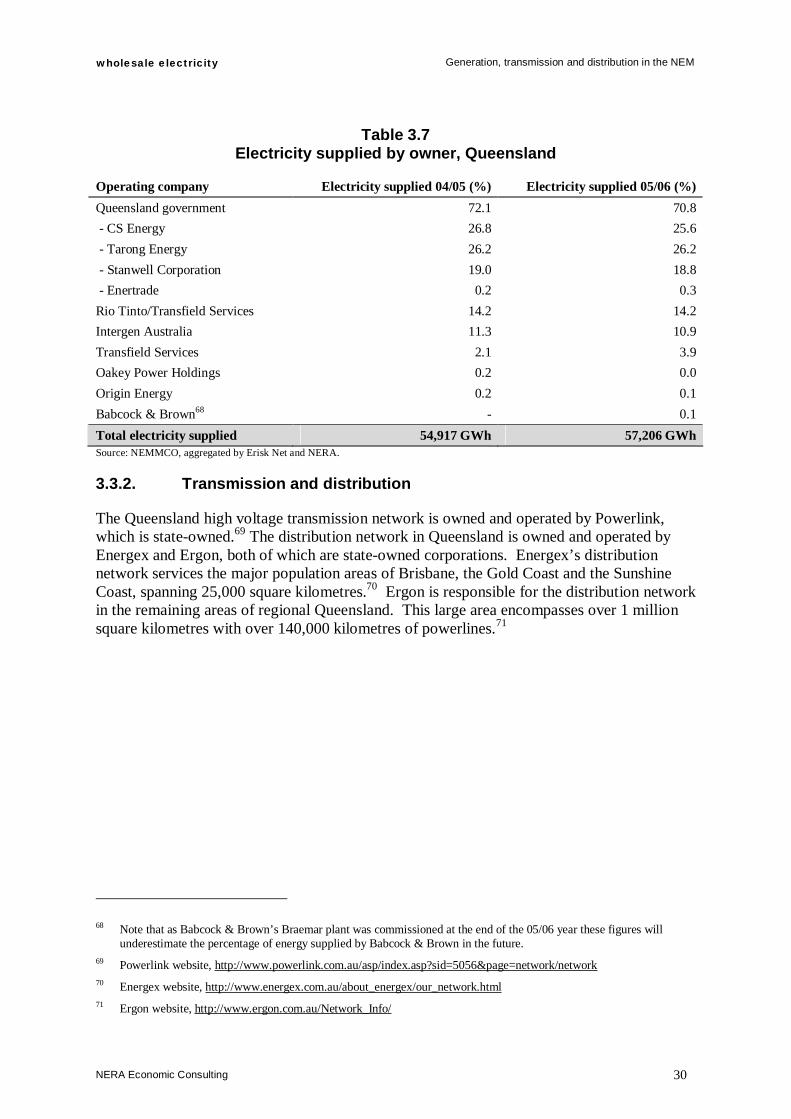
Table 3.7 Electricity supplied by owner, Queensland
Operating company Electricity supplied 04/05 (%) Electricity supplied 05/06 (%) Queensland government 72.1 70.8 - CS Energy 26.8 25.6 - Tarong Energy 26.2 26.2 - Stanwell Corporation 19.0 18.8 - Enertrade 0.2 0.3 Rio Tinto/Transfield Services 14.2 14.2 Intergen Australia 11.3 10.9 Transfield Services 2.1 3.9 Oakey Power Holdings 0.2 0.0 Origin Energy 0.2 0.1 Babcock & Brown68 - 0.1 Total electricity supplied 54,917 GWh 57,206 GWh Source: NEMMCO, aggregated by Erisk Net and NERA.
3.3.2. Transmission and distribution
The Queensland high voltage transmission network is owned and operated by Powerlink, which is state-owned.69 The distribution network in Queensland is owned and operated by Energex and Ergon, both of which are state-owned corporations. Energex’s distribution network services the major population areas of Brisbane, the Gold Coast and the Sunshine Coast, spanning 25,000 square kilometres.70 Ergon is responsible for the distribution network in the remaining areas of regional Queensland. This large area encompasses over 1 million square kilometres with over 140,000 kilometres of powerlines.71
68 Note that as Babcock & Brown’s Braemar plant was commissioned at the end of the 05/06 year these figures will
underestimate the percentage of energy supplied by Babcock & Brown in the future. 69 Powerlink website, http://www.powerlink.com.au/asp/index.asp?sid=5056&page=network/network 70 Energex website, http://www.energex.com.au/about_energex/our_network.html 71 Ergon website, http://www.ergon.com.au/Network_Info/
wholesale electricity Generation, transmission and distribution in the NEM
NERA Economic Consulting 31
3.4. South Australia72
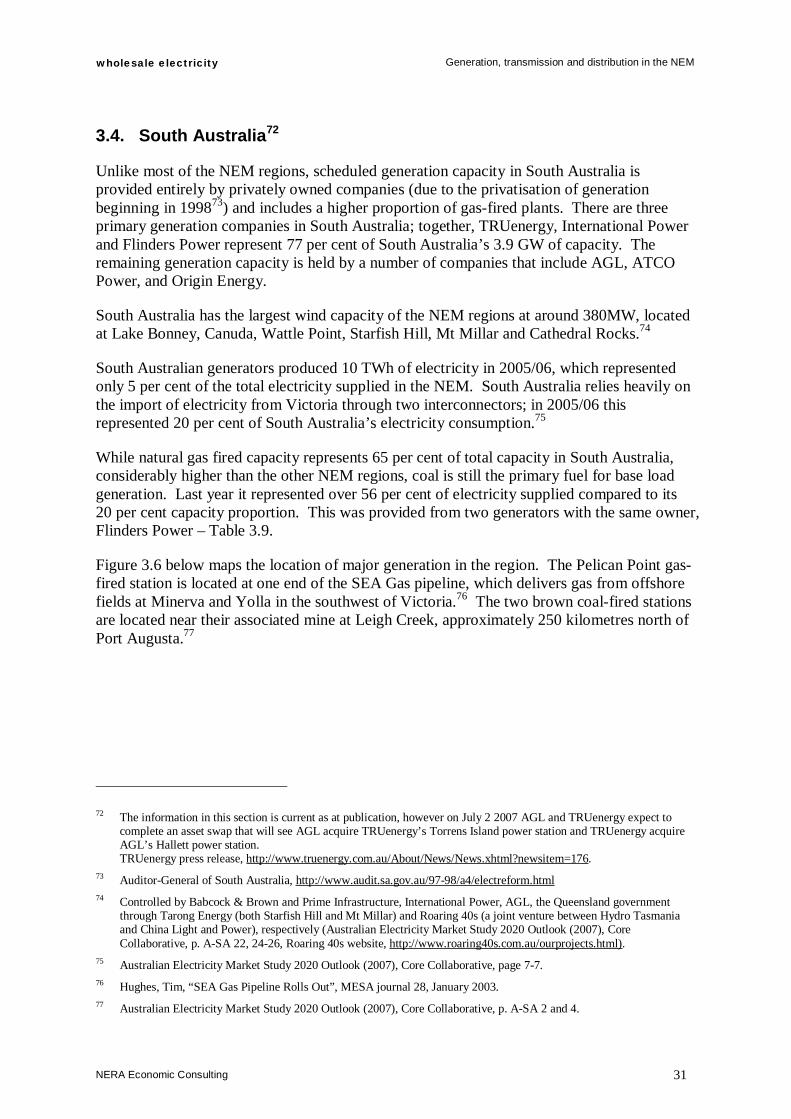
Unlike most of the NEM regions, scheduled generation capacity in South Australia is provided entirely by privately owned companies (due to the privatisation of generation beginning in 199873) and includes a higher proportion of gas-fired plants. There are three primary generation companies in South Australia; together, TRUenergy, International Power and Flinders Power represent 77 per cent of South Australia’s 3.9 GW of capacity. The remaining generation capacity is held by a number of companies that include AGL, ATCO Power, and Origin Energy.
South Australia has the largest wind capacity of the NEM regions at around 380MW, located at Lake Bonney, Canuda, Wattle Point, Starfish Hill, Mt Millar and Cathedral Rocks.74
South Australian generators produced 10 TWh of electricity in 2005/06, which represented only 5 per cent of the total electricity supplied in the NEM. South Australia relies heavily on the import of electricity from Victoria through two interconnectors; in 2005/06 this represented 20 per cent of South Australia’s electricity consumption.75
While natural gas fired capacity represents 65 per cent of total capacity in South Australia, considerably higher than the other NEM regions, coal is still the primary fuel for base load generation. Last year it represented over 56 per cent of electricity supplied compared to its 20 per cent capacity proportion. This was provided from two generators with the same owner, Flinders Power – Table 3.9.
Figure 3.6 below maps the location of major generation in the region. The Pelican Point gas-fired station is located at one end of the SEA Gas pipeline, which delivers gas from offshore fields at Minerva and Yolla in the southwest of Victoria.76 The two brown coal-fired stations are located near their associated mine at Leigh Creek, approximately 250 kilometres north of Port Augusta.77
72 The information in this section is current as at publication, however on July 2 2007 AGL and TRUenergy expect to
complete an asset swap that will see AGL acquire TRUenergy’s Torrens Island power station and TRUenergy acquire AGL’s Hallett power station.
TRUenergy press release, http://www.truenergy.com.au/About/News/News.xhtml?newsitem=176. 73 Auditor-General of South Australia, http://www.audit.sa.gov.au/97-98/a4/electreform.html 74 Controlled by Babcock & Brown and Prime Infrastructure, International Power, AGL, the Queensland government
through Tarong Energy (both Starfish Hill and Mt Millar) and Roaring 40s (a joint venture between Hydro Tasmania and China Light and Power), respectively (Australian Electricity Market Study 2020 Outlook (2007), Core Collaborative, p. A-SA 22, 24-26, Roaring 40s website, http://www.roaring40s.com.au/ourprojects.html).
75 Australian Electricity Market Study 2020 Outlook (2007), Core Collaborative, page 7-7. 76 Hughes, Tim, “SEA Gas Pipeline Rolls Out”, MESA journal 28, January 2003. 77 Australian Electricity Market Study 2020 Outlook (2007), Core Collaborative, p. A-SA 2 and 4.
wholesale electricity Generation, transmission and distribution in the NEM
NERA Economic Consulting 32
Figure 3.6 Major generation in South Australia
Source: RLMS, annotated by NERA.
l Adelaide
Thomas Playford B 240MWFlinders Power
Coal
Thomas Playford B 240MWFlinders Power
Coal
Pelican Point 478MWInternational Power Australia
Natural Gas
Pelican Point 478MWInternational Power Australia
Natural Gas
Northern 530MWFlinders Power
Coal
Northern 530MWFlinders Power
Coal
Torrens Island 1280MWTRUenergyNatural Gas
Torrens Island 1280MWTRUenergyNatural Gas
500kV
330kV
275kV
220kV
132/110kV
66kV
Transmission Lines
500kV
330kV
275kV
220kV
132/110kV
66kV
Transmission Lines
wholesale electricity Generation, transmission and distribution in the NEM
NERA Economic Consulting 33
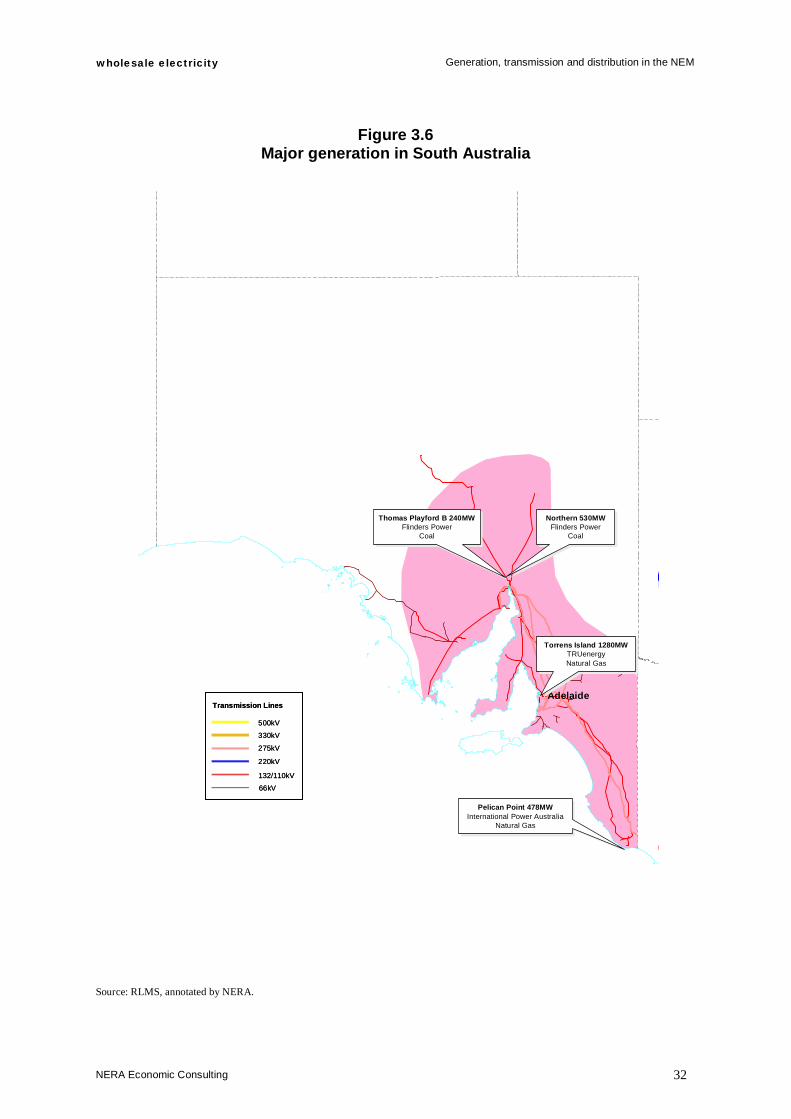
Figure 3.7 Generation capacity and electricity supplied by fuel type, South Australia
Capacity Electricity supplied 2005/06
Natural Gas64%
Coal20%
Oil Products
4%
Other2%
Wind10%
Natural Gas44%
Coal56%
Oil Products
0%
Source: Electricity Gas Australia (2006), ESAA, NEMMCO, aggregated by Erisk Net and NERA.
As mentioned, the largest electricity generators in South Australia are TRUenergy (Torrens Island 1280MW gas plant), International Power (Pelican Point 478MW gas plant and the four Synergen peaking plants) and Flinders Power with its two coal plants at Northern (530MW) and Thomas Playford B (240MW). Tarong Energy, owned by the Queensland government, operates the Starfish Hill wind farm.
The tables below summarise electricity generation capacity and output by owner.
wholesale electricity Generation, transmission and distribution in the NEM
NERA Economic Consulting 34
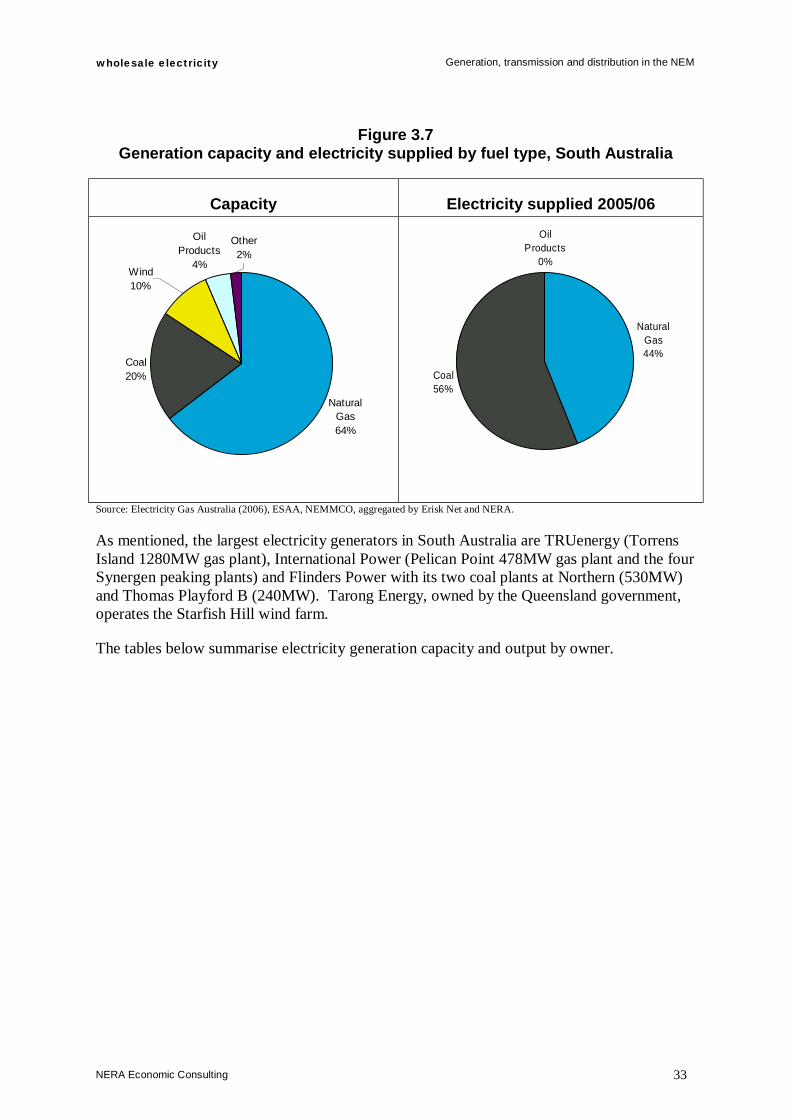
Table 3.8 Generation capacity by owner, South Australia
Owner Capacity (GW) Capacity (%) TRUenergy78 1.3 33.5 International Power Australia79 0.9 23.1 Flinders Power80 0.8 20.2 AGL81 0.3 7.2 ATCO Power and Origin Energy82 0.2 4.8 Origin Energy83 0.2 4.6 Other interests84 0.3 6.6
Total capacity 3.8 100 Source: Electricity Gas Australia (2006), ESAA and other sources as footnoted.
The disproportionate proportion of electricity sourced from coal generation carries through to supplied energy by owner, where Flinders Power supplied considerably more energy than any other entity through its ownership of all coal-fired plant in South Australia.
78 Torrens Island natural gas power station, which TRUenergy has on a 100 year lease. TRUenergy, http://www.truenergy.com.au/Production/Torrens/Index.xhtml 79 International Power owns the natural gas plant at Pelican Point (its largest station in South Australia at 478MW) and the
Canuda Wind Farm. Additionally it has a long term lease over the four Synergen plants with a total of 359MW of capacity – the Mintaro and Dry Creek natural gas plants and two oil-product-fired stations at Snuggery and Port Lincoln.
International Power website, http://www.ipplc.com.au/Page.php?iPageID=34 80 Two coal-fired stations, Northern (530MW) and Thomas Playford B (240MW). 81 AGL owns the Hallett 183MW natural gas plant and the Wattle Point wind farm. 82 ATCO and Origin each have a half share in the Osborne natural gas plant. Australian Electricity Market Study 2020 Outlook (2007), Core Collaborative, p. A-SA 12. 83 Origin owns the 84MW Ladbroke Grove and 92MW Quarantine natural gas plants. 84 This category includes a variety of small plants including Starfish Hill and Lake Bonney wind farms, oil product fired
plants owned by Cummins (20MW at Lonsdale) and Infratil (40MW at Angaston) and a landfill gas plant owned by Energy Developments (16MW at Wingfield).
wholesale electricity Generation, transmission and distribution in the NEM
NERA Economic Consulting 35
Table 3.9 Electricity supplied by owner, South Australia
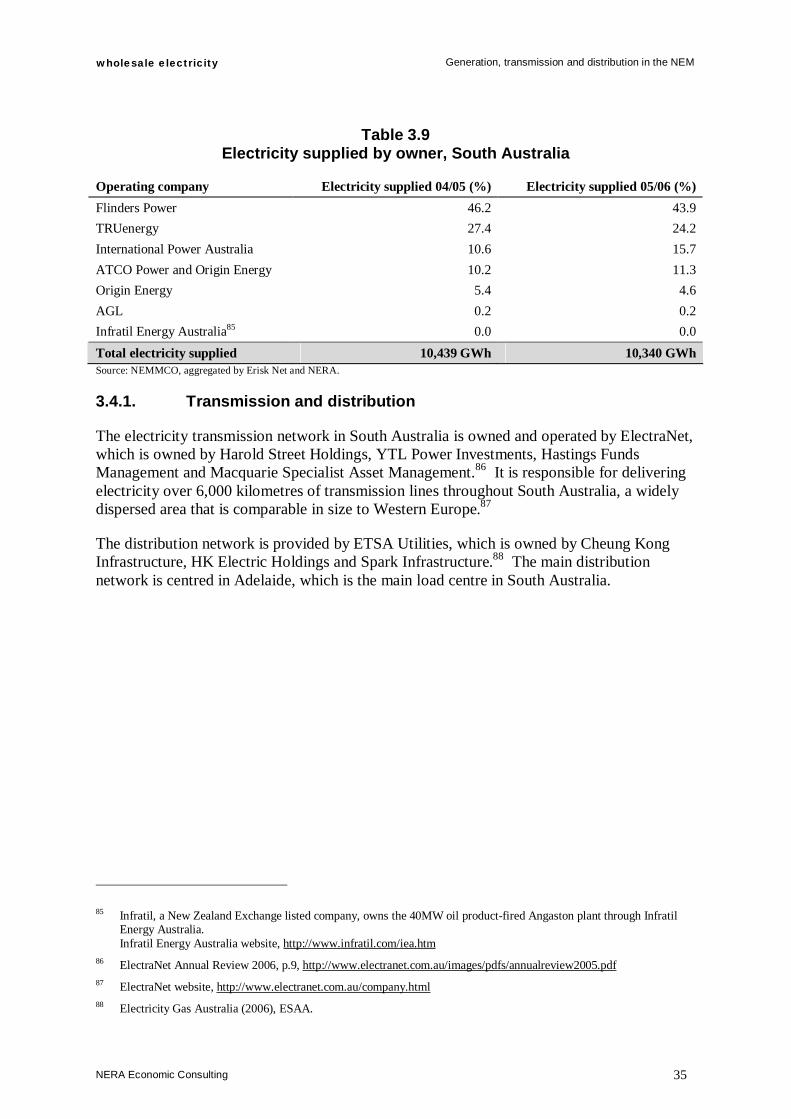
Operating company Electricity supplied 04/05 (%) Electricity supplied 05/06 (%) Flinders Power 46.2 43.9 TRUenergy 27.4 24.2 International Power Australia 10.6 15.7 ATCO Power and Origin Energy 10.2 11.3 Origin Energy 5.4 4.6 AGL 0.2 0.2 Infratil Energy Australia85 0.0 0.0 Total electricity supplied 10,439 GWh 10,340 GWh Source: NEMMCO, aggregated by Erisk Net and NERA.
3.4.1. Transmission and distribution
The electricity transmission network in South Australia is owned and operated by ElectraNet, which is owned by Harold Street Holdings, YTL Power Investments, Hastings Funds Management and Macquarie Specialist Asset Management.86 It is responsible for delivering electricity over 6,000 kilometres of transmission lines throughout South Australia, a widely dispersed area that is comparable in size to Western Europe.87
The distribution network is provided by ETSA Utilities, which is owned by Cheung Kong Infrastructure, HK Electric Holdings and Spark Infrastructure.88 The main distribution network is centred in Adelaide, which is the main load centre in South Australia.
85 Infratil, a New Zealand Exchange listed company, owns the 40MW oil product-fired Angaston plant through Infratil
Energy Australia. Infratil Energy Australia website, http://www.infratil.com/iea.htm 86 ElectraNet Annual Review 2006, p.9, http://www.electranet.com.au/images/pdfs/annualreview2005.pdf 87 ElectraNet website, http://www.electranet.com.au/company.html 88 Electricity Gas Australia (2006), ESAA.
wholesale electricity Generation, transmission and distribution in the NEM
NERA Economic Consulting 36
3.5. Snowy
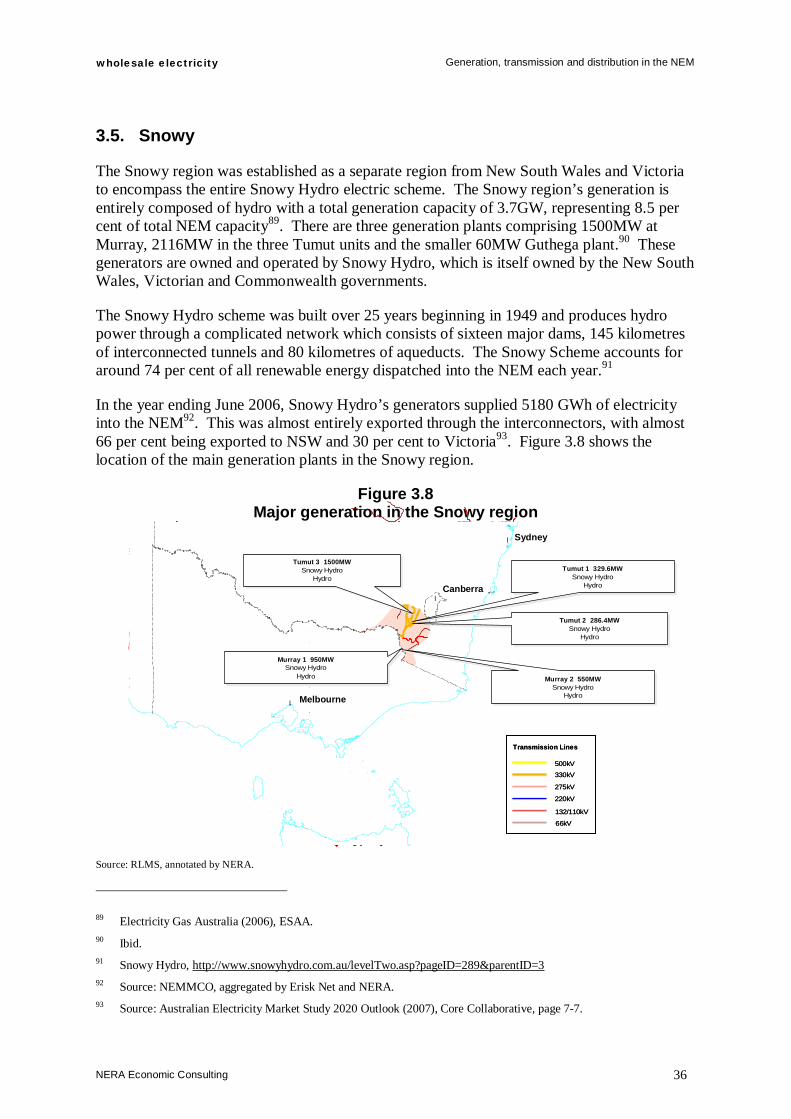
The Snowy region was established as a separate region from New South Wales and Victoria to encompass the entire Snowy Hydro electric scheme. The Snowy region’s generation is entirely composed of hydro with a total generation capacity of 3.7GW, representing 8.5 per cent of total NEM capacity89. There are three generation plants comprising 1500MW at Murray, 2116MW in the three Tumut units and the smaller 60MW Guthega plant.90 These generators are owned and operated by Snowy Hydro, which is itself owned by the New South Wales, Victorian and Commonwealth governments.
The Snowy Hydro scheme was built over 25 years beginning in 1949 and produces hydro power through a complicated network which consists of sixteen major dams, 145 kilometres of interconnected tunnels and 80 kilometres of aqueducts. The Snowy Scheme accounts for around 74 per cent of all renewable energy dispatched into the NEM each year.91
In the year ending June 2006, Snowy Hydro’s generators supplied 5180 GWh of electricity into the NEM92. This was almost entirely exported through the interconnectors, with almost 66 per cent being exported to NSW and 30 per cent to Victoria93. Figure 3.8 shows the location of the main generation plants in the Snowy region.
Figure 3.8 Major generation in the Snowy region
Source: RLMS, annotated by NERA.
89 Electricity Gas Australia (2006), ESAA. 90 Ibid. 91 Snowy Hydro, http://www.snowyhydro.com.au/levelTwo.asp?pageID=289&parentID=3 92 Source: NEMMCO, aggregated by Erisk Net and NERA. 93 Source: Australian Electricity Market Study 2020 Outlook (2007), Core Collaborative, page 7-7.
l
l
l
Sydney
Canberra
Melbourne
Tumut 3 1500MWSnowy Hydro
Hydro
Tumut 3 1500MWSnowy Hydro
HydroTumut 1 329.6MW
Snowy HydroHydro
Tumut 1 329.6MWSnowy Hydro
Hydro
Tumut 2 286.4MWSnowy Hydro
Hydro
Tumut 2 286.4MWSnowy Hydro
Hydro
Murray 1 950MWSnowy Hydro
Hydro
Murray 1 950MWSnowy Hydro
HydroMurray 2 550MW
Snowy HydroHydro
Murray 2 550MWSnowy Hydro
Hydro
500kV
330kV
275kV
220kV
132/110kV
66kV
Transmission Lines
500kV
330kV
275kV
220kV
132/110kV
66kV
Transmission Lines
wholesale electricity Generation, transmission and distribution in the NEM
NERA Economic Consulting 37
3.6. Tasmania
3.6.1. Generation
Tasmania joined the NEM on 29 May 2005 in anticipation of the completion of the Basslink interconnector in April 2006 that would allow electricity to be transferred between Tasmania and the mainland.94
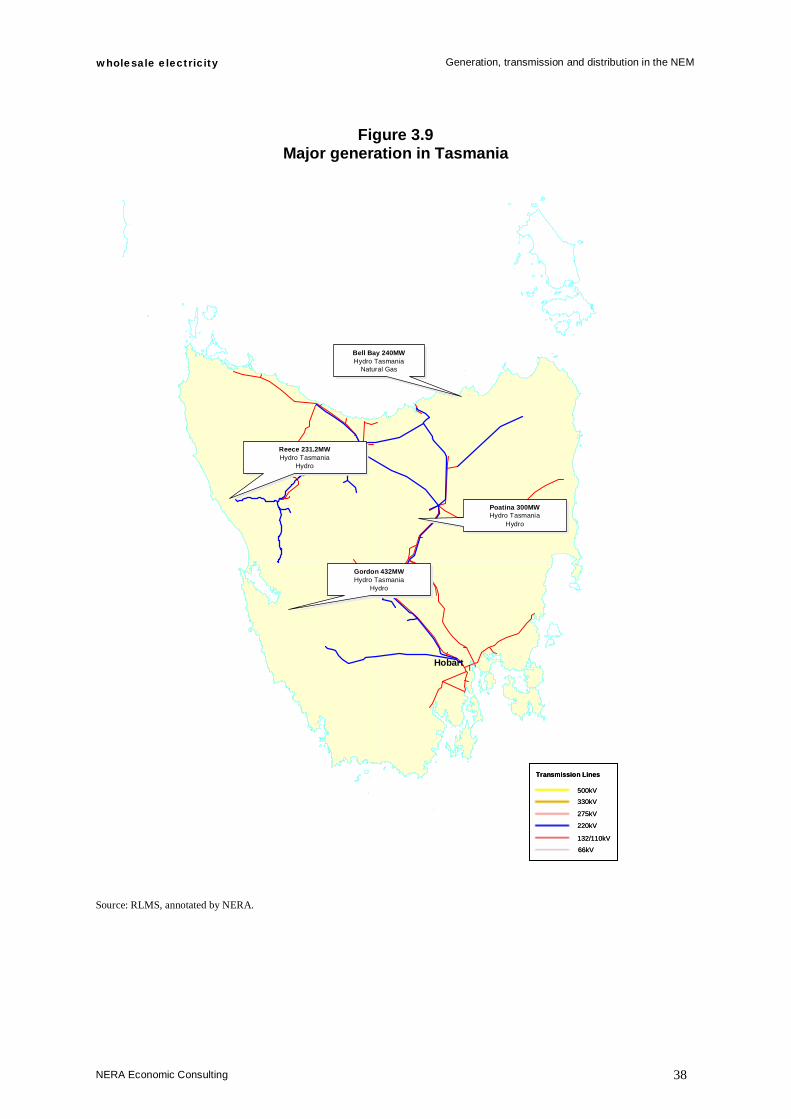
Electricity in Tasmania is provided almost entirely by Hydro Tasmania, which is state-owned. Hydro Tasmania operates thirty one hydro generators and a natural gas plant95, supplying 9.9 TWh of electricity in 2005/06. This represented 5 per cent of total NEM energy supply. Total generation capacity in Tasmania is 2.7 GW, the majority of which is represented by hydro generation at 83.2 per cent, while natural gas has a sizeable presence of over 12 per cent96.
Tasmania’s hydro generators are principally located in an integrated scheme in high rainfall areas, consisting of numerous lakes and over 50 large dams.97 Hydro generation in Tasmania has a long history, with the oldest plant, Tarraleah, having been commissioned in 1938.98 The predominance of hydro generation in Tasmania means that it has the largest portion of renewable energy in the NEM, excluding the special case of Snowy. In addition, Hydro Tasmania has interests in wind generation through its joint venture with China Light and Power, Roaring 40s, represented in Tasmania by the 64.5MW Woolnorth farm.
Of the total energy supplied by Hydro Tasmania in the 2006 financial year, the majority was from the hydro generators at over 94 per cent, with only 6 per cent of energy being sourced from the natural gas plant, which is approximately half of its capacity. Natural gas for the Bell Bay turbines is supplied via the Tasmanian Gas Pipeline, which links it to the Victorian gas fields.99
Hydro Tasmania’s major generators are located throughout Tasmania, as indicated in Figure 3.9 below.
94 Hydro Tasmania website,
http://www.hydro.com.au/home/Energy/NEM+and+Basslink/The+National+Electricity+Market.htm 95 Bell Bay Three represents three turbines added to the existing Bell Bay plant; for practical purposes they comprise one
plant. Australian Electricity Market Study 2020 Outlook (2007), Core Collaborative, p. A-TAS 38.
96 Electricity Gas Australia (2006), ESAA. 97 Hydro Tasmania website, http://www.hydro.com.au/home/Corporate/Generating_Power/ 98 Hydro Tasmania website, http://www.hydro.com.au/home/Our+Environment/Cultural+Heritage/ 99 Australian Electricity Market Study 2020 Outlook (2007), Core Collaborative, p. A-TAS 36.
wholesale electricity Generation, transmission and distribution in the NEM
NERA Economic Consulting 38
Figure 3.9 Major generation in Tasmania
Source: RLMS, annotated by NERA.
lHobart
Reece 231.2MWHydro Tasmania
Hydro
Reece 231.2MWHydro Tasmania
Hydro
Bell Bay 240MWHydro Tasmania
Natural Gas
Bell Bay 240MWHydro Tasmania
Natural Gas
Poatina 300MWHydro Tasmania
Hydro
Poatina 300MWHydro Tasmania
Hydro
Gordon 432MWHydro Tasmania
Hydro
Gordon 432MWHydro Tasmania
Hydro
500kV
330kV
275kV
220kV
132/110kV
66kV
Transmission Lines
500kV
330kV
275kV
220kV
132/110kV
66kV
Transmission Lines
wholesale electricity Generation, transmission and distribution in the NEM
NERA Economic Consulting 39
3.6.2. Transmission and distribution
The electricity transmission network in Tasmania is operated by Transend, a state-owned corporation that operates a network of 3,500 kilometres of transmission lines.100 Aurora Energy is the distribution network service provider in Tasmania and is also state-owned. It provides distribution services to approximately 260,000 customers throughout Tasmania.101
The integration of Tasmania into the NEM has been achieved through the construction of the Basslink interconnector, connecting Tasmania with Victoria. The Basslink interconnector is a DC interconnector, with a capacity of 600MW into Victoria and 300MW from Victoria and has been in operation since April 2006.102 The available flow data does not conclusively suggest whether Tasmania will tend to be a net importer or exporter of electricity although it was a small net exporter of 19 GWh for the period April-June 2006.103
100 Transend website, http://www.transend.com.au/ 101 Aurora Energy Annual Report 2006,
http://www.auroraenergy.com.au/pdf/about_aurora/annual_report_0506/year_in_review.pdf 102 Australian Electricity Market Study 2020 Outlook (2007), Core Collaborative, p. 7-7. 103 Ibid.
wholesale electricity Generation, transmission and distribution in the NEM
NERA Economic Consulting 40
3.7. Victoria
3.7.1. Generation
Generation in Victoria is characterised by large coal-fired facilities located in the Latrobe Valley, adjacent to large reserves of brown coal. The majority of accessible reserves are located in this area and the nearby Gippsland Basin.104 These supplies are estimated to be sufficient to supply Victoria for 500 years.105 Coal represents 71 per cent of capacity in the region, which is currently 9.2 GW or 21 per cent of NEM capacity. Natural gas is the second largest generation type, representing 20.5 per cent of total Victorian generation capacity. The four largest generation plants represent 67 per cent of total capacity and facilities range in size from 2120MW (Loy Yang A) to 1000MW (Loy Yang B).
Victoria is characterised by a relatively large number of private generation companies. There are five companies that each control over 10 per cent of total generation capacity in Victoria, producing in excess of 49 TWh of electricity in 2005/06. This represented 24 per cent of total NEM electricity supplied in 2005/06.
Hydro accounts for 6 per cent of Victoria’s capacity, and 103.7MW of wind capacity or 1 per cent of total capacity is provided by four wind farms at Codrington, Challicum Hills, Toora and Wonthaggi.
Figure 3.10 shows the location of all generation capacity in excess of 200MW in the Victorian NEM region. These eight generators represent 85 per cent of total generation capacity located in Victoria.
104 Victoria Department of Primary Industries, Mineral Notes: Brown Coal, updated April 2007. 105 Australian Coal Association website, http://www.australiancoal.com.au/resources.htm
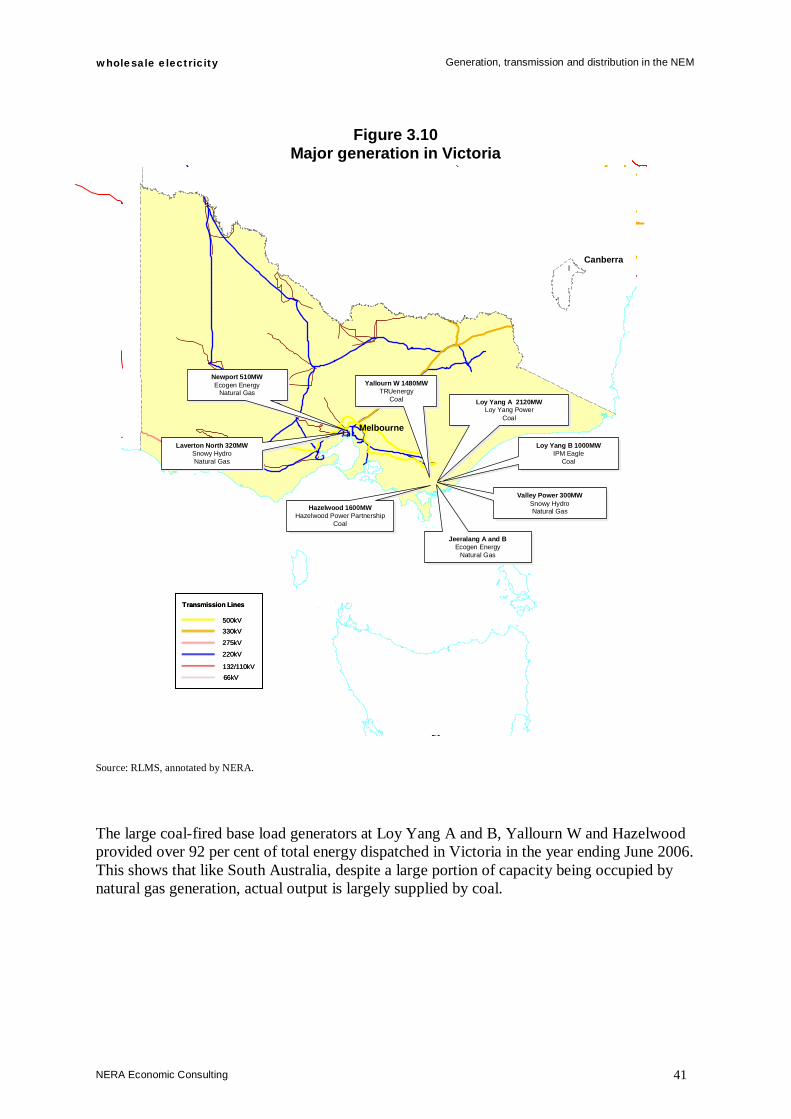
wholesale electricity Generation, transmission and distribution in the NEM
NERA Economic Consulting 41
Figure 3.10 Major generation in Victoria
Source: RLMS, annotated by NERA.
The large coal-fired base load generators at Loy Yang A and B, Yallourn W and Hazelwood provided over 92 per cent of total energy dispatched in Victoria in the year ending June 2006. This shows that like South Australia, despite a large portion of capacity being occupied by natural gas generation, actual output is largely supplied by coal.
l
l
Melbourne
Canberra
Valley Power 300MWSnowy HydroNatural Gas
Valley Power 300MWSnowy HydroNatural Gas
Jeeralang A and BEcogen Energy
Natural Gas
Jeeralang A and BEcogen Energy
Natural Gas
Newport 510MWEcogen Energy
Natural Gas
Newport 510MWEcogen Energy
Natural Gas
Loy Yang B 1000MWIPM Eagle
Coal
Loy Yang B 1000MWIPM Eagle
Coal
Yallourn W 1480MWTRUenergy
Coal
Yallourn W 1480MWTRUenergy
Coal
Hazelwood 1600MWHazelwood Power Partnership
Coal
Hazelwood 1600MWHazelwood Power Partnership
Coal
Loy Yang A 2120MWLoy Yang Power
Coal
Loy Yang A 2120MWLoy Yang Power
Coal
Laverton North 320MWSnowy HydroNatural Gas
Laverton North 320MWSnowy HydroNatural Gas
500kV330kV
275kV
220kV
132/110kV66kV
Transmission Lines
500kV330kV
275kV
220kV
132/110kV66kV
Transmission Lines
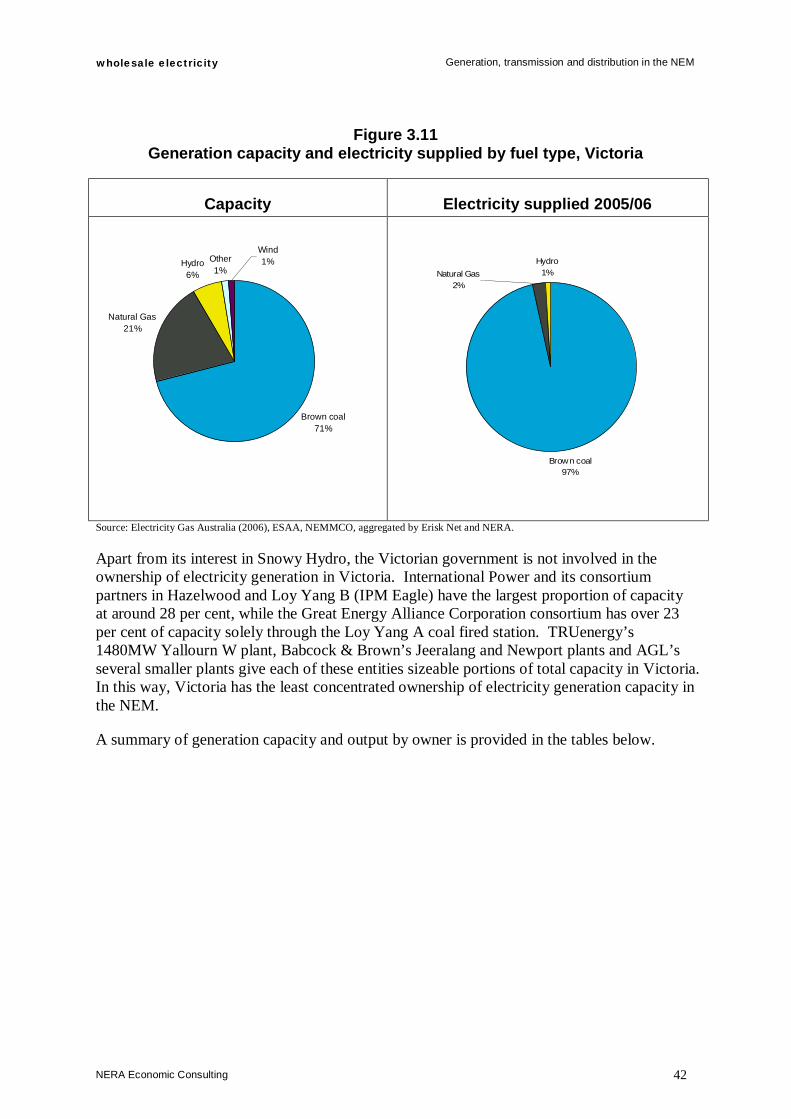
wholesale electricity Generation, transmission and distribution in the NEM
NERA Economic Consulting 42
Figure 3.11 Generation capacity and electricity supplied by fuel type, Victoria
Capacity Electricity supplied 2005/06
Brown coal71%
Natural Gas21%
Hydro6%
Other1%
Wind1%
Brown coal97%
Hydro1%Natural Gas
2%
Source: Electricity Gas Australia (2006), ESAA, NEMMCO, aggregated by Erisk Net and NERA.
Apart from its interest in Snowy Hydro, the Victorian government is not involved in the ownership of electricity generation in Victoria. International Power and its consortium partners in Hazelwood and Loy Yang B (IPM Eagle) have the largest proportion of capacity at around 28 per cent, while the Great Energy Alliance Corporation consortium has over 23 per cent of capacity solely through the Loy Yang A coal fired station. TRUenergy’s 1480MW Yallourn W plant, Babcock & Brown’s Jeeralang and Newport plants and AGL’s several smaller plants give each of these entities sizeable portions of total capacity in Victoria. In this way, Victoria has the least concentrated ownership of electricity generation capacity in the NEM.
A summary of generation capacity and output by owner is provided in the tables below.
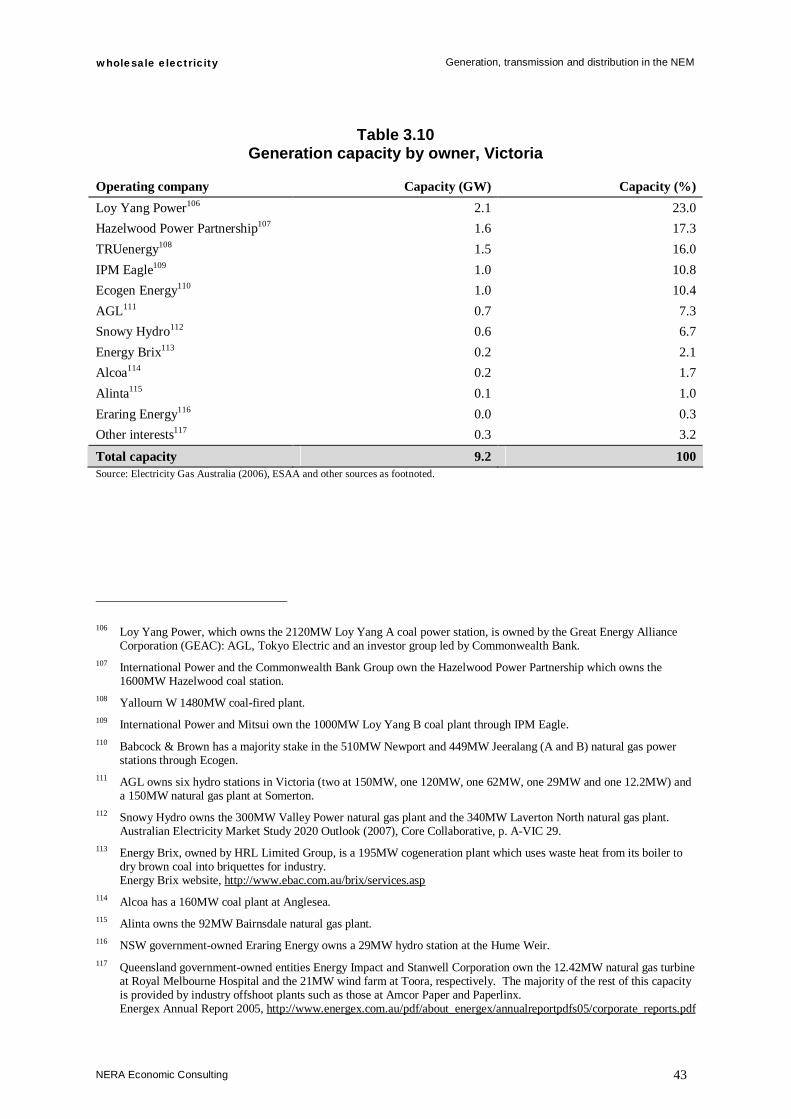
wholesale electricity Generation, transmission and distribution in the NEM
NERA Economic Consulting 43
Table 3.10 Generation capacity by owner, Victoria
Operating company Capacity (GW) Capacity (%) Loy Yang Power106 2.1 23.0 Hazelwood Power Partnership107 1.6 17.3 TRUenergy108 1.5 16.0 IPM Eagle109 1.0 10.8 Ecogen Energy110 1.0 10.4 AGL111 0.7 7.3 Snowy Hydro112 0.6 6.7 Energy Brix113 0.2 2.1 Alcoa114 0.2 1.7 Alinta115 0.1 1.0 Eraring Energy116 0.0 0.3 Other interests117 0.3 3.2
Total capacity 9.2 100 Source: Electricity Gas Australia (2006), ESAA and other sources as footnoted.
106 Loy Yang Power, which owns the 2120MW Loy Yang A coal power station, is owned by the Great Energy Alliance
Corporation (GEAC): AGL, Tokyo Electric and an investor group led by Commonwealth Bank. 107 International Power and the Commonwealth Bank Group own the Hazelwood Power Partnership which owns the
1600MW Hazelwood coal station. 108 Yallourn W 1480MW coal-fired plant. 109 International Power and Mitsui own the 1000MW Loy Yang B coal plant through IPM Eagle. 110 Babcock & Brown has a majority stake in the 510MW Newport and 449MW Jeeralang (A and B) natural gas power
stations through Ecogen. 111 AGL owns six hydro stations in Victoria (two at 150MW, one 120MW, one 62MW, one 29MW and one 12.2MW) and
a 150MW natural gas plant at Somerton. 112 Snowy Hydro owns the 300MW Valley Power natural gas plant and the 340MW Laverton North natural gas plant. Australian Electricity Market Study 2020 Outlook (2007), Core Collaborative, p. A-VIC 29. 113 Energy Brix, owned by HRL Limited Group, is a 195MW cogeneration plant which uses waste heat from its boiler to
dry brown coal into briquettes for industry. Energy Brix website, http://www.ebac.com.au/brix/services.asp 114 Alcoa has a 160MW coal plant at Anglesea. 115 Alinta owns the 92MW Bairnsdale natural gas plant. 116 NSW government-owned Eraring Energy owns a 29MW hydro station at the Hume Weir. 117 Queensland government-owned entities Energy Impact and Stanwell Corporation own the 12.42MW natural gas turbine
at Royal Melbourne Hospital and the 21MW wind farm at Toora, respectively. The majority of the rest of this capacity is provided by industry offshoot plants such as those at Amcor Paper and Paperlinx.
Energex Annual Report 2005, http://www.energex.com.au/pdf/about_energex/annualreportpdfs05/corporate_reports.pdf
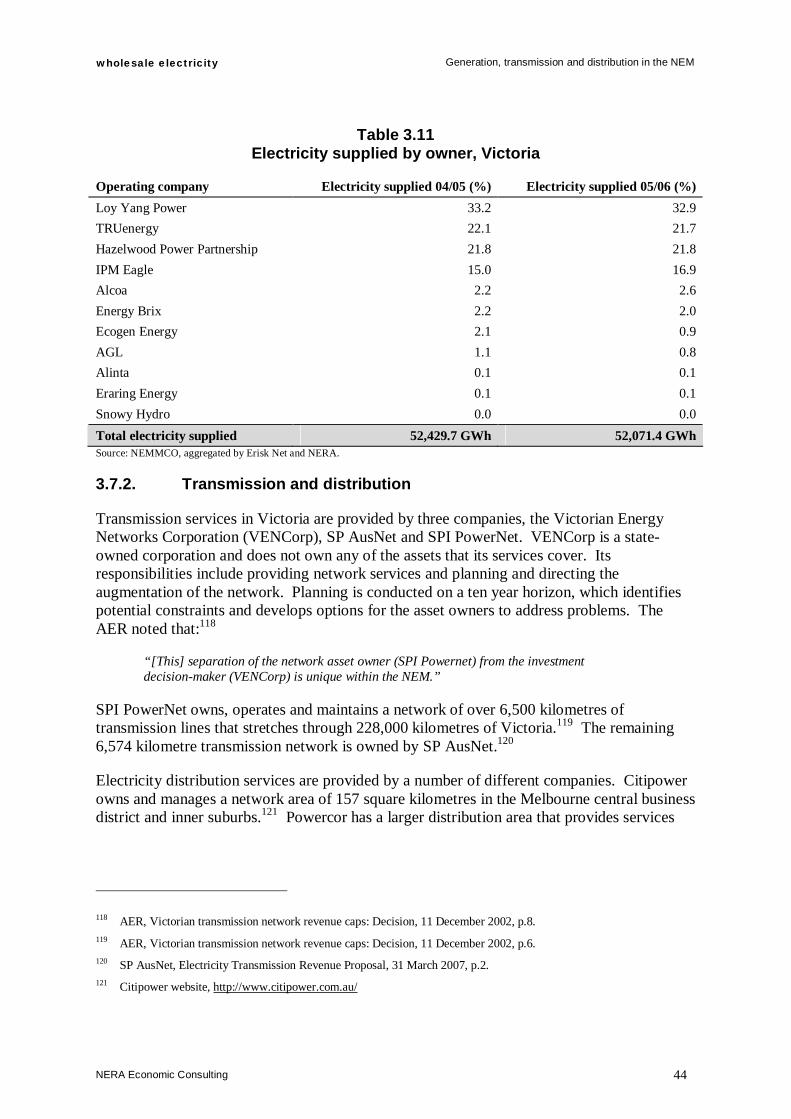
wholesale electricity Generation, transmission and distribution in the NEM
NERA Economic Consulting 44
Table 3.11 Electricity supplied by owner, Victoria
Operating company Electricity supplied 04/05 (%) Electricity supplied 05/06 (%) Loy Yang Power 33.2 32.9 TRUenergy 22.1 21.7 Hazelwood Power Partnership 21.8 21.8 IPM Eagle 15.0 16.9 Alcoa 2.2 2.6 Energy Brix 2.2 2.0 Ecogen Energy 2.1 0.9 AGL 1.1 0.8 Alinta 0.1 0.1 Eraring Energy 0.1 0.1 Snowy Hydro 0.0 0.0 Total electricity supplied 52,429.7 GWh 52,071.4 GWh Source: NEMMCO, aggregated by Erisk Net and NERA.
3.7.2. Transmission and distribution
Transmission services in Victoria are provided by three companies, the Victorian Energy Networks Corporation (VENCorp), SP AusNet and SPI PowerNet. VENCorp is a state-owned corporation and does not own any of the assets that its services cover. Its responsibilities include providing network services and planning and directing the augmentation of the network. Planning is conducted on a ten year horizon, which identifies potential constraints and develops options for the asset owners to address problems. The AER noted that:118
“[This] separation of the network asset owner (SPI Powernet) from the investment decision-maker (VENCorp) is unique within the NEM.”
SPI PowerNet owns, operates and maintains a network of over 6,500 kilometres of transmission lines that stretches through 228,000 kilometres of Victoria.119 The remaining 6,574 kilometre transmission network is owned by SP AusNet.120
Electricity distribution services are provided by a number of different companies. Citipower owns and manages a network area of 157 square kilometres in the Melbourne central business district and inner suburbs.121 Powercor has a larger distribution area that provides services
118 AER, Victorian transmission network revenue caps: Decision, 11 December 2002, p.8. 119 AER, Victorian transmission network revenue caps: Decision, 11 December 2002, p.6. 120 SP AusNet, Electricity Transmission Revenue Proposal, 31 March 2007, p.2. 121 Citipower website, http://www.citipower.com.au/
wholesale electricity Generation, transmission and distribution in the NEM
NERA Economic Consulting 45
across 65 per cent of Victoria.122 However, both entities are owned by the same group of companies.123
United Energy Distribution services the south-east of Melbourne and the Mornington Peninsula with 12,600 kilometres of lines over approximately 1,450 square kilometres of land.124,125 SP AusNet also provides distribution services. Their network stretches more than 80,000 square kilometres in eastern Victoria.126
In the north west of greater Melbourne Alinta provides electricity distribution services, though until late 2006 the network was owned by AGL. Approximately 285,000 homes and businesses receive electricity through a network of approximately 10,285 kilometres of lines.127 Alinta also holds a 34 per cent interest in the United Energy Distribution network and provides operation and management to that network through its subsidiary Alinta Asset Management.128,129
Victoria is connected to the surrounding NEM regions via four interconnectors. In the 2006 financial year, Victoria was a net exporter of electricity to South Australia and a net importer from the Snowy region, resulting in a net export of approximately 1.4 per cent of Victoria’s supplied energy.
3.8. Proposed generation investments
ABARE provides an indication of proposed generator investments for each of the NEM regions.130 These indicate that over 15,200 MW of generation capacity is currently proposed in the NEM over the period to 2013. This represents an additional 35 per cent increase in capacity compared with current operating generator capacity.
Significant developments expected to be completed in the near future include an upgrade to the Mt Piper coal power station by Delta Electricity (1680 MW), and construction of the Mortlake CCGT power station in Victoria and the Spring Gully CCGT power station in Queensland by Origin Energy (both 1000 MW).131 TRUenergy’s Tallawarra 400MW CCGT plant is expected to be operational in NSW in 2008, 132 while CS Energy expects its Kogan
122 Powercor website, Australia http://www.powercor.com.au/infocentre/fs_electricity.html 123 Energy Gas Australia (2006), ESAA. 124 United Energy, ASX Release, “United Energy Obtains Court Approval of Scheme of Arrangement”, 15 July 2003. 125 United Energy Distribution website, http://www.ue.com.au/industry/distributionMap.htm. 126 SP AusNet website, http://www.sp-ausnet.com.au/CA256FE40020993B/page/Distribution?OpenDocument&1=100-
Distribution~&2=~&3=~ 127 Alinta website, http://www.alinta.net.au/operations/distribution/alintaVICElecNetworks/ 128 Alinta website, http://www.alinta.net.au/operations/distribution/unitedEnergyDistribution/ 129 Alinta is currently under agreement to sell these interests to Singapore Power International and Babcock & Brown
International (SPI press release 11 May 2007, AGL press release 31 October 2005 and 11 October 2006) 130 ABARE (2006), Energy in Australia 2006, p. 53 to 54. 131 Ibid. 132 Australian Electricity Market Study 2020 Outlook (2007), Core Collaborative, p. A-NSW 26.
wholesale electricity Generation, transmission and distribution in the NEM
NERA Economic Consulting 46
Creek 750MW coal plant near Chinchilla in South West Queensland to be operational in November 2007.133
The most significant wind project under construction is the Pacific Hydro 195MW Portland Wind Project in Victoria, expected to be completed by 2008.134
133 Australian Electricity Market Study 2020 Outlook (2007), Core Collaborative, p. A-QLD 56. 134 Pacific Hydro, http://www.pacifichydro.com.au/Default.aspx?tabid=134.
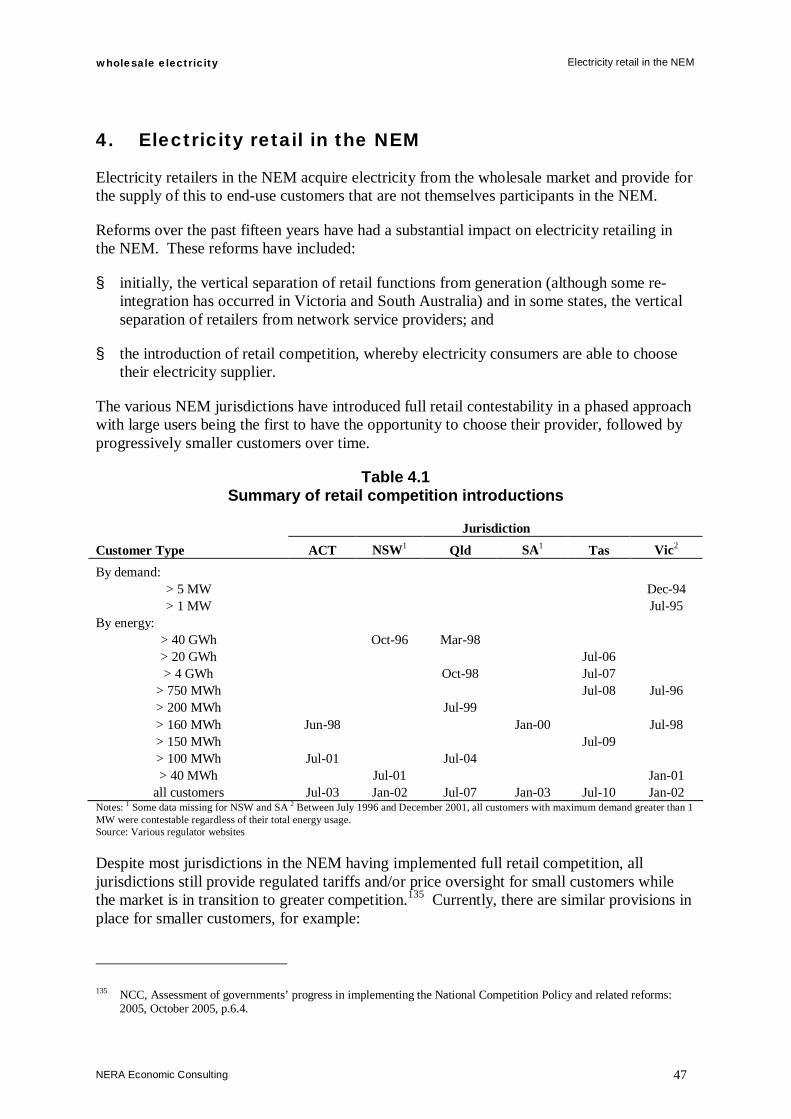
wholesale electricity Electricity retail in the NEM
NERA Economic Consulting 47
4. Electricity retail in the NEM
Electricity retailers in the NEM acquire electricity from the wholesale market and provide for the supply of this to end-use customers that are not themselves participants in the NEM.
Reforms over the past fifteen years have had a substantial impact on electricity retailing in the NEM. These reforms have included:
§ initially, the vertical separation of retail functions from generation (although some re-integration has occurred in Victoria and South Australia) and in some states, the vertical separation of retailers from network service providers; and
§ the introduction of retail competition, whereby electricity consumers are able to choose their electricity supplier.
The various NEM jurisdictions have introduced full retail contestability in a phased approach with large users being the first to have the opportunity to choose their provider, followed by progressively smaller customers over time.
Table 4.1 Summary of retail competition introductions
Jurisdiction Customer Type ACT NSW1 Qld SA1 Tas Vic2 By demand:
> 5 MW Dec-94 > 1 MW Jul-95
By energy: > 40 GWh Oct-96 Mar-98 > 20 GWh Jul-06 > 4 GWh Oct-98 Jul-07
> 750 MWh Jul-08 Jul-96 > 200 MWh Jul-99 > 160 MWh Jun-98 Jan-00 Jul-98 > 150 MWh Jul-09 > 100 MWh Jul-01 Jul-04 > 40 MWh Jul-01 Jan-01
all customers Jul-03 Jan-02 Jul-07 Jan-03 Jul-10 Jan-02 Notes: 1 Some data missing for NSW and SA 2 Between July 1996 and December 2001, all customers with maximum demand greater than 1 MW were contestable regardless of their total energy usage. Source: Various regulator websites
Despite most jurisdictions in the NEM having implemented full retail competition, all jurisdictions still provide regulated tariffs and/or price oversight for small customers while the market is in transition to greater competition.135 Currently, there are similar provisions in place for smaller customers, for example:
135 NCC, Assessment of governments’ progress in implementing the National Competition Policy and related reforms:
2005, October 2005, p.6.4.
wholesale electricity Electricity retail in the NEM
NERA Economic Consulting 48
§ ESCOSA regulates a standing contract (price, terms and conditions) that the incumbent, AGL, must offer customers consuming below 160MWh a year;136
§ IPART also regulates the prices for small consumers of less than 160 MWh per year offered by the three incumbent providers, Country Energy, EnergyAustralia and Integral Energy;137 and
§ ESC has reserve powers to regulate prices of electricity for those consuming less than 160 MWh per year.138
Under new principles established by a COAG agreement, announced 10 February 2006, states are to phase out all forms of energy retail price regulation where effective competition is in place.139 The AEMC’s reviews of the effectiveness of retail gas and electricity competition will inform this decision.
The remainder of this section sets out:
§ the cost structure faced by retailers;
§ the retail market operators operating in each jurisdiction; and
§ the retail market structure prevailing in each jurisdiction.
4.1. Costs faced by retailers
The principal costs incurred by retailers are associated with:
§ purchasing electricity from the wholesale market;
§ network fees relating to the transport of electricity to end-use customers;
§ jurisdictional licensing fees and NEMMCO participant fees; and
§ operating costs, such as those for customer support systems, marketing, etc.
The cost associated with purchasing electricity from the wholesale market includes the risk premium required for retailers to hedge against adverse movements in electricity prices. Typically such hedging will be achieved by contracting directly with generators or through an intermediary – see section 5 for a discussion of the instruments used in these transactions. The purchasing costs incurred by a retailer also include energy losses sustained in transport to end-use customers.
Several government initiatives targeted at the reduction of greenhouse gas emissions have an effect on the energy costs faced by a retailer. For example: 136 ESCOSA website, http://www.escosa.sa.gov.au/site/page.cfm?u=172 137 IPART website, http://www.ipart.nsw.gov.au/investigations.asp?industry=2§or=3 138 ESC website, http://www.esc.vic.gov.au/public/Energy/ 139 COAG website, http://www.coag.gov.au/meetings/100206/index.htm
wholesale electricity Electricity retail in the NEM
NERA Economic Consulting 49
§ Queensland has a 13 per cent gas scheme, whereby electricity retailers must source at least 13 per cent of their electricity from gas fired generation including either natural, coal seam methane, LPG or waste gas and accredited generators create credits that retailers must be able to surrender as proof of 13 per cent electricity sold or used in the state consistent with the scheme;140 and
§ The NSW Greenhouse Plan for retailers is to offer all new or moving residential customers a ten per cent Green Power component.141
A number of benchmarking studies have been undertaken to analyse the breakdown of these costs. Charles River Associates (CRA) undertook a benchmarking study for the Queensland Competition Authority and found that network and energy costs account for approximately 92 per cent of the retail price of electricity. The remaining 8 per cent represents the retailers’ operating costs and a margin.142 A similar breakdown was reported in a recent report for IPART.143
4.2. Structure of electricity retailers in the NEM
Retailers have been described as occupying three broad categories:144
§ incumbent retailers, or local retailers who previously were the franchised operators in a particular state or region;
§ full-service (mass market) entrants, or non-incumbent retailers who aim to establish coverage similar to the local retailer. Such a business could be an incumbent from another jurisdiction;
§ niche retailers that expect to remain small and who focus on particular classes of customers, distinguishing themselves by offering differentiated products.
Table 4.2 shows, where available, customer data for each retailer in the NEM jurisdictions.
140 Queensland Department of Mines and Energy website, http://www.energy.qld.gov.au/13percentgas.cfm 141 IPART, Regulated Retail Tariffs and Charges for Small Customers 2007 to 2010: Draft Report and Determination,
April 2007, p.15. 142 CRA, Calculation of the Benchmark Retail Cost Index for 2006-07 and 2007-08, 7 May 2007, p.3. 143 Frontier Economics, Mass Market New Entrant Retail Costs and Retail Margin, March 2007, p.53. 144 ESC, Review of the Effectiveness of Retail Competition and Consumer Safety Net in Gas and Electricity, 22 June 2004,
p.22.
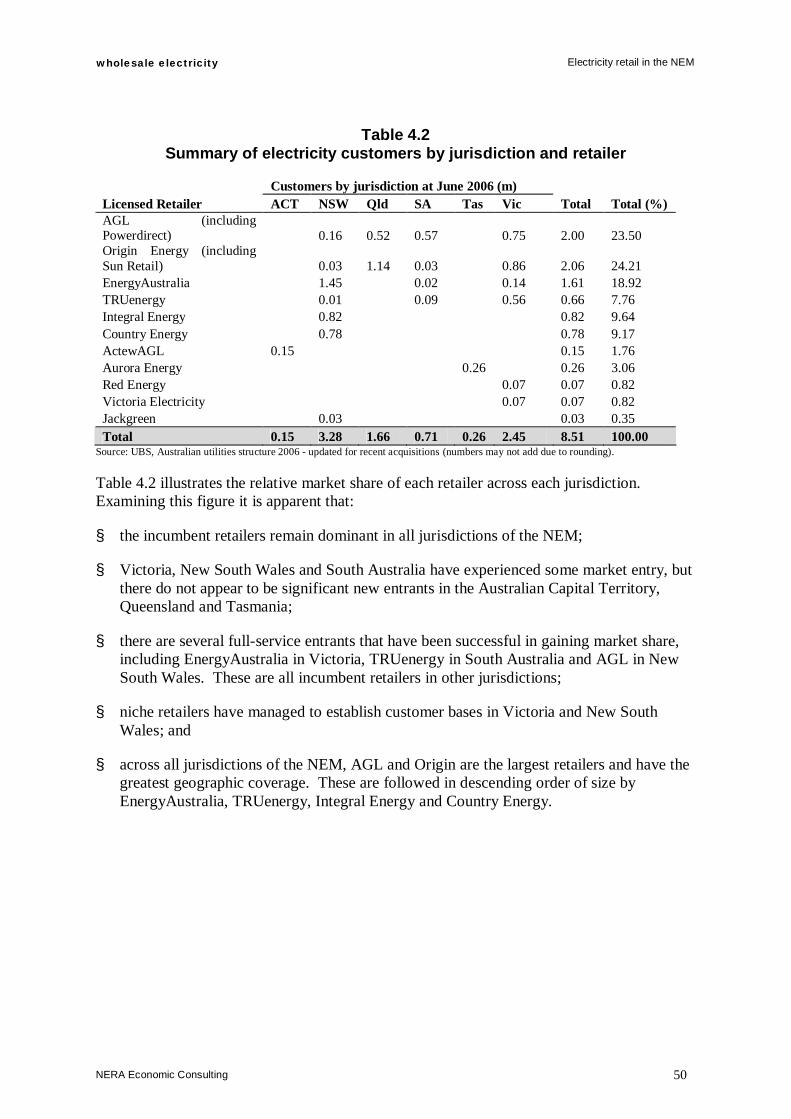
wholesale electricity Electricity retail in the NEM
NERA Economic Consulting 50
Table 4.2 Summary of electricity customers by jurisdiction and retailer
Customers by jurisdiction at June 2006 (m) Licensed Retailer ACT NSW Qld SA Tas Vic Total Total (%) AGL (including Powerdirect) 0.16 0.52 0.57 0.75 2.00 23.50 Origin Energy (including Sun Retail) 0.03 1.14 0.03 0.86 2.06 24.21 EnergyAustralia 1.45 0.02 0.14 1.61 18.92 TRUenergy 0.01 0.09 0.56 0.66 7.76 Integral Energy 0.82 0.82 9.64 Country Energy 0.78 0.78 9.17 ActewAGL 0.15 0.15 1.76 Aurora Energy 0.26 0.26 3.06 Red Energy 0.07 0.07 0.82 Victoria Electricity 0.07 0.07 0.82 Jackgreen 0.03 0.03 0.35 Total 0.15 3.28 1.66 0.71 0.26 2.45 8.51 100.00
Source: UBS, Australian utilities structure 2006 - updated for recent acquisitions (numbers may not add due to rounding).
Table 4.2 illustrates the relative market share of each retailer across each jurisdiction. Examining this figure it is apparent that:
§ the incumbent retailers remain dominant in all jurisdictions of the NEM;
§ Victoria, New South Wales and South Australia have experienced some market entry, but there do not appear to be significant new entrants in the Australian Capital Territory, Queensland and Tasmania;
§ there are several full-service entrants that have been successful in gaining market share, including EnergyAustralia in Victoria, TRUenergy in South Australia and AGL in New South Wales. These are all incumbent retailers in other jurisdictions;
§ niche retailers have managed to establish customer bases in Victoria and New South Wales; and
§ across all jurisdictions of the NEM, AGL and Origin are the largest retailers and have the greatest geographic coverage. These are followed in descending order of size by EnergyAustralia, TRUenergy, Integral Energy and Country Energy.
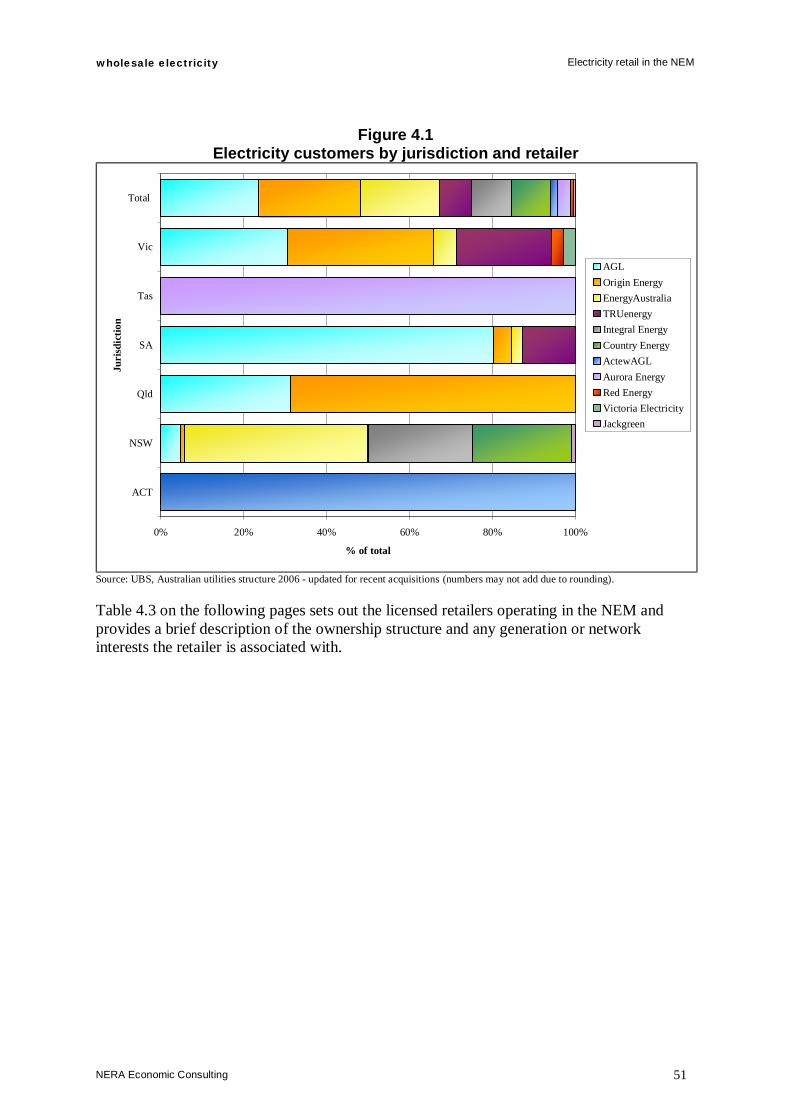
wholesale electricity Electricity retail in the NEM
NERA Economic Consulting 51
Figure 4.1 Electricity customers by jurisdiction and retailer
0% 20% 40% 60% 80% 100%
ACT
NSW
Qld
SA
Tas
Vic
Total
Juri
sdic
tion
% of total
AGL Origin Energy EnergyAustraliaTRUenergyIntegral EnergyCountry EnergyActewAGLAurora EnergyRed EnergyVictoria ElectricityJackgreen
Source: UBS, Australian utilities structure 2006 - updated for recent acquisitions (numbers may not add due to rounding).
Table 4.3 on the following pages sets out the licensed retailers operating in the NEM and provides a brief description of the ownership structure and any generation or network interests the retailer is associated with.
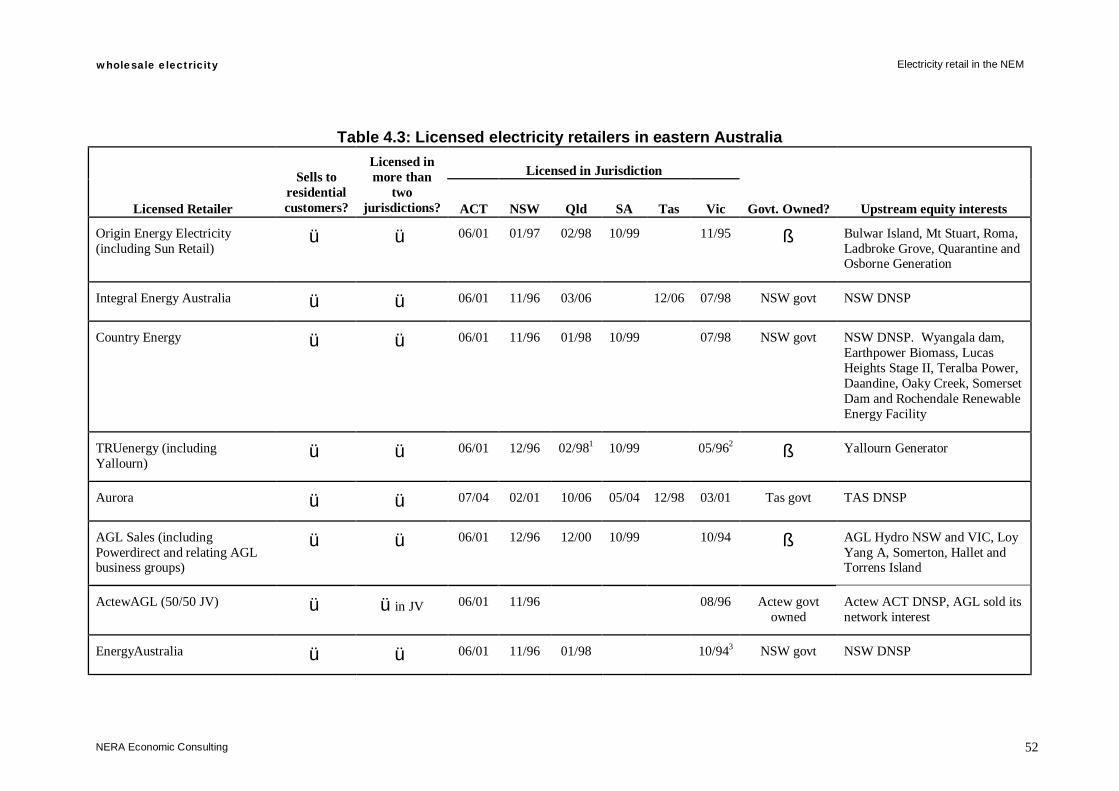
wholesale electricity Electricity retail in the NEM
NERA Economic Consulting 52
Table 4.3: Licensed electricity retailers in eastern Australia Licensed in Jurisdiction
Licensed Retailer
Sells to residential customers?
Licensed in more than
two jurisdictions? ACT NSW Qld SA Tas Vic Govt. Owned? Upstream equity interests
Origin Energy Electricity (including Sun Retail)
ü ü 06/01 01/97 02/98 10/99 11/95 û Bulwar Island, Mt Stuart, Roma, Ladbroke Grove, Quarantine and Osborne Generation
Integral Energy Australia ü ü 06/01 11/96 03/06 12/06 07/98 NSW govt NSW DNSP
Country Energy ü ü 06/01 11/96 01/98 10/99 07/98 NSW govt NSW DNSP. Wyangala dam, Earthpower Biomass, Lucas Heights Stage II, Teralba Power, Daandine, Oaky Creek, Somerset Dam and Rochendale Renewable Energy Facility
TRUenergy (including Yallourn)
ü ü 06/01 12/96 02/981 10/99 05/962 û Yallourn Generator
Aurora ü ü 07/04 02/01 10/06 05/04 12/98 03/01 Tas govt TAS DNSP
AGL Sales (including Powerdirect and relating AGL business groups)
ü ü 06/01 12/96 12/00 10/99 10/94 û AGL Hydro NSW and VIC, Loy Yang A, Somerton, Hallet and Torrens Island
ActewAGL (50/50 JV) ü üin JV 06/01 11/96 08/96 Actew govt owned
Actew ACT DNSP, AGL sold its network interest
EnergyAustralia ü ü 06/01 11/96 01/98 10/943 NSW govt NSW DNSP
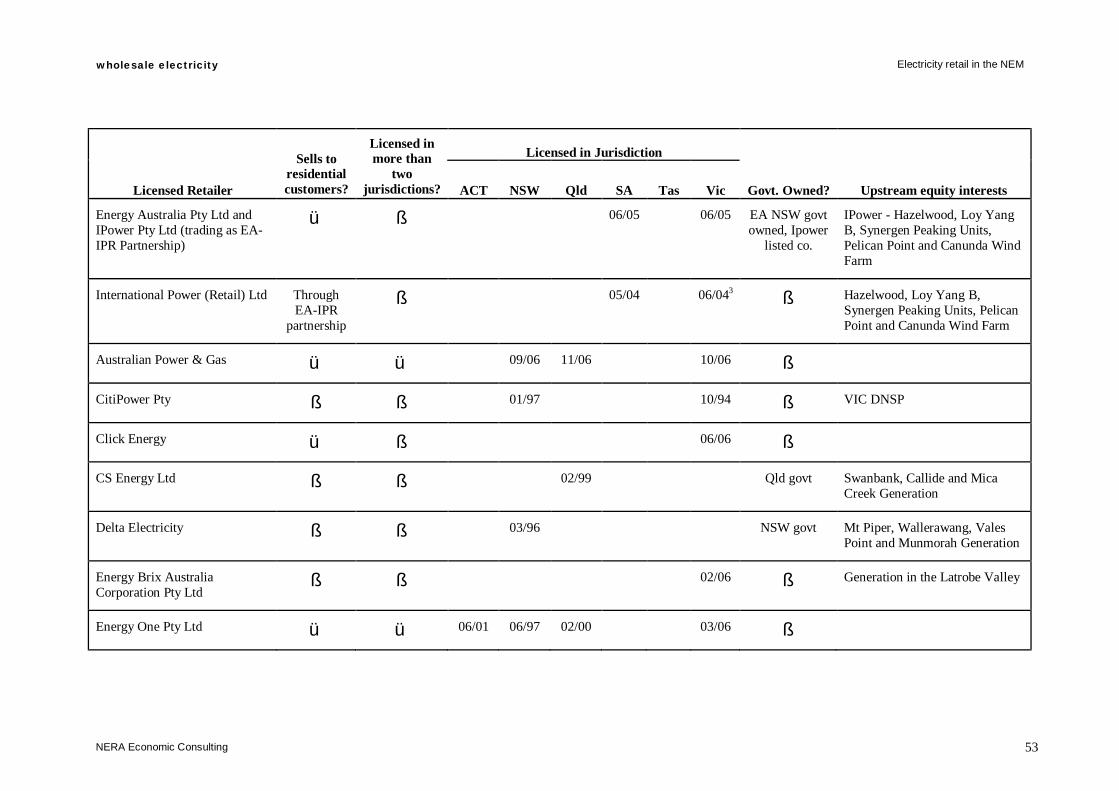
wholesale electricity Electricity retail in the NEM
NERA Economic Consulting 53
Licensed in Jurisdiction
Licensed Retailer
Sells to residential customers?
Licensed in more than
two jurisdictions? ACT NSW Qld SA Tas Vic Govt. Owned? Upstream equity interests
Energy Australia Pty Ltd and IPower Pty Ltd (trading as EA-IPR Partnership)
ü û 06/05 06/05 EA NSW govt owned, Ipower
listed co.
IPower - Hazelwood, Loy Yang B, Synergen Peaking Units, Pelican Point and Canunda Wind Farm
International Power (Retail) Ltd Through EA-IPR
partnership
û 05/04 06/043 û Hazelwood, Loy Yang B, Synergen Peaking Units, Pelican Point and Canunda Wind Farm
Australian Power & Gas ü ü 09/06 11/06 10/06 û
CitiPower Pty û û 01/97 10/94 û VIC DNSP
Click Energy ü û 06/06 û
CS Energy Ltd û û 02/99 Qld govt Swanbank, Callide and Mica Creek Generation
Delta Electricity û û 03/96 NSW govt Mt Piper, Wallerawang, Vales Point and Munmorah Generation
Energy Brix Australia Corporation Pty Ltd
û û 02/06 û Generation in the Latrobe Valley
Energy One Pty Ltd ü ü 06/01 06/97 02/00 03/06 û
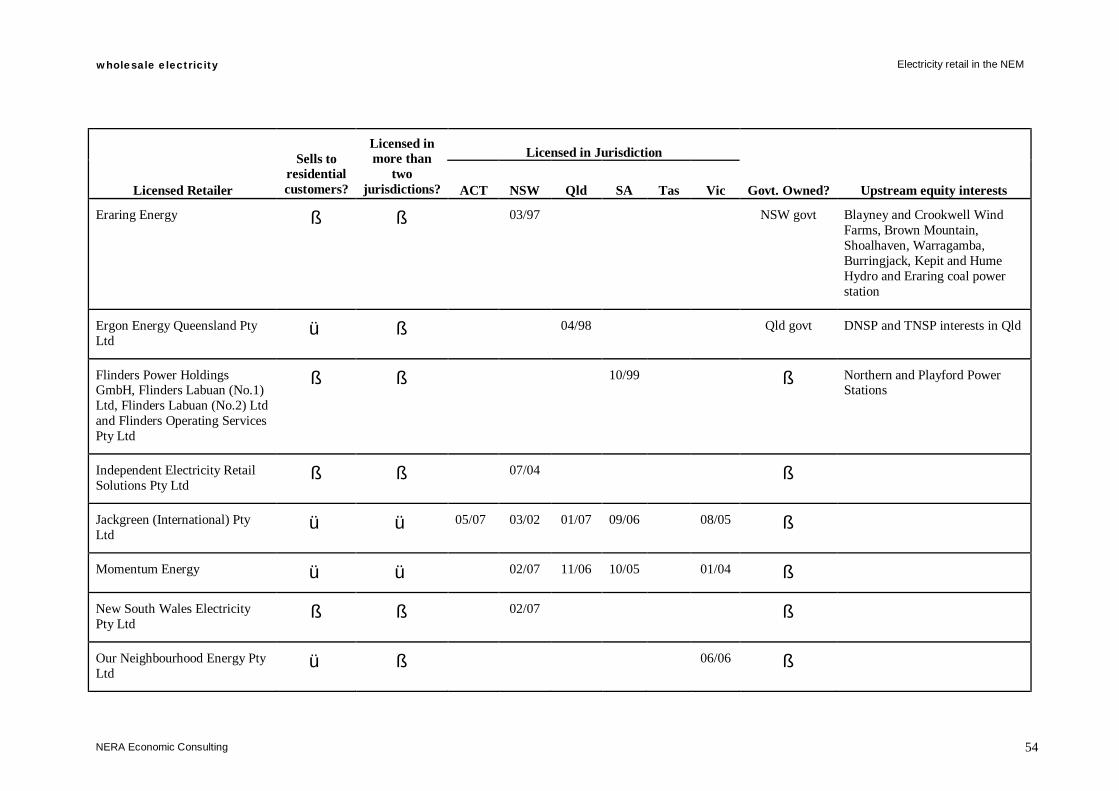
wholesale electricity Electricity retail in the NEM
NERA Economic Consulting 54
Licensed in Jurisdiction
Licensed Retailer
Sells to residential customers?
Licensed in more than
two jurisdictions? ACT NSW Qld SA Tas Vic Govt. Owned? Upstream equity interests
Eraring Energy û û 03/97 NSW govt Blayney and Crookwell Wind Farms, Brown Mountain, Shoalhaven, Warragamba, Burringjack, Kepit and Hume Hydro and Eraring coal power station
Ergon Energy Queensland Pty Ltd
ü û 04/98 Qld govt DNSP and TNSP interests in Qld
Flinders Power Holdings GmbH, Flinders Labuan (No.1) Ltd, Flinders Labuan (No.2) Ltd and Flinders Operating Services Pty Ltd
û û 10/99 û Northern and Playford Power Stations
Independent Electricity Retail Solutions Pty Ltd
û û 07/04 û
Jackgreen (International) Pty Ltd
ü ü 05/07 03/02 01/07 09/06 08/05 û
Momentum Energy ü ü 02/07 11/06 10/05 01/04 û
New South Wales Electricity Pty Ltd
û û 02/07 û
Our Neighbourhood Energy Pty Ltd
ü û 06/06 û
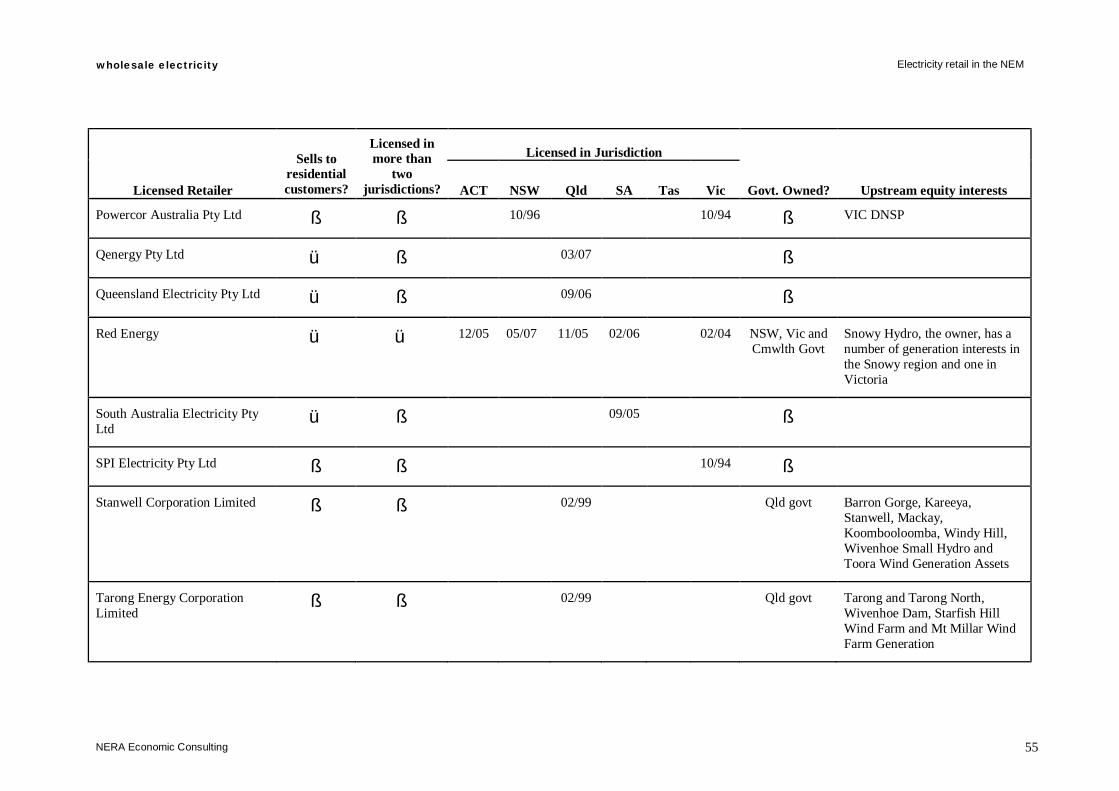
wholesale electricity Electricity retail in the NEM
NERA Economic Consulting 55
Licensed in Jurisdiction
Licensed Retailer
Sells to residential customers?
Licensed in more than
two jurisdictions? ACT NSW Qld SA Tas Vic Govt. Owned? Upstream equity interests
Powercor Australia Pty Ltd û û 10/96 10/94 û VIC DNSP
Qenergy Pty Ltd ü û 03/07 û
Queensland Electricity Pty Ltd ü û 09/06 û
Red Energy ü ü 12/05 05/07 11/05 02/06 02/04 NSW, Vic and Cmwlth Govt
Snowy Hydro, the owner, has a number of generation interests in the Snowy region and one in Victoria
South Australia Electricity Pty Ltd
ü û 09/05 û
SPI Electricity Pty Ltd û û 10/94 û
Stanwell Corporation Limited û û 02/99 Qld govt Barron Gorge, Kareeya, Stanwell, Mackay, Koombooloomba, Windy Hill, Wivenhoe Small Hydro and Toora Wind Generation Assets
Tarong Energy Corporation Limited
û û 02/99 Qld govt Tarong and Tarong North, Wivenhoe Dam, Starfish Hill Wind Farm and Mt Millar Wind Farm Generation
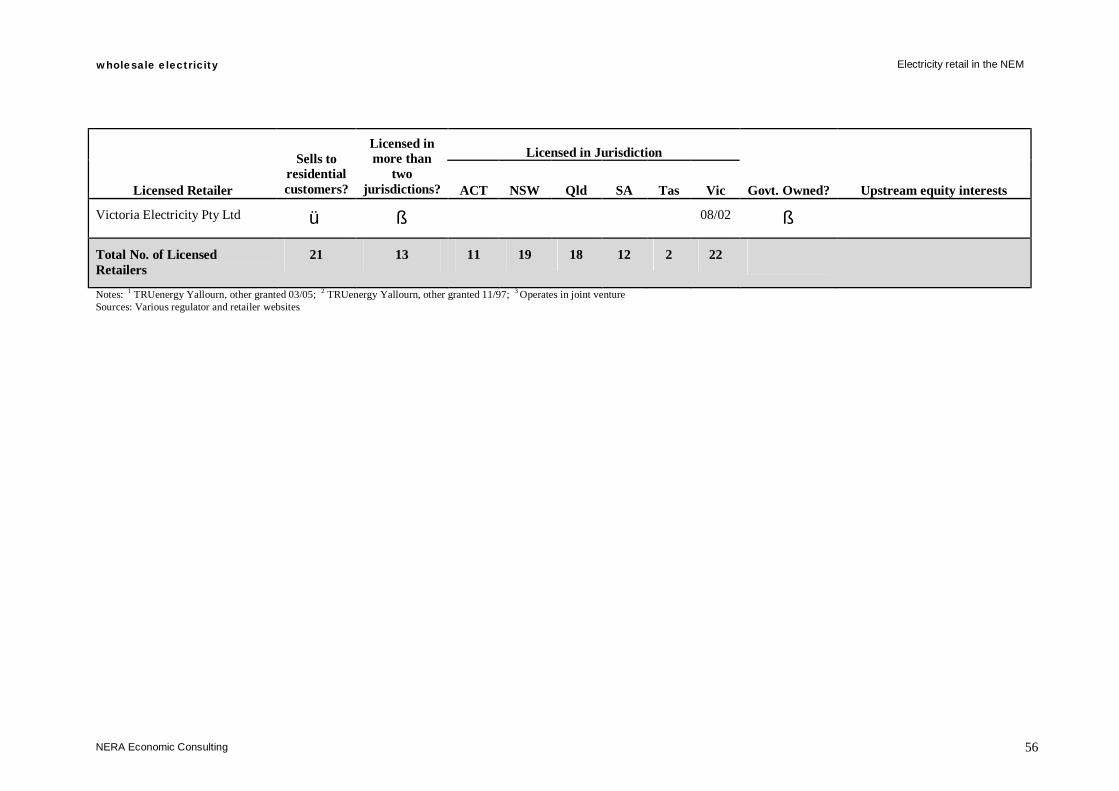
wholesale electricity Electricity retail in the NEM
NERA Economic Consulting 56
Licensed in Jurisdiction
Licensed Retailer
Sells to residential customers?
Licensed in more than
two jurisdictions? ACT NSW Qld SA Tas Vic Govt. Owned? Upstream equity interests
Victoria Electricity Pty Ltd ü û 08/02 û
Total No. of Licensed Retailers
21 13 11 19 18 12 2 22
Notes: 1 TRUenergy Yallourn, other granted 03/05; 2 TRUenergy Yallourn, other granted 11/97; 3 Operates in joint venture Sources: Various regulator and retailer websites
The Wholesale Electricity Market Electricity retail in the NEM
NERA Economic Consulting
4.2.1. Observations
Table 4.3 indicates that there are currently 34 distinct licensed electricity retailers in the NEM, although the actual number of licences issued is greater due to some businesses holding multiple retail licences through various subsidiaries. A lesser number of these currently supply or are intending to supply the small retail market.145
Thirteen of the retailers listed in Table 4.3 are licensed across more than two jurisdictions, these being AGL, ActewAGL, Aurora, Australian Power & Gas, Country Energy, Energy One, EnergyAustralia, Integral Energy, Jack Green, Momentum Energy, Origin, Red Energy and TRUenergy. Eight are incumbent retailers in various jurisdictions, and together these accounted for 98 per cent of the retail market across the NEM as at June 2006.
The incumbent retailers, together with Red Energy (which is owned by Snowy Hydro) own various upstream interests. The government owned businesses such as those in New South Wales, Tasmania and, previously, Queensland, are associated with DNSP and/or TNSP assets while the Victorian and South Australian incumbents have reinvested in generation assets in several states.
In addition to the upstream assets listed for each of the retailers in Table 4.3, several retailers have announced their involvement in a number of new generation projects, increasing their interests in generation. These projects include:
§ Spring Gully, a 1000 MW combined-cycle gas-fired plant to be located at the coal seam gas field of the same name and owned by Origin Energy. It will be constructed in two stages with a 500 MW plant expected to be operational by 2008. Origin is also, pending approvals, planning to construct a similarly sized gas-fired plant at Mortlake in western Victoria by 2010;146
§ Tallawarra, a 400MW combined-cycle gas-fired plant to be located near Wollongong in New South Wales, is under construction and completion is expected in 2008. It will be owned by TRUenergy;147 and
§ Bogong, a planned 140MW hydroelectric power plant to be constructed in the Kiewa Valley in Victoria by AGL.148
A change in upstream ownership is set to occur in July 2007 when AGL and TRUenergy conclude an agreement to transfer electricity generation interests in South Australia.149 AGL
145 See for example, IPART, Regulated Retail Tariffs and Charges for Small Customers 2007 to 2010: Draft Report and
Determination, April 2007, p.24. 146 ASX announcements; Origin website, http://www.originenergy.com.au/about/template.php?pageid=224 147 Rod Myer, “TRU to build $250m plant”, The Age, 8 December 2005. 148 AGL website,
http://www.agl.com.au/AGLNew/About+AGL/Generation+assets/Projects+under+development/Hydro+electric+power.htm
149 TRUenergy press release, http://www.truenergy.com.au/About/News/News.xhtml?newsitem=176.
The Wholesale Electricity Market Electricity retail in the NEM
NERA Economic Consulting
will take ownership of the Torrens Island power station from TRUenergy while TRUenergy will take ownership of AGL’s Hallett power station.150
4.2.2. Queensland
Queensland first introduced retail contestability in 1998 and currently extends this to customers with annual consumption greater than 100MWh. FRC is planned to be introduced in July 2007.
Until recently, the Queensland government retained ownership of the entire electricity production chain, aside from a number of merchant generators and non-incumbent retailers. However, the government has recently sold the electricity retailing arms of its incumbent energy suppliers, Energex and Ergon, in anticipation of full retail contestability being extended to entire market in Queensland. Origin and AGL were the purchasers of these spin-offs, called Sun Retail and Powerdirect respectively.151
Given the lack of full retail competition in Queensland, it is unsurprising that NEMMCO statistics indicate that the rate of customer churn in the state is negligible, 0.1 per cent in the period from May 2006 to April 2007.152 The two incumbent retailers together service almost all retail customers, although this figure may be misleading since it does not indicate the extent to which large customers (which represent a tiny proportion of customer numbers) have switched to alternative providers.
Table 4.3 indicates that there are 18 retailers licensed to operate in Queensland, however, 8 of these have entered in the past 18 months, likely in anticipation of the development of FRC in Queensland later this year.
4.2.3. New South Wales
There are currently 24 licensed electricity retail operators in New South Wales, although only 19 are shown in Table 4.3 above since some larger conglomerates hold multiple licenses through various subsidiaries. The incumbent retailers in New South Wales are EnergyAustralia, Integral Energy and Country Energy and these firms still control 93 per cent of the retail customers in the state. These firms are all government owned and are also DNSPs, and, in the case of EnergyAustralia, a TNSP. The New South Wales government also owns the majority of generation assets in the state.
Retail contestability was introduced for customers for consumption greater than 40GWh in October 1996, but it was not until January 2002 that contestability was rolled out to all customers. The incumbent Victorian firms have captured some customers, with AGL being the most successful by leveraging its gas retail business to offer dual fuel contracts. Niche retailers such as Jack Green also operate in New South Wales.
150 See ACCC informal clearance, http://www.accc.gov.au/content/index.phtml/itemId/784137 151 Company ASX releases related to the sale. 152 NEMMCO, Retail Transfer Statistical Data; NERA analysis.
The Wholesale Electricity Market Electricity retail in the NEM
NERA Economic Consulting
Reviews of retail competition in New South Wales show that discounts from the regulated tariffs are available through market contracts of up to 10 per cent, at least in metropolitan markets. There is also some evidence that the extent of these discounts has increased over time.153 Customer transfer statistics from NEMMCO indicate that the rate of customer churn in New South Wales between May 2006 and April 2007 was approximately 11 per cent, with the majority of transferring customers leaving their franchised provider to seek a market contract with an alternative provider.154
However, competition has not always developed effectively. In a recent report, IPART observed that there are nearly 300 regulated retail tariffs in Country Energy’s area, 200 of which are obsolete. It was also noted that in order for a second tier retailer to attract the customers in that area they would need to identify the relevant tariff to offer a discount from.155 For example, AGL stated:156
New entrant retailers currently find it difficult to compete in the NSW electricity market as there are numerous regulated tariffs, many of which are obsolete, complex or are under-recovering.
4.2.4. Australian Capital Territory
The Australian Capital Territory introduced FRC in 2003. However, customer data displayed in Table 4.3 above indicates that the incumbent provider, ActewAGL, still services almost all retail customers. Actew ACT, a 50 per cent partner in the joint venture with AGL in ActewAGL, is also the DNSP for the Territory, whilst AGL has a number of generation interests, including some hydroelectric capacity in New South Wales.
There are 11 electricity retailers licensed to operate in the ACT, all of these being retailers that have also entered, or are incumbents in, New South Wales. NEMMCO transfer data amalgamates the Australian Capital Territory and New South Wales and hence we have been unable to report separate churn rates.
4.2.5. Victoria
Victoria was the first jurisdiction in the NEM to introduce retail contestability for large customers and it implemented FRC in January 2002.
Government ownership of incumbent retailers was relinquished early in the reform process, and the retail functions were vertically separated from the network providers and generation. However, re-integration in recent years has seen AGL, Origin Energy and TRUenergy acquiring various generation assets in the Victorian and South Australian regions.
153 IPART, Regulated Retail Tariffs and Charges for Small Customers 2007 to 2010: Draft Report and Determination,
April 2007, p.28. 154 NEMMCO, Retail Transfer Statistical Data; NERA analysis. 155 IPART, Regulated Retail Tariffs and Charges for Small Customers 2007 to 2010: Draft Report and Determination,
April 2007, p.21. 156 AGL Submission to IPART Issues Paper on Price Determination, October 2006, p.9.
The Wholesale Electricity Market Electricity retail in the NEM
NERA Economic Consulting
These remain the prevailing retailers in the market, accounting for 89 per cent of the retail electricity customers in the state. Other retailers that have managed to establish significant customer bases are EnergyAustralia, Red Energy and Victoria Electricity. Customer transfer statistics from NEMMCO indicate that the rate of customer churn in Victoria between May 2006 and April 2007 was approximately 25 per cent, with the majority of the 600,000 transferring customers leaving their franchised provider to seek a market contract with an alternative provider, or churning between alternative providers.157
Evidence in a recent review of the effectiveness of retail competition in Victoria indicated that customers on market contracts were able to achieve discounts of as much as 20 per cent from the regulated retail tariffs.158
4.2.6. South Australia
South Australia introduced FRC in January 2003 and there are now 12 licensed retailers operating in the state, with many of these entering since the introduction of FRC. The incumbent retailer is AGL, which serves 80 per cent of customers in South Australia. However, TRUenergy, Origin and EnergyAustralia have also managed to accumulate significant numbers of retail customers.
The NEMMCO retail customer transfer statistics over the period from October 2006 to April 2007159 indicate that, along with Victoria, South Australia is the most active retail electricity market in Australia with annualised churn of 27 per cent. This places these states as the second and third most active retail markets in the world behind New Zealand, which has a longer history of FRC.160
As is the case in Victoria, the dominant providers in South Australia also have interests in generation capacity. As mentioned in the South Australia section above, the largest power station in the state, Torrens Island, is expected to change ownership between two retailers, TRUenergy and AGL. Origin Energy also has generation interests in South Australia.
4.2.7. Tasmania
Tasmania joined the NEM with the completion of the Basslink interconnector in 2006 and has therefore only recently entered a reform path towards FRC. Currently retail competition is open to customers with annual usage of more than 20GWh.
Integral Energy is currently the only retailer to have entered into competition with the incumbent firm Aurora Energy, which is also the DNSP in the state. The Tasmanian government also owns the vast majority of generation capacity in the state, which consists principally of hydroelectric dams. 157 NEMMCO, Retail Transfer Statistical Data; NERA analysis. 158 ESC, Review of the Effectiveness of Retail Competition and Consumer Safety Net in Gas and Electricity, 22 June 2004,
p.35. 159 NEMMCO, Retail Transfer Statistical Data; NERA analysis. Data for South Australia was not available prior to
October 2006. 160 IPART, Regulated Retail Tariffs and Charges for Small Customers 2007 to 2010: Draft Report and Determination,
April 2007, p.72.
The Wholesale Electricity Market Electricity retail in the NEM
NERA Economic Consulting
Given the small number of contestable customers, it is unsurprising that Aurora is still the retailer to almost all Tasmanian customers. Further market entry may be expected as Tasmania proceeds with its reforms, which are currently scheduled to result in FRC by July 2010.
The Wholesale Electricity Market Vertical integration in the NEM
NERA Economic Consulting 62
5. Vertical integration in the NEM
As an approach to manage risks associated with price volatility in the NEM, a number of retailers have purchased interests in generation, to create a natural hedge.161 There are four electricity retail businesses that have some generation interests including AGL, Origin Energy, TRUenergy and International Power.162 In this section we outline the relationship between these businesses and their generation interests.
5.1. AGL
Over the last five years AGL has actively sought to increase its interest in upstream generation assets as a way of ameliorating the wholesale price risk and earnings volatility faced by its retail arm. The portfolio of generation assets that AGL has since developed is diverse consisting of thermal and renewable base, intermediate and peaking generation assets across Victoria, South Australia and New South Wales.
As at May 2007 this portfolio consisted of, among others:
§ The 150MW Somerton gas fired power plant that was constructed in 2002 (Victoria);
§ a 32.5 per cent interest in the 2120MW Loy Yang A coal fired power plant that was acquired in April 2004 (Victoria); and
§ AGL Hydro Victoria and AGL Hydro New South Wales that were acquired in November 2005 as part of the Southern Hydro acquisition.
In addition, a major boost to AGL’s generation is anticipated in July 2007 when it acquires TRUenergy’s Torrens Island gas fired power station in South Australia, as mentioned above.
In addition to these assets AGL has proposed a number of gas, hydro and wind generation developments including a joint venture with CS Energy at Mica Creek (gas fired), Leafs Gully (coal seam methane fired which will utilise gas from AGL’s upstream interest in the Sydney Gas Co.), Townsville (gas fired), Bogong (hydro), McKay Creek (hydro) and the Hallet wind farm.
AGL’s diversity of generation assets has been a deliberate strategy of AGL as they stated following the acquisition of Southern Hydro and the upcoming acquisition of Torrens Island Power Station.
“The new hydro facilities acquired by AGL have added significant value to the generation portfolio because of their ability to start up almost instantaneously….In a market where there is a wholesale electricity price set for each five-minute period, this fast start capability helps offset exposure to the potentially high spot prices that AGL would otherwise face in order to meet customer demand.”163
161 We outline briefly in section 9 some of the implications arising from increased vertical integration in the NEM. 162 Although NRG Flinders – a significant player in generation – holds a license to retail in South Australia it does not
appear to have operated as a retailer. 163 AGL, Annual Report 2006, p.17.
The Wholesale Electricity Market Vertical integration in the NEM
NERA Economic Consulting 63
“Developing means to physically manage the price risk of a large retail base is a key financial risk mitigant, and this acquisition represents a significant leap forward in our strategic intent….Deepening our position in vital peaking and intermediate capacity plant like Torrens Island will afford AGL the direct and physical means to lower cost of goods sold and allow AGL to reduce its exposure to high cost hedge products due to the enhanced portfolio benefits of the acquisition.”164
5.2. Origin Energy
Origin has also sought to mitigate the price risks faced by its retail arm by holding interests in generation assets. However, unlike the diversified nature of AGL’s portfolio, Origin’s portfolio consists primarily of cogeneration plants and gas fired power plants in Western Australia, Queensland and South Australia.
The gas fired power generation assets currently held by Origin include:165
§ the Mt Stuart Power Plant located in Queensland (peaking plant);
§ the Roma Peaking Plant located in Queensland (peaking plant);
§ the Quarantine Power Station located in South Australia (peaking plant); and
§ the Ladbroke Grove Power Station located in South Australia (intermediate plant).
The output from the latter three of these plants is contracted to Origin Retail.166
Origin is also in the process of developing two new gas fired power plants in Victoria (the Mortlake power station) and Queensland (the Spring Gully power station). Both of these developments will use gas from Origin’s upstream gas production interests in the Otway Basin and the Spring Gully coal seam methane fields.167,168
The gas fired power generation assets have principally used gas from Origin’s upstream gas production interests in the Cooper/Eromanga and Otway basins and thus the development of this portfolio of generation assets has:
§ provided a market for the gas produced in fields within which Origin has a joint venture interest; and
§ been designed to provide a natural hedge against wholesale electricity price shocks.
This strategy can be seen in the following quotes made by Origin:
“The development of Quarantine Power Station provides markets for natural gas and an internal hedge against retail electricity exposure to volatility in electricity pool prices.”169
164 AGL, Media Release, 29 January 2007. 165 Origin website, http://www.originenergy.com.au/about/template.php?pageid=289 166 Ibid. 167 Origin website, http://www.originenergy.com.au/about/template.php?pageid=1376 168 Origin webstie, http://www.originenergy.com.au/about/template.php?pageid=1510 169 Origin Energy, Annual Report 2002, p.6.
The Wholesale Electricity Market Vertical integration in the NEM
NERA Economic Consulting 64
“By participating in fuel supply, generation and retail sales Origin Energy is able to create additional value while effectively managing its risk exposure.170
5.3. TRUenergy
Unlike Origin Energy and AGL, TRUenergy has significant base load generation interests in both South Australia and Victoria, which contributed around 6.5 per cent of the NEM scheduled load in 2004-05.
As at May 2007, these interests included the:
§ 1280MW CCGT plant at Torrens Island in South Australia (although this is soon to be transferred to AGL); and
§ 1480MW coal facility at Yallourn in Victoria.
As part of the sale of the Torrens Island power station lease to AGL TRUenergy will be acquiring the 180 MW Hallett power station from AGL.
5.4. International Power
International Power retails electricity in both Victoria and South Australia under the EnergyAustralia brand as part of the EA IPR Retail Partnership.171
As at May 2007, International Power’s generation capacity in South Australia included the:
§ 478MW CCGT plant at Pelican Point;
§ 46MW Canuda Wind Farm;
§ 206MW of natural gas generation at Mintaro and Dry Creek; and
§ 113MW of oil product-fired generation at Port Lincoln and Snuggery172.
In Victoria, International Power owns a:
§ 92 per cent share of the 1600MW Hazelwood coal power station; and
170 Origin Energy, Annual Report 2002, p.8. 171 EnergyAustralia, http://www.energy.com.au/energy/ea.nsf/Content/SA+Who+is+EnergyAustralia. 172 As mentioned above, International Power does not own Mintaro, Dry Creek, Snuggery or Port Lincoln but operates
them under a long term lease.
The Wholesale Electricity Market Vertical integration in the NEM
NERA Economic Consulting 65
§ 70 per cent share of the 1000MW Loy Yang B coal power station. 173
173 International Power Annual Report 2005, http://www.investis.com/ipr/pdf/ar05.pdf?t=popup
The Wholesale Electricity Market Operation of the NEM
NERA Economic Consulting 66
6. Operation of the NEM
NEMMCO was established under the Rules as a not-for-profit independent electricity market and system operator. In this role, NEMMCO is responsible for the operation of the NEM, maintaining system security and the co-ordinated planning of the network.
Within the wholesale market, NEMMCO’s responsibility is to balance supply and demand through a centrally co-ordinated real time dispatch process. In doing so, NEMMCO conducts a sequence of activities that facilitates trade between generators and consumers of electricity. In this section we provide an overview of NEMMCO’s role in the operation of the NEM.
6.1. Pre-dispatch
Prior to dispatching generators, NEMMCO publishes a pre-dispatch schedule that sets out supply and projected demand for all trading intervals (30 minute periods) over the following two days.
In accordance with the NER, registered scheduled generators are required to submit bids for particular quantities of electricity two days ahead of the supply requirement for each of the 48 trading intervals in that day. These bids specify the quantities that each generator is willing to supply at nominated prices.
For some quantities of supply, generators will bid a negative price, reflecting its minimum operating level. This reflects the costs associated with shutting down and subsequently refiring a plant exceeding a generator paying to continue generating at a negative price.
When submitting bids to NEMMCO, generators are permitted to bid production quantities in up to ten price bands, with each band representing an incremental amount of generation. This bidding approach is illustrated in Figure 6.1 below.
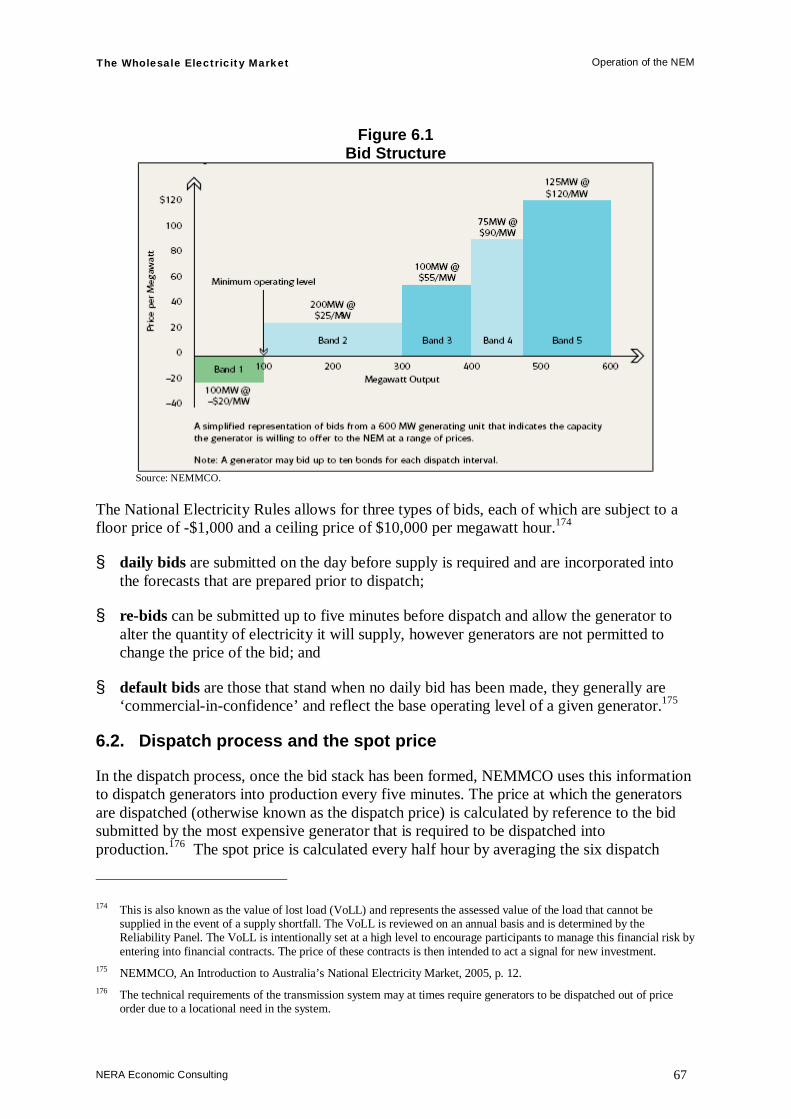
The Wholesale Electricity Market Operation of the NEM
NERA Economic Consulting 67
Figure 6.1 Bid Structure
Source: NEMMCO.
The National Electricity Rules allows for three types of bids, each of which are subject to a floor price of -$1,000 and a ceiling price of $10,000 per megawatt hour.174
§ daily bids are submitted on the day before supply is required and are incorporated into the forecasts that are prepared prior to dispatch;
§ re-bids can be submitted up to five minutes before dispatch and allow the generator to alter the quantity of electricity it will supply, however generators are not permitted to change the price of the bid; and
§ default bids are those that stand when no daily bid has been made, they generally are ‘commercial-in-confidence’ and reflect the base operating level of a given generator.175
6.2. Dispatch process and the spot price
In the dispatch process, once the bid stack has been formed, NEMMCO uses this information to dispatch generators into production every five minutes. The price at which the generators are dispatched (otherwise known as the dispatch price) is calculated by reference to the bid submitted by the most expensive generator that is required to be dispatched into production.176 The spot price is calculated every half hour by averaging the six dispatch
174 This is also known as the value of lost load (VoLL) and represents the assessed value of the load that cannot be
supplied in the event of a supply shortfall. The VoLL is reviewed on an annual basis and is determined by the Reliability Panel. The VoLL is intentionally set at a high level to encourage participants to manage this financial risk by entering into financial contracts. The price of these contracts is then intended to act a signal for new investment.
175 NEMMCO, An Introduction to Australia’s National Electricity Market, 2005, p. 12. 176 The technical requirements of the transmission system may at times require generators to be dispatched out of price
order due to a locational need in the system.
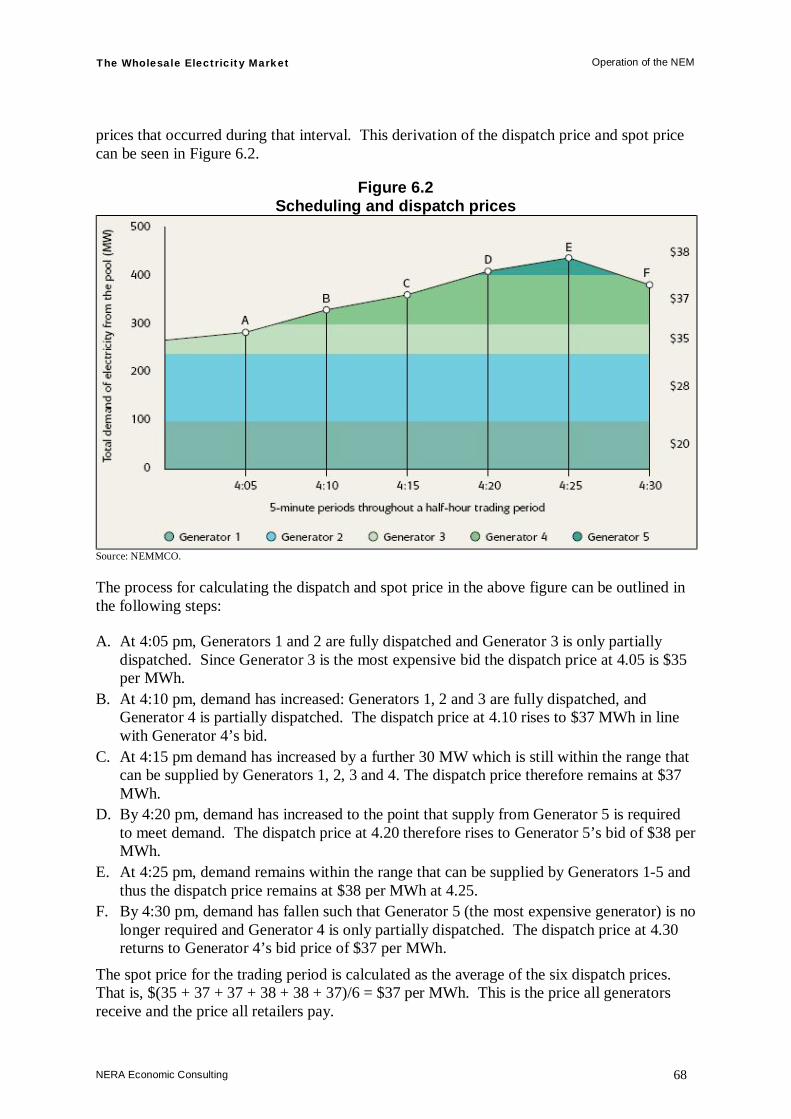
The Wholesale Electricity Market Operation of the NEM
NERA Economic Consulting 68
prices that occurred during that interval. This derivation of the dispatch price and spot price can be seen in Figure 6.2.
Figure 6.2 Scheduling and dispatch prices
Source: NEMMCO.
The process for calculating the dispatch and spot price in the above figure can be outlined in the following steps:
A. At 4:05 pm, Generators 1 and 2 are fully dispatched and Generator 3 is only partially dispatched. Since Generator 3 is the most expensive bid the dispatch price at 4.05 is $35 per MWh.
B. At 4:10 pm, demand has increased: Generators 1, 2 and 3 are fully dispatched, and Generator 4 is partially dispatched. The dispatch price at 4.10 rises to $37 MWh in line with Generator 4’s bid.
C. At 4:15 pm demand has increased by a further 30 MW which is still within the range that can be supplied by Generators 1, 2, 3 and 4. The dispatch price therefore remains at $37 MWh.
D. By 4:20 pm, demand has increased to the point that supply from Generator 5 is required to meet demand. The dispatch price at 4.20 therefore rises to Generator 5’s bid of $38 per MWh.
E. At 4:25 pm, demand remains within the range that can be supplied by Generators 1-5 and thus the dispatch price remains at $38 per MWh at 4.25.
F. By 4:30 pm, demand has fallen such that Generator 5 (the most expensive generator) is no longer required and Generator 4 is only partially dispatched. The dispatch price at 4.30 returns to Generator 4’s bid price of $37 per MWh.
The spot price for the trading period is calculated as the average of the six dispatch prices. That is, $(35 + 37 + 37 + 38 + 38 + 37)/6 = $37 per MWh. This is the price all generators receive and the price all retailers pay.
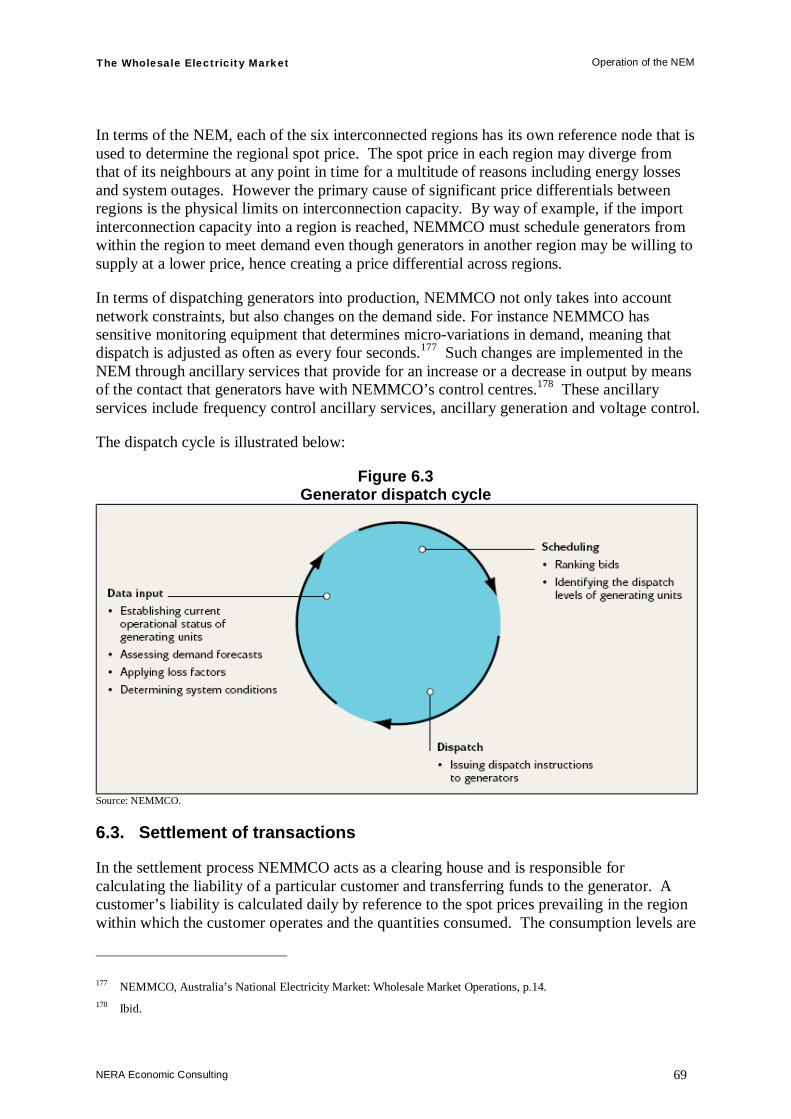
The Wholesale Electricity Market Operation of the NEM
NERA Economic Consulting 69
In terms of the NEM, each of the six interconnected regions has its own reference node that is used to determine the regional spot price. The spot price in each region may diverge from that of its neighbours at any point in time for a multitude of reasons including energy losses and system outages. However the primary cause of significant price differentials between regions is the physical limits on interconnection capacity. By way of example, if the import interconnection capacity into a region is reached, NEMMCO must schedule generators from within the region to meet demand even though generators in another region may be willing to supply at a lower price, hence creating a price differential across regions.
In terms of dispatching generators into production, NEMMCO not only takes into account network constraints, but also changes on the demand side. For instance NEMMCO has sensitive monitoring equipment that determines micro-variations in demand, meaning that dispatch is adjusted as often as every four seconds.177 Such changes are implemented in the NEM through ancillary services that provide for an increase or a decrease in output by means of the contact that generators have with NEMMCO’s control centres.178 These ancillary services include frequency control ancillary services, ancillary generation and voltage control.
The dispatch cycle is illustrated below:
Figure 6.3 Generator dispatch cycle
Source: NEMMCO.
6.3. Settlement of transactions
In the settlement process NEMMCO acts as a clearing house and is responsible for calculating the liability of a particular customer and transferring funds to the generator. A customer’s liability is calculated daily by reference to the spot prices prevailing in the region within which the customer operates and the quantities consumed. The consumption levels are
177 NEMMCO, Australia’s National Electricity Market: Wholesale Market Operations, p.14. 178 Ibid.
The Wholesale Electricity Market Operation of the NEM
NERA Economic Consulting 70
obtained from metering data that records the electricity consumption and time of that consumption of a particular customer. The funds collected by NEMMCO from each customer are then transferred to the generators. As with other clearing houses, NEMMCO imposes a number of prudential requirements on end users. Specifically, NEMMCO requires end users to obtain bank guarantees and to maintain security deposits. Customers are also subject to a maximum daily credit limit that requires daily settlement.
6.4. Maintaining the demand and supply balance in the wholesale market
To ensure demand and supply are balanced and that the integrity of the market is maintained NEMMCO has the power to intervene in the market in certain circumstances. For example, if demand exceeds supply and the ceiling bid of $10,000 per megawatt hour is triggered then NEMMCO can instruct generators to supply more capacity than they have bid into the market. If NEMMCO anticipates that supply will fall below a defined reliability standard then it may act as a reserve trader and enter into reserve contracts with generators for the provision of reserve capacity ahead of the expected shortfall. As a last resort NEMMCO may instruct network service providers to commence load shedding. All of these actions are designed to ensure that the security of the system is maintained and that supply and demand is balanced.
Demand side participation is also encouraged and facilitated by the publication of demand forecasts by NEMMCO on a seven day and two year basis. These forecasts are updated regularly and allow retailers or large customers to voluntarily withdraw from the market if a particular spot price is reached.
6.5. Planning and development of the wholesale electricity market
As the market and system operator NEMMCO is also responsible for identifying investment opportunities in both generation capacity and transmission network augmentation. The identification of these opportunities is facilitated through the inter-regional planning committee. This committee assists NEMMCO in the preparation and annual publication of both: § the Statement of Opportunities, which identifies opportunities for future investment in
generation capacity over a ten year period; and
§ the Annual National Transmission Statement, which identifies technically feasible modifications that can be implemented to address both current and forecast system constraints on the transmission network.
6.6. Energy Losses
Losses consist of electrical losses, metering errors and theft. They account for approximately 10 per cent of total energy produced in Australia.179 Generally speaking, there is a trade-off between network utilisation and losses (i.e., as network assets are driven harder and asset utilisation improves, losses will increase). Losses also increase with the distance that energy must be transferred. The Rules distinguish between transmission losses, measured via
179 NEMCO, An Introduction to Australia’s Electricity Market, 2005, p.18.
The Wholesale Electricity Market Operation of the NEM
NERA Economic Consulting 71
transmission loss factors (TLFs) and distribution losses, measured via distribution loss factors (DLFs).
There are three types of losses:
§ Inter-regional losses – the losses from transporting electricity between two regional reference nodes along regulated interconnectors. NEMMCO is required to approve an equation for estimating losses, where that equation is expressed in terms of significant variables. It would appear to follow that the loss factor is recalculated for each trading interval depending upon how those variables change. The loss factor must represent the marginal losses suffered. The surplus accruing from the fact that marginal losses generally exceed average losses is treated as an inter-regional settlement residue and is dealt with in the same way as other inter-regional settlement residues.
§ Intra-regional losses – the losses from transporting electricity between the regional reference node and any transmission connection point (transmission connection points include points of generator connection and connections to distribution networks). NEMMCO approves (static) loss factors for each transmission connection point for the year in advance (albeit with an ability to respond to new generators and other significant changes). The loss factors must represent the average of the marginal electricity losses expected in each trading interval over the year. The surplus accruing from the fact that marginal losses generally exceed average losses is treated as a settlement residue and is distributed to the TNSP (to be offset against the revenue permitted to be earned from transmission prices).
§ Distribution losses – the losses incurred in conveyance of electricity over a distribution network. The jurisdictional regulator must approve (static) distribution loss factors for each distribution connection point annually, in advance of the relevant year (albeit with an ability to respond to new generators and other significant changes). The loss factors must reflect the average electricity lost when conveying electricity between a transmission connection point and a distribution connection point. The ‘losses’ derived by multiplying the loss factors by throughput are required to equate to forecast total losses – so no surplus should be expected.
The loss factors may be:
§ site specific (where size thresholds are passed or where an embedded generator wishes to have a site specific distribution loss factor and is prepared to pay for its calculation); or
§ averaged across the distribution network connection points in the relevant voltage class that are assigned to a particular transmission connection point.
6.6.1. Treatment of energy losses
Loss factors are important to the NEM dispatch and settlement processes.
6.6.1.1. Dispatch
Central dispatch is based on (amongst other things) generator bids (clause 3.8.1). The bids that a scheduled generator submits are its bid to supply energy at that generator’s connection point. The generator’s bid is then adjusted to derive the ‘offer’ that is used in the central
The Wholesale Electricity Market Operation of the NEM
NERA Economic Consulting 72
dispatch process (the objective being to reference the bid to the regional reference node) – which is achieved by dividing the bid by the applicable loss factor (clause 3.8.6(g)). If a generator is connected to the distribution network, the applicable loss factor is the product of its distribution loss factor and the intra-regional loss factor that is assigned to the generator (applying to the transmission connection point of the distribution network in which the generator is located).
6.6.1.2. Settlement
The local spot price for each transmission connection point is the regional reference price multiplied by the intra-regional loss factor (clause 3.9.1(c)). The amount that a generator gets paid (or a retailer pays) is the product of (clause 3.15.6):
§ the regional reference price;
§ the intra-regional loss factor at the transmission connection point at which the generator connects or which is assigned to an embedded generator; and
§ the ‘adjusted gross energy’.
Hence, the price received (the outworking of the first two terms) is the ‘local spot price’ for the relevant transmission connection point. ‘Adjusted gross energy’ for an embedded generator is measured energy multiplied by the distribution loss factor (measured energy is positive for generators, and negative for end users).
6.6.1.3. The outcome for embedded generators
When determining which generators are dispatched, the NEM takes into account the losses incurred (or avoided) by embedded generators.
§ The bids of all generators are adjusted to take account of the losses incurred (or avoided) when conveying electricity to the regional reference node, which includes losses incurred (or avoided) on the distribution network.
§ If the embedded generator is in an energy importing region, then its intra-regional and distribution loss factors will be greater than one, and so its bids will be scaled down when being compared to other generators (whereas generators that are in generation rich areas will have an intra-regional loss factor that is less than 1, and so their bids will be scaled up).
The price that an embedded generator gets paid reflects the losses incurred (or avoided) when transporting electricity from the regional reference node to its transmission connection point.
§ The price that all generators are paid is their local spot price, which is the regional reference price multiplied by the intra-regional loss factor.
§ If the embedded generator is in an energy importing region, then its intra-regional loss factor will be greater than one and hence it will receive a higher price than the regional reference price.
The output that an embedded generator gets paid for reflects the losses incurred (or avoided) on the distribution network.
The Wholesale Electricity Market Operation of the NEM
NERA Economic Consulting 73
§ The amount that the embedded generator is paid for is its output multiplied by its distribution loss factor.
§ If the embedded generator is in an energy importing area, then its distribution loss factor will be greater than one, which means that it is deemed to be avoiding losses and it will get paid for more than it produces.
In summary, a loss factor of greater than one is good for a generator, as such a loss factor scales down its price offer (and hence increases its likelihood of being dispatched), scales up the price it receives (as it receives its local spot price) and – for embedded generators – scales up the quantities it sells (by its distribution loss factor). Conversely, a loss factor of greater than one is bad for a retailer, as such a loss factor scales up the price it pays for electricity delivered to the transmission connection point associated with a particular customer and scales up the quantities it buys on behalf of that customer (by the distribution loss factor).
6.7. Constraints
The transportation of electricity through the NEM is limited by the technical capacity of the interconnectors and the distribution network. Technical capacity refers to the quantity of electricity each section of the NEM can handle. If these constraints are exceeded then the security and reliability of the system would be compromised.
If the system were operating without constraints, NEMMCO would dispatch generators purely on the basis of cost. However this is not the case and NEMMCO takes into consideration the capacity of the entire system when dispatching generators into production. For instance if the interconnector to region A is at maximum capacity, NEMMCO must, in order to satisfy demand, dispatch generators from region A even if electricity can be produced at a cheaper price elsewhere.
As with energy losses, the presence of constraints can lead to differences between regional reference spot prices.
The Wholesale Electricity Market Risk management
NERA Economic Consulting 74
7. Risk management
7.1. Overview
Managing the risks inherent in operating in the NEM is important for all market participants. This section provides an overview of the risks faced by market participants, the tools used to manage these risks and some discussion of the effectiveness of these tools.
Parties participating in the NEM face three forms of risk: market risk, credit risk and settlement risk.180
7.1.1. Market Risk
Market risk refers to the exposure of participants in the NEM to fluctuations in the price of electricity on the spot market. As established in Section 2.3.3, prices in the NEM exhibit volatility. This arises because electricity is a non-storable commodity, meaning fluctuations in demand and supply cannot be smoothed through the use of inventories. Instead, supply and demand are balanced in the spot market through the price mechanism.
The volatility of prices is compounded when one takes into account the regional structure of the NEM. If participants are trading or using contracting positions in one region to support activities in another, then they are exposed to the risk that the spot price will differ between the two regions (this is known as inter-regional risk).
The cause of fluctuations in demand and supply include:
§ changes in temperature which create demand peaks;
§ unplanned generator outages; and
§ transmission/interconnector line failures.
The presence of such fluctuations is evident in the first three months of 2007 where the price of electricity in the spot market ranged from a low of -$999 to a high of $10,000 per MWh.181
Market risk also refers to the financial risk that arises due to uncertainty associated with volume. Given that demand for electricity can be quite volatile, retailers face the risk that any uncontracted load may occur when the spot price is high. On the other hand, generators face the risk that they may not be able to meet their contracted supply due to planned or unplanned outages.
180 NEMMCO, Australia’s National Electricity Market: Trading Arrangements in the NEM, p. 12. 181 NEMMCO Market Data.
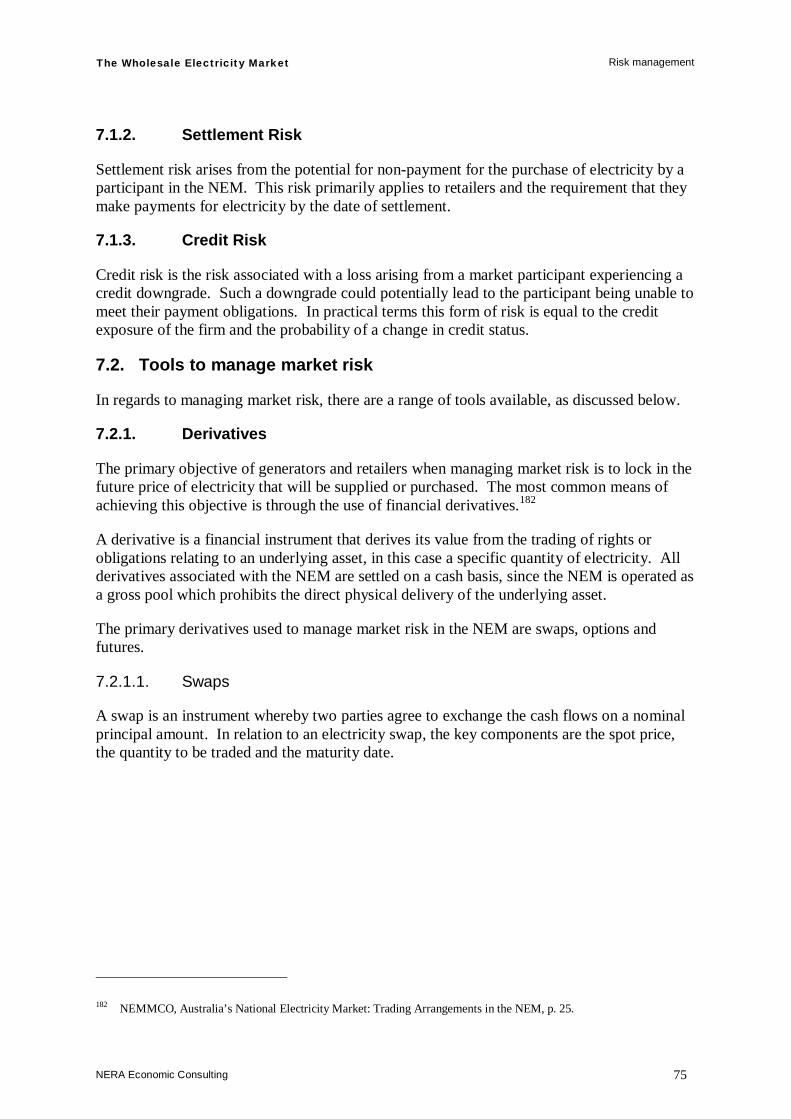
The Wholesale Electricity Market Risk management
NERA Economic Consulting 75
7.1.2. Settlement Risk
Settlement risk arises from the potential for non-payment for the purchase of electricity by a participant in the NEM. This risk primarily applies to retailers and the requirement that they make payments for electricity by the date of settlement.
7.1.3. Credit Risk
Credit risk is the risk associated with a loss arising from a market participant experiencing a credit downgrade. Such a downgrade could potentially lead to the participant being unable to meet their payment obligations. In practical terms this form of risk is equal to the credit exposure of the firm and the probability of a change in credit status.
7.2. Tools to manage market risk
In regards to managing market risk, there are a range of tools available, as discussed below.
7.2.1. Derivatives
The primary objective of generators and retailers when managing market risk is to lock in the future price of electricity that will be supplied or purchased. The most common means of achieving this objective is through the use of financial derivatives.182
A derivative is a financial instrument that derives its value from the trading of rights or obligations relating to an underlying asset, in this case a specific quantity of electricity. All derivatives associated with the NEM are settled on a cash basis, since the NEM is operated as a gross pool which prohibits the direct physical delivery of the underlying asset.
The primary derivatives used to manage market risk in the NEM are swaps, options and futures.
7.2.1.1. Swaps
A swap is an instrument whereby two parties agree to exchange the cash flows on a nominal principal amount. In relation to an electricity swap, the key components are the spot price, the quantity to be traded and the maturity date.
182 NEMMCO, Australia’s National Electricity Market: Trading Arrangements in the NEM, p. 25.
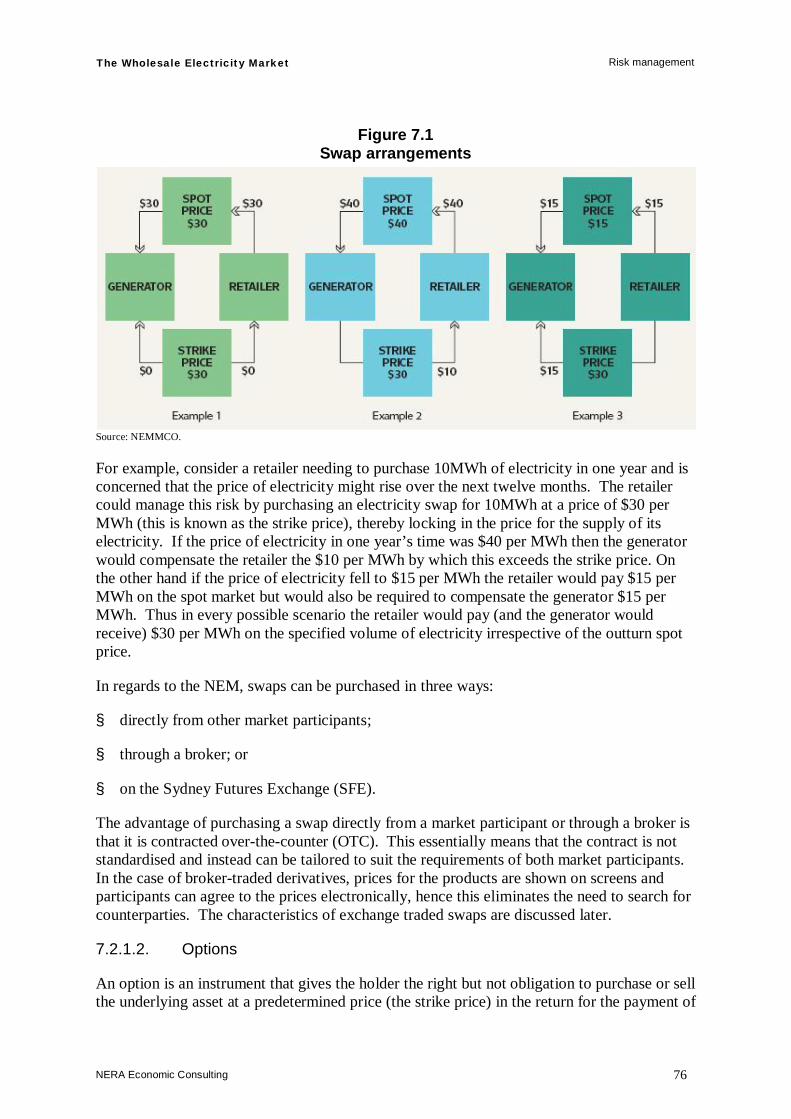
The Wholesale Electricity Market Risk management
NERA Economic Consulting 76
Figure 7.1 Swap arrangements
Source: NEMMCO.
For example, consider a retailer needing to purchase 10MWh of electricity in one year and is concerned that the price of electricity might rise over the next twelve months. The retailer could manage this risk by purchasing an electricity swap for 10MWh at a price of $30 per MWh (this is known as the strike price), thereby locking in the price for the supply of its electricity. If the price of electricity in one year’s time was $40 per MWh then the generator would compensate the retailer the $10 per MWh by which this exceeds the strike price. On the other hand if the price of electricity fell to $15 per MWh the retailer would pay $15 per MWh on the spot market but would also be required to compensate the generator $15 per MWh. Thus in every possible scenario the retailer would pay (and the generator would receive) $30 per MWh on the specified volume of electricity irrespective of the outturn spot price.
In regards to the NEM, swaps can be purchased in three ways:
§ directly from other market participants;
§ through a broker; or
§ on the Sydney Futures Exchange (SFE).
The advantage of purchasing a swap directly from a market participant or through a broker is that it is contracted over-the-counter (OTC). This essentially means that the contract is not standardised and instead can be tailored to suit the requirements of both market participants. In the case of broker-traded derivatives, prices for the products are shown on screens and participants can agree to the prices electronically, hence this eliminates the need to search for counterparties. The characteristics of exchange traded swaps are discussed later.
7.2.1.2. Options
An option is an instrument that gives the holder the right but not obligation to purchase or sell the underlying asset at a predetermined price (the strike price) in the return for the payment of
The Wholesale Electricity Market Risk management
NERA Economic Consulting 77
a premium. In relation to electricity, an option gives the holder the right to purchase or sell a specific quantity of electricity at the strike price on a specified date.
Like swaps, options can be purchased either OTC or through an exchange. However unlike options, the holder can protect themselves against adverse price movements whilst still retaining the ability to benefit from positive price changes. This key feature arises due to the fact that an option gives the holder the right but not obligation to exercise the instrument. Hence if the price were to move favourably then the holder would not exercise the option and simply forgo the premium they paid to acquire the instrument.
Options primarily come in two forms: ‘put’ options and ‘call’ options. A put option gives the holder the right, but not obligation, to sell electricity at a predetermined price whilst a call option gives the holder the right, but not obligation, to purchase electricity at a predetermined price. A generator would therefore use put options to construct a price floor whereby it could guarantee itself a minimum price (the strike price) should the spot price of electricity fall. On the other hand, a retailer would use call options to construct a price cap to set an upper limit on the price they would need to pay for electricity.
It is also possible to construct a price ‘collar’ which combines both put and call options. The purpose of such a strategy is to construct a band within which the price of electricity is allowed to vary. Whilst such a strategy may at first appear illogical, it is often the case that a zero premium payment is required by sharing the upside and downside risk in this fashion. For instance in the case of a retailer, the cost of buying a call option can be offset by the premium earned through selling a put option.183
In addition to put and call options, participants in the NEM can purchase a swaption to hedge against adverse price movements. As the name suggests, a swaption is an instrument which gives the holder the right but not obligation to enter into a swap agreement. In many respects they are similar to price caps and floors since they can be used to set a minimum price for the purchase or sale of electricity.
Whilst participants in the options market are generally those who have a physical commitment in the NEM, ie, retailers and generators, other parties such as banks and traders are active players in the market. These parties look to profit from the premiums earned when options are abandoned by buyers.184
183 NEMMCO, Australia’s National Electricity Market: Trading Arrangements in the NEM, p. 29. 184 Ibid.
The Wholesale Electricity Market Risk management
NERA Economic Consulting 78
Figure 7.2 OTC instruments185
74%
12%
5%6%3%
Swaps Caps Swaptions Collars and Asian options Other options
Source: ERIG.
In regards to derivatives purchased OTC, the most popular type, as listed in the 2007 ERIG Energy Reform report, are swaps. In Figure 7.2 it can be seen that just less than three quarters of all derivatives purchased OTC are swaps, with the next dominant derivative being price caps.
7.2.1.3. Futures
A futures contract is a standardised contract, traded on an exchange, for the purchase or sale of an underlying asset at a future date. In Australia electricity futures are traded on the SFE, with the products traded including base load and peak period futures and options on swap futures.186
Each futures contract is highly standardised with set sizes and maturity dates. Whilst this feature reduces the flexibility of futures in comparison to OTC instruments, it enables them to be traded on the Sydney Futures Exchange. The benefit of exchange-based trading is that they are cleared and settled through a centralised clearing house (SFE Clearing Corporation). In this process the SFE Clearing Corporation imposes margin calls on every party, which allows it to acts as the counterparty to every transaction, thus reducing the credit risk of futures.187
185 ERIG, Energy Reform: The way forward for Australia, 2007, p. 2217. 186 A base load future is essential a swap covering the entire day whilst a peak period future covers 7:00am to 10pm on
Monday to Friday. For further information on the products available on the SFE refer to http://www.d-cyphatrade.com.au/products/electricity_futures/strip_futures_products
187 NEMMCO, Australia’s National Electricity Market: Trading Arrangements in the NEM, p. 30.
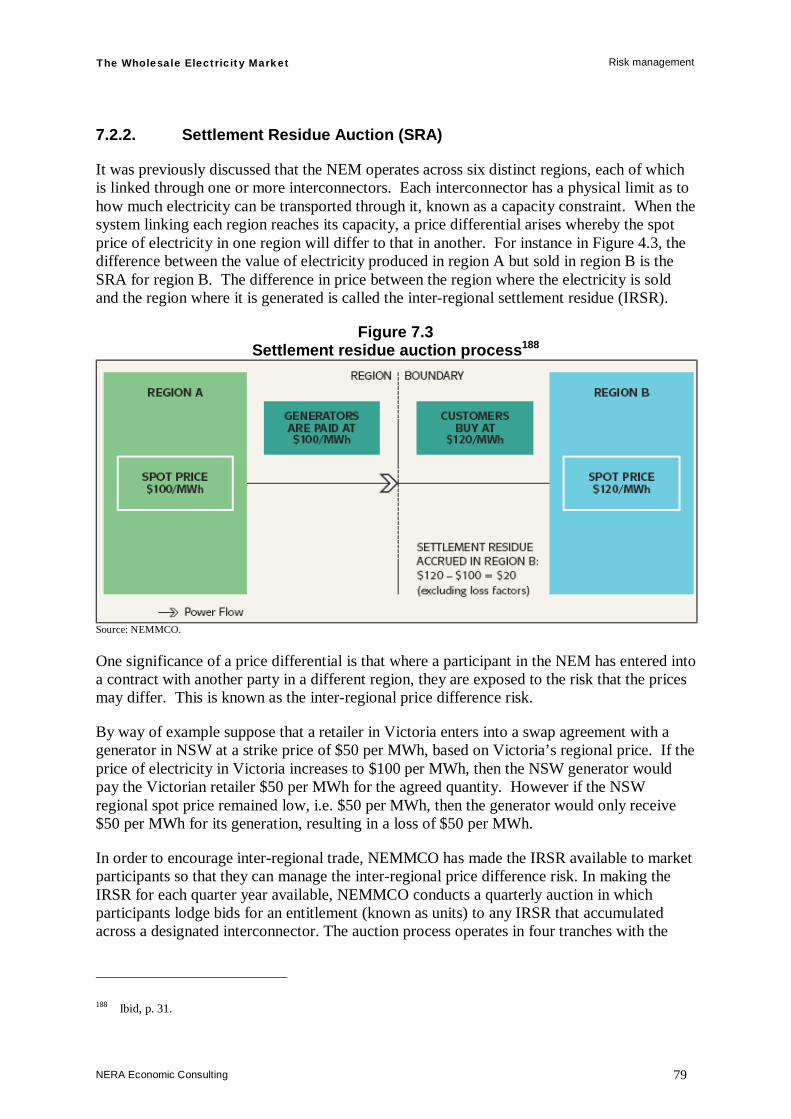
The Wholesale Electricity Market Risk management
NERA Economic Consulting 79
7.2.2. Settlement Residue Auction (SRA)
It was previously discussed that the NEM operates across six distinct regions, each of which is linked through one or more interconnectors. Each interconnector has a physical limit as to how much electricity can be transported through it, known as a capacity constraint. When the system linking each region reaches its capacity, a price differential arises whereby the spot price of electricity in one region will differ to that in another. For instance in Figure 4.3, the difference between the value of electricity produced in region A but sold in region B is the SRA for region B. The difference in price between the region where the electricity is sold and the region where it is generated is called the inter-regional settlement residue (IRSR).
Figure 7.3 Settlement residue auction process188
Source: NEMMCO.
One significance of a price differential is that where a participant in the NEM has entered into a contract with another party in a different region, they are exposed to the risk that the prices may differ. This is known as the inter-regional price difference risk.
By way of example suppose that a retailer in Victoria enters into a swap agreement with a generator in NSW at a strike price of $50 per MWh, based on Victoria’s regional price. If the price of electricity in Victoria increases to $100 per MWh, then the NSW generator would pay the Victorian retailer $50 per MWh for the agreed quantity. However if the NSW regional spot price remained low, i.e. $50 per MWh, then the generator would only receive $50 per MWh for its generation, resulting in a loss of $50 per MWh.
In order to encourage inter-regional trade, NEMMCO has made the IRSR available to market participants so that they can manage the inter-regional price difference risk. In making the IRSR for each quarter year available, NEMMCO conducts a quarterly auction in which participants lodge bids for an entitlement (known as units) to any IRSR that accumulated across a designated interconnector. The auction process operates in four tranches with the
188 Ibid, p. 31.
The Wholesale Electricity Market Risk management
NERA Economic Consulting 80
first tranche occurring one year in advance. In the first tranche 25 per cent of the units are auctioned off, with a further 25 per cent auctioned off at every subsequent quarter.189
In addition to the SRA, market participants can manage inter-regional risk through the use of inter-regional swaps and options. These derivatives function in a similar manner to the derivatives described previously, in that they lock the price of electricity for retailers and generators. However these derivatives cannot be purchased on an exchange like the SFE, but instead can only be purchased OTC.
7.2.3. Government Instruments
In addition to derivatives and the SRA, there are a number of state government instruments which are used to manage market risk.
NSW Electricity Tariff Equalisation Fund (ETEF)
In 2001 the NSW government initiated the ETEF as a means to smooth wholesale electricity prices for those retailers who are required by law to sell electricity at the regulated tariff established by the Independent Pricing Regulatory Tribunal (IPART).
The ETEF operates by forcing retailers to contribute to the fund when spot prices fall below the regulated tariff. When prices exceed the tariff, ETEF pays retailers the difference from the fund. In the event that the ETEF has insufficient funds to compensate retailers, generators are required to ‘top-up’ the fund until spot prices fall below the regulated tariff level.
Recently the NSW government announced that the ETEF will be phased out by 2010.190
Queensland Long-term Energy Procurement (LEP) Arrangement
The LEP scheme operated by compensating state retailers for the price risk they incur when supplying franchise customers (i.e. those customers who pay a regulated tariff) that is in excess of what other retailers are facing. In operating this arrangement, the government benchmarked the cost of supplying electricity to franchise customers and compares this with publicly available data on the cost of supplying electricity to other retail customers.191 Unlike the ETEF, retailers were still required to manage some price risk through arrangements such as those discussed in Section 7.2.1.
The LEP arrangement was the successor to the Queensland Benchmarking Pricing Agreement (BPA).192 In light of the recent privatisation of Queensland’s retail businesses the LEP scheme has been abandoned.
189 NEMMCO, National Electricity Market Settlement Auction Rules, p. 9. 190 Review of Regulated Retail Tariffs and Charges for Electricity 2007 to 2010, IPART, July 2006. 191 ERIG, Review of Energy Related Financial Markets: Electricity Trading, 2006, p. 76-77. 192 Under the terms of the BPA, retailers received a payment for supplying franchise customers with electricity and in the
event that total revenue exceeded expenses they would pay the State Treasury the difference.
The Wholesale Electricity Market Risk management
NERA Economic Consulting 81
7.2.4. Vertical Integration
One approach to hedge against market risk in the NEM is by combining retailing and generation businesses into one operation, or vertical integration. The benefit of such an approach is that it provides the merged entity with a physical hedge against adverse price movements, although it also creates other risks associated with managing generation capacity and load requirements and it does not entirely eliminate price risks.
The growing popularity of vertical integration as a means to manage price and volume risk is evident by the fact that the three major retailers in the NEM increased their share of generation capacity from 8.5 per cent to 14 per cent from 2002 to 2006.193 In particular energy retailers are directing their investments towards peaking assets which allow them to manage the risk due to peak and/or extreme price events.194
7.3. Effectiveness of Market Risk Tools
The effectiveness of any hedging strategy is dependant on having access to a market of sufficient depth so that the price of the hedging instrument is resilient to large orders. Whilst it is important to have an array of hedging tools available to enable participants to satisfy their differing requirements, these tools will be ineffective if there is no depth in the market. It follows that one of the requirements for the operation of the NEM is a liquid electricity financial market.
A liquid market, as defined in the ERIG Review of Energy Related Financial Markets, is one which has ready and willing buyers and sellers at all times. As the number of buyers and sellers increases, the depth of the market also increases. In this situation the price of electricity in a deeply liquid market would not be strongly influenced by anything other than extremely large transactions.
Such is the importance of liquidity in electricity financial markets that at least three reviews have been conducted since 2001 examining the issue.195 In the most recent review, the ERIG Review of Energy Related Financial Markets, it was noted that liquidity in energy markets serves two purposes in that it:
§ enables NEM participants to hedge cash flows without owning generation assets; and
§ enables price discovery.
7.3.1. Assessment - Hedging
In the most recent assessment of liquidity in electricity financial markets, the general consensus amongst retailers and generators is that the level of liquidity is sufficient for the
193 ERIG, Review of Energy Related Financial Markets: Electricity Trading, 2006, p. 68. 194 We outline in section 5 the extent of vertical integration currently in the NEM. 195 The reviews being; COAG Independent Review of Energy Market Directions, ERIG Review of Energy Related
Financial Markets and the Independent Survey of Contract Market Liquidity in the NEM conducted by the National Generators Forum and the Energy Retailers Association of Australia.
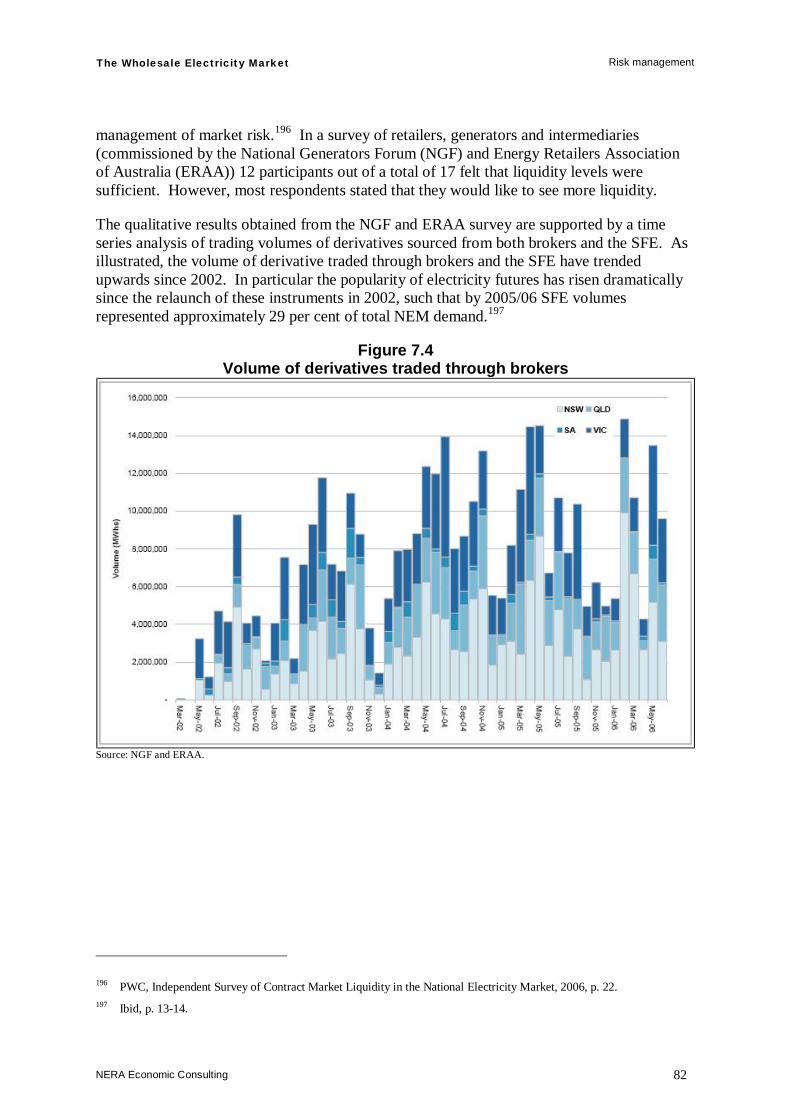
The Wholesale Electricity Market Risk management
NERA Economic Consulting 82
management of market risk.196 In a survey of retailers, generators and intermediaries (commissioned by the National Generators Forum (NGF) and Energy Retailers Association of Australia (ERAA)) 12 participants out of a total of 17 felt that liquidity levels were sufficient. However, most respondents stated that they would like to see more liquidity.
The qualitative results obtained from the NGF and ERAA survey are supported by a time series analysis of trading volumes of derivatives sourced from both brokers and the SFE. As illustrated, the volume of derivative traded through brokers and the SFE have trended upwards since 2002. In particular the popularity of electricity futures has risen dramatically since the relaunch of these instruments in 2002, such that by 2005/06 SFE volumes represented approximately 29 per cent of total NEM demand.197
Figure 7.4 Volume of derivatives traded through brokers
Source: NGF and ERAA.
196 PWC, Independent Survey of Contract Market Liquidity in the National Electricity Market, 2006, p. 22. 197 Ibid, p. 13-14.
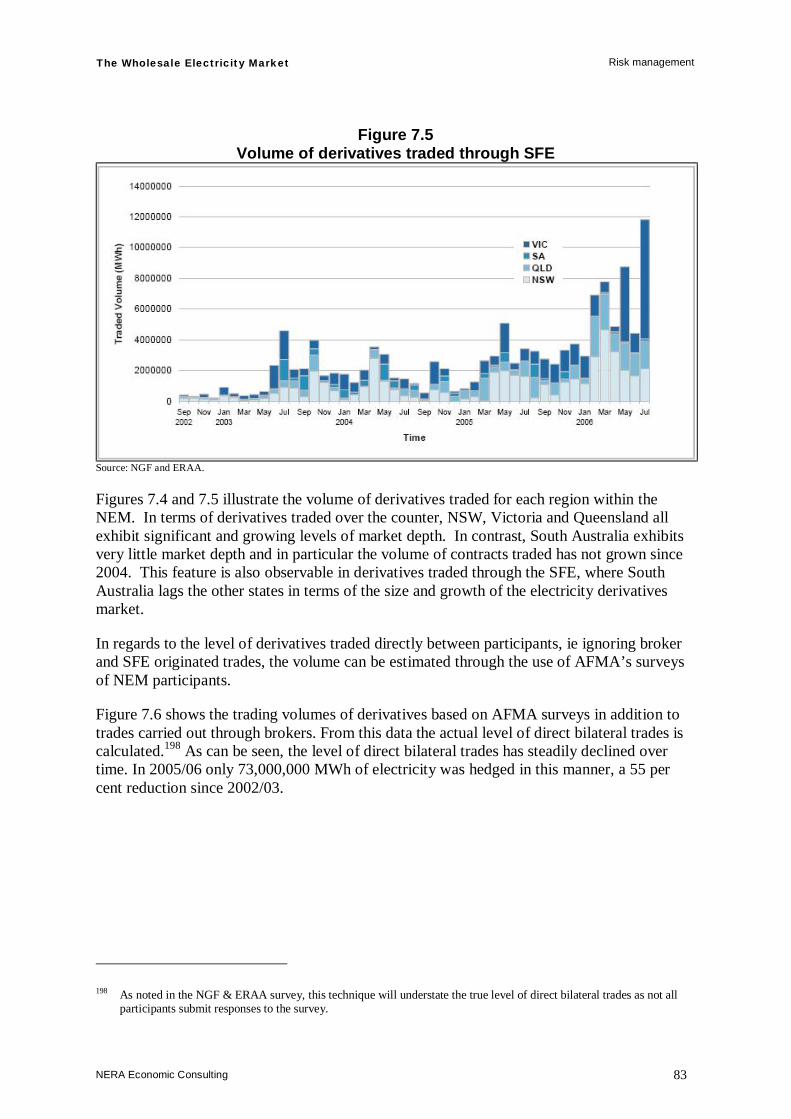
The Wholesale Electricity Market Risk management
NERA Economic Consulting 83
Figure 7.5 Volume of derivatives traded through SFE
Source: NGF and ERAA.
Figures 7.4 and 7.5 illustrate the volume of derivatives traded for each region within the NEM. In terms of derivatives traded over the counter, NSW, Victoria and Queensland all exhibit significant and growing levels of market depth. In contrast, South Australia exhibits very little market depth and in particular the volume of contracts traded has not grown since 2004. This feature is also observable in derivatives traded through the SFE, where South Australia lags the other states in terms of the size and growth of the electricity derivatives market.
In regards to the level of derivatives traded directly between participants, ie ignoring broker and SFE originated trades, the volume can be estimated through the use of AFMA’s surveys of NEM participants.
Figure 7.6 shows the trading volumes of derivatives based on AFMA surveys in addition to trades carried out through brokers. From this data the actual level of direct bilateral trades is calculated.198 As can be seen, the level of direct bilateral trades has steadily declined over time. In 2005/06 only 73,000,000 MWh of electricity was hedged in this manner, a 55 per cent reduction since 2002/03.
198 As noted in the NGF & ERAA survey, this technique will understate the true level of direct bilateral trades as not all
participants submit responses to the survey.
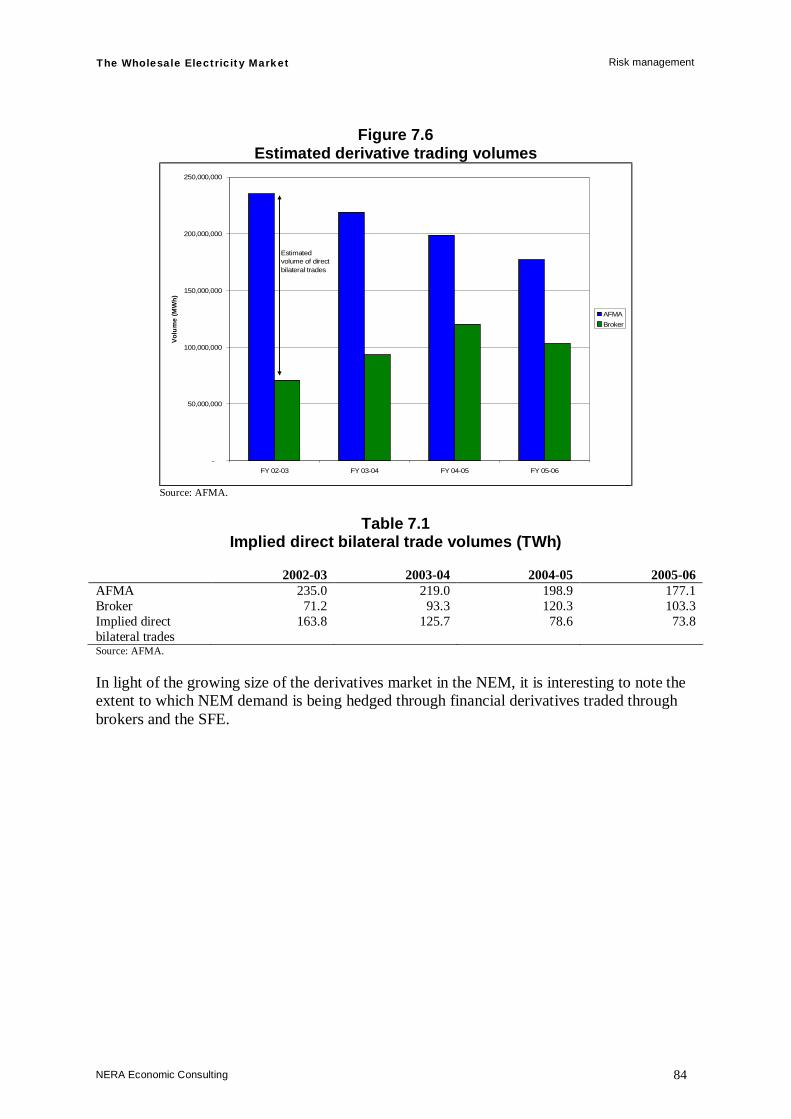
The Wholesale Electricity Market Risk management
NERA Economic Consulting 84
Figure 7.6 Estimated derivative trading volumes
-
50,000,000
100,000,000
150,000,000
200,000,000
250,000,000
FY 02-03 FY 03-04 FY 04-05 FY 05-06
Volu
me
(MW
h)
AFMABroker
Estimated volume of direct bilateral trades
Source: AFMA.
Table 7.1 Implied direct bilateral trade volumes (TWh)
2002-03 2003-04 2004-05 2005-06 AFMA 235.0 219.0 198.9 177.1 Broker 71.2 93.3 120.3 103.3 Implied direct bilateral trades
163.8 125.7 78.6 73.8
Source: AFMA.
In light of the growing size of the derivatives market in the NEM, it is interesting to note the extent to which NEM demand is being hedged through financial derivatives traded through brokers and the SFE.
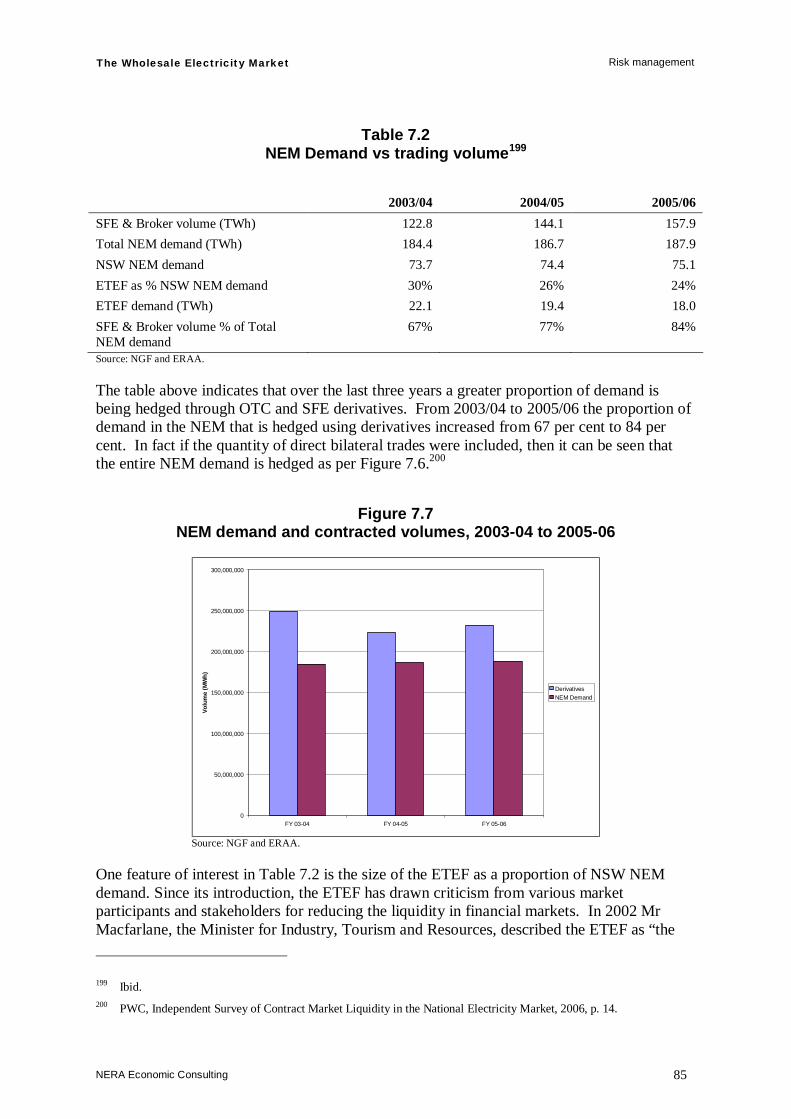
The Wholesale Electricity Market Risk management
NERA Economic Consulting 85
Table 7.2 NEM Demand vs trading volume199
2003/04 2004/05 2005/06 SFE & Broker volume (TWh) 122.8 144.1 157.9 Total NEM demand (TWh) 184.4 186.7 187.9 NSW NEM demand 73.7 74.4 75.1 ETEF as % NSW NEM demand 30% 26% 24% ETEF demand (TWh) 22.1 19.4 18.0 SFE & Broker volume % of Total NEM demand
67% 77% 84%
Source: NGF and ERAA.
The table above indicates that over the last three years a greater proportion of demand is being hedged through OTC and SFE derivatives. From 2003/04 to 2005/06 the proportion of demand in the NEM that is hedged using derivatives increased from 67 per cent to 84 per cent. In fact if the quantity of direct bilateral trades were included, then it can be seen that the entire NEM demand is hedged as per Figure 7.6.200
Figure 7.7 NEM demand and contracted volumes, 2003-04 to 2005-06
0
50,000,000
100,000,000
150,000,000
200,000,000
250,000,000
300,000,000
FY 03-04 FY 04-05 FY 05-06
Volu
me
(MW
h)
DerivativesNEM Demand
Source: NGF and ERAA.
One feature of interest in Table 7.2 is the size of the ETEF as a proportion of NSW NEM demand. Since its introduction, the ETEF has drawn criticism from various market participants and stakeholders for reducing the liquidity in financial markets. In 2002 Mr Macfarlane, the Minister for Industry, Tourism and Resources, described the ETEF as “the 199 Ibid. 200 PWC, Independent Survey of Contract Market Liquidity in the National Electricity Market, 2006, p. 14.
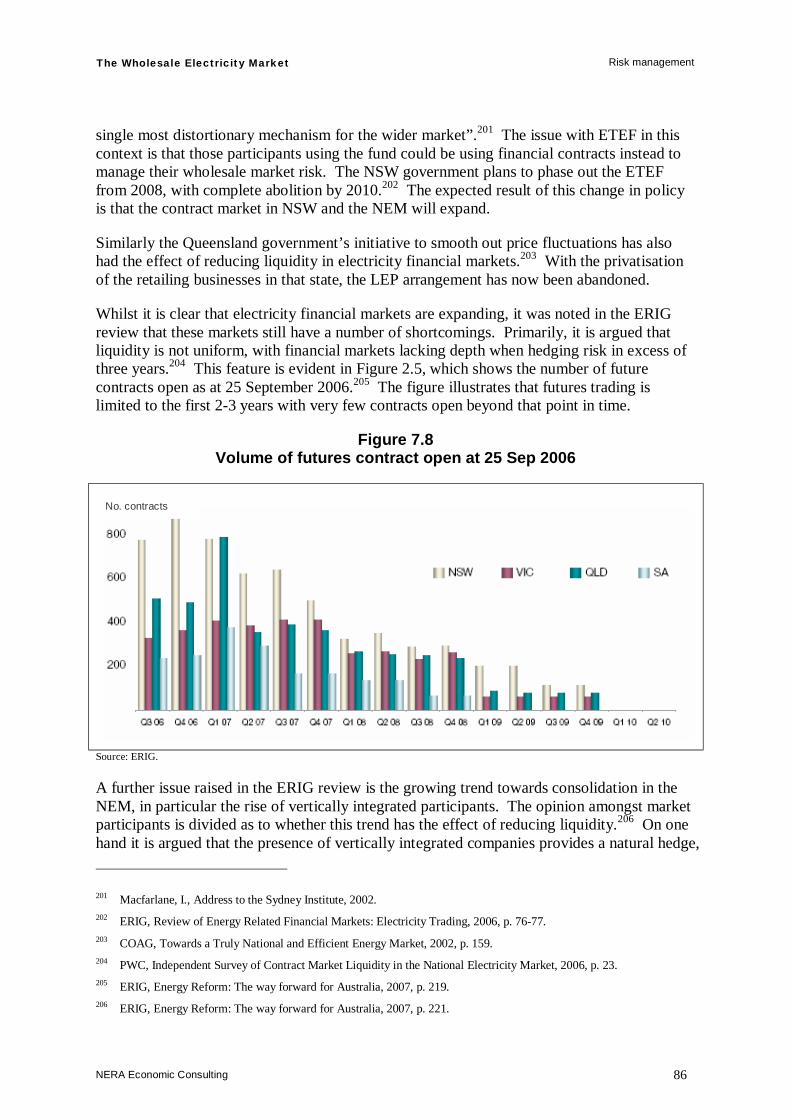
The Wholesale Electricity Market Risk management
NERA Economic Consulting 86
single most distortionary mechanism for the wider market”.201 The issue with ETEF in this context is that those participants using the fund could be using financial contracts instead to manage their wholesale market risk. The NSW government plans to phase out the ETEF from 2008, with complete abolition by 2010.202 The expected result of this change in policy is that the contract market in NSW and the NEM will expand.
Similarly the Queensland government’s initiative to smooth out price fluctuations has also had the effect of reducing liquidity in electricity financial markets.203 With the privatisation of the retailing businesses in that state, the LEP arrangement has now been abandoned.
Whilst it is clear that electricity financial markets are expanding, it was noted in the ERIG review that these markets still have a number of shortcomings. Primarily, it is argued that liquidity is not uniform, with financial markets lacking depth when hedging risk in excess of three years.204 This feature is evident in Figure 2.5, which shows the number of future contracts open as at 25 September 2006.205 The figure illustrates that futures trading is limited to the first 2-3 years with very few contracts open beyond that point in time.
Figure 7.8 Volume of futures contract open at 25 Sep 2006
Source: ERIG.
A further issue raised in the ERIG review is the growing trend towards consolidation in the NEM, in particular the rise of vertically integrated participants. The opinion amongst market participants is divided as to whether this trend has the effect of reducing liquidity.206 On one hand it is argued that the presence of vertically integrated companies provides a natural hedge, 201 Macfarlane, I., Address to the Sydney Institute, 2002. 202 ERIG, Review of Energy Related Financial Markets: Electricity Trading, 2006, p. 76-77. 203 COAG, Towards a Truly National and Efficient Energy Market, 2002, p. 159. 204 PWC, Independent Survey of Contract Market Liquidity in the National Electricity Market, 2006, p. 23. 205 ERIG, Energy Reform: The way forward for Australia, 2007, p. 219. 206 ERIG, Energy Reform: The way forward for Australia, 2007, p. 221.
No. contracts
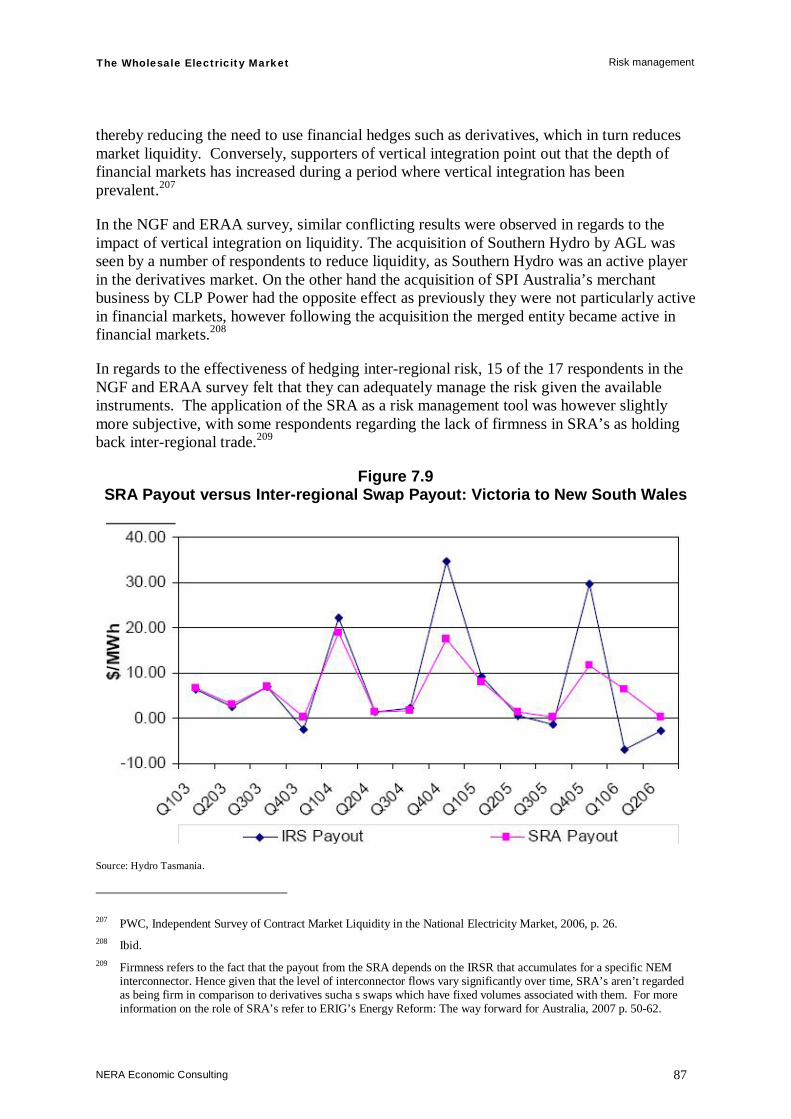
The Wholesale Electricity Market Risk management
NERA Economic Consulting 87
thereby reducing the need to use financial hedges such as derivatives, which in turn reduces market liquidity. Conversely, supporters of vertical integration point out that the depth of financial markets has increased during a period where vertical integration has been prevalent.207
In the NGF and ERAA survey, similar conflicting results were observed in regards to the impact of vertical integration on liquidity. The acquisition of Southern Hydro by AGL was seen by a number of respondents to reduce liquidity, as Southern Hydro was an active player in the derivatives market. On the other hand the acquisition of SPI Australia’s merchant business by CLP Power had the opposite effect as previously they were not particularly active in financial markets, however following the acquisition the merged entity became active in financial markets.208
In regards to the effectiveness of hedging inter-regional risk, 15 of the 17 respondents in the NGF and ERAA survey felt that they can adequately manage the risk given the available instruments. The application of the SRA as a risk management tool was however slightly more subjective, with some respondents regarding the lack of firmness in SRA’s as holding back inter-regional trade.209
Figure 7.9 SRA Payout versus Inter-regional Swap Payout: Victoria to New South Wales
Source: Hydro Tasmania.
207 PWC, Independent Survey of Contract Market Liquidity in the National Electricity Market, 2006, p. 26. 208 Ibid. 209 Firmness refers to the fact that the payout from the SRA depends on the IRSR that accumulates for a specific NEM
interconnector. Hence given that the level of interconnector flows vary significantly over time, SRA’s aren’t regarded as being firm in comparison to derivatives sucha s swaps which have fixed volumes associated with them. For more information on the role of SRA’s refer to ERIG’s Energy Reform: The way forward for Australia, 2007 p. 50-62.
The Wholesale Electricity Market Risk management
NERA Economic Consulting 88
Figure 7.9 illustrates the payout from an inter-regional swap (IRS payout) against the payout from SRA units across the VIC to NSW interconnector210. Given that the swap is a firm instrument, by contrasting the payout from the SRA against the swap, it is possible to examine the effectiveness of the SRA in hedging inter-regional risk.
As can be seen, for the most part the payout from both instruments is nearly identical. At certain times however, in particular Q404 and Q405, the payout from the SRA is less than the swap, reflecting transmission constraints and other physical factors that affect interconnector flows and hence the SRA payout. In these situations the SRA is an imperfect instrument to hedge inter-regional risk. Where the swap payout is negative, it is a reflection that the electricity is flowing in a different direction than that intended in the inter-regional swap.211
7.3.2. Assessment - Price Discovery
One of the key roles of the electricity financial market is that it can act as a medium for price discovery. With 50 to 70 per cent of all trades being direct and bi-lateral,212 market participants have limited access to pricing information. Without access to this information participants, and in particular new entrants, may face some difficulty in assessing and pricing the cost of hedging their exposure to market risk.
In light of this difficulty, the futures market is playing an increasingly important role for participants in assessing the cost of hedging. It was generally accepted in the NGF and ERAA survey that transparency though futures and brokers play an important role in facilitating trading and assessing risk. Interestingly, the absence of price information arising due to the dominance of direct bilateral trades was not seen as an impediment to price discovery.213
One issue of concern noted in the ERIG review was that price discovery through the futures market was very difficult for periods exceeding three years. Given the lack of depth in the market, represented by very few open contracts extending beyond three years, market participants must use other sources of information to examine future price trends. One consequence of this problem is that it is difficult to evaluate long term hedging costs associated with decisions such as investing in generation assets.
7.4. Managing Settlement Risk and Credit Risk
7.4.1. Spot Market
In order to manage settlement and credit risk in the spot market, NEMMCO has established a prudential framework which imposes obligations on market participants. These obligations involve four key areas; credit criteria, credit support, a maximum credit limit and a trading limit.
210 The VIC – NSW interconnector is actually represented by the VIC – SNOWY – NSW interconnector. 211 ERIG, Review of Energy Related Financial Markets: Electricity Trading, 2006, p. 53-60. 212 Ibid, p. 21. 213 Ibid, p. 24
The Wholesale Electricity Market Risk management
NERA Economic Consulting 89
7.4.1.1. Credit Criteria
All registered entities participating in the NEM, as defined in Section 2.1, are required to meet certain criteria under the National Electricity Code. The first requirement is that the entity must be under supervision by either the Australian Prudential Regulation Authority (APRA) or a relevant State or Territory body214.
Additionally each entity is required to hold an acceptable credit rating. In regards to this matter an acceptable credit rating is defined as being higher than A-1 under the Standard and Poor’s index or higher than Moodys P-1.
On top of these requirements, each entity must provide credit support to NEMMCO. Where an entity cannot provide such support on their own right then they must obtain this from an entity that satisfies the required credit criteria.215
7.4.1.2. Credit Support
Credit support relates to the requirement for each entity to pay NEMMCO unconditionally on demand and up to a nominated limit. This requirement is satisfied by providing NEMMCO with certain instruments issued by an entity that meets the acceptable credit criteria. The entity from which the instruments originate cannot be a participant in the NEM.
Of the types of instruments that can be provided as credit support, the most common is a bank guarantee. Other forms of credit support include security deposits in the form of cash lodged with NEMMCO.
In addition to requiring credit support from participants in the NEM, NEMMCO can issue call notices to market participants. A call notice is a demand for the provision of additional credit support and must be met by 11am on the next business day. Failure to do so can lead to a default notice and at worst market suspension.216
7.4.1.3. Maximum Credit Limit
In its role as the market operator, NEMMCO provides financial settlement services such as billing and collecting funds for each trade in the market. In carrying out this role there exists the risk that there may be a shortfall in funds collected.
NEMMCO minimises this risk by imposing on each participant a maximum credit limit (MCL). The MCL represents the worst-case estimate of NEMMCO’s exposure to any financial participant over a 42-day trading period. From the MCL, NEMMCO is able to calculate the acceptable amount of collateral (credit support) that each participant is required to lodge.
214 NEMMCO, Australia’s National Electricity Market: Trading Arrangements in the NEM, p. 14 215 For further information on credit criteria refer to the NEMMCO paper Australia’s National Electricity Market: Trading
Arrangements in the NEM. 216 In the event of a market suspension the jurisdiction in which the entity operated may nominate a retailer of last resort to
assume responsibilities for delivering electricity supply.
The Wholesale Electricity Market Risk management
NERA Economic Consulting 90
7.4.1.4. Trading Limit
The establishment of a trading limit is designed to provide NEMMCO with an early warning that the MCL may be breached. The trading limit is set at 84 per cent of a participant’s MCL, with the 16 per cent difference providing NEMMCO with sufficient notice to issue a call requesting additional credit support.
7.4.2. Forward Market
One of the fundamental differences between the two forms of derivatives discussed in Section 7.2 is that they can be either OTC or exchange-traded. The form that the derivative takes has significant implications on the level of credit and settlement risk of the contract.
For OTC derivatives, the management of credit risk is the responsibility of each market participant. With every forward contract, there is a certain degree of risk that the counterparty may not be able to pay for reasons such as changes in the underlying electricity price or to their credit status. It is therefore the usual practice for each market participant to establish credit limits with counterparties in order to minimise their exposure to default. The ERIG review concluded that there is little evidence that credit default risk is priced into the contract market.217
As is briefly discussed in Section 7.1, the exchange-traded derivatives market contains a mechanism to manage credit risk. Through its role as the clearing house, the SFE Clearing Corporation acts as the counterparty to every trade and therefore is liable to perform against all contracts. This eliminates the need for participants to assess the credit level of potential counterparties, which in turn enhances the attractiveness of the SFE and thus promotes liquidity.218
217 ERIG, Review of Energy Related Financial Markets: Electricity Trading, 2006, p. 81. 218 For further information on credit risk in the spot and forward markets refer to the 2006 ERIG Review of Energy Related
Financial Markets.
The Wholesale Electricity Market Recent reviews of the wholesale electricity market
NERA Economic Consulting 91
8. Recent reviews of the wholesale electricity market
The operation of the wholesale electricity market has undergone a number of reviews since its inception in 1998, to ensure that it is operating in a manner consistent with market efficiency principles, and delivering appropriate incentives for new generation investment. Some of these reviews include:
§ an independent review chaired by Warwick R. Parer, which was commissioned by the Council of Australian Governments to examine the strategic directions for energy market reform including the governance and regulatory reforms required across both the gas and electricity markets (Parer Review) – 2002;
§ a review by the Productivity Commission of National Competition Policy Reforms, which included a consideration of the reforms as they related to the energy sector – 2005;
§ a further review by the Productivity Commission of the potential benefits of the National Reform Agenda, also including a consideration of the benefits as they related to the electricity sector – 2007; and
§ a review of certain elements of the operation of the energy sector by the Energy Reform Implementation Group (ERIG), which was established by the Council of Australian Governments – 2007.
The Parer Review was commenced at a time where there was some criticism about the competition reforms that had resulted in significant changes to the structure of the electricity and gas markets in Australia. In particular, some commentators blamed the reforms for increases in energy prices, eg, in South Australia at the time, due to the scope for generators to exercise market power.219 The key findings from the review as relevant to the operation of the wholesale market included:220
§ there was insufficient generator competition for the gross pool system to work as intended; and
§ there was a lack of liquidity in the financial contracts market, due in large part to regulatory uncertainty.
To address these market deficiencies, Parer recommended that there be changes to the regulatory structure, including the Ministerial Council on Energy subsuming the responsibilities of the previous NEM Ministers Forum to direct energy policy, and the creation of a national energy regulator to replace the existing jurisdictional based regulators. To address market operation concerns, the recommendations focused on the removal of the ETEF and Benchmark Pricing Arrangements in NSW and Queensland respectively; disaggregating generators in NSW to improve competition; and the development of specific criteria by the ACCC to apply when considering mergers between generators.
219 Parer, Warwick R, Towards a Truly National and Efficient Energy Market, 20 December 2002, p.7. 220 Ibid, p.9.
The Wholesale Electricity Market Recent reviews of the wholesale electricity market
NERA Economic Consulting 92
Many of the reforms in the energy market that are currently being implemented stem from these original Parer Review recommendations, (although the ACCC has not seen the need to develop specific criteria for assessing generator mergers).
Following the Review, the MCE determined in late 2003 to address the concerns identified through the development of further reforms relating to market governance, economic regulation, electricity transmission development and planning, and energy user participation, amongst others.221 This new energy market reform program was endorsed by COAG in 2004 and included agreement to establish the Australian Energy Regulator and the Australian Energy Market Commission.
As part of the Productivity Commission’s review of NCP reforms, a number of gaps were identified in the energy reform program. These included:222
§ a need to strengthen competition in the generation sector, particularly in those regions dominated by government-owned generators; and
§ the need to examine the competition laws as they apply to potential mergers between transmission and generation businesses.
In general, the PC indicated that existing competition law was sufficient to address concerns surrounding potential mergers between generators.
The most recent review of the energy market reforms has been recently completed by the ERIG. The key findings from the review include identifying a need:223
§ to improve the operation of the electricity market by increasing contestability in generation, further disaggregation, privatisations and improving competitive neutrality provisions;
§ to improve the financial trading mechanisms particularly supporting interstate trade, to improve the firmness of inter-regional trading rights, and by contracting relevant generators to support inter-regional electricity flows; and
§ to improve the settlement arrangements between the spot and contract markets to reduce the duplication of credit requirements and lower barriers to entry.
Improving competition amongst the government-owned electricity businesses was a key finding. ERIG concluded that:224
Disaggregation of significant retail and generation portfolios, followed by privatisation, is the most effective solution to most of these problems and would increase the overall efficiency of Australia’s energy sectors.
221 Including relating to the natural gas market and addressing greenhouse emissions from the energy sector (MCE report
to COAG, 11 December 2003, p.4). 222 PC, Review of National Competition Policy Arrangements, 28 February 2005, p.185. 223 ERIG, Energy Reform: the way forward for Australia, January 2007, p.1. 224 Ibid, p.8.
The Wholesale Electricity Market Recent reviews of the wholesale electricity market
NERA Economic Consulting 93
In response to the ERIG report, the COAG has recently agreed that the AEMC and NEMMCO should investigate ways to improve the integration of the spot and contract markets, to improve prudential requirements and thereby efficiency in the operation of the wholesale market.225 There was no response to ERIG’s findings relating to the need to improve contestability in the operation of the market.
In essence, future reforms to the operation of the wholesale electricity market are likely to build on earlier reforms that have each sought to improve competition in the wholesale market, and the efficiency of the trading mechanisms, particularly as they relate to access to financial risk instruments.
225 COAG Communique, 13 April 2007.
The Wholesale Electricity Market Issues for retail competition
NERA Economic Consulting 94
9. Issues for retail competition
In this report we have provided an overview of the structure and operation of the wholesale national electricity market across the eastern seaboard of Australia. Our focus has been to provide a snapshot of the market structure within each of the NEM regions, by identifying generator capacity and ownership, electricity supply and retailer customer share. In addition, we have outlined the tools used to manage the risks associated with providing retail services, particularly managing wholesale price risks.
In summary the National Electricity Market is made up of six regions based on state boundaries with the addition of the Snowy region where:
§ transmission and distribution services are provided by an interconnected common carriage network of high and low voltage lines;
§ coal-fired generators are the main source of electricity output and capacity, providing approximately 86 per cent of total electricity output in the market; and
§ generation capacity (to meet increasing demand, particularly for peak load) has been increasing through investment in peaking gas-fired plants, and there is likely to be a need for additional generation capacity investment in the near future.
While for presentational convenience we have presented information in this report on generator capacity and output by NEM region, any assessment of the competitiveness of the wholesale market requires an analysis of the nature and extent of competitive intensity by generators across the NEM regions.
Ongoing development of the NEM and particularly the market operating rules and regulatory structures are also likely to influence the operation of the wholesale market and behaviour of market participants, with subsequent implications for retail competition. The likely impact of these changes should also be taken into account in an assessment of the effectiveness of retail competition.
Finally, there are emerging circumstances arising from the current state of the market that may influence retail competition. Some of these include:
§ proposals for reform to the operation of the wholesale market (the ERIG reform proposals), that have as their objective the increasing of contestability amongst generators;
§ increasing attention to carbon emissions, leading to a greater likelihood that Australia will consider mechanisms to limit carbon emissions;
§ the decision by the NSW government to abolish the Electricity Tariff Equalisation Fund, will result in NSW retailers increasing demand for alternative risk management tools such as derivative contracts; and
§ a tendency by some private retailers to invest directly in generation capacity to provide a natural hedge against wholesale price increases.
The Wholesale Electricity Market Issues for retail competition
NERA Economic Consulting 95
In the remainder of this chapter we focus on wholesale market competition, the sources of price variations and implications for retail competition.
9.1. Observations on the extent of wholesale competition
As we have outlined in greater detail for each NEM region in section 3, there are a relatively large number of generation companies competing to supply electricity into the market. For example, 15 generation companies each control in excess of 2 per cent of total NEM generation capacity, and supplied over 86 per cent of total electricity to the market in 2005/06.
As outlined above, an analysis of wholesale market competition requires a consideration of a number of factors including:
§ the degree of substitutability between generation in each region, which requires a consideration of losses affecting generator competitiveness between regions and the frequency of interconnector constraints;
§ the portfolio of generation assets owned by a single generation company, since this can affect its incentive and ability to influence market prices; and
§ the relative market shares for generators.
The relative market share of a generator however will not necessarily be indicative of competition in the market. It is possible for a generator with relatively low market share to influence wholesale prices, by controlling generation assets within critical segments of the price stack. All of the above factors should therefore be considered as part of an assessment of competition in the wholesale market, with subsequent implications for retail competition.
Turning to the relative market shares for generators in New South Wales, Queensland and Tasmania, the majority of each region’s electricity is supplied by government owned generators. In these jurisdictions, each business has a large share of total generation capacity and output both within their respective NEM region and the entire NEM - Table 9.1.
For the remaining NEM regions, private provision of generation has led to a larger number of generation companies. This has meant that the total capacity share and proportion of output for any one generator tends to be lower than generators in states with a majority of government owned generators. For example, in Victoria five generators each have capacity shares in excess of 10 per cent, with the largest supplying 33 per cent and the smallest 0.9 per cent of Victorian electricity output in 2005/06.
In addition, the market share of the larger generators has been steadily eroded through ongoing investment in alternative energy sources. We anticipate that this will continue, particularly with increased concern about carbon emissions and the potential introduction of a national carbon trading scheme. While a significant carbon tax would be required to price existing coal-fired power plants entirely out of the market, support for generation capacity that has lower carbon emissions, where these investments are not made by existing generators, will impact on market shares by existing generators in the wholesale market.
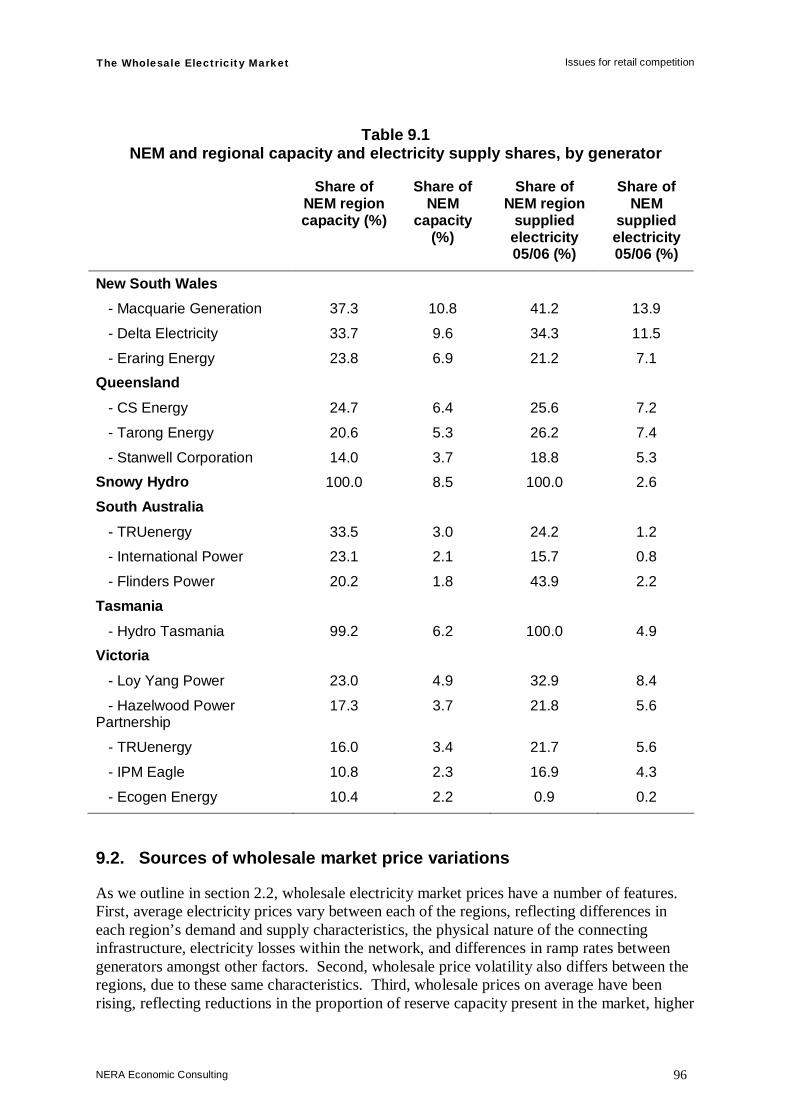
The Wholesale Electricity Market Issues for retail competition
NERA Economic Consulting 96
Table 9.1 NEM and regional capacity and electricity supply shares, by generator
Share of NEM region capacity (%)
Share of NEM
capacity (%)
Share of NEM region
supplied electricity 05/06 (%)
Share of NEM
supplied electricity 05/06 (%)
New South Wales
- Macquarie Generation 37.3 10.8 41.2 13.9
- Delta Electricity 33.7 9.6 34.3 11.5
- Eraring Energy 23.8 6.9 21.2 7.1 Queensland
- CS Energy 24.7 6.4 25.6 7.2
- Tarong Energy 20.6 5.3 26.2 7.4
- Stanwell Corporation 14.0 3.7 18.8 5.3 Snowy Hydro 100.0 8.5 100.0 2.6
South Australia
- TRUenergy 33.5 3.0 24.2 1.2
- International Power 23.1 2.1 15.7 0.8
- Flinders Power 20.2 1.8 43.9 2.2
Tasmania
- Hydro Tasmania 99.2 6.2 100.0 4.9 Victoria
- Loy Yang Power 23.0 4.9 32.9 8.4
- Hazelwood Power Partnership
17.3 3.7 21.8 5.6
- TRUenergy 16.0 3.4 21.7 5.6
- IPM Eagle 10.8 2.3 16.9 4.3
- Ecogen Energy 10.4 2.2 0.9 0.2
9.2. Sources of wholesale market price variations
As we outline in section 2.2, wholesale electricity market prices have a number of features. First, average electricity prices vary between each of the regions, reflecting differences in each region’s demand and supply characteristics, the physical nature of the connecting infrastructure, electricity losses within the network, and differences in ramp rates between generators amongst other factors. Second, wholesale price volatility also differs between the regions, due to these same characteristics. Third, wholesale prices on average have been rising, reflecting reductions in the proportion of reserve capacity present in the market, higher
The Wholesale Electricity Market Issues for retail competition
NERA Economic Consulting 97
coal prices due to increased export demand, and most recently due to supply constraints arising from drought restricting water availability for some major electricity generators.
To manage price volatility, there has been an increase in the volume of financial hedging arrangements such as over-the-counter and broker contracts. This allows retailers to lock-in their wholesale costs for periods of up to three years. Beyond three years, contract liquidity reduces, in part due to the uncertainty about wholesale prices after that period.
Concern has been expressed that the liquidity of contract or derivative instruments based on the wholesale electricity market may be affected by increasing vertical integration between some electricity retailers and generators. In practice however, the relationship between vertical integration and contract market liquidity is unlikely to be so straightforward. Some factors to consider in relation to this issue are:
§ a retailer is unlikely to operate its own generator out of the merit order, ie, if it would be cheaper to purchase electricity on the spot market, thereby creating some incentive to manage spot market price volatility;
§ it is extremely unlikely that a retailer’s load profile will precisely match its generation portfolio, optimally dispatched, thereby necessitating the use of derivative instruments to manage wholesale market risks arising from mismatches in its balance between load and in-the-merit-order generation; and
§ a natural hedge does not eliminate all price risks, in part because physical risks associated with not being able to generate electricity (such as generator or transmission outages) when required can still arise.
ERIG observes that the incidence of price spikes within the market has been increasing over recent years. It implies that this is a problem within the market, such that interventions may be required to ‘solve’ this problem. In our view however, the simple observation that the numbers of price spikes are increasing is not itself evidence of a problem. Rather, it may well be a simple consequence of the market indicating the need for new generation investment.
The recent price rises observed in the wholesale market have been driven particularly by a number of generators having to restrict output due to a lack of cooling water to operate their plants. These price rises represent the actual out-workings of the wholesale market as demand and supply are equated for each dispatch interval. We would anticipate that the current high prices will result in some proposed generation projects being accelerated.
These developments on the supply side highlight a wider question about the relationship between wholesale prices, price volatility risk management and retail prices. In principle, hedging arrangements allow retailers to manage price volatility risks. However, where there are sudden changes in input prices, these can be expected to be passed through to customers in the form of higher (or lower) prices. For example, when airlines were faced with large increases in the price of airline fuel, they imposed an additional levy on all tickets. Any limitation on electricity retailers from increasing retail charges in response to higher wholesale costs is likely to have a detrimental effect on competition.
The Wholesale Electricity Market Issues for retail competition
NERA Economic Consulting 98
When considering the effectiveness of retail competition it is therefore important to consider the scope for new entrants not only to manage price volatility but also to respond to structural price changes.
9.3. Implications for retail electricity competition
Effective retail competition requires electricity retailers, and particularly new entrants, to have access to wholesale electricity markets and subsequent transmission and distribution services, to allow them to manage retail customer demand. Even where retailers own interests in generation, the nature of the wholesale market and the operation of the electricity system as a network mean that a retailer’s load may often not be coincident with its own generation. The wholesale electricity market provides retailers the opportunity to manage demand and supply to meet customers’ needs.
The key role of a retailer is therefore to manage the financial and physical risks that arise in supplying the retail market at predetermined fixed prices. Effective retail competition therefore requires retailers to be able to:
§ access wholesale electricity supplies, which is achieved through access to the NEM spot market allowing retailers to purchase electricity when required to meet customer needs, and also manage demand variations;
§ access hedging instruments to provide an opportunity to manage price volatility risks in the NEM, as required, although there is debate about whether the hedging market and spot market are indeed separate ‘markets’ in competition terms; and
§ flexibility to manage exogenous shocks, such as those arising from significant wholesale electricity cost increases – as in the example of airline fuel levies.
As indicated above, in competition terms it is open to debate whether the hedging market and electricity spot market are sufficiently separate such that any reduction in liquidity in the hedging market (say, arising from vertical integration) is a potential impediment to competitive entry in the electricity retail market. Some factors to consider include:
§ the spot market is, by definition, a substitute for the hedging market, since it is always possible for a retailer to settle its requirements exclusively by reference to the spot market if there are insufficient hedging products available;
§ in theory, the price of a hedge should equal the expected value of the future spot price plus the cost/value of any financial risks transferred, such that hedging amounts to a form of insurance that allows both generators and retailers to improve the management of cash flows;
§ there are transactions costs associated with hedging, such that it is not itself a costless exercise;
§ hedging is not itself a risk free process since the cost usually means that retailer’s do not hedge their full requirements, and in any case it is necessary to decide how much of a retailer’s expected load to hedge.
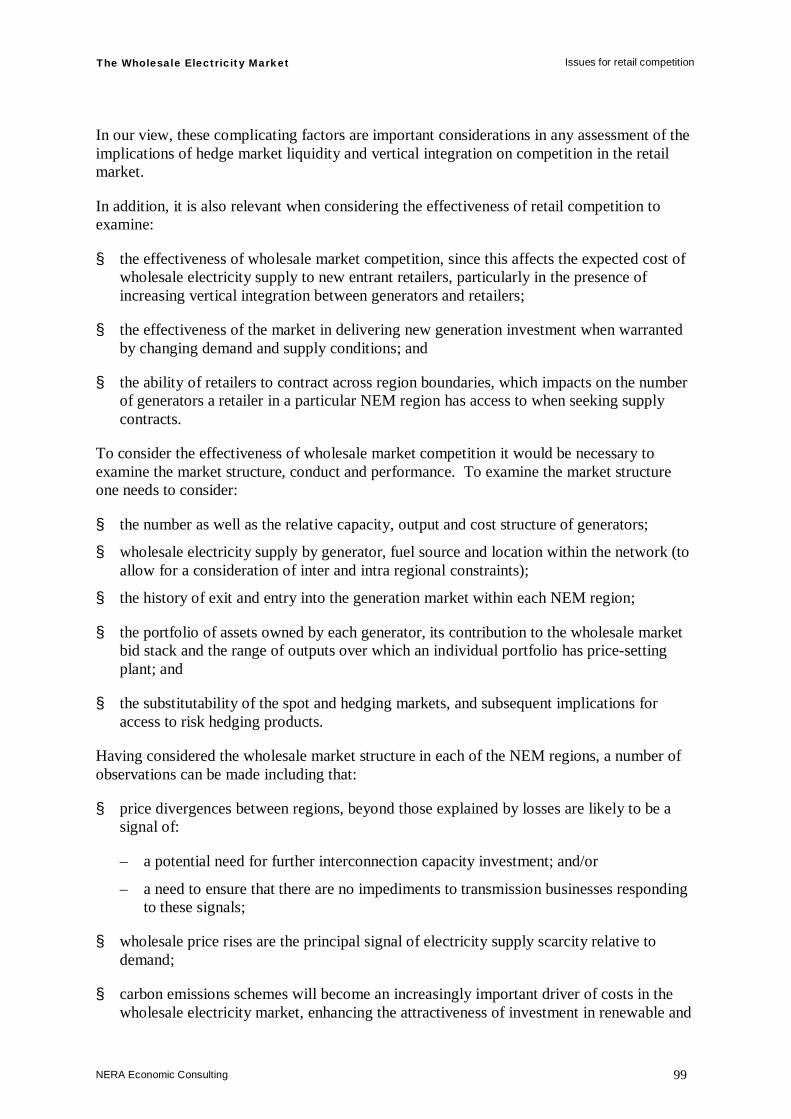
The Wholesale Electricity Market Issues for retail competition
NERA Economic Consulting 99
In our view, these complicating factors are important considerations in any assessment of the implications of hedge market liquidity and vertical integration on competition in the retail market.
In addition, it is also relevant when considering the effectiveness of retail competition to examine:
§ the effectiveness of wholesale market competition, since this affects the expected cost of wholesale electricity supply to new entrant retailers, particularly in the presence of increasing vertical integration between generators and retailers;
§ the effectiveness of the market in delivering new generation investment when warranted by changing demand and supply conditions; and
§ the ability of retailers to contract across region boundaries, which impacts on the number of generators a retailer in a particular NEM region has access to when seeking supply contracts.
To consider the effectiveness of wholesale market competition it would be necessary to examine the market structure, conduct and performance. To examine the market structure one needs to consider:
§ the number as well as the relative capacity, output and cost structure of generators;
§ wholesale electricity supply by generator, fuel source and location within the network (to allow for a consideration of inter and intra regional constraints);
§ the history of exit and entry into the generation market within each NEM region;
§ the portfolio of assets owned by each generator, its contribution to the wholesale market bid stack and the range of outputs over which an individual portfolio has price-setting plant; and
§ the substitutability of the spot and hedging markets, and subsequent implications for access to risk hedging products.
Having considered the wholesale market structure in each of the NEM regions, a number of observations can be made including that:
§ price divergences between regions, beyond those explained by losses are likely to be a signal of:
– a potential need for further interconnection capacity investment; and/or
– a need to ensure that there are no impediments to transmission businesses responding to these signals;
§ wholesale price rises are the principal signal of electricity supply scarcity relative to demand;
§ carbon emissions schemes will become an increasingly important driver of costs in the wholesale electricity market, enhancing the attractiveness of investment in renewable and
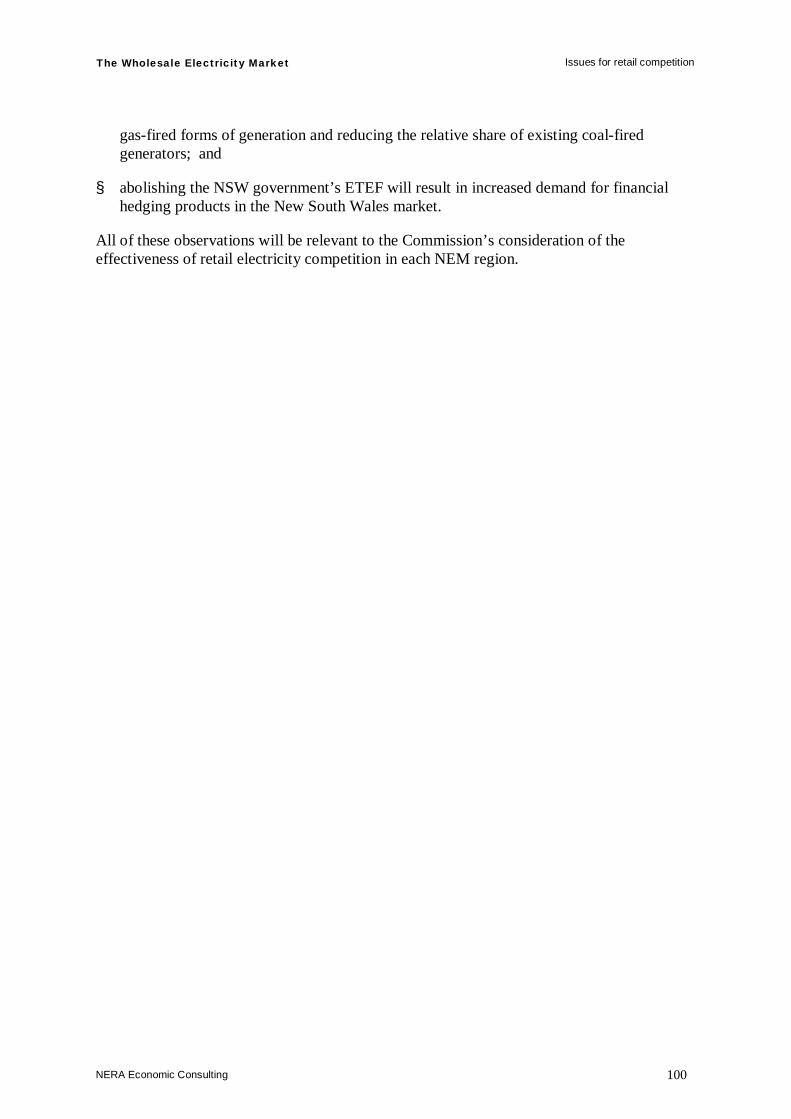
The Wholesale Electricity Market Issues for retail competition
NERA Economic Consulting 100
gas-fired forms of generation and reducing the relative share of existing coal-fired generators; and
§ abolishing the NSW government’s ETEF will result in increased demand for financial hedging products in the New South Wales market.
All of these observations will be relevant to the Commission’s consideration of the effectiveness of retail electricity competition in each NEM region.
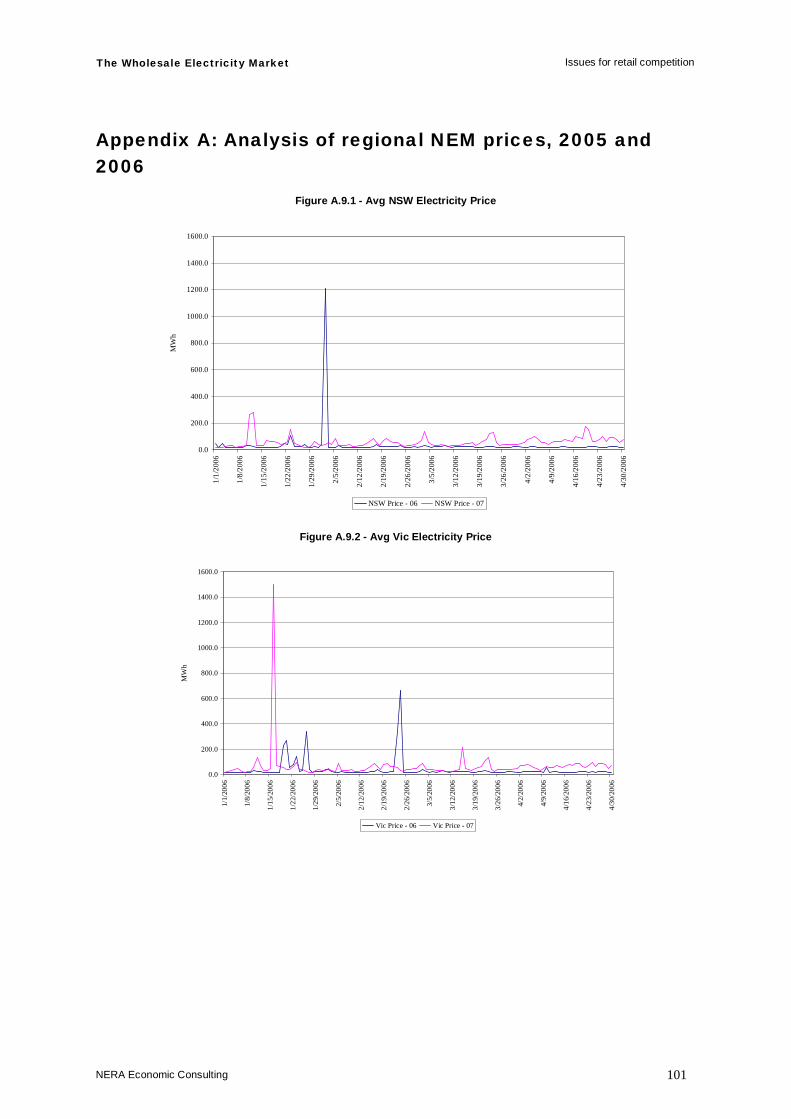
The Wholesale Electricity Market Issues for retail competition
NERA Economic Consulting 101
Appendix A: Analysis of regional NEM prices, 2005 and 2006
Figure A.9.1 - Avg NSW Electricity Price
0.0
200.0
400.0
600.0
800.0
1000.0
1200.0
1400.0
1600.0
1/1/
2006
1/8/
2006
1/15
/200
6
1/22
/200
6
1/29
/200
6
2/5/
2006
2/12
/200
6
2/19
/200
6
2/26
/200
6
3/5/
2006
3/12
/200
6
3/19
/200
6
3/26
/200
6
4/2/
2006
4/9/
2006
4/16
/200
6
4/23
/200
6
4/30
/200
6
MW
h
NSW Price - 06 NSW Price - 07 Figure A.9.2 - Avg Vic Electricity Price
0.0
200.0
400.0
600.0
800.0
1000.0
1200.0
1400.0
1600.0
1/1/
2006
1/8/
2006
1/15
/200
6
1/22
/200
6
1/29
/200
6
2/5/
2006
2/12
/200
6
2/19
/200
6
2/26
/200
6
3/5/
2006
3/12
/200
6
3/19
/200
6
3/26
/200
6
4/2/
2006
4/9/
2006
4/16
/200
6
4/23
/200
6
4/30
/200
6
MW
h
Vic Price - 06 Vic Price - 07
The Wholesale Electricity Market Issues for retail competition
NERA Economic Consulting 102
Figure A.9.3 - Avg SA Electricity Price
0.0
100.0
200.0
300.0
400.0
500.0
600.0
700.0
800.0
900.0
1000.0
1/1/
2006
1/8/
2006
1/15
/200
6
1/22
/200
6
1/29
/200
6
2/5/
2006
2/12
/200
6
2/19
/200
6
2/26
/200
6
3/5/
2006
3/12
/200
6
3/19
/200
6
3/26
/200
6
4/2/
2006
4/9/
2006
4/16
/200
6
4/23
/200
6
4/30
/200
6
MW
h
SA Price - 06 SA Price - 07 Figure A.9.4 - Avg Snowy Electricity Price
0.0
100.0
200.0
300.0
400.0
500.0
600.0
1/1/2006
1/8/2006
1/15/2006
1/22/2006
1/29/2006
2/5/2006
2/12/2006
2/19/2006
2/26/2006
3/5/2006
3/12/2006
3/19/2006
3/26/2006
4/2/2006
4/9/2006
4/16/2006
4/23/2006
4/30/2006
Snowy Price - 06 Snowy Price - 07
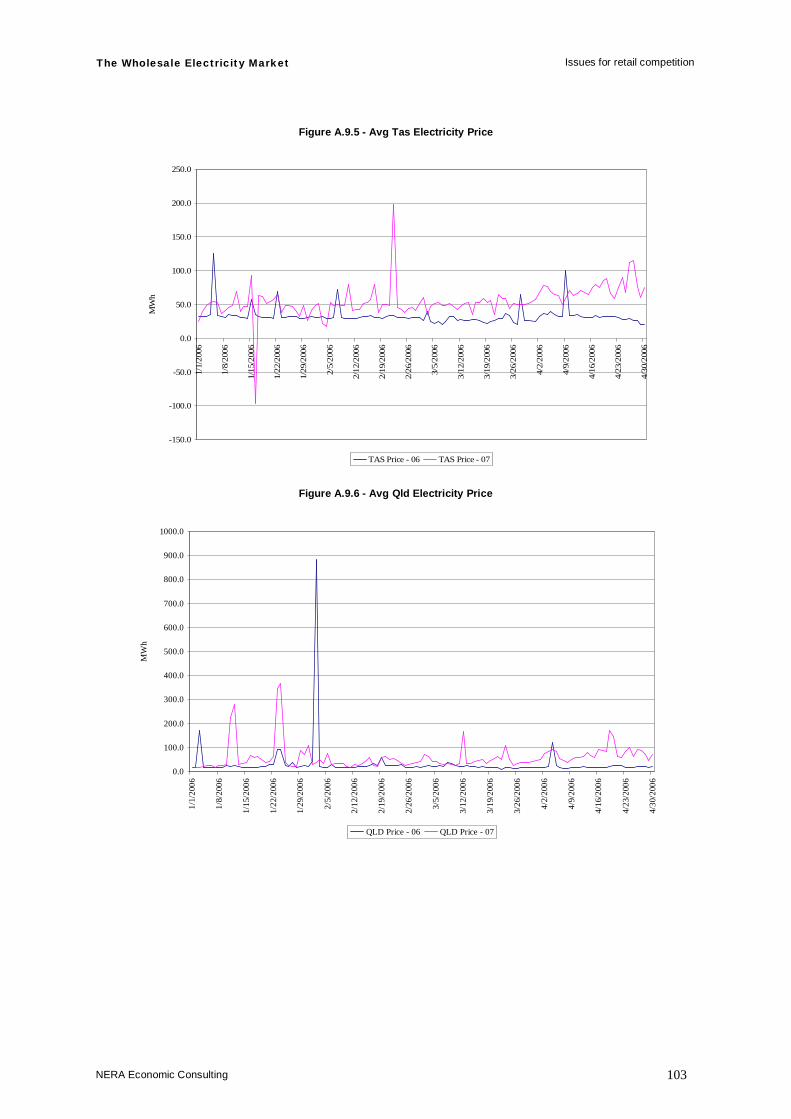
The Wholesale Electricity Market Issues for retail competition
NERA Economic Consulting 103
Figure A.9.5 - Avg Tas Electricity Price
-150.0
-100.0
-50.0
0.0
50.0
100.0
150.0
200.0
250.0
1/1/
2006
1/8/
2006
1/15
/200
6
1/22
/200
6
1/29
/200
6
2/5/
2006
2/12
/200
6
2/19
/200
6
2/26
/200
6
3/5/
2006
3/12
/200
6
3/19
/200
6
3/26
/200
6
4/2/
2006
4/9/
2006
4/16
/200
6
4/23
/200
6
4/30
/200
6
MW
h
TAS Price - 06 TAS Price - 07 Figure A.9.6 - Avg Qld Electricity Price
0.0
100.0
200.0
300.0
400.0
500.0
600.0
700.0
800.0
900.0
1000.0
1/1/
2006
1/8/
2006
1/15
/200
6
1/22
/200
6
1/29
/200
6
2/5/
2006
2/12
/200
6
2/19
/200
6
2/26
/200
6
3/5/
2006
3/12
/200
6
3/19
/200
6
3/26
/200
6
4/2/
2006
4/9/
2006
4/16
/200
6
4/23
/200
6
4/30
/200
6
MW
h
QLD Price - 06 QLD Price - 07
NERA Economic Consulting Darling Park Tower 3 201 Sussex Street Sydney NSW 2000 Tel: +61 2 8864 6500 Fax: +61 2 8864 6549 www.nera.com
NERA Australia Pty Ltd, ABN 34 092 959 665