Embed Size (px)
Citation preview

The Weekly Dig – February 24, 2017 Mick Carew, PhD [email protected]
Emma Boggio, MSA, CPA (Mass.) 604-697-6166 [email protected]
and the Haywood Mining Team
Member of the Canadian Investor Protection Fund
Please see page 40 for Analyst Certification, and pages 40 to 47 for Important
Information and Legal Disclaimers, Rating Structure, and notes.
Gold Mining Equities Slide despite Gold Surging Above $1,250
It was an unusual week for gold mining equities. While the price of gold surged amid weakness in the U.S. dollar, gold mining equities followed a downward trend, with the S&P/TSX Gold Mining Index falling 1.5% this week to finish at 216. The gold price surged past the $1,250 level, briefly touching $1,260 per ounce before settling at $1,256 per ounce on Friday. Global markets in general were mixed; the S&P/TSX Composite Index fell almost 350 point to close at 15533, while the Dow Jones Industrial Average closed higher for the week, up 50 points to 20821. The mixed performance in global markets followed a number of comments made by President Trump, which included his willingness to increase his Country’s nuclear arsenal. Furthermore, some commentators have alluded to the end of the “Trump Bubble”, a term used to link the recent surge in equity markets since the election to the promise of greater infrastructure spend in the U.S. Meanwhile, comments by the Federal Reserve stating “uncertainty regarding the impact of possible tax cuts and other White House economic policies" also weighed on global markets. Silver (up 1.90%), platinum (up 2.2%) and palladium (up 0.80%) finished the week higher at $18.35, $1026 and $771 per ounce respectively. After last week’s commentary in the Weekly Dig, the daily Broker Average Price (BAP) of uranium fell further this week; down 9.8% since last Friday. Base metals were varied with copper down 0.51% and nickel down 1.71%, finished at $2.68, and $4.90 per pound respectively. Lead was up 0.59% and zinc was up 0.77% finishing at $1.02 and $1.28 per pound respectively. Rounding the week off was WTI crude, which was unchanged this week at $54 per barrel.
DIGGING IN… Metals Sector Macro: Gold up/gold equities down this week…………………………..…..…2 Junior Explorer – Weekly Vantage Point: News from the Junior sector this week included drilling results from Barkerville Gold Mines Ltd. (BGM-V), a private placement announcement from IDM Mining Ltd. (IDM-V), trenching results from Auryn Resources Inc. (AUG-T), and drilling results from Cardinal Resources Limited (CDV-ASX) ……….…………………………….………………………………………………………………………..3 Haywood Research – The Week in Review: Publications from the Haywood Research team this week included a site visit of B2Gold Corp. (BTO-T), a resource update from Marathon Gold Corp. (MOZ-T), Q4/16 results from Richmont Mines Inc. (RIC-T), a feasibility study from Alamos Gold Inc. (AGI-T), a research report for Asanko Gold Inc. (AKG-T), drilling results from NewCastle Gold Ltd. (NCA-T), a research report for Midas Gold Corp. (MAX-T), a research report for Alamos Gold Inc. (AGI-T), and Q4/16 results from OceanaGold Corporation (OGC-T) …….….….11 Weekly Commodities / Indices / Exchange Rates: The S&P/TSX Comp finished at 15,533 while the S&P/TSX Composite Venture Index was down (0.91)%......……....17 Commodities and ETFs: Gold finishes at 1,257 /oz on Friday……………………….…....18 Upcoming Macroeconomic News: Bank of Canada rate decision on Wednesday March 1st.………..………………………………………………………………………………………………….22 Comparables Tables: Consensus and Haywood forecasts and multiples, plus market valuations for in situ resources………………………….………..……………….……..….23 The Dig is intended to provide general information only and it is written for an institutional audience. It is not a solicitation for the purchase of securities, an offer of securities, or intended as investment research or advice. The information presented, while obtained from sources we believe reliable is not guaranteed against errors or omissions. For Canadian residents: Haywood Securities Inc. is a Canadian registered broker-dealer and a member of the Investment Industry Regulatory Organization of Canada, the Toronto Stock Exchange, the Toronto Venture Exchange and the Canadian Investor Protection Fund. Any Canadian client that wishes further information about anything contained herein should contact a qualified salesperson of Haywood Securities Inc. For U.S. residents: The Dig is distributed in the United States by Haywood Securities (USA) Inc.
$1,200
$1,250
$1,300
2/20 2/24
Gold (US$/oz)Last: $1,259
$17.5
$18.0
$18.5
2/20 2/24
Silver (US$/oz)Last: $18.40
$2.50
$2.60
$2.70
$2.80
2/20 2/24
Hu
nd
red
s
Copper (US$/lb)Last: $2.69
$52
$54
$56
2/20 2/24
WTI Crude (US$/bbl)Last: $54.01

The Weekly Dig 2/24/17
Haywood Mining [email protected] Page 2
Metals Sector Macro
Macroeconomic News
United States
The seasonally adjusted U.S. Manufacturing Purchasing Managers’ Index (PMI) decreased to 54.3 in February, following January’s near 2-year high of 55. Falling below expectations, February’s Manufacturing PMI decline was due mainly to softer output and new order growth. Despite February’s slowdown, the latest survey indicated that new order growth remained as fast as it has been since March 2015. Driven by strong sales domestically, this helped offset weaker growth in export markets during February. Mortgage Bankers Association (MBA) Mortgage applications decreased 2% in the week ended February 17. Following a 3.7% decrease in the previous period, refinance applications declined 1%, and applications to purchase a home went down 2.8% last week. In addition, average fixed 30-year mortgage rates increased by 4 basis points to 4.36%. Existing home sales jumped 3.3% on a month-over-month basis to a seasonally adjusted annual rate of 5,690,000 in January. The jump is following a downwardly revised 5,510,000 in the previous month and beating market expectations of 5,550,000. January’s existing home sales are the highest we have seen since February of 2007. This growth is driven by rebounding sales for condos, which are up 8.3% from a 10.4% decline in December, and single-family home sales, which are up 2.6% from a 0.4% decline the month before. For the week ending February 18, initial jobless claims increased by 6,000, from the previous week’s revised 238,000, to reach 244,000. However, claims have been below 300,000 for 103 straight weeks, the longest streak since 1970. New home sales of single-family houses in the U.S. went up 3.7% to a seasonally adjusted annual rate of 555,000 in January. This increase follows a downwardly revised 535,000 in the December. The median sales price of new houses sold in January was $312,900, and the average sales price was $360,900 for the month. According to the Survey of Consumers from the University of Michigan, the Index of Consumer Sentiment for February came in at 96.3, down from January’s 98.5. Still a 5% increase from last February, the Sentiment Index has been higher during the past three months than any time since March 2004. However, this doesn’t appear to be a result of consumer’s expectation that Trump's election will have a positive economic impact. Instead, there appears to be an unprecedented partisan divergence with Democrats expecting recession and Republicans expecting robust growth. While the expectations of Democrats and Republicans largely offset each other, the overall gain in the Expectations Index was due to self-identified Independents, who were much closer to the optimism of the Republicans than the pessimism of the Democrats. Canada
The NSA Consumer Price Index (CPI) in Canada increased by 0.86% from December’s 128.40 to reach an all-time high of 129.50 Index Points in January. The seasonally adjusted CPI increased 0.7% since December, and 2.12% since January 2016, to reach the January 2017 index of 130.3. According to Statistics Canada, the main contributors to the 12 month change in the CPI were: gasoline (+20.6%), purchase of passenger vehicles (+3.8%), homeowners’ replacement cost (+4.3%), natural gas (+15.6%), and food purchased from restaurants (+2.3%). Whereas, the contributors with the greatest decrease were primarily produce and other grocery items with vegetables down 15.5% and fruit down 10.8%.

The Weekly Dig 2/24/17
Haywood Mining [email protected] Page 3
Junior Explorer: Weekly Vantage Point
News from the Junior sector this week included:
Mining Flashes Other News
Barkerville Gold Mines Ltd. (BGM-V)
IDM Mining Ltd. (IDM-T)
Cardinal Resources Limited (CDV-ASX) Auryn Resources Inc. (AUG-T)
Mining Flashes Barkerville Gold Mines Ltd. (BGM-V, $0.48, not rated) – Expanded Drill Program Yields More High-Grade Drill Results
Mick Carew, [email protected], Emma Boggio, MSA, CPA (Mass.), [email protected]
Barkerville Gold announced additional drill results from Island Mountain, located within the Company’s Cariboo gold project in British Columbia. In addition, Barkerville also completed a number of metallurgical drill holes at Cow Mountain, and has begun drilling at the Tailings Zone, situated between Cow and Island Mountain. The Tailings Zone has not been drill tested since the 1960s.
Highlight results from the drilling at Island Mountain include the following:
Near-surface intersections proximal to the historical Mosquito mine: o IM-17-007: 6.70 metres grading 11.18 g/t gold from a downhole depth of 110.60 metres; this includes
a 0.6 metre intercept grading 22.20 g/t gold, o IM-17-008: 4.50 metres grading 12.40 g/t gold from a downhole depth of 142.0 metres, including 1
metre grading 51.70 g/t gold , and o IM-17-013: 2.05 metres grading 34.06 g/t gold from a downhole depth of 269.45 metres, including
0.70 metre grading 96.30 g/t gold (drilled approximately 70 metres downdip of historical mine development).
Near-surface intersections at the newly discovered Shaft Zone: o IM-17-010: 5.40 metres grading 7.60 g/t gold from a downhole depth 19.25 metres, including 1.25
metres grading 23.60 g/t gold.
See Haywood Securities for the full report
IDM Mining Ltd. (IDM-V, $0.16, not rated) – $15.2 Million Private Placement with Osisko Gold Royalties Ltd.
Mick Carew, [email protected], Emma Boggio, MSA, CPA (Mass.), [email protected]
On Wednesday morning, IDM Mining (IDM-T), which owns the Red Mountain Gold exploration/development project within the “Golden Triangle” of northwest B.C., announced a $15.248 million private placement with Osisko Gold Royalties Ltd. (OR-T, Buy, TP $18.25). Pursuant to this placement, Osisko agreed to purchase 29.4 million common shares at a price of $0.17 per share and 41 million flow-through shares at a price of $0.25 per share. On closing, which is anticipated on or about March 1, 2017, Osisko will hold 19.9% of IDM Mining on a non-diluted basis. The shares will be subject to a 4-month hold period. As part of the deal, IDM Mining will grant to Osisko certain pre-emptive rights in respect to purchases or grants of royalties or streams from the Red Mountain gold project. Proceeds from the offering will be used primarily to advance development of the Red Mountain gold project, as well as to move forward with the feasibility study for the project.
Located in northwestern B.C., Red Mountain is 15 kilometres northeast of the town of Stewart. With Osisko Gold Royalties now a significant shareholder, IDM Mining is preparing to move forward on its feasibility study

The Weekly Dig 2/24/17
Haywood Mining [email protected] Page 4
for the Red Mountain project. This study will follow the July 2016 Preliminary Economic Assessment (PEA) for Red Mountain, which returned an after-tax net present value (NPV) of C$86.6 million and an after-tax internal rate of return (IRR) of 32.3% with a 2-year payback period. We note that since then, the Company released an updated Mineral Resource estimate in January, which returned 2.07 million tonnes grading 8.75 g/t gold (583,700 ounces, measured and indicated) and 324,000 tonnes grading 6.21 g/t gold (64,800 ounces, inferred), plus silver credits. Key catalysts for the Company include: metallurgical test work results (Q1/17) and exploration and resource expansion drilling through spring/summer of this year. The feasibility study is expected to be completed in Q2/17. We note that after closing, Osisko Gold Royalties will be a significant shareholder, with approximately 19.9% of the shares outstanding.
See Haywood Securities for the full report
Other News Cardinal Resources Limited (CDV-ASX, not rated)
Share Price: $0.38 52-week high/low: $0.77/$0.13 Average Daily Volume for the Week: 1,002,850 shares Market Capitalization: $114 million Shares Outstanding: 304 million Cash and Equivalents: $4.86 million (June 30. 2016) Date of Release: February 21, 2017 Earlier this week, Cardinal Resources Limited (CDV-ASX) announced drill assay results from an additional drill hole. NMDD062 is a west step-out down dip extension drill hole and interested the Namdini mineralised corridor down dip. A total of 150 metres of mineralised interactions, at a 0.5 g/t cut off and weighted average grade of 2.3 g/t gold were returned in NMDD062. Please see further details below in Figure 1.

The Weekly Dig 2/24/17
Haywood Mining [email protected] Page 5
Figure 1: Cross Section of NMDD062
Source: Cardinal Resources

The Weekly Dig 2/24/17
Haywood Mining [email protected] Page 6
Auryn Resources Inc. (AUG-T, not rated) Share Price: $3.34 52-week high/low: $4.17/$1.33 Average Daily Volume for the Week: 160,960 shares Market Capitalization: $258.26 million Shares Outstanding: 76.71 million Cash: $42 million (Sept. 30, 2016) Date of Release: February 24, 2017
This week, Auryn Resources Inc. (AUG-T) provided an exploration update from its Sombrero skarn-porhyry gold-copper oxide project located in southern Peru. The trenching results included 53 meters of 1.75g/t Au (including 14 meters of 5.23g/t Au) of oxide mineralization at the margin of a newly discovered 2.3 kilometer by 500 meter gold in soils anomaly (see Figure 1). The mineralized footprint of the Sombrero project was significantly expanded by the two week sample campaign to 4.5 kilometers by 4.2 kilometers were samples returned up to 7.54g/t gold and 16.0 % copper in areas that had not been previously sampled (see Figure 2). This has increased the potential scalability of the mineralized system at Sombrero considerably. Please see Table 1 for details.
Figure 1: Sombrero Soil Survey and Trenching Results
Source: Auryn Resources

The Weekly Dig 2/24/17
Haywood Mining [email protected] Page 7
Figure 2: Sombrero Rock Chip Samples (Gold)
Source: Auryn Resources

The Weekly Dig 2/24/17
Haywood Mining [email protected] Page 8
Table 1: Sombrero Soil Survey and Trenching Results
Source: Auryn Resources
SAMPLE LONG LAT TYPE MINSAu
ppm
Ag
ppmCu % SAMPLE LONG LAT TYPE MINS
Au
ppm
Ag
ppmCu %
Q921194 -74.42 -13.90 rock oxide 7.54 1.72 0.0227 Q919675 -74.41 -13.90 rock oxide 0.393 8.18 16
Q921196 -74.42 -13.90 rock oxide 7.09 0.89 0.0465 Q921576 -74.42 -13.90 rock oxide 0.032 0.57 3.55
Q921187 -74.42 -13.90 rock oxide 6.23 1.14 0.111 Q921482 -74.43 -13.90 rock oxide 0.017 1.55 2.36
Q919731 -74.42 -13.89 rock oxide 5.94 0.41 0.0174 Q921589 -74.42 -13.90 rock oxide 0.088 1.25 0.965
Q919732 -74.42 -13.89 rock oxide 5.63 0.55 0.0098 Q919674 -74.41 -13.90 rock oxide 0.025 0.28 0.666
Q921188 -74.42 -13.90 rock oxide 5.36 1.02 0.045 Q921591 -74.42 -13.90 rock oxide 0.074 0.39 0.634
Q921195 -74.42 -13.90 rock oxide 3.99 0.49 0.0777 Q921525 -74.42 -13.90 rock oxide 0.087 1.49 0.627
Q921031 -74.42 -13.90 rock oxide 3.28 1.56 0.149 Q919673 -74.41 -13.90 rock oxide 0.179 0.41 0.598
Q921191 -74.42 -13.90 rock oxide 3.16 0.6 0.188 Q921582 -74.42 -13.90 rock oxide 0.012 0.13 0.561
Q921189 -74.42 -13.90 rock oxide 2.64 0.42 0.0652 Q921483 -74.43 -13.90 rock oxide 0.032 1.57 0.539
Q919724 -74.42 -13.89 rock oxide 2.41 0.25 0.0074 Q919677 -74.41 -13.90 rock oxide 0.167 0.99 0.52
Q919722 -74.42 -13.89 rock oxide 2.06 0.14 0.0073 Q921162 -74.42 -13.90 rock oxide 0.022 1.09 0.462
Q921159 -74.43 -13.90 rock 1.74 0.21 0.0301 Q921529 -74.43 -13.90 rock oxide 0.228 3.44 0.43
Q919723 -74.42 -13.89 rock oxide 1.33 0.07 0.0078 Q921577 -74.42 -13.90 rock oxide 0.25 5.06 0.414
Q921001 -74.42 -13.89 rock oxide 1.325 2.54 0.0116 Q921167 -74.42 -13.90 rock oxide 0.125 4 0.401
Q921035 -74.42 -13.90 rock oxide 1.165 11.7 0.012 Q921523 -74.43 -13.90 rock oxide 0.103 1.99 0.383
Q921584 -74.42 -13.90 rock oxide 0.931 1.73 0.164 Q921478 -74.43 -13.90 rock oxide 0.044 1.14 0.364
Q919734 -74.42 -13.89 rock oxide 0.896 0.22 0.0038 Q921486 -74.42 -13.90 rock oxide 0.157 11.05 0.362
Q919748 -74.42 -13.89 rock oxide 0.834 0.43 0.0212 Q919679 -74.41 -13.90 rock oxide 0.072 1.32 0.339
Q921192 -74.42 -13.90 rock oxide 0.813 0.46 0.0171 Q921154 -74.42 -13.90 rock oxide 0.05 0.49 0.322
Q919742 -74.42 -13.89 rock oxide 0.739 0.43 0.0471 Q921156 -74.42 -13.90 rock oxide 0.056 1.14 0.318
Q919736 -74.42 -13.89 rock oxide 0.738 0.1 0.0051 Q919678 -74.41 -13.90 rock oxide 0.114 0.98 0.315
Q919744 -74.42 -13.89 rock oxide 0.693 0.48 0.033 Q921520 -74.43 -13.90 rock oxide 0.044 0.95 0.295
Q921563 -74.43 -13.90 rock oxide 0.688 4.61 0.0166 Q921476 -74.43 -13.90 rock oxide 0.134 6 0.292
Q919721 -74.42 -13.89 rock oxide 0.672 0.17 0.0028 Q921489 -74.42 -13.90 rock oxide 0.142 8.39 0.291
Q919740 -74.42 -13.89 rock oxide 0.585 0.23 0.0225 Q921522 -74.42 -13.90 rock oxide 0.146 16.65 0.283
Q921034 -74.42 -13.90 rock oxide 0.57 0.6 0.031 Q921524 -74.43 -13.90 rock oxide 0.282 2.91 0.273
Q919746 -74.42 -13.89 rock oxide 0.545 0.32 0.0276 Q921484 -74.42 -13.90 rock oxide 0.008 1.47 0.271
Q921037 -74.42 -13.90 rock sulphide 0.513 6.93 0.0047 Q921166 -74.42 -13.90 rock oxide 0.011 0.57 0.251
Q921521 -74.43 -13.90 rock oxide 0.483 4.05 0.23 Q921488 -74.42 -13.90 rock oxide 0.026 1.86 0.244
Q919735 -74.42 -13.89 rock oxide 0.461 0.31 0.0133 Q919691 -74.43 -13.90 rock oxide 0.068 0.71 0.237
Q921158 -74.43 -13.90 rock 0.457 0.06 0.0653 Q921521 -74.43 -13.90 rock oxide 0.483 4.05 0.23
Q921597 -74.42 -13.90 rock oxide 0.447 23.2 0.0692 Q919669 -74.41 -13.90 rock oxide 0.032 5.8 0.229
Q919719 -74.42 -13.89 rock oxide 0.445 0.11 0.003 Q921575 -74.43 -13.90 rock oxide 0.168 0.41 0.226
Q919675 -74.41 -13.90 rock oxide 0.393 8.18 16 Q919699 -74.42 -13.90 rock oxide 0.05 0.22 0.223
Q919743 -74.42 -13.89 rock oxide 0.382 0.75 0.0419 Q921528 -74.42 -13.90 rock oxide 0.196 1.21 0.212
Q921029 -74.42 -13.90 rock oxide 0.381 12.35 0.0644 Q921565 -74.43 -13.90 rock oxide 0.023 0.31 0.207
Q919717 -74.42 -13.89 rock oxide 0.371 0.11 0.0049 Q921587 -74.42 -13.90 rock oxide 0.241 0.59 0.206
Q919733 -74.42 -13.89 rock oxide 0.362 0.07 0.0033 Q919680 -74.41 -13.90 rock oxide 0.008 0.48 0.202
Q921600 -74.42 -13.89 rock oxide 0.358 0.28 0.007 Q919681 -74.41 -13.90 rock oxide 0.086 0.98 0.196

The Weekly Dig 2/24/17
Haywood Mining [email protected] Page 9
Performance of Companies Included in Junior X and Notable News Flow
Source: Capital IQ and Haywood Securities
Close
Price Market Capitalization
Cash at Quarter
End Weekly Performance QTD Performance
QTD Performance
vs. TSXV Index
Company Ticker (C$) (C$M) (C$M)
Junior Exploration Names
Cardinal Resources Limited ASX:CDV 0.38 114.80 4.70 (5.1)% 56.3% 44.5%
Cordoba Minerals Corp. TSXV:CDB 1.39 123.22 2.54 (4.1)% 85.3% 73.6%
IDM Mining Ltd. TSXV:IDM 0.17 46.77 7.39 3.1% 13.8% 2.0%
Kootenay Silver Inc TSXV:KTN 0.32 54.97 7.12 0.0% (10.0)% (21.8)%
Nighthawk Gold Corp. TSXV:NHK 0.71 109.98 4.63 4.4% 57.8% 46.0%
Orex Minerals Inc. TSXV:REX 0.23 25.52 4.67 (2.2)% (53.1)% (64.9)%
Plateau Uranium Inc. TSXV:PLU 0.65 35.26 2.07 (4.4)% 195.5% 183.7%
Pure Gold Mining Inc. TSXV:PGM 0.66 125.56 13.79 (2.9)% 41.9% 30.2%
Purepoint Uranium Group Inc. TSXV:PTU 0.15 27.43 0.71 (3.3)% 52.6% 40.9%
SilverCrest Metals Inc. TSXV:SIL 2.50 120.46 1.53 2.9% 8.7% (3.1)%
Wealth Minerals Ltd. TSXV:WML 1.70 128.39 1.68 (1.2)% 49.1% 37.4%
Other Companies in the News
Barkerville Gold Mines Ltd. TSXV:BGM 0.48 147.39 13.26 0.0% 3.3% (8.5)%

The Weekly Dig 2/24/17
Haywood Mining [email protected] Page 10
Key Catalysts for Companies Featured in the Last Junior Exploration Report
Source: Haywood Securities
Company Ticker Catalysts
Junior Exploration Names
Cardinal Resources Limited ASX:CDV• Drill results focussed on expansion of resource - 2017
• Metallurgical results - Q1/17
Cordoba Minerals Corp. TSXV:CDB
• Drill results from Alacran - Q1/17
• Initial resource estimate - Alacran - H1/17
• Regional exploration drill results - Q1/17
IDM Mining Ltd. TSXV:IDM
• Phase 2 drill program - Q1/17
• Environmental Assessment Certificate - mid-2017
• Commencement of production - mid-2018
Kootenay Silver Inc TSXV:KTN
• Drill results from La Soledad - Q1/17
• Initial resource estimate for La Negra - H1/17
• Resource update leading to PEA at La Cigarra - late 2017
Nighthawk Gold Corp. TSXV:NHK
• Recommence drilling at Colomac - Q1/17
• Updated resource estimate - Q2/17
Orex Minerals Inc. TSXV:REX• Drill results from 5,000 metre 2-rig program at Coneto - Q1/17
• Drill results from 4,000 metre program at Sandra Escobar - Q1/17
Plateau Uranium Inc. TSXV:PLU
• Metallurgical test results - Q4/16
• Drill results from Pinochio target - early 2017
• Additional lab test work - 2017
Pure Gold Mining Inc. TSXV:PGM
• Drill results from 77,000 metre program - Q1/17
• Re-open portal at McVeigh horizon - Q4/16
• Updated mineral resource estimate - mid-2017
Purepoint Uranium Group Inc. TSXV:PTU
•Drill results from the balance of 2016 drilling and proposed 2017 drill program -
2017
.
Rupert Resources Ltd. TSXV:RUP• Phase 2 drill program - Q1/17
• Exploration work - Q1/17
SilverCrest Metals Inc. TSXV:SIL
• Drill results from phase 2 exploration program at Las Chispas - H1/17
• Maiden resource at Las Chispas - H1/17
• Results from testing and processing of bulk sample - 2017
Wealth Minerals Ltd. TSXV:WML • Developing exploration program at Atacama

The Weekly Dig 2/24/17
Haywood Mining [email protected] Page 11
Haywood Research: The Week in Review
Publications from the Haywood Research team for the week included the following:
Site visit of B2Gold Corp. (BTO-T)
Resource update from Marathon Gold Corp. (MOZ-T)
Q4/16 results from Richmont Mines Inc. (RIC-T)
Feasibility study from Alamos Gold Inc. (AGI-T)
Research report for Asanko Gold Inc. (AKG-T)
Drilling results from NewCastle Gold Ltd. (NCA-T)
Research report for Midas Gold Corp. (MAX-T)
Research report for Alamos Gold Inc. (AGI-T)
Q4/16 results from OceanaGold Corporation (OGC-T)
Radar Flashes
B2Gold Corp. (BTO-T, $4.22, [Buy Rating, $5.50 Target Price]) – African Site Visits Highlight B2Gold’s Near- and Mid-Term Organic Growth Potential
Geordie Mark, PhD, FAusIMM [email protected]
Event: Fekola and Otjikoto gold mine visits and exploration review
Impact – Positive: Visits show organic growth base is firmly centred on West Africa, with Otjikoto in optimization phase and Fekola ready for Q4/17 first pour.
Otjikoto Gold Mine: Both the Otjikoto and Wolfshag open-pit mines are operating and feeding material to the Otjikoto carbon in leach / carbon in pulp (CIL-CIP) gold processing plant. Wolfshag feed started to be processed in late 2016. Highlights for the plant include the outstanding rates of gold recovery and the low rates of power consumption that have led to low operating costs…
Fekola Gold Mine: The mine is under development and projected to deliver first gold pour in October 2017. Development costs are in line with budget and ahead of the original schedule. Mining operations are underway, with 3.16 Mt and 13.17 Mt of ore and waste projected to be mined respectively in H1/17 and H2/17…
West African Exploration: Exploration highlights show the potential for resource expansion at Fekola, through delineation of the Kiwi Zone, as well as the materialization of a maiden resource on the Anaconda target. The latter offers the potential for a low-strip-ratio, free-dig mine yielding a lower grade feed to a satellite processing facility…
Q4/16 Production and 2017 Guidance: Q4/16 production of 141.6 koz of gold was in line with our expectations of 141 koz of gold, with La Libertad outperforming and El Limón underperforming. Quarterly revenue was $151 million on the sale of 151.5 koz of gold, which exceeded our expectations of $150 million. 2017 production guidance of 520 koz to 595 koz exceeded our earlier guidance of 561 koz of gold, with Fekola supporting an increase in production guidance, and La Libertad production lower than expected.
See Haywood Securities for the full report

The Weekly Dig 2/24/17
Haywood Mining [email protected] Page 12
Marathon Gold Corp. (MOZ-T, $1.01, [Buy Rating, $1.10 Target Price]) – Upgraded Resource Estimate at
Marathon Deposit
Mick Carew, [email protected], Emma Boggio, MSA, CPA (Mass.), [email protected]
Marathon Gold announced an updated resource estimate for its Marathon deposit, which is part of the Company’s Valentine Lake gold project in Newfoundland. The new National Instrument 43-101 compliant resource estimate for the Marathon deposit is given below:
Measured and indicated: 483,800 ounces grading 1.72 g/t gold (from 195,600 ounces grading 1.98 g/t gold—a 150% increase in contained gold)
Inferred: 583,400 ounces grading 2.20 g/t gold (from only 23,800 ounces grading 2.64 g/t gold).
The Company has also divided the updated resource estimate into open-pit constrained and underground resources. We note that 93% of the measured and indicated resource at Marathon is defined as open-pit resources.
Overall, the Marathon Gold deposit contains a total (measured + indicated + inferred) of 1.067 million ounces grading 1.98 g/t gold, a 400% increase from the previous resource estimate. The global resource estimate for the Valentine Lake gold project (measured + indicated + inferred) now stands at 2.154 million ounces grading 2.02 g/t gold, a 70% increase from the previous resource estimate.
See Haywood Securities for the full report
Richmont Mines Inc. (RIC-T, $12.05, [Buy Rating, $14.00 Target Price]) – Q4/16 Results Down Slightly on Lower Realized Gold Price
Kerry Smith, MBA, PEng [email protected], Danny Ochoa, CFA, [email protected]
Q4 CFPS Slightly Below Expectations on Lower Realized Gold Price…Bad Timing the Culprit – Richmont reported Q4 CFPS of $0.17 per share, versus consensus of $0.19 and our estimate of $0.19 per share. For the full year, CFPS came in at $0.80 versus consensus at $0.82 and Haywood at $0.83. The miss in Q4 was due to 1,390 fewer ounces sold than produced, and an average realized gold price in Q4 that was US$31/oz below the London Metal Exchange average price for the quarter (or C$38/oz).
Q4/16 and 2016 Production Pre-released…a Record Year – 2016 production was pre-released at 104,050 ounces of gold at a cash cost of $908/oz (US$685/oz), which compares with our expectations of 101,095 ounces at $875/oz (US$660/oz), a 3% beat on production, and a 4% miss on costs. Production came in at the top end of Company guidance for the year of between 98,000 and 106,000 ounces, and in the middle of cash-cost guidance of $885 to $945/oz (US$675 to US$720/oz). Production in Q4/16 came in at 29,505 ounces of gold at a cash cost of $952/oz (US$714/oz), which compares with our expectations of 26,550 ounces at $805/oz (US$605).
Strong Balance Sheet to Fund Island Mine Development and Exploration – Richmont sold 102,660 ounces of gold in 2016 at an average realized price of $1,640/oz (US$1,238/oz), generating $168.7 million of revenue. Cash balance decreased to $75.1 million, from $78.9 million at the end of Q3, but increased from $61.0 million at year-end 2015. Richmont has a good balance sheet to fund its development of the lower mine at Island and drive ahead with exploration. The Company expects between $58 million and $64 million in capital expenditures, and between $16 million and $19 million for exploration and project evaluation.
See Haywood Securities for the full report
The Weekly Dig 2/24/17
Haywood Mining [email protected] Page 13
Alamos Gold Inc. (AGI-T, $10.53, [Buy Rating, $13.00 Target Price]) – Aği Daği FS and Çamyurt PEA Demonstrate Nice Returns
Kerry Smith, MBA, PEng [email protected], Danny Ochoa, CFA, [email protected]
Aği Daği Delivers Impressive Feasibility Study Results
On Wednesday morning, Alamos announced results of the feasibility study (FS) completed on its 100% owned Aği Daği project in western Turkey. The study highlights a 30,000 tonne per day (tpd) open-pit heap leach operation, with annual gold production averaging 177,600 ounces per year at an average total cash cost of US$374/oz and all-in sustaining cost (AISC) of US$411/oz over the first 5 years. Initial capital cost is estimated at US$250 million (compared with US$278 million in the 2012 prefeasibility study [PFS]). At gold and silver price assumptions of US$1,250/oz and US$16.00/oz, the project returns an NPV5% of US$360 million and an after-tax IRR of 39%. Using these same gold and silver assumptions for the 2012 PFS, NPV8% has increased by 240% (to US$297.6 million from US$87.6 million), and the IRR has increased to 38.7% from 15.4%.
In general, our capex assumption is higher at US$285 million for Aği Daği and US$15 million for Çamyurt. Our average annual production is about 28% less than this FS, and our total cash cost is US$530/oz versus US$374/oz in the FS. We model 1.3 million ounces recoverable versus 0.94 million ounces in the FS at Aği Daği. The total reserve and resource at Aği Daği is currently 1.9 million ounces for all categories, and we expect our modelled recoverable reserves are achievable.
Aği Daği Resources Converted to 2P
A large portion of the measured and indicated (M&I) resource at Aği Daği has been successfully converted to an initial Proven and Probable (2P) Mineral Reserve totalling 54.4 million tonnes at an average gold grade of 0.67 g/t and 5.4 g/t silver, containing 1.17 Moz of gold and 9.5 Moz of silver. Alamos plans to drill a further 57,000 metres before construction starts, with 5,000 metres of infill at Aği Daği, 12,000 metres of step-out drilling at Aği Daği along strike, and a further 18,000 metres of drilling on other nearby targets (Fire Tower, Ilhamur, and Ayi Tepe). Another 22,000 metres of infill and step-out drilling are also planned at Çamyurt. We expect over time that Aği Daği and Çamyurt can reach 2 million ounces mineable.
See Haywood Securities for the full report
Asanko Gold Inc. (AKG-T, $3.93, [Buy Rating, $5.50 Target Price]) – Equity Selloff Presents Opportunity
Geordie Mark, PhD, FAusIMM [email protected]
Q4 Financials Expectations
In light of the upcoming financials expected later this quarter, we project that Asanko will deliver operating cash flow (before changes in working capital) of US$19 million, or US$0.09 per share on revenues of US$70 million, delivering earnings before interest, taxes, depreciation, and amortization (EBITDA) of US$23 million.
Q4/16 Operations Summary
Asanko reported gold production of 57,178 ounces and sales of 58,483 ounces of gold for revenues of US$70.1 million at an average gold price of US$1,199/oz. Production was driven by processing of 901 kt of ore material at an average head grade of 2.1 g/t gold, with gold recoveries coming in at 94%. Mining operations removed a total of 7.23 Mt of material (similar to Q3/16), which included 1.30 Mt of ore material for a strip ratio of 4.6:1. Material stockpiles also showed quarter-over-quarter growth in tonnes, average grade and contained metal.

The Weekly Dig 2/24/17
Haywood Mining [email protected] Page 14
2017 Forecasts
We project total production of 241 koz of gold at a cash cost of $718/oz. Our 2017 forecasts drive revenues of US$3308 million, EBITDA of US$160 million, and operating cash flow of US$110 million or US$0.54 per share.
Target Price, Ratings
Our target remains unchanged, but we have modified our rating to BUY from Hold.
See Haywood Securities for the full report
NewCastle Gold Ltd. (NCA-T, $0.76, [Buy Rating, $1.60 Target Price]) – Drilling Returns Impressive Results at South Domes
Kerry Smith, MBA, PEng [email protected], Danny Ochoa, CFA, [email protected]
South Domes Drilling Continues to Deliver Impressive Results
On Wednesday night, NewCastle Gold announced assay results from its ongoing 40,000-metre Phase II drill program (budgeted at $8 million) at the Company’s 100% owned Castle Mountain project located in San Bernardino County, California. The program commenced in November 2016, with seven rigs currently drilling, and to date 50% of the program has been completed. This program should be finished in April, with an updated resource estimate expected in Q3 and a prefeasibility study in Q4. About 80% of this drill program is infilling the South Oro Belle resource area to reserves, and the remainder is infill and step-out drilling at South Domes. NewCastle has cash today of around $15 million and is well funded for the current drill program.
Yesterday’s Results Follow-up on Previously Reported Results at the South Domes Target
The six new drill holes support the expansion of mineralization at the deposit, with drill hole CMM-129, the longest intercept reported to date, ending in mineralization 100 metres below the modelled pit shell. Hole CMM-129 included 5.43 g/t gold over 48.8 metres, which is below the current resource envelope. These six holes are predominately infill and again have delivered some nice grades and widths. Overall grade in South Domes should increase following this drill program given the tenor of the results so far versus the average resource grade currently at South Domes of 0.6 g/t gold.
See Haywood Securities for the full report
Midas Gold Corp. (MAX-T, $0.89, [Buy Rating, $1.75 Target Price]) – Shallow High-Grade Gold-Antimony Mineralization Intersected at Yellow Pine
Geordie Mark, PhD, FAusIMM [email protected]
Yellow Pine Exploration: MGI-16-421 returned a significant intersection of 216.70 metres grading 3.24 g/t gold, 6.1 g/t silver, and 0.3% lead. This drill hole was designed to intersect west-northwest- to east-west-trending, north-dipping silica-sulphide vein systems and silica-sulphide breccias zones to better assess true widths. High-grade gold-antimony mineralization is largely bound between the A-B structure and the C structure, the latter of which is projected to coalesce with the G structure at depth.
Drill Holes MGI-16-418 and MGI-16-419: In Addition, these holes returned appreciable intervals of shallow high-grade gold and antimony mineralization, and were completed in the southeast portion of the Yellow Pine deposit to determine continuity of silica-sulphide breccia encountered in earlier 2012 and 2013 drilling campaigns. Drill hole MGI-16-418 (southwest of MGI-16-419) contained modestly higher grade gold mineralization (30%) over slightly greater widths (15%) than encountered in earlier drilling. Antimony grades were reportedly lower than delivered in earlier work. MG-16-419 encountered higher gold grades (2x) over a narrower interval (60%) than earlier results, but breccia may have been affected by post-mineralization faulting. See Haywood Securities for the full report
The Weekly Dig 2/24/17
Haywood Mining [email protected] Page 15
Alamos Gold Inc. (AGI-T, $10.87, [Buy Rating, $13.00 Target Price]) – Q4 Cash Flow in Line…and Organic Growth Getting Closer
Kerry Smith, MBA, PEng [email protected], Danny Ochoa, CFA, [email protected]
2016 Cash Flow Beats Consensus - Alamos reported 2016 cash flow (before non-cash working-capital changes) of US$148M, or US$0.56 per share, above our estimate of US$0.55 per share, and above consensus of US$0.52 per share. Q4 CFPS came in at $0.13, below our estimate of US$0.15 per share, and in line with consensus at US$0.13 per share…
2016 Production at Top End of Guidance - In 2016, Alamos produced 392,000 ounces of gold, which was at the top end of guidance of 370,000 to 400,000 ounces. All-in sustaining capital (AISC) averaged US$1,010/oz, which was just above the top end of full-year guidance of between US$800/oz and US$975/oz.
2017 Guidance….a 6% Increase on 2016 - Alamos previously released 2017 guidance of between 400,000 and 430,000 ounces of gold at a total cash cost of US$765/oz and an AISC of US$940/oz. We model 420,000 ounces of gold production at a total cash cost of US$750/oz and AISC of US$940/oz.
Reserves Increase by 31% - Alamos also reported updated mineral reserves and resources, with global proven and probable reserves increasing by 31% to 7.7 Moz, resulting in part from a significant increase in reserves at La Yaqui of 519,000 ounces, and initial mineral reserves reported at both Kirazlı and Aği Daği of 1.8M ounces in total.
Target Price, Ratings - We have adjusted our model to account for the recently completed bought-deal financing, as well as 2016 results and 2017 guidance. Our 2017 CFPS declines to US$0.70 from US$0.80, and our target price, which is based on a 12.5x EV/CFPS multiple (from 12.0x), remains unchanged at $13.00. We maintain our BUY rating.
See Haywood Securities for the full report
OceanaGold Corporation (OGC-T, C$4.07, [Buy Rating, $5.75 Target Price]) – Q4/16 Financials Deliver Marginal Beat with Haile now in Production
Geordie Mark, PhD, FAusIMM [email protected]
Q4/16 Results - OceanaGold reported revenues of US$147 million, EBITDA of US$67 million and OCF of US$67 million / US$0.11/sh, which came in marginally our estimates of EBTIDA of US$66 million and OCF of US$0.10/sh. Operationally, consolidated production totaled 102 koz of gold and 8.3 Mlb of copper with sales of 106 koz of gold and 10.9 Mlb of copper at a cash cost of US$372 per ounce gold (net of copper). Reported AISC for the year came in at US$708 per ounce. The company has also instituted a US$0.02 dividend payable in equal semi-annual amounts.
Philippine Operations – Production of 30.7 koz gold and 8.3 Mlb copper or 46 koz AuEq. was delivered by processing 0.7 Mt at an average gold and copper grade of 1.71 g/t and 0.48% respectively. The average cash cost came in at -US$120/oz Au. Initial feed from underground mining is expected to be delivered in Q4/17 with open pit mining due for completion in H2/17…

The Weekly Dig 2/24/17
Haywood Mining [email protected] Page 16
New Zealand Operations - Combined production of 71.73 koz gold at a cash cost of US$614/oz. Waihi - Production of 29.28 koz of gold at a cash cost of US$427/oz by processing 0.129 kt at an average gold grade of 7.77 g/t. Macraes - production of 42.45 koz of gold at a cash cost of US$743/oz via processing 1.48 Mt at an average gold head grade of 1.04 g/t.
Haile Update – First gold pour achieved in January 2017 with initial material fed into the plant in late December 2016. Construction spend for development was estimated at US$380 million The schedule reportedly remains unchanged for early 2017 commercial production with sulphide-bearing material being fed into the plant to commission the flotation and fine-grinding circuits…
See Haywood Securities for the full report

The Weekly Dig 2/24/17
Haywood Mining [email protected] Page 17
Weekly Commodities / Indices / Exchange Rates
Metal and Currency Prices for the Week
Source: Haywood Securities
15,000
15,500
16,000
2/21 2/24
S&P/TSX Composite IndexLast: 15,549
200
220
240
2/21 2/24
S&P/TSX Global Gold IndexLast: 217.08
20,600
20,800
21,000
2/21 2/24
Dow Jones Industrial AverageLast: 20,763
820
830
840
850
2/21 2/24
S&P/TSX Venture Comp IndexLast: 836
104106108110112114116118120
2/21 2/24
S&P/TSX Global Base Metals IndexLast: 110.29
2,350
2,360
2,370
2/21 2/24
S&P 500 IndexLast: 2,359
Name Close 1Wk Δ % 5 Day Trend 52W H/L 1W H/L
Gold Spot 1,257 22.49 1.79% 1,375 1,257
US$/oz 1,123 1,235
Silver Spot 18.35 0.35 1.90% 21.14 18.35
US$/oz 14.62 17.97
Platinum Spot 1,026 22.57 2.20% 1,195 1,026
US$/oz 890 1,003
Palladium Spot 771 (6.14) (0.80)% 797 783
US$/oz 481 769
Copper Future 2.68 (0.01) (0.51)% 2.79 2.75
US$/lb 2.04 2.65
Nickel Spot 4.90 (0.08) (1.71)% 5.32 5.03
US$/lb 3.75 4.77
Lead Spot 1.02 0.01 0.59% 1.12 1.04
US$/lb 0.75 1.01
Zinc Spot 1.28 0.01 0.77% 1.35 1.31
US$/lb 0.78 1.26
Aluminum Spot 0.86 0.01 0.93% 0.86 0.86
US$/lb 0.67 0.84
Iron Ore Spot 87 (0.13) (0.15)% 140 79
US$/t 78 78
Newcastle Coal 83 3.35 4.02% 106 84
US$/t 50 80
Uranium Spot 24.00 (1.00) (4.17)% 35 25
US$/lb 18 24
WTI 54 0.27 0.50% 57 54
US$/bbl 41 54
Brent 56 0.25 0.45% 59 57
US$/bbl 41 56
Henry Hub 2.80 (0.16) (5.58)% 3.65 2.95
US$/MMBtu 2.31 2.69
ENER
GY
BA
SE M
ETA
LSP
REC
IOU
S M
ETA
LS
Name Close 1Wk Δ % 5 Day Trend 52W H/L 1W H/L
TSX 15,533 (305) (1.96)% 15,943 15,922
12,506 15,533
TSXV 836 (7.65) (0.91)% 849 845
532 836
Canadian Dollar 1.31 0.00 0.08% 1.36 1.32
1.25 1.31
Euro 1.06 (0.01) (0.53)% 1.16 1.06
1.03 1.05
China Renminbi 6.87 0.00 0.04% 6.96 6.88
6.45 6.87
Mexican Peso 19.88 (0.55) (2.75)% 22.04 20.43
17.05 19.67
Peruvian Sol 3.25 (0.01) (0.37)% 3.53 3.26
3.23 3.24
S. African Rand 12.96 (0.08) (0.62)% 16.31 13.14
12.79 12.87
Australian Dollar 0.77 0.00 0.09% 0.78 0.77
0.71 0.77
Japanese Yen 112.2 (0.67) (0.60)% 118.7 113.7
99.0 112.2
Chilean Peso 646 1.37 0.21% 700 646
636 641
British Pound 1.25 0.00 0.38% 1.50 1.26
1.18 1.24
Swiss Franc 1.01 0.01 0.50% 1.03 1.01
0.94 1.00
Turkish Lira 3.61 (0.02) (0.68)% 3.94 3.63
2.79 3.57
Indian Rupee 66.83 (0.19) (0.29)% 68.86 67.02
66.07 66.83
EXC
HA
NG
E R
ATE
SIN
DIC
IES

The Weekly Dig 2/24/17
Haywood Mining [email protected] Page 18
Commodities and ETFs: A Week in Action
Gold - 1-Year US$/oz (left) and Total ETF Holdings (right)
Spot: Gain (+1.8%) for the week
ETF Holdings: 58,788,012 ounces, up 106,042 ounces for the week
Silver - 1-Year US$/oz (left) and Total ETF Holdings (right)
Spot: Gain (+2.1%) for the week
ETF Holdings: 646,783,098 ounces, up 443,067 ounces for the week
Platinum - 1-Year US$/oz (left) and Total ETF Holdings (right)
Spot: Gain (+2.2%) for the week
ETF Holdings: 2,387,778 ounces, up 2,929 ounces for the week
Palladium - 1-Year US$/oz (left) and Total ETF Holdings (right)
Spot: Loss (-0.8%) for the week
ETF Holdings: 1,529,783 ounces, up 665 ounces for the week
Copper - 1-Year US$/lb (left) and LME Inventory (right)
Futures: Loss (-0.5%) for the week
LME Copper: 257,150 tonnes, down 6,625 tonnes for the week
$1,000
$1,100
$1,200
$1,300
$1,400
Feb-16 Feb-17Gold ($/oz)
Price
100D MA45
55
65
Feb-16 Feb-17Gold ETF Holdings (Moz)
$13.00
$16.00
$19.00
$22.00
Feb-16 Feb-17Silver ($/oz)
Price
100D MA
590600610620630640650660670680690
Feb-16 Feb-17Silver ETF Holdings (Moz)
$800
$1,000
$1,200
Feb-16 Feb-17Platinum ($/oz)
Price
100D MA
2.2
2.3
2.4
2.5
Feb-16 Feb-17Platinum ETF Holdings (Moz)
$460
$660
$860
Feb-16 Feb-17Palladium ($/oz)
Price
100D MA
1.51.61.71.81.92.02.12.22.32.4
Feb-16 Feb-17Palladium ETF Holdings (Moz)
$1.90
$2.40
Feb-16 Feb-17Copper ($/lb)
Price
100D MA
130,000
230,000
330,000
Feb-16 Feb-17LME Copper Inventories (t)

The Weekly Dig 2/24/17
Haywood Mining [email protected] Page 19
Nickel - 1-Year US$/lb (left) and LME Inventory (right)
Spot: Loss (-1.7%) for the week
LME Nickel: 379,680 tonnes, up 186 tonnes for the week
Lead - 1-Year US$/lb (left) and LME Inventory (right)
Spot: Gain (+0.6%) for the week
LME Lead: 190,325 tonnes, up 575 tonnes for the week
Zinc - 1-Year US$/lb (left) and LME Inventory (right)
Spot: Gain (+0.8%) for the week
LME Zinc: 381,425 tonnes, down 9,425 tonnes for the week
Iron – 1-Year US$/t 62% Fe (left) and 1-Year US$/t Newcastle (right)
Newcastle Thermal Futures: Gain (+1.9%) for the week
62% Fe Iron Ore: Loss (-0.1%) for the week
Uranium – 1-Year US$/lb Short-Term (left) and Long-Term (right)
Uranium Spot: Loss (-4.0%) for the week
Uranium Long-Term: Unchanged
Source: Bloomberg, UxC Consulting, and Haywood Securities
$3.50
$4.50
Feb-16 Feb-17Nickel ($/lb)
Price
100D MA
350,000
400,000
450,000
Feb-16 Feb-17LME Nickel Inventories (t)
$0.70
$0.90
$1.10
Feb-16 Feb-17Lead ($/lb)
Price
100D MA
140,000
160,000
180,000
200,000
220,000
Feb-16 Feb-17LME Lead Inventories (t)
$0.65
$1.15
Feb-16 Feb-17Zinc ($/lb)
Price
100D MA
300,000
400,000
500,000
600,000
Feb-16 Feb-17LME Zinc Inventories (t)
$35
$55
$75
Feb-16 Feb-1762% Iron Ore ($/t)
Price
100D MA
$30
$50
$70
$90
Feb-16 Feb-17Newcastle Coal (AUD/t)
Price
100D MA
$18
$23
$28
$33
$38
Feb-16 Feb-17Uranium Spot ($/lb)
Price
100D MA
$25
$35
$45
Feb-16 Feb-17Uranium Long-Term ($/lb)
Price
100D MA

The Weekly Dig 2/24/17
Haywood Mining [email protected] Page 20
Equities: Weekly Performances
S&P TSX Global Mining Index – Top and Bottom Performance (upper) and Constituent Performance (lower)
Source: Capital IQ and Haywood Securities
Top Companies Close $∆ %∆
Altius Minerals Corporation 12.69 0.80 7%
Silvercorp Metals Inc. 5.58 0.26 5%
B2Gold Corp. 4.39 0.17 4%
Randgold Resources Limited 94.77 3.60 4%
TMAC Resources Inc. 17.42 0.55 3%
Silver Standard Resources Inc. 15.09 0.32 2%
Teranga Gold Corporation 1.00 0.02 2%
Kirkland Lake Gold LTD. 10.32 0.09 1%
Stillwater Mining Company 17.06 (0.01) (0)%
Gold Fields Limited 3.25 (0.02) (1)%
1Wk 1Wk
Bottom Companies Close $∆ %∆
Northern Dynasty Minerals Ltd. 2.19 (0.78) (26)%
Torex Gold Resources Inc 26.96 (4.97) (16)%
Eldorado Gold Corporation 4.22 (0.58) (12)%
Dominion Diamond Corporation 11.50 (1.58) (12)%
Ivanhoe Mines Ltd. 4.28 (0.58) (12)%
Freeport-McMoRan Inc. 13.25 (1.66) (11)%
Argonaut Gold Inc. 2.36 (0.28) (11)%
Hecla Mining Company 5.90 (0.68) (10)%
AngloGold Ashanti Limited 11.59 (1.31) (10)%
Nevsun Resources Ltd. 3.55 (0.40) (10)%
1Wk 52Wk 1Wk 52Wk
Ticker Company Close $∆ %∆ High Low Ticker Company Close $∆ %∆ High Low
TSX:AEM Agnico Eagle Mines Limited 59.39 (1.93) (3)% 78.35 44.07 TSX:K Kinross Gold Corporation 4.99 (0.07) (1)% 7.56 3.61
TSX:ASR Alacer Gold Corp. 2.93 (0.07) (2)% 3.79 1.75 TSX:KL Kirkland Lake Gold LTD. 10.32 0.09 1% 11.15 6.33
TSX:AGI Alamos Gold Inc. 10.54 (0.35) (3)% 13.65 5.80 TSX:KDX Klondex Mines Ltd. 7.45 (0.12) (2)% 7.95 3.40
NYSE:AA Alcoa Corporation 34.48 (1.73) (5)% 39.78 20.00 TSX:LUC Lucara Diamond Corp. 2.78 (0.31) (10)% 4.39 2.41
NasdaqGS:ARLP Alliance Resource Partners, L.P. 23.50 (0.80) (3)% 26.65 10.15 TSX:LUN Lundin Mining Corporation 8.17 (0.17) (2)% 8.94 3.66
TSX:ALS Altius Minerals Corporation 12.69 0.80 7% 14.06 9.01 TSX:MAG MAG Silver Corp. 20.34 (0.72) (3)% 23.32 9.29
NYSE:ACH Aluminum Corporation Of China Limited 12.55 (0.59) (4)% 13.85 7.22 TSX:MDI Major Drilling Group International Inc. 7.60 (0.42) (5)% 8.66 5.72
NYSE:AU AngloGold Ashanti Limited 11.59 (1.31) (10)% 22.91 9.28 NYSE:MTRN Materion Corporation 35.45 (0.40) (1)% 41.23 22.36
TSX:AR Argonaut Gold Inc. 2.36 (0.28) (11)% 4.45 1.48 NYSE:MUX McEwen Mining Inc. 3.74 (0.39) (9)% 4.92 1.68
TSX:AZ Arizona Mining Inc. 2.95 (0.07) (2)% 3.49 0.39 TSX:NSU Nevsun Resources Ltd. 3.55 (0.40) (10)% 4.81 3.55
TSX:AKG Asanko Gold Inc. 3.90 (0.04) (1)% 6.09 2.55 TSX:NGD New Gold, Inc. 3.92 (0.13) (3)% 7.87 3.11
TSX:BTO B2Gold Corp. 4.39 0.17 4% 4.74 1.40 NYSE:NEM Newmont Mining Corporation 36.08 (0.93) (3)% 46.07 24.59
TSX:ABX Barrick Gold Corporation 25.59 (0.82) (3)% 30.45 16.95 TSX:NXE NexGen Energy Ltd. 3.87 (0.15) (4)% 4.45 0.93
NYSE:BHP BHP Billiton Limited 37.97 (2.31) (6)% 41.79 22.44 TSX:NDM Northern Dynasty Minerals Ltd. 2.19 (0.78) (26)% 4.54 0.37
NYSE:BBL BHP Billiton plc 32.67 (2.25) (6)% 37.44 19.69 TSX:NG NovaGold Resources Inc. 7.62 (0.25) (3)% 9.56 5.09
TSX:CCO Cameco Corporation 14.38 (0.97) (6)% 17.67 9.88 TSX:OGC OceanaGold Corporation 4.01 (0.05) (1)% 5.56 3.24
TSX:CG Centerra Gold Inc. 6.59 (0.25) (4)% 8.13 5.56 TSX:OR Osisko Gold Royalties Ltd. 14.76 (0.56) (4)% 18.64 11.90
TSX:CGG China Gold International Resources Corp. Ltd. 2.93 (0.03) (1)% 3.67 1.84 TSX:PAAS Pan American Silver Corp. 24.89 (0.40) (2)% 27.99 12.16
NYSE:CDE Coeur Mining, Inc. 8.75 (0.13) (1)% 16.41 3.41 TSX:PG Premier Gold Mines Limited 2.92 (0.29) (9)% 5.05 1.87
NYSE:BVN Compañía de Minas Buenaventura S.A.A. 12.63 (0.50) (4)% 16.45 5.00 TSX:PVG Pretium Resources Inc. 14.23 (0.58) (4)% 16.48 6.00
NYSE:CMP Compass Minerals International, Inc. 75.70 (2.25) (3)% 84.40 67.05 NasdaqGS:GOLD Randgold Resources Limited 94.77 3.60 4% 126.55 67.54
NYSE:CNX CONSOL Energy Inc. 15.78 (1.16) (7)% 22.34 7.54 TSX:RIC Richmont Mines Inc. 11.35 (0.84) (7)% 15.01 5.99
NYSE:CSTM Constellium N.V 8.10 (0.10) (1)% 8.85 4.02 NYSE:RIO Rio Tinto plc 41.69 (3.81) (8)% 47.11 25.44
TSX:CNL Continental Gold Inc. 5.11 (0.42) (8)% 5.75 1.44 NasdaqGS:RGLD Royal Gold, Inc. 68.33 (1.62) (2)% 87.74 42.80
TSX:DGC Detour Gold Corporation 17.07 (1.79) (9)% 35.93 15.36 TSX:SSL Sandstorm Gold Ltd. 5.94 (0.14) (2)% 8.73 3.76
TSX:DDC Dominion Diamond Corporation 11.50 (1.58) (12)% 16.82 10.47 NYSE:SA Seabridge Gold Inc. 11.35 (0.45) (4)% 15.88 7.35
TSX:ELD Eldorado Gold Corporation 4.22 (0.58) (12)% 6.71 3.46 TSX:SMF SEMAFO Inc. 4.42 (0.33) (7)% 7.46 3.60
TSX:EDV Endeavour Mining Corporation 26.76 (0.22) (1)% 28.81 10.11 NYSE:SBGL Sibanye Gold Limited 8.54 (0.10) (1)% 20.97 6.16
TSX:EDR Endeavour Silver Corp. 6.03 (0.18) (3)% 7.75 2.11 TSX:SSO Silver Standard Resources Inc. 15.09 0.32 2% 20.48 6.92
NasdaqGS:GSM Ferroglobe PLC 10.96 (0.47) (4)% 12.53 7.33 TSX:SLW Silver Wheaton Corp. 27.71 (0.51) (2)% 40.80 20.10
TSX:FR First Majestic Silver Corp. 12.50 (0.66) (5)% 24.96 5.76 TSX:SVM Silvercorp Metals Inc. 5.58 0.26 5% 5.90 1.03
TSX:FM First Quantum Minerals Ltd. 14.00 (1.00) (7)% 17.55 4.81 NYSE:SCCO Southern Copper Corporation 36.29 (1.01) (3)% 39.50 23.80
TSX:FVI Fortuna Silver Mines Inc. 8.01 (0.31) (4)% 12.73 4.46 NYSE:SWC Stillwater Mining Company 17.06 (0.01) (0)% 17.50 7.78
TSX:FNV Franco-Nevada Corporation 86.27 (1.79) (2)% 105.69 71.44 TSX:SWY Stornoway Diamond Corporation 0.82 (0.01) (1)% 1.33 0.81
NYSE:FCX Freeport-McMoRan Inc. 13.25 (1.66) (11)% 17.06 7.26 TSX:THO Tahoe Resources Inc. 11.02 (0.60) (5)% 22.13 11.13
NYSE:GFI Gold Fields Limited 3.25 (0.02) (1)% 6.60 2.60 TSX:TECK.B Teck Resources Limited 27.16 (0.82) (3)% 35.67 7.60
TSX:G Goldcorp Inc. 21.70 (1.06) (5)% 26.56 15.95 TSX:TGZ Teranga Gold Corporation 1.00 0.02 2% 1.40 0.55
TSX:GUY Guyana Goldfields Inc. 7.22 (0.37) (5)% 10.35 4.03 TSX:TMR TMAC Resources Inc. 17.42 0.55 3% 20.18 7.10
NYSE:HL Hecla Mining Company 5.90 (0.68) (10)% 7.64 2.44 TSX:TXG Torex Gold Resources Inc 26.96 (4.97) (16)% 35.17 16.00
TSX:HBM Hudbay Minerals Inc. 10.42 (0.29) (3)% 11.95 3.75 TSX:TV Trevali Mining Corporation 1.36 (0.02) (1)% 1.48 0.33
TSX:IMG IAMGOLD Corporation 5.67 (0.28) (5)% 7.65 2.62 TSX:TRQ Turquoise Hill Resources Ltd. 4.46 (0.07) (2)% 5.03 2.87
TSX:IVN Ivanhoe Mines Ltd. 4.28 (0.58) (12)% 5.11 0.66 NYSE:VEDL Vedanta Limited 15.35 (0.14) (1)% 15.89 4.05
NasdaqGS:KALU Kaiser Aluminum Corporation 76.85 (5.22) (6)% 96.06 69.41 TSX:YRI Yamana Gold Inc. 3.66 (0.38) (9)% 7.87 3.29

The Weekly Dig 2/24/17
Haywood Mining [email protected] Page 21
Upcoming Macroeconomic News
Source: Bloomberg
Date Event Period Survey Prior Revised Relevance Date Event Period Survey Prior Relevance
United States Canada02/27/2017 Durable Goods Orders Jan P 1.60% -0.50% -- 93 02/27/2017 Bloomberg Nanos Confidence 24-Feb -- 57.7 11
02/27/2017 Durables Ex Transportation Jan P 0.50% 0.50% -- 75 02/28/2017 Industrial Product Price MoM Jan -- 0.40% 6402/27/2017 Cap Goods Orders Nondef Ex Air Jan P 0.60% 0.70% -- 61 02/28/2017 Raw Materials Price Index MoM Jan -- 6.50% 5802/27/2017 Cap Goods Ship Nondef Ex Air Jan P -- 1.00% -- 60 03/01/2017 MLI Leading Indicator MoM Jan -- 0.60% 702/27/2017 Pending Home Sales MoM Jan 0.90% 1.60% -- 78 03/01/2017 Current Account Balance 4Q -- -$18.30b 5302/27/2017 Pending Home Sales NSA YoY Jan -- -2.00% -- 31 03/01/2017 Markit Canada Manufacturing PMI Feb -- 53.5 9002/27/2017 Dallas Fed Manf. Activity Feb 20 22.1 -- 66 03/01/2017 Bank of Canada Rate Decision 1-Mar 0.50% 0.50% 9802/28/2017 GDP Annualized QoQ 4Q S 2.10% 1.90% -- 97 03/02/2017 GDP MoM Dec 0.30% 0.40% 8402/28/2017 Personal Consumption 4Q S -- 2.50% -- 68 03/02/2017 GDP YoY Dec -- 1.60% 4002/28/2017 GDP Price Index 4Q S 2.10% 2.10% -- 78 03/02/2017 Quarterly GDP Annualized 4Q 2.00% 3.50% 9302/28/2017 Core PCE QoQ 4Q S -- 1.30% -- 6802/28/2017 Advance Goods Trade Balance Jan -$66.0b -$65.0b -$64.4b 502/28/2017 Wholesale Inventories MoM Jan P 0.40% 1.00% -- 8202/28/2017 Retail Inventories MoM Jan -- 0.00% -- 402/28/2017 S&P CoreLogic CS 20-City MoM SA Dec 0.70% 0.88% -- 2702/28/2017 S&P CoreLogic CS 20-City YoY NSA Dec 5.30% 5.27% -- 4802/28/2017 S&P CoreLogic CS 20-City NSA Index Dec -- 192.14 -- 5302/28/2017 S&P CoreLogic CS US HPI YoY NSA Dec -- 5.64% -- 3702/28/2017 S&P CoreLogic CS US HPI NSA Index Dec -- 185.23 -- 3502/28/2017 Chicago Purchasing Manager Feb 53 50.3 -- 8202/28/2017 Conf. Board Consumer Confidence Feb 111 111.8 -- 9502/28/2017 Conf. Board Present Situation Feb -- 129.7 -- 002/28/2017 Conf. Board Expectations Feb -- 99.8 -- 202/28/2017 Richmond Fed Manufact. Index Feb 10 12 -- 7303/01/2017 MBA Mortgage Applications 24-Feb -- -2.00% -- 9203/01/2017 Personal Income Jan 0.30% 0.30% -- 8603/01/2017 Personal Spending Jan 0.30% 0.50% -- 8603/01/2017 Real Personal Spending Jan -0.20% 0.30% -- 2103/01/2017 PCE Deflator MoM Jan 0.50% 0.20% -- 1803/01/2017 PCE Deflator YoY Jan 2.00% 1.60% -- 4103/01/2017 PCE Core MoM Jan 0.30% 0.10% -- 6003/01/2017 PCE Core YoY Jan 1.80% 1.70% -- 4703/01/2017 Markit US Manufacturing PMI Feb F -- 54.3 -- 9003/01/2017 ISM Manufacturing Feb 56 56 -- 9603/01/2017 ISM Prices Paid Feb 68 69 -- 7503/01/2017 ISM New Orders Feb -- 60.4 -- 5
03/01/2017 ISM Employment Feb -- 56.1 -- 303/01/2017 Construction Spending MoM Jan 0.70% -0.20% -- 8103/01/2017 U.S. Federal Reserve Releases Beige 003/01/2017 Wards Total Vehicle Sales Feb 17.60m 17.48m -- 4503/01/2017 Wards Domestic Vehicle Sales Feb 13.70m 13.60m -- 40
03/02/2017 Challenger Job Cuts YoY Feb -- -38.80% -- 38
03/02/2017 Initial Jobless Claims 25-Feb -- 244k -- 98
03/02/2017 Continuing Claims 18-Feb -- 2060k -- 69
03/02/2017 Bloomberg Consumer Comfort 26-Feb -- 48 -- 69
03/03/2017 Markit US Services PMI Feb F -- 53.9 -- 70
03/03/2017 Markit US Composite PMI Feb F -- 54.3 -- 70
03/03/2017 ISM Non-Manf. Composite Feb 56.4 56.5 -- 79
The Weekly Dig 2/24/17
Haywood Mining [email protected] Page 22
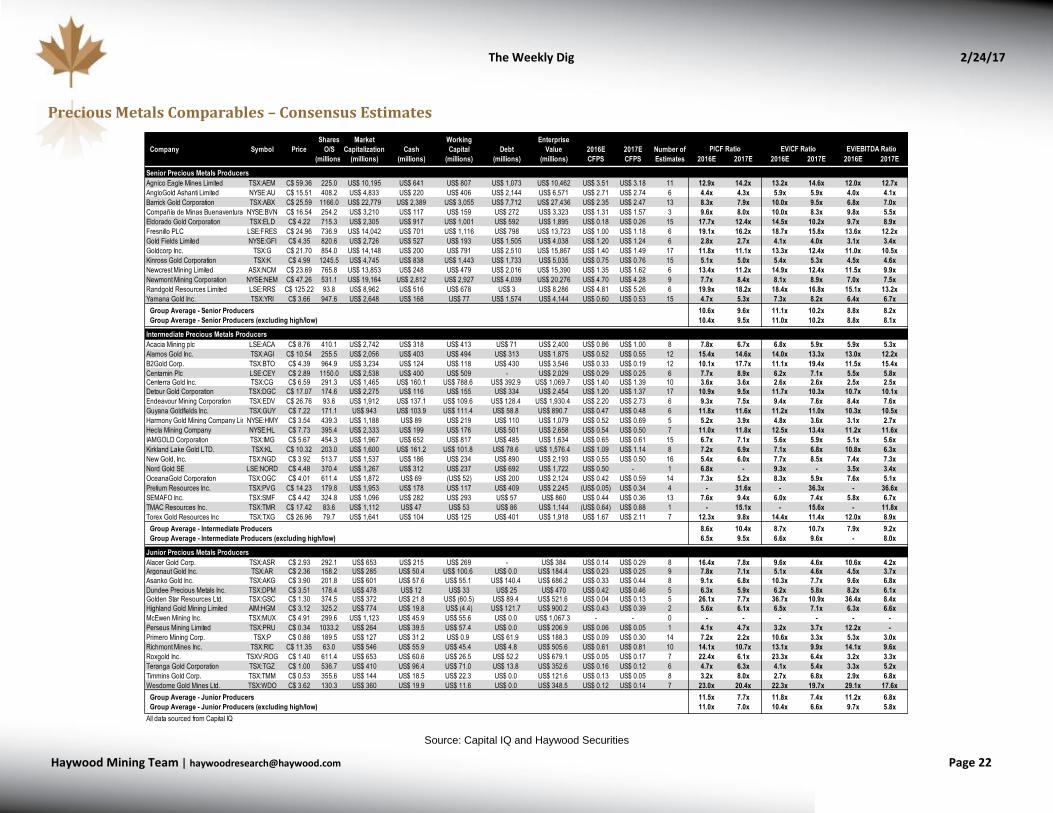
Precious Metals Comparables – Consensus Estimates
Source: Capital IQ and Haywood Securities
Shares Market Working Enterprise
Company Symbol Price O/S Capitalization Cash Capital Debt Value 2016E 2017E Number of
(millions) (millions) (millions) (millions) (millions) (millions) CFPS CFPS Estimates 2016E 2017E 2016E 2017E 2016E 2017E
Senior Precious Metals Producers
Agnico Eagle Mines Limited TSX:AEM C$ 59.36 225.0 US$ 10,195 US$ 641 US$ 807 US$ 1,073 US$ 10,462 US$ 3.51 US$ 3.18 11 12.9x 14.2x 13.2x 14.6x 12.0x 12.7x
AngloGold Ashanti Limited NYSE:AU C$ 15.51 408.2 US$ 4,833 US$ 220 US$ 406 US$ 2,144 US$ 6,571 US$ 2.71 US$ 2.74 6 4.4x 4.3x 5.9x 5.9x 4.0x 4.1x
Barrick Gold Corporation TSX:ABX C$ 25.59 1166.0 US$ 22,779 US$ 2,389 US$ 3,055 US$ 7,712 US$ 27,436 US$ 2.35 US$ 2.47 13 8.3x 7.9x 10.0x 9.5x 6.8x 7.0x
Compañía de Minas Buenaventura S.A.A.NYSE:BVN C$ 16.54 254.2 US$ 3,210 US$ 117 US$ 159 US$ 272 US$ 3,323 US$ 1.31 US$ 1.57 3 9.6x 8.0x 10.0x 8.3x 9.8x 5.5x
Eldorado Gold Corporation TSX:ELD C$ 4.22 715.3 US$ 2,305 US$ 917 US$ 1,001 US$ 592 US$ 1,895 US$ 0.18 US$ 0.26 15 17.7x 12.4x 14.5x 10.2x 9.7x 8.9x
Fresnillo PLC LSE:FRES C$ 24.96 736.9 US$ 14,042 US$ 701 US$ 1,116 US$ 798 US$ 13,723 US$ 1.00 US$ 1.18 6 19.1x 16.2x 18.7x 15.8x 13.6x 12.2x
Gold Fields Limited NYSE:GFI C$ 4.35 820.6 US$ 2,726 US$ 527 US$ 193 US$ 1,505 US$ 4,038 US$ 1.20 US$ 1.24 6 2.8x 2.7x 4.1x 4.0x 3.1x 3.4x
Goldcorp Inc. TSX:G C$ 21.70 854.0 US$ 14,148 US$ 200 US$ 791 US$ 2,510 US$ 15,867 US$ 1.40 US$ 1.49 17 11.8x 11.1x 13.3x 12.4x 11.0x 10.5x
Kinross Gold Corporation TSX:K C$ 4.99 1245.5 US$ 4,745 US$ 838 US$ 1,443 US$ 1,733 US$ 5,035 US$ 0.75 US$ 0.76 15 5.1x 5.0x 5.4x 5.3x 4.5x 4.6x
Newcrest Mining Limited ASX:NCM C$ 23.69 765.8 US$ 13,853 US$ 248 US$ 479 US$ 2,016 US$ 15,390 US$ 1.35 US$ 1.62 6 13.4x 11.2x 14.9x 12.4x 11.5x 9.9x
Newmont Mining Corporation NYSE:NEM C$ 47.26 531.1 US$ 19,164 US$ 2,812 US$ 2,927 US$ 4,039 US$ 20,276 US$ 4.70 US$ 4.28 9 7.7x 8.4x 8.1x 8.9x 7.0x 7.5x
Randgold Resources Limited LSE:RRS C$ 125.22 93.8 US$ 8,962 US$ 516 US$ 678 US$ 3 US$ 8,286 US$ 4.81 US$ 5.26 6 19.9x 18.2x 18.4x 16.8x 15.1x 13.2x
Yamana Gold Inc. TSX:YRI C$ 3.66 947.6 US$ 2,648 US$ 168 US$ 77 US$ 1,574 US$ 4,144 US$ 0.60 US$ 0.53 15 4.7x 5.3x 7.3x 8.2x 6.4x 6.7x
Group Average - Senior Producers 10.6x 9.6x 11.1x 10.2x 8.8x 8.2x
Group Average - Senior Producers (excluding high/low) 10.4x 9.5x 11.0x 10.2x 8.8x 8.1x
Intermediate Precious Metals Producers
Acacia Mining plc LSE:ACA C$ 8.76 410.1 US$ 2,742 US$ 318 US$ 413 US$ 71 US$ 2,400 US$ 0.86 US$ 1.00 8 7.8x 6.7x 6.8x 5.9x 5.9x 5.3x
Alamos Gold Inc. TSX:AGI C$ 10.54 255.5 US$ 2,056 US$ 403 US$ 494 US$ 313 US$ 1,875 US$ 0.52 US$ 0.55 12 15.4x 14.6x 14.0x 13.3x 13.0x 12.2x
B2Gold Corp. TSX:BTO C$ 4.39 964.9 US$ 3,234 US$ 124 US$ 118 US$ 430 US$ 3,546 US$ 0.33 US$ 0.19 12 10.1x 17.7x 11.1x 19.4x 11.5x 15.4x
Centamin Plc LSE:CEY C$ 2.89 1150.0 US$ 2,538 US$ 400 US$ 509 - US$ 2,029 US$ 0.29 US$ 0.25 6 7.7x 8.9x 6.2x 7.1x 5.5x 5.8xCenterra Gold Inc. TSX:CG C$ 6.59 291.3 US$ 1,465 US$ 160.1 US$ 788.6 US$ 392.9 US$ 1,069.7 US$ 1.40 US$ 1.39 10 3.6x 3.6x 2.6x 2.6x 2.5x 2.5x
Detour Gold Corporation TSX:DGC C$ 17.07 174.6 US$ 2,275 US$ 116 US$ 155 US$ 334 US$ 2,454 US$ 1.20 US$ 1.37 17 10.9x 9.5x 11.7x 10.3x 10.7x 10.1x
Endeavour Mining Corporation TSX:EDV C$ 26.76 93.6 US$ 1,912 US$ 137.1 US$ 109.6 US$ 128.4 US$ 1,930.4 US$ 2.20 US$ 2.73 6 9.3x 7.5x 9.4x 7.6x 8.4x 7.6x
Guyana Goldfields Inc. TSX:GUY C$ 7.22 171.1 US$ 943 US$ 103.9 US$ 111.4 US$ 58.8 US$ 890.7 US$ 0.47 US$ 0.48 6 11.8x 11.6x 11.2x 11.0x 10.3x 10.5x
Harmony Gold Mining Company LimitedNYSE:HMY C$ 3.54 439.3 US$ 1,188 US$ 89 US$ 219 US$ 110 US$ 1,079 US$ 0.52 US$ 0.69 5 5.2x 3.9x 4.8x 3.6x 3.1x 2.7x
Hecla Mining Company NYSE:HL C$ 7.73 395.4 US$ 2,333 US$ 199 US$ 176 US$ 501 US$ 2,658 US$ 0.54 US$ 0.50 7 11.0x 11.8x 12.5x 13.4x 11.2x 11.6x
IAMGOLD Corporation TSX:IMG C$ 5.67 454.3 US$ 1,967 US$ 652 US$ 817 US$ 485 US$ 1,634 US$ 0.65 US$ 0.61 15 6.7x 7.1x 5.6x 5.9x 5.1x 5.6x
Kirkland Lake Gold LTD. TSX:KL C$ 10.32 203.0 US$ 1,600 US$ 161.2 US$ 101.8 US$ 78.6 US$ 1,576.4 US$ 1.09 US$ 1.14 8 7.2x 6.9x 7.1x 6.8x 10.8x 6.3x
New Gold, Inc. TSX:NGD C$ 3.92 513.7 US$ 1,537 US$ 186 US$ 234 US$ 890 US$ 2,193 US$ 0.55 US$ 0.50 16 5.4x 6.0x 7.7x 8.5x 7.4x 7.3x
Nord Gold SE LSE:NORD C$ 4.48 370.4 US$ 1,267 US$ 312 US$ 237 US$ 692 US$ 1,722 US$ 0.50 - 1 6.8x - 9.3x - 3.5x 3.4x
OceanaGold Corporation TSX:OGC C$ 4.01 611.4 US$ 1,872 US$ 69 (US$ 52) US$ 200 US$ 2,124 US$ 0.42 US$ 0.59 14 7.3x 5.2x 8.3x 5.9x 7.6x 5.1x
Pretium Resources Inc. TSX:PVG C$ 14.23 179.8 US$ 1,953 US$ 178 US$ 117 US$ 409 US$ 2,245 (US$ 0.05) US$ 0.34 4 - 31.6x - 36.3x - 36.6x
SEMAFO Inc. TSX:SMF C$ 4.42 324.8 US$ 1,096 US$ 282 US$ 293 US$ 57 US$ 860 US$ 0.44 US$ 0.36 13 7.6x 9.4x 6.0x 7.4x 5.8x 6.7x
TMAC Resources Inc. TSX:TMR C$ 17.42 83.6 US$ 1,112 US$ 47 US$ 53 US$ 86 US$ 1,144 (US$ 0.64) US$ 0.88 1 - 15.1x - 15.6x - 11.8x
Torex Gold Resources Inc TSX:TXG C$ 26.96 79.7 US$ 1,641 US$ 104 US$ 125 US$ 401 US$ 1,918 US$ 1.67 US$ 2.11 7 12.3x 9.8x 14.4x 11.4x 12.0x 8.9x
Group Average - Intermediate Producers 8.6x 10.4x 8.7x 10.7x 7.9x 9.2x
Group Average - Intermediate Producers (excluding high/low) 6.5x 9.5x 6.6x 9.6x - 8.0x
Junior Precious Metals Producers
Alacer Gold Corp. TSX:ASR C$ 2.93 292.1 US$ 653 US$ 215 US$ 269 - US$ 384 US$ 0.14 US$ 0.29 8 16.4x 7.8x 9.6x 4.6x 10.6x 4.2xArgonaut Gold Inc. TSX:AR C$ 2.36 158.2 US$ 285 US$ 50.4 US$ 100.6 US$ 0.0 US$ 184.4 US$ 0.23 US$ 0.25 9 7.8x 7.1x 5.1x 4.6x 4.5x 3.7x
Asanko Gold Inc. TSX:AKG C$ 3.90 201.8 US$ 601 US$ 57.6 US$ 55.1 US$ 140.4 US$ 686.2 US$ 0.33 US$ 0.44 8 9.1x 6.8x 10.3x 7.7x 9.6x 6.8x
Dundee Precious Metals Inc. TSX:DPM C$ 3.51 178.4 US$ 478 US$ 12 US$ 33 US$ 25 US$ 470 US$ 0.42 US$ 0.46 5 6.3x 5.9x 6.2x 5.8x 8.2x 6.1xGolden Star Resources Ltd. TSX:GSC C$ 1.30 374.5 US$ 372 US$ 21.8 US$ (60.5) US$ 89.4 US$ 521.6 US$ 0.04 US$ 0.13 5 26.1x 7.7x 36.7x 10.9x 36.4x 8.4x
Highland Gold Mining Limited AIM:HGM C$ 3.12 325.2 US$ 774 US$ 19.8 US$ (4.4) US$ 121.7 US$ 900.2 US$ 0.43 US$ 0.39 2 5.6x 6.1x 6.5x 7.1x 6.3x 6.6x
McEwen Mining Inc. TSX:MUX C$ 4.91 299.6 US$ 1,123 US$ 45.9 US$ 55.6 US$ 0.0 US$ 1,067.3 - - 0 - - - - - -
Perseus Mining Limited TSX:PRU C$ 0.34 1033.2 US$ 264 US$ 39.5 US$ 57.4 US$ 0.0 US$ 206.9 US$ 0.06 US$ 0.05 1 4.1x 4.7x 3.2x 3.7x 12.2x -
Primero Mining Corp. TSX:P C$ 0.88 189.5 US$ 127 US$ 31.2 US$ 0.9 US$ 61.9 US$ 188.3 US$ 0.09 US$ 0.30 14 7.2x 2.2x 10.6x 3.3x 5.3x 3.0x
Richmont Mines Inc. TSX:RIC C$ 11.35 63.0 US$ 546 US$ 55.9 US$ 45.4 US$ 4.8 US$ 505.6 US$ 0.61 US$ 0.81 10 14.1x 10.7x 13.1x 9.9x 14.1x 9.6x
Roxgold Inc. TSXV:ROG C$ 1.40 611.4 US$ 653 US$ 60.6 US$ 26.5 US$ 52.2 US$ 679.1 US$ 0.05 US$ 0.17 7 22.4x 6.1x 23.3x 6.4x 3.2x 3.3x
Teranga Gold Corporation TSX:TGZ C$ 1.00 536.7 US$ 410 US$ 96.4 US$ 71.0 US$ 13.8 US$ 352.6 US$ 0.16 US$ 0.12 6 4.7x 6.3x 4.1x 5.4x 3.3x 5.2x
Timmins Gold Corp. TSX:TMM C$ 0.53 355.6 US$ 144 US$ 18.5 US$ 22.3 US$ 0.0 US$ 121.6 US$ 0.13 US$ 0.05 8 3.2x 8.0x 2.7x 6.8x 2.9x 6.8x
Wesdome Gold Mines Ltd. TSX:WDO C$ 3.62 130.3 US$ 360 US$ 19.9 US$ 11.6 US$ 0.0 US$ 348.5 US$ 0.12 US$ 0.14 7 23.0x 20.4x 22.3x 19.7x 29.1x 17.6x
Group Average - Junior Producers 11.5x 7.7x 11.8x 7.4x 11.2x 6.8x
Group Average - Junior Producers (excluding high/low) 11.0x 7.0x 10.4x 6.6x 9.7x 5.8x
All data sourced from Capital IQ
P/CF Ratio EV/CF Ratio EV/EBITDA Ratio

The Weekly Dig 2/24/17
Haywood Mining [email protected] Page 23
Other Precious Metals Comparables – Consensus Estimates
Source: Capital IQ and Haywood Securities
Shares Market Working Enterprise
Company Symbol Price O/S Capitalization Cash Capital Debt Value 2016E 2017E Number of
(millions) (millions) (millions) (millions) (millions) (millions) CFPS CFPS Estimates 2016E 2017E 2016E 2017E 2016E 2017E
PGM Producers
Impala Platinum Holdings Limited JSE:IMP C$ 4.61 709.7 US$ 2,495 US$ 390 US$ 828 US$ 582 US$ 2,250 US$ 0.31 US$ 0.34 4 11.3x 10.3x 10.2x 9.2x 7.7x 6.5x
Lonmin plc LSE:LMI C$ 2.01 282.4 US$ 432 US$ 323 US$ 511 US$ 150 US$ 71 US$ 0.30 US$ 0.31 5 5.0x 4.9x 0.8x 0.8x 0.8x 0.9x
Stillwater Mining Company NYSE:SWC C$ 22.35 121.2 US$ 2,068 US$ 450 US$ 527 US$ 275 US$ 1,816 US$ 0.75 US$ 1.10 2 22.9x 15.5x 20.1x 13.6x 17.9x 11.9x
North American Palladium Ltd. TSX:PDL C$ 5.71 58.1 US$ 253 US$ 11 US$ 6 US$ 34 US$ 281 - - 0 - - - - - -
Group Average - PGM Producers 13.1x 10.2x 10.4x 7.9x 8.8x 6.4x
Group Average - PGM Producers (excluding high/low) 11.3x 10.3x 10.2x 9.2x 7.7x 6.5x
Silver Producers
Aurcana Corporation TSXV:AUN C$ 0.45 84.7 US$ 29 US$ 1 US$ 1 - US$ 28 - - 0 - - - - - -
Coeur Mining, Inc. NYSE:CDE C$ 11.46 181.1 US$ 1,584 US$ 162 US$ 294 US$ 176 US$ 1,466 US$ 1.10 US$ 1.12 5 8.0x 7.8x 7.4x 7.2x 6.3x 6.2x
Endeavour Silver Corp. TSX:EDR C$ 6.03 127.1 US$ 585 US$ 83 US$ 92 US$ 2 US$ 495 US$ 0.23 US$ 0.26 5 19.8x 18.0x 16.8x 15.3x 13.3x 12.9x
First Majestic Silver Corp. TSX:FR C$ 12.50 165.0 US$ 1,574 US$ 143 US$ 131 US$ 32 US$ 1,475 US$ 0.61 US$ 0.69 6 15.5x 13.9x 14.5x 13.0x 13.6x 12.4x
Fortuna Silver Mines Inc. TSX:FVI C$ 8.01 158.9 US$ 971 US$ 105 US$ 91 US$ 40 US$ 920 US$ 0.50 US$ 0.55 5 12.3x 11.2x 11.6x 10.6x 11.4x 9.0x
Hecla Mining Company NYSE:HL C$ 7.73 395.4 US$ 2,333 US$ 199 US$ 176 US$ 501 US$ 2,658 US$ 0.54 US$ 0.50 5 11.0x 11.8x 12.5x 13.4x 11.2x 11.6x
Mandalay Resources Corporation TSX:MND C$ 0.63 451.2 US$ 217 US$ 67 US$ 44 US$ 1 US$ 174 US$ 0.12 US$ 0.11 4 4.1x 4.5x 3.3x 3.6x 3.5x 3.8x
Pan American Silver Corp. TSX:PAAS C$ 24.89 152.2 US$ 2,893 US$ 218 US$ 429 US$ 36 US$ 2,500 US$ 1.48 US$ 1.42 6 12.8x 13.4x 11.1x 11.5x 8.9x 9.2x
Silver Standard Resources Inc. TSX:SSO C$ 15.09 119.4 US$ 1,376 US$ 476 US$ 560 US$ 220 US$ 1,036 US$ 1.45 US$ 1.12 4 7.9x 10.3x 6.0x 7.8x 5.1x 6.8x
Silvercorp Metals Inc. TSX:SVM C$ 5.58 167.3 US$ 713 US$ 97 US$ 64 - US$ 648 US$ 0.18 US$ 0.42 2 23.7x 10.1x 21.5x 9.2x 15.8x -
Tahoe Resources Inc. TSX:THO C$ 11.02 311.1 US$ 2,618 US$ 142 US$ 168 - US$ 2,449 US$ 1.11 US$ 0.98 10 7.6x 8.6x 7.1x 8.0x 6.3x 7.0x
Group Average - Silver Producers 12.3x 11.0x 11.2x 10.0x 9.5x 8.8x
Group Average - Silver Producers (excluding high/low) 11.9x 10.9x 10.9x 10.1x 9.5x 8.9x
Diamond Producers
Dominion Diamond Corporation NYSE:DDC C$ 11.49 83.1 US$ 728 US$ 198 US$ 438 - US$ 290 US$ 1.67 US$ 1.33 4 5.3x 6.6x 2.1x 2.6x 1.2x 1.8x
Lucara Diamond Corp. TSX:LUC C$ 2.78 382.2 US$ 811 US$ 53 US$ 66 - US$ 745 US$ 0.28 US$ 0.28 8 7.5x 7.6x 6.9x 6.9x 4.0x 4.8x
Stornoway Diamond Corporation TSX:SWY C$ 0.82 828.5 US$ 519 US$ 64 US$ 39 US$ 172 US$ 652 US$ 0.10 US$ 0.08 3 6.5x 7.5x 8.1x 9.4x - 6.8x
Group Average - Diamond Producers 6.4x 7.1x 4.5x 4.8x 2.6x 3.3x
Royalty Companies
Anglo Pacific Group plc LSE:APF C$ 2.00 180.0 US$ 275 US$ 5 US$ 0 US$ 12 US$ 286 US$ 0.12 US$ 0.21 3 12.7x 7.2x 13.2x 7.4x 7.0x 4.9x
Franco-Nevada Corporation TSX:FNV C$ 86.27 178.3 US$ 11,740 US$ 278 US$ 358 - US$ 11,383 US$ 2.58 US$ 2.55 15 25.5x 25.8x 24.7x 25.0x 23.5x 23.5x
Osisko Gold Royalties Ltd. TSX:OR C$ 14.76 106.5 US$ 1,200 US$ 299 US$ 296 US$ 35 US$ 939 US$ 0.38 US$ 0.38 11 29.8x 29.7x 23.3x 23.2x 27.2x 25.3x
Royal Gold, Inc. US:RGLD C$ 89.50 65.3 US$ 4,464 US$ 84 US$ 114 US$ 677 US$ 5,028 US$ 3.41 US$ 4.20 9 20.0x 16.3x 22.6x 18.3x 19.0x 16.2x
Sandstorm Gold Ltd. TSX:SSL C$ 5.94 151.9 US$ 689 US$ 21 US$ 24 - US$ 665 US$ 0.27 US$ 0.27 8 16.9x 16.7x 16.3x 16.1x 16.7x 16.1x
Silver Wheaton Corp. US:RGLD C$ 27.71 441.2 US$ 9,334 US$ 126 US$ 115 US$ 1,345 US$ 10,564 US$ 3.41 US$ 4.20 9 6.2x 5.0x 7.0x 5.7x 18.0x 16.7x
Group Average - Royalty Companies 18.5x 16.8x 17.9x 16.0x 18.6x 17.1x
Group Average - Royalty Companies (excluding high/low) 18.8x 16.5x 18.9x 16.3x 19.3x 18.1x
All data sourced from Capital IQ
P/CF Ratio EV/CF Ratio EV/EBITDA Ratio

The Weekly Dig 2/24/17
Haywood Mining [email protected] Page 24
Base Metals Comparables – Consensus Estimates
Shares Market Working Enterprise
Company Symbol Price O/S Capitalization Cash Capital Debt Value 2016E 2017E Number of
(millions) (millions) (millions) (millions) (millions) (millions) CFPS CFPS Estimates 2016E 2017E 2016E 2017E 2016E 2017E
Large-Cap Base Metals Producers
Anglo American plc LSE:AAL C$ 20.50 1402.2 US$ 21,945 US$ 6,051 US$ 5,924 US$ 11,310 US$ 27,331 US$ 3.79 US$ 4.89 9 4.1x 3.2x 5.1x 4.0x 4.7x 3.4x
Antofagasta plc LSE:ANTO C$ 13.22 985.9 US$ 9,948 US$ 2,180 US$ 1,968 US$ 2,328 US$ 10,308 US$ 1.10 US$ 1.27 10 9.1x 8.0x 9.5x 8.3x 6.7x 6.1x
BHP Billiton Limited ASX:BHP C$ 25.23 5320.5 US$ 102,499 US$ 14,090 US$ 9,502 US$ 30,670 US$ 123,667 US$ 2.73 US$ 3.32 4 7.1x 5.8x 8.5x 7.0x 10.4x 5.7x
First Quantum Minerals Ltd. TSX:FM C$ 14.00 689.4 US$ 7,368 US$ 1,463 US$ 849 US$ 4,561 US$ 11,080 US$ 1.49 US$ 1.68 9 7.2x 6.4x 10.8x 9.6x 10.8x 9.5x
Freeport-McMoRan Inc. NYSE:FCX C$ 17.36 1440.0 US$ 19,080 US$ 4,245 US$ 6,170 US$ 14,795 US$ 27,705 US$ 2.83 US$ 2.75 7 4.7x 4.8x 6.8x 7.0x 5.8x 5.1x
Glencore Plc LSE:GLEN C$ 5.36 14227.8 US$ 58,225 US$ 2,642 US$ 45 US$ 22,862 US$ 81,042 US$ 0.51 US$ 0.60 9 8.1x 6.8x 11.2x 9.5x 8.3x 5.9x
KGHM Polska Miedz Spólka Akcyjna WSE:KGH C$ 41.89 200.0 US$ 6,395 US$ 191 US$ 313 US$ 1,691 US$ 7,774 US$ 4.01 US$ 4.97 4 8.0x 6.4x 9.7x 7.8x 7.4x 6.0x
Rio Tinto plc LSE:RIO C$ 54.27 1799.1 US$ 74,537 US$ 8,560 US$ 5,686 US$ 16,913 US$ 85,764 US$ 5.22 US$ 7.17 7 7.9x 5.8x 9.1x 6.6x 6.5x 5.2x
Teck Resources Limited TSX:TECK.B C$ 27.16 577.1 US$ 11,978 US$ 1,047 US$ 1,907 US$ 6,137 US$ 16,208 US$ 3.52 US$ 6.50 7 5.9x 3.2x 8.0x 4.3x 6.0x 3.6x
Vale S.A. NYSE:VALE C$ 13.87 5153.4 US$ 54,790 US$ 4,632 US$ 11,350 US$ 27,703 US$ 71,142 US$ 1.49 US$ 1.82 6 7.0x 5.8x 9.2x 7.6x 6.3x 4.9x
Group Average - Large-Cap Producers 6.9x 5.6x 8.8x 7.2x 7.3x 5.5x
Group Average - Large-Cap Producers (excluding high/low) 7.0x 5.6x 8.9x 7.3x 7.2x 5.3x
Mid Tier Base Metals Producers
Capstone Mining Corp TSX:CS C$ 1.65 390.4 US$ 492 US$ 130 US$ 171 US$ 325 US$ 646 US$ 0.30 US$ 0.30 10 4.2x 4.2x 5.5x 5.5x 4.4x 4.6x
Cliffs Natural Resources Inc. NYSE:CLF C$ 14.03 288.1 US$ 3,085 US$ 323 US$ 434 US$ 2,175 US$ 4,827 US$ 1.24 US$ 1.72 2 8.7x 6.2x 13.6x 9.8x 14.2x 7.5x
Hudbay Minerals Inc. TSX:HBM C$ 10.42 237.3 US$ 1,887 US$ 150 US$ 122 US$ 1,216 US$ 2,982 US$ 1.55 US$ 1.95 11 5.1x 4.1x 8.1x 6.4x 6.7x 5.2x
Imperial Metals Corporation TSX:III C$ 6.60 93.6 US$ 472 US$ 3 (US$ 37) US$ 640 US$ 1,149 US$ 0.73 US$ 1.32 3 6.9x 3.8x 16.7x 9.3x 14.2x 8.7x
KAZ Minerals plc LSE:KAZ C$ 8.96 446.7 US$ 3,056 US$ 1,108 US$ 866 US$ 3,446 US$ 5,636 US$ 0.60 US$ 0.91 3 11.5x 7.5x 21.2x 13.9x 18.2x 7.8x
Lundin Mining Corporation TSX:LUN C$ 8.17 726.2 US$ 4,529 US$ 715 US$ 2,052 US$ 982 US$ 3,459 US$ 0.52 US$ 1.03 8 12.1x 6.1x 9.2x 4.6x 5.9x 4.1x
MMG Limited HKSE:1208 C$ 0.53 7935.1 US$ 3,190 US$ 234 (US$ 107) US$ 9,572 US$ 12,869 US$ 0.24 US$ 0.16 1 1.7x 2.5x 6.8x 10.1x 15.7x 5.9x
Nevsun Resources Ltd. TSX:NSU C$ 3.55 301.3 US$ 817 US$ 199 US$ 201 - US$ 616 US$ 0.34 US$ 0.26 6 8.0x 10.3x 6.0x 7.8x 5.9x -
Nyrstar NV ENXTBR:NYR C$ 8.11 93.6 US$ 579 US$ 142 (US$ 411) US$ 596 US$ 1,586 US$ 0.92 US$ 2.11 1 6.7x 2.9x 18.5x 8.0x 7.9x 4.7x
OZ Minerals Limited ASX:OZL C$ 9.57 298.7 US$ 2,181 US$ 474 US$ 556 - US$ 1,625 US$ 0.88 US$ 0.75 5 8.3x 9.7x 6.2x 7.3x 5.4x 5.0x
Sherritt International Corporation TSX:S C$ 1.16 294.3 US$ 261 US$ 230 US$ 368 US$ 1,627 US$ 1,519 (US$ 0.38) US$ 0.19 2 - 4.6x - 27.0x 86.5x 6.7x
Turquoise Hill Resources Ltd. TSX:TRQ C$ 4.46 2012.3 US$ 6,852 US$ 1,437 US$ 2,229 US$ 4,099 US$ 8,722 US$ 0.14 (US$ 0.09) 5 24.0x - 30.6x - 23.4x 82.1x
Vedanta Resources plc LSE:VED C$ 14.49 277.1 US$ 3,064 US$ 8,167 US$ 1,358 US$ 12,022 US$ 13,729 US$ 6.62 US$ 10.11 2 1.7x 1.1x 7.5x 4.9x 5.9x 4.3x
Western Areas Ltd ASX:WSA C$ 2.42 272.3 US$ 502 US$ 75 US$ 87 - US$ 416 US$ 0.12 US$ 0.24 3 15.4x 7.6x 12.8x 6.3x 15.0x 7.4x
Group Average - Mid Tier Producers 8.8x 5.4x 12.5x 9.3x 16.4x 11.8x
Group Average - Mid Tier Producers (excluding high/low) 7.5x 5.0x 11.0x 7.8x 11.5x 6.0x
Small Cap Base Metals Producers
Amerigo Resources Ltd. TSX:ARG C$ 0.56 174.7 US$ 75 US$ 16 US$ 1 US$ 59 US$ 133 US$ 0.12 US$ 0.02 1 3.6x 21.4x 6.4x 38.2x 37.0x -
Copper Mountain Mining Corporation TSX:CMMC C$ 1.20 132.7 US$ 122 US$ 23 (US$ 1) US$ 236 US$ 358 US$ 0.27 US$ 0.31 4 3.3x 3.0x 9.9x 8.8x 9.9x 6.9x
Taseko Mines Limited TSX:TKO C$ 1.82 223.9 US$ 311 US$ 67 US$ 82 US$ 278 US$ 507 US$ 0.06 US$ 0.38 5 23.3x 3.6x 38.0x 5.9x 35.8x 6.0x
Trevali Mining Corporation TSX:TV C$ 1.43 402.6 US$ 441 US$ 11 US$ 4 US$ 45 US$ 482 US$ 0.09 US$ 0.23 4 11.8x 4.8x 12.9x 5.3x 10.8x 3.9x
Group Average - Small Cap Producers 10.5x 8.2x 16.8x 14.5x 23.4x 5.6x
Group Average - Small Cap Producers (excluding high/low) 7.7x 4.2x 11.4x 7.3x 23.3x 4.9x
All data sourced from Capital IQ
P/CF Ratio EV/CF Ratio EV/EBITDA Ratio

The Weekly Dig 2/24/17
Haywood Mining [email protected] Page 25
Iron Comparables – Consensus Estimates
Bloomberg Shares Market Daily Enterprise
Company (T icker) Share Price
Consensus
Target
Implied
Return β
Outstanding
(millions)
Capitalization
(millions)
Volume
(millions)
Weekly
Liquidity WACC
Debt
(millions)
Value
(millions) 2017 2018 2019 2017 2018 2019 2017 2018 2019 2017 2018 2019
Diversified Mining Houses
VALE SA (VALE3-BZ) R$ 32.72 R$ 36.55 11.7% 1.59 3,217 R$ 169,141 5.6 1.2% 15.3% R$ 95,563 R$ 257,275 5.97 4.89 5.5x 6.7x 10.6x 13.1x 9.7x 6.1x 6.9x 5.9x
BHP BILLITON (BHP-AU) A$ 25.06 A$ 28.08 12.0% 1.57 3,212 A$ 125,353 10.2 1.7% 10.8% A$ 36,421 A$ 121,989 3.88 3.63 3.53 6.5x 6.9x 7.1x 13.5x 16.4x 17.3x 5.7x 6.4x 6.4x
RIO TINTO (RIO-AU) A$ 62.88 A$ 70.81 12.6% 1.19 424 A$ 100,737 2.7 5.1% 7.8% A$ 18,392 A$ 93,904 8.92 7.34 8.07 7.1x 8.6x 7.8x 12.4x 16.2x 15.0x 5.7x 6.6x 6.3x
Group Average - Diversifed Mining Avg. -> 6.3x 7.4x 7.4x 12.1x 15.2x 14.0x 5.9x 6.6x 6.2x
Producers
KUMBA IRON (KIO-SJE) ZAR 20,654 ZAR 17,994 (12.9)% 1.97 322 ZAR 66,524 0.6 1.2% 12.2% ZAR 4,500 ZAR 69,045 3685 2700 2185 5.6x 7.6x 9.5x 8.6x 12.4x 19.8x 4.2x 5.4x 7.1x
FORTESCUE METALS (FMG-AU) A$ 6.57 A$ 6.71 2.1% 1.59 3,114 A$ 20,458 22.5 4.1% 10.9% A$ 6,771 A$ 19,703 1.58 1.03 1.06 4.2x 6.4x 6.2x 6.9x 11.2x 15.1x 4.1x 5.5x 6.4x
CLIFFS NATURAL (CLF-US) US$ 10.71 US$ 9.63 (10.1)% 1.91 288 US$ 3,085 19.5 39.6% 9.3% US$ 2,231 US$ 5,127 2.45 2.56 1.97 4.4x 4.2x 5.4x 7.3x 10.5x 11.6x 7.7x 10.0x 10.7x
MMX MINERACAO (MMXM3-BRZ) R$ 5.04 0.61 6 R$ 33 0.1 1.1% 13.2% R$ 151 R$ 163
FERREXPO PLC (FXPO-LSE) GBp 161 GBp 146.50 (8.9)% 1.31 589 GBp 947 3.6 2.9% 3.8% GBp 904 GBp 1,932 51.44 34.14 44.01 3.1x 4.7x 3.7x 4.1x 7.9x 7.7x 4.2x 6.7x 7.5x
MOUNT GIBSON (MGX-AU) A$ 0.53 A$ 0.53 0.3% 0.88 1,097 A$ 576 3.8 3.5% 9.0% A$ 0 A$ 129 0.03 0.00 (0.02) 15.9x 15.0x 32.8x
GRANGE RESOURCES (GRR-AU) A$ 0.25 0.83 1,157 A$ 284 2.2 1.2% 8.1% A$ 12 A$ 186
BC IRON (BCI-AU) A$ 0.25 A$ 0.34 38.8% 1.87 393 A$ 96 4.2 8.7% 16.0% A$ 2 A$ 64
Group Average - Producers Avg. -> 6.6x 5.7x 6.2x 8.4x 15.0x 13.5x 5.0x 6.9x 7.9x
Advanced Development / Exploration (Select Group)
SUNDANCE RESOURCES (SDL-AU) A$ 0.01 1.00 7,101 A$ 49.7 31.4 4.8% 4.7% A$ 97 A$ 118
NEW MILLENNIUM (NML-T) C$ 0.29 1.16 181 C$ 51.6 1.1 2.0% 12.9% C$ 0 C$ 37
ALDERON IRON (ADV-T) C$ 0.50 C$ 0.50 0.0% 1.43 132 C$ 66.1 0.6 1.6% 8.0% C$ 21 C$ 120
ZANAGA IRON (ZIOC-LSE) GBp 8 0.07 279 GBp 22.3 0.5 0.3% 4.7% GBp 0 GBp 22
CENTURY GLOBAL (CNT-T) C$ 0.34 98 C$ 33.5 0.0 0.0% 11.4% C$ 0 C$ 20
CHAMPION IRON (CIA-T) C$ 1.15 1.08 386 C$ 443.8 2.0 2.2% 13.1% C$ 0 C$ 430
BLACK IRON (BKI-T) C$ 0.11 (0.47) 160 C$ 17.6 0.9 3.8% -3.0% C$ 0 C$ 10
OCEANIC IRON (FEO-T) C$ 0.28 0.06 50 C$ 13.9 0.1 0.4% 2.1% C$ 2 C$ 15
MACARTHUR MINERALS (MMS-T) C$ 0.13 0.88 140 C$ 18.1 1.8 8.8% 9.1% C$ 0 C$ 17
Group Average - Developers / Explorers Avg. ->
All data sourced from Bloomberg
EV/EBITDAP/EPSCFPS (LoC) P/CFPS

The Weekly Dig 2/24/17
Haywood Mining [email protected] Page 26
Uranium Comparables – Consensus Estimates
Bloomberg Shares Market Daily Enterprise
Company (T icker)
Share
Price
Consensus
Target
Implied
Return β
Outst.
(millions)
Capitalization
(millions)
Volume
(millions)
Weekly
Liquidity
Value
(millions)
Resource
(M lb)
USD
EV/lb
Resource 2016 2017 2018 2016 2017 2018 2016 2017 2018 2016 2017 2018
CAMECO CORP (CCO-T) C$ 14.38 C$ 15.87 10.3% 0.99 396 C$ 5,691 3.53 3.3% C$ 6,865 996.1 $5.26 1.17 1.64 1.22 12.3x 8.8x 11.8x 0.51 0.83 1.06 28.2x 17.3x 13.5x
PALADIN ENERGY (PDN-AU) A$ 0.12 A$ 0.11 (2.9)% 1.00 1,713 A$ 197 2.81 1.0% A$ 482 510.5 $0.72 (0.02) 0.00 0.00 38.3x 115.0x (0.03) 0.02 7.2x
ENERGY RESOURCES (ERA-AU) C$ 0.60 C$ 0.05 (92)% 0.63 518 C$ 311 0.79 1.0% C$ -85 473.0 ($0.14) (0.06) 0.00 300.0x (0.12) (0.07) (0.05)
ENERGY FUELS (EFR-T) C$ 2.85 C$ 5.62 97.0% 1.71 67 C$ 190 0.40 2.6% C$ 162 152.0 $0.82 (0.18) (0.16) (0.05) (0.52) (0.33)
UR-ENERGY INC (URE-T) C$ 1.02 C$ 2.08 104.3% 0.72 144 C$ 147 0.22 0.5% C$ 135 29.9 $3.44 0.01 0.01 (0.02) 127.5x 127.5x (0.02) 0.02 0.00 51.0x 340.0x
URANIUM ENERGY (UEC-AMEX) US$ 1.60 US$ 2.81 75.8% 1.46 135 US$ 216 2.39 7.2% US$ 231 89.3 $2.59 (0.10) (0.09) 0.06 29.1x (0.12) (0.10) (0.07)
Group Average - Producers $2.12 69.9x 118.7x 52.0x 28.2x 34.1x 120.2x
DEEP YELLOW (DYL-AU) A$ 0.02 0.12 2,592 A$ 54 17.67 1.7% A$ 53 106.0 $0.38
DENISON MINES (DML-T) US$ 0.88 US$ 1.40 59.5% 1.44 533 US$ 469 2.26 1.9% US$ 346 204.3 $1.29 (0.02) (0.02) (0.01) (0.02) (0.03) (0.02)
FORSYS METALS (FSY-T) C$ 0.17 0.28 146 C$ 24 0.24 0.5% C$ 24 125.0 $0.14
UR-ENERGY INC (URE-T) C$ 1.02 C$ 2.08 104.3%
MEGA URANIUM (MGA-T) C$ 0.26 1.35 284 C$ 73 2.15 2.7% C$ 71 43.1 $1.27
LARAMIDE RESOURCES (LAM-T) C$ 0.63 C$ 0.75 19.0% 1.10 111 C$ 70 0.56 2.1% C$ 69 62.3 $0.85 (0.03) (0.03) (0.02) (0.02) (0.03) (0.02)
BANNERMAN RESOURCES (BMN-AU) A$ 0.06 1.04 849 A$ 52 3.08 2.4% A$ 50 169.6 $0.23
PLATEAU URANIUM (PLU-V) C$ 0.65 1.10 55 C$ 35 0.20 4.7% C$ 25 124.0 $0.15
TORO ENERGY (TOE-AU) A$ 0.05 A$ 0.07 55.6% 0.52 2,008 A$ 90 1.59 0.3% A$ 80 96.0 $0.64
ALLIANCE RESOURCES (AGS-AU) A$ 0.10 0.27 104 A$ 10 NA NA A$ -15 17.8 ($0.64)
PENINSULA ENERGY (PEN-AU) C$ 0.66 C$ 1.14 74.3% 1.20 198 C$ 130 0.45 0.6% C$ 151 110.6 $1.05 (0.03) 0.06 0.07 10.9x (0.03) 0.04 0.08 18.7x 8.4x
Group Average - Developers $0.54 10.9x 18.7x
FISSION URANIUM (FCU-T) C$ 0.78 C$ 1.70 117.9% 1.15 484 C$ 378 1.87 1.5% C$ 324 108.3 $2.29 (0.02) (0.02) (0.02) (0.02) (0.02) (0.02)
FISSION 3.0 (FUU-V) C$ 0.08 1.19 178 C$ 13 0.49 0.4% C$ 12
NEXGEN ENERGY (NXE-T) C$ 3.87 C$ 4.60 18.9% 1.1 306 C$ 1,185 2.55 4.1% C$ 1,167 201.9 $4.41 (0.03) (0.02) (0.02) (0.05) (0.04) (0.04)
KIVALLIQ ENERGY (KIV-V) C$ 0.15 C$ 0.15 3.4% 1.23 247 C$ 36 0.60 0.8% C$ 35 20.0 $0.35
AZINCOURT URANIUM (AAZ-V) C$ 0.16 1.03 14 C$ 2 0.05 3.2% C$ 2
URACAN RESOURCES (URC-V) C$ 0.06 0.19 106 C$ 6 0.14 1.1% C$ 6 44.0 $0.11
Group Average - Explorers $1.79
URANIUM PARTICIPATION (U-T) C$ 4.28 C$ 4.83 12.9% 0.57 121 C$ 517 0.35 1.1% C$ 507 (0.04) (0.04)
All data sourced from Bloomberg
PR
OD
UC
ER
SD
EV
ELO
PE
RS
EX
PLO
RE
RS
P/EPSCFPS (LoC) P/CFPS EPS (LoC)
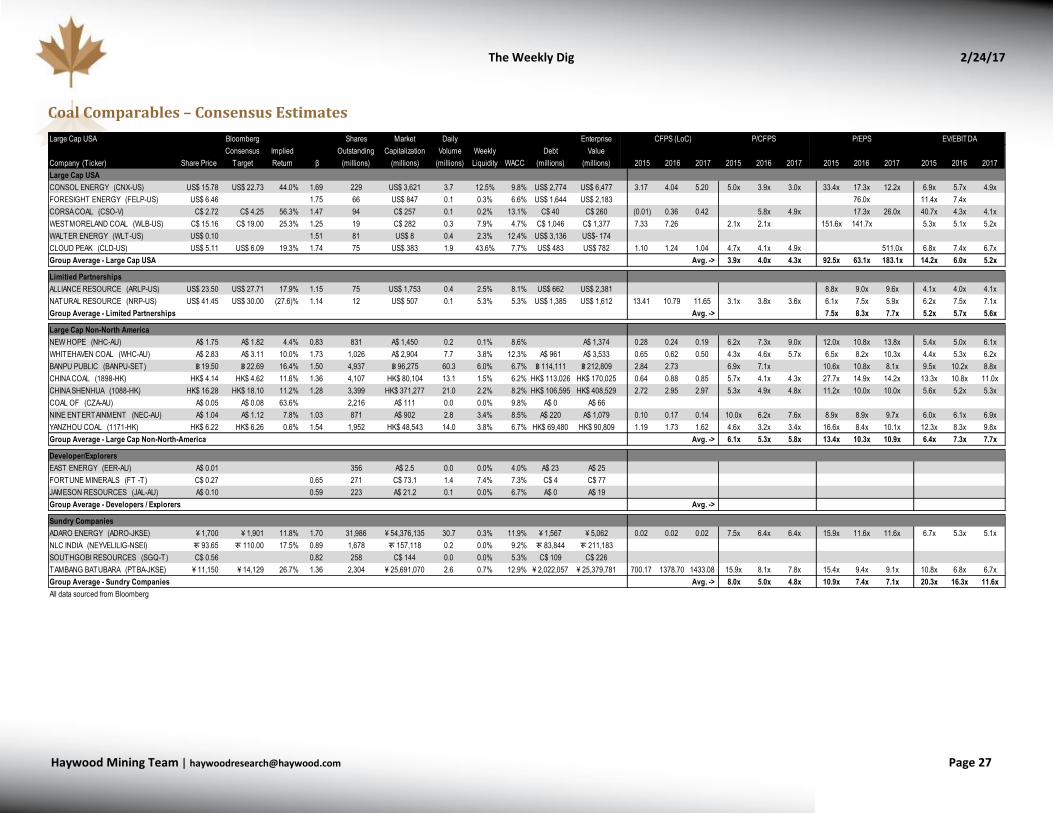
The Weekly Dig 2/24/17
Haywood Mining [email protected] Page 27
Coal Comparables – Consensus Estimates
Large Cap USA Bloomberg Shares Market Daily Enterprise
Company (T icker) Share Price
Consensus
Target
Implied
Return β
Outstanding
(millions)
Capitalization
(millions)
Volume
(millions)
Weekly
Liquidity WACC
Debt
(millions)
Value
(millions) 2015 2016 2017 2015 2016 2017 2015 2016 2017 2015 2016 2017
Large Cap USA
CONSOL ENERGY (CNX-US) US$ 15.78 US$ 22.73 44.0% 1.69 229 US$ 3,621 3.7 12.5% 9.8% US$ 2,774 US$ 6,477 3.17 4.04 5.20 5.0x 3.9x 3.0x 33.4x 17.3x 12.2x 6.9x 5.7x 4.9x
FORESIGHT ENERGY (FELP-US) US$ 6.46 1.75 66 US$ 847 0.1 0.3% 6.6% US$ 1,644 US$ 2,183 76.0x 11.4x 7.4x
CORSA COAL (CSO-V) C$ 2.72 C$ 4.25 56.3% 1.47 94 C$ 257 0.1 0.2% 13.1% C$ 40 C$ 260 (0.01) 0.36 0.42 5.8x 4.9x 17.3x 26.0x 40.7x 4.3x 4.1x
WESTMORELAND COAL (WLB-US) C$ 15.16 C$ 19.00 25.3% 1.25 19 C$ 282 0.3 7.9% 4.7% C$ 1,046 C$ 1,377 7.33 7.26 2.1x 2.1x 151.6x 141.7x 5.3x 5.1x 5.2x
WALTER ENERGY (WLT-US) US$ 0.10 1.51 81 US$ 8 0.4 2.3% 12.4% US$ 3,136 US$- 174
CLOUD PEAK (CLD-US) US$ 5.11 US$ 6.09 19.3% 1.74 75 US$ 383 1.9 43.6% 7.7% US$ 483 US$ 782 1.10 1.24 1.04 4.7x 4.1x 4.9x 511.0x 6.8x 7.4x 6.7x
Group Average - Large Cap USA Avg. -> 3.9x 4.0x 4.3x 92.5x 63.1x 183.1x 14.2x 6.0x 5.2x
Limitied Partnerships
ALLIANCE RESOURCE (ARLP-US) US$ 23.50 US$ 27.71 17.9% 1.15 75 US$ 1,753 0.4 2.5% 8.1% US$ 662 US$ 2,381 8.8x 9.0x 9.6x 4.1x 4.0x 4.1x
NATURAL RESOURCE (NRP-US) US$ 41.45 US$ 30.00 (27.6)% 1.14 12 US$ 507 0.1 5.3% 5.3% US$ 1,385 US$ 1,612 13.41 10.79 11.65 3.1x 3.8x 3.6x 6.1x 7.5x 5.9x 6.2x 7.5x 7.1x
Group Average - Limited Partnerships Avg. -> 7.5x 8.3x 7.7x 5.2x 5.7x 5.6x
Large Cap Non-North America
NEW HOPE (NHC-AU) A$ 1.75 A$ 1.82 4.4% 0.83 831 A$ 1,450 0.2 0.1% 8.6% A$ 15 A$ 1,374 0.28 0.24 0.19 6.2x 7.3x 9.0x 12.0x 10.8x 13.8x 5.4x 5.0x 6.1x
WHITEHAVEN COAL (WHC-AU) A$ 2.83 A$ 3.11 10.0% 1.73 1,026 A$ 2,904 7.7 3.8% 12.3% A$ 961 A$ 3,533 0.65 0.62 0.50 4.3x 4.6x 5.7x 6.5x 8.2x 10.3x 4.4x 5.3x 6.2x
BANPU PUBLIC (BANPU-SET) ฿ 19.50 ฿ 22.69 16.4% 1.50 4,937 ฿ 96,275 60.3 6.0% 6.7% ฿ 114,111 ฿ 212,809 2.84 2.73 6.9x 7.1x 10.6x 10.8x 8.1x 9.5x 10.2x 8.8x
CHINA COAL (1898-HK) HK$ 4.14 HK$ 4.62 11.6% 1.36 4,107 HK$ 80,104 13.1 1.5% 6.2% HK$ 113,026 HK$ 170,025 0.64 0.88 0.85 5.7x 4.1x 4.3x 27.7x 14.9x 14.2x 13.3x 10.8x 11.0x
CHINA SHENHUA (1088-HK) HK$ 16.28 HK$ 18.10 11.2% 1.28 3,399 HK$ 371,277 21.0 2.2% 8.2% HK$ 106,595 HK$ 408,529 2.72 2.95 2.97 5.3x 4.9x 4.8x 11.2x 10.0x 10.0x 5.6x 5.2x 5.3x
COAL OF (CZA-AU) A$ 0.05 A$ 0.08 63.6% 2,216 A$ 111 0.0 0.0% 9.8% A$ 0 A$ 66
NINE ENTERTAINMENT (NEC-AU) A$ 1.04 A$ 1.12 7.8% 1.03 871 A$ 902 2.8 3.4% 8.5% A$ 220 A$ 1,079 0.10 0.17 0.14 10.0x 6.2x 7.6x 8.9x 8.9x 9.7x 6.0x 6.1x 6.9x
YANZHOU COAL (1171-HK) HK$ 6.22 HK$ 6.26 0.6% 1.54 1,952 HK$ 48,543 14.0 3.8% 6.7% HK$ 69,480 HK$ 90,809 1.19 1.73 1.62 4.6x 3.2x 3.4x 16.6x 8.4x 10.1x 12.3x 8.3x 9.8x
Group Average - Large Cap Non-North-America Avg. -> 6.1x 5.3x 5.8x 13.4x 10.3x 10.9x 6.4x 7.3x 7.7x
Developer/Explorers
EAST ENERGY (EER-AU) A$ 0.01 356 A$ 2.5 0.0 0.0% 4.0% A$ 23 A$ 25
FORTUNE MINERALS (FT -T) C$ 0.27 0.65 271 C$ 73.1 1.4 7.4% 7.3% C$ 4 C$ 77
JAMESON RESOURCES (JAL-AU) A$ 0.10 0.59 223 A$ 21.2 0.1 0.0% 6.7% A$ 0 A$ 19
Group Average - Developers / Explorers Avg. ->
Sundry Companies
ADARO ENERGY (ADRO-JKSE) ¥ 1,700 ¥ 1,901 11.8% 1.70 31,986 ¥ 54,376,135 30.7 0.3% 11.9% ¥ 1,567 ¥ 5,062 0.02 0.02 0.02 7.5x 6.4x 6.4x 15.9x 11.6x 11.6x 6.7x 5.3x 5.1x
NLC INDIA (NEYVELILIG-NSEI) रू 93.65 रू 110.00 17.5% 0.89 1,678 रू 157,118 0.2 0.0% 9.2% रू 83,844 रू 211,183
SOUTHGOBI RESOURCES (SGQ-T) C$ 0.56 0.82 258 C$ 144 0.0 0.0% 5.3% C$ 109 C$ 226
TAMBANG BATUBARA (PTBA-JKSE) ¥ 11,150 ¥ 14,129 26.7% 1.36 2,304 ¥ 25,691,070 2.6 0.7% 12.9% ¥ 2,022,057 ¥ 25,379,781 700.17 1378.70 1433.08 15.9x 8.1x 7.8x 15.4x 9.4x 9.1x 10.8x 6.8x 6.7x
Group Average - Sundry Companies Avg. -> 8.0x 5.0x 4.8x 10.9x 7.4x 7.1x 20.3x 16.3x 11.6x
All data sourced from Bloomberg
EV/EBITDAP/EPSCFPS (LoC) P/CFPS

The Weekly Dig 2/24/17
Haywood Mining [email protected] Page 28
Senior/Intermediate Gold Producers – EV/oz Comparables
Symbol Market Working EnterpriseGlobal Reserves & Resources Reserves ReservesResources (M&I and Inferred) Global
Au Au AuEq AuEq % Au Au Au AuEq AuEq % Au EV/oz Au Au AuEq AuEq % Au % Au EV/oz EV/oz
Agnico Eagle Mines Limited NYSE:AEM US $10,195 US $807 US $10,763 53.4 1.95 59.6 2.19 89% 19.1 2.37 20.6 2.55 93% US $564 34.3 1.78 39.1 2.03 88% 54% US $202 US $180
AngloGold Ashanti Limited JSE:ANG US $4,833 US $406 US $6,949 208.7 1.23 236.2 1.39 88% 51.9 0.80 55.6 0.86 93% US $134 157.0 1.55 180.9 1.79 87% 32% US $33 US $29
B2Gold Corp. TSX:BTO US $3,234 US $118 US $3,566 23.2 0.75 29.0 0.95 80% 7.5 1.38 7.5 1.38 100% US $478 15.7 0.62 21.6 0.85 73% 47% US $154 US $123
Barrick Gold Corporation TSX:ABX US $22,779 US $3,055 US $30,901 199.0 0.80 319.4 1.29 62% 102.3 1.13 141.2 1.56 72% US $302 96.7 0.61 178.3 1.13 54% 33% US $155 US $97
Compañía de Minas Buenaventura S.A.A. NYSE:BVN US $3,210 US $159 US $3,980 20.2 0.22 89.0 0.96 23% 3.6 0.11 24.7 0.75 15% US $1,107 16.4 0.28 64.1 1.08 26% 35% US $197 US $45
Detour Gold Corporation TSX:DGC US $2,275 US $155 US $2,494 21.4 0.98 21.4 0.98 100% 16.4 0.99 16.4 0.99 100% US $152 5.0 0.96 5.0 0.96 100% 22% US $117 US $117
Eldorado Gold Corporation TSX:ELD US $2,305 US $1,001 US $2,062 37.4 0.76 53.7 1.10 70% 20.6 1.10 28.7 1.53 72% US $100 16.9 0.56 25.0 0.83 67% 59% US $55 US $38
Gold Fields Limited JSE:GFI US $2,726 US $193 US $4,092 111.3 2.09 130.9 2.46 85% 48.0 2.78 49.2 2.85 98% US $85 63.3 1.76 81.8 2.27 77% 44% US $37 US $31
Goldcorp Inc. TSX:G US $14,148 US $791 US $16,775 113.6 0.77 190.5 1.28 60% 42.3 0.71 84.8 1.42 50% US $397 71.2 0.80 105.6 1.19 67% 35% US $148 US $88
Harmony Gold Mining Company Limited JSE:HAR US $1,188 US $232 US $1,210 81.2 1.04 111.5 1.43 73% 23.7 0.66 35.6 1.00 66% US $51 57.5 1.35 75.0 1.77 77% 36% US $15 US $11
IAMGOLD Corporation TSX:IMG US $1,967 US $817 US $1,846 33.4 1.22 33.4 1.22 100% 8.8 1.39 8.8 1.39 100% US $210 24.6 1.17 24.6 1.17 100% 33% US $55 US $55
Kinross Gold Corporation TSX:K US $4,745 US $1,443 US $5,702 67.1 0.70 73.8 0.77 91% 33.2 0.71 37.0 0.79 90% US $172 33.9 0.70 36.9 0.76 92% 15% US $85 US $77
New Gold, Inc. TSX:NGD US $1,537 US $234 US $2,259 23.5 0.76 31.1 1.00 75% 15.0 0.78 18.7 0.97 80% US $151 8.5 0.72 12.4 1.05 68% 22% US $96 US $73
Newmont Mining Corporation NYSE:NEM US $19,164 US $2,927 US $22,120 122.6 0.72 167.9 0.99 73% 71.3 0.82 79.5 0.91 90% US $310 51.3 0.62 88.4 1.07 58% 34% US $180 US $132
Randgold Resources Limited LSE:RRS US $8,962 US $678 US $8,698 27.9 3.31 27.9 3.31 100% 14.8 3.69 14.8 3.69 100% US $590 13.1 2.96 13.1 2.96 100% 51% US $312 US $312
Tahoe Resources Inc. TSX:THO US $2,618 US $168 US $2,529 18.9 0.66 32.0 1.11 59% 4.5 0.48 11.8 1.27 38% US $567 14.4 0.74 20.2 1.04 72% 56% US $134 US $79
Yamana Gold Inc. TSX:YRI US $2,648 US $77 US $4,219 64.5 0.55 120.9 1.03 53% 22.3 0.41 55.3 1.02 40% US $189 42.2 0.67 65.6 1.04 64% 39% US $65 US $35
Group Average - Total # Companies: 17 US $327 US $120 US $90
Equivalency assumptions (US$ / 03-24-16): $1,235/oz Au, $18.00/oz Ag, $1,003/oz Pt, $778/oz Pd, $2.70/lb Cu, $1.27/lb Zn, $1.02/lb Pb, $4.99/lb Ni, $7.77/lb Mo, $20.07/lb Co, $7,950/t Sb, $25.00/lb U3O8, $0.20/lb Sn, $93.00/t HCC, $86.40/t 62% Fe
Source: SNL Financial retrieved on February 24, 2017
Reserves
Alamos Gold Inc. TSX:AGI US $2,402 US $355 US $2,442 21.7 1.20 22.4 1.23 97% 5.9 1.67 5.9 1.67 100% US $415 15.9 1.08 16.5 1.13 96% 30% US $112 US $109
Argonaut Gold Inc. TSX:AR US $285 US $101 US $236 9.3 0.67 9.9 0.71 94% 3.3 0.82 3.3 0.82 100% US $71 6.0 0.61 6.6 0.67 91% 23% US $25 US $24
Centamin Plc LSE:CEY US $2,538 US $509 US $2,133 10.1 1.18 10.1 1.18 100% 4.4 1.08 4.4 1.08 100% US $485 5.7 1.27 5.7 1.27 100% 31% US $211 US $211
China Gold International Resources Corp. Ltd. TSX:CGG US $887 US ($323) US $1,974 12.2 0.18 65.2 0.94 19% 5.4 0.29 24.3 1.32 22% US $368 6.9 0.13 40.8 0.80 17% 51% US $162 US $30
Evolution Mining Limited ASX:EVN US $2,931 US $67 US $3,384 16.2 1.33 16.8 1.39 96% 7.6 1.29 7.7 1.31 98% US $445 8.2 1.38 8.7 1.47 94% 46% US $209 US $201
G-Resources Group Limited SEHK:1051 US $495 US $976 US ($359) - - - - - - - - - - - - - - - - - - -
Nord Gold SE LSE:NORD US $1,267 US $237 US $1,896 31.6 1.02 32.4 1.05 98% 13.6 1.01 13.9 1.03 98% US $140 18.1 1.03 18.5 1.06 98% 43% US $60 US $59
Northern Star Resources Limited ASX:NST US $2,045 US $209 US $1,835 8.5 3.26 21.3 8.21 40% 1.7 5.24 1.7 5.24 100% US $1,050 6.7 3.02 19.6 8.76 34% 58% US $216 US $86
OceanaGold Corporation TSX:OGC US $1,872 US ($52) US $2,134 15.8 1.53 17.2 1.66 92% 5.3 1.47 6.2 1.71 86% US $400 10.5 1.56 11.0 1.63 95% 32% US $135 US $124
Primero Mining Corp. TSX:P US $127 US $1 US $210 6.8 0.84 10.9 1.35 62% 1.8 1.38 2.9 2.29 60% US $120 5.0 0.73 8.0 1.17 62% 27% US $31 US $19
Regis Resources Limited ASX:RRL US $1,367 US $84 US $1,297 8.6 0.96 8.6 0.96 100% 2.1 1.09 2.1 1.09 100% US $610 6.4 0.93 6.4 0.93 100% 25% US $152 US $152
Resolute Mining Limited ASX:RSG US $1,054 US $144 US $977 11.5 1.40 11.5 1.40 100% 5.2 1.50 5.2 1.50 100% US $190 5.9 1.26 5.9 1.26 100% 42% US $85 US $85
SEMAFO Inc. TSX:SMF US $1,096 US $293 US $897 7.6 2.80 7.6 2.80 100% 3.0 3.29 3.0 3.29 100% US $302 4.6 2.56 4.6 2.56 100% 42% US $118 US $118
Group Average - Total # Companies: 12 US $383 US $126 US $101
Equivalency assumptions (US$ / 03-24-16): $1,235/oz Au, $18.00/oz Ag, $1,003/oz Pt, $778/oz Pd, $2.70/lb Cu, $1.27/lb Zn, $1.02/lb Pb, $4.99/lb Ni, $7.77/lb Mo, $20.07/lb Co, $7,950/t Sb, $25.00/lb U3O8, $0.20/lb Sn, $93.00/t HCC, $86.40/t 62% Fe
Source: SNL Financial retrieved on February 24, 2017
% Au
Inferred
Enterprise
Value
(millions)
Company Symbol
Market
Capitalization
(millions)
Working
Capital
(millions)
Global Reserves & Resources Reserves Resources (M&I and Inferred)
Au
(Moz)
Au
(g/t)
AuEq
(Moz)
AuEq
(g/t)% Au
Global
EV/oz
Au% Au
Au
(Moz)
Au
(g/t)
AuEq
(Moz)
AuEq
(g/t)
EV/oz
Au
EV/oz
AuEq
Au
(Moz)
Au
(g/t)
AuEq
(Moz)
AuEq
(g/t)% Au

The Weekly Dig 2/24/17
Haywood Mining [email protected] Page 29
Junior Gold Producers – EV/oz Comparables
Reserves
Alacer Gold Corp. TSX:ASR US $653 US $269 US $591 7.7 0.40 17.9 0.92 43% 3.9 2.04 5.5 2.83 72% US $151 3.8 0.22 12.4 0.71 31% 53% US $76 US $33
Asanko Gold Inc. TSX:AKG US $601 US $55 US $696 9.5 1.68 9.5 1.68 100% 4.7 1.68 4.7 1.68 100% US $147 4.8 1.68 4.8 1.68 100% 48% US $73 US $73
Avesoro Resources Inc. TSX:ASO US $163 US ($29) US $274 2.5 2.48 2.5 2.48 100% 0.8 3.38 0.8 3.38 100% US $329 1.7 2.19 1.7 2.19 100% 68% US $108 US $108
Beadell Resources Limited ASX:BDR US $265 US $28 US $294 3.5 - 18.2 - 19% 1.5 - 1.5 - 100% US $199 2.1 - 16.7 - 12% 68% US $83 US $16
Avnel Gold Mining Limited TSX:AVK US $67 US $5 US $47 2.7 4.11 2.7 4.11 100% 1.6 2.81 1.6 2.81 100% US $30 1.2 11.05 1.2 11.05 100% 21% US $17 US $17
Azumah Resources Limited ASX:AZM US $16 US ($1) US $17 1.9 1.55 1.9 1.55 100% 0.6 2.14 0.6 2.14 100% US $30 1.3 1.38 1.3 1.38 100% 47% US $9 US $9
Banro Corporation TSX:BAA US $43 US ($242) US $337 12.1 1.60 12.1 1.60 100% 3.2 2.03 3.2 2.03 100% US $106 8.9 1.49 8.9 1.49 100% 57% US $28 US $28
Dundee Precious Metals Inc. TSX:DPM US $478 US $33 US $523 11.1 0.43 20.3 0.78 55% 3.0 3.36 4.0 4.54 74% US $175 8.1 0.32 16.2 0.64 50% 51% US $47 US $26
Endeavour Mining Corporation TSX:EDV US $1,912 US $110 US $1,974 15.2 1.59 15.2 1.59 100% 5.5 1.71 5.5 1.71 100% US $357 9.6 1.54 9.6 1.54 100% 49% US $130 US $130
Golden Star Resources Ltd. TSX:GSC US $372 US ($60) US $387 8.6 2.96 8.6 2.96 100% 1.9 2.77 1.9 2.77 100% US $205 6.7 3.02 6.7 3.02 100% 46% US $45 US $45
Goldgroup Mining Inc. TSX:GGA US $15 US $3 US $13 0.5 0.76 0.9 1.48 52% - - - - - - 0.5 0.76 0.9 1.48 52% 41% US $27 US $14
Guyana Goldfields Inc. TSX:GUY US $943 US $111 US $917 8.9 2.95 8.9 2.95 100% 3.0 2.94 3.0 2.94 100% US $302 5.9 2.95 5.9 2.95 100% 36% US $103 US $103
Kirkland Lake Gold LTD. TSX:KL US $1,600 US $66 US $1,541 10.6 5.23 10.6 5.23 100% 2.3 9.51 2.3 9.51 100% US $671 8.3 4.65 8.3 4.65 100% 41% US $145 US $145
Klondex Mines Ltd. TSX:KDX US $997 US $120 US $898 3.5 1.71 3.7 1.79 96% 0.5 8.51 - - - US $1,635 3.0 1.49 - - - 55% US $255 US $244
Mandalay Resources Corporation TSX:MND US $217 US $44 US $209 1.8 0.86 4.3 2.09 41% 0.7 2.30 1.0 3.40 68% US $296 1.0 0.61 3.2 1.86 33% 21% US $119 US $49
Metanor Resources Inc. TSXV:MTO US $23 US ($4) US $28 1.7 1.53 1.7 1.53 100% 0.2 7.37 0.2 7.37 100% US $139 1.5 1.38 1.5 1.38 100% 79% US $16 US $16
Orosur Mining Inc. TSX:OMI US $22 US $7 US $16 1.6 0.68 2.7 1.10 61% 0.1 1.43 0.1 1.43 100% US $130 1.5 0.65 2.5 1.09 59% 5% US $10 US $6
Orvana Minerals Corp. TSX:ORV US $22 US $5 US $28 3.5 2.50 4.3 3.04 82% 0.3 2.82 0.5 3.84 73% US $84 3.2 2.47 3.8 2.97 83% 48% US $8 US $7
Perseus Mining Limited TSX:PRU US $264 US $61 US $229 17.2 1.28 17.2 1.28 100% 6.5 1.50 6.5 1.50 100% US $35 10.7 1.17 10.7 1.17 100% 43% US $13 US $13
Richmont Mines Inc. TSX:RIC US $546 US $47 US $498 4.7 3.59 4.7 3.60 100% 0.6 8.05 0.6 8.05 100% US $797 4.1 3.30 4.1 3.32 100% 59% US $106 US $106
Roxgold Inc. TSXV:ROG US $397 US $26 US $412 1.2 13.55 1.2 13.55 100% 0.7 11.83 0.7 11.83 100% US $603 0.5 16.96 0.5 16.96 100% 91% US $350 US $350
Rubicon Minerals Corporation TSX:RMX US $80 US ($137) US $134 0.4 6.39 0.4 6.39 100% - - - - - - 0.4 6.39 0.4 6.39 100% 74% US $325 US $325
Shanta Gold Ltd. AIM:SHG US $76 US $34 US $104 3.1 3.19 3.1 3.19 100% 0.8 4.95 0.8 4.95 100% US $135 2.3 2.95 2.3 2.95 100% 57% US $33 US $33
Teranga Gold Corporation TSX:TGZ US $410 US $71 US $339 8.5 1.52 8.5 1.52 100% 3.2 1.40 3.2 1.40 100% US $106 5.3 1.61 5.3 1.61 100% 28% US $40 US $40
Timmins Gold Corp. TSX:TMM US $144 US $22 US $128 3.2 0.94 3.3 0.97 97% 0.6 0.50 0.6 0.50 100% US $201 2.6 1.20 2.7 1.25 96% 4% US $40 US $38
Torex Gold Resources Inc TSX:TXG US $1,641 US $125 US $1,951 8.5 2.48 11.7 3.42 73% 3.6 2.62 3.7 2.68 98% US $538 4.9 2.39 8.0 3.91 61% 88% US $229 US $166
Wesdome Gold Mines Ltd. TSX:WDO US $360 US $12 US $350 6.4 1.43 6.4 1.43 100% 0.4 4.63 0.4 4.63 100% US $812 6.0 1.36 6.0 1.36 100% 59% US $55 US $55
Group Average - Total # Companies: 27 US $328 US $92 US $81
Equivalency assumptions (US$ / 03-24-16): $1,235/oz Au, $18.00/oz Ag, $1,003/oz Pt, $778/oz Pd, $2.70/lb Cu, $1.27/lb Zn, $1.02/lb Pb, $4.99/lb Ni, $7.77/lb Mo, $20.07/lb Co, $7,950/t Sb, $25.00/lb U3O8, $0.20/lb Sn, $93.00/t HCC, $86.40/t 62% Fe
Source: SNL Financial retrieved on February 24, 2017
EV/oz
Au
Enterprise
Value
(millions)
Company Symbol
Market
Capitalization
(millions)
Working
Capital
(millions)
Global Reserves & Resources Reserves Resources (M&I and Inferred)
Au
(Moz)
Au
(g/t)
AuEq
(Moz)
AuEq
(g/t)% Au
Global
% AuAu
(Moz)
Au
(g/t)
AuEq
(Moz)
AuEq
(g/t)
EV/oz
Au
EV/oz
AuEq
Au
(Moz)
Au
(g/t)
AuEq
(Moz)
AuEq
(g/t)% Au
% Au
Inferred

The Weekly Dig 2/24/17
Haywood Mining [email protected]
Page 30
Gold Development-Stage Companies (Engineering Study Complete) – EV/oz Comparables
Company Reserves
African Gold Group, Inc. TSXV:AGG US $12 US ($1) US $12 2.0 1.01 2.0 1.01 100% 0.5 1.25 0.5 1.25 100% 1.5 0.96 1.5 0.96 100% 59% US $6 US $6
Almaden Minerals Ltd. TSX:AMM US $99 US $10 US $89 2.0 0.54 3.7 0.99 54% - - - - - 2.0 0.54 3.7 0.99 54% 18% US $45 US $24
Amarillo Gold Corporation TSXV:AGC US $22 US ($1) US $30 2.0 1.30 2.0 1.30 100% - - - - - 2.0 1.30 - - - 29% US $15 US $15
ATAC Resources Ltd. TSXV:ATC US $44 US $12 US $31 0.7 2.35 0.7 2.39 98% - - - - - 0.7 2.35 0.7 2.39 98% 28% US $46 US $45
Barkerville Gold Mines Ltd. TSXV:BGM US $113 US $19 US $87 5.0 2.43 5.1 2.45 99% 0.0 4.82 - - - 5.0 2.42 - - - 41% US $17 US $17
Chaarat Gold Holdings Limited AIM:CGH US $89 US $2 US $87 7.1 2.53 7.2 2.57 98% - - - - - 7.1 2.53 7.2 2.57 98% 15% US $12 US $12
Chalice Gold Mines Limited ASX:CHN US $36 US $47 US ($11) 0.2 4.09 0.2 4.09 100% - - - - - 0.2 4.09 0.2 4.09 100% 83% - -
Chesapeake Gold Corp. TSXV:CKG US $143 US $17 US $127 19.8 0.49 32.1 0.80 62% 18.3 0.52 29.7 0.84 62% 1.5 0.33 2.4 0.52 64% 53% US $6 US $4
Continental Gold Inc. TSX:CNL US $553 US $29 US $521 9.1 9.91 9.7 10.61 93% 3.7 8.41 3.9 8.77 96% 5.4 11.31 5.9 12.33 92% 86% US $57 US $54
Dacian Gold Limited ASX:DCN US $238 US $5 US $231 3.3 - 3.3 - 100% 1.2 - - - - 2.1 - - - - 53% US $69 US $69
Dalradian Resources Inc. TSX:DNA US $240 US $31 US $207 4.4 10.74 4.4 10.74 100% - - - - - 4.4 10.74 4.4 10.74 100% 52% US $47 US $47
Exeter Resource Corporation TSX:XRC US $96 US $14 US $82 25.3 0.49 39.8 0.77 64% 0.0 3.31 0.0 3.31 100% 25.3 0.49 39.8 0.77 64% 7% US $3 US $2
Falco Resources Ltd. TSXV:FPC US $108 US $14 US $91 5.6 1.54 9.7 2.65 58% - - - - - 5.6 1.54 9.7 2.65 58% 19% US $16 US $9
First Mining Finance Corp. TSXV:FF US $435 US $33 US $404 14.0 1.64 14.4 1.69 97% 0.2 1.50 - - - 13.8 1.64 - - - 41% US $29 US $28
Gabriel Resources Ltd. TSX:GBU US $126 US $60 US $120 16.4 - 17.5 - 94% 8.1 - - - - 8.3 - - - - 27% US $7 US $7
Gold Road Resources Limited ASX:GOR US $368 US $67 US $299 3.3 1.11 3.4 1.15 96% 1.8 1.20 1.8 1.20 100% 1.5 1.02 1.7 1.10 93% 62% US $90 US $87
Golden Queen Mining Co. Ltd. TSX:GQM US $74 US ($17) US $165 0.9 0.53 1.1 0.66 80% 0.5 0.66 0.6 0.82 80% 0.4 0.43 0.5 0.54 80% 30% US $185 US $148
Goldquest Mining Corp. TSXV:GQC US $81 US $6 US $74 2.2 2.60 3.4 3.96 66% 0.8 3.72 1.2 5.09 73% 1.4 2.19 2.0 3.29 67% 16% US $34 US $22
Hummingbird Resources PLC AIM:HUM US $114 US $37 US $95 6.4 1.64 6.4 1.64 100% 0.6 3.14 0.6 3.14 100% US $157 5.8 1.57 5.8 1.57 100% 53% US $15 US $15
Integra Gold Corp. TSXV:ICG US $307 US $14 US $263 5.4 6.38 5.4 6.39 100% - - - - - - 5.4 6.38 5.4 6.39 100% 60% US $49 US $49
International Tower Hill Mines Ltd. TSX:ITH US $95 US ($13) US $94 12.6 0.68 12.6 0.68 100% 9.0 0.71 9.0 0.71 100% US $10 3.6 0.60 3.6 0.60 100% 31% US $7 US $7
INV Metals Inc. TSX:INV US $47 US $8 US $38 3.1 - 3.9 - 79% 1.9 - - - - US $21 1.2 - - - - 44% US $12 US $10
K92 Mining Inc. TSXV:KNT US $90 US $14 US $76 1.4 8.09 2.0 11.27 72% - - - - - - 1.4 8.09 - - - 84% US $53 US $38
KEFI Minerals Plc AIM:KEFI US $17 US ($2) US $17 1.9 1.96 1.9 1.96 100% 1.0 2.12 1.0 2.12 100% US $17 0.9 1.82 0.9 1.82 100% 20% US $9 US $9
Lundin Gold Inc. TSX:LUG US $492 US $50 US $437 9.5 - 9.7 - 98% 4.8 - - - - US $91 4.7 - - - - 46% US $46 US $45
Lupaka Gold Corp. TSXV:LPK US $18 US ($1) US $18 2.8 1.17 3.2 1.35 87% - - - - - - 2.8 1.17 3.2 1.35 87% 42% US $7 US $6
Lydian International Limited TSX:LYD US $201 US $154 US $103 5.0 0.69 5.4 0.73 94% 2.4 0.78 2.6 0.83 94% US $43 2.6 0.62 2.8 0.66 94% 77% US $21 US $19
Metals Exploration Plc AIM:MTL US $120 US ($44) US $200 1.7 1.62 2.0 1.89 86% 0.9 1.86 1.0 2.10 89% US $223 0.8 1.43 1.0 1.72 83% 82% US $115 US $99
Midas Gold Corp. TSX:MAX US $121 US $37 US $100 6.5 1.57 7.2 1.73 91% 4.6 1.60 5.1 1.78 90% US $22 2.0 1.49 2.1 1.63 91% 55% US $15 US $14
Moneta Porcupine Mines Inc. TSX:ME US $44 US $5 US $38 4.3 1.17 4.3 1.17 100% - - - - - - 4.3 1.17 4.3 1.17 100% 75% US $9 US $9
NewCastle Gold Ltd. TSX:NCA US $112 US $1 US $120 5.4 0.24 14.2 0.63 38% - - - - - - 5.4 0.24 14.2 0.63 38% 17% US $22 US $8
NovaGold Resources Inc. TSX:NG US $1,870 US $104 US $1,849 28.7 - 44.4 - 65% 19.6 - - - - US $94 9.1 - - - - 58% US $64 US $42
Orca Gold Inc. TSXV:ORG US $34 US $8 US $14 1.6 1.88 1.9 2.26 83% - - - - - - 1.6 1.88 1.9 2.26 83% 24% US $9 US $8
Orezone Gold Corporation TSXV:ORE US $75 US $24 US $51 4.5 0.77 4.5 0.77 100% - - - - - - 4.5 0.77 4.5 0.77 100% 15% US $11 US $11
Pershimco Resources Inc. TSXV:PRO US $56 US ($13) US $68 0.8 0.69 1.0 0.87 79% 0.5 0.77 0.5 0.83 93% US $140 0.1 7.46 0.1 7.46 100% 12% US $85 US $67
Pilot Gold Inc. TSX:PLG US $69 US $4 US $88 2.0 0.36 4.4 0.78 47% - - - - - - 2.0 0.36 4.4 0.78 47% 35% US $44 US $20
Premier Gold Mines Limited TSX:PG US $449 US $65 US $457 7.2 1.74 7.3 1.77 98% 2.9 1.20 2.9 1.22 98% US $159 4.3 2.49 4.4 2.55 98% 54% US $64 US $63
Pretium Resources Inc. TSX:PVG US $1,953 US $117 US $2,184 49.0 0.68 63.3 0.88 77% 7.5 14.14 7.9 14.98 94% US $291 41.5 0.58 55.4 0.78 75% 31% US $45 US $35
Red Eagle Mining Corporation TSX:R US $168 US $2 US $215 0.6 3.35 0.6 3.35 100% 0.4 5.19 0.4 5.19 100% US $532 0.2 1.98 0.2 1.98 100% 64% US $352 US $352
RTG Mining Inc. TSX:RTG US $27 US $14 US $13 0.6 1.66 1.3 3.74 44% 0.3 2.04 0.8 5.09 40% US $40 0.3 1.35 0.5 2.64 51% 84% US $22 US $10
Sabina Gold & Silver Corp. TSX:SBB US $227 US $32 US $195 7.2 6.21 7.2 6.21 100% 2.5 6.30 2.5 6.30 100% US $78 4.7 6.16 4.7 6.16 100% 40% US $27 US $27
Sandspring Resources Ltd. TSXV:SSP US $51 US $5 US $46 10.0 0.84 11.3 0.95 88% 4.1 1.00 4.6 1.12 90% US $11 5.9 0.75 6.6 0.85 88% 53% US $5 US $4
Seabridge Gold Inc. TSX:SEA US $613 US $10 US $597 109.8 0.48 221.8 0.96 50% 45.3 0.61 71.4 0.97 63% US $13 64.6 0.41 150.4 0.96 43% 76% US $5 US $3
Sihayo Gold Limited ASX:SIH US $18 US ($4) US $15 1.1 2.60 1.1 2.60 100% 0.4 2.41 0.4 2.41 100% US $37 0.7 2.73 0.7 2.73 100% 43% US $14 US $14
Sulliden Mining Capital Inc. TSX:SMC US $9 US $13 US ($4) 1.4 - 1.6 - 88% - - - - - - 1.4 - - - - 26% - -
Terraco Gold Corp. TSXV:TEN US $17 US $2 US $22 1.0 0.70 1.0 0.70 100% - - - - - - 1.0 0.70 1.0 0.70 100% 8% US $21 US $21
Vast Resources plc AIM:VAST US $29 US ($0) US $42 2.4 1.53 2.9 1.89 81% 0.6 1.83 1.0 3.26 56% US $73 1.8 1.45 1.9 1.54 94% 75% US $18 US $14
Victoria Gold Corp. TSXV:VIT US $223 US $42 US $175 4.5 0.65 4.6 0.66 99% 2.7 0.67 2.7 0.67 100% US $66 1.9 0.62 1.9 0.63 97% 30% US $39 US $38
Group Average - Total # Companies: 48 US $106 US $41 US $36
Group Average - 0 - 20 million ounces # Companies: 44 US $40 US $36
Group Average - 20 - 50 million ounces # Companies: 3 US $37 US $16
Group Average - +50 million ounces # Companies: 1 US $5 US $19
Equivalency assumptions (US$ / 03-24-16): $1,235/oz Au, $18.00/oz Ag, $1,003/oz Pt, $778/oz Pd, $2.70/lb Cu, $1.27/lb Zn, $1.02/lb Pb, $4.99/lb Ni, $7.77/lb Mo, $20.07/lb Co, $7,950/t Sb, $25.00/lb U3O8, $0.20/lb Sn, $93.00/t HCC, $86.40/t 62% Fe
Source: SNL Financial retrieved on February 24, 2017
Symbol
Market
Capitalization
(millions)
Working
Capital
(millions)
Enterprise
Value
(millions)
Global Reserves & ResourcesAu
(Moz)
Au
(g/t)
AuEq
(Moz)
AuEq
(g/t)% Au
AuEq
(Moz)
AuEq
(g/t)
% Au
Inferre% Au
AuEq
(g/t)
EV/oz
Au
ReservesAu
(Moz)
Au
(g/t)
GlobalEV/oz
Au
EV/oz
AuEq
Resources (M&I and Inferred)Au
(Moz)
Au
(g/t)
AuEq
(Moz)% Au
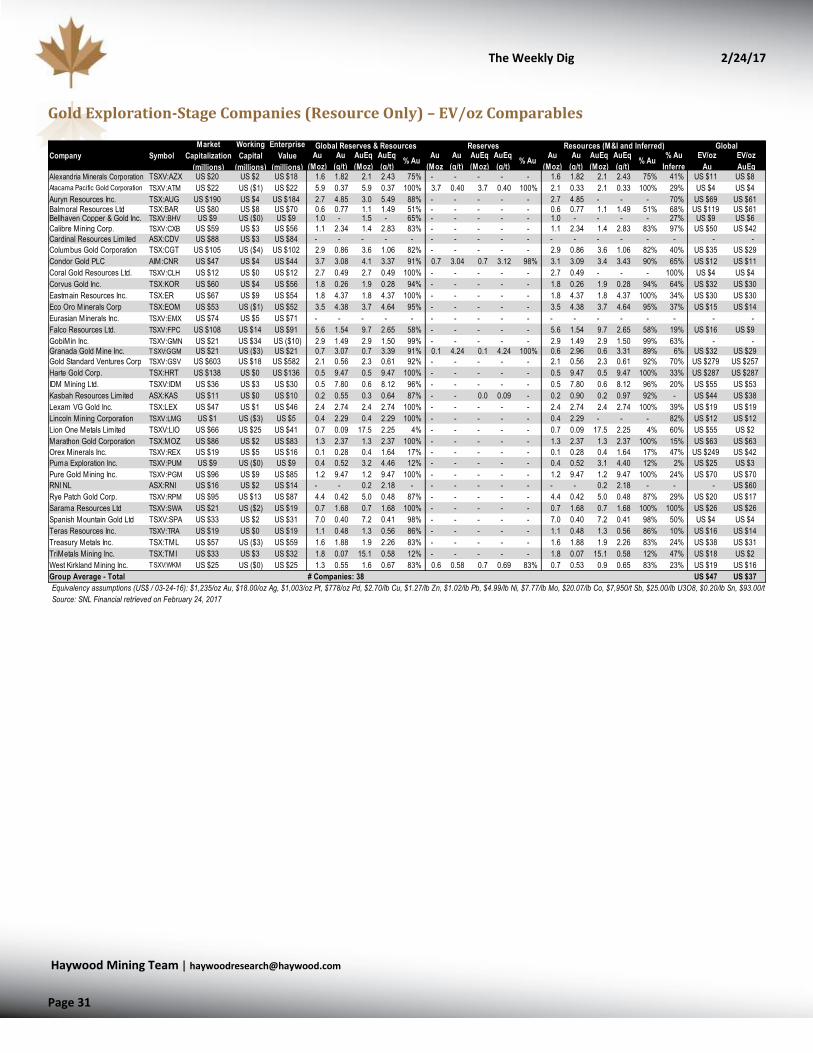
The Weekly Dig 2/24/17
Haywood Mining [email protected]
Page 31
Gold Exploration-Stage Companies (Resource Only) – EV/oz Comparables
Alexandria Minerals Corporation TSXV:AZX US $20 US $2 US $18 1.6 1.82 2.1 2.43 75% - - - - - 1.6 1.82 2.1 2.43 75% 41% US $11 US $8
Atacama Pacific Gold Corporation TSXV:ATM US $22 US ($1) US $22 5.9 0.37 5.9 0.37 100% 3.7 0.40 3.7 0.40 100% 2.1 0.33 2.1 0.33 100% 29% US $4 US $4
Auryn Resources Inc. TSX:AUG US $190 US $4 US $184 2.7 4.85 3.0 5.49 88% - - - - - 2.7 4.85 - - - 70% US $69 US $61
Balmoral Resources Ltd TSX:BAR US $80 US $8 US $70 0.6 0.77 1.1 1.49 51% - - - - - 0.6 0.77 1.1 1.49 51% 68% US $119 US $61Bellhaven Copper & Gold Inc. TSXV:BHV US $9 US ($0) US $9 1.0 - 1.5 - 65% - - - - - 1.0 - - - - 27% US $9 US $6
Calibre Mining Corp. TSXV:CXB US $59 US $3 US $56 1.1 2.34 1.4 2.83 83% - - - - - 1.1 2.34 1.4 2.83 83% 97% US $50 US $42
Cardinal Resources Limited ASX:CDV US $88 US $3 US $84 - - - - - - - - - - - - - - - - - -
Columbus Gold Corporation TSX:CGT US $105 US ($4) US $102 2.9 0.86 3.6 1.06 82% - - - - - 2.9 0.86 3.6 1.06 82% 40% US $35 US $29
Condor Gold PLC AIM:CNR US $47 US $4 US $44 3.7 3.08 4.1 3.37 91% 0.7 3.04 0.7 3.12 98% 3.1 3.09 3.4 3.43 90% 65% US $12 US $11
Coral Gold Resources Ltd. TSXV:CLH US $12 US $0 US $12 2.7 0.49 2.7 0.49 100% - - - - - 2.7 0.49 - - - 100% US $4 US $4
Corvus Gold Inc. TSX:KOR US $60 US $4 US $56 1.8 0.26 1.9 0.28 94% - - - - - 1.8 0.26 1.9 0.28 94% 64% US $32 US $30
Eastmain Resources Inc. TSX:ER US $67 US $9 US $54 1.8 4.37 1.8 4.37 100% - - - - - 1.8 4.37 1.8 4.37 100% 34% US $30 US $30
Eco Oro Minerals Corp TSX:EOM US $53 US ($1) US $52 3.5 4.38 3.7 4.64 95% - - - - - 3.5 4.38 3.7 4.64 95% 37% US $15 US $14
Eurasian Minerals Inc. TSXV:EMX US $74 US $5 US $71 - - - - - - - - - - - - - - - - - -
Falco Resources Ltd. TSXV:FPC US $108 US $14 US $91 5.6 1.54 9.7 2.65 58% - - - - - 5.6 1.54 9.7 2.65 58% 19% US $16 US $9
GobiMin Inc. TSXV:GMN US $21 US $34 US ($10) 2.9 1.49 2.9 1.50 99% - - - - - 2.9 1.49 2.9 1.50 99% 63% - -
Granada Gold Mine Inc. TSXV:GGM US $21 US ($3) US $21 0.7 3.07 0.7 3.39 91% 0.1 4.24 0.1 4.24 100% 0.6 2.96 0.6 3.31 89% 6% US $32 US $29
Gold Standard Ventures Corp TSXV:GSV US $603 US $18 US $582 2.1 0.56 2.3 0.61 92% - - - - - 2.1 0.56 2.3 0.61 92% 70% US $279 US $257
Harte Gold Corp. TSX:HRT US $138 US $0 US $136 0.5 9.47 0.5 9.47 100% - - - - - 0.5 9.47 0.5 9.47 100% 33% US $287 US $287
IDM Mining Ltd. TSXV:IDM US $36 US $3 US $30 0.5 7.80 0.6 8.12 96% - - - - - 0.5 7.80 0.6 8.12 96% 20% US $55 US $53
Kasbah Resources Limited ASX:KAS US $11 US $0 US $10 0.2 0.55 0.3 0.64 87% - - 0.0 0.09 - 0.2 0.90 0.2 0.97 92% - US $44 US $38
Lexam VG Gold Inc. TSX:LEX US $47 US $1 US $46 2.4 2.74 2.4 2.74 100% - - - - - 2.4 2.74 2.4 2.74 100% 39% US $19 US $19
Lincoln Mining Corporation TSXV:LMG US $1 US ($3) US $5 0.4 2.29 0.4 2.29 100% - - - - - 0.4 2.29 - - - 82% US $12 US $12
Lion One Metals Limited TSXV:LIO US $66 US $25 US $41 0.7 0.09 17.5 2.25 4% - - - - - 0.7 0.09 17.5 2.25 4% 60% US $55 US $2
Marathon Gold Corporation TSX:MOZ US $86 US $2 US $83 1.3 2.37 1.3 2.37 100% - - - - - 1.3 2.37 1.3 2.37 100% 15% US $63 US $63
Orex Minerals Inc. TSXV:REX US $19 US $5 US $16 0.1 0.28 0.4 1.64 17% - - - - - 0.1 0.28 0.4 1.64 17% 47% US $249 US $42
Puma Exploration Inc. TSXV:PUM US $9 US ($0) US $9 0.4 0.52 3.2 4.46 12% - - - - - 0.4 0.52 3.1 4.40 12% 2% US $25 US $3
Pure Gold Mining Inc. TSXV:PGM US $96 US $9 US $85 1.2 9.47 1.2 9.47 100% - - - - - 1.2 9.47 1.2 9.47 100% 24% US $70 US $70
RNI NL ASX:RNI US $16 US $2 US $14 - - 0.2 2.18 - - - - - - - - 0.2 2.18 - - - US $60
Rye Patch Gold Corp. TSXV:RPM US $95 US $13 US $87 4.4 0.42 5.0 0.48 87% - - - - - 4.4 0.42 5.0 0.48 87% 29% US $20 US $17
Sarama Resources Ltd TSXV:SWA US $21 US ($2) US $19 0.7 1.68 0.7 1.68 100% - - - - - 0.7 1.68 0.7 1.68 100% 100% US $26 US $26
Spanish Mountain Gold Ltd TSXV:SPA US $33 US $2 US $31 7.0 0.40 7.2 0.41 98% - - - - - 7.0 0.40 7.2 0.41 98% 50% US $4 US $4
Teras Resources Inc. TSXV:TRA US $19 US $0 US $19 1.1 0.48 1.3 0.56 86% - - - - - 1.1 0.48 1.3 0.56 86% 10% US $16 US $14
Treasury Metals Inc. TSX:TML US $57 US ($3) US $59 1.6 1.88 1.9 2.26 83% - - - - - 1.6 1.88 1.9 2.26 83% 24% US $38 US $31
TriMetals Mining Inc. TSX:TMI US $33 US $3 US $32 1.8 0.07 15.1 0.58 12% - - - - - 1.8 0.07 15.1 0.58 12% 47% US $18 US $2
West Kirkland Mining Inc. TSXV:WKM US $25 US ($0) US $25 1.3 0.55 1.6 0.67 83% 0.6 0.58 0.7 0.69 83% 0.7 0.53 0.9 0.65 83% 23% US $19 US $16
Group Average - Total # Companies: 38 US $47 US $37
Equivalency assumptions (US$ / 03-24-16): $1,235/oz Au, $18.00/oz Ag, $1,003/oz Pt, $778/oz Pd, $2.70/lb Cu, $1.27/lb Zn, $1.02/lb Pb, $4.99/lb Ni, $7.77/lb Mo, $20.07/lb Co, $7,950/t Sb, $25.00/lb U3O8, $0.20/lb Sn, $93.00/t HCC, $86.40/t 62% Fe
Source: SNL Financial retrieved on February 24, 2017
EV/oz
Au
EV/oz
AuEq
Au
(Moz)
Au
(g/t)
AuEq
(Moz)
AuEq
(g/t)% Au
Global
% Au% AuAu
(Moz)
Au
(g/t)
AuEq
(Moz)
Global Reserves & Resources Reserves Resources (M&I and Inferred)Au
(Moz
Au
(g/t)
AuEq
(Moz)
AuEq
(g/t)
AuEq
(g/t)
% Au
Inferre
Company Symbol
Market
Capitalization
(millions)
Working
Capital
(millions)
Enterprise
Value
(millions)

The Weekly Dig 2/24/17
Haywood Mining [email protected] Page 32
Silver – EV/oz Comparables
Reserves
Alexco Resource Corp. TSX:AXR US $169 US $19 US $150 67 319 124 586 54% - - - - - - 67 319 124 586 54% 18% US $2.23 US $1.21
Americas Silver Corporation TSX:USA US $141 US $28 US $122 109 150 225 311 48% 31 185 - - - US $3.93 78 140 - - - 35% US $1.12 US $0.54
Athena Silver Corp OTCPK:AHNR US $3 US ($2) US $5 43 67 43 67 100% - - - - - - 43 67 43 67 100% - US $0.12 US $0.12
Bear Creek Mining Corporation TSXV:BCM US $232 US $33 US $198 523 41 1,093 85 48% 291 52 623 111 47% US $0.68 232 32 471 65 49% 33% US $0.38 US $0.18
Defiance Silver Corp. TSXV:DEF US $27 US $1 US $27 17 182 18 191 95% - - - - - - 17 182 18 191 95% 100% US $1.57 US $1.50
Dolly Varden Silver Corporation TSXV:DV US $19 US $3 US $17 43 333 43 333 100% - - - - - - 43 333 43 333 100% 25% US $0.39 US $0.39
Golden Arrow Resources Corporation TSXV:GRG US $49 US $7 US $42 58 83 102 145 57% 6 145 7 166 87% US $6.97 52 79 95 144 55% 25% US $0.73 US $0.42
Golden Minerals Company AMEX:AUMN US $58 US $4 US $54 113 41 286 103 40% - - - - - - 113 41 286 103 40% 58% US $0.48 US $0.19
Iberian Minerals Ltd. TSXV:IML US $21 US $0 US $20 22 9 414 164 5% - - - - - - 22 9 414 164 5% - US $0.90 US $0.05
Investigator Resources Limited ASX:IVR US $20 US $1 US $19 33 117 33 117 100% - - - - - - 33 117 33 117 100% 100% US $0.58 US $0.58
Kootenay Silver Inc TSXV:KTN US $42 US $6 US $36 76 62 118 96 65% - - - - - - 76 62 118 96 65% 19% US $0.48 US $0.31
MacPhersons Resources Limited ASX:MRP US $59 US $10 US $56 20 28 65 89 31% 8 44 25 134 33% US $6.74 12 22 40 73 30% 29% US $2.76 US $0.86
MAG Silver Corp. TSX:MAG US $1,253 US $141 US $1,112 152 65 525 225 29% - - - - - - 152 65 525 225 29% 59% US $7.32 US $2.12
Minco Silver Corporation TSX:MSV US $66 US $40 US $35 162 158 252 246 64% 50 189 62 234 81% US $0.71 112 148 190 250 59% 52% US $0.22 US $0.14
Silver Bear Resources Inc. TSX:SBR US $56 US $3 US $104 56 723 57 729 99% 23 852 23 852 100% US $4.62 34 - 34 - 99% 67% US $1.85 US $1.83
Silver Bull Resources, Inc. OTCPK:SVBL US $20 US $1 US $19 91 48 456 240 20% - - - - - - 91 48 456 240 20% 0% US $0.21 US $0.04
Silver Predator Corp. TSXV:SPD US $7 US $1 US $11 21 67 21 67 100% - - - - - - 21 67 21 67 100% 19% US $0.53 US $0.53
Silver Range Resources Ltd. TSXV:SNG US $9 US $1 US $8 2 9 76 401 2% - - - - - - 2 9 76 401 2% - US $4.75 US $0.11
T inka Resources Limited TSXV:TK US $53 US $1 US $52 39 31 223 173 18% - - - - - - 39 31 223 173 18% 64% US $1.32 US $0.23
Group Average - Total # Companies: 19 US $3.94 US $1.47 US $0.60
Equivalency assumptions (US$ / 03-24-16): $1,235/oz Au, $18.00/oz Ag, $1,003/oz Pt, $778/oz Pd, $2.70/lb Cu, $1.27/lb Zn, $1.02/lb Pb, $4.99/lb Ni, $7.77/lb Mo, $20.07/lb Co, $7,950/t Sb, $25.00/lb U3O8, $0.20/lb Sn, $93.00/t HCC, $86.40/t 62% Fe
Source: SNL Financial retrieved on February 24, 2017
EV/oz
Ag
EV/oz
AgEq
Ag
(Moz)
Ag
(g/t)
AgEq
(Moz)
AgEq
(g/t)% Ag
Global
% Ag% AgAg
(Moz)
Ag
(g/t)
AgEq
(Moz)
Global Reserves & Resources Reserves Resources (M&I and Inferred)
Ag
(Moz)
Ag
(g/t)
AgEq
(Moz)
AgEq
(g/t)
AgEq
(g/t)
% Ag
Inferred
EV/oz
Ag
Company Symbol
Market
Capitalization
(millions)
Working
Capital
(millions)
Enterprise
Value
(millions)

The Weekly Dig 2/24/17
Haywood Mining [email protected] Page 33
Copper Non-Producers – EV/lb Comparables
Shares Market Working LTD Enterprise Copper
Company Symbol Price O/S Capitalization Capital Value Value Ratio*** Reserve (P&P) Resource (Total)
(million) (million) (million) (million) (million) (% Contained) (CuEq** Mlb) (CuEq** Mlb) Reserve Total
AQM Copper Inc. TSXV:AQM C$ 0.23 143.0 US$ 25 US$ 1.4 US$ 0.0 US$ 23 Cu / Au 90% - 2,026 - $0.011
Bellhaven Copper and Gold Inc.TSXV:BHV C$ 0.51 22.0 US$ 9 US$ (0.3) US$ 0.0 US$ 9 Au / Cu 40% - 1,036 - $0.009
Candente Copper Corp. TSX:DNT C$ 0.11 163.7 US$ 14 US$ (1.3) US$ 0.0 US$ 15 Cu / Au 89% - 12,427 - $0.001
Colorado Resources Ltd. TSXV:CXO C$ 0.30 81.0 US$ 18 US$ 2.7 US$ 0.0 US$ 16 Cu / Au 59% - 1,165 - $0.013
Copper Fox Metals Inc TSXV:CUU C$ 0.16 427.8 US$ 51 US$ 1.6 US$ 0.0 US$ 49 Cu / Au 68% 2,375 5,648 $0.021 $0.009
Coro Mining Corp. TSX:COP C$ 0.18 483.4 US$ 65 US$ 0.1 US$ 0.3 US$ 65 Cu / Au 84% 195 965 $0.332 $0.067
Crazy Horse Resources Inc. TSXV:CZH C$ 0.02 48.6 US$ 1 US$ (0.2) US$ 0.0 US$ 1 Cu / Au 80% 2,638 5,794 $0.000 $0.000
Exeter Resource Corporation TSX:XRC C$ 1.42 88.7 US$ 96 US$ 14.2 US$ 0.0 US$ 82 Au / Cu 41% 12,504 22,559 $0.007 $0.004
Foran Mining Corporation TSXV:FOM C$ 0.38 96.9 US$ 28 US$ 0.9 US$ 0.0 US$ 27 Cu / Zn 46% - 1,756 - $0.015
Getty Copper Inc. TSXV:GTC C$ 0.03 108.4 US$ 2 US$ (0.5) US$ 0.0 US$ 3 Cu / Mo 96% 620 969 $0.004 $0.003
Gold Reach Resources Ltd. TSXV:GRV C$ 0.15 47.0 US$ 5 US$ 0.3 US$ 0.0 US$ 5 Cu / Mo 68% - 5,444 - $0.001
Highland Copper Co Inc. TSXV:HI C$ 0.17 208.3 US$ 27 US$ (1.7) US$ 0.3 US$ 29 Cu / Ag 96% 871 6,019 $0.033 $0.005
Indico Resources Ltd. TSXV:IDI C$ 0.02 147.0 US$ 2 US$ 0.1 US$ 0.0 US$ 2 Cu / - 100% - 410 - $0.005
Kiska Metals Corporation TSXV:KSK C$ 0.09 131.4 US$ 9 US$ 5.9 US$ 0.0 US$ 3 Au / Cu 38% - 2,048 - $0.002
Los Andes Copper Limited TSXV:LA C$ 0.19 244.9 US$ 35 US$ (1.3) US$ 0.0 US$ 36 Cu / Mo 89% - 12,305 - $0.003
Nevada Copper Corp. TSX:NCU C$ 0.77 88.2 US$ 52 US$ 4.6 US$ 148.7 US$ 196 Cu / Au 91% 5,791 7,917 $0.034 $0.025
NGEx Resources Inc. TSX:NGQ C$ 1.35 213.5 US$ 220 US$ 8.0 US$ 0.0 US$ 212 Cu / Au 76% - 27,655 - $0.008
Northern Dynasty Minerals Ltd. TSX:NDM C$ 2.19 291.1 US$ 487 US$ 5.5 US$ 0.0 US$ 481 Cu / Au 57% - 142,635 - $0.003
Northisle Copper and Gold Inc. TSXV:NCX C$ 0.16 105.1 US$ 13 US$ 0.3 US$ 0.0 US$ 12 Cu / Au 51% - 4,358 - $0.003
NovaCopper Inc. TSX:TMQ C$ 0.61 0.0 US$ 0 US$ 15.1 US$ 0.0 US$ (15) Cu / Zn 83% - 9,685 - -
Panoro Minerals Ltd. TSXV:PML C$ 0.17 258.1 US$ 34 US$ 4.8 US$ 0.0 US$ 29 Cu / Au 77% - 10,114 - $0.003
Polymet Mining Corp. TSX:POM C$ 1.06 318.4 US$ 258 US$ 22.0 US$ 103.5 US$ 339 Cu / Ni 49% 3,145 10,139 $0.108 $0.033
Quaterra Resources Inc. TSXV:QTA C$ 0.12 193.5 US$ 18 US$ 5.2 US$ 0.0 US$ 12 Cu / Ag 96% - 8,247 - $0.002
Redhawk Resources, Inc. TSX:RDK C$ 0.06 157.7 US$ 7 US$ (1.1) US$ 1.3 US$ 9 Cu / Mo 92% - 3,835 - $0.002
Regulus Resources Inc TSXV:REG C$ 1.60 68.6 US$ 84 US$ 9.4 US$ 0.0 US$ 74 Cu / Au 0% - - - -
Serengeti Resources Inc. TSXV:SIR C$ 0.17 71.5 US$ 9 US$ 0.4 US$ 0.0 US$ 9 Cu / Au 67% - 4,153 - $0.002
St Augustine Gold and Copper LimitedTSX:SAU C$ 0.03 726.8 US$ 17 US$ (0.3) US$ 0.0 US$ 17 Cu / Au 58% 2,131 3,263 $0.008 $0.005
Tintina Resources Inc. TSXV:TAU C$ 0.12 323.5 US$ 28 US$ 3.6 US$ 0.0 US$ 25 Cu / Co 86% - 1,538 - $0.016
Western Copper and Gold CorporationTSX:WRN C$ 1.98 95.0 US$ 144 US$ 5.8 US$ 0.0 US$ 138 Cu / Au 45% 10,033 22,599 $0.014 $0.006
Yellowhead Mining Inc. TSX:YMI C$ 0.08 0.0 US$ 0 US$ 0.4 US$ 0.0 US$ (0) Cu / Au 91% 4,475 8,701 - -
Group Average - Total $0.056 $0.009
*All reserve and resource data sourced from IntierraRMG, additional data sourced from Capital IQ and Market Q.
**CuEq = copper equivalent. Calculated based on Haywood's formal long-term metal price forecasts.
***Copper Ratio = value of in situ copper / total value of in situ metals.
Primary /
Secondary
Metal
Reserves & Resources* - Attributable
EV/lb CuEq** (US$)

The Weekly Dig 2/24/17
Haywood Mining [email protected] Page 34
Nickel Non-Producers – EV/lb Comparables
Zinc Non-Producers – EV/lb Comparables
Shares Market Working LTD Enterprise Nickel
Company Symbol Price O/S Capitalization Capital Value Value Ratio*** Reserve (P&P) Resource (Total)
(million) (million) (million) (million) (million) (% Contained) (NiEq** Mlb) (NiEq** Mlb) Reserve Total
Anfield Nickel Corp. TSXV:ANF C$ 1.08 117.0 US$ 96 US$ 32.4 US$ 0.0 US$ 64 Ni / Co 99% 2,169 3,616 $0.030 $0.018
Asian Mineral Resources LimitedTSXV:ASN C$ 0.02 788.9 US$ 12 US$ 4.7 US$ 0.0 US$ 7 Ni / Cu 86% 85 146 $0.087 $0.051
Canadian Arrow Mines Ltd. TSXV:CRO C$ 0.02 140.0 US$ 2 US$ (0.6) US$ 0.0 US$ 2 Ni / Cu 82% - 141 - $0.015
First Point Minerals Corp. TSXV:FPX C$ 0.11 122.3 US$ 10 US$ 0.2 US$ 5.1 US$ 15 Ni / Cu 182% - 141 - $0.105
Hard Creek Nickel Corporation TSXV:HNC C$ 0.09 43.1 US$ 3 US$ 0.1 US$ 0.0 US$ 3 Ni / Co 91% - 9,161 - $0.000
Mustang Minerals Corp. TSXV:MUM C$ 0.02 256.5 US$ 4 US$ (0.5) US$ 0.0 US$ 4 Co / Ni 38% 2 1,176 $1.857 $0.004
Noront Resources Ltd TSXV:NOT C$ 0.25 306.3 US$ 58 US$ 7.4 US$ 32.8 US$ 84 Ni / Cu 78% 498 851 $0.168 $0.099
North American Nickel Inc. TSXV:NAN C$ 0.09 122.2 US$ 8 US$ 4.0 US$ 0.0 US$ 4 Ni / Cu 0% - - - -
Northern Shield Resources Inc. TSXV:NRN C$ 0.06 205.0 US$ 9 US$ 1.7 US$ 0.0 US$ 7 Ni / Cu 0% - - - -
Poseidon Nickel Limited ASX:POS C$ 0.05 865.0 US$ 31 US$ (0.9) US$ 14.4 US$ 47 Ni / Au 98% 171 1,284 $0.273 $0.036
Royal Nickel Corporation TSX:RNX C$ 0.36 276.2 US$ 76 US$ (13.6) US$ 13.0 US$ 103 Ni / Cu 0% - - - -
Sama Resources Inc. TSXV:SME C$ 0.15 119.0 US$ 14 US$ (0.0) US$ 0.0 US$ 14 Ni / Cu 71% - 195 - $0.070
Strongbow Exploration Inc. TSXV:SBW C$ 0.16 57.9 US$ 7 US$ 0.4 US$ 1.1 US$ 8 Ni / Cu 86% - 417 - $0.019
Talon Metals Corporation TSX:TLO C$ 0.10 129.6 US$ 9 US$ 0.6 US$ 13.6 US$ 22 Ni / Fe 56% - 125 - $0.180
Group Average - Total $0.483 $0.054
*All reserve and resource data sourced from IntierraRMG, additional data sourced from Capital IQ and Market Q.
**NiEq = nickel equivalent. Calculated based on Haywood's formal long-term metal price forecasts.
***Nickel Ratio = value of in situ nickel / total value of in situ metals.
Primary /
Secondary
Metal
Reserves & Resources* - Attributable
EV/lb NiEq** (US$)
Shares Market Working LTD Enterprise Zinc
Company Symbol Price O/S Capitalization Capital Value Value Ratio*** Reserve (P&P) Resource (Total)
(million) (million) (million) (million) (million) (% Contained) (ZnEq** Mlb) (ZnEq** Mlb) Reserve Total
Aquila Resources Inc. TSX:AQA C$ 0.25 271.5 US$ 51 US$ (0.4) US$ 0.0 US$ 51 Au / Zn 19% - 1,587 - $0.032
Canada Zinc Metals Corp. TSXV:CZX C$ 0.36 155.2 US$ 43 US$ 4.6 US$ 0.0 US$ 38 Zn / Pb 82% - 6,096 - $0.006
Canadian Zinc Corporation TSX:CZN C$ 0.26 265.9 US$ 52 US$ 7.0 US$ 0.0 US$ 45 Zn / Pb 40% 2,525 10,077 $0.018 $0.004
El Nino Ventures Inc. TSXV:ELN C$ 0.03 61.6 US$ 1 US$ 0.2 US$ 0.0 US$ 1 Zn / Cu 45% - 1,357 - $0.001
Firestone Ventures Inc. TSXV:FV C$ 0.05 36.8 US$ 1 US$ (0.6) US$ 0.0 US$ 2 Zn / Pb 73% - 454 - $0.004
Foran Mining Corporation TSXV:FOM C$ 0.38 96.9 US$ 28 US$ 0.9 US$ 0.0 US$ 27 Cu / Zn 33% - 4,962 - $0.005
InZinc Mining Ltd. TSXV:IZN C$ 0.25 72.7 US$ 14 US$ 0.4 US$ 0.0 US$ 13 Zn / Cu 77% - 3,873 - $0.003
Rathdowney Resources Ltd. TSXV:RTH C$ 0.30 139.9 US$ 32 US$ (0.6) US$ 0.0 US$ 33 Zn / Pb 80% - 3,437 - $0.009
Wolfden Resources Corp. TSXV:WLF C$ 0.17 81.1 US$ 10 US$ 1.2 US$ 0.0 US$ 9 Au / Zn 29% - 4,516 - $0.002
Group Average - Total $0.018 $0.005*All reserve and resource data sourced from IntierraRMG, additional data sourced from Capital IQ and Market Q.
**ZnEq = Zinc equivalent. Calculated based on Haywood's formal long-term metal price forecasts.
***Zinc Ratio = value of in situ zinc / total value of in situ metals.
Primary /
Secondary
Metal
Reserves & Resources* - Attributable
EV/lb ZnEq** (US$)

The Weekly Dig 2/24/17
Haywood Mining [email protected] Page 35
Dissemination of Research
Research reports are disseminated either through electronic medium or in printed copy. Clients may access reports on our
website, or receive publications directly via email. Haywood strives to ensure all clients receive research in a timely manner and
at the same time. It is against our policy for analysts to discuss or circulate their recommendations internally prior to public
distribution. This policy applies equally to recommendation changes, target changes and/or forecast revisions.
For Canadian residents: Haywood Securities Inc. is a Canadian registered broker-dealer and a member of the Investment
Industry Regulatory Organization of Canada, the Toronto Stock Exchange, the Toronto Venture Exchange and the Canadian
Investor Protection Fund and accepts responsibility for the dissemination of this report. Any Canadian client that wishes further
information on any securities discussed in this report should contact a qualified salesperson of Haywood Securities Inc.
For U.S. residents: This investment research is distributed in the United States, as third party research by Haywood Securities
(USA) Inc. Haywood Securities (USA) Inc. is a wholly owned subsidiary of Haywood Securities Inc., registered with the U.S.
Securities and Exchange Commission, and is a member of FINRA and the Securities Investor Protection Corporation (SIPC).
Haywood Securities (USA) Inc. as a U.S. registered broker-dealer accepts responsibility for this Research Report and its
dissemination in the United States. Any U.S. client that wishes further information on any securities discussed in this report or
wish to effect a transaction in these securities should contact a qualified salesperson of Haywood Securities (USA) Inc. Haywood
Securities Inc. Research Analysts are considered Foreign Research Analysts to the USA and are not registered/qualified as
Research Analysts with FINRA. As these analysts are considered Foreign Research Analysts they may not be specifically subject
to FINRA (formerly NASD) Rule 2711 and FINRA (formerly NYSE) Rule 472 restrictions on communications with a Subject
Company, Public Appearances and trading securities held by a Research Analyst Account.
This report may be distributed in the following states: nil. Otherwise, this report may only be distributed into those states with
an institutional buyer state securities registration exemption.
Analyst Certification
We, Mick Carew, Geordie Mark, Colin Healey, Pierre Vaillancourt, and Kerry Smith, hereby certify that the views expressed in
this report (which includes the rating assigned to the issuer’s shares as well as the analytical substance and tone of the report)
accurately reflect my/our personal views about the subject securities and the issuer. No part of my/our compensation was, is,
or will be directly or indirectly related to the specific recommendations.
Important Disclosures
Of the companies included in the report the following Important Disclosures apply:
Ticker Company 1 2 3 4 5 6 7 8
TSX:AGI Alamos Gold Inc. X X X
TSX:AKG Asanko Gold Inc. X X
TSXV:AGB Atlantic Gold Corp. X X X X
TSXV:AUG Auryn Resources X X X
TSX:BTO B2Gold Corp. X X
TSXV:BGM Barkerville Gold Mines Ltd. X X
TSX:ABX Barrick Gold Corporation X
ASX:CDV Cardinal Resources Ltd.
TSX:DML Denison Mines Corp. X X X
TSX:DGC Detour Gold Corporation X X X

The Weekly Dig 2/24/17
Haywood Mining [email protected] Page 36
TSX:ELD Eldorado Gold Corporation X X
TSX:EDV Endeavour Mining Corp. X X X
TSX:EFR Energy Fuels Inc. X X X
ASX:GOR Gold Road Resources Limited X
TSXV:ICG Integra Gold Corp. X X
TSX:LUC Lucara Diamond Corp. X X
TSX:LUG Lundin Gold Inc. X X
TSX:MOZ Marathon Gold Corp. X X X X
TSX:MAX Midas Gold Corp. X X X X
TSX:MPV Mountain Province Diamonds Inc. X X X
TSX:NXE NexGen Energy Ltd. X X
TSXV:NCA NewCastle Gold Ltd. X X X
TSX:OGC OceanaGold Corporation X
TSX:OR Osisko Gold Royalties Ltd. X
TSX:OSK Osisko Mining Inc. X X
TSX:PLG Pilot Gold Inc. X X
TSX:RIC Richmont Mines Inc. X X
TSXV:ROG Roxgold Inc. X X X
TSX:SBB Sabina Gold and Silver Corp. X X X
TSX:SMF SEMAFO Inc. X X
TSX:THO Tahoe Resources Inc. X
AMEX:UEC Uranium Energy Corp. X X X
TSX:U Uranium Participation Corporation X X
1 The Analyst(s) preparing this report (or a member of the Analysts’ households) have a financial interest in this company.
2 As of the end of the month immediately preceding this publication either Haywood Securities, Inc., one of its subsidiaries, its officers or directors beneficially owned 1% or more of this company.
3 Haywood Securities, Inc. has reviewed lead projects of this company and a portion of the expenses for this travel have been reimbursed by the issuer.
4 Haywood Securities Inc. or one of its subsidiaries has managed or co-managed or participated as selling group in a public offering of securities for this company in the past 12 months.
5 Haywood Securities, Inc. or one of its subsidiaries has received compensation for investment banking services from this company in the past 12 months
6 Haywood Securities, Inc. or one of its subsidiaries has received compensation for investment banking services from this company in the past 24 months
7 Haywood Securities, Inc. or one of its subsidiaries is restricted on this company at the time of publication
8 Haywood Securities, Inc. or one of its subsidiaries expects to receive or intends to seek compensation for investment banking services from this company in the next three months
Other material conflict of interest of the research analyst of which the research analyst or Haywood Securities Inc. knows or has
reason to know at the time of publication or at the time of public appearance:
n/a
Rating Structure
Each company within an analyst’s universe, or group of companies covered, is assigned: (i) a recommendation or rating, usually
BUY, HOLD, or SELL; (ii) a 12 month target price, which represents an analyst’s current assessment of a company’s potential
stock price over the next year; (iii) an overall risk rating which represents an analyst’s assessment of the company’s overall
investment risk; and (iv) specific risk ratings or risk profile parameters which in their aggregate support an analyst’s overall risk
rating. These ratings are more fully explained below. Before acting on our recommendation we caution you to confer with your

The Weekly Dig 2/24/17
Haywood Mining [email protected] Page 37
Haywood investment advisor to determine the suitability of our recommendation for your specific investment objectives, risk
tolerance and investment time horizon.
Recommendation Rating
BUY –The analyst believes that the security will outperform other companies in their sector on a risk adjusted basis or for the
reasons stated in the research report the analyst believes that the security is deserving of a (continued) BUY rating.
HOLD – The analyst believes that the security is expected to perform in line with other companies in their sector on a risk
adjusted basis or for the reasons stated in the research report the analyst believes that the security is deserving of a (continued)
HOLD rating.
SELL – Investors are advised to sell the security or hold alternative securities within the sector. Stocks in this category are
expected to under-perform other companies on a risk adjusted basis or for the reasons stated in the research report the analyst
believes that the security is deserving of a (continued) SELL rating.
TENDER – The analyst is recommending that investors tender to a specific offering for the company’s stock.
RESEARCH COMMENT – An analyst comment about an issuer event that does not include a rating or recommendation.
UNDER REVIEW – Placing a stock Under Review does not revise the current rating or recommendation of the analyst. A stock
will be placed Under Review when the relevant company has a significant material event with further information pending or
to be announced. An analyst will place a stock Under Review while he/she awaits sufficient information to re-evaluate the
company’s financial situation.
COVERAGE DROPPED – Haywood Securities will no longer cover the issuer. Haywood will provide notice to clients whenever
coverage of an issuer is discontinued.
Haywood’s focus is to search for undervalued companies which analysts believe may achieve attractive risk-adjusted returns.
This research coverage on potentially undervalued companies may result in an outweighed percentage of companies rated as
BUY. Management regularly reviews rating and targets in all sectors to ensure fairness and accuracy.
For further information on Haywood Securities’ research dissemination policies, please visit: http://haywood.com/what-we-
offer/research/research-policy
Overall Risk Rating
Very High Risk: Venture type companies or more established micro, small, mid or large cap companies whose risk profile
parameters and/or lack of liquidity warrant such a designation. These companies are only appropriate for investors who have a
very high tolerance for risk and volatility and who are capable of incurring temporary or permanent loss of a very significant
portion of their investment capital.
High Risk: Typically micro or small cap companies which have an above average investment risk relative to more established or
mid to large cap companies. These companies will generally not form part of the broad senior stock market indices and often
will have less liquidity than more established mid and large cap companies. These companies are only appropriate for investors
who have a high tolerance for risk and volatility and who are capable of incurring a temporary or permanent loss of a significant
loss of their investment capital.
Medium-High Risk: Typically mid to large cap companies that have a medium to high investment risk. These companies will
often form part of the broader senior stock market indices or sector specific indices. These companies are only appropriate for
investors who have a medium to high tolerance for risk and volatility and who are prepared to accept general stock market risk
including the risk of a temporary or permanent loss of some of their investment capital.
Moderate Risk: Large to very large cap companies with established earnings who have a track record of lower volatility when
compared against the broad senior stock market indices. These companies are only appropriate for investors who have a
medium tolerance for risk and volatility and who are prepared to accept general stock market risk including the risk of a
temporary or permanent loss of some of their investment capital.

The Weekly Dig 2/24/17
Haywood Mining [email protected] Page 38
Distribution of Ratings (as of February 24, 2017)
IB Clients
% # (TTM)
Buy 76.4% 68 92.6%
Hold 9.0% 8 3.7%
Sell 0.0% 0 0.0%
Tender 1.1% 1 0.0%
UR (Buy) 0.0% 0 0.0%
UR (Hold) 0.0% 0 0.0%
UR (Sell) 0.0% 0 0.0% dropped (TTM) 13.5% 12 3.7%
Price Chart, Rating and Target Price History (as of February 24, 2017)
Alamos Gold Inc. (AGI-T) Date Target(C$) Rating7/11/16 $13.00 Buy7/7/16 $14.75 Buy
5/30/16 $10.25 Buy5/13/16 $9.50 Buy3/28/16 $7.75 Buy1/12/16 $7.00 Buy
11/13/15 $8.00 Buy7/15/15 $9.00 Buy1/27/15 $9.25 Buy
10/23/14 $11.25 Buy4/16/14 $12.00 Buy
0
5
10
15
20
25
Apr14
Jul14
Oct14
Jan15
Apr15
Jul15
Oct15
Jan16
Apr16
Jul16
Oct16
Jan17
Price History (C$) Target/Rating/Coverage Change
Asanko Gold Inc. (AKG-T) Date Target(C$) Rating2/22/17 $5.50 Buy1/25/17 $5.50 Hold7/11/16 $6.50 Buy5/31/16 $5.25 Buy5/3/16 $5.00 Buy4/7/16 $3.50 Buy
3/24/16 $3.25 Hold1/12/16 $3.25 Buy7/15/15 $3.60 Buy1/21/15 $3.20 Buy
10/23/14 $3.35 Buy4/16/14 $3.60 Buy
Initiated Coverage 12/11/13
0
1
2
3
4
5
6
7
Feb14
May14
Aug14
Nov14
Feb15
May15
Aug15
Nov15
Feb16
May16
Aug16
Nov16
Price History (C$) Target/Rating/Coverage Change
Atlantic Gold Corporation (AGB-V) Date Target(C$) Rating1/25/17 $1.30 Buy10/6/16 $1.35 Buy7/11/16 $1.25 Buy5/19/16 $1.10 Buy12/9/15 $1.00 Buy3/1/16 $0.85 Buy
1/12/16 $0.55 Buy12/10/15 $0.50 Buy
Initiated Coverage 12/9/15
0
0.2
0.4
0.6
0.8
1
1.2
1.4
1.6
Jan14
Apr14
Jul14
Oct14
Jan15
Apr15
Jul15
Oct15
Jan16
Apr16
Jul16
Oct16
Price History (C$) Target/Rating/Coverage Change
B2Gold Corp. (BTO-T) Date Target(C$) Rating1/25/17 $5.50 Buy8/5/16 $6.00 Buy8/3/16 $5.00 Buy
7/11/16 $4.50 Buy5/31/16 $2.80 Buy5/13/16 $2.75 Hold3/18/16 $2.10 Hold
11/16/15 $2.10 Buy3/17/15 $2.75 Buy1/27/15 $3.25 Buy
11/17/14 $3.20 Buy10/23/14 $3.45 Buy8/15/14 $3.75 Buy7/9/14 $3.90 Buy
4/16/14 $3.80 Buy3/18/14 $3.75 Buy
Transferred Coverage 09/12/12; Re-Initiated Coverage 02/05/14
0
1
2
3
4
5
6
7
Feb14
May14
Aug14
Nov14
Feb15
May15
Aug15
Nov15
Feb16
May16
Aug16
Nov16
Price History (C$) Target/Rating/Coverage Change
Barrick Gold Corporation (ABX-T) Date Target(C$) Rating2/17/17 $38.50 Buy1/25/17 $33.00 Buy7/11/16 $37.50 Buy5/31/16 $25.25 Buy4/27/16 $25.00 Buy4/18/16 $20.50 Buy2/19/16 $19.50 Buy1/12/16 $14.50 Buy8/7/15 $11.00 Buy
7/15/15 $15.65 Hold4/29/15 $15.75 Hold2/20/15 $15.00 Hold1/27/15 $14.25 Hold
10/23/14 $17.25 Hold7/9/14 $23.50 Hold5/1/14 $23.00 Hold0
5
10
15
20
25
30
35
40
45
Feb14
May14
Aug14
Nov14
Feb15
May15
Aug15
Nov15
Feb16
May16
Aug16
Nov16
Price History (C$) Target/Rating/Coverage Change
Denison Mines Corp. (DML-T) Date Target(C$) Rating5/31/16 $1.80 Buy1/12/16 $1.90 Buy3/25/14 $2.10 Buy
Transferred & Re-initiated Coverage 08/20/12
0
0.5
1
1.5
2
2.5
Feb14
May14
Aug14
Nov14
Feb15
May15
Aug15
Nov15
Feb16
May16
Aug16
Nov16
Price History (C$) Target/Rating/Coverage Change

The Weekly Dig 2/24/17
Haywood Mining [email protected] Page 39
Detour Gold Corporation (DGC-T) Date Target(C$) Rating1/25/17 $32.00 Buy11/3/16 $38.00 Buy7/11/16 $49.00 Buy5/31/16 $32.00 Buy4/15/16 $28.00 Buy3/11/16 $24.00 Buy1/27/16 $19.50 Buy1/12/16 $18.75 Buy7/15/15 $18.50 Buy1/27/15 $14.00 Buy
10/23/14 $13.50 Buy7/31/14 $15.50 Buy7/9/14 $16.50 Buy
4/16/14 $13.75 Buy3/6/14 $12.50 Buy
0
10
20
30
40
50
60
Feb14
May14
Aug14
Nov14
Feb15
May15
Aug15
Nov15
Feb16
May16
Aug16
Nov16
Price History (C$) Target/Rating/Coverage Change
Eldorado Gold Corporation (ELD-T) Date Target(C$) Rating1/25/17 $8.25 Buy7/29/16 $8.75 Buy7/11/16 $9.25 Buy5/31/16 $7.50 Buy5/13/16 $6.75 Buy1/26/16 $4.50 Buy1/12/16 $6.50 Buy7/15/15 $6.75 Buy2/23/15 $7.75 Buy1/27/15 $9.00 Buy
10/23/14 $9.50 Buy7/9/14 $8.50 Hold
4/16/14 $8.00 Hold2/24/14 $7.50 Hold
0
1
2
3
4
5
6
7
8
9
10
Feb14
May14
Aug14
Nov14
Feb15
May15
Aug15
Nov15
Feb16
May16
Aug16
Nov16
Price History (C$) Target/Rating/Coverage Change
Endeavour Mining Corporation (EDV-T) Date Target(C$) Rating1/25/17 $31.00 Buy
10/20/16 $33.00 Buy7/11/16 $33.00 Buy5/31/16 $22.00 Buy4/21/16 $19.75 Buy3/21/16 $14.50 Buy1/18/16 $12.00 Buy12/3/15 $11.00 Buy1/27/15 $13.00 Buy11/5/14 $11.50 Buy
10/23/14 $10.50 Buy8/21/14 $12.50 Buy
Initiated Coverage 08/21/14; 10:1 Prices/Targets adjusted to reflect
Stock Consolidation 12/02/15; Transfer of Coverage 10/20/16
0
5
10
15
20
25
30
35
Feb14
May14
Aug14
Nov14
Feb15
May15
Aug15
Nov15
Feb16
May16
Aug16
Nov16
Price History (C$) Target/Rating/Coverage Change
Energy Fuels Inc. (AMEX:UUUU) Date Target(US$) Rating1/25/17 $4.80 Buy11/4/16 $5.00 Buy5/31/16 $6.00 Buy1/12/16 $7.25 Buy9/30/15 $8.20 Buy7/15/15 $9.41 Buy7/9/14 $11.73 Buy
4/16/14 $12.71 Buy3/31/14 $13.55 Buy
Targets and prices prior to 11/06/13 adjusted for share
consolidation; Transferred & Re-initiated Coverage 08/20/12;
Targets prior to 05/31/16 converted to US$ at spot
0
2
4
6
8
10
12
14
16
Feb14
May14
Aug14
Nov14
Feb15
May15
Aug15
Nov15
Feb16
May16
Aug16
Nov16
Price History (US$) Target/Rating/Coverage Change
Gold Road Resources Limited (GOR-A) Date Target(C$) Rating10/20/16 $1.00 Buy9/13/16 $1.00 Buy
Initiated Coverage 9/13/2016; Transfer of Coverage 10/20/16
0
0.5
1
1.5
2
2.5
3
Jan14
Apr14
Jul14
Oct14
Jan15
Apr15
Jul15
Oct15
Jan16
Apr16
Jul16
Oct16
Price History (C$) Target/Rating/Coverage Change
Integra Gold Corp. (ICG-V) Date Target(C$) Rating1/25/17 $0.90 Buy7/11/16 $0.90 Hold5/31/16 $0.70 Hold1/12/16 $0.60 Buy7/15/15 $0.70 Buy6/23/15 $0.65 Buy
Initiated Coverage 6/23/16
0
0.2
0.4
0.6
0.8
1
Feb14
May14
Aug14
Nov14
Feb15
May15
Aug15
Nov15
Feb16
May16
Aug16
Nov16
Price History (C$) Target/Rating/Coverage Change
Lucara Diamond Corp. (LUC-T) Date Target(C$) Rating1/25/17 $3.50 Buy12/1/16 $3.00 Hold
11/10/16 $3.25 Hold8/8/16 $3.70 Hold8/2/16 $3.90 Hold
6/30/16 $3.90 Buy5/31/16 $4.40 Hold5/4/16 $4.10 Buy
3/15/16 $3.40 Buy1/12/16 $3.15 Buy12/3/15 $2.80 Buy8/13/15 $2.50 Buy4/28/15 $2.80 Buy
Initiated Coverage 04/28/15
0
0.5
1
1.5
2
2.5
3
3.5
4
4.5
5
Jan14
Apr14
Jul14
Oct14
Jan15
Apr15
Jul15
Oct15
Jan16
Apr16
Jul16
Oct16
Price History (C$) Target/Rating/Coverage Change
Lundin Gold Inc. (LUG-T) Date Target(C$) Rating1/25/17 $8.25 Buy7/11/16 $8.75 Buy5/31/16 $7.25 Buy12/8/15 $5.00 Buy
Initiated Coverage: 12/08/15
0
1
2
3
4
5
6
7
8
9
10
Jan14
Apr14
Jul14
Oct14
Jan15
Apr15
Jul15
Oct15
Jan16
Apr16
Jul16
Oct16
Price History (C$) Target/Rating/Coverage Change

The Weekly Dig 2/24/17
Haywood Mining [email protected] Page 40
Marathon Gold Corporation (MOZ-T) Date Target(C$) Rating1/17/17 $1.10 Buy
Initiated Coverage: 1/17/2017
0
0.2
0.4
0.6
0.8
1
1.2
1.4
1.6
1.8
2
Feb14
May14
Aug14
Nov14
Feb15
May15
Aug15
Nov15
Feb16
May16
Aug16
Nov16
Price History (C$) Target/Rating/Coverage Change
Midas Gold Corp. (MAX-T) Date Target(C$) Rating1/25/17 $1.75 Buy7/11/16 $1.90 Buy5/31/16 $0.95 Buy4/21/16 $0.85 Buy3/11/16 $0.65 Buy1/12/16 $0.45 Hold7/15/15 $0.50 Hold1/27/15 $0.80 Buy1/9/15 $0.85 Buy
10/23/14 $1.15 Buy8/21/14 $1.30 Buy7/9/14 $1.40 Buy
Transferred and Re-initiated Coverage 11/05/13
0
0.2
0.4
0.6
0.8
1
1.2
1.4
1.6
1.8
2
Jan14
Apr14
Jul14
Oct14
Jan15
Apr15
Jul15
Oct15
Jan16
Apr16
Jul16
Oct16
Price History (C$) Target/Rating/Coverage Change
Mountain Province Diamonds Inc. (MPVD-T) Date Target(C$) Rating10/17/16 $10.00 Buy3/31/16 $7.60 Buy1/12/16 $8.00 Buy7/15/15 $8.50 Buy2/19/15 $7.40 Buy2/5/15 $7.70 Buy
Initiated Coverage 02/05/15
0
2
4
6
8
10
12
Jan14
Apr14
Jul14
Oct14
Jan15
Apr15
Jul15
Oct15
Jan16
Apr16
Jul16
Oct16
Price History (C$) Target/Rating/Coverage Change
NewCastle Gold Ltd. (NCA-T) Date Target(C$) Rating1/10/17 $1.60 Buy
10/31/16 UR UR7/11/16 $1.20 Buy5/31/16 $0.80 Buy1/12/16 $0.45 Buy9/3/15 $0.30 Buy
7/15/15 $0.60 Buy1/27/15 $0.70 Buy
12/12/14 $0.65 Buy10/23/14 $0.75 Buy
7/9/14 $1.40 Buy4/16/14 $1.35 Buy
Initiated Coverage 11/28/13; Name changed to NewCastle Gold
06/30/15; Transfer of Coverage 10/20/2016
0
0.2
0.4
0.6
0.8
1
1.2
1.4
1.6
1.8
Feb14
May14
Aug14
Nov14
Feb15
May15
Aug15
Nov15
Feb16
May16
Aug16
Nov16
Price History (C$) Target/Rating/Coverage Change
NexGen Energy Ltd. (NXE-T) Date Target(C$) Rating1/25/17 $4.50 Buy4/14/16 $4.00 Buy3/30/16 $3.20 Buy1/12/16 $2.00 Buy11/5/15 $2.10 Buy
Initiated Coverage 11/05/15
0
0.5
1
1.5
2
2.5
3
3.5
4
4.5
5
Jan14
Apr14
Jul14
Oct14
Jan15
Apr15
Jul15
Oct15
Jan16
Apr16
Jul16
Oct16
Price History (C$) Target/Rating/Coverage Change
OceanaGold Corporation (OGC-T) Date Target(C$) Rating1/25/17 $5.75 Buy7/11/16 $6.50 Buy5/31/16 $4.40 Hold4/29/16 $4.35 Hold3/1/16 $3.80 Hold
2/19/16 $4.00 Hold10/2/15 $4.00 Buy7/15/15 $4.10 Buy4/30/15 $3.80 Buy2/20/15 $3.60 Buy1/27/15 $3.20 Buy
10/23/14 $3.30 Buy9/22/14 $3.50 Buy
Initiated Coverage 09/22/14
0
1
2
3
4
5
6
7
Jan14
Apr14
Jul14
Oct14
Jan15
Apr15
Jul15
Oct15
Jan16
Apr16
Jul16
Oct16
Price History (C$) Target/Rating/Coverage Change
Osisko Gold Royalties Ltd. (OR-T) Date Target(C$) Rating1/25/17 $18.25 Buy
10/20/16 $19.00 Buy7/11/16 $20.25 Buy3/2/16 $19.00 Buy
12/16/15 $18.75 Buy
Initiated Coverage 12/16/2015; Transfer of Coverage
10/20/2016
0
5
10
15
20
25
Jun14
Sep14
Dec14
Mar15
Jun15
Sep15
Dec15
Mar16
Jun16
Sep16
Dec16
Price History (C$) Target/Rating/Coverage Change
Osisko Mining Inc. (OSK-T) Date Target(C$) Rating10/20/16 $4.00 Buy7/11/16 $4.00 Buy5/31/16 $3.00 Buy2/4/16 $2.00 Buy
12/10/15 $2.50 Buy
Initiated Coverage 12/10/2016; Transfer of Coverage
10/20/2016
0
1
2
3
4
5
6
7
Apr14
Jul14
Oct14
Jan15
Apr15
Jul15
Oct15
Jan16
Apr16
Jul16
Oct16
Price History (C$) Target/Rating/Coverage Change

The Weekly Dig 2/24/17
Haywood Mining [email protected] Page 41
B: Buy; H: Hold; S: Sell; T: Tender; UR: Under Review
Source: Capital IQ and Haywood Securities
Pilot Gold Inc. (PLG-T) Date Target(C$) Rating10/20/16 $1.00 Buy7/11/16 $1.20 Buy5/31/16 $1.00 Buy1/12/16 $0.70 Buy7/15/15 $1.50 Buy1/29/15 $1.90 Buy1/27/15 $1.60 Buy
10/23/14 $1.70 Buy4/2/14 $2.00 Buy
Initiated Coverage 10/09/12; Transfer of Coverage 10/20/2016
0
0.5
1
1.5
2
2.5
Jan14
Apr14
Jul14
Oct14
Jan15
Apr15
Jul15
Oct15
Jan16
Apr16
Jul16
Oct16
Price History (C$) Target/Rating/Coverage Change
Richmont Mines Inc. (RIC-T) Date Target(C$) Rating1/25/17 $14.00 Buy7/11/16 $20.00 Buy5/31/16 $15.75 Buy5/13/16 $12.25 Buy4/13/16 $10.00 Buy3/7/16 $8.00 Buy
Initiated Coverage: 3/7/16
0
5
10
15
20
25
Feb14
May14
Aug14
Nov14
Feb15
May15
Aug15
Nov15
Feb16
May16
Aug16
Nov16
Price History (C$) Target/Rating/Coverage Change
Roxgold Inc. (ROG-V) Date Target(C$) Rating1/25/17 $2.00 Buy
10/20/16 $2.10 Buy7/11/16 $2.15 Buy5/31/16 $1.60 Buy4/28/16 $1.50 Buy7/15/15 $1.10 Buy11/5/14 $1.00 Buy7/9/14 $1.25 Buy
4/23/14 $1.15 Buy
Initiated Coverage 01/27/14; Transfer of Coverage 10/20/2016
0
0.5
1
1.5
2
2.5
Feb14
May14
Aug14
Nov14
Feb15
May15
Aug15
Nov15
Feb16
May16
Aug16
Nov16
Price History (C$) Target/Rating/Coverage Change
Sabina Gold & Silver Corp. (SBB-T) Date Target(C$) Rating1/25/17 $1.70 Buy6/16/16 UR UR (Buy)5/31/16 $1.65 Buy1/12/16 $1.00 Buy
12/15/15 $0.90 Buy
Initiated Coverage 12-15-15
0
0.2
0.4
0.6
0.8
1
1.2
1.4
1.6
1.8
2
Jan14
Apr14
Jul14
Oct14
Jan15
Apr15
Jul15
Oct15
Jan16
Apr16
Jul16
Oct16
Price History (C$) Target/Rating/Coverage ChangeThis Company is Restricted
SEMAFO Inc. (SMF-T) Date Target(C$) Rating1/25/17 $7.00 Buy
11/10/16 $7.50 Buy7/11/16 $8.25 Buy5/12/16 $6.50 Buy2/26/16 $6.00 Buy7/15/15 $5.00 Buy1/27/15 $5.75 Buy
10/23/14 $6.25 Buy7/9/14 $6.50 Buy
4/16/14 $5.50 Buy3/13/14 $5.25 Buy
0
1
2
3
4
5
6
7
8
9
Feb14
May14
Aug14
Nov14
Feb15
May15
Aug15
Nov15
Feb16
May16
Aug16
Nov16
Price History (C$) Target/Rating/Coverage Change
Tahoe Resources Inc. (THO-T) Date Target(C$) Rating1/25/17 $14.00 Hold11/4/16 $25.00 Buy8/11/16 $28.00 Buy7/11/16 $25.00 Buy5/9/16 $20.00 Buy
7/15/15 $16.50 Buy4/29/15 $19.25 Buy4/2/15 $16.00 Hold
1/27/15 $14.50 Sell12/5/14 $12.75 Sell11/7/14 $15.00 Sell
10/23/14 $17.25 Sell7/9/14 $18.75 Sell
5/12/14 $17.00 Sell
Initiated Coverage 11/05/13
0
5
10
15
20
25
30
35
Jan14
Apr14
Jul14
Oct14
Jan15
Apr15
Jul15
Oct15
Jan16
Apr16
Jul16
Oct16
Price History (C$) Target/Rating/Coverage Change
Uranium Participation Corporation (U-T) Date Target(C$) Rating1/25/17 $5.10 Buy
12/19/16 $5.80 Buy1/12/16 $6.80 Buy7/15/15 $6.50 Buy1/27/15 $6.20 Buy
10/23/14 $5.80 Buy7/9/14 $5.70 Buy
4/16/14 $6.60 Buy
Transferred & Re-initiated Coverage 08/20/12
0
1
2
3
4
5
6
7
8
Jan14
Apr14
Jul14
Oct14
Jan15
Apr15
Jul15
Oct15
Jan16
Apr16
Jul16
Oct16
Price History (C$) Target/Rating/Coverage Change
Uranium Energy Corp. (UEC-AMEX) Date Target(US$) Rating2/3/17 $2.40 Buy
1/25/17 $2.00 Buy5/31/16 $1.80 Buy7/15/15 $2.00 Buy6/24/15 $2.10 Hold7/8/14 $1.70 Hold
4/16/14 $2.00 Hold
Transferred & Re-initiated Coverage 08/20/12
0
0.5
1
1.5
2
2.5
3
3.5
Feb14
May14
Aug14
Nov14
Feb15
May15
Aug15
Nov15
Feb16
May16
Aug16
Nov16
Price History (US$) Target/Rating/Coverage Change