Embed Size (px)
Citation preview
7/28/2019 The Wealth Effects of the 2010-2011 Arab Uprisings: A Market Model Event Study
http://slidepdf.com/reader/full/the-wealth-effects-of-the-2010-2011-arab-uprisings-a-market-model-event-study 1/50
CLAREMONT McKENNA COLLEGE
THE WEALTH EFFECTS OF THE 2010-2011 ARAB UPRISINGS: A MARKET MODEL
EVENT STUDY
SUBMITTED TO
PROFESSOR JANET SMITH
AND
DEAN GREGORY HESS
BY
RACHIT KHAITAN
FOR
SENIOR THESIS
FALL 2012
DECEMBER 3, 2012

7/28/2019 The Wealth Effects of the 2010-2011 Arab Uprisings: A Market Model Event Study
http://slidepdf.com/reader/full/the-wealth-effects-of-the-2010-2011-arab-uprisings-a-market-model-event-study 2/50
Acknowledgements
I am grateful to Professor Janet Smith for motivating me to examine this topic and for
constantly guiding me through the process. I am also thankful for the inspiration and support
provided by my friends and family.

7/28/2019 The Wealth Effects of the 2010-2011 Arab Uprisings: A Market Model Event Study
http://slidepdf.com/reader/full/the-wealth-effects-of-the-2010-2011-arab-uprisings-a-market-model-event-study 3/50
Abstract
Previous empirical analyses have concluded that political events can have significant
linkages with stock returns. Using Brown & Warner’s (1984) OLS market model, I examine the
effect of political disruptions in the 2010-2011 Arab uprisings on major stock indices of Egypt,
Tunisia, Jordan, Lebanon, Saudi Arabia, Dubai and London. My analysis finds mostly negative
abnormal returns, highly statistically significant relative to the S&P 500, associated with many
key events between December 1st, 2010 and December 1st, 2011. My findings suggest that the
loss of investor wealth can be attributed to dramatic regime changes and large scale protests
during that time period.
7/28/2019 The Wealth Effects of the 2010-2011 Arab Uprisings: A Market Model Event Study
http://slidepdf.com/reader/full/the-wealth-effects-of-the-2010-2011-arab-uprisings-a-market-model-event-study 4/50
Contents
I. Overview................................................................................................................................. 3 A. An Overview of Key Events ............................................................................................ 3 B. Political and Economic Context ....................................................................................... 5
II. Literature Review ....................................................................................................................... 7 A. Economic News and Stock Markets................................................................................. 7 B. Political News and Stock Markets ................................................................................... 8 C. Emerging Markets ............................................................................................................ 9 D. Motivation ....................................................................................................................... 11
III. Methodology and Empirical Analysis..................................................................................... 12 A. Dataset............................................................................................................................ 12 B. Daily Returns.................................................................................................................. 13
C. Descriptive Statistics ...................................................................................................... 13 D. OLS Market Model Regression Methodology ............................................................... 14
IV. Results ..................................................................................................................................... 16 V. Conclusion ................................................................................................................................ 20 Charts & Tables............................................................................................................................. 22 References..................................................................................................................................... 41 Appendix....................................................................................................................................... 43
7/28/2019 The Wealth Effects of the 2010-2011 Arab Uprisings: A Market Model Event Study
http://slidepdf.com/reader/full/the-wealth-effects-of-the-2010-2011-arab-uprisings-a-market-model-event-study 5/50
1
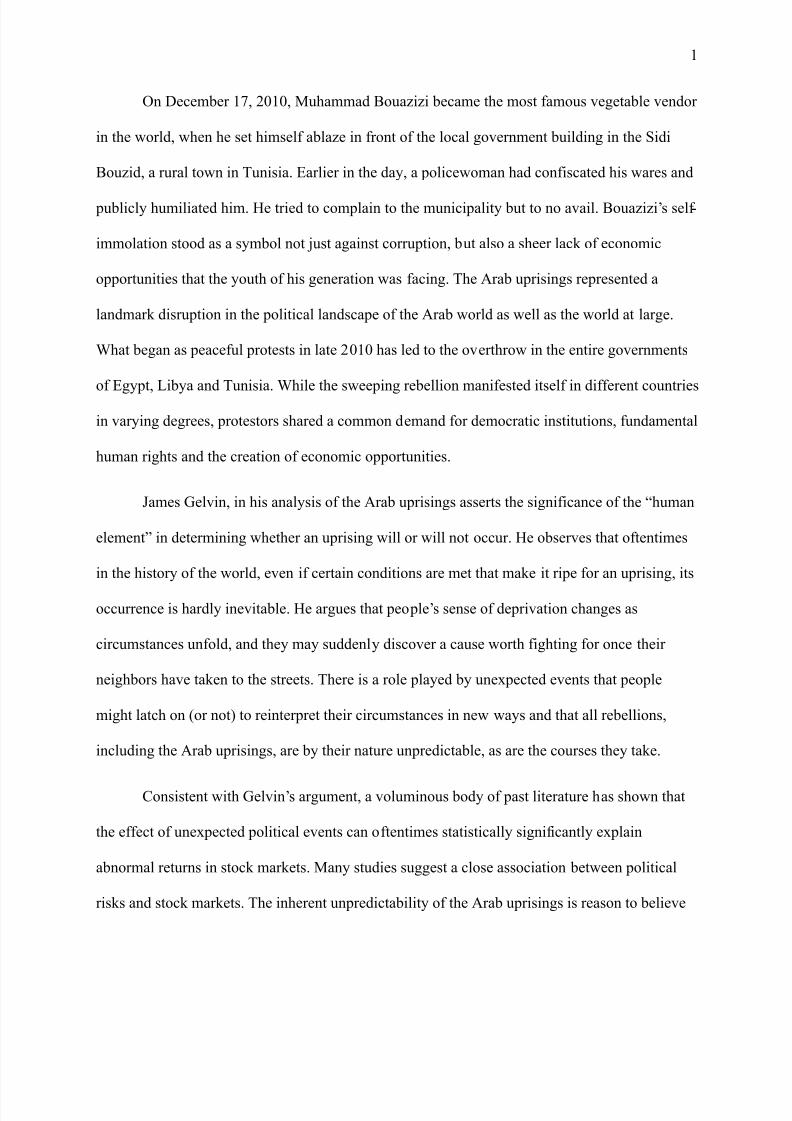
On December 17, 2010, Muhammad Bouazizi became the most famous vegetable vendor
in the world, when he set himself ablaze in front of the local government building in the Sidi
Bouzid, a rural town in Tunisia. Earlier in the day, a policewoman had confiscated his wares and
publicly humiliated him. He tried to complain to the municipality but to no avail. Bouazizi’s self -
immolation stood as a symbol not just against corruption, but also a sheer lack of economic
opportunities that the youth of his generation was facing. The Arab uprisings represented a
landmark disruption in the political landscape of the Arab world as well as the world at large.
What began as peaceful protests in late 2010 has led to the overthrow in the entire governments
of Egypt, Libya and Tunisia. While the sweeping rebellion manifested itself in different countries
in varying degrees, protestors shared a common demand for democratic institutions, fundamental
human rights and the creation of economic opportunities.
James Gelvin, in his analysis of the Arab uprisings asserts the significance of the “human
element” in determining whether an uprising will or will not occur. He observes that oftentimes
in the history of the world, even if certain conditions are met that make it ripe for an uprising, its
occurrence is hardly inevitable. He argues that people’s sense of deprivation changes as
circumstances unfold, and they may suddenly discover a cause worth fighting for once their
neighbors have taken to the streets. There is a role played by unexpected events that people
might latch on (or not) to reinterpret their circumstances in new ways and that all rebellions,
including the Arab uprisings, are by their nature unpredictable, as are the courses they take.
Consistent with Gelvin’s argument, a voluminous body of past literature has shown that
the effect of unexpected political events can oftentimes statistically significantly explain
abnormal returns in stock markets. Many studies suggest a close association between political
risks and stock markets. The inherent unpredictability of the Arab uprisings is reason to believe
7/28/2019 The Wealth Effects of the 2010-2011 Arab Uprisings: A Market Model Event Study
http://slidepdf.com/reader/full/the-wealth-effects-of-the-2010-2011-arab-uprisings-a-market-model-event-study 6/50
2
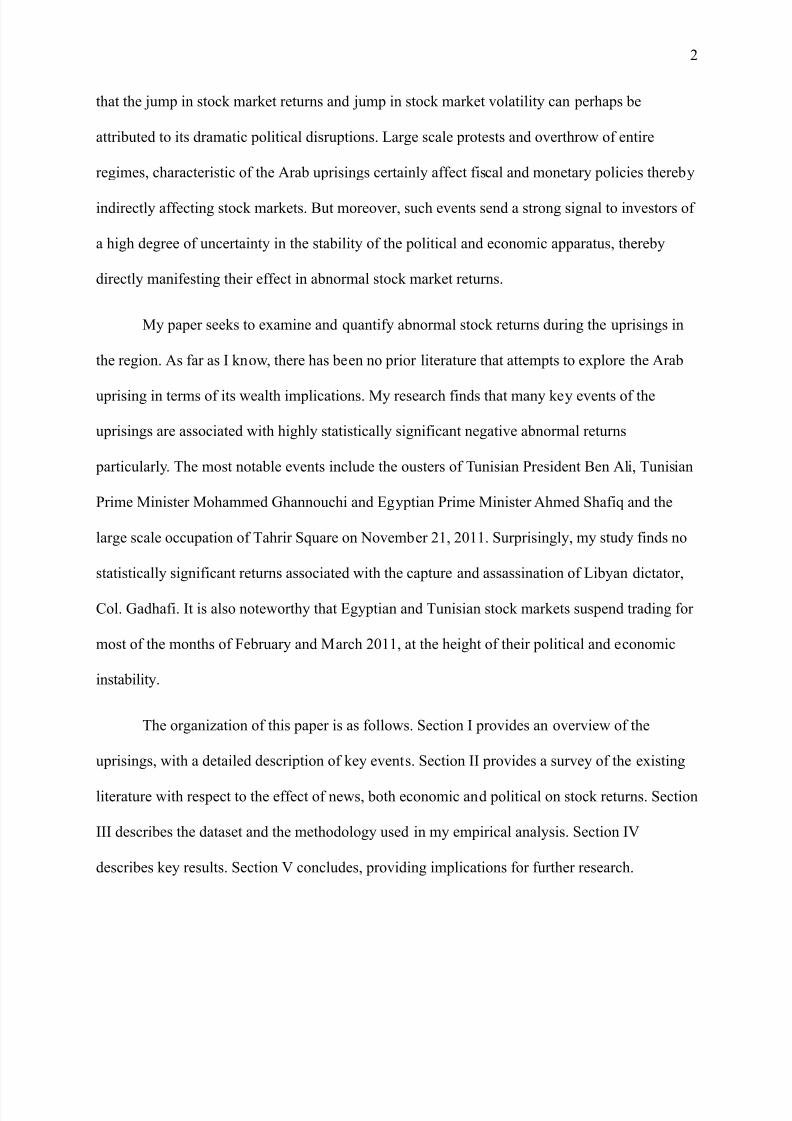
that the jump in stock market returns and jump in stock market volatility can perhaps be
attributed to its dramatic political disruptions. Large scale protests and overthrow of entire
regimes, characteristic of the Arab uprisings certainly affect fiscal and monetary policies thereby
indirectly affecting stock markets. But moreover, such events send a strong signal to investors of
a high degree of uncertainty in the stability of the political and economic apparatus, thereby
directly manifesting their effect in abnormal stock market returns.
My paper seeks to examine and quantify abnormal stock returns during the uprisings in
the region. As far as I know, there has been no prior literature that attempts to explore the Arab
uprising in terms of its wealth implications. My research finds that many key events of the
uprisings are associated with highly statistically significant negative abnormal returns
particularly. The most notable events include the ousters of Tunisian President Ben Ali, Tunisian
Prime Minister Mohammed Ghannouchi and Egyptian Prime Minister Ahmed Shafiq and the
large scale occupation of Tahrir Square on November 21, 2011. Surprisingly, my study finds no
statistically significant returns associated with the capture and assassination of Libyan dictator,
Col. Gadhafi. It is also noteworthy that Egyptian and Tunisian stock markets suspend trading for
most of the months of February and March 2011, at the height of their political and economic
instability.
The organization of this paper is as follows. Section I provides an overview of the
uprisings, with a detailed description of key events. Section II provides a survey of the existing
literature with respect to the effect of news, both economic and political on stock returns. Section
III describes the dataset and the methodology used in my empirical analysis. Section IV
describes key results. Section V concludes, providing implications for further research.
7/28/2019 The Wealth Effects of the 2010-2011 Arab Uprisings: A Market Model Event Study
http://slidepdf.com/reader/full/the-wealth-effects-of-the-2010-2011-arab-uprisings-a-market-model-event-study 7/50
3
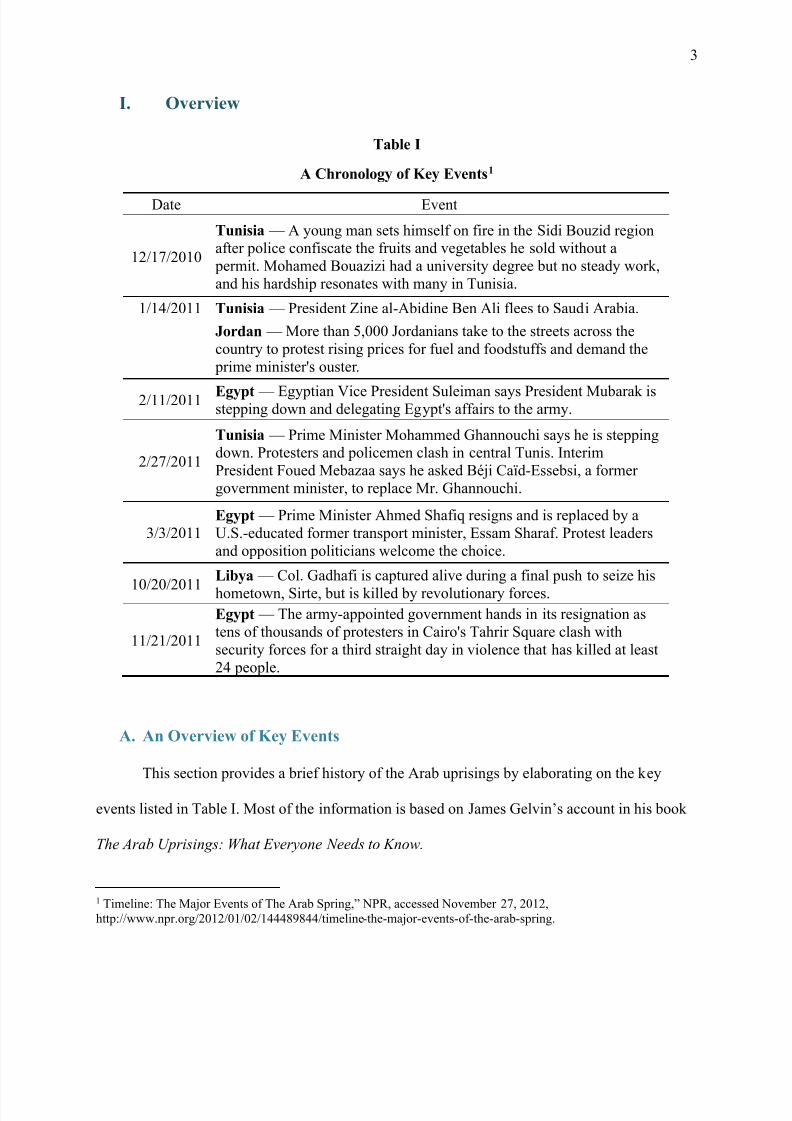
I. Overview
Table I
A Chronology of Key Events1
Date Event
12/17/2010
Tunisia — A young man sets himself on fire in the Sidi Bouzid regionafter police confiscate the fruits and vegetables he sold without a
permit. Mohamed Bouazizi had a university degree but no steady work,
and his hardship resonates with many in Tunisia.
1/14/2011 Tunisia — President Zine al-Abidine Ben Ali flees to Saudi Arabia.
Jordan — More than 5,000 Jordanians take to the streets across the
country to protest rising prices for fuel and foodstuffs and demand the
prime minister's ouster.
2/11/2011 Egypt — Egyptian Vice President Suleiman says President Mubarak isstepping down and delegating Egypt's affairs to the army.
2/27/2011
Tunisia — Prime Minister Mohammed Ghannouchi says he is steppingdown. Protesters and policemen clash in central Tunis. Interim
President Foued Mebazaa says he asked Béji Caïd-Essebsi, a former
government minister, to replace Mr. Ghannouchi.
3/3/2011Egypt — Prime Minister Ahmed Shafiq resigns and is replaced by a
U.S.-educated former transport minister, Essam Sharaf. Protest leaders
and opposition politicians welcome the choice.
10/20/2011
Libya — Col. Gadhafi is captured alive during a final push to seize his
hometown, Sirte, but is killed by revolutionary forces.
11/21/2011
Egypt — The army-appointed government hands in its resignation as
tens of thousands of protesters in Cairo's Tahrir Square clash with
security forces for a third straight day in violence that has killed at least
24 people.
A. An Overview of Key Events
This section provides a brief history of the Arab uprisings by elaborating on the key
events listed in Table I. Most of the information is based on James Gelvin’s account in his book
The Arab Uprisings: What Everyone Needs to Know.
1 Timeline: The Major Events of The Arab Spring,” NPR, accessed November 27, 2012,
http://www.npr.org/2012/01/02/144489844/timeline-the-major -events-of -the-arab-spring.
7/28/2019 The Wealth Effects of the 2010-2011 Arab Uprisings: A Market Model Event Study
http://slidepdf.com/reader/full/the-wealth-effects-of-the-2010-2011-arab-uprisings-a-market-model-event-study 8/50
4
The self -immolation of Muhammad Bouazizi in rural Sidi Bouzid touched off protests
that reached Tunisia’s capital by December 27. Tunisia’s President Zine-al Abidine Ben Ali, who
had ruled for a quarter of a century, tried to pacify protestors by making promises of new jobs
and new parliamentary elections, but to no avail. With the army refusing to fire on the protestors,
Ben Ali fled the country on January 14, leaving the country in the hands of a caretaker
government.
The Tunisian uprising was the first in a series of cascading events that swept through the
Arab world. About a week and a half after the departure of Ben Ali, young people, many of
whom belonged to an organization called the “April 6 Movement,” began their occupation of
Tahrir Square in Cairo; strikes and antigovernment protests spread throughout Egypt. On
February 11, the army took matters in its own hands: it deposed the incumbent ruler of thirty
years, and established a new government under the Supreme Council of the Armed Forces.
After Ben Ali fled Tunisia, Mohamed Ghannouchi, his prime minister and political crony,
announced he was taking the job of transitional president in direct violation of the Tunisian
constitution. Despite the fact that he shortly returned to his original position, the real power still
lay with him. The “second Tunisian revolution” lasted through March 2011, and by the six-
month anniversary of the flight of Ben Ali, Ghannouchi was gone for good and the government
had given in to a number of the protestors’ demands.
In the aftermath of the Tunisian and Egyptian uprisings, a coalition of groups, including
an umbrella group called the National Conference for the Libyan Opposition, issued a call on
social media for Libyans to participate in their own “Day of Rage” to protest political and
economic conditions in Libya. From the beginning, the regime met the uprising with an appalling
level of violence. After six months of intense fighting and the engagement of NATO jets
7/28/2019 The Wealth Effects of the 2010-2011 Arab Uprisings: A Market Model Event Study
http://slidepdf.com/reader/full/the-wealth-effects-of-the-2010-2011-arab-uprisings-a-market-model-event-study 9/50
5
providing close combat air support to the rebels, Tripoli fell to the rebels in August 2011. Two
months later, rebels found and killed Gaddafi in home town of Surt.
In November 2011, the largest demonstrations in Egypt since the resignation of Hosni
Mubarak took place in Tahrir Square, the focal point of the Egyptian revolution. With the cabinet
offering its resignation a few days prior, transitional military rulers as security forces carried out
an increasingly lethal crackdown on three days of violent street protests, reviving the uncertainty
about Egypt’s future that marked the earliest days of the Arab uprising. Egypt’s military had been
viewed as the linchpin of the political transition after the ouster of President Hosni Mubarak. The
cabinet’s offer to resign, in a bow to protestors’ demands, was a blow to the tenuous legitimacy
of the ruling military council2.
B. Political and Economic Context
Many political analysts have argued that the pre-revolution state of affairs in the Arab
world, particularly Egypt and Tunisia had created a pressure cooker waiting to burst. Although,
as James Gelvin argues, there is no inevitability, some of the political and economic conditions
on the eve of the revolution provide can help provide context to the uprisings. The following
outlines some of the key characteristics of the Arab world on the brink of insurrection.
A series of reports prepared by the Regional Bureau for Arab States of the United Nations
Development Program (UNDP) outlined the political conditions of the region, and painted a
bleak picture on the eve of the revolution. None of the countries, with the exception of Jordan,
ranked above the international mean of metrics that measured civil rights, political rights and
independence of media. Eight of the twenty Arab states surveyed ranked above the international
2 David Kirkpatrick, “Egypt’s Cabinet Offers to Resign as Protests Rage,” New York Times, November 21, 2011.
(available at http://www.nytimes.com/2011/11/22/world/middleeast/facing-calls-to-give-up- power -egypts-military-
battles-crowds.html ).
7/28/2019 The Wealth Effects of the 2010-2011 Arab Uprisings: A Market Model Event Study
http://slidepdf.com/reader/full/the-wealth-effects-of-the-2010-2011-arab-uprisings-a-market-model-event-study 10/50
6
means in the quality of public services and the bureaucracy and independence of civil service.
The report categorized almost all Arab states as “black -hole states,” in which the executive
branch of the government was so powerful that it “converts the surrounding environments into a
setting in which nothing movies and from which nothing escapes.”3
In a separate report prepared by the International Monetary Fund (IMF) for the G-8
meeting in 2011, it outlined some of the key economic indicators of the Middle East and North
Africa region. Over the course of the past three decades, the GDP growth in the region averaged
3 percent, while the rest of the developing world grew at the rate of 4.5 percent. It calculated that
to absorb the unemployed and new entrants to the job market, the annual GDP would have to
grow at a rate of 7.5 percent. Further, it highlighted that exports had remained flat in recent
decades, with the exception of oil and gas, and about 60 percent of the region’s exports go to
Europe implying limited interaction with emerging markets such as China. The number of jobs
grew as 2 percent annually between 2000 and 2007 and overall unemployment in Egypt, Jordan,
Lebanon, Syria and Tunisia hovered between 10 and 12 percent.4
3 James Gelvin, The Arab Uprisings: What Everyone Needs to Know (New York: Oxford University Press, 2012), 5 4 Ibid., 11.
7/28/2019 The Wealth Effects of the 2010-2011 Arab Uprisings: A Market Model Event Study
http://slidepdf.com/reader/full/the-wealth-effects-of-the-2010-2011-arab-uprisings-a-market-model-event-study 11/50
7
II. Literature Review
A. Economic News and Stock Markets
There is a substantial body of research devoted to understanding the determinants of
stock prices, especially in terms of economic news. Most attempts to explain the sources of stock
volatility have focused on the interplay of the stock market and easily observable real and
financial variables. Fama et al. (1969) conducted one of the foremost studies of testing the speed
of adjustment of stock prices to specific kinds of new information. By examining the process by
which common stock prices adjust to the stock split information, they conclude that stock
markets are “efficient” in the sense that stock markets adjust very rapidly to new information.
Moreover, their evidence indicates that on average the market’s judgments concerning the
information implications of a split are fully reflected in the price of a share at least by the end of
the split month but most probably almost immediately after the announcement date.
Pearce & Roley (1984) examined the daily responses of stock prices, based on the S&P
500, to economic news such as announcements about the money supply, inflation, real economic
activity, and the discount rate using survey data to identify the unexpected component, or the
surprise, of the announcements. They use survey data on market participants’ expectations of
economic announcements in order to construct direct measures of the unexpected changes.
Although the authors found that new information related directly to monetary policy significantly
affects stock prices, they found limited evidence of impact from inflation surprises and no
evidence of an impact from real activity surprise on the announcement days. Furthermore, they
found weak evidence of stock price responses to surprises beyond the announcement day.
Chen et al. (1986) found several economic variables to be significant in explaining
expected stock returns most notably, industrial production, changes in the risk premium, twists in
7/28/2019 The Wealth Effects of the 2010-2011 Arab Uprisings: A Market Model Event Study
http://slidepdf.com/reader/full/the-wealth-effects-of-the-2010-2011-arab-uprisings-a-market-model-event-study 12/50
8
the yield curves and somewhat more weakly, measures of unanticipated inflation and changes in
expected inflation during periods when these variables were highly volatile. They concluded that
stock returns are exposed to systematic economic news, that they are priced in accordance with
their exposures, and that the news can be measured as innovations in state variables whose
identification can be accomplished through simple and intuitive financial theory.
B. Political News and Stock Markets
It is difficult to study the effects of political disruptions on the market returns because of
the complexity in controlling for investors’ expectations prior to major events.
Cutler, Poterba & Summers (1989) analyze the stock market reactions to identifiable
world news. Their results suggest the difficulty of explaining as much as half the variance in
aggregate stock prices on the basis of publicly available news bearing on fundamental values.
They find that while events such as wars, the Presidency, or significant changes in financial
policies have an effect on moving stock prices, they are skeptical of the view that such
qualitative news can account for all the variation in return.
On the other hand, there are several studies that found significant linkages between
political uncertainty and stock prices. Bittlingmayer (1998) found that politics play a significant
role in explaining volatility in Germany’s stock market during World War I, the 1918 Armstice,
and the political turbulence of 1920. His analysis considers key events of post war Weimar
Germany, marked by revolution, an unstable republic and insurrection among other political
agitations. By using a different strategy from his predecessors, of examining a dramatic political
shift rather than simple news stories, he was able to explain a significant amount of variation in
returns in post war Germany. He concludes that his results offer support for the view that
causation runs from political uncertainty to stock prices.
7/28/2019 The Wealth Effects of the 2010-2011 Arab Uprisings: A Market Model Event Study
http://slidepdf.com/reader/full/the-wealth-effects-of-the-2010-2011-arab-uprisings-a-market-model-event-study 13/50
9
In the context of volatility, Mitchell & Mulherin (1994) find that publicly available
information, including major news stories, accounts for only a small fraction of observed daily
volatility in stock markets. Further, Voth (2002) identifies strong evidence in favor of a link
between share price volatility during the Great Depression and the fear about social unrest and
the danger of a violent challenge to the economic status quo. By explaining between half and
two-thirds of the volatility during the Great Depression, he provides direct evidence in favor of
the Merton/Schwert hypothesis5 by accounting for a measure of the risk of revolution, based on
the observed correlations between social unrest, political violence, and the revolutions that do
not occur in his sample period. He argues that this “threat variable” is a highly significant
predictor of higher stock volatility.
C. Emerging Markets
In the context of emerging markets, Kim & Pei (2001) discovered that unexpected return
jumps in the Hong Kong market index are closely associated with political news, and that the
impact of this news is asymmetric, with bad news associated with greater volatility than good
news. Further, they find that the largest market movements in Hong Kong were often associated
with major political news. Hassan et al. (2003) analyze the factors that determine the volatility
and predictability using a sample of 10 emerging markets in the Middle East and Africa region
(MEAF). They use quantitative measures of political, financial, and economic risk and find that
shocks in these ratings shift volatility parameters in MEAF emerging markets. Furthermore, their
results show that local factors represented by these risks have a high power in predicting returns
in the MEAF emerging markets.
5 Schwert (1989) argues that when all likely explanations for abnormal volatility are insufficient, the most likely one
is political risk, the nature of which threatens the survival of an entire regime. Merton (1980) further argues that
relatively small changes in the probability of a momentous shock lead to extreme swings in market sentiment.
7/28/2019 The Wealth Effects of the 2010-2011 Arab Uprisings: A Market Model Event Study
http://slidepdf.com/reader/full/the-wealth-effects-of-the-2010-2011-arab-uprisings-a-market-model-event-study 14/50
10
Amihud & Wuhl (2004) examine the effects of changes in the market’s expectations of
Saddam Hussein’s fall from power. They find a significant difference in the effects of the
probability of Saddam’s fall between the war period and the pre-war period indicating a change
in the interpretation of the news reflected in the Saddam contract prices6. However, the weak
explanatory power of the news of his fall suggests that moves in stock markets reflect something
other than fundamental values, as suggested by Cutler et al. (1989)7. Amihud & Wuhl also detect
a gradual adjustment of stock prices to information prior to the war but hypothesize that fads and
media attention contributed to setting investor expectations about Hussein’s fall during the war
itself revealing a stronger effect on stock prices, oil prices and exchange rates.
Jensen & Schmith (2005) perform an event study to examine the stock market responses
to political events in the context of the 2002 Brazilian presidential election. They use movements
in the Brazilian stock market as proxies for future expectations for the Brazilian economy and
employ a GARCH8 model which allows them to model both the conditional mean return and the
variance. Their analysis finds no statistically significant impact of their political variables on
mean return. They contend that while the rise of Lula (often regarded as the most popular
politician in the history of Brazil) increased uncertainty about the country’s economic future, it
did not clearly signal a decline. More conclusively, they find a positive impact on the volatility of
the Brazilian stock market and they attribute the increase in uncertainty in financial markets to
the uncertainty of Lula’s policies and not to the uncertainty of the election itself. Their findings
6 Amihud & Wulf refer to “Sadddam contracts” as traded contracts that promise a fixed amount of Saddam were out
of power by the contracts’ expiration dates. They monitor the prices of these contracts as a means to control for
investors’ expectations. 7 Cutler et al. (1989) contend that volatility may reflect changes that take place in average assessments of given sets
of information regarding fundamental values as investors re-examine existing data or present new arguments. 8 GARCH refers to the generalized autoregressive conditional heteroskedasticity model.
7/28/2019 The Wealth Effects of the 2010-2011 Arab Uprisings: A Market Model Event Study
http://slidepdf.com/reader/full/the-wealth-effects-of-the-2010-2011-arab-uprisings-a-market-model-event-study 15/50
11
suggest that markets did not expect that Lula’s rise would have a clear negative impact on firms’
future performance, contrary to the discussions in the popular media.
As Pagan & Schwert (1990) as well as Jensen & Schmith (2005) have demonstrated,
conventional ARCH and GARCH models fail to capture the rise in share price variability.
Schwert (1989) observes that the U.S. and world economies came out of the Depression quite
well even though at the time, investors could not have had such confident expectations. He
argues that when all likely explanations are insufficient, the most likely one is political risk
during the Great Depression, in that the very survival of the capitalist system, even in the United
States, was seen to be at risk. Merton (1980) also points to the relatively small changes in the
probability of a momentous shock leading to the extreme swings in market sentiment.
D. Motivation
My research seeks to study the wealth effects of political events in the context of the Arab
uprisings, a major contemporary world event with far -reaching economic and sociological
ramifications. By employing the OLS market model as specified by Brown and Warner (1984), it
seeks to calculate unexpected or abnormal stock returns of major indices in Egypt, Tunisia,
Jordan, Lebanon, Saudi Arabia, Bahrain, Dubai and London with respect to the S&P 500, in the
context of predefined time windows around major events. Specifically, it seeks to examine if key
political events characterized by large scale protests and overthrow of regimes, can statistically
significantly explain abnormality in return and by how much.
7/28/2019 The Wealth Effects of the 2010-2011 Arab Uprisings: A Market Model Event Study
http://slidepdf.com/reader/full/the-wealth-effects-of-the-2010-2011-arab-uprisings-a-market-model-event-study 16/50
12
III. Methodology and Empirical Analysis
A. Dataset
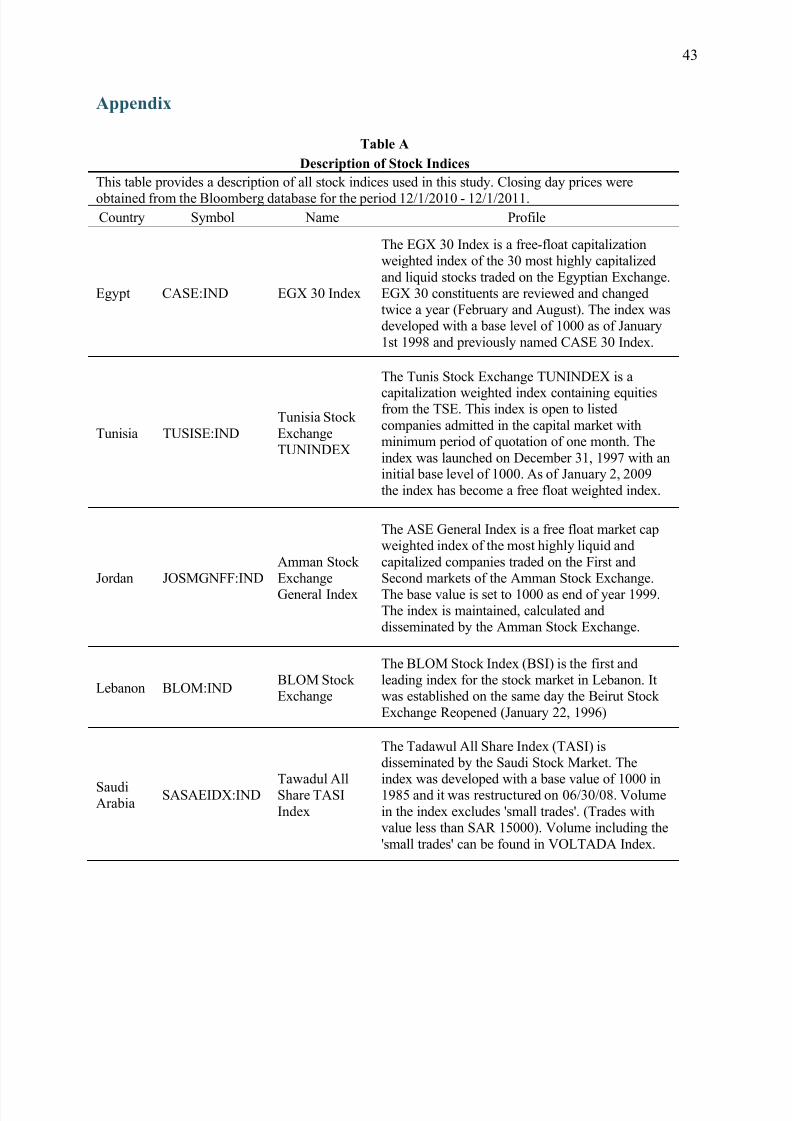
The dataset for this study is constructed from closing day prices of aggregate
capitalization weighted equity indices in each of the countries considered namely Egypt, Tunisia,
Jordan, Lebanon, Saudi Arabia, Bahrain, Dubai, London and New York. The countries were
selected based on impact of disruptions caused by the uprisings, and partly on the availability of
data. Closing day prices for each index were obtained from the Bloomberg database. The
specifics of each index are provided in Table II with detailed descriptions provided in Table A of
the Appendix. Daily data is used for this study based on the conclusions drawn by Brown &
Warner (1984) that the use of daily data is straightforward and generally reinforce the robustness
of the OLS market model under a variety of conditions.
The event dates for this study mark either a large scale civilian protest, the ouster of an
incumbent autocrat, or a simultaneous occurrence of both. Such massively disruptive events are
potentially effective signals to investors about the instability of the regime and can give rise to a
legitimate uncertainty about the survival of the economic and political apparatus. The event
windows are defined as 7-day periods, assuming efficient markets, with 2 days prior and 4 days
after the date of the actual event. This tries to take into account investors’ expectations in
anticipation of the event as well as the lag between the dissemination of news and the occurrence
of the event itself as much as possible. The specifics of the event windows are provided in Table
III.
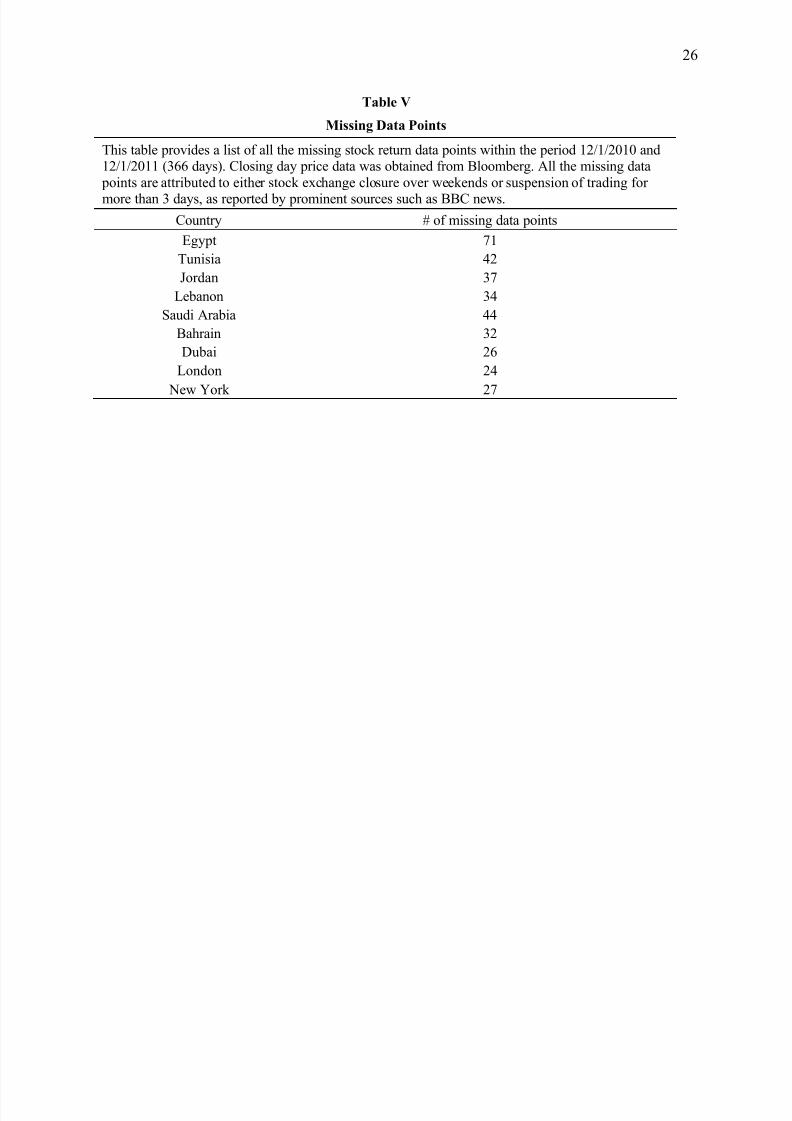
Table V reports missing data points for each of the indices considered. The lack of data is
attributed to either stock exchange closure over weekends or suspension of trading for more than
7/28/2019 The Wealth Effects of the 2010-2011 Arab Uprisings: A Market Model Event Study
http://slidepdf.com/reader/full/the-wealth-effects-of-the-2010-2011-arab-uprisings-a-market-model-event-study 17/50
13
3 days. Data points over weekends outside event windows were extrapolated from the closing
price of the previous day. No extrapolation was done for more than 3 days of missing data.
B. Daily Returns
To examine the wealth effects correlated with political upheavals during the Arab
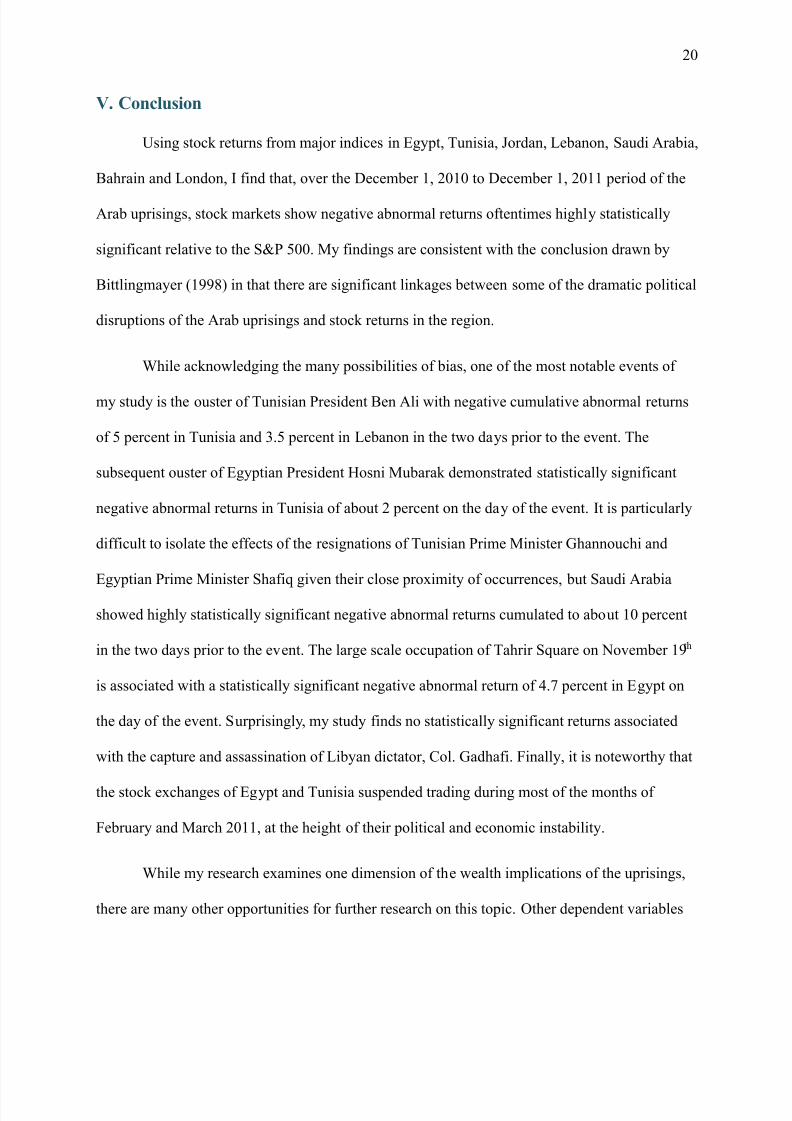
revolution, I analyze daily equity returns calculated using closing day index prices. Figures 1 is a
simple line plot of daily returns over the entire time period of this study i.e. between 12/1/2010
and 12/1/2011. The dotted lines mark key events that I study, as specified above. It is noteworthy
that many significant jumps in returns are seen immediately after major events.
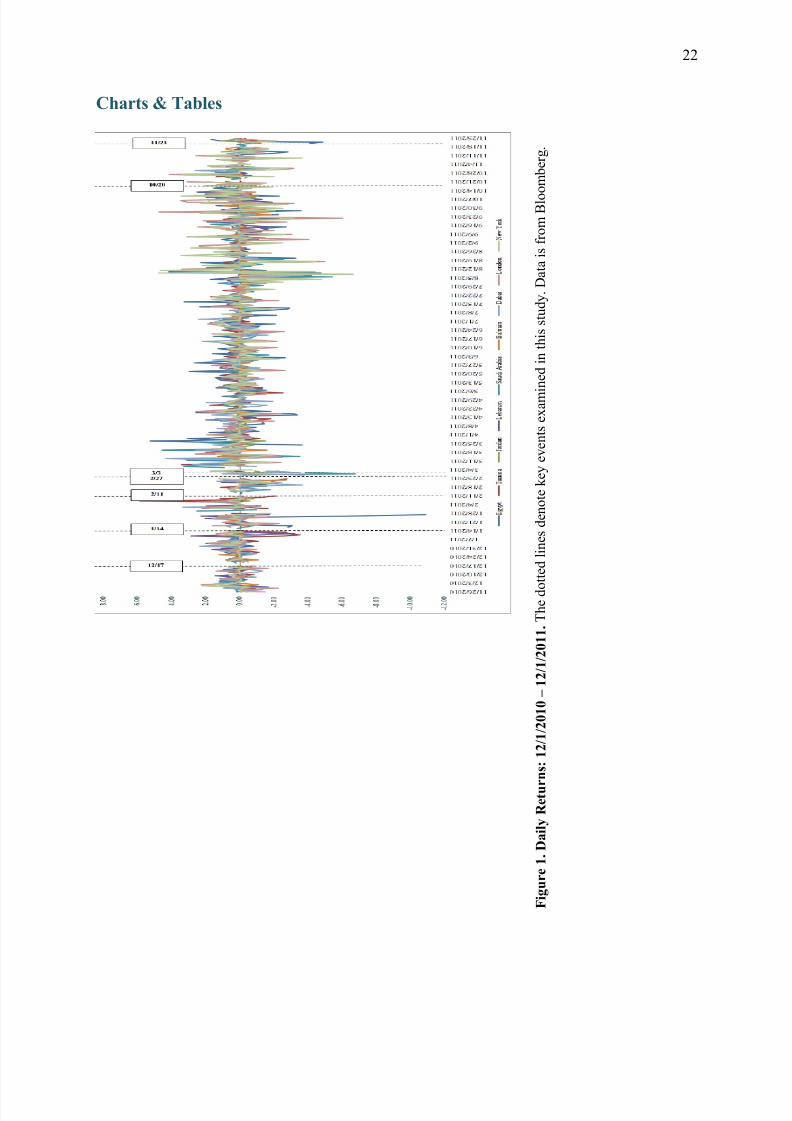
Figure 2 is a simple line plot of cumulative daily returns of the stock indices, with dotted
lines marking key events. This chart supports the view that large stock movements were the
result of sudden, specific political developments. Moreover, it shows that overall wealth, as
characterized by cumulative equity returns was lost over the course of the one year that this study
takes into consideration. This effect is most significantly demonstrated by Egypt and Tunisia, the
epicenters of the revolution, with each of them experiencing pervasive turmoil and consequently,
dramatic changes in regime.
Tables VI (A) through VI (G) display daily index returns isolated by the event windows
as defined earlier. The data in each of the tables is visually represented by a corresponding
simple line plot, with dotted lines marking key events.
C. Descriptive Statistics
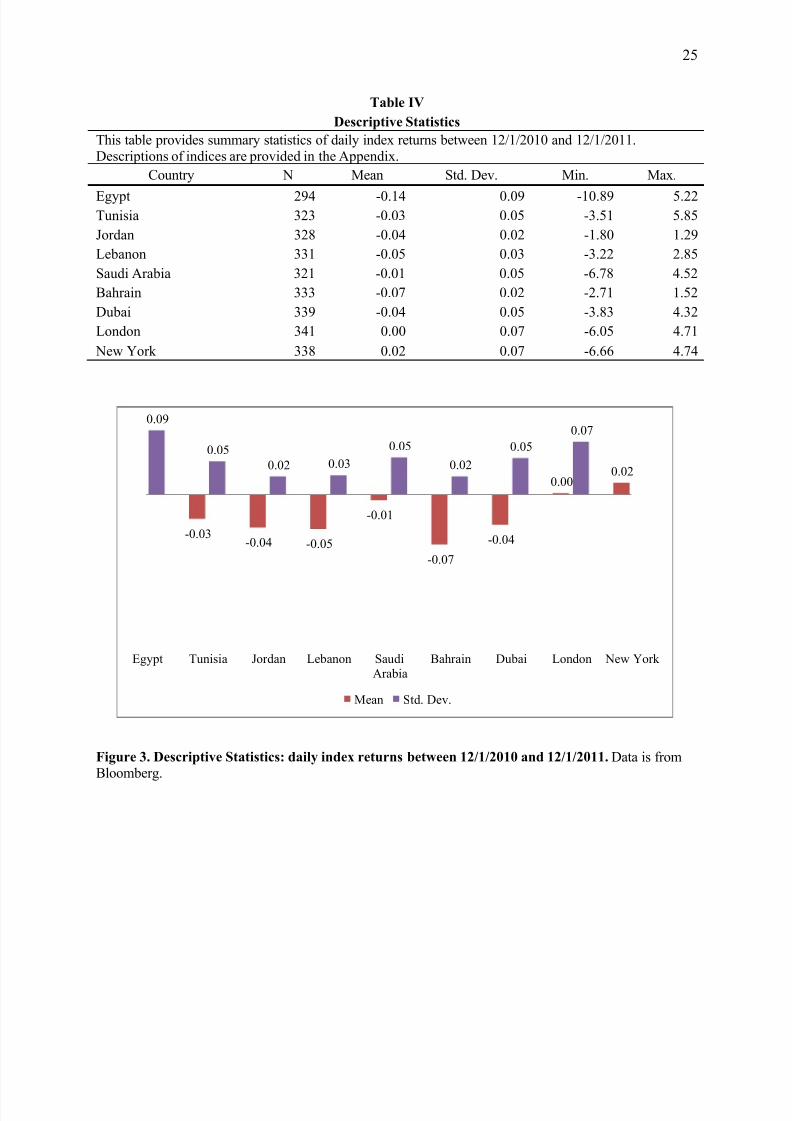
Table IV provides summary statistics of daily index returns during the entire time period of
this study i.e. between 12/1/2010 and 12/1/2011. Figure 3 visually represents the corresponding
means and standard deviations.
7/28/2019 The Wealth Effects of the 2010-2011 Arab Uprisings: A Market Model Event Study
http://slidepdf.com/reader/full/the-wealth-effects-of-the-2010-2011-arab-uprisings-a-market-model-event-study 18/50
14
It is noteworthy that mean returns are mostly negative, signifying a loss of wealth during the
time period. Although Egypt has the least available data points, it notably shows the lowest mean
and minimum values indicating the lowest decline in market returns during the time period, as
compared other nations. This is consistent with the fact that it was politically and economically
the most affected by the uprisings during the time period. Further, Egypt’s high standard
deviation in returns suggests a high level of volatility during the time period reflecting the
pervasive market sentiment of uncertainty.
D. OLS Market Model Regression Methodology
This section describes the methodology and regression model employed in my analysis. I
use the OLS market model as specified by Brown & Warner (1984) to estimate daily abnormal
returns of each country’s representative index with respect to market returns as represented by
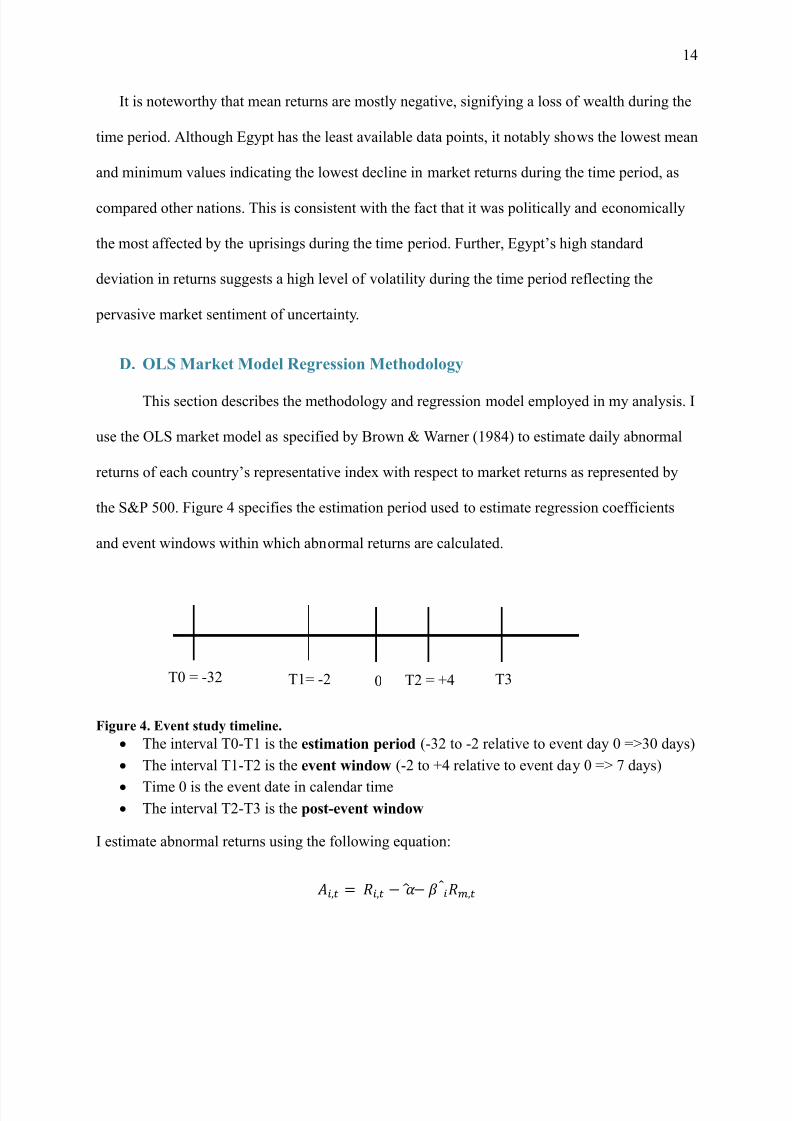
the S&P 500. Figure 4 specifies the estimation period used to estimate regression coefficients
and event windows within which abnormal returns are calculated.
Figure 4. Event study timeline.
The interval T0-T1 is the estimation period (-32 to -2 relative to event day 0 =>30 days)
The interval T1-T2 is the event window (-2 to +4 relative to event day 0 => 7 days)
Time 0 is the event date in calendar time The interval T2-T3 is the post-event window
I estimate abnormal returns using the following equation:
, = , − − ,
T0 = -32 T1= -2 0 T2 = +4 T3
7/28/2019 The Wealth Effects of the 2010-2011 Arab Uprisings: A Market Model Event Study
http://slidepdf.com/reader/full/the-wealth-effects-of-the-2010-2011-arab-uprisings-a-market-model-event-study 19/50
15
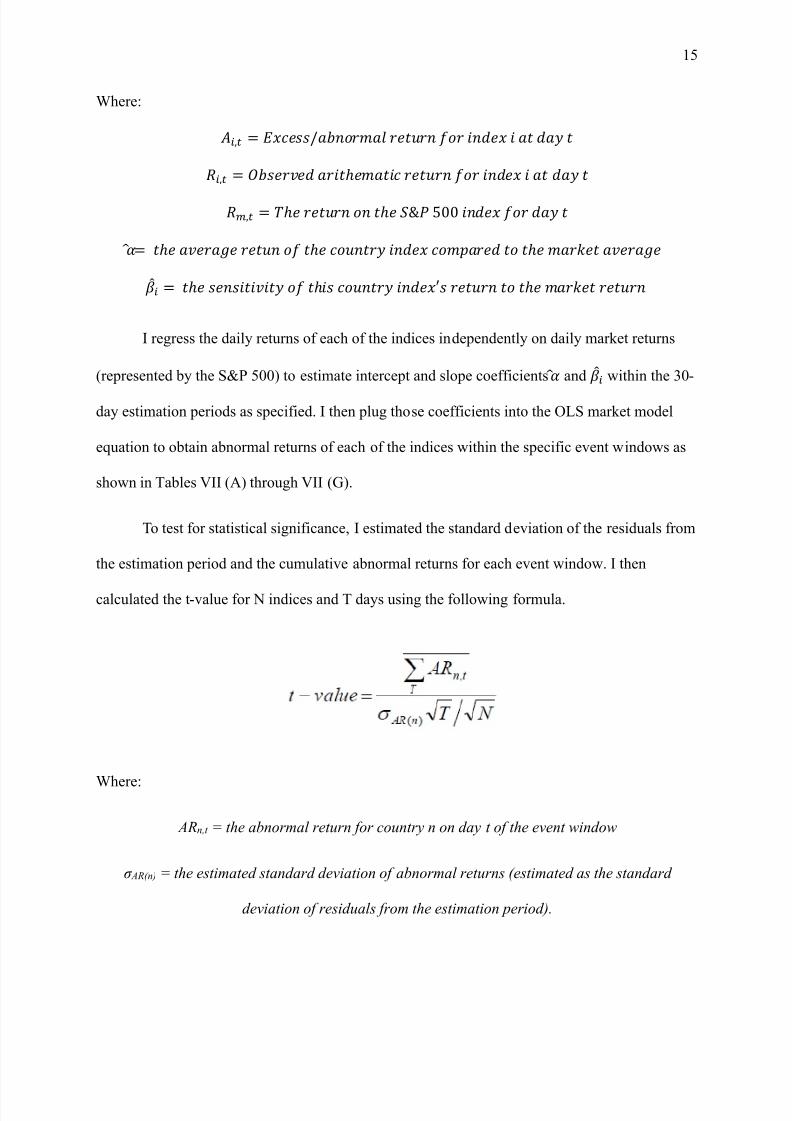
Where:
, = /
, = ℎ
, = ℎ ℎ & 500
= ℎ ℎ ℎ
= ℎ ℎ ′ ℎ
I regress the daily returns of each of the indices independently on daily market returns
(represented by the S&P 500) to estimate intercept and slope coefficients and within the 30-
day estimation periods as specified. I then plug those coefficients into the OLS market model
equation to obtain abnormal returns of each of the indices within the specific event windows as
shown in Tables VII (A) through VII (G).
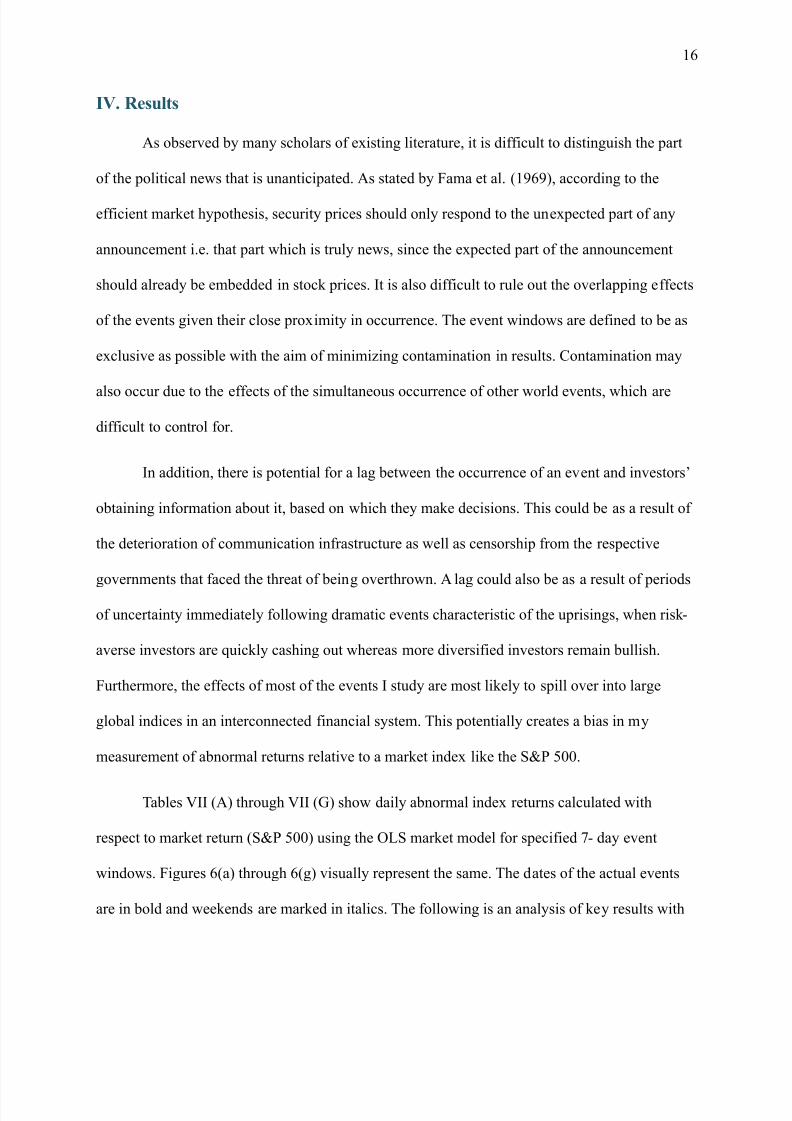
To test for statistical significance, I estimated the standard deviation of the residuals from
the estimation period and the cumulative abnormal returns for each event window. I then
calculated the t-value for N indices and T days using the following formula.
Where:
ARn,t = the abnormal return for country n on day t of the event window
σ AR(n) = the estimated standard deviation of abnormal returns (estimated as the standard
deviation of residuals from the estimation period).
7/28/2019 The Wealth Effects of the 2010-2011 Arab Uprisings: A Market Model Event Study
http://slidepdf.com/reader/full/the-wealth-effects-of-the-2010-2011-arab-uprisings-a-market-model-event-study 20/50
16
IV. Results
As observed by many scholars of existing literature, it is difficult to distinguish the part
of the political news that is unanticipated. As stated by Fama et al. (1969), according to the
efficient market hypothesis, security prices should only respond to the unexpected part of any
announcement i.e. that part which is truly news, since the expected part of the announcement
should already be embedded in stock prices. It is also difficult to rule out the overlapping effects
of the events given their close proximity in occurrence. The event windows are defined to be as
exclusive as possible with the aim of minimizing contamination in results. Contamination may
also occur due to the effects of the simultaneous occurrence of other world events, which are
difficult to control for.
In addition, there is potential for a lag between the occurrence of an event and investors’
obtaining information about it, based on which they make decisions. This could be as a result of
the deterioration of communication infrastructure as well as censorship from the respective
governments that faced the threat of being overthrown. A lag could also be as a result of periods
of uncertainty immediately following dramatic events characteristic of the uprisings, when risk -
averse investors are quickly cashing out whereas more diversified investors remain bullish.
Furthermore, the effects of most of the events I study are most likely to spill over into large
global indices in an interconnected financial system. This potentially creates a bias in my
measurement of abnormal returns relative to a market index like the S&P 500.
Tables VII (A) through VII (G) show daily abnormal index returns calculated with
respect to market return (S&P 500) using the OLS market model for specified 7- day event
windows. Figures 6(a) through 6(g) visually represent the same. The dates of the actual events
are in bold and weekends are marked in italics. The following is an analysis of key results with
7/28/2019 The Wealth Effects of the 2010-2011 Arab Uprisings: A Market Model Event Study
http://slidepdf.com/reader/full/the-wealth-effects-of-the-2010-2011-arab-uprisings-a-market-model-event-study 21/50
17
respect to of the event windows. T-statistics for each of the event windows are provided in Table
B of the Appendix.
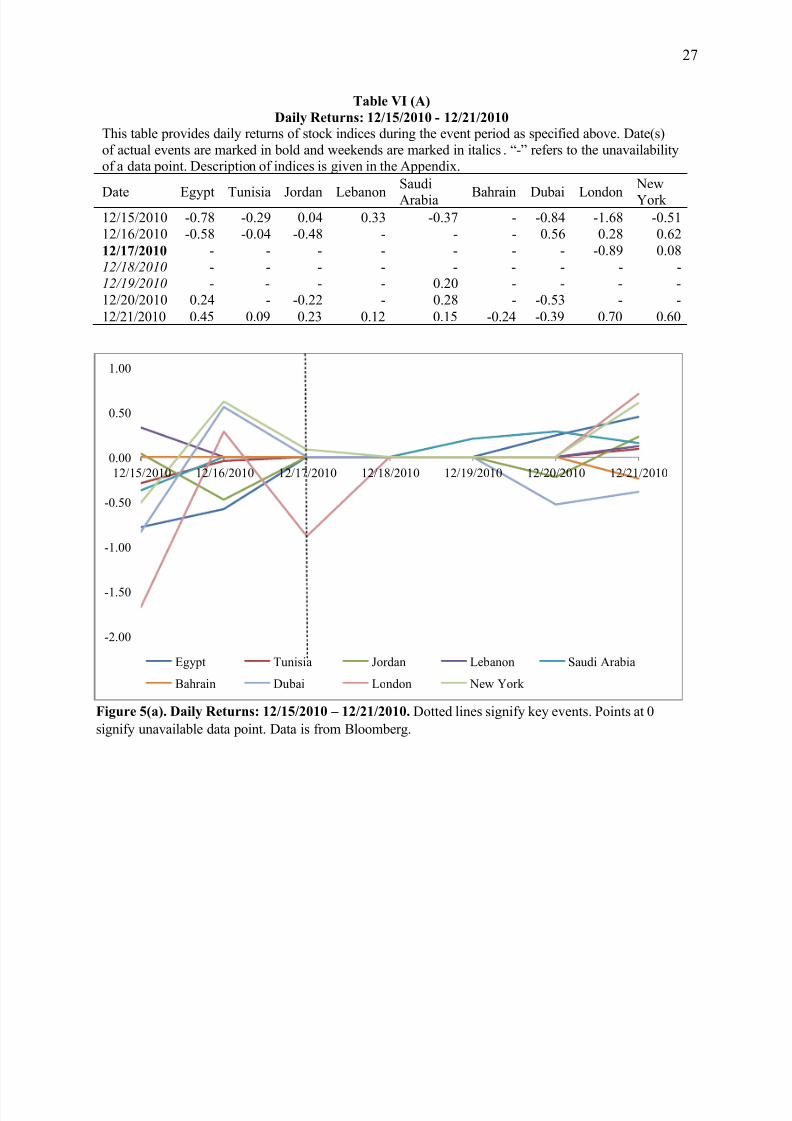
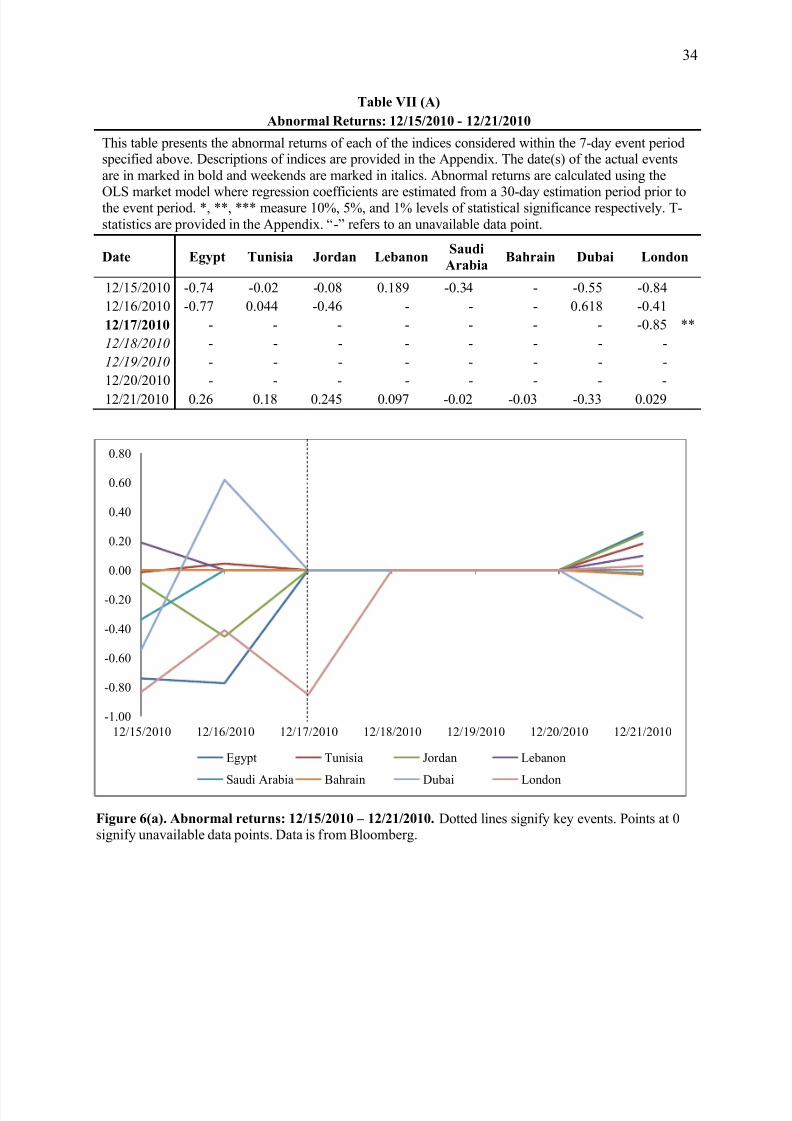
On December 17th, 2010, Mohammed Bouazizi, a vegetable vendor in a small town in
Tunisia, sparked the beginning of the Arab uprisings through an act of self -immolation.
Abnormal index returns for the corresponding event window reflect some of the initial wealth
effects as shown by Table VII (A) with a visual representation in Figure 6(a). While Tunisia does
not show any statistically significant declines, London shows negative abnormal returns of about
0.85 percent on the day of the event, significant at the 5 percent level.
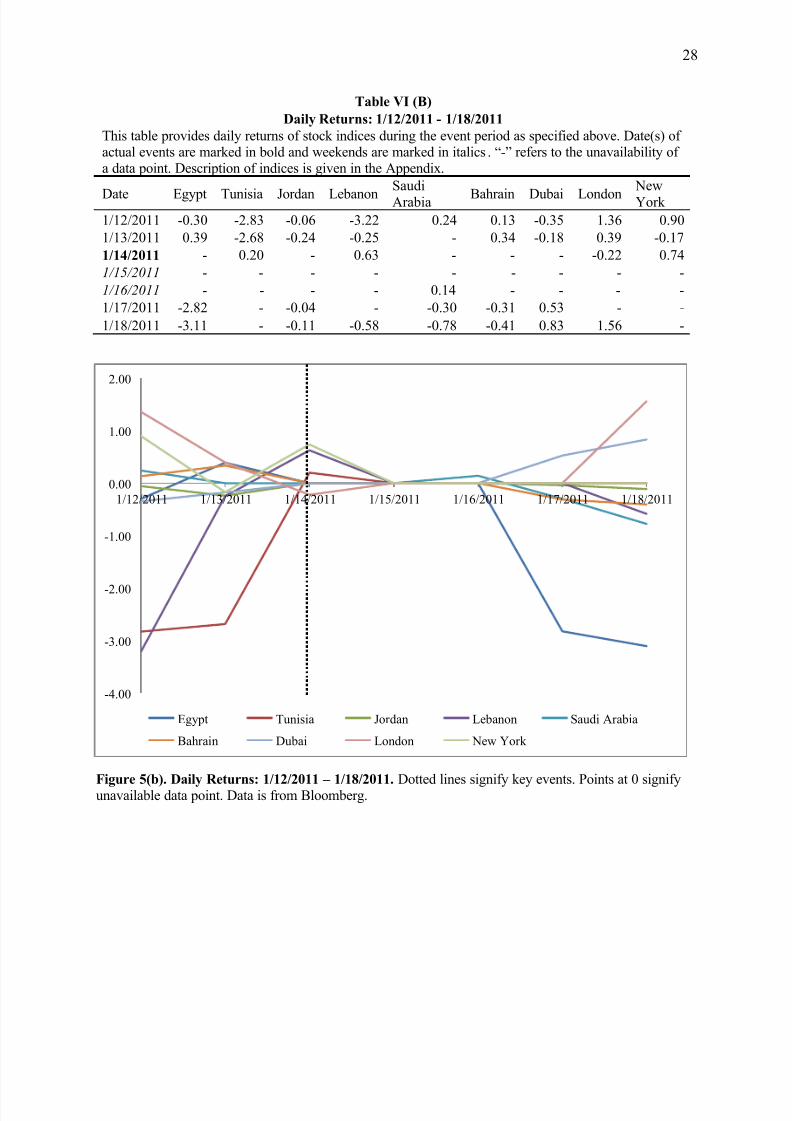
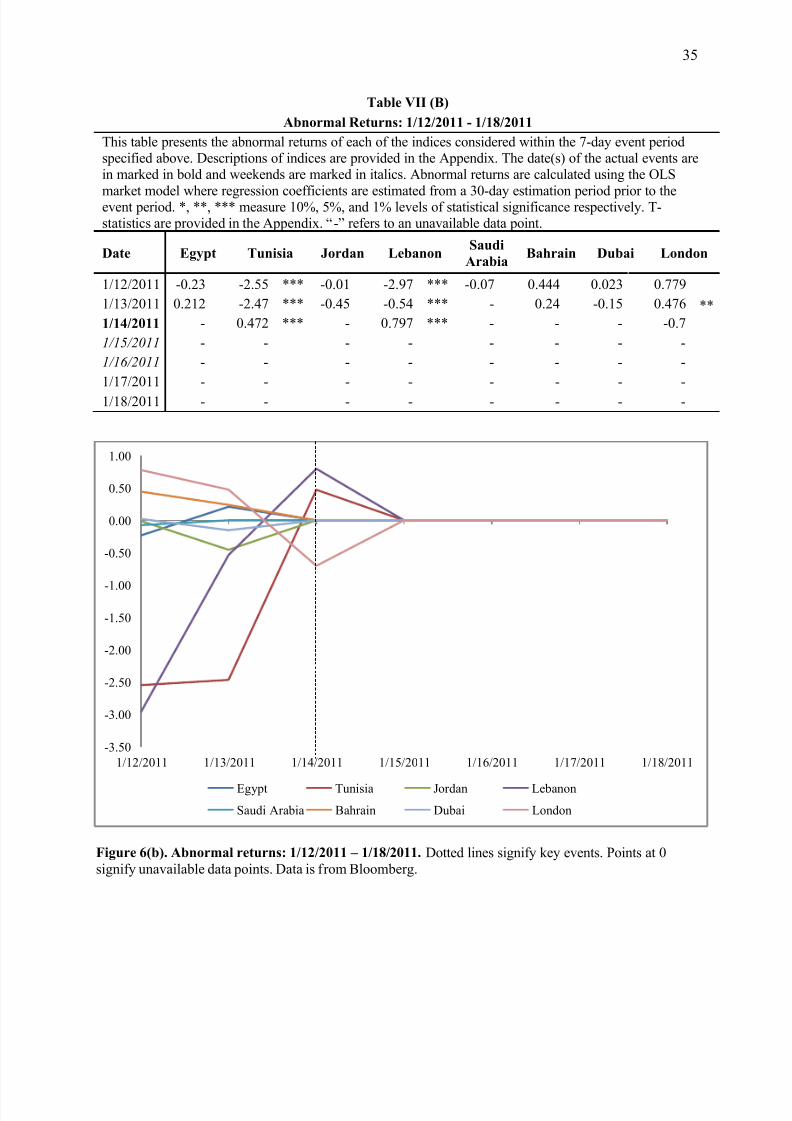
On January 14th, 2011, President Ben Ali of Tunisia flees the country after many weeks of
trying to mollify the raging crowds. Abnormal returns for the corresponding event are provided
in Table VII (B) with a visual representation in Figure 6(b). Arguably in anticipation of his
departure, the Tunisian stock market demonstrates dramatic negative abnormal returns of 2.6
percent two days prior and 2.5 percent one day prior to the event, both at a 1 percent level of
statistical significance. Lebanon shows negative returns of a similar magnitude with a drop of
about 3 percent two days prior and about 0.5 percent on the day prior to the event, also
significant at the 1 percent level.
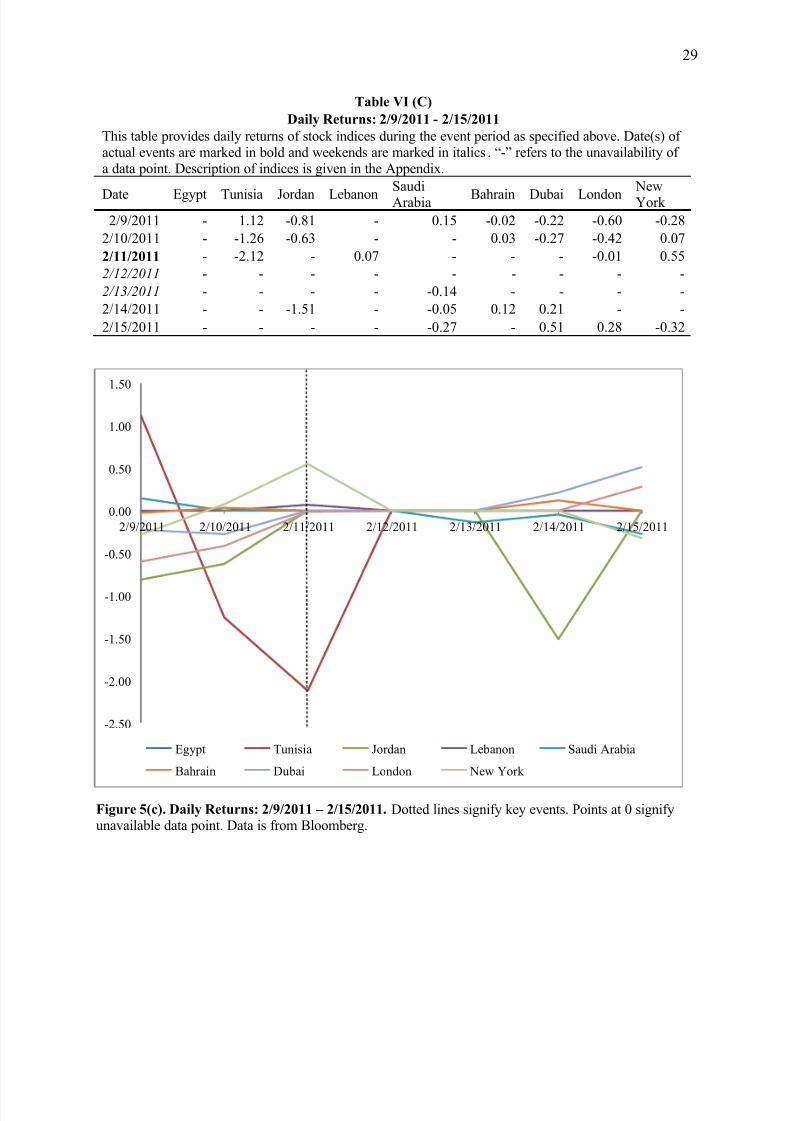
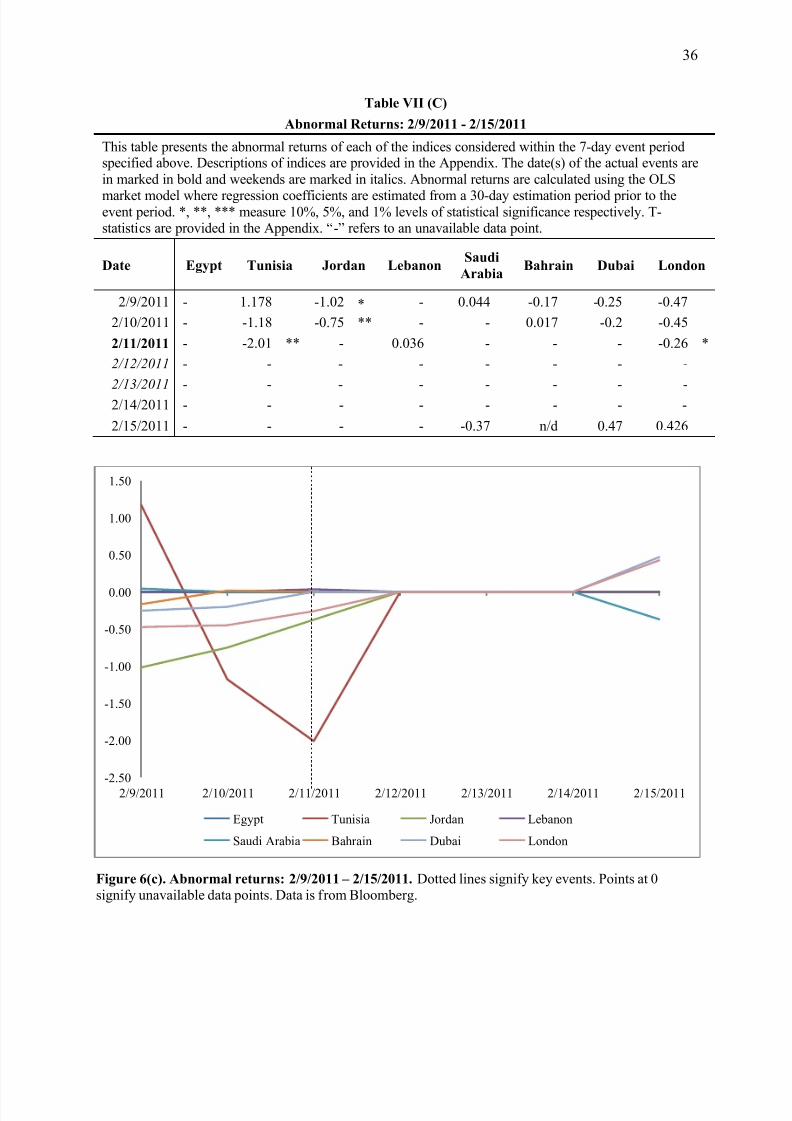
On February 9th, 2011, President Hosni Mubarak, the long incumbent dictator of Egypt
announces his resignation. Abnormal returns for the corresponding event are provided in Table
VII (C) with a visual representation in Figure 6(c). While the Egyptian stock market remain
closed for trading, Tunisia shows negative abnormal returns of about 2 percent at the 5 percent
level on the day of the event and Jordan shows negative returns of about 0.75 percent on the day
prior, at the 5 percent level. London shows negative returns of about 0.2 percent, albeit only at
the 10 percent level.
7/28/2019 The Wealth Effects of the 2010-2011 Arab Uprisings: A Market Model Event Study
http://slidepdf.com/reader/full/the-wealth-effects-of-the-2010-2011-arab-uprisings-a-market-model-event-study 22/50
18
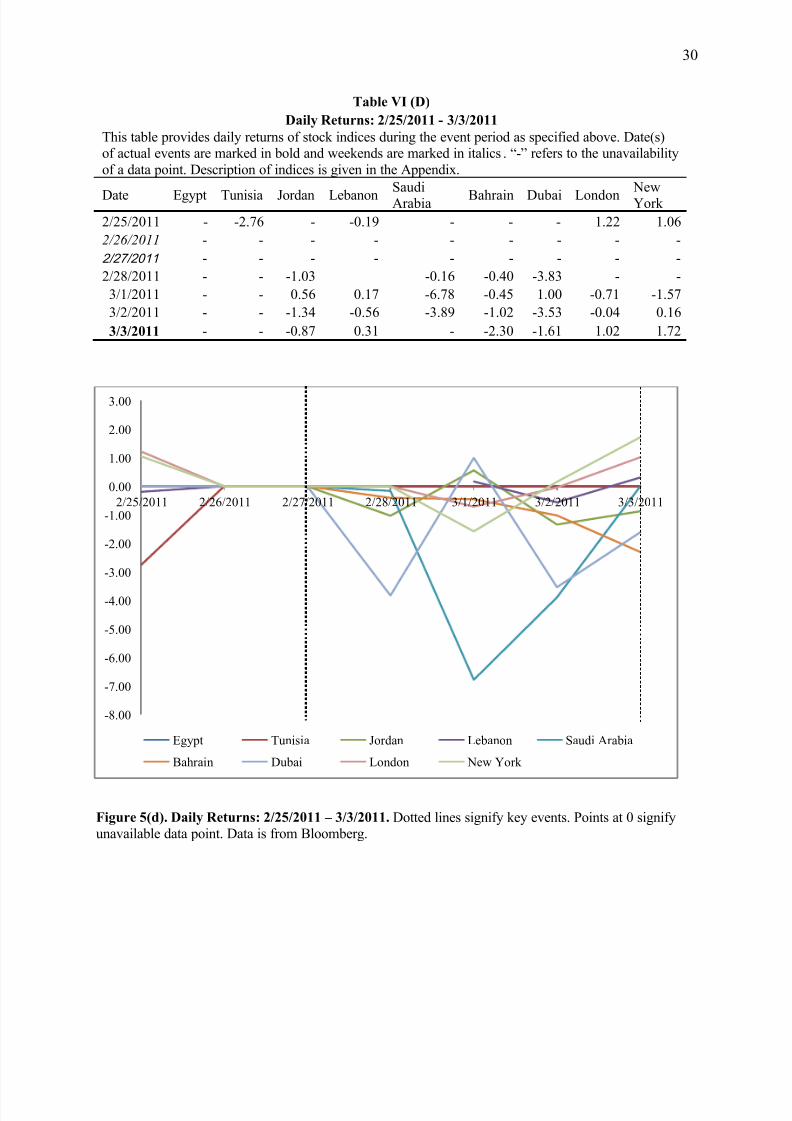
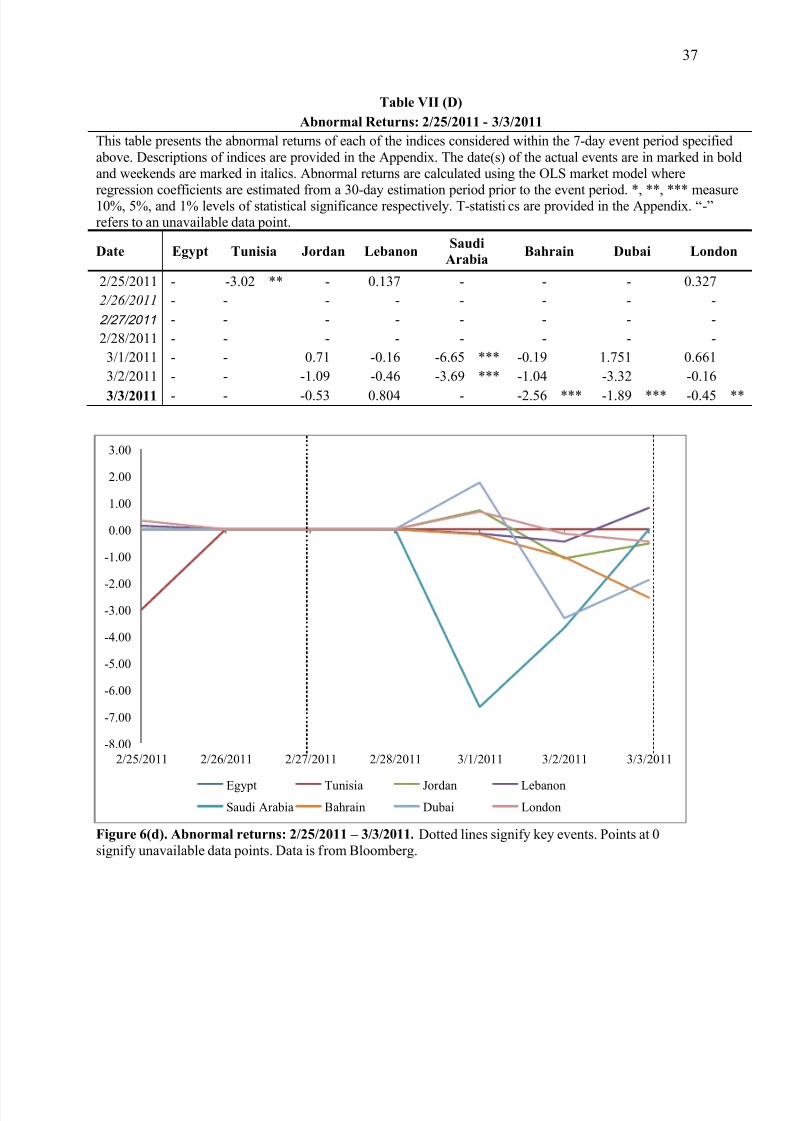
On February 25th, 2011, the Prime Minister of Tunisia, Mohammed Ghannouchi also
announces his resignation and large scale protests erupt in the capital city of Tunis. Abnormal
returns for the corresponding event are provided in Table VII (D) with a visual representation of
the same in Figure 6(d). The Tunisian stock index shows negative returns of about 3 percent two
days prior to the event, significant at the 5 percent level, following which the Tunisian stock
exchange suspends trading for the remainder of February and half way through March.
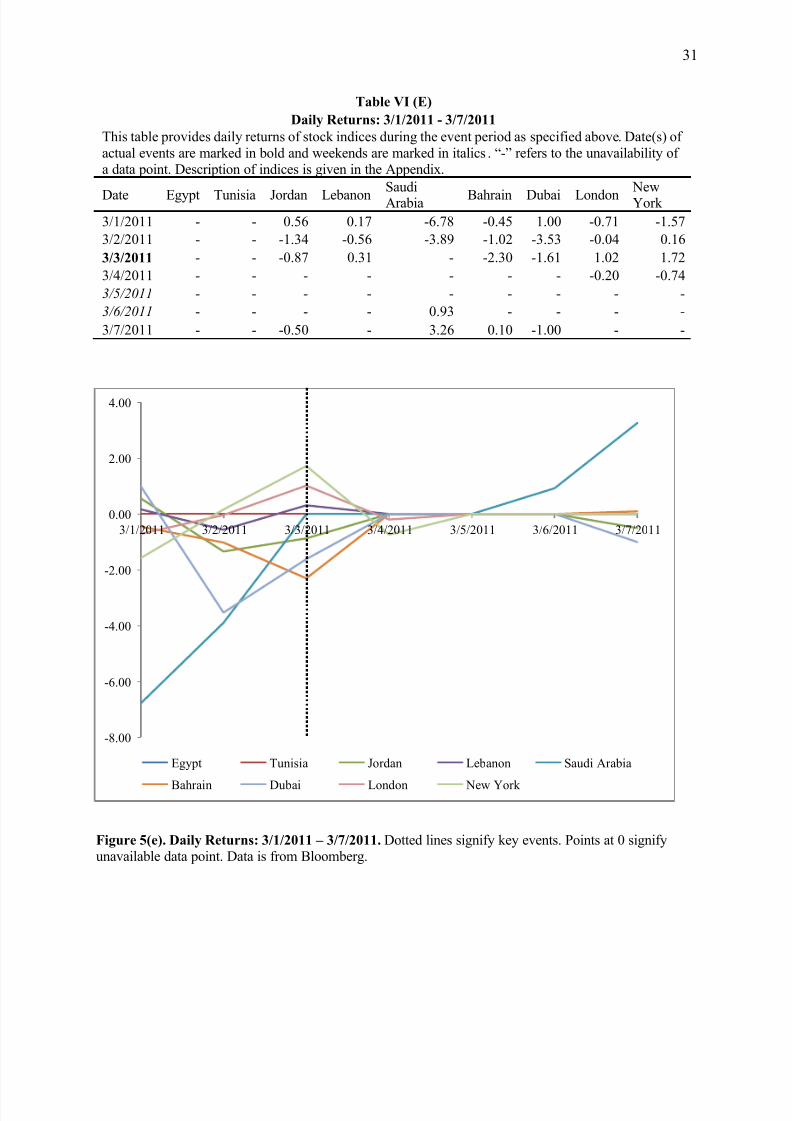
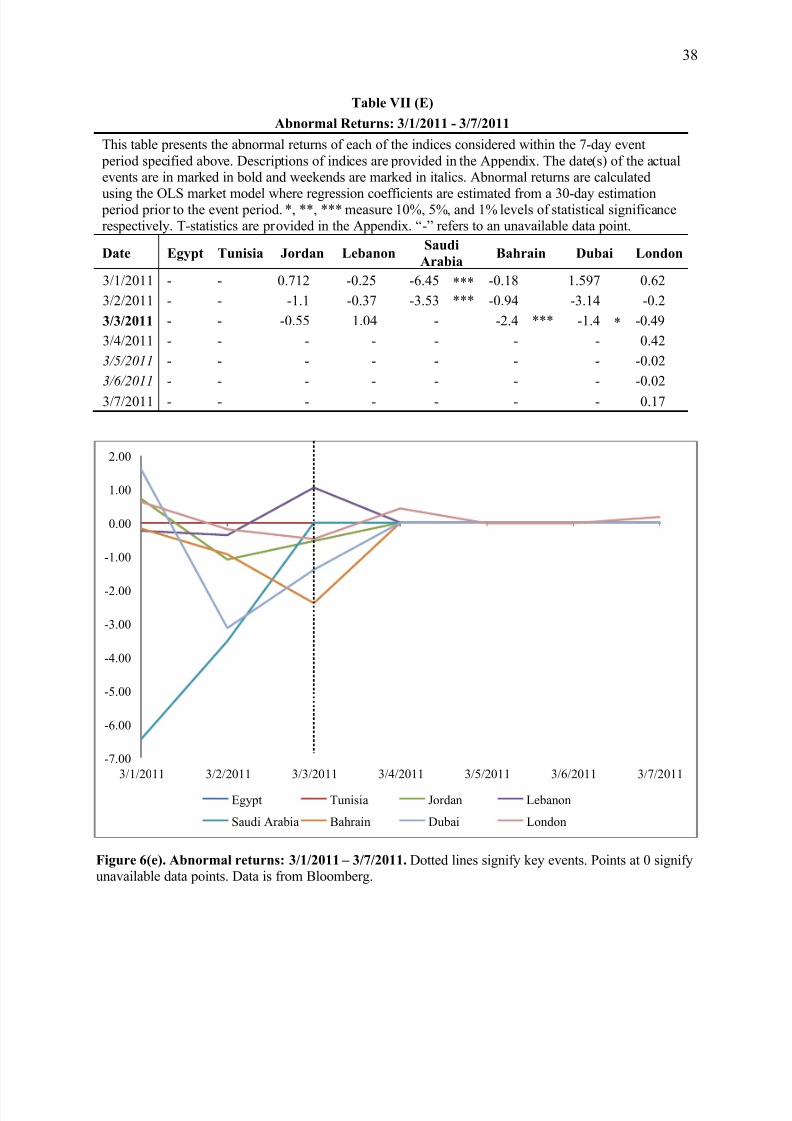
A few days later, on March 3rd, 2011, the Prime Minister of Egypt, Ahmed Shafiq steps
down from office. Given the close proximity of Tunisian Prime Minister Ghannouchi’s
resignation with that of Egyptian Prime Minister Shafiq, there is most likely an overlap which
makes it difficult to isolate effects. Abnormal returns for the corresponding event are provided in
Table VII (E) with a visual representation in Figure 6(e). Taking into consideration the
overlapping effect, Saudi Arabia partly reflects the sentiment of investors, with negative returns
of 6.5 percent two days prior and 3.5 percent decline the day before the event, statistically
significant at the 1 percent level. Bahrain also exhibits negative returns of about 2 percent, at the
1 percent level while Dubai shows negative returns of 1.5 percent, significant at the 10 percent
level. Both the Egyptian and Tunisian stock exchanges remain closed for the duration of the last
two event window.
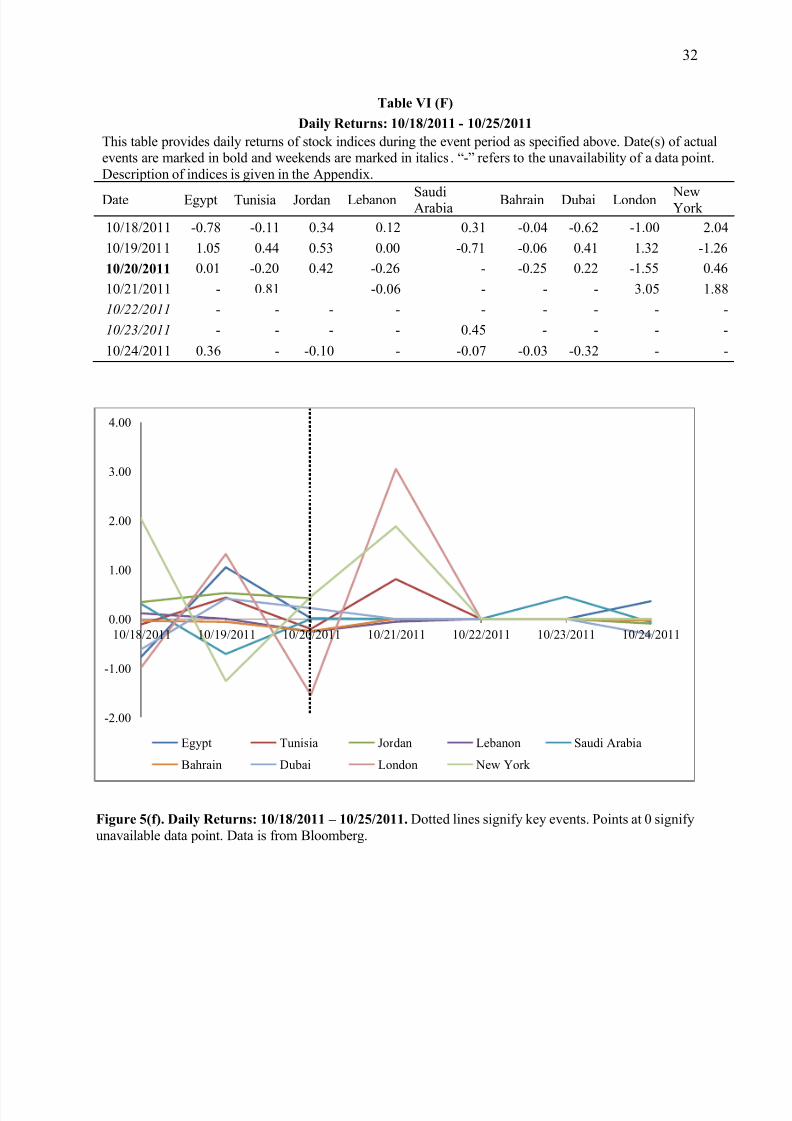
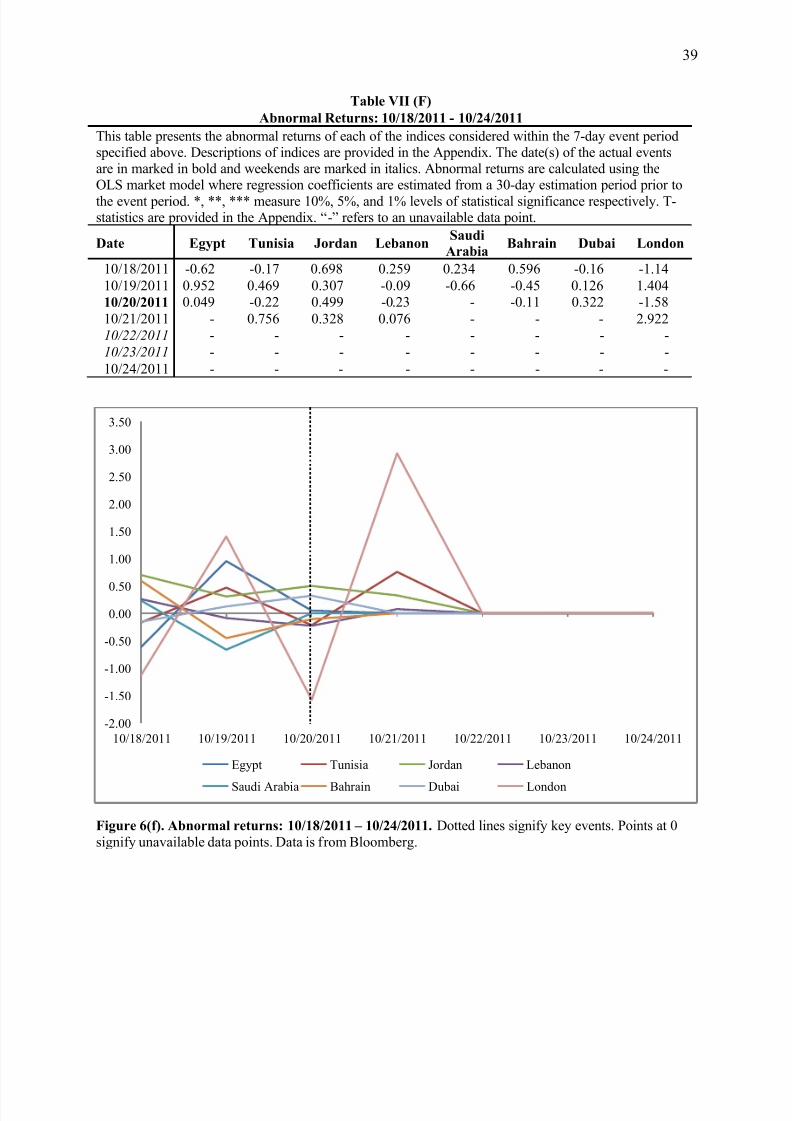
On October 20, 2011, Col. Gadhafi of Libya is captured and killed in his hometown but
surprisingly, none of the countries I consider reveal any statistically significant abnormal returns,
as demonstrated by Table VII (F) and visually represented by Figure 6(f).
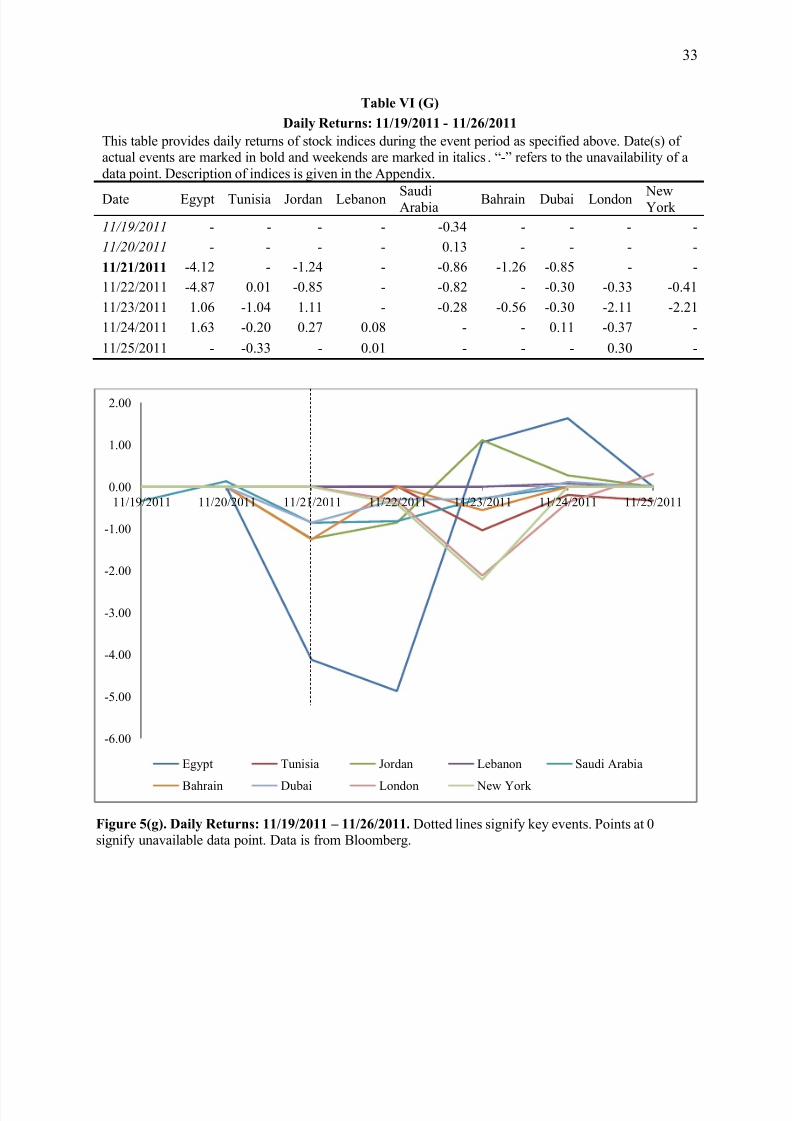
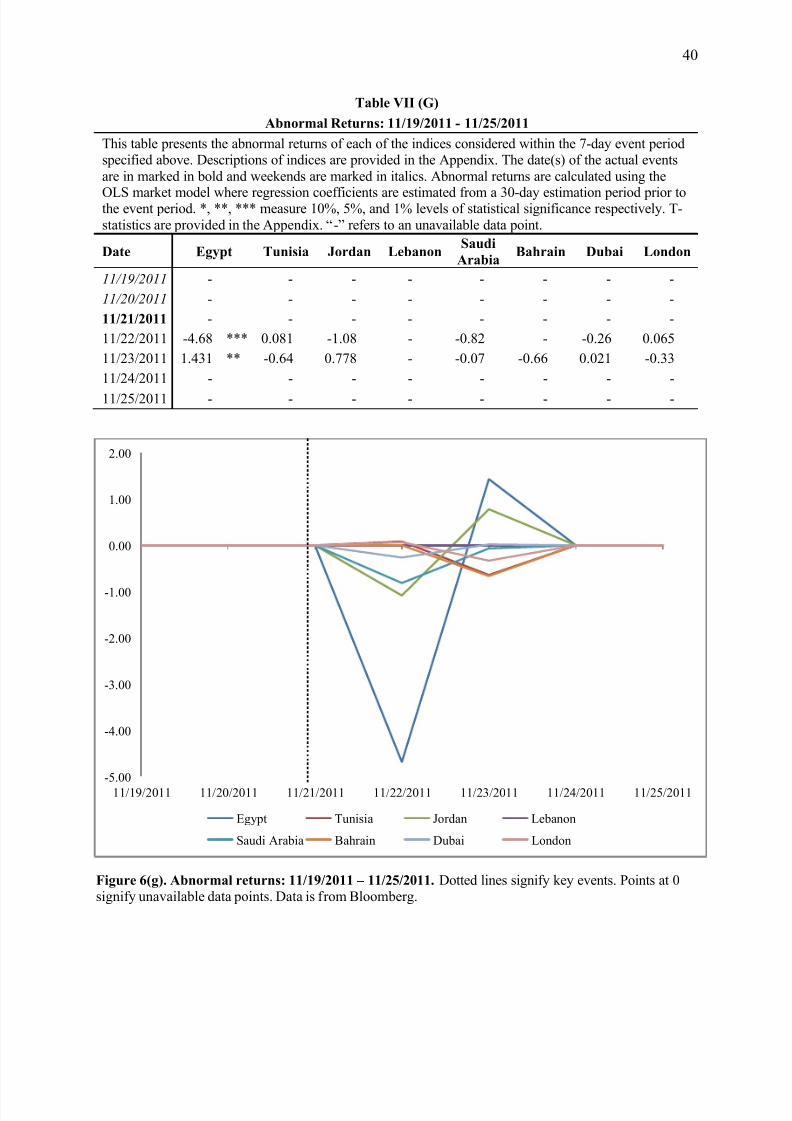
One month later, on November 21, 2011, Egypt takes the center stage of the uprisings
once again with thousands of protestors occupying Tahrir Square in Cairo. Abnormal returns for
this event are provided Table VII (G) and visually represented in Figure 6(g). The Egyptian stock

7/28/2019 The Wealth Effects of the 2010-2011 Arab Uprisings: A Market Model Event Study
http://slidepdf.com/reader/full/the-wealth-effects-of-the-2010-2011-arab-uprisings-a-market-model-event-study 23/50
19
market reacts dramatically with negative abnormal returns of about 5 percent, statistically
significant at the 1 percent level, on the day of the event. No other countries show any
statistically significant returns within this event window.
7/28/2019 The Wealth Effects of the 2010-2011 Arab Uprisings: A Market Model Event Study
http://slidepdf.com/reader/full/the-wealth-effects-of-the-2010-2011-arab-uprisings-a-market-model-event-study 24/50
20
V. Conclusion
Using stock returns from major indices in Egypt, Tunisia, Jordan, Lebanon, Saudi Arabia,
Bahrain and London, I find that, over the December 1, 2010 to December 1, 2011 period of the
Arab uprisings, stock markets show negative abnormal returns oftentimes highly statistically
significant relative to the S&P 500. My findings are consistent with the conclusion drawn by
Bittlingmayer (1998) in that there are significant linkages between some of the dramatic political
disruptions of the Arab uprisings and stock returns in the region.
While acknowledging the many possibilities of bias, one of the most notable events of
my study is the ouster of Tunisian President Ben Ali with negative cumulative abnormal returns
of 5 percent in Tunisia and 3.5 percent in Lebanon in the two days prior to the event. The
subsequent ouster of Egyptian President Hosni Mubarak demonstrated statistically significant
negative abnormal returns in Tunisia of about 2 percent on the day of the event. It is particularly
difficult to isolate the effects of the resignations of Tunisian Prime Minister Ghannouchi and
Egyptian Prime Minister Shafiq given their close proximity of occurrences, but Saudi Arabia
showed highly statistically significant negative abnormal returns cumulated to about 10 percent
in the two days prior to the event. The large scale occupation of Tahrir Square on November 19th
is associated with a statistically significant negative abnormal return of 4.7 percent in Egypt on
the day of the event. Surprisingly, my study finds no statistically significant returns associated
with the capture and assassination of Libyan dictator, Col. Gadhafi. Finally, it is noteworthy that
the stock exchanges of Egypt and Tunisia suspended trading during most of the months of
February and March 2011, at the height of their political and economic instability.
While my research examines one dimension of the wealth implications of the uprisings,
there are many other opportunities for further research on this topic. Other dependent variables

7/28/2019 The Wealth Effects of the 2010-2011 Arab Uprisings: A Market Model Event Study
http://slidepdf.com/reader/full/the-wealth-effects-of-the-2010-2011-arab-uprisings-a-market-model-event-study 25/50
21
such as oil price or insurance industry price indices can be used to calculate abnormal returns and
examine wealth effects manifested in other markets. Further, the event study methodology could
be extended to draw conclusions about stock volatility. Schwert (1989) shows that stock
volatility increases for brief periods during and immediately after financial crises or bank panics,
but there are no long-term effects on volatility, which he characterizes as the “volatility
problem”. The events of the Arab uprisings can be effectively used to perform an explicit test of
the Merton/Schwert hypothesis that dramatic changes in regime add to the fundamental
uncertainty reflected in past and future volatility.
7/28/2019 The Wealth Effects of the 2010-2011 Arab Uprisings: A Market Model Event Study
http://slidepdf.com/reader/full/the-wealth-effects-of-the-2010-2011-arab-uprisings-a-market-model-event-study 26/50
22
Charts & Tables
F i g u r e 1 .
D a i l y R e t u r
n s : 1 2 / 1 / 2 0 1 0 –
1 2 / 1 / 2 0 1 1 .
T h e d o
t t e d l i n e s d e n o t e k e y e v e n t s e x a m i n e d i n t h i s s t u d y .
D a t a i s f r o m
B l o
o m b e r g .
7/28/2019 The Wealth Effects of the 2010-2011 Arab Uprisings: A Market Model Event Study
http://slidepdf.com/reader/full/the-wealth-effects-of-the-2010-2011-arab-uprisings-a-market-model-event-study 27/50
23
F i g u r e 2 .
C u m u l a t i v e
D a i l y R e t u r n s : 1 2 / 1 / 2 0 1 0 - 1 2 / 1 / 2 0 1 1 .
T h e d o t t e d l i n e s d e n o t e k e y e v e n t s e x a m i n e d i n t h i s s t u d y .
D a t a
i s f r o m
B l o o m b e r g .
7/28/2019 The Wealth Effects of the 2010-2011 Arab Uprisings: A Market Model Event Study
http://slidepdf.com/reader/full/the-wealth-effects-of-the-2010-2011-arab-uprisings-a-market-model-event-study 28/50
24
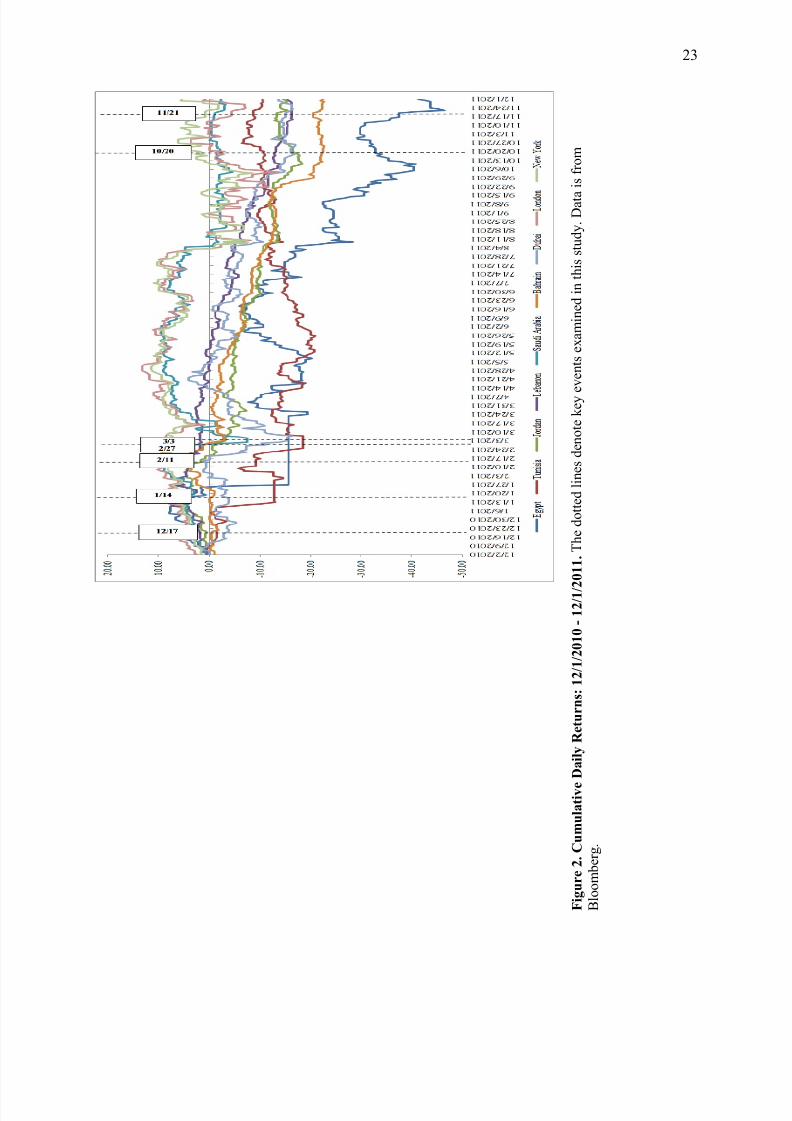
*restructured in 2008
Table III
Event Windows
This table defines the 7-day event periods with respect to the date of the actual event between 12/1/2010
and 12/1/2011. The event dates for this study mark either a large scale civilian protest, the ouster of anincumbent autocrat, or a simultaneous occurrence of both. Dates of the actual event are obtained from
NPR’s timeline of major events cited in the references section.
Event Date Event Window Event
12/17/2010 12/15/2010 - 12/22/2010 Bouazizi (vegetable vendor) sets himself on fire.
1/14/2011 1/12/2011 - 1/18/2011Ben Ali (President of Tunisia) flees; Mass protests inJordan.
2/11/2011 2/9/2011 - 2/15/2011 Mubarak (President of Egypt) announces resignation.
2/27/2011 2/25/2011 - 3/3/2011 Ghannouchi (PM of Tunisia) announces resignation.
3/3/2011 3/1/2011 - 3/7/2011 Shafiq (PM of Egypt) steps down.
10/20/2011 10/18/2011 - 10/24/2011 Gaddafi (Ruler of Libya) is captured and killed.
11/21/2011 11/19/2011 - 11/25/2011 Mass demonstrations at Tahrir Square in Cairo, Egypt.
Table II
Stock Indices
This table provides a list of stock indices employed in calculating returns. Closing day prices for each of the indices was obtained from the Bloomberg database for the 12/1/2010 - 12/1/2011 period. Each index
is capitalization weighted and best represents aggregate equity returns for its respective country. Adetailed description of each index is provided in the Appendix.
Country Name Date of Origination
Egypt EGX 30 Index 2003
Tunisia Tunisia Stock Exchange TUNINDEX 1997
Jordan Amman Stock Exchange General Index 1993
Lebanon BLOM Stock Index 1996
Saudi Arabia Tawadul All Share TASI Index 2008*
Bahrain Bahrain Bourse All Share Index 2004
Dubai Dubai Financial Market General Index 2004
London FTSE All-Share Index 1962
New York S&P 500 Index 1957
7/28/2019 The Wealth Effects of the 2010-2011 Arab Uprisings: A Market Model Event Study
http://slidepdf.com/reader/full/the-wealth-effects-of-the-2010-2011-arab-uprisings-a-market-model-event-study 29/50
25
Table IV
Descriptive Statistics
This table provides summary statistics of daily index returns between 12/1/2010 and 12/1/2011.Descriptions of indices are provided in the Appendix.
Country N Mean Std. Dev. Min. Max.
Egypt 294 -0.14 0.09 -10.89 5.22Tunisia 323 -0.03 0.05 -3.51 5.85
Jordan 328 -0.04 0.02 -1.80 1.29
Lebanon 331 -0.05 0.03 -3.22 2.85
Saudi Arabia 321 -0.01 0.05 -6.78 4.52
Bahrain 333 -0.07 0.02 -2.71 1.52
Dubai 339 -0.04 0.05 -3.83 4.32
London 341 0.00 0.07 -6.05 4.71
New York 338 0.02 0.07 -6.66 4.74
Figure 3. Descriptive Statistics: daily index returns between 12/1/2010 and 12/1/2011. Data is fromBloomberg.
-0.03-0.04 -0.05
-0.01
-0.07
-0.04
0.000.02
0.09
0.05
0.02 0.03
0.05
0.02
0.05
0.07
Egypt Tunisia Jordan Lebanon Saudi
Arabia
Bahrain Dubai London New York
Mean Std. Dev.
7/28/2019 The Wealth Effects of the 2010-2011 Arab Uprisings: A Market Model Event Study
http://slidepdf.com/reader/full/the-wealth-effects-of-the-2010-2011-arab-uprisings-a-market-model-event-study 30/50
26
Table V
Missing Data Points
This table provides a list of all the missing stock return data points within the period 12/1/2010 and12/1/2011 (366 days). Closing day price data was obtained from Bloomberg. All the missing data
points are attributed to either stock exchange closure over weekends or suspension of trading for
more than 3 days, as reported by prominent sources such as BBC news.
Country # of missing data points
Egypt 71
Tunisia 42
Jordan 37
Lebanon 34
Saudi Arabia 44
Bahrain 32
Dubai 26
London 24
New York 27
7/28/2019 The Wealth Effects of the 2010-2011 Arab Uprisings: A Market Model Event Study
http://slidepdf.com/reader/full/the-wealth-effects-of-the-2010-2011-arab-uprisings-a-market-model-event-study 31/50
27
Table VI (A)
Daily Returns: 12/15/2010 - 12/21/2010
This table provides daily returns of stock indices during the event period as specified above. Date(s)
of actual events are marked in bold and weekends are marked in italics. “-” refers to the unavailabilityof a data point. Description of indices is given in the Appendix.
Date Egypt Tunisia Jordan Lebanon
Saudi
Arabia Bahrain Dubai London
New
York 12/15/2010 -0.78 -0.29 0.04 0.33 -0.37 - -0.84 -1.68 -0.51
12/16/2010 -0.58 -0.04 -0.48 - - - 0.56 0.28 0.62
12/17/2010 - - - - - - - -0.89 0.08
12/18/2010 - - - - - - - - -
12/19/2010 - - - - 0.20 - - - -
12/20/2010 0.24 - -0.22 - 0.28 - -0.53 - -
12/21/2010 0.45 0.09 0.23 0.12 0.15 -0.24 -0.39 0.70 0.60
Figure 5(a). Daily Returns: 12/15/2010 – 12/21/2010. Dotted lines signify key events. Points at 0
signify unavailable data point. Data is from Bloomberg.
-2.00
-1.50
-1.00
-0.50
0.00
0.50
1.00
12/15/2010 12/16/2010 12/17/2010 12/18/2010 12/19/2010 12/20/2010 12/21/2010
Egypt Tunisia Jordan Lebanon Saudi Arabia
Bahrain Dubai London New York
7/28/2019 The Wealth Effects of the 2010-2011 Arab Uprisings: A Market Model Event Study
http://slidepdf.com/reader/full/the-wealth-effects-of-the-2010-2011-arab-uprisings-a-market-model-event-study 32/50
28
Table VI (B)
Daily Returns: 1/12/2011 - 1/18/2011
This table provides daily returns of stock indices during the event period as specified above. Date(s) of actual events are marked in bold and weekends are marked in italics. “-” refers to the unavailability of a data point. Description of indices is given in the Appendix.
Date Egypt Tunisia Jordan LebanonSaudi
Arabia Bahrain Dubai London New
York
1/12/2011 -0.30 -2.83 -0.06 -3.22 0.24 0.13 -0.35 1.36 0.90
1/13/2011 0.39 -2.68 -0.24 -0.25 - 0.34 -0.18 0.39 -0.17
1/14/2011 - 0.20 - 0.63 - - - -0.22 0.74
1/15/2011 - - - - - - - - -
1/16/2011 - - - - 0.14 - - - -
1/17/2011 -2.82 - -0.04 - -0.30 -0.31 0.53 - -
1/18/2011 -3.11 - -0.11 -0.58 -0.78 -0.41 0.83 1.56 -
Figure 5(b). Daily Returns: 1/12/2011 – 1/18/2011. Dotted lines signify key events. Points at 0 signifyunavailable data point. Data is from Bloomberg.
-4.00
-3.00
-2.00
-1.00
0.00
1.00
2.00
1/12/2011 1/13/2011 1/14/2011 1/15/2011 1/16/2011 1/17/2011 1/18/2011
Egypt Tunisia Jordan Lebanon Saudi Arabia
Bahrain Dubai London New York
7/28/2019 The Wealth Effects of the 2010-2011 Arab Uprisings: A Market Model Event Study
http://slidepdf.com/reader/full/the-wealth-effects-of-the-2010-2011-arab-uprisings-a-market-model-event-study 33/50
29
Table VI (C)
Daily Returns: 2/9/2011 - 2/15/2011
This table provides daily returns of stock indices during the event period as specified above. Date(s) of actual events are marked in bold and weekends are marked in italics. “-” refers to the unavailability of a data point. Description of indices is given in the Appendix.
Date Egypt Tunisia Jordan LebanonSaudiArabia Bahrain Dubai London
NewYork
2/9/2011 - 1.12 -0.81 - 0.15 -0.02 -0.22 -0.60 -0.28
2/10/2011 - -1.26 -0.63 - - 0.03 -0.27 -0.42 0.07
2/11/2011 - -2.12 - 0.07 - - - -0.01 0.55
2/12/2011 - - - - - - - - -
2/13/2011 - - - - -0.14 - - - -
2/14/2011 - - -1.51 - -0.05 0.12 0.21 - -
2/15/2011 - - - - -0.27 - 0.51 0.28 -0.32
Figure 5(c). Daily Returns: 2/9/2011 – 2/15/2011. Dotted lines signify key events. Points at 0 signifyunavailable data point. Data is from Bloomberg.
-2.50
-2.00
-1.50
-1.00
-0.50
0.00
0.50
1.00
1.50
2/9/2011 2/10/2011 2/11/2011 2/12/2011 2/13/2011 2/14/2011 2/15/2011
Egypt Tunisia Jordan Lebanon Saudi Arabia
Bahrain Dubai London New York
7/28/2019 The Wealth Effects of the 2010-2011 Arab Uprisings: A Market Model Event Study
http://slidepdf.com/reader/full/the-wealth-effects-of-the-2010-2011-arab-uprisings-a-market-model-event-study 34/50
30
Table VI (D)
Daily Returns: 2/25/2011 - 3/3/2011
This table provides daily returns of stock indices during the event period as specified above. Date(s)of actual events are marked in bold and weekends are marked in italics. “-” refers to the unavailability
of a data point. Description of indices is given in the Appendix.
Date Egypt Tunisia Jordan LebanonSaudiArabia Bahrain Dubai London
NewYork
2/25/2011 - -2.76 - -0.19 - - - 1.22 1.06
2/26/2011 - - - - - - - - -
2/27/2011 - - - - - - - - -
2/28/2011 - - -1.03 -0.16 -0.40 -3.83 - -
3/1/2011 - - 0.56 0.17 -6.78 -0.45 1.00 -0.71 -1.57
3/2/2011 - - -1.34 -0.56 -3.89 -1.02 -3.53 -0.04 0.16
3/3/2011 - - -0.87 0.31 - -2.30 -1.61 1.02 1.72
Figure 5(d). Daily Returns: 2/25/2011 – 3/3/2011. Dotted lines signify key events. Points at 0 signifyunavailable data point. Data is from Bloomberg.
-8.00
-7.00
-6.00
-5.00
-4.00
-3.00
-2.00
-1.00
0.00
1.00
2.00
3.00
2/25/2011 2/26/2011 2/27/2011 2/28/2011 3/1/2011 3/2/2011 3/3/2011
Egypt Tunisia Jordan Lebanon Saudi Arabia
Bahrain Dubai London New York
7/28/2019 The Wealth Effects of the 2010-2011 Arab Uprisings: A Market Model Event Study
http://slidepdf.com/reader/full/the-wealth-effects-of-the-2010-2011-arab-uprisings-a-market-model-event-study 35/50
31
Table VI (E)
Daily Returns: 3/1/2011 - 3/7/2011
This table provides daily returns of stock indices during the event period as specified above. Date(s) of
actual events are marked in bold and weekends are marked in italics. “-” refers to the unavailability of a data point. Description of indices is given in the Appendix.
Date Egypt Tunisia Jordan LebanonSaudiArabia Bahrain Dubai London
NewYork
3/1/2011 - - 0.56 0.17 -6.78 -0.45 1.00 -0.71 -1.57
3/2/2011 - - -1.34 -0.56 -3.89 -1.02 -3.53 -0.04 0.16
3/3/2011 - - -0.87 0.31 - -2.30 -1.61 1.02 1.72
3/4/2011 - - - - - - - -0.20 -0.74
3/5/2011 - - - - - - - - -
3/6/2011 - - - - 0.93 - - - -
3/7/2011 - - -0.50 - 3.26 0.10 -1.00 - -
Figure 5(e). Daily Returns: 3/1/2011 – 3/7/2011. Dotted lines signify key events. Points at 0 signifyunavailable data point. Data is from Bloomberg.
-8.00
-6.00
-4.00
-2.00
0.00
2.00
4.00
3/1/2011 3/2/2011 3/3/2011 3/4/2011 3/5/2011 3/6/2011 3/7/2011
Egypt Tunisia Jordan Lebanon Saudi Arabia
Bahrain Dubai London New York
7/28/2019 The Wealth Effects of the 2010-2011 Arab Uprisings: A Market Model Event Study
http://slidepdf.com/reader/full/the-wealth-effects-of-the-2010-2011-arab-uprisings-a-market-model-event-study 36/50
32
Table VI (F)
Daily Returns: 10/18/2011 - 10/25/2011
This table provides daily returns of stock indices during the event period as specified above. Date(s) of actualevents are marked in bold and weekends are marked in italics. “-” refers to the unavailability of a data point.
Description of indices is given in the Appendix.
Date Egypt Tunisia Jordan Lebanon SaudiArabia Bahrain Dubai London NewYork
10/18/2011 -0.78 -0.11 0.34 0.12 0.31 -0.04 -0.62 -1.00 2.04
10/19/2011 1.05 0.44 0.53 0.00 -0.71 -0.06 0.41 1.32 -1.26
10/20/2011 0.01 -0.20 0.42 -0.26 - -0.25 0.22 -1.55 0.46
10/21/2011 - 0.81 -0.06 - - - 3.05 1.88
10/22/2011 - - - - - - - - -
10/23/2011 - - - - 0.45 - - - -
10/24/2011 0.36 - -0.10 - -0.07 -0.03 -0.32 - -
Figure 5(f). Daily Returns: 10/18/2011 – 10/25/2011. Dotted lines signify key events. Points at 0 signify
unavailable data point. Data is from Bloomberg.
-2.00
-1.00
0.00
1.00
2.00
3.00
4.00
10/18/2011 10/19/2011 10/20/2011 10/21/2011 10/22/2011 10/23/2011 10/24/2011
Egypt Tunisia Jordan Lebanon Saudi Arabia
Bahrain Dubai London New York
7/28/2019 The Wealth Effects of the 2010-2011 Arab Uprisings: A Market Model Event Study
http://slidepdf.com/reader/full/the-wealth-effects-of-the-2010-2011-arab-uprisings-a-market-model-event-study 37/50
33
Table VI (G)
Daily Returns: 11/19/2011 - 11/26/2011
This table provides daily returns of stock indices during the event period as specified above. Date(s) of actual events are marked in bold and weekends are marked in italics. “-” refers to the unavailability of a
data point. Description of indices is given in the Appendix.
Date Egypt Tunisia Jordan Lebanon SaudiArabia Bahrain Dubai London NewYork
11/19/2011 - - - - -0.34 - - - -
11/20/2011 - - - - 0.13 - - - -
11/21/2011 -4.12 - -1.24 - -0.86 -1.26 -0.85 - -
11/22/2011 -4.87 0.01 -0.85 - -0.82 - -0.30 -0.33 -0.41
11/23/2011 1.06 -1.04 1.11 - -0.28 -0.56 -0.30 -2.11 -2.21
11/24/2011 1.63 -0.20 0.27 0.08 - - 0.11 -0.37 -
11/25/2011 - -0.33 - 0.01 - - - 0.30 -
Figure 5(g). Daily Returns: 11/19/2011 – 11/26/2011. Dotted lines signify key events. Points at 0signify unavailable data point. Data is from Bloomberg.
-6.00
-5.00
-4.00
-3.00
-2.00
-1.00
0.00
1.00
2.00
11/19/2011 11/20/2011 11/21/2011 11/22/2011 11/23/2011 11/24/2011 11/25/2011
Egypt Tunisia Jordan Lebanon Saudi Arabia
Bahrain Dubai London New York
7/28/2019 The Wealth Effects of the 2010-2011 Arab Uprisings: A Market Model Event Study
http://slidepdf.com/reader/full/the-wealth-effects-of-the-2010-2011-arab-uprisings-a-market-model-event-study 38/50
34
Table VII (A)
Abnormal Returns: 12/15/2010 - 12/21/2010
This table presents the abnormal returns of each of the indices considered within the 7-day event periodspecified above. Descriptions of indices are provided in the Appendix. The date(s) of the actual events
are in marked in bold and weekends are marked in italics. Abnormal returns are calculated using the
OLS market model where regression coefficients are estimated from a 30-day estimation period prior tothe event period. *, **, *** measure 10%, 5%, and 1% levels of statistical significance respectively. T-
statistics are provided in the Appendix. “-” refers to an unavailable data point.
Date Egypt Tunisia Jordan LebanonSaudi
ArabiaBahrain Dubai London
12/15/2010 -0.74 -0.02 -0.08 0.189 -0.34 - -0.55 -0.84
12/16/2010 -0.77 0.044 -0.46 - - - 0.618 -0.41
12/17/2010 - - - - - - - -0.85 **
12/18/2010 - - - - - - - -
12/19/2010 - - - - - - - -
12/20/2010 - - - - - - - -
12/21/2010 0.26 0.18 0.245 0.097 -0.02 -0.03 -0.33 0.029
Figure 6(a). Abnormal returns: 12/15/2010 – 12/21/2010. Dotted lines signify key events. Points at 0signify unavailable data points. Data is from Bloomberg.
-1.00
-0.80
-0.60
-0.40
-0.20
0.00
0.20
0.40
0.60
0.80
12/15/2010 12/16/2010 12/17/2010 12/18/2010 12/19/2010 12/20/2010 12/21/2010
Egypt Tunisia Jordan Lebanon
Saudi Arabia Bahrain Dubai London
7/28/2019 The Wealth Effects of the 2010-2011 Arab Uprisings: A Market Model Event Study
http://slidepdf.com/reader/full/the-wealth-effects-of-the-2010-2011-arab-uprisings-a-market-model-event-study 39/50
35
Table VII (B)
Abnormal Returns: 1/12/2011 - 1/18/2011
This table presents the abnormal returns of each of the indices considered within the 7-day event periodspecified above. Descriptions of indices are provided in the Appendix. The date(s) of the actual events arein marked in bold and weekends are marked in italics. Abnormal returns are calculated using the OLS
market model where regression coefficients are estimated from a 30-day estimation period prior to theevent period. *, **, *** measure 10%, 5%, and 1% levels of statistical significance respectively. T-statistics are provided in the Appendix. “-” refers to an unavailable data point.
Date Egypt Tunisia Jordan LebanonSaudi
ArabiaBahrain Dubai London
1/12/2011 -0.23 -2.55 *** -0.01 -2.97 *** -0.07 0.444 0.023 0.779
1/13/2011 0.212 -2.47 *** -0.45 -0.54 *** - 0.24 -0.15 0.476 **
1/14/2011 - 0.472 *** - 0.797 *** - - - -0.7
1/15/2011 - - - - - - - -
1/16/2011 - - - - - - - -
1/17/2011 - - - - - - - -
1/18/2011 - - - - - - - -
Figure 6(b). Abnormal returns: 1/12/2011 – 1/18/2011. Dotted lines signify key events. Points at 0
signify unavailable data points. Data is from Bloomberg.
-3.50
-3.00
-2.50
-2.00
-1.50
-1.00
-0.50
0.00
0.50
1.00
1/12/2011 1/13/2011 1/14/2011 1/15/2011 1/16/2011 1/17/2011 1/18/2011
Egypt Tunisia Jordan Lebanon
Saudi Arabia Bahrain Dubai London
7/28/2019 The Wealth Effects of the 2010-2011 Arab Uprisings: A Market Model Event Study
http://slidepdf.com/reader/full/the-wealth-effects-of-the-2010-2011-arab-uprisings-a-market-model-event-study 40/50
36
Table VII (C)
Abnormal Returns: 2/9/2011 - 2/15/2011
This table presents the abnormal returns of each of the indices considered within the 7-day event periodspecified above. Descriptions of indices are provided in the Appendix. The date(s) of the actual events are
in marked in bold and weekends are marked in italics. Abnormal returns are calculated using the OLS
market model where regression coefficients are estimated from a 30-day estimation period prior to theevent period. *, **, *** measure 10%, 5%, and 1% levels of statistical significance respectively. T-statistics are provided in the Appendix. “-” refers to an unavailable data point.
Date Egypt Tunisia Jordan LebanonSaudi
ArabiaBahrain Dubai London
2/9/2011 - 1.178 -1.02 * - 0.044 -0.17 -0.25 -0.47
2/10/2011 - -1.18 -0.75 ** - - 0.017 -0.2 -0.45
2/11/2011 - -2.01 ** - 0.036 - - - -0.26 *
2/12/2011 - - - - - - - -
2/13/2011 - - - - - - - -
2/14/2011 - - - - - - - -
2/15/2011 - - - - -0.37 n/d 0.47 0.426
Figure 6(c). Abnormal returns: 2/9/2011 – 2/15/2011. Dotted lines signify key events. Points at 0signify unavailable data points. Data is from Bloomberg.
-2.50
-2.00
-1.50
-1.00
-0.50
0.00
0.50
1.00
1.50
2/9/2011 2/10/2011 2/11/2011 2/12/2011 2/13/2011 2/14/2011 2/15/2011
Egypt Tunisia Jordan Lebanon
Saudi Arabia Bahrain Dubai London
7/28/2019 The Wealth Effects of the 2010-2011 Arab Uprisings: A Market Model Event Study
http://slidepdf.com/reader/full/the-wealth-effects-of-the-2010-2011-arab-uprisings-a-market-model-event-study 41/50
37
Table VII (D)
Abnormal Returns: 2/25/2011 - 3/3/2011
This table presents the abnormal returns of each of the indices considered within the 7-day event period specified
above. Descriptions of indices are provided in the Appendix. The date(s) of the actual events are in marked in boldand weekends are marked in italics. Abnormal returns are calculated using the OLS market model where
regression coefficients are estimated from a 30-day estimation period prior to the event period. *, **, *** measure10%, 5%, and 1% levels of statistical significance respectively. T-statistics are provided in the Appendix. “-”refers to an unavailable data point.
Date Egypt Tunisia Jordan LebanonSaudi
ArabiaBahrain Dubai London
2/25/2011 - -3.02 ** - 0.137 - - - 0.327
2/26/2011 - - - - - - - -
2/27/2011 - - - - - - - -
2/28/2011 - - - - - - - -
3/1/2011 - - 0.71 -0.16 -6.65 *** -0.19 1.751 0.661
3/2/2011 - - -1.09 -0.46 -3.69 *** -1.04 -3.32 -0.16
3/3/2011 - - -0.53 0.804 - -2.56 *** -1.89 *** -0.45 **
Figure 6(d). Abnormal returns: 2/25/2011 – 3/3/2011. Dotted lines signify key events. Points at 0signify unavailable data points. Data is from Bloomberg.
-8.00
-7.00
-6.00
-5.00
-4.00
-3.00
-2.00
-1.00
0.00
1.00
2.00
3.00
2/25/2011 2/26/2011 2/27/2011 2/28/2011 3/1/2011 3/2/2011 3/3/2011
Egypt Tunisia Jordan Lebanon
Saudi Arabia Bahrain Dubai London
7/28/2019 The Wealth Effects of the 2010-2011 Arab Uprisings: A Market Model Event Study
http://slidepdf.com/reader/full/the-wealth-effects-of-the-2010-2011-arab-uprisings-a-market-model-event-study 42/50
38
Table VII (E)
Abnormal Returns: 3/1/2011 - 3/7/2011
This table presents the abnormal returns of each of the indices considered within the 7-day event
period specified above. Descriptions of indices are provided in the Appendix. The date(s) of the actualevents are in marked in bold and weekends are marked in italics. Abnormal returns are calculated
using the OLS market model where regression coefficients are estimated from a 30-day estimation period prior to the event period. *, **, *** measure 10%, 5%, and 1% levels of statistical significancerespectively. T-statistics are pr ovided in the Appendix. “-” refers to an unavailable data point.
Date Egypt Tunisia Jordan LebanonSaudi
ArabiaBahrain Dubai London
3/1/2011 - - 0.712 -0.25 -6.45 *** -0.18 1.597 0.62
3/2/2011 - - -1.1 -0.37 -3.53 *** -0.94 -3.14 -0.2
3/3/2011 - - -0.55 1.04 - -2.4 *** -1.4 * -0.49
3/4/2011 - - - - - - - 0.42
3/5/2011 - - - - - - - -0.02
3/6/2011 - - - - - - - -0.02
3/7/2011 - - - - - - - 0.17
Figure 6(e). Abnormal returns: 3/1/2011 – 3/7/2011. Dotted lines signify key events. Points at 0 signifyunavailable data points. Data is from Bloomberg.
-7.00
-6.00
-5.00
-4.00
-3.00
-2.00
-1.00
0.00
1.00
2.00
3/1/2011 3/2/2011 3/3/2011 3/4/2011 3/5/2011 3/6/2011 3/7/2011
Egypt Tunisia Jordan Lebanon
Saudi Arabia Bahrain Dubai London
7/28/2019 The Wealth Effects of the 2010-2011 Arab Uprisings: A Market Model Event Study
http://slidepdf.com/reader/full/the-wealth-effects-of-the-2010-2011-arab-uprisings-a-market-model-event-study 43/50
39
Table VII (F)
Abnormal Returns: 10/18/2011 - 10/24/2011
This table presents the abnormal returns of each of the indices considered within the 7-day event periodspecified above. Descriptions of indices are provided in the Appendix. The date(s) of the actual eventsare in marked in bold and weekends are marked in italics. Abnormal returns are calculated using theOLS market model where regression coefficients are estimated from a 30-day estimation period prior to
the event period. *, **, *** measure 10%, 5%, and 1% levels of statistical significance respectively. T-statistics are provided in the Appendix. “-” refers to an unavailable data point.
Date Egypt Tunisia Jordan LebanonSaudi
ArabiaBahrain Dubai London
10/18/2011 -0.62 -0.17 0.698 0.259 0.234 0.596 -0.16 -1.14
10/19/2011 0.952 0.469 0.307 -0.09 -0.66 -0.45 0.126 1.404
10/20/2011 0.049 -0.22 0.499 -0.23 - -0.11 0.322 -1.58
10/21/2011 - 0.756 0.328 0.076 - - - 2.922
10/22/2011 - - - - - - - -
10/23/2011 - - - - - - - -
10/24/2011 - - - - - - - -
Figure 6(f). Abnormal returns: 10/18/2011 – 10/24/2011. Dotted lines signify key events. Points at 0
signify unavailable data points. Data is from Bloomberg.
-2.00
-1.50
-1.00
-0.50
0.00
0.50
1.00
1.50
2.00
2.50
3.00
3.50
10/18/2011 10/19/2011 10/20/2011 10/21/2011 10/22/2011 10/23/2011 10/24/2011
Egypt Tunisia Jordan Lebanon
Saudi Arabia Bahrain Dubai London
7/28/2019 The Wealth Effects of the 2010-2011 Arab Uprisings: A Market Model Event Study
http://slidepdf.com/reader/full/the-wealth-effects-of-the-2010-2011-arab-uprisings-a-market-model-event-study 44/50
40
Table VII (G)
Abnormal Returns: 11/19/2011 - 11/25/2011
This table presents the abnormal returns of each of the indices considered within the 7-day event periodspecified above. Descriptions of indices are provided in the Appendix. The date(s) of the actual events
are in marked in bold and weekends are marked in italics. Abnormal returns are calculated using the
OLS market model where regression coefficients are estimated from a 30-day estimation period prior tothe event period. *, **, *** measure 10%, 5%, and 1% levels of statistical significance respectively. T-
statistics are provided in the Appendix. “-” refers to an unavailable data point.
Date Egypt Tunisia Jordan LebanonSaudi
ArabiaBahrain Dubai London
11/19/2011 - - - - - - - -
11/20/2011 - - - - - - - -
11/21/2011 - - - - - - - -
11/22/2011 -4.68 *** 0.081 -1.08 - -0.82 - -0.26 0.065
11/23/2011 1.431 ** -0.64 0.778 - -0.07 -0.66 0.021 -0.33
11/24/2011 - - - - - - - -
11/25/2011 - - - - - - - -
Figure 6(g). Abnormal returns: 11/19/2011 – 11/25/2011. Dotted lines signify key events. Points at 0signify unavailable data points. Data is from Bloomberg.
-5.00
-4.00
-3.00
-2.00
-1.00
0.00
1.00
2.00
11/19/2011 11/20/2011 11/21/2011 11/22/2011 11/23/2011 11/24/2011 11/25/2011
Egypt Tunisia Jordan Lebanon
Saudi Arabia Bahrain Dubai London
7/28/2019 The Wealth Effects of the 2010-2011 Arab Uprisings: A Market Model Event Study
http://slidepdf.com/reader/full/the-wealth-effects-of-the-2010-2011-arab-uprisings-a-market-model-event-study 45/50
41
References
Amihud, Yakov and Avi Wohl. 2004. Political news and stock prices: The case of Saddam
Hussein contracts. Journal of Banking & Finance 28.
Bittlingmayer, George. 1998. Output, stock volatility, and political uncertainty in a naturalexperiment: Germany, 1880-1940. American Finance Association 53, no. 6.
Brown, Stephen J. and Jerold B. Warner. 1984. Using daily stock returns: The case of eventstudies. Journal of Financial Economics 14, no. 3: 31.
Chen, Nai-Fu, Richard Roll, and Stephen A. Ross. 1986. Economic forces and the stock market.The Journal of Business 59, no. 3.
Cutler, David M., James M. Poterba, and Lawrence H. Summers. 1989. What moves stock
prices? Journal of Portfolio Management 15, no. 3.
Fama, Eugene F., Lawrence Fisher, Michael C. Jensen, and Richard Roll. 1969. The adjustmentof stock prices to new information. International Economic Review 10, no. 1.
Gelvin, James L. 2012. The Arab Uprisings: What everyone needs to know. New York: Oxford
University Press.
Hassan, M. Kabir, Neal C. Maroney, Hassan Monir El-Sady, and Ahmad Telfah. 2003. Countryrisk and stock market volatility, predictability, and diversification in the Middle East and
Africa. Economic Systems.
Jensen, Nathan M. and Scott Schmith. 2005. Market responses to politics: The rise of Lula and
the decline of the Brazilian stock market. Comparative Political Studies 38, no. 1245.
Kim, Harold Y. and Jianping P. Mei. 2001. What makes the stock market jump? An analysis of
political risk on Hong Kong stock returns. Journal of International Money and Finance20.
Merton, Robert C. 1980. On estimating the expected return on the market: An exploratoryinvestigation. Journal of Financial Economics 8.
Mitchell, Mark L. and Harold J. Mulherin. 1994. The impact of public information on the stock market. The Journal of Finance 49, no. 3.
Pearce, Douglas K. and V. Vance Roley. 1984. Stock prices and economic news. NBER Working Paper Series.
Schwert, G. William. 1989. Business cycles, financial crises, and stock volatility. NBER.

7/28/2019 The Wealth Effects of the 2010-2011 Arab Uprisings: A Market Model Event Study
http://slidepdf.com/reader/full/the-wealth-effects-of-the-2010-2011-arab-uprisings-a-market-model-event-study 46/50
7/28/2019 The Wealth Effects of the 2010-2011 Arab Uprisings: A Market Model Event Study
http://slidepdf.com/reader/full/the-wealth-effects-of-the-2010-2011-arab-uprisings-a-market-model-event-study 47/50
43
Appendix
Table A
Description of Stock Indices
This table provides a description of all stock indices used in this study. Closing day prices were
obtained from the Bloomberg database for the period 12/1/2010 - 12/1/2011.Country Symbol Name Profile
Egypt CASE:IND EGX 30 Index
The EGX 30 Index is a free-float capitalizationweighted index of the 30 most highly capitalized
and liquid stocks traded on the Egyptian Exchange.EGX 30 constituents are reviewed and changedtwice a year (February and August). The index wasdeveloped with a base level of 1000 as of January
1st 1998 and previously named CASE 30 Index.
Tunisia TUSISE:IND
Tunisia Stock
ExchangeTUNINDEX
The Tunis Stock Exchange TUNINDEX is a
capitalization weighted index containing equitiesfrom the TSE. This index is open to listed
companies admitted in the capital market withminimum period of quotation of one month. The
index was launched on December 31, 1997 with aninitial base level of 1000. As of January 2, 2009
the index has become a free float weighted index.
Jordan JOSMGNFF:INDAmman Stock Exchange
General Index
The ASE General Index is a free float market capweighted index of the most highly liquid and
capitalized companies traded on the First andSecond markets of the Amman Stock Exchange.
The base value is set to 1000 as end of year 1999.The index is maintained, calculated anddisseminated by the Amman Stock Exchange.
Lebanon BLOM:INDBLOM Stock Exchange
The BLOM Stock Index (BSI) is the first andleading index for the stock market in Lebanon. Itwas established on the same day the Beirut Stock
Exchange Reopened (January 22, 1996)
SaudiArabia
SASAEIDX:IND Tawadul AllShare TASI
Index
The Tadawul All Share Index (TASI) isdisseminated by the Saudi Stock Market. The
index was developed with a base value of 1000 in1985 and it was restructured on 06/30/08. Volume
in the index excludes 'small trades'. (Trades withvalue less than SAR 15000). Volume including the
'small trades' can be found in VOLTADA Index.
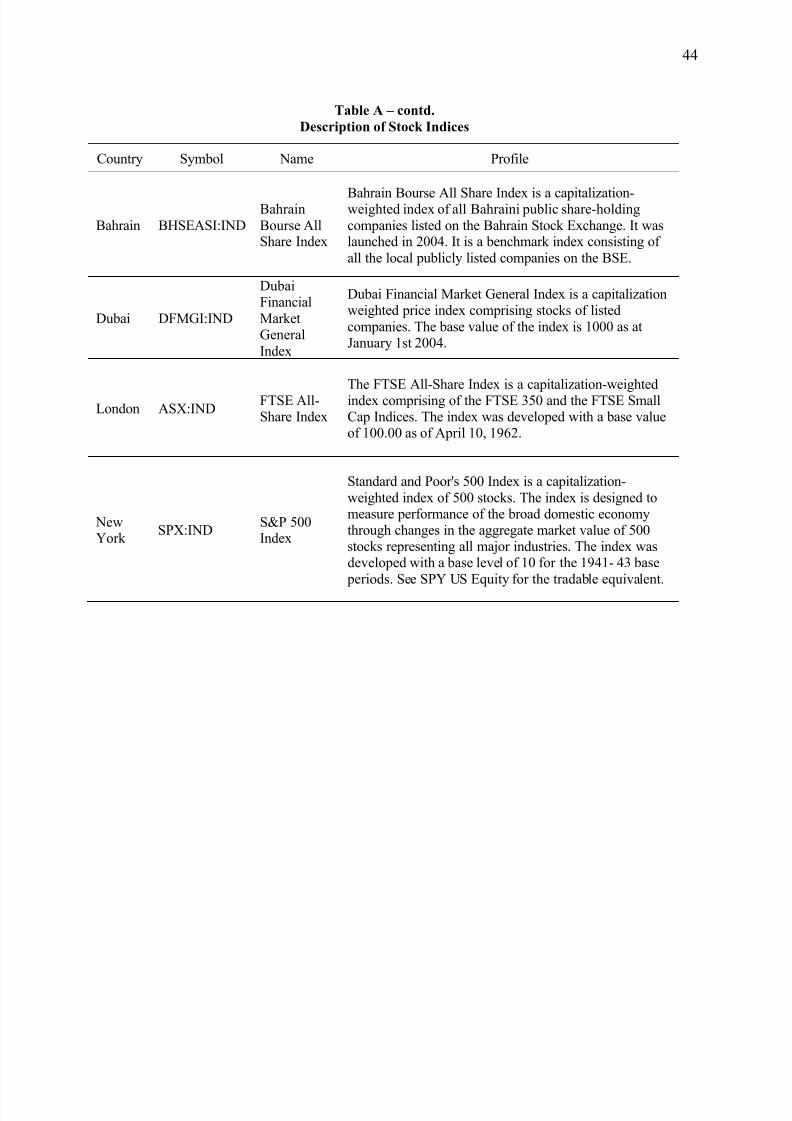
7/28/2019 The Wealth Effects of the 2010-2011 Arab Uprisings: A Market Model Event Study
http://slidepdf.com/reader/full/the-wealth-effects-of-the-2010-2011-arab-uprisings-a-market-model-event-study 48/50
44
Table A – contd.
Description of Stock Indices
Country Symbol Name Profile
Bahrain BHSEASI:IND
Bahrain
Bourse AllShare Index
Bahrain Bourse All Share Index is a capitalization-weighted index of all Bahraini public share-holding
companies listed on the Bahrain Stock Exchange. It waslaunched in 2004. It is a benchmark index consisting of
all the local publicly listed companies on the BSE.
Dubai DFMGI:IND
DubaiFinancial
MarketGeneral
Index
Dubai Financial Market General Index is a capitalizationweighted price index comprising stocks of listed
companies. The base value of the index is 1000 as atJanuary 1st 2004.
London ASX:INDFTSE All-Share Index
The FTSE All-Share Index is a capitalization-weightedindex comprising of the FTSE 350 and the FTSE SmallCap Indices. The index was developed with a base valueof 100.00 as of April 10, 1962.
NewYork
SPX:INDS&P 500Index
Standard and Poor's 500 Index is a capitalization-
weighted index of 500 stocks. The index is designed tomeasure performance of the broad domestic economythrough changes in the aggregate market value of 500stocks representing all major industries. The index wasdeveloped with a base level of 10 for the 1941- 43 base
periods. See SPY US Equity for the tradable equivalent.
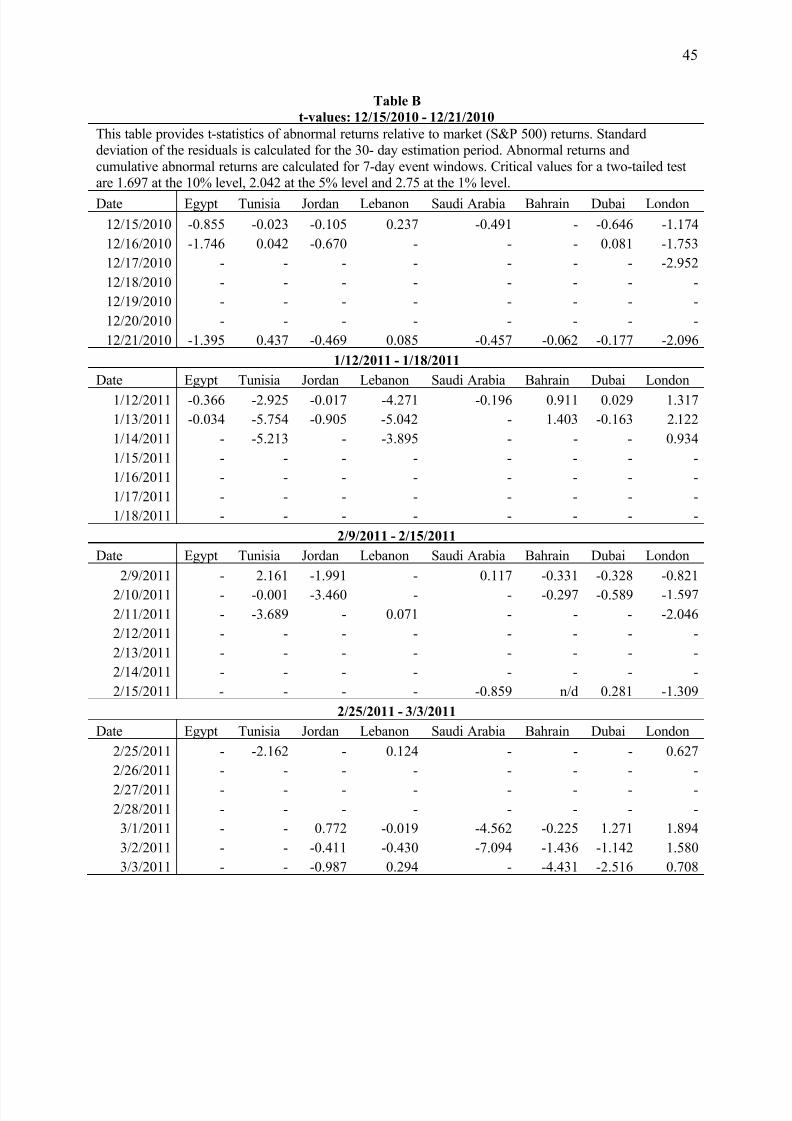
7/28/2019 The Wealth Effects of the 2010-2011 Arab Uprisings: A Market Model Event Study
http://slidepdf.com/reader/full/the-wealth-effects-of-the-2010-2011-arab-uprisings-a-market-model-event-study 49/50
45
Table B
t-values: 12/15/2010 - 12/21/2010
This table provides t-statistics of abnormal returns relative to market (S&P 500) returns. Standarddeviation of the residuals is calculated for the 30- day estimation period. Abnormal returns and
cumulative abnormal returns are calculated for 7-day event windows. Critical values for a two-tailed testare 1.697 at the 10% level, 2.042 at the 5% level and 2.75 at the 1% level.
Date Egypt Tunisia Jordan Lebanon Saudi Arabia Bahrain Dubai London
12/15/2010 -0.855 -0.023 -0.105 0.237 -0.491 - -0.646 -1.174
12/16/2010 -1.746 0.042 -0.670 - - - 0.081 -1.753
12/17/2010 - - - - - - - -2.952
12/18/2010 - - - - - - - -
12/19/2010 - - - - - - - -
12/20/2010 - - - - - - - -
12/21/2010 -1.395 0.437 -0.469 0.085 -0.457 -0.062 -0.177 -2.096
1/12/2011 - 1/18/2011
Date Egypt Tunisia Jordan Lebanon Saudi Arabia Bahrain Dubai London
1/12/2011 -0.366 -2.925 -0.017 -4.271 -0.196 0.911 0.029 1.317
1/13/2011 -0.034 -5.754 -0.905 -5.042 - 1.403 -0.163 2.122
1/14/2011 - -5.213 - -3.895 - - - 0.934
1/15/2011 - - - - - - - -
1/16/2011 - - - - - - - -
1/17/2011 - - - - - - - -
1/18/2011 - - - - - - - -
2/9/2011 - 2/15/2011
Date Egypt Tunisia Jordan Lebanon Saudi Arabia Bahrain Dubai London
2/9/2011 - 2.161 -1.991 - 0.117 -0.331 -0.328 -0.821
2/10/2011 - -0.001 -3.460 - - -0.297 -0.589 -1.597
2/11/2011 - -3.689 - 0.071 - - - -2.046
2/12/2011 - - - - - - - -
2/13/2011 - - - - - - - -
2/14/2011 - - - - - - - -
2/15/2011 - - - - -0.859 n/d 0.281 -1.309
2/25/2011 - 3/3/2011
Date Egypt Tunisia Jordan Lebanon Saudi Arabia Bahrain Dubai London
2/25/2011 - -2.162 - 0.124 - - - 0.627
2/26/2011 - - - - - - - -
2/27/2011 - - - - - - - -
2/28/2011 - - - - - - - -
3/1/2011 - - 0.772 -0.019 -4.562 -0.225 1.271 1.894
3/2/2011 - - -0.411 -0.430 -7.094 -1.436 -1.142 1.580
3/3/2011 - - -0.987 0.294 - -4.431 -2.516 0.708
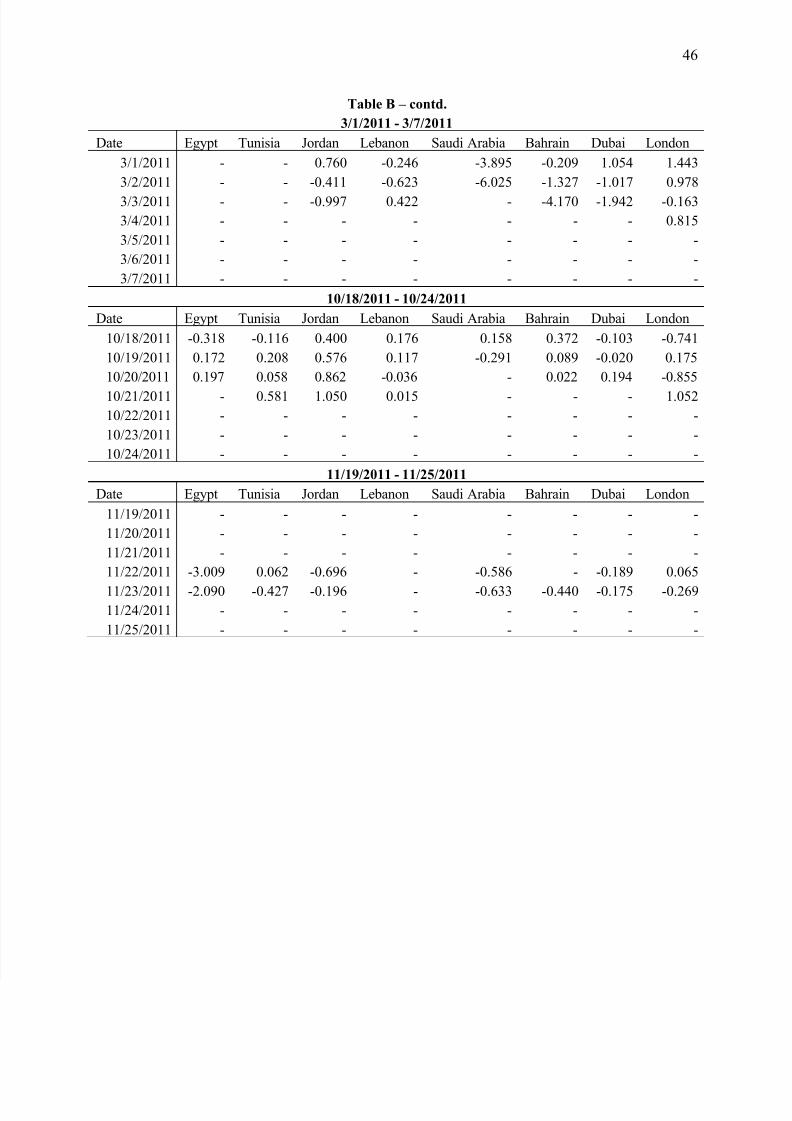
7/28/2019 The Wealth Effects of the 2010-2011 Arab Uprisings: A Market Model Event Study
http://slidepdf.com/reader/full/the-wealth-effects-of-the-2010-2011-arab-uprisings-a-market-model-event-study 50/50
46
Table B – contd.
3/1/2011 - 3/7/2011
Date Egypt Tunisia Jordan Lebanon Saudi Arabia Bahrain Dubai London
3/1/2011 - - 0.760 -0.246 -3.895 -0.209 1.054 1.443
3/2/2011 - - -0.411 -0.623 -6.025 -1.327 -1.017 0.978
3/3/2011 - - -0.997 0.422 - -4.170 -1.942 -0.163
3/4/2011 - - - - - - - 0.815
3/5/2011 - - - - - - - -
3/6/2011 - - - - - - - -
3/7/2011 - - - - - - - -
10/18/2011 - 10/24/2011
Date Egypt Tunisia Jordan Lebanon Saudi Arabia Bahrain Dubai London
10/18/2011 -0.318 -0.116 0.400 0.176 0.158 0.372 -0.103 -0.741
10/19/2011 0.172 0.208 0.576 0.117 -0.291 0.089 -0.020 0.175
10/20/2011 0.197 0.058 0.862 -0.036 - 0.022 0.194 -0.855
10/21/2011 - 0.581 1.050 0.015 - - - 1.052
10/22/2011 - - - - - - - -
10/23/2011 - - - - - - - -
10/24/2011 - - - - - - - -
11/19/2011 - 11/25/2011
Date Egypt Tunisia Jordan Lebanon Saudi Arabia Bahrain Dubai London
11/19/2011 - - - - - - - -
11/20/2011 - - - - - - - -
11/21/2011 - - - - - - - -
11/22/2011 -3.009 0.062 -0.696 - -0.586 - -0.189 0.065
11/23/2011 -2.090 -0.427 -0.196 - -0.633 -0.440 -0.175 -0.26911/24/2011 - - - - - - - -
11/25/2011 - - - - - - - -