Embed Size (px)
Citation preview

Item # MKT79863-00.indd Job # Page #
CS21276-01 1 of 19
Spellcheck: YesColor Seps: NoFold Dummy: No
Round 3 Last Modified 4-30-2014 10:32 AM
TEAM
StudioPrev. Studio
Pitalo, MichaelPitalo, Michael
SET
up
Bleed None
CONTE
NT
Placed Graphics Inks
LOG-CSRtlPrf-TgLnRght-2995U.eps (42%) Shutter_60495253-S.tif (CMYK; 357 ppi, 363 ppi; 83.92%, 82.51%)
Cyan Magenta Yellow Black PMS 2995 U
Traffic Mgr. Lauren Green Trim 8.5” x 11”
Art Director Kevin Nitsos Live None
Acct. Mgr. Gary Holloway Fonts Charles Modern (Regular, Light; True Type)
Graphics --
DETA
ILS Job Type PDF Only
Mech Scale 100%
Output Size None
Schwab Center for Financial Research
The wealth-building power of equities and the elegance of indexing.

Item # MKT79863-00.indd Job # Page #
CS21276-01 2 of 19
Spellcheck: YesColor Seps: NoFold Dummy: No
Round 3 Last Modified 4-30-2014 10:32 AM
TEAM
StudioPrev. Studio
Pitalo, MichaelPitalo, Michael
SET
up
Bleed None
CONTE
NT
Placed Graphics Inks
None Magenta Yellow Black PMS 2995 U
Traffic Mgr. Lauren Green Trim 8.5” x 11”
Art Director Kevin Nitsos Live None
Acct. Mgr. Gary Holloway Fonts Charles Modern (Bold, Regular; True Type)
Graphics --
DETA
ILS Job Type PDF Only
Mech Scale 100%
Output Size None
2
Why Invest?
I have always believed that investing is the best way for people to participate in
the growth of the world’s economies and potentially build wealth. Of course, we
also participate through our jobs and the earnings that come from our work. But
for most of us, stock investing is the means to participate—as owners—in the
growth of companies that make up the global economy.
Companies are built to grow
Stocks, or “equities,” as they are also called, are shares of ownership in
companies and are the foundation of investing. All companies are motivated to
grow, and stock ownership is the opportunity for individuals to participate in that
growth. Other types of investments certainly provide their own benefits, but they
may not be solely oriented toward increasing in value: For example, you might
invest in bonds to lend stability and income to your portfolio; or in real estate, in
order to earn rent or have a tangible asset. Only companies are built to grow.
In fact, a company’s board of directors will demand that it grow over time;
otherwise, management risks being replaced. Over my career, I have been
fortunate to serve on numerous boards of both public and private companies. In
each case, we held management responsible for growing the business. As much
as we may like a CEO personally, our goal is to make sure that a given leader is
capable of growing a company and increasing shareholder value.
This process has led to many success stories in the market. Apple started by
making one computer in 1976, and today produces hundreds of millions of
consumer electronic devices. McDonald’s started with one store and now has
over 30,000 locations. Of course, not all companies grow; some fail—Lehman
Brothers and Blockbuster Video are two recent examples that come to mind.
However, over the long run, investing in companies has proven a time-tested way
to grow one’s wealth.
The challenge for the investor is determining which stock to buy. Investors can
choose to buy shares in individual companies. However, not everyone can take
the time to research a company, analyze its balance sheet, and determine
whether it is fairly priced in the market. This is challenging, difficult work that
even seasoned professionals often struggle to do successfully and consistently.
A message from
Charles Schwab,
Founder and Chairman

Item # MKT79863-00.indd Job # Page #
CS21276-01 3 of 19
Spellcheck: YesColor Seps: NoFold Dummy: No
Round 3 Last Modified 4-30-2014 10:32 AM
TEAM
StudioPrev. Studio
Pitalo, MichaelPitalo, Michael
SET
up
Bleed None
CONTE
NT
Placed Graphics Inks
SIG-Charles.R.Schwab-BLK.tif (Gray; 355 ppi; 84.38%)
Black PMS 2995 UTraffic Mgr. Lauren Green Trim 8.5” x 11”
Art Director Kevin Nitsos Live None
Acct. Mgr. Gary Holloway Fonts Charles Modern (Bold, Regular; True Type)
Graphics --
DETA
ILS Job Type PDF Only
Mech Scale 100%
Output Size None
3
The sophistication of indexing
For those of us without the time or interest to do research, one of the most
effective strategies to gain exposure to the growth power of companies is using
mutual funds and exchange-traded funds (ETFs) to own a basket of companies.
And the most brilliant approach to that, from my perspective, is index investing.
I believe indexing is unfairly perceived as unsophisticated. The industry often
refers to indexing as “passive” because index funds follow a stock index, as
opposed to actively managed funds, which have an individual manager who
chooses securities based on his or her professional assessment of their potential
for investment returns. As you’ll see in the following report, the word passive
does a disservice to investors considering their options. Indexing provides an
effective means of owning the market and allows investors to participate in the
returns of a basket of stocks. The basket of stocks changes over time as stocks
are added or removed based on its rules.
Academic research shows how difficult it is for active managers to consistently
outperform their benchmarks over the long term, especially when factoring in the
impact of fees. In contrast, index investing typically aims for market-based results
and doesn’t deviate from a predetermined methodology. It removes the emotions
that often hinder active management. For all these reasons, index funds can be
an important tool for both new and experienced investors and often form the core
of a well-diversified portfolio. And there are a variety of indexing approaches,
from so-called market-cap-weighted strategies that adjust stock exposure based
on companies’ capitalization to fundamental strategies that track changes in
earnings, revenue, and other fundamental or economic measures.
It’s generally expected that companies will grow and increase in value, and that
the potential growth will be available to those who invest in them. That’s why I
launched the Schwab 1000 Index®, and the mutual fund based on it, in 1991—to
give investors a lower-cost, diversified option to invest in stock.
Sometimes the most straightforward and simple approach is best. I invite you to
learn more about the power of indexing—and the rich variety of approaches it can
take—in the following report by the Schwab Center for Financial Research.
Charles R. Schwab, Founder and Chairman

Item # MKT79863-00.indd Job # Page #
CS21276-01 4 of 19
Spellcheck: YesColor Seps: NoFold Dummy: No
Round 3 Last Modified 4-30-2014 10:32 AM
TEAM
StudioPrev. Studio
Pitalo, MichaelPitalo, Michael
SET
up
Bleed None
CONTE
NT
Placed Graphics Inks
None Black PMS 2995 UTraffic Mgr. Lauren Green Trim 8.5” x 11”
Art Director Kevin Nitsos Live None
Acct. Mgr. Gary Holloway Fonts Charles Modern (Bold, Regular, Italic; True Type)
Graphics --
DETA
ILS Job Type PDF Only
Mech Scale 100%
Output Size None
4
Many investors lack the time or the expertise to determine
which specific stocks—or bonds or other investments—they
should hold in their portfolio. In addition, they may not have
enough money on hand to sufficiently spread out their risk
by holding a large number of different securities across
sectors, industries, and companies.
Key Points
• Indexfundsprovidethebenefitofdiversificationinasingleinvestment vehicle, eliminating the challenge of evaluating individual securities.
• Index funds help take the emotion out of investing. They follow disciplined, rules-based methodologies, staying committed to their strategy and remaining invested through up and down markets.
• Index funds tend to be more cost effective and more tax efficientthanactivelymanagedmutualfunds.
Item # MKT79863-00.indd Job # Page #
CS21276-01 5 of 19
Spellcheck: YesColor Seps: NoFold Dummy: No
Round 3 Last Modified 4-30-2014 10:32 AM
TEAM
StudioPrev. Studio
Pitalo, MichaelPitalo, Michael
SET
up
Bleed None
CONTE
NT
Placed Graphics Inks
ILL-ProperDiversification-MIX.eps (69%) Cyan Magenta Yellow Black PMS 2995 U
Traffic Mgr. Lauren Green Trim 8.5” x 11”
Art Director Kevin Nitsos Live None
Acct. Mgr. Gary Holloway Fonts Charles Modern (Bold, Regular, Italic; True Type)
Graphics --
DETA
ILS Job Type PDF Only
Mech Scale 100%
Output Size None
5
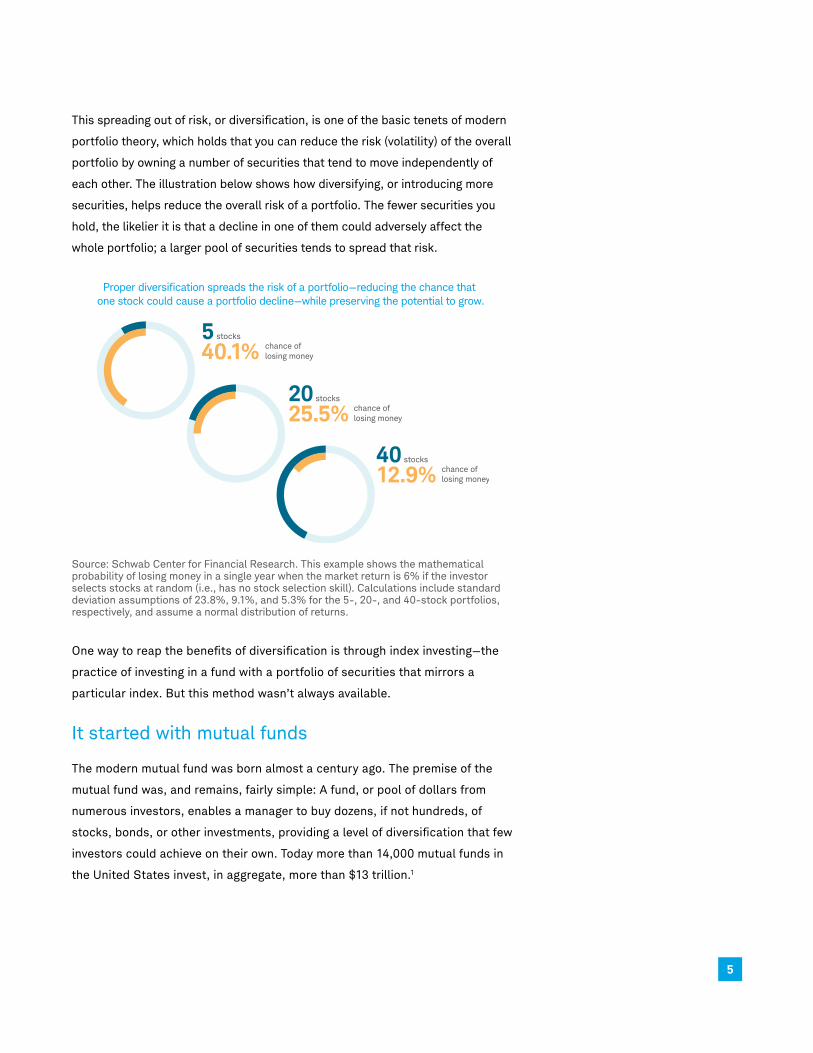
This spreading out of risk, or diversification, is one of the basic tenets of modern
portfolio theory, which holds that you can reduce the risk (volatility) of the overall
portfolio by owning a number of securities that tend to move independently of
each other. The illustration below shows how diversifying, or introducing more
securities, helps reduce the overall risk of a portfolio. The fewer securities you
hold, the likelier it is that a decline in one of them could adversely affect the
whole portfolio; a larger pool of securities tends to spread that risk.
5 stocks
40.1% chance of losing money
20 stocks
25.5% chance of losing money
40 stocks
12.9% chance of losing money
Proper diversification spreads the risk of a portfolio—reducing the chance that one stock could cause a portfolio decline—while preserving the potential to grow.
Source: Schwab Center for Financial Research. This example shows the mathematical probability of losing money in a single year when the market return is 6% if the investor selects stocks at random (i.e., has no stock selection skill). Calculations include standard deviation assumptions of 23.8%, 9.1%, and 5.3% for the 5-, 20-, and 40-stock portfolios, respectively, and assume a normal distribution of returns.
One way to reap the benefits of diversification is through index investing—the
practice of investing in a fund with a portfolio of securities that mirrors a
particular index. But this method wasn’t always available.
It started with mutual funds
The modern mutual fund was born almost a century ago. The premise of the
mutual fund was, and remains, fairly simple: A fund, or pool of dollars from
numerous investors, enables a manager to buy dozens, if not hundreds, of
stocks, bonds, or other investments, providing a level of diversification that few
investors could achieve on their own. Today more than 14,000 mutual funds in
the United States invest, in aggregate, more than $13 trillion.1

Item # MKT79863-00.indd Job # Page #
CS21276-01 6 of 19
Spellcheck: YesColor Seps: NoFold Dummy: No
Round 3 Last Modified 4-30-2014 10:32 AM
TEAM
StudioPrev. Studio
Pitalo, MichaelPitalo, Michael
SET
up
Bleed None
CONTE
NT
Placed Graphics Inks
ILL-IndexFundETFFlows-MIX.eps (68.58%) Cyan Magenta Yellow Black PMS 2995 U
Traffic Mgr. Lauren Green Trim 8.5” x 11”
Art Director Kevin Nitsos Live None
Acct. Mgr. Gary Holloway Fonts Charles Modern (Bold, Regular, Italic; True Type)
Graphics --
DETA
ILS Job Type PDF Only
Mech Scale 100%
Output Size None
6
From the 1920s through the 1960s, all mutual funds were “actively managed,”
which means a portfolio manager or a team of investors sifts through potential
investments to identify and invest in those they believe will be the best fit to
achieve the fund’s overall objective.
Indexing 1.0
In 1971, the pension fund of the luggage manufacturer Samsonite Company
invested $6 million in a new type of mutual fund called an “index fund.” These
funds, sometimes referred to as “passive” to differentiate them from actively
managed funds, aim to mirror the performance of a particular index, like the
S&P 500® Index, Japan’s Nikkei 225 Index, London’s FTSE 100 Index, or the
Barclays U.S. Aggregate Bond Index.
Designed chiefly to provide investors with broad exposure to various segments
of the market, index investing has evolved markedly over the years, taking a
quantum leap forward in the 1990s with the advent of exchange-traded funds,
or ETFs. These funds have helped democratize investing, allowing individuals to
invest in scores of markets and investment opportunities—from traditional
domestic stock and bond investments to emerging market bonds, currencies,
commodities, and sophisticated investment strategies.
The wave of innovation within index investing hasn’t abated. But before we look
at the new developments in index funds, it’s important to understand what
makes these funds so appealing.
Active funds Index funds and ETFs
2000 2001 2002 2003 2004 2005 2006 2007 2008 2009 2010 2011 2012 2013
–$250
–$150
–$50
0
$50
$150
$250
$350
Bill
ions
In recent years, index fund and ETF flows have outpaced active fund flows.
Source: Strategic Insight as of 12/31/13. Money market funds not included.
The wave of innovation
within index investing
hasn’t abated.

Item # MKT79863-00.indd Job # Page #
CS21276-01 7 of 19
Spellcheck: YesColor Seps: NoFold Dummy: No
Round 3 Last Modified 4-30-2014 10:32 AM
TEAM
StudioPrev. Studio
Pitalo, MichaelPitalo, Michael
SET
up
Bleed None
CONTE
NT
Placed Graphics Inks
ILL-ShareAssetsIndexed-MIX.eps (69.02%) Cyan Magenta Yellow Black PMS 2995 U
Traffic Mgr. Lauren Green Trim 8.5” x 11”
Art Director Kevin Nitsos Live None
Acct. Mgr. Gary Holloway Fonts Charles Modern (Bold, Regular, Italic; True Type)
Graphics --
DETA
ILS Job Type PDF Only
Mech Scale 100%
Output Size None
7
Index MF assetsActive MF assets Index ETF assets
Tota
l ass
ets
(bill
ions
)
$0
$3,000
$6,000
$9,000
$12,000
$15,000
2000 2001 2002 2003 2004 2005 2006 2007 2008 2009 2010 2011 2012 2013
The share of assets invested in index funds is growing.
Source: Investment Company Institute and Morningstar.
Why index funds?
Index funds let you participate in the growth of the economy in a very
straightforward way: The U.S. market has grown over time, so the indexes that
follow it have risen in tandem.
Take as an example the Schwab 1000 Index® Fund, which tracks the Schwab
1000 Index, Schwab’s proprietary index comprising the largest 1,000 U.S.
companies. Since it commenced operations in 1991, the fund’s share price has
grown an average of 9.4% annually. Put another way, $10,000 invested in the
Schwab 1000 Index Fund at launch and left untouched would be worth more
than $70,000 today.

Item # MKT79863-00.indd Job # Page #
CS21276-01 8 of 19
Spellcheck: YesColor Seps: NoFold Dummy: No
Round 3 Last Modified 4-30-2014 10:32 AM
TEAM
StudioPrev. Studio
Pitalo, MichaelPitalo, Michael
SET
up
Bleed None
CONTE
NT
Placed Graphics Inks
ILL-S1000Growth-MIX.eps (68.87%) Cyan Magenta Yellow Black PMS 2995 U
Traffic Mgr. Lauren Green Trim 8.5” x 11”
Art Director Kevin Nitsos Live None
Acct. Mgr. Gary Holloway Fonts Charles Modern (Bold, Regular, Italic; True Type)
Graphics --
DETA
ILS Job Type PDF Only
Mech Scale 100%
Output Size None
8
Annualized Performance as of 3/31/14Schwab 1000 Index FundSchwab 1000 IndexRussell 1000 TR USD
1 Year22.0%22.4%22.2%
5 Year21.2%21.6%21.7%
10 Year7.5%7.8%7.8%
Since 4/2/919.4%9.8%9.8%
$0
$10,000
$20,000
$30,000
$40,000
$50,000
$60,000
$70,000
$80,000
91 92 93 94 95 96 97 98 99 00 01 02 03 04 05 06 07 08 09 10 11 12 13
Since 1991, the Schwab 1000 Index® Fund has cumulatively grown over 700%. Growth of $10,000 invested in Schwab 1000 Index Fund (4/2/1991–3/31/2014)
Source: Schwab Center for Financial Research. Data as of March 31, 2014. Includes the impact of fees and expenses, as well as reinvestment of dividends and capital gains. Past performance is no guarantee of future results. See appendix for year-end performance and Schwab.com for most recent performance information.
An index is a broad basket of securities that is designed to be representative of
a market segment. The indexes will adjust over time through two practices:
reconstitution and rebalancing.
• Reconstitution is when securities are added to or deleted from an index.
• Rebalancing is when the securities’ weights are adjusted in an index.
Index investing is a straightforward way to track the market. It is also generally
a more tax-efficient approach than actively managed mutual funds. Active
funds tend to have higher turnover than index funds—their managers
continuously buy and sell securities in an attempt to beat the market, rather
than invest according to a set schedule of reconstitution and/or rebalancing.
Without that frequent buying and selling, there are fewer occasions to realize
capital gains.
Similarly, ETFs are often touted for their tax efficiency, which stems from
their generally lower turnover rates and structural advantages compared to
mutual funds.
The U.S. market has
grown over time, so the
indexes that follow it
have risen in tandem.

Item # MKT79863-00.indd Job # Page #
CS21276-01 9 of 19
Spellcheck: YesColor Seps: NoFold Dummy: No
Round 3 Last Modified 4-30-2014 10:32 AM
TEAM
StudioPrev. Studio
Pitalo, MichaelPitalo, Michael
SET
up
Bleed None
CONTE
NT
Placed Graphics Inks
ILL-FeesEatAwayReturns-MIX.eps (68%) Magenta Yellow Black PMS 2995 U
Traffic Mgr. Lauren Green Trim 8.5” x 11”
Art Director Kevin Nitsos Live None
Acct. Mgr. Gary Holloway Fonts Charles Modern (Bold, Regular, Italic; True Type)
Graphics --
DETA
ILS Job Type PDF Only
Mech Scale 100%
Output Size None
9
Index investing allows investors to obtain broad exposure to the market even if
they do not have large sums to invest. For example, the Schwab® S&P 500
Index Fund and the Schwab Total Stock Market Index Fund® both have a
minimum investment of just $100; however, fund minimums can vary widely.
And finally, there’s cost. The typical index fund has lower operating expenses
and management fees than an actively managed fund. The average cost of an
actively managed all-equity mutual fund is roughly 0.92% of assets per year.2
Index mutual funds range in cost but typically charge between 0.10% and
0.30% of assets—and the cost of the two funds mentioned above is only 0.09%.
ETFs (which often track an index) range in cost from 0.04% for traditional
market-cap exposure, to 0.75% for more esoteric strategies. This gap in fees
adds up over the life of an investment. For instance, a $100,000 portfolio
growing at 6% annually over 25 years would accumulate almost $58,000 more if
the fees were 0.25% instead of 0.90%.
0
$20,000
$30,000
$40,000
$50,000
$60,000
$10,000
Dif
fere
nce
in fe
es p
aid
25 Years20 Years15 Years10 Years5 Years
$4,015
$10,458
$20,433
$35,490
$57,794
Fees can eat away at returns.$100,000 invested in an active equity fund loses almost $58,000 to fees
over 25 years compared to an index fund
Source: Schwab Center for Financial Research. This hypothetical example is for illustrative purposes only; assumes an annualized return rate of 6%, active equity fund expense of 0.90%, and index fund expense of 0.25%; and is not representative of any specific investment or product.
Bottom line, index funds have done well on both an absolute and a relative
basis: on an absolute basis over the long term because equity markets have
grown over time, and on a relative basis because of their lower cost structures.
Indexes allow investors
to obtain broad
exposure to the market
even if they do not have
large sums to invest.

Item # MKT79863-00.indd Job # Page #
CS21276-01 10 of 19
Spellcheck: YesColor Seps: NoFold Dummy: No
Round 3 Last Modified 4-30-2014 10:32 AM
TEAM
StudioPrev. Studio
Pitalo, MichaelPitalo, Michael
SET
up
Bleed None
CONTE
NT
Placed Graphics Inks
ILL-PowerCompounding-MIX.eps (68.66%) Cyan Magenta Yellow Black PMS 2995 U
Traffic Mgr. Lauren Green Trim 8.5” x 11”
Art Director Kevin Nitsos Live None
Acct. Mgr. Gary Holloway Fonts Charles Modern (Bold, Regular, Italic; True Type)
Graphics --
DETA
ILS Job Type PDF Only
Mech Scale 100%
Output Size None
10
An old investment adage states that “it’s not timing the market, but time in the
market.” Investors often chase returns and allow their emotions to get in the
way of their investment plans. According to a Dalbar Investment Behavior
report, for the 10-year time period ending in 2012, the average equity mutual
fund investor was up 4.3% while the S&P 500® was up 8.2%. Equity investors
held on to their investments an average of 3.29 years. In other words, investors
chased returns rather than staying with their funds. They would have been
better served developing a plan and sticking to it. A straightforward way to do
that is through index investing.
The following chart shows the hypothetical gains that could have been made by
contributing $5,000 annually since the inception of the Schwab 1000 Index®
Fund—perhaps through an IRA contribution, or just as part of a systematic
investment plan. Over 22 years, an investor would have contributed $110,000
total and seen this investment grow to over $310,000.
Additional growth Amount contributed
92 93 94 95 96 97 98 99 00 01 02 03 04 05 06 07 08 09 10 11 12 13$0
$50,000
$100,000
$150,000
$200,000
$250,000
$300,000
$350,000
$310,624 total value
$110,000contributed
$200,624growth
The power of compounding. Hypothetical growth of $5,000 invested in the Schwab 1000 Index Fund
with an additional $5,000 invested at the beginning of each year (1/1/1992–12/31/2013)
Source: Schwab Center for Financial Research. The example is hypothetical and provided for illustrative purposes only. Includes the impact fees and expenses, as well as reinvestment of dividends and capital gains. Past performance is no guarantee of future results.

Item # MKT79863-00.indd Job # Page #
CS21276-01 11 of 19
Spellcheck: YesColor Seps: NoFold Dummy: No
Round 3 Last Modified 4-30-2014 10:32 AM
TEAM
StudioPrev. Studio
Pitalo, MichaelPitalo, Michael
SET
up
Bleed None
CONTE
NT
Placed Graphics Inks
ILL-ChangesS1000-MIX.eps (69%) Magenta Yellow Black PMS 2995 U
Traffic Mgr. Lauren Green Trim 8.5” x 11”
Art Director Kevin Nitsos Live None
Acct. Mgr. Gary Holloway Fonts Charles Modern (Bold, Regular, Italic; True Type)
Graphics --
DETA
ILS Job Type PDF Only
Mech Scale 100%
Output Size None
11
How an index works
Index investing often is referred to as “passive” because index funds track the
movements of an index, as opposed to actively managed funds, which have an
individual manager choosing investments. While accurate, the word “passive”
may suggest a lack of change and doesn’t fully capture the dynamic nature of
index funds. The fact is, index funds follow a rigorous methodology that
periodically alters their composition, enabling investors to participate in
important market shifts.
To illustrate this point, let’s again consider the Schwab 1000 Index®. It screens
and ranks all U.S. stocks based on their market capitalization, or the total stock
market value of their shares. It builds a portfolio containing the top 1,000
stocks in proportion to their overall value. Then, every year, it rebalances that
portfolio to account for stock splits, performance, and other corporate actions,
and re-ranks the top 1,000, ensuring that investors have exposure to the
biggest publicly traded contributors to the U.S. economy. Because the rankings
and weightings shift according to each company’s market performance, index
fund owners are essentially “making the market their manager.”
Over the course of a year, turnover within the index can translate to the entry
and exit of about 50 companies. In 2013, Facebook joined the Schwab 1000
Index, and Molycorp (whose stock had declined by about 80% since 2010) was
removed. Domino’s® Pizza entered the index in 2013, as its stock rise propelled
it into the ranks of the top 1,000 U.S. companies. Kraft Foods, spun off from
Mondelez International in 2013, also was among the new entrants in the index.
Those two companies replaced Heinz, which was acquired by a private equity
firm, and Diebold, whose market value decline drove its removal from the list.
FacebookIPO
Additions Deletions
Schwab 10001,000 largest companies, re-evaluated annually
Domino’sMarket cap
increase
Kraft FoodsSpin out
from Mondelez
DieboldMarket cap
decline
HeinzAcquired by
private equity
MolycorpMarket cap
decline
Sample changes to the Schwab 1000 in 2013.

Item # MKT79863-00.indd Job # Page #
CS21276-01 12 of 19
Spellcheck: YesColor Seps: NoFold Dummy: No
Round 3 Last Modified 4-30-2014 10:32 AM
TEAM
StudioPrev. Studio
Pitalo, MichaelPitalo, Michael
SET
up
Bleed None
CONTE
NT
Placed Graphics Inks
None Magenta Yellow Black PMS 2995 U
Traffic Mgr. Lauren Green Trim 8.5” x 11”
Art Director Kevin Nitsos Live None
Acct. Mgr. Gary Holloway Fonts Charles Modern (Bold, Regular, Italic; True Type)
Graphics --
DETA
ILS Job Type PDF Only
Mech Scale 100%
Output Size None
12
Over longer periods of time, the index’s annual turnover ensures that the portfolio
reflects the changing economy and market. We can see an example by looking
at how the composition of the Schwab 1000 Index has shifted since its launch.
Over 22 years, the Schwab 1000 Index reflects a changing economy.
Schwab 1000, 1991 Schwab 1000, 2013
Sector Share Sector Share
Consumer Discretionary 16% Information Technology 18%
Health Care 13% Financials 17%
Consumer Staples 12% Consumer Discretionary 13%
Financials 11% Health Care 12%
Information Technology 10% Industrials 11%
Energy 8% Energy 10%
Materials 8% Consumer Staples 9%
Telecommunication Services 7% Materials 4%
Utilities 7% Utilities 3%
Industrials 6% Telecommunication Services 2%
Other 1% Other 1%
Source: Charles Schwab & Co., Inc. Data as of December 31, 2013. The 1991 industry weightings for the Schwab 1000 Index Fund were determined using the fund holdings as of 12/31/1991 and translated into the current Global Industry Classification Standard (GICS). GICS was developed by and is the exclusive property of MSCI and Standard & Poor’s (S&P). GICS is a service mark of MSCI and S&P, and has been licensed for use by Charles Schwab & Co., Inc.
One significant change is the dramatic growth of the information technology
sector. This should be little surprise to investors who have followed the
emergence of companies like Google and Facebook, as well as the rapid growth
of existing companies such as Apple and Oracle. All told, the tech industry has
grown from 10% of the Schwab 1000 Index in 1991, to 18% in 2013. In fact,
today the five largest tech companies alone are worth more than $1.5 trillion—
the equivalent of about 38% of the entire U.S. stock market back in 1991.3
Long-term market performance
There’s no shortage of literature discussing the difficulty of outperforming
the market on a consistent basis. In the popular book A Random Walk Down
Wall Street, for example, Princeton economist Burton Malkiel argued that
a “blindfolded monkey” has just as good a chance of outperforming the
market as a market professional. While some individual stock pickers do
beat the market each year, data from the Schwab Center for Financial
Research illustrates how difficult it is for actively managed funds to deliver
outstanding results year after year. Our evaluation shows that between 2004
and 2013, just one equity mutual fund was able to rank in the top performance
quartile for more than seven years.

Item # MKT79863-00.indd Job # Page #
CS21276-01 13 of 19
Spellcheck: YesColor Seps: NoFold Dummy: No
Round 3 Last Modified 4-30-2014 10:32 AM
TEAM
StudioPrev. Studio
Pitalo, MichaelPitalo, Michael
SET
up
Bleed None
CONTE
NT
Placed Graphics Inks
ILL-EquityFundsTopPerformance-MIX.eps (69.36%)
Magenta Yellow Black PMS 2995 U
Traffic Mgr. Lauren Green Trim 8.5” x 11”
Art Director Kevin Nitsos Live None
Acct. Mgr. Gary Holloway Fonts Charles Modern (Bold, Regular, Italic; True Type)
Graphics --
DETA
ILS Job Type PDF Only
Mech Scale 100%
Output Size None
13
0
300
600
900
1,200
1,500
Num
ber
of f
unds
≥ 3 ≥ 4 ≥ 5 ≥ 6 ≥ 7≥ 1 ≥ 2 ≥ 8
Number of years in top quartile
1,221
953
598
305
134
415 1
It’s hard for active managers to repeat success year after year.Number of actively managed equity funds in the top performance quartile
Source: Schwab Center for Financial Research with data provided by Morningstar. The chart examines a universe of 1,320 distinct portfolios of diversified U.S. domestic equity funds with a complete 10-year history from January 2004 through December 2013. Each fund’s annual performance was ranked within a given year and placed in quartiles within its respective Morningstar style category. The annual ranking was derived by comparing the fund’s performance to the performance of all distinct, nonpassive portfolios currently placed in the category. The number of times an individual fund’s annual performance ranked in a year’s top quartile was then counted. Past performance is no indication of future results
The S&P SPIVA Persistence Scorecard, which ranks mutual fund performance,
offers similar evidence. The December 2012 report “Does Past Performance
Matter?” notes that of the 707 funds in the top performance quartile as of
September 2010, only 10% were still in the top quartile two years later. In other
words, 9 out of every 10 top performers couldn’t repeat.
This is not to suggest that active management doesn’t have a place in a well-
diversified portfolio—investors just have to devote a lot of time, energy, and
research to finding the right managers. A good active manager can adopt a more
conservative posture in rough markets and play defense. For example, when
former Fed Chairman Bernanke first discussed “tapering,” the markets fell
sharply due to concerns that the market’s catalyst was being removed. In a
situation like this, an active manager could mitigate risk in an equity portfolio by
increasing cash and/or buying more defensive companies. An index fund would
need to adhere to its rules-based discipline regardless of market conditions.
Our evaluation shows
that between 2004
and 2013, just one
equity mutual fund
was able to rank in
the top performance
quartile for more than
seven years.

Item # MKT79863-00.indd Job # Page #
CS21276-01 14 of 19
Spellcheck: YesColor Seps: NoFold Dummy: No
Round 3 Last Modified 4-30-2014 10:32 AM
TEAM
StudioPrev. Studio
Pitalo, MichaelPitalo, Michael
SET
up
Bleed None
CONTE
NT
Placed Graphics Inks
None Magenta Yellow Black PMS 2995 U
Traffic Mgr. Lauren Green Trim 8.5” x 11”
Art Director Kevin Nitsos Live None
Acct. Mgr. Gary Holloway Fonts Charles Modern (Bold, Regular, Italic; True Type)
Graphics --
DETA
ILS Job Type PDF Only
Mech Scale 100%
Output Size None
14
Active managers have greater flexibility in responding to changing market
conditions, and some have demonstrated proficiency in protecting portfolios in
difficult markets. As such, we believe that there is value in identifying active
managers who have exhibited better downside protection.
Indexing 2.0
The first phase of indexing was designed to provide exposure to virtually every
market in a cost-effective manner. Index funds and ETFs were great tools for
institutional and individual investors. With the increased demand, indexing has
evolved beyond the traditional market-capitalization approach to include a
number of new and innovative approaches.
Recent innovations in indexing aim to combine the benefits of both traditional
indexing and active fund management. One twist is fundamentally weighted
indexes, which screen and weight stocks based on a variety of economic factors,
such as a company’s adjusted sales, cash flow, and dividends plus buybacks.
Fundamental strategies sometimes are referred to as “alternative beta” or
“smart beta” because they provide broad-based market exposure (beta), and
they weight securities based on fundamental factors rather than simply
assigning the greatest weights to the largest capitalized companies.
Fundamentally weighted indexes rely on rules-based disciplines to select and
weight securities, removing the potential biases of an active manager who may
favor a particular stock because of emotional attachment to the company’s
management or a product, for example.
At Schwab, we believe that fundamental strategies are an important
evolutionary step forward in index investing because they capture many of the
positive attributes of both traditional market-cap strategies and active
management strategies. While the past is never a guarantee of future returns,
fundamentally weighted indexes have historically outperformed their market-
cap index counterparts.
Recent innovations in
indexing aim to
combine the benefits
of both traditional
indexing and active
fund management.

Item # MKT79863-00.indd Job # Page #
CS21276-01 15 of 19
Spellcheck: YesColor Seps: NoFold Dummy: No
Round 3 Last Modified 4-30-2014 10:32 AM
TEAM
StudioPrev. Studio
Pitalo, MichaelPitalo, Michael
SET
up
Bleed None
CONTE
NT
Placed Graphics Inks
None Magenta Yellow Black PMS 2995 U
Traffic Mgr. Lauren Green Trim 8.5” x 11”
Art Director Kevin Nitsos Live None
Acct. Mgr. Gary Holloway Fonts Charles Modern (Bold, Regular, Italic; True Type)
Graphics --
DETA
ILS Job Type PDF Only
Mech Scale 100%
Output Size None
15
Fundamental and market-cap indexes may hold the same companies, but at
different weights.
Russell Fundamental U.S. Large Company Index
Russell 1000® Index (Traditional Market-Cap Index)
Company Weight Company Weight
Exxon Mobil Corp. 5.0% Apple Inc. 2.8%
Chevron Corp. 2.4% Exxon Mobil Corp. 2.4%
AT&T Inc. 2.0% Microsoft Corp. 1.6%
Microsoft Corp. 1.9% Google Inc. 1.6%
ConocoPhillips 1.9% General Electric Co. 1.5%
General Electric Co. 1.6% Johnson & Johnson 1.4%
Bank of America Corp. 1.4% Chevron Corp. 1.3%
Procter & Gamble Co. 1.4% Procter & Gamble Co. 1.2%
Wal-Mart Stores Inc. 1.4% JPMorgan Chase & Co. 1.2%
JPMorgan Chase & Co. 1.3% Wells Fargo & Co. 1.2%
Source: Russell Investments. Top 10 holdings as of December 31, 2013. For illustrative purposes only. Holdings are subject to change without notice. Not a recommendation or guarantee that any company has been or will be profitable.
The Russell 1000 Index and the Russell Fundamental U.S. Large Company Index
own most of the same companies, but with different weights. The Russell 1000
Index assigns the largest weight to the largest companies based on market
capitalization, while the Russell Fundamental U.S. Large Company Index
weights securities based on fundamental factors.
This difference in weighting methodologies can lead to very different results
over time. As you can see in the table above, Apple was the most heavily
weighted component of the Russell 1000 Index in 2013, but it wasn’t even in the
top 10 of the Russell Fundamental U.S. Large Company Index. Look at the effect
of Apple’s stock price on the two indexes over the course of 2012 and 2013.

Item # MKT79863-00.indd Job # Page #
CS21276-01 16 of 19
Spellcheck: YesColor Seps: NoFold Dummy: No
Round 3 Last Modified 4-30-2014 10:32 AM
TEAM
StudioPrev. Studio
Pitalo, MichaelPitalo, Michael
SET
up
Bleed None
CONTE
NT
Placed Graphics Inks
ILL-AppleStockPrice-MIX.eps (69.07%) Cyan Magenta Yellow Black PMS 2995 U
Traffic Mgr. Lauren Green Trim 8.5” x 11”
Art Director Kevin Nitsos Live None
Acct. Mgr. Gary Holloway Fonts Charles Modern (Bold, Regular, Italic; True Type)
Graphics --
DETA
ILS Job Type PDF Only
Mech Scale 100%
Output Size None
16
–8
–6
–4
–2
0
2
4
6
8
10
12
Mon
thly
ret
urn
1/13 2/13 3/13 4/13 5/131/12 2/12 3/12 6/12 7/12 8/12 9/12 11/12 12/12
Russell 1000 TR USDRussell Fundamental U.S. Large Company TR USD
Apple’s stock price has had a disproportionate effect on market-cap indexes.
Performance 1/1/12 to 9/30/12 Apple Inc. stock �65.42%
Performance 10/1/12 to 6/30/13 Apple Inc. stock �39.54%
Source: Morningstar Direct, from January 1, 2012, to June 30, 2013.
Through the first three quarters of 2012, Apple shares gained more than 65%.
Apple was the largest company in the Russell 1000® Index, accounting for about
4% of its total value. Not surprisingly, the Russell 1000 Index outperformed the
Russell Fundamental U.S. Large Company Index over that period, by more than
1 percentage point (16.28% versus 15.13%). Over the next three quarters,
however, shares of Apple declined almost 40%, and the Russell Fundamental
U.S. Large Company Index outperformed the Russell 1000 Index by almost 4
percentage points (17.94% versus 14.04%). This is part of the reason that we
view market-cap and fundamental strategies as complements to one another.
Now, let’s compare the same Fundamental Index® to a universe of active mutual
funds. In the time period from March 2011 through December 2013, the Russell
Fundamental U.S. Large Company Index outperformed the Russell 1000 Index
by nearly 1% (16.0% versus 15.3%). During this time period, the top-quartile
active fund managers generated an annualized return of 15.1%. In other words,
the remaining 75% of active fund managers generated returns of less than
15.1%—falling short of the returns of the broad market index.4
Annualized return
Annualized standard deviation
Russell Fundamental U.S. Large Company Index 16.0% 20.5%
Russell 1000 Index 15.3% 20.7%
S&P 500® Index 15.2% 20.3%
Peer group 25th percentile 15.1% 21.4%
Peer group median 13.9% 20.5%
Peer group 75th percentile 12.3% 19.1%
Peer group: Morningstar Category Large Blend. Number of investments ranked: 1,464. Time period: March 2011–December 2013. The inception date for the Russell Fundamental Index® Series is 2/24/2011. Past performance is no guarantee of future results.
During this time
period, the top-
quartile active fund
managers generated
an annualized return
of 15.1%.

Item # MKT79863-00.indd Job # Page #
CS21276-01 17 of 19
Spellcheck: YesColor Seps: NoFold Dummy: No
Round 3 Last Modified 4-30-2014 10:32 AM
TEAM
StudioPrev. Studio
Pitalo, MichaelPitalo, Michael
SET
up
Bleed None
CONTE
NT
Placed Graphics Inks
None Black PMS 2995 UTraffic Mgr. Lauren Green Trim 8.5” x 11”
Art Director Kevin Nitsos Live None
Acct. Mgr. Gary Holloway Fonts Charles Modern (Bold, Regular, Italic, Condensed Regular; True Type)
Graphics --
DETA
ILS Job Type PDF Only
Mech Scale 100%
Output Size None
17
What should investors do?
We believe that active management, market-cap, and fundamental strategies
each have their own investment merits, and that they all deserve a place in a
well-diversified portfolio:
• Active management offers the potential to outperform a given market and
may be particularly useful for potential downside protection;
• Market-cap index investing offers diversification and cost-effective exposure
to virtually every segment of the market;
• Fundamentally weighted strategies capture many of the positive attributes
of both traditional market-capitalization indexing and active management, and
have historically delivered excess returns relative to market-cap strategies.
At Schwab, we see index-based strategies forming the core of investors’
portfolios. Index investing offers a simple yet highly effective way to participate
in the growth of the global economy—allowing individual investors to diversify,
gain market exposure, and maybe even capture greater growth potential as part
of their overall investment strategy.
1 2013 Investment Company Fact Book.2 2013 Investment Company Fact Book.3 Total U.S. market capitalization of $4 trillion in 1991. Source: World Bank.4 Schwab Center for Financial Research, using the Morningstar Large Blend Universe of 1,464 mutual funds.

Item # MKT79863-00.indd Job # Page #
CS21276-01 18 of 19
Spellcheck: YesColor Seps: NoFold Dummy: No
Round 3 Last Modified 4-30-2014 10:32 AM
TEAM
StudioPrev. Studio
Pitalo, MichaelPitalo, Michael
SET
up
Bleed None
CONTE
NT
Placed Graphics Inks
ILL-CumulativeExcessLoss-MIX.eps (68.93%) Magenta Yellow Black PMS 2995 U
Traffic Mgr. Lauren Green Trim 8.5” x 11”
Art Director Kevin Nitsos Live None
Acct. Mgr. Gary Holloway Fonts Charles Modern (Bold, Regular; True Type)
Graphics --
DETA
ILS Job Type PDF Only
Mech Scale 100%
Output Size None
18
Appendix
Long-term returns of select indexes
Through December 31, 2013 1 Year 3 Year 5 Year 10 Year 20 Year 40 Year Year of Inception
Russell Fundamental US LC TR USD 34.92% 17.45% – – – – 2011
FTSE RAFI U.S. 1000 TR USD 35.66% 16.75% 22.07% – – – 2005
Schwab 1000 Index® 33.04% 16.13% 18.51% 7.83% 9.44% – 1991
Russell 1000 TR USD 33.11% 16.30% 18.59% 7.78% 9.38% – 1978
S&P 500 TR USD 32.39% 16.18% 17.94% 7.41% 9.22% 10.98% 1970
The power of compounding: Hypothetical growth of $5,000 invested in the Schwab 1000 Index Fund in 1992, with $5,000 additionally invested at the start of each year
1992 1993 1994 1995 1996 1997
Total amount contributed $5,000.00 $10,000.00 $15,000.00 $20,000.00 $25,000.00 $30,000.00
Additional growth $426.00 $1,430.02 $1,411.95 $9,248.72 $16,639.60 $31,526.96
1998 1999 2000 2001 2002 2003
Total amount contributed $35,000.00 $40,000.00 $45,000.00 $50,000.00 $55,000.00 $60,000.00
Additional growth $49,595.68 $68,410.78 $59,099.75 $45,724.12 $24,380.68 $48,631.69
2004 2005 2006 2007 2008 2009
Total amount contributed $65,000.00 $70,000.00 $75,000.00 $80,000.00 $85,000.00 $90,000.00
Additional growth $60,926.64 $68,847.70 $90,712.55 $100,545.59 $31,374.19 $64,970.57
2010 2011 2012 2013
Total amount contributed $95,000.00 $100,000.00 $105,000.00 $110,000.00
Additional growth $90,501.87 $92,921.25 $124,133.43 $200,624.82
Returns lost to taxes
2003 2004 2005 2006 2007 2008 2009 2010 2011 2012 2013$0
$500
$1,000
$1,500
$2,000
$2,500
$3,000
$2,823
$2,410
$2,037
$1,701
$1,397
$1,125
$880
$662
$466
$292$137
Over time, returns lost to taxes add up.$100,000 invested in an active equity fund loses over $2,800 to taxes
over 10 years compared to an index equity fund
Source: Charles Schwab Investment Advisory, Inc. This hypothetical example assumes a return rate of 6%, active equity fund expense of 0.90%, and index equity fund expense of 0.25%.

Item # MKT79863-00.indd Job # Page #
CS21276-01 19 of 19
Spellcheck: YesColor Seps: NoFold Dummy: No
Round 3 Last Modified 4-30-2014 10:32 AM
TEAM
StudioPrev. Studio
Pitalo, MichaelPitalo, Michael
SET
up
Bleed None
CONTE
NT
Placed Graphics Inks
LOG-CSRtlPrf-TgLnRght-2995U.eps (42%) Black PMS 2995 UTraffic Mgr. Lauren Green Trim 8.5” x 11”
Art Director Kevin Nitsos Live None
Acct. Mgr. Gary Holloway Fonts Charles Modern (Regular, Bold; True Type)
Graphics --
DETA
ILS Job Type PDF Only
Mech Scale 100%
Output Size None
©2014 Charles Schwab & Co., Inc. All rights reserved. Member SIPC.CS21276-01 (0414-1632) MKT79863-00 (04/14) 00113950
Important Disclosures
For funds, investors should carefully consider information contained in the prospectus, including investment objectives, risks, charges, and expenses. You can request a prospectus by visiting Schwab.com or calling Schwab at 800-435-4000. Please read the prospectus carefully before investing. Past performance is no guarantee of future results. All expressions of opinion are subject to change without notice in reaction to shifting market conditions. Data here is obtained from what are considered reliable sources; however, its accuracy, completeness, or reliability cannot be guaranteed.
The information here is for general informational purposes only and should not be considered an individualized recommendation or personalized investment advice. The type of securities and investment strategies mentioned may not be suitable for everyone. Each investor needs to review a security transaction for his or her own particular situation.
Diversification strategies do not ensure a profit and do not protect against losses in declining markets.
Indexes are unmanaged, do not incur management fees, costs, and expenses, and cannot be invested in directly.
The S&P 500® is a stock market index based on the market capitalizations of 500 large companies having common stock listed on the NYSE or NASDAQ.
The Russell 1000® Index measures the performance of the large-cap segment of the U.S. equity universe. It is a subset of the Russell 3000® Index and includes approximately 1,000 of the largest securities based on a combination of their market cap and current index membership.
The Russell Fundamental U.S. Large Company Index ranks companies in the Russell 3000 Index by fundamental measures of size and tracks the performance of those companies whose fundamental scores are in the top 87.5% of the Russell 3000 Index. The index uses a partial quarterly reconstitution methodology in which the index is split into four equal segments at the annual reconstitution and each segment is then rebalanced on a rolling quarterly basis. Performance includes reinvestment of dividends.
The Schwab 1000 Index includes the stocks of the largest 1,000 publicly traded companies in the United States, with size determined by market capitalization (total market value of all shares outstanding). The index is designed to measure the performance of large- and mid-cap U.S. stocks.
“Fundamental Index” is a registered trademark of Research Affiliates LLC. Russell Investments and Research Affiliates LLC have entered into a strategic alliance with respect to the Russell Fundamental Index Series. Subject to Research Affiliates’ intellectual property rights in certain content, Russell Investments is the owner of all copyrights related to the Russell Fundamental Index Series. Russell Investments and Research Affiliates jointly own all trademark and service mark rights in and to the Russell Fundamental Indexes.
Charles Schwab & Co., Inc. is not affiliated with Russell Investments or Research Affiliates. The Schwab Center for Financial Research is a division of Charles Schwab & Co., Inc. Charles Schwab Investment Advisory, Inc. (“CSIA”) is an affiliate of Charles Schwab & Co., Inc. (“Schwab”).