Embed Size (px)
Citation preview
The Weakness of Bottom-Up Accountability:Experimental Evidence from the Ugandan Health Sector
Pia Raffler ⇤ Daniel N. Posner † Doug Parkerson ‡
August 27, 2018
Please contact authors for the most recent version.
Abstract
We evaluate the impact of a large-scale information and mobilization intervention designedto improve health service delivery in rural Uganda by increasing citizens’ ability to monitorand apply bottom-up pressure on underperforming health workers. Modeled closely on thelandmark “Power to the People” study (Bjorkman and Svensson, 2009), the intervention wasundertaken in 376 health centers in 16 districts and involved a three wave panel of more than14,000 households. We find that while the intervention had a positive impact on treatment qual-ity and patient satisfaction, it had no effect on utilization rates or health outcomes (includingchild mortality). We also find no evidence that the channel through which the intervention af-fected treatment quality was citizen monitoring. The results hold in a wide set of pre-specifiedsubgroups and also when, via a factorial design, we break down the complex intervention intoits two most important components. While our findings validate the power of information pro-vision to change the behavior of frontline service providers, they cast doubt on the power ofinformation to foster community monitoring or to generate improvements in health outcomes,at least in the short term.1
⇤Department of Government, Harvard University, [email protected].†Department of Political Science, University of California, Los Angeles, [email protected].‡Innovations for Poverty Action, [email protected] listed in reverse alphabetical order. We thank the Ministry of Health in Uganda, in particular Dr. An-
thony Mbonye; IPA Uganda, in particular Frederic Cochinard, Martin Atyera, Joshua Bwiira, Paola Elice, Afke Jager,Kyle Holloway, Douglas Kaziiro, Steven Kizza, Ezra Rwakazooba, Laura Schmucker, and Alex Tusiime for excellentresearch assistance and Damien Kirchhoffer, Dickson Malunda, and Daniele Ressler for their dedicated project man-agement. We thank our partners at GOAL Uganda, in particular Elizabeth Allen, Angela Bailey, Niamh Barry, andFiona Mitchell; our implementing partners, Coalition for Health Promotion and Social Development (HEPS Uganda),Kabarole Research and Resource Centre (KRC), and Multi-Community Based Development Initiative (MUCOBADI);and the Department for International Development (DfID) for funding. Helpful comments were provided by MartinaBjorkman Nyqvist, Darin Christensen, Johannes Haushofer, Chad Hazlett, Stuti Khemani, Stephen Kosack, partici-pants at the 17th and 23rd EGAP meetings, and at seminars at Rochester, Stanford, and UCLA. The pre-analysis planwas registered at EGAP (ID 20160611AA).
1 Introduction
Poor service delivery is a major problem in developing countries, particularly in primary healthcare. In the world’s poorest countries, staff at rural government-run clinics are often absent, ad-herence to clinical guidelines is weak, shortages of basic drugs are common, and services such asfamily planning and antenatal care are underprovided.2 In part for these reasons, utilization ratesat government clinics are low. Many children fail to receive essential vaccinations. Stunting andanemia are common. Under-five mortality rates, although declining, are still more than ten timeshigher than in developed countries (UNICEF, 2017). Improving the delivery of primary healthservices is therefore a central development priority (World Bank, 2004).
In recent years, development funders and practitioners have embraced a potentially promisingapproach to the problem of poor service provision: the bottom-up monitoring of service providersby community members (Mansuri and Rao, 2013; Kosack and Fung, 2014; Molina et al., 2016).Rooted in the logic of the principal-agent problem, the idea is that providing citizens with infor-mation about service delivery shortfalls, along with information allowing them to compare localoutcomes with national standards and with outcomes in other communities, will put them in a po-sition to monitor and apply pressure on underperforming service providers. The presumed causalarrows run from information to citizen pressure to improved provider behavior to improvementsin health outcomes. A major attraction of this approach is that it leverages the growing space forpolitical engagement in many developing countries while directly addressing the lack of effort andcorruption of service providers that is viewed as one of the major sources of poor service deliv-ery in such settings (World Bank, 2016). The approach has the additional appeal of attacking theproblem without requiring expensive inputs such as additional staff, training, or new equipment.
The attractiveness of this bottom-up, information-focused, community monitoring strategy wasvalidated by the findings of a landmark randomized study published in 2009 by Martina Bjorkmanand Jakob Svensson (Bjorkman and Svensson, 2009). The “Power to the People” (P2P) studysought to improve local health care provision in rural Uganda by providing community membersand local health care providers with information about the quality of health services being pro-vided at the local government-run health center (HC) and then bringing the community membersand health center staff together to discuss how they might collaborate to improve health outcomesin the community. The P2P intervention generated striking results: infant weights increased intreatment communities; under-5 mortality declined by 33 percent; immunization rates rose; wait-ing times at clinics fell; staff absenteeism dropped; utilization increased; and communities becamemore engaged and monitored clinics more extensively. Given both these large effects and the ap-peal of the approach it was testing, the P2P study received wide acclaim. It has been held up as anexample of the power of information to generate accountability and of the utility of community-based monitoring as a tool for improving health outcomes in developing country settings. Hun-dreds of millions of dollars have been spent on programming inspired by the P2P design.
Notwithstanding the strong findings in P2P, the effectiveness of similar programs as tools forimproving frontline service provision has received only mixed support in other research. Olken
2For country-specific details, see the reports generated as part of the World Bank’s Service Delivery Indicatorsproject, http://datatopics.worldbank.org/sdi/.
2
(2007), Banerjee et al. (2010), and Keefer and Khemani (2014) all report weak effects of interven-tions designed to generate behavioral change by frontline service providers through informationprovision and bottom-up grassroots monitoring. Pandey, Goyal and Sundararaman (2009), Barret al. (2012), Pradhan et al. (2009), Andrabi, Das and Khwaja (2017), Fiala and Premand (2017),and Banerjee et al. (2018), meanwhile, find more promising effects. These mixed results, com-bined with the limited power of the original P2P study—the intervention included just twenty-fivetreated health centers, and several of the study’s key findings were of only borderline statisticalsignificance—have raised questions about how certain we can be about the power of informationprovision and community monitoring to improve service provision.
In this paper, we report the results of Accountability Can Transform (ACT) Health, a large-scaleintervention designed to improve health service delivery in rural Uganda.3 Although modeled onP2P, the objective of ACT Health was not merely to replicate that influential study but to learn moreabout the strengths, limitations, and operation of the causal pathway it popularized. ACT Healthrandomized the delivery of information about patient rights and responsibilities, utilization patternsand health outcomes at the local health center, worked with health center staff and communitymembers to develop action plans in light of that information, and organized meetings betweenmembers of the community and health center staff to generate a joint social contract to guideboth actors’ future behavior and interactions. The intervention was implemented in 376 healthcenters and their associated catchment areas in 16 districts. The study involved the collection ofthree waves of panel data on utilization rates, treatment quality, patient satisfaction, and healthoutcomes (including child mortality) at both the health center and household (N=14,609) levels.To capture the channels through which the intervention was hypothesized to effect change, wecollected data on a broad array of intermediate outcomes as well as on health center, communityand household characteristics that might be sources of treatment effects in particular subgroupsof health centers and catchment areas. We also implemented a factorial design to gain a deeperunderstanding of the mechanisms at work. Given the project’s scope and the comprehensiveness ofthe data we collected, our study provides a particularly high-powered test of the potential impactof information provision and community monitoring on primary health outcomes in a developingcountry setting.
In contrast to P2P, we find only limited evidence for the impact of the intervention.4 Whilewe find no statistically significant effects on utilization rates and robust null effects on health out-comes (including child mortality), we find robust, positive (albeit substantively small) impacts ontreatment quality and patient satisfaction. These results are reinforced when we examine sub-populations of health centers, communities and individuals: we find larger impacts on treatmentquality in subgroups in which we might have expected to find stronger effects, and we find persis-tently null effects on utilization and health outcomes across nearly all subgroups. The null resultson health outcomes and child mortality also hold in both of the treatment arms we investigate viathe factorial design: 1) the provision of information and the mobilization of health center staffand community members in light of that information, and 2) the holding of interface meetingsin which health center staff and citizens can confront one another and work together to develop
3ACT Health was implemented by GOAL Uganda with funding from the UK’s Department for International Devel-opment. The evaluation described in this paper was undertaken by Innovations for Poverty Action under the directionof the study authors.
4A discussion of the possible reasons for these different findings is provided in Section 7.
3

a plan of action to improve health outcomes. We also find little evidence that the interventioncaused citizens to increase their monitoring or sanctioning of health care workers, although wefind suggestive evidence that the presence of sub-county officials during the programming boostedthe impact of the intervention on treatment quality. Consistent with the conclusions in World Bank(2016), this suggests that top-down monitoring by government officials may be a more powerfultool for changing health workers’ behavior than bottom-up monitoring by citizens. Taken together,our findings validate the power of information to alter the behavior of frontline service providersbut cast doubt on the ability of information to generate community monitoring or improvements inbottom-line health outcomes.
2 Health Service Delivery in Rural Uganda
Public health services in Uganda are provided in a hierarchical system with national referral hos-pitals at the national level, regional referral hospitals at the regional level, general hospitals atthe district level, and smaller scale health centers at the sub-county and parish levels—the formertermed HC3s; the latter, HC2s. Our study focuses on health care delivery at the HC3 and HC2levels, the lowest levels of the public health system.5 HC3s, which are staffed by a trained medicalworker and one or more nurses and lab technicians, provide preventative and out-patient care andhave laboratory services to undertake basic tests.6 They also generally have maternity wards andoffer prenatal and antenatal services. HC2s provide outpatient services and antenatal care. Theyare run by a nurse, sometimes working with a midwife and a nursing assistant. Both types of unitsare supported by Village Health Teams (VHTs) comprised of volunteer community health workerswho undertake health education outreach, provide simple curative services, and refer patients tohigher level health centers for treatment of more complicated conditions. Generally speaking, pa-tients seek care at the facility closest to their home and are then referred on to higher-level facilitiesas the nature of their medical condition requires.
Government-run health facilities operate alongside a growing number of private for-profit andnot-for-profit (often religious) health providers, as well as traditional practitioners. In our sampleat baseline, 40 percent of households that reported having a health condition requiring treatmentduring the past year sought care at a government-run health center, whereas 18 percent sought careat a private clinic. Thirty-three percent self-treated.7 Among the reasons cited for not visiting thegovernment-run health center were lack of drugs, long waiting times, poor quality of services, andpoor staff attitude. Just 60 percent of households that sought care at the government-run healthcenter said that the staff clearly explained their diagnosis, and just three percent said that they feltfree to express themselves to the staff during their examination. Only 68 percent reported beingsatisfied or very satisfied with the quality of care they received during their visit. 8
5As discussed below, the P2P study only included units at the HC3 level.6These are the government standards. HC3s frequently do not have the full set of staff or provide the full set of
services that government standards specify.7Seven percent sought care from a member of the VHT and two percent sought care from a traditional healer.8Although our sample was not drawn to be nationally representative, these findings are consistent with data col-
lected on utilization and satisfaction with health outcomes in Uganda more broadly (Rutaremwa et al., 2015; UgandaBureau of Statistics, 2017).
4
Factors both within and outside the health workers’ control contribute to this low utilizationand patient dissatisfaction. Understaffing, low and irregular payments to health workers, short-ages of necessary medical supplies, and limited oversight by higher-level health officials are ma-jor problems (Uganda Ministry of Health, 2017). They lead to low morale and poor treatmentquality, which in turn generates poor health outcomes and reduces incentives for citizens to thegovernment-run facilities for their health needs.
3 Intervention
The ACT Health intervention was implemented by a consortium of civil society organizations,coordinated by GOAL Uganda.9 Like most other interventions in the “transparency and account-ability” space (Kosack and Fung, 2014), the theory of change underlying ACT Health was thatservice delivery could be improved by empowering community members to demand high qualityservices, monitor service providers, and hold them accountable for poor performance. This is the“short route” of accountability popularized in the World Bank’s influential 2004 World Develop-ment Report (World Bank, 2004).
The intervention consisted of three components, closely modeled on P2P.10
Information. The research team used data collected in the baseline health center and householdsurveys to create citizen report cards (CRCs) providing health center-specific information aboutcitizens’ knowledge of their rights and responsibilities, utilization of the various services offeredat the health center, citizens’ perceptions of the quality of these services, and overall satisfactionwith the health care they received. For most outcomes, the health center-specific data was presentedalongside district averages to provide a benchmark of relative performance. The CRCs were sharedwith both health care providers and community members. Information was presented with the helpof visual props designed by local artists to ensure comprehension among illiterate participants.
Mobilization. Trained facilitators worked with local leaders and VHT members to organizecommunity meetings at which the CRC results were presented and discussed. An action plan wasdeveloped to identify specific steps that could be taken by community members to improve healthservice delivery. Significant efforts were made to ensure that the meetings included representativesfrom all major social groups in the community.11 Parallel meetings were also held separately withhealth center staff at which the CRC results were discussed and an action plan was formulateddescribing steps that the staff could take to improve health outcomes.
Interface. Facilitators brought the health center staff together with representatives of the com-9The project was approved by the Internal Review Boards at IPA (Protocol ID: 0497) and at the Uganda National
Council for Science and Technology (UNCST) (Protocol ID: ARC157). Approval for the project was also receivedfrom UNCST itself (Protocol ID: SS3559) and the Office of the President, Uganda. Participation in the study wasvoluntary and all respondents needed to give their informed consent in order to participate. Respondents did notreceive any compensation for their participation.
10A summary of these components, taken from the training manual developed by GOAL, is provided in AppendixH. The deviations from P2P in program design and implementation are summarized in Appendix G.
11The meetings included an average of 100 attendees. Further details about the meeting participants, as well as theworksheet used to guide the implementing teams’ mobilization efforts, are provided in Appendix H.
5

munity to discuss their respective action plans and how they might work together to improve thequality of health care in the community.12 The output of the interface meeting was a social con-tract between the citizens and health care workers laying out specific steps that each could take tocontribute to improvements in health outcomes.
These components are hypothesized to generate improvements in health outcomes via threemutually-reinforcing mechanisms. First, the receipt of information by both community membersand health providers, via the CRC, increases knowledge about issues related to health care, such aspatients’ right and responsibilities, the services that are supposed to be offered at the local healthcenter, and how the health outcomes and treatment practices at the health center compare withthose of other health facilities and with national standards. This information puts citizens in astronger position to evaluate whether their own health center is performing adequately and createscommon knowledge among community members and health center staff about the health center’sperformance.
Second, the holding of meetings to mobilize community members and the development ofaction plans in light of the information provided in the CRC allows citizens to identify concreteactions that they might take to improve health outcomes. The meetings may also generate effi-cacy among community members, foster a sense of responsibility for monitoring health workersto make sure they provide high quality services, and help overcome free riding problems withinthe community—all of which may be critical for generating bottom-up pressure by citizens andbehavioral changes by health center staff (Barr et al., 2012; Lieberman, Posner and Tsai, 2014).
Third, the interface meetings may provide opportunities for citizens to confront health providersdirectly and apply social sanctions to those revealed by the CRC to be underperforming. Alterna-tively, by providing a space for community members and health providers to discuss the problemsand constraints they each face, the drafting of the joint social contract may generate improvementsin the relationship between community members and health providers, which may in turn havepositive downstream effects on utilization, service delivery, and health outcomes.
Figure 1: Time line of the intervention
12On average, 50 community members and four health center staff members participated in the interface meetings.Further details are provided in Appendix H.
6
Implementing teams spent several days in each catchment area to organize the community andhealth center dialogues and interface meetings, and they returned every six months (for a totalof three follow-up visits before endline data collection) to meet with community members andhealth center staff to check on the progress that had been made toward the commitments made inthe social contract. A time line of the intervention is provided in Figure 1. Examples of a CRC,community and health center action plans, and a joint social contract are included in AppendixH.3.
4 Research Design, Data, and Estimation Framework
The unit of randomization in our study is the health center and its associated catchment area.Our sample includes 376 health centers, which represent nearly the entire universe of functioninggovernment-run HC2s and HC3s in our sixteen study districts.13 We define the catchment area asthe three villages that are closest in proximity to the health center in question (including the villagein which the health center is located), as measured by the straight-line distance from the healthcenter to the village centroid.14 In identifying these villages, we only include villages located inthe same parish (for HC2s) or sub-county (for HC3s) as the health center in question.15
4.1 Factorial Design
Although our primary interest is in the impact of the full ACT Health intervention, we use a facto-rial design to break the multifaceted treatment it contains into two of the three main componentsdescribed in Section 3. We combine the information and mobilization components into one treat-ment arm and cross it with the interface treatment, as depicted in Figure 2. We then randomlyassign health centers and their catchment areas to one of the four treatment groups, with treat-ment assignment blocked by district and health center level. This design enables us to assess theeffectiveness of the full ACT Health intervention by comparing units in the bottom right cell tothe control group and to learn which aspects of the broader intervention are doing the work ingenerating the effects we find by making comparisons across all four cells.
13The sixteen districts are: Lira, Apac, Pader, Gulu, Lamwo, Kitgum, Agago, Katakwi, Bukedea, Manafwa, Tororo,Kabarole, Mubende, Nakaseke, Kibaale, and Bundibugyo. We excluded government health centers funded by themilitary or prison departments because of the unique communities they serve.
14Catchment areas were determined using village-level shape files provided by the Uganda Bureau of Statistics(UBOS), and health center GPS coordinates collected by GOAL. To minimize overlap of catchment areas (and hencethe possibility of spillovers), we excluded health centers that were less than 2.5 km apart or that shared a village amongtheir three closest villages.
15If only two villages were located within a parish or sub-county, then only these two villages were included in thecatchment area. In addition, if a village was split into smaller subunits (typically the village subunits would be named“A” and “B” or “1” and “2”) and if field teams confirmed that this had occurred within the last 12 months (or had notbeen formally recognized by the appointment of a new local council), then both of these villages were included andconsidered as a single village.
7
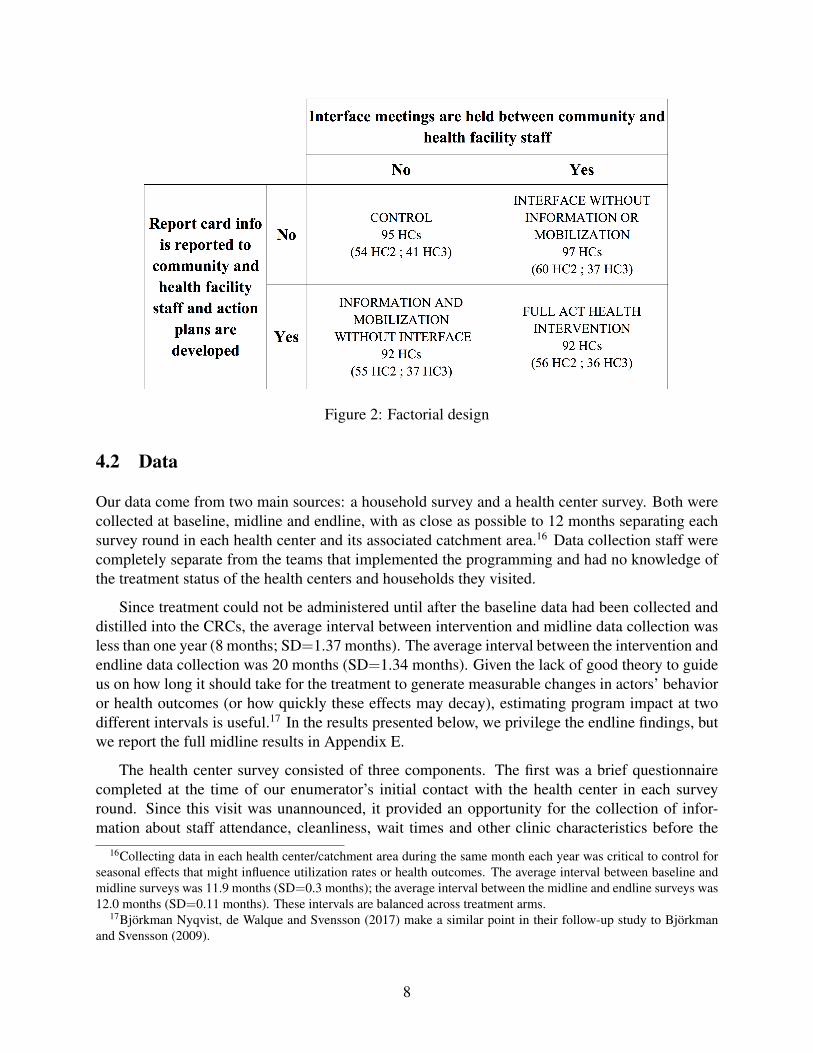
Figure 2: Factorial design
4.2 Data
Our data come from two main sources: a household survey and a health center survey. Both werecollected at baseline, midline and endline, with as close as possible to 12 months separating eachsurvey round in each health center and its associated catchment area.16 Data collection staff werecompletely separate from the teams that implemented the programming and had no knowledge ofthe treatment status of the health centers and households they visited.
Since treatment could not be administered until after the baseline data had been collected anddistilled into the CRCs, the average interval between intervention and midline data collection wasless than one year (8 months; SD=1.37 months). The average interval between the intervention andendline data collection was 20 months (SD=1.34 months). Given the lack of good theory to guideus on how long it should take for the treatment to generate measurable changes in actors’ behavioror health outcomes (or how quickly these effects may decay), estimating program impact at twodifferent intervals is useful.17 In the results presented below, we privilege the endline findings, butwe report the full midline results in Appendix E.
The health center survey consisted of three components. The first was a brief questionnairecompleted at the time of our enumerator’s initial contact with the health center in each surveyround. Since this visit was unannounced, it provided an opportunity for the collection of infor-mation about staff attendance, cleanliness, wait times and other clinic characteristics before the
16Collecting data in each health center/catchment area during the same month each year was critical to control forseasonal effects that might influence utilization rates or health outcomes. The average interval between baseline andmidline surveys was 11.9 months (SD=0.3 months); the average interval between the midline and endline surveys was12.0 months (SD=0.11 months). These intervals are balanced across treatment arms.
17Bjorkman Nyqvist, de Walque and Svensson (2017) make a similar point in their follow-up study to Bjorkmanand Svensson (2009).
8
clinic staff were able to respond to the fact that they were being evaluated. The second componentwas the main health center staff survey, which collected information about the variety and qualityof health services provided, utilization rates, staff structure and perceptions, funding mechanismsand drug stock-outs. This survey was conducted with the most senior health center staff member,as well as randomly drawn health workers, during an appointment scheduled at a time that wouldminimize the impact on patient care.18 The third component involved the collection of administra-tive data on file at the health center, including monthly Health Management Information System(HMIS) forms and drug stock cards. Physical checks of drug stocks and storage conditions wereconducted to verify the accuracy of these records.
The household survey was enumerated based on a baseline sampling frame of households con-taining at least one child under five years old or a pregnant woman, based on village household listsand consultations with the village chairperson, VHT members, Health Unit Management Commit-tee (HUMC) members and other knowledgeable persons.19 We randomly sampled 40 householdsper catchment area from this frame, with the number of households drawn from each village pro-portional to the number of eligible households in that village.20
The primary respondent for the household survey was the female head of household. Thesurvey collected information about household members’ recent experiences with the local healthcenter (including their satisfaction with the quality of care they received), their knowledge abouttheir rights and responsibilities, their health status, and their participation in community activities(including those directly related to monitoring the performance of their local health care providers),among other topics. All household surveys also included an anthropometric survey component inwhich we recorded the weight, height and middle-upper arm circumference (MUAC) of each childunder the age of five in the household. The ages of the children, and their immunization status,were also gathered using immunization cards, if available.
The household surveys were conducted in ten local languages with the help of 279 field staffhired and trained by IPA Uganda. All data was collected using smart phones, with date and timestamps, GPS coordinates recorded, and information transmitted to an encrypted server on a dailybasis.21 In all, we completed 15,295 household surveys at baseline, 14,459 at midline, and 14,609at endline.22 Thanks to detailed tracking protocols, we were successful in re-interviewing 95.5percent of our study households at endline. Our analyses are therefore based on a panel of 14,609households, each interviewed at minimum at baseline and endline, and the vast majority at threedifferent points in time. As shown in Appendix C, the small degree of attrition we experienced isbalanced across treatment arms.
18If the in-charge was unavailable, we interviewed the next most highly ranked (or longest serving) health centerstaff member. In order not to distract health workers from performing their duties, enumerators were instructed tosuspend the survey when a health worker was busy and to resume when she was again available.
19In instances in which our informants were unsure about the ages of children in a particular household, we verifiedthis information by visiting the household with a knowledgeable person from the village.
20During the baseline only, an additional abbreviated (“short”) survey was administered to another 15 householdsin catchment areas assigned to the information and mobilization treatments (i.e., units along the bottom row in Figure2, which received CRCs). These additional households were included to reduce noise in the measures included in theCRC and to increase the likelihood that the community would feel that the CRC represented its views and experiences.
21Further details of the procedures we employed to ensure data quality are discussed in Appendix B.22The baseline sample does not include the additional short surveys administered in the information and mobiliza-
tion arm.
9
4.2.1 Outcomes of Interest
We estimate the impact of the ACT Health intervention on five categories of outcomes: utilizationrates, treatment quality, patient satisfaction, health outcomes, and child mortality. Child mortalityis, of course, also a health outcome, but we break it out as a separate category because of itssingular importance as a bottom-line measure of health system performance. For each of the firstfour outcome categories, we create an averaged z-score index (Kling, Liebman and Katz, 2007)),constructed so that higher values imply a more beneficial outcome. The index can be interpretedas the average of the included measures, scaled to standard deviation units. Child mortality iscalculated at the child level via a set of indicator variables for whether each child is dead or alivein a given month.23 The components of each index are as follows:
Utilization- Vaccination rates of children under 36 months for polio, DPT, BCG, and measles, by age
bracket24
- Number of self-reported visits to the health center by household members in the past 12month
- Share of self-reported visits to the health center versus other providers
Treatment quality- Whether equipment was used during the most recent visit- Total time spent waiting for the initial consultation and the examination- Percent of staff in attendance during the unannounced visit to the health center- Condition of the health center (cleanliness of floors and walls; smell) as observed during the
unannounced visit- Share of months in which stock cards indicate no availability of six key tracer drugs in past
three months, as determined during the unannounced visit- Whether the person seeking care was examined by trained health center staff during their
most recent visit- Whether the person seeking care had privacy during their most recent examination- Whether lab tests were administered during the most recent visit- Whether the diagnosis was clearly explained to the person seeking care during his/her most
recent visit
Patient satisfaction- Whether services currently offered at the health center are judged to be of “very high” or
“somewhat high” quality23This child-level analysis is a deviation from our pre-analysis plan, in which we had registered that we would
calculate the mortality rate at the health center catchment level using a synthetic cohort approach. For a fuller discus-sion of our measures of child mortality, and how they compare to those used in P2P, see Appendix D. Results for thesynthetic cohort approach are shown in Appendix E.
24Vaccination rates are calculated at the household level as the percentage of children under 36 months who, subjectto a six week grace period, have received the full set of age-relevant vaccinations as recommended in the UgandaNational Expanded Program on Immunization.
10

- Whether the person seeking care was “very satisfied” or “satisfied” with the quality of carehe/she received during his/her most recent visit to the health center
- Whether the person conducting the examination behaved politely/showed respect- Whether the person conducting the examination appeared to be interested in the health con-
dition of the person seeking care- Whether the person conducting the examination listened to what the person seeking care had
to say- Whether the person seeking care felt free to express him/herself to the person conducting the
examination- Whether, compared to the year before, the availability of medical staff has improved at the
health center
Health outcomes- Weight for age among children aged 0-18 months- Weight for age among children aged 18-36 months- Upper arm circumference among children aged 0-18 months- Upper arm circumference among children aged 18-36 months
Child mortality
Calculated via a binary variable indicating whether a child is dead or alive in a given month,measured over the course of 36 months through a child roster in the household survey, for childrenin the following three age categories:
- 0 to 5 years (main measure)- 0 to 12 months- 1 to 5 years
In addition to these five main outcomes, we also test for treatment effects on averaged z-scoreindices of seven intermediate outcomes that map onto the mechanisms discussed in Section 3:citizen knowledge, health center staff knowledge, efficacy, community responsibility, communitymonitoring, the relationship between health workers and the community, and health center trans-parency. The components of these indices are listed in Appendix A. The logic underlying thisapproach is that if the treatment affects health care delivery through its impact on intermediateoutcome Q, then we should see an effect of the treatment on Q.25 Estimating treatment effectson these intermediate outcomes can thus help us gain a deeper understanding of the mechanismsthrough which the intervention operates.
4.2.2 Missing Values and Outliers
As specified in our pre-analysis plan, we remove outliers by capping unbounded variables at the99th percentile of the observed values in our data. To deal with missing values on our covariates,
25Of course, we should also see an effect of Q on our main outcomes as well, but estimating this second stage ismuch more complicated (Imai, Keele and Tingley, 2010), so we limit our analysis to the first stage, which provides atleast suggestive evidence for the relevance of the causal pathway captured by each intermediate outcome measure.
11
we adopt the approach described in Lin, Green and Coppock (2016). If no more than 10% of thecovariate’s values are missing, we recode the missing values to the overall mean. If more than 10%of the covariate’s values are missing, we include a missingness dummy as an additional covariateand recode the missing values to zero. We deal with missing values on our outcome measures bysetting them equal to the mean of the treatment group.
4.2.3 Social Desirability Bias and Hawthorne Effects
Although many of the outcomes we measure are products of objective observation by our surveyteam, several are based on subjective reports by household members. This raises the possibility thatrespondents might provide more positive answers to questions about utilization, treatment quality,or their satisfaction with the quality of the services they received at the health center because theybelieve such answers will reflect better on them in the eyes of the interviewers. While we cannotcompletely rule out such social desirability bias, we note that it should be balanced across treatmentand control arms (since we collected outcome data in the same way in both), and hence not affectour estimates of treatment impacts.
A more compelling concern is that health center staff and/or household respondents may havebehaved or answered questions differently because they knew they were receiving our treatment. Inthe case of health center staff, we believe we can largely rule out such Hawthorne effects becausewe implemented the health center survey—by far the most intrusive aspect of the intervention fromthe standpoint of the clinic staff—in both treatment and control units. To the extent that receivingand discussing the CRC or participating in the interface meeting—aspects of ACT Health programto which only treated health centers were exposed—generated an additional incentive for healthcenter staff to improve their performance, it will be difficult to disentangle a Hawthorne effectfrom a treatment effect. However, with respect to cueing health center staff to the fact that theywere being observed, we believe that it is reasonable to think that the effect of being comprehen-sively interviewed and monitored at baseline, midline, and endline swamps the additional effect ofreceiving the CRC or participating in the interface meeting.
In the case of household members, concerns regarding Hawthorne effects are minimized be-cause only 20 percent of surveyed households in treated catchment areas reported having evenheard about the CRC or the community or interface meetings. So, it is unlikely that knowledgeof treatment status affected our estimates of the impact of ACT Health on outcomes related tocitizens’ behavior.
We can also rule out the parallel concern that members of the survey team might have soughtto validate the program’s objectives through the way they asked questions or recorded observationsabout the clinics they visited because, as noted, survey team members were blinded to the treatmentstatus of the health centers and households they visited.
12
4.3 Estimation
4.3.1 Main Effects and Intermediate Outcomes
To estimate the effect of the full treatment, we estimate the following ITT equation:
Yij = �0 + �1Tij + �2Y0ij + �3Xij + �4Xij ⇤ Tij + �d + uij (1)
where Yij is the outcome measure (in our main specifications, one of our five indices) of householdi in health center catchment area j. Tij is a binary variable indicating whether the health centerand catchment area j was assigned to treatment. �1 is the average treatment effect, Y 0
ij is thebaseline value of the outcome measure, Xij is a vector of demeaned controls,26 Xij ⇤ Tij is theirinteraction with the treatment indicator,27 �d are district fixed effects, and uij are robust standarderrors clustered by the health center catchment area. Following Lin (2013), we use Huber-Whitesandwiched standard errors.
We also use Equation 1 to estimate the effects of treatment on the intermediate outcomes de-scribed in Section 4.2.1.
To estimate the effect of the treatment on child mortality rates, we consider a Cox proportionalhazards model to be the superior specification. By estimating the treatment effect on the chance ofsurvival of the individual child, it mimics the data generation process more closely and leveragesthe fact that we have child-month level data on survival over the course of 36 months.28 Resultsfrom equation 1 for child mortality rates are presented in Table E24 in the Appendix.
4.3.2 Analysis by Treatment Arm
To estimate the effect of each treatment arm, we estimate the model:
Yij = �0 + �1TInfoOnlyij + �2T
Info&Interfaceij + �3T
InterfaceOnlyij + �4Y
0ij + �5Xij + �d + uij (2)
where T InfoOnlyij is a binary variable indicating whether the health center and catchment area j
was assigned to receive only the information treatment, T InterfaceOnlyij indicates whether the unit
26As specified in our pre-analysis plan, the controls include whether the health center is a HC2, whether the healthcenter provides delivery services, whether the health center has staff houses, whether household members report usingthe health center within the 12 months prior to baseline, the education level of the interviewed household head, and thehousehold wealth (calculated as the first component of a principal component analysis of the number of items of 17assets—including cattle, radios, bicycles etc.—owned by the household, as well as three measures of housing quality).Since the baseline value of the efficacy index is imbalanced, we include it in the vector of controls as well, as per ourpre-analysis plan.
27The inclusion of the interaction between the controls and the treatment dummy was not pre-specified. We addedthis term in line with the recommendations in Lin, Green and Coppock (2016).
28We note again that this is a deviation from the pre-analysis plan, where we had specified that we would estimatethe effect on mortality rates using Equation 1 with child mortality rates by catchment area. The Cox model includes thesame vector of controls and their interaction with the treatment indicator as Equation 1. Standard errors are clusteredby health center catchment area. An important assumption of the Cox model is that the relative effect of a covariateon the hazard function is constant over time (proportional hazard rates). We therefore do not include district fixedeffects in our Cox models, since different regions of Uganda experience different seasonal patterns and thus differenttemporal patterns of child mortality rates. Our results are not affected by the exclusion of district fixed effects.
13

was assigned to receive only the interface treatment, T Info&Interfaceij indicates whether the unit was
assigned to receive the full treatment, and all other terms are defined as in Equation 1. This set-upallows us to compare each cell in the factorial design to the control group.29
4.3.3 Subgroup Treatment Effects
To explore the conditions under which treatment effects are more or less strong, we undertake anumber of tests for treatment effects on both the five main outcome indices and the seven interme-diate outcome indices in particular subgroups of our data. To test for subgroup treatment effects,we estimate the standard equation:
Yij = �0 + �1Tkij + �2T
kij ⇤Hetij + �3Hetij + �4Y
0ij + �5Xij + �6Xij ⇤ T k
ij + �d + uij (3)
where Hetij is an indicator variable of the subgroup for which we are testing for treatment effects,which for this purpose is not included in the vector of covariates Xij .30 �2 is the marginal increasein the treatment effect in the health centers/catchment areas in this subgroup.
5 Results
As a first step, we check for covariate balance to ensure we are drawing inferences from validcomparisons. As shown in Appendix C, our sample is balanced across treatment arms with respectto the baseline characteristics of the catchment areas and health centers. Baseline levels of ourmain and intermediate outcome indices are also balanced, with the exception of our measure ofefficacy, which we accordingly add to our vector of controls in our main analyses, as specified inour pre-analysis plan. We also test for evidence of treatment spillover by comparing outcomes incontrol health centers that were close to and far from the nearest treated health center, and findno statistically significant differences.31 If anything, we find that the effect of exposure to theintervention on treatment quality is stronger in control health centers that are further away fromtreated units (see Appendix C).
5.1 Main Outcomes
Figure 3 presents the study’s main findings. The coefficient plot summarizes the effect of the fullACT Health program on the five main outcome indices as measured at endline (20 months after
29We had initially pre-specified the model Yij
= �0 + �1TInfo
ij
+ �2TInfo
ij
T Interface
ij
+ �3TInterface
ij
+ �4Y 0ij
+�5Xij
+�d
+uij
, which considers the rows and columns as well as their interaction. We deem the model described inEquation 2 better since it relies on fewer assumptions, is easier to interpret, and presents our findings in a way that isconsistent with the results in the main specification. Results from the pre-specified model are presented in AppendixE.6.
30For specifications looking at subgroup effects by health center level we exclude the three health center levelcovariates from the vector since they have limited variation, leading to concerns about multicollinearity.
31“Close” control health centers are defined as those whose distance to the nearest treated health center was lessthan 5.2 miles, which is the 67th percentile of distances among all closest control/treated pairs in our sample.
14
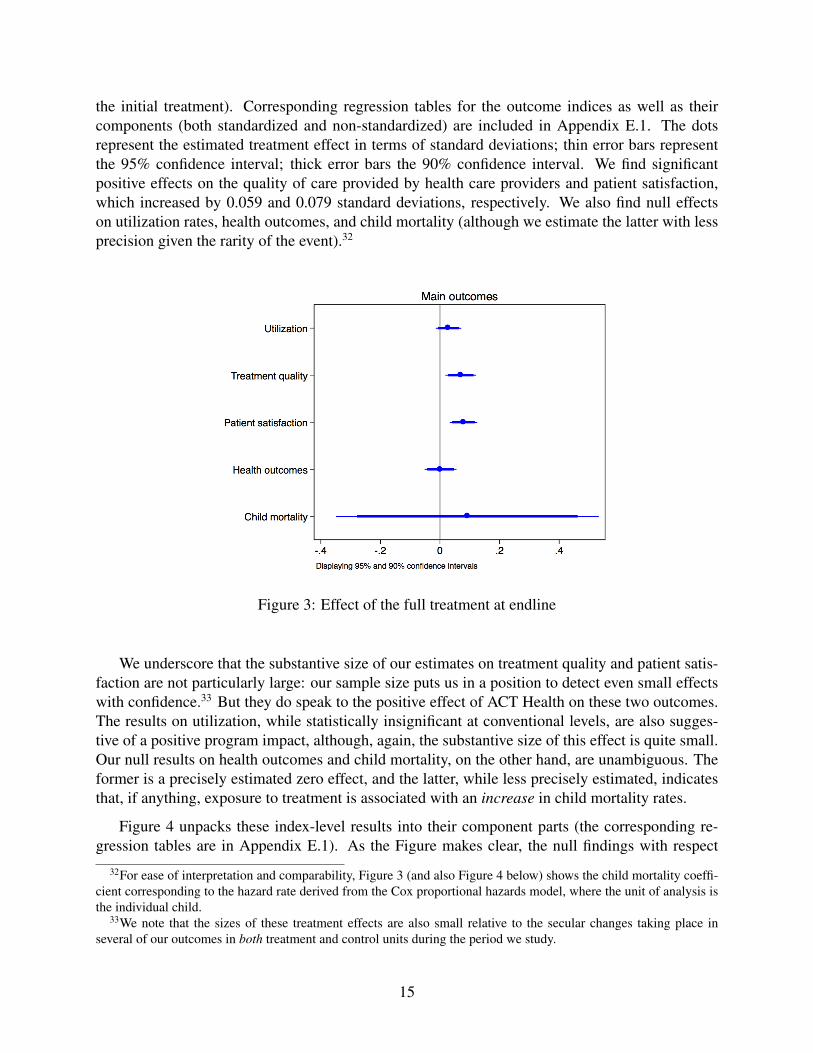
the initial treatment). Corresponding regression tables for the outcome indices as well as theircomponents (both standardized and non-standardized) are included in Appendix E.1. The dotsrepresent the estimated treatment effect in terms of standard deviations; thin error bars representthe 95% confidence interval; thick error bars the 90% confidence interval. We find significantpositive effects on the quality of care provided by health care providers and patient satisfaction,which increased by 0.059 and 0.079 standard deviations, respectively. We also find null effectson utilization rates, health outcomes, and child mortality (although we estimate the latter with lessprecision given the rarity of the event).32
Figure 3: Effect of the full treatment at endline
We underscore that the substantive size of our estimates on treatment quality and patient satis-faction are not particularly large: our sample size puts us in a position to detect even small effectswith confidence.33 But they do speak to the positive effect of ACT Health on these two outcomes.The results on utilization, while statistically insignificant at conventional levels, are also sugges-tive of a positive program impact, although, again, the substantive size of this effect is quite small.Our null results on health outcomes and child mortality, on the other hand, are unambiguous. Theformer is a precisely estimated zero effect, and the latter, while less precisely estimated, indicatesthat, if anything, exposure to treatment is associated with an increase in child mortality rates.
Figure 4 unpacks these index-level results into their component parts (the corresponding re-gression tables are in Appendix E.1). As the Figure makes clear, the null findings with respect
32For ease of interpretation and comparability, Figure 3 (and also Figure 4 below) shows the child mortality coeffi-cient corresponding to the hazard rate derived from the Cox proportional hazards model, where the unit of analysis isthe individual child.
33We note that the sizes of these treatment effects are also small relative to the secular changes taking place inseveral of our outcomes in both treatment and control units during the period we study.
15

to utilization, health outcomes, and child mortality are rooted in statistically insignificant coeffi-cient estimates on every index component. The one utilization index component that approachesconventional levels of statistical significance—and that, in fact, drives the nearly significant indexcoefficient—is child vaccination rates. The critical number of visits to the health center during thepast 12 months measure, however, is a precisely estimated zero.
The patient satisfaction findings, by contrast, are a product of significant, positive estimates onevery component but one (which is still positive, but not statistically significant). Households intreated communities were more likely to report at endline that the services offered at the healthcenter were of “very” or “somewhat” high quality (5.4 percentage points); that they were “satis-fied” or “very satisfied” with the quality of the care they received during their most recent visit tothe clinic (2.4 percentage points); that the person conducting their examination behaved politelyand respectfully (1.6 percentage points), appeared interested in their health condition (2.3 percent-age points), listened to what they had to say (1.7 percentage points, and insignificant); that theyfelt free to express themselves to the person conducting the examination (1.2 percentage points,insignificant), and that, compared to the year before, the availability of medical staff had improved(3.6 percentage points).34
Our significant results with respect to treatment quality are built on somewhat more mixedcomponent-level findings. Respondents in households who received their care from treated healthcenters were more likely to report having had privacy during their most recent exam and having hadtheir diagnosis clearly explained to them (1.5 and 2.4 percentage points, respectively) and treatedhealth centers were 6.2 percentage points less likely to have had stockouts of key drugs duringthe past three months. Although these are the only index components for which treatment effectsreach traditional levels of statistical significance, all of the other components also have positivecoefficients, resulting in a significant positive estimate for the index as a whole. This positiveindex-level effect is robust to several alternative specifications, including (with one exception)dropping index components one by one and excluding the three index components measured at thehealth center level (observed staff presence, cleanliness, and drug availability), whose inclusion inthe household-level index artificially inflates their contributions (see Appendix E.4).
The only index component whose single omission causes the treatment quality index to lose itsstatistical significance is drug availability. Drug stockouts are more than just a statistically influen-tial index component. They are also a highly important phenomenon in the context we study. Theunavailability of essential medicines is a major source of poor health—and even death—in ruralUganda, and the roots of this unavailability often lie in the theft of drugs by medical staff, whosteal them to sell to private pharmacies (Arinaitwe, 2017).35 Eighty-eight percent of households inour sample cited health workers selling drugs on the side as an important factor in explaining poorhealth service delivery. The problem is so severe that in 2009 President Museveni established a spe-
34Since patient satisfaction can only be reported by households that utilized the health center during the past year,and since utilization is a post-treatment outcome, it is in theory possible that our estimates could be biased by atreatment effect on utilization. We think this is highly unlikely, however, given the statistically insignificant effects ofthe treatment on utilization. Furthermore, the treatment effect on patient satisfaction is robust to restricting the sampleto the 92.5% of households who had visited the health center in the 12 months before the baseline.
35Uganda employs a “push” system under which set quantities of basic drug supplies are sent to clinics from theNational Medical Store. Hence, stockouts are almost entirely a product of leakage that occurs after the drugs arrive atthe health center, when they are under the control of the clinic staff.
16
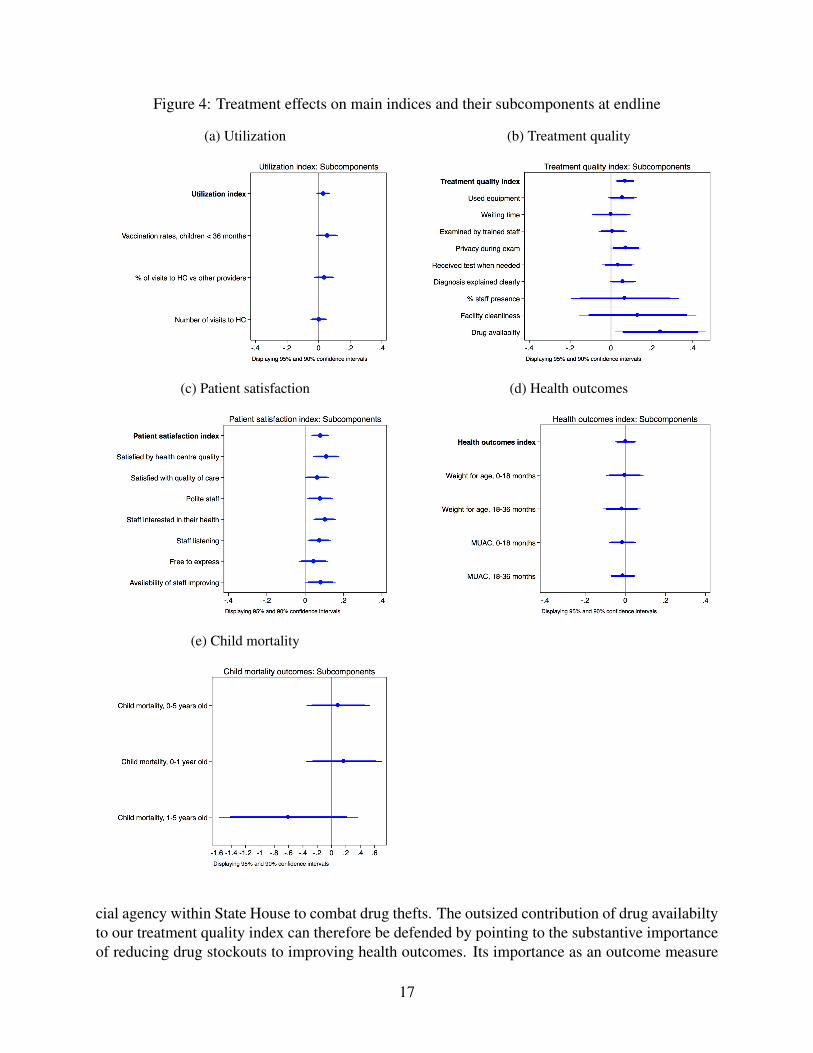
Figure 4: Treatment effects on main indices and their subcomponents at endline
(a) Utilization (b) Treatment quality
(c) Patient satisfaction (d) Health outcomes
(e) Child mortality
cial agency within State House to combat drug thefts. The outsized contribution of drug availabiltyto our treatment quality index can therefore be defended by pointing to the substantive importanceof reducing drug stockouts to improving health outcomes. Its importance as an outcome measure
17
is also bolstered by the fact that our research staff measured drug availability directly through thephysical inspection of each health center’s pharmacy shelves during an unannounced visit. Thismakes our measure of drug stockouts immune to the subjective reporting that may affect our othertreatment quality index components.
5.1.1 Midline Results for Main Outcomes
Our findings at midline are generally consistent with those at endline. As shown in AppendixE.7, we find a significant effect on treatment quality, but not on patient satisfaction, when weuse outcome data measured 8 months, rather than 20 months, after treatment. As at endline, wefind null results on utilization, health outcomes, and child mortality. Exposure to the ACT Healthintervention thus does not appear to have had shorter-term effects that dissipated by the time of ourendline data collection.
5.1.2 Robustness Tests
In addition to the main results shown in Figure 3 and Appendix E.1, we find consistent effectsin nonparametric tests (see Appendix E.8), and in various alternative models we specified in ourpre-analysis plan. As we show in Appendix E.4, running the models without control variables ordistrict fixed effects, aggregating all outcome measures to the health center level, and re-specifyingour outcome measures as the difference between post-treatment and pre-treatment values all leaveour findings (mostly) unchanged. To allay concerns that the number of hypotheses we test mightlead us to falsely report statistically significant effects, we provide estimates of treatment impacton all indices and index components both with and without False Discovery Rate adjusted p-values(Benjamini and Hochberg, 1995), based on the comparison families described in Appendix E.9.36
Quantile regressions of our five outcome indices (reported in Appendix E.4) suggest that ourestimated treatment effects (both null and positive) are not driven by just parts of the distribution.Our results on utilization, patient satisfaction, and health outcomes are robust to substituting ourmain pre-registered outcome measures with alternative indices based on the fist component ofa principal component analysis (also see Appendix E.4). This is important insofar as our pre-registered indices, while deductively coherent, might not perfectly capture the underlying outcomethey were designed to summarize.
5.2 Intermediate Outcomes
To better understand the channels through which the ACT Health intervention affected our out-comes of interest, we collected data on a range of intermediate outcomes. These include knowl-edge of patients’ rights and responsibilities among community members, sense of efficacy amonghouseholds, perceived community responsibility for monitoring health service delivery, monitor-ing activities undertaken by community members, and the perceived quality of their relationship
36For indices, we define a family as either the set of main outcome indices or intermediate outcome indices. Forindex components, we define a family as the set of components of an index.
18
with health care workers. In addition, we collected data on health workers’ knowledge of patients’rights and responsibilities as well as actions the health center staff may have undertaken to improvetransparency vis-a-vis the community (for example, having a suggestion box or posting openingtimes, a duty roster, and information about services provided and patients’ rights). The componentsof each of these indices are listed in detail in Appendix A.
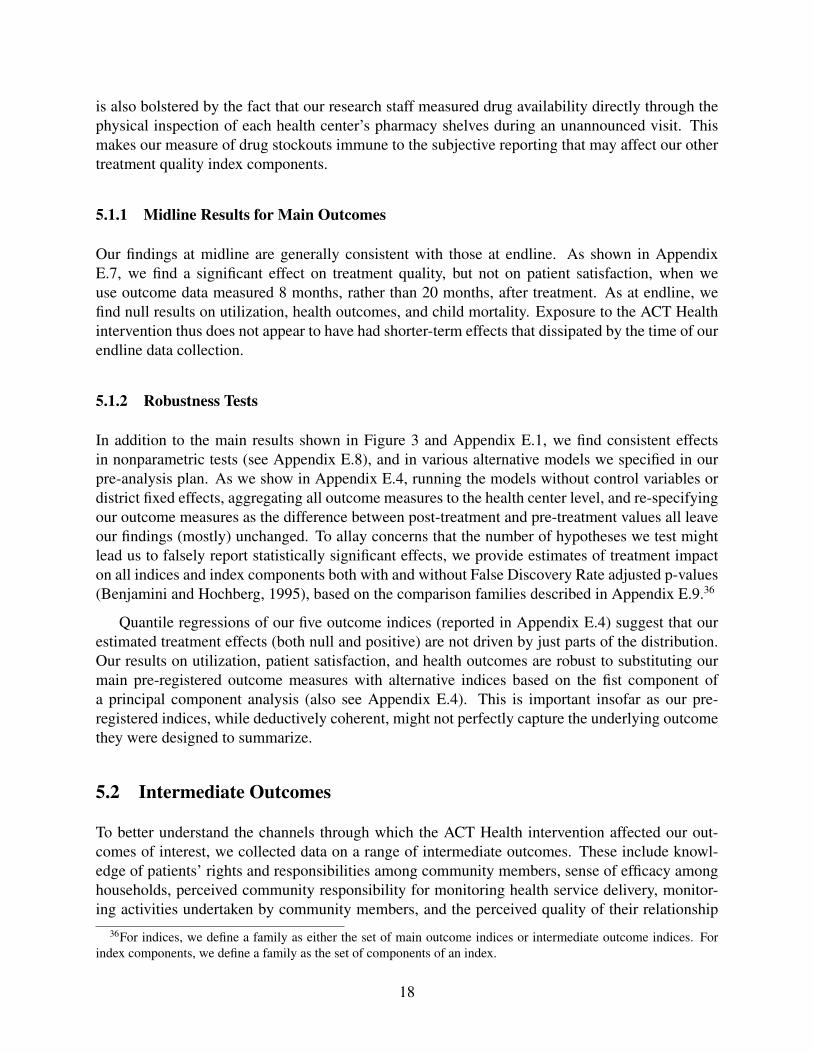
As can be seen in Figure 5, we do not find evidence for positive treatment effects at endline onany of the intermediate outcome measures we collected (see Appendix E.2 for regression tables).The fact that we see no impact on efficacy, community responsibility, or community monitoring—including in indices constructed using principal component analysis rather than averaged z-scores(see Appendix E.4)—is especially noteworthy, as these are the three indices that speak most di-rectly to the role that citizens may play in generating bottom-up accountability. Given the expecta-tion that information provision will affect health provision through its impact on citizen monitoringand bottom-up pressure, this is an important result. It suggests that the improvements we observein treatment quality—and ultimately patient satisfaction—may have been driven less by the effectof the intervention on community actions than by a direct effect on health workers’ behavior.
Figure 5: Treatment effect on intermediate outcomes at endline
5.3 Differences by Treatment Arm
Our motivation for the factorial research design was to disentangle which aspects of the bundledfull intervention are doing the work, if any. Table 1 shows effects on the five main outcomes bytreatment arm. Each of the three treatment arms enters as an indicator variable.
19
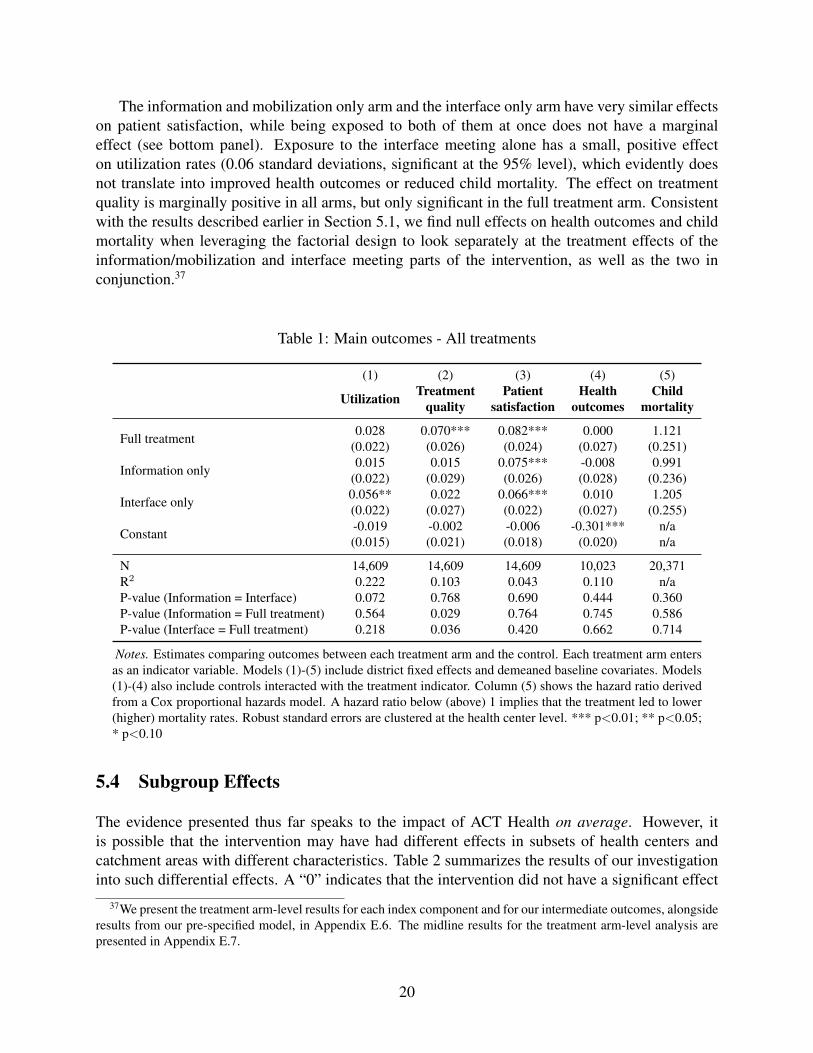
The information and mobilization only arm and the interface only arm have very similar effectson patient satisfaction, while being exposed to both of them at once does not have a marginaleffect (see bottom panel). Exposure to the interface meeting alone has a small, positive effecton utilization rates (0.06 standard deviations, significant at the 95% level), which evidently doesnot translate into improved health outcomes or reduced child mortality. The effect on treatmentquality is marginally positive in all arms, but only significant in the full treatment arm. Consistentwith the results described earlier in Section 5.1, we find null effects on health outcomes and childmortality when leveraging the factorial design to look separately at the treatment effects of theinformation/mobilization and interface meeting parts of the intervention, as well as the two inconjunction.37
Table 1: Main outcomes - All treatments
(1) (2) (3) (4) (5)
Utilization Treatmentquality
Patientsatisfaction
Healthoutcomes
Childmortality
Full treatment 0.028 0.070*** 0.082*** 0.000 1.121(0.022) (0.026) (0.024) (0.027) (0.251)
Information only 0.015 0.015 0.075*** -0.008 0.991(0.022) (0.029) (0.026) (0.028) (0.236)
Interface only 0.056** 0.022 0.066*** 0.010 1.205(0.022) (0.027) (0.022) (0.027) (0.255)
Constant -0.019 -0.002 -0.006 -0.301*** n/a(0.015) (0.021) (0.018) (0.020) n/a
N 14,609 14,609 14,609 10,023 20,371R2 0.222 0.103 0.043 0.110 n/aP-value (Information = Interface) 0.072 0.768 0.690 0.444 0.360P-value (Information = Full treatment) 0.564 0.029 0.764 0.745 0.586P-value (Interface = Full treatment) 0.218 0.036 0.420 0.662 0.714
Notes. Estimates comparing outcomes between each treatment arm and the control. Each treatment arm entersas an indicator variable. Models (1)-(5) include district fixed effects and demeaned baseline covariates. Models(1)-(4) also include controls interacted with the treatment indicator. Column (5) shows the hazard ratio derivedfrom a Cox proportional hazards model. A hazard ratio below (above) 1 implies that the treatment led to lower(higher) mortality rates. Robust standard errors are clustered at the health center level. *** p<0.01; ** p<0.05;* p<0.10
5.4 Subgroup Effects
The evidence presented thus far speaks to the impact of ACT Health on average. However, itis possible that the intervention may have had different effects in subsets of health centers andcatchment areas with different characteristics. Table 2 summarizes the results of our investigationinto such differential effects. A “0” indicates that the intervention did not have a significant effect
37We present the treatment arm-level results for each index component and for our intermediate outcomes, alongsideresults from our pre-specified model, in Appendix E.6. The midline results for the treatment arm-level analysis arepresented in Appendix E.7.
20

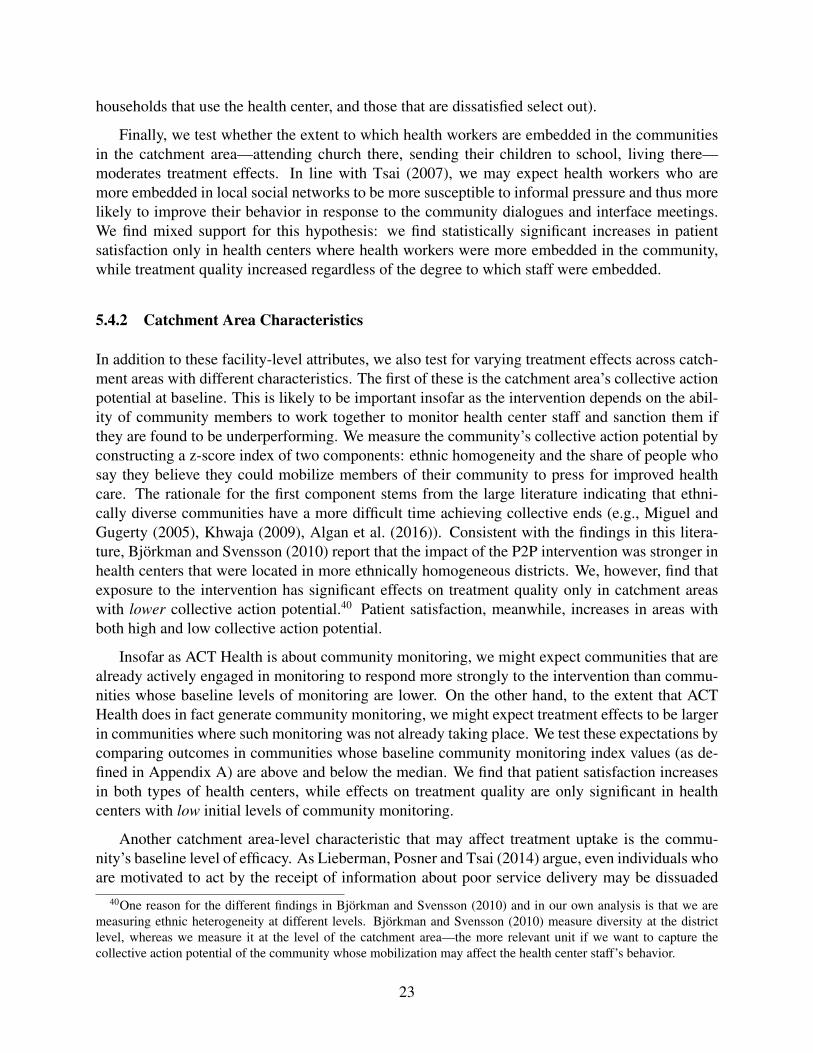
in the specific subset of health centers or catchment areas specified at left. A “+” indicates that theintervention had a positive treatment effect, a “-” indicates that it had a negative treatment effect,both at least at the 90% significance level. Levels of significance are indicated by the shade ofgray, with dark gray indicating 99% significance, medium gray 95% significance, and light gray90% significance. The specific coefficient estimates on which these codings are based are shownin Appendix E.3.38
The results of our investigation into subgroup effects reinforce our null findings with respect toutilization, health outcomes and child mortality by demonstrating that these null results hold notjust in general but across all (and, in the case of utilization, nearly all) subsets of health centers,catchment areas and households. Our positive findings with respect to treatment quality and patientsatisfaction, meanwhile, are bolstered by the fact that, as we describe below, we are more likely tofind effects in places where theory suggests the intervention should have had the greatest impact.
5.4.1 Health Facility Characteristics
The first health facility characteristic we test is the health center’s level. HC3s and HC2s havedifferent kinds of personnel (the former are staffed by trained medical workers who often liveoutside the community they serve, whereas the latter are usually staffed by a single nurse wholives locally). They also differ in the services they offer: most important, most HC2s do not havematernity wards, whereas most HC3s do. In addition, the types and sizes of the communities thatHC3s and HC2s serve (the former typically provide health care for a subcounty with a medianpopulation of 25,000 people, whereas the latter typically serve one to two parishes, or about oneto two fifths of a subcounty) also differ considerably.39 All of these factors could lead to divergenttreatment effects. While we find no effects with respect to utilization, health outcomes or childmortality across either HC2s or HC3s, we find positive and significant effects on patient satisfactionin both types of health centers. Effects on treatment quality, meanwhile, are significant only inHC2s.
The second clinic-level characteristic we address is whether the health center is performingabove or below the median level in its district in our treatment quality index, as measured at base-line. The rationale for this test is that the impact of the intervention may be different in well-performing and poorly-performing health centers—in part because the nature of the informationcontained in the CRC (and thus the treatment itself) will be different and in part because differentbaseline conditions imply varying degrees of room for improvement. Consistent with this expecta-tion, we find significant increases in treatment quality only in health centers that were performingpoorly at baseline. Patient satisfaction, meanwhile, increased regardless of the baseline perfor-mance of the health center in the community.
38Appendix E.3 also presents results of the subgroup analysis for our intermediate outcomes.39Median subcounty population is calculated from the 2014 Ugandan census.
21
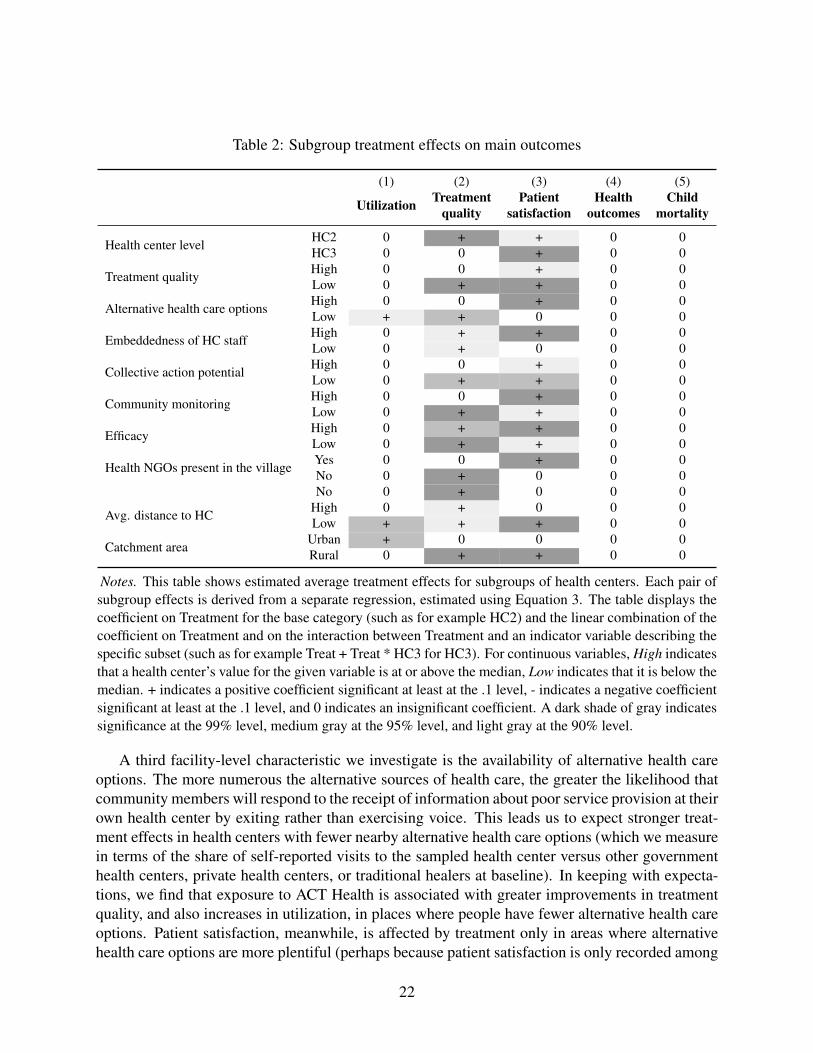
Table 2: Subgroup treatment effects on main outcomes
(1) (2) (3) (4) (5)
Utilization Treatmentquality
Patientsatisfaction
Healthoutcomes
Childmortality
Health center level HC2 0 + + 0 0HC3 0 0 + 0 0
Treatment quality High 0 0 + 0 0Low 0 + + 0 0
Alternative health care options High 0 0 + 0 0Low + + 0 0 0
Embeddedness of HC staff High 0 + + 0 0Low 0 + 0 0 0
Collective action potential High 0 0 + 0 0Low 0 + + 0 0
Community monitoring High 0 0 + 0 0Low 0 + + 0 0
Efficacy High 0 + + 0 0Low 0 + + 0 0
Health NGOs present in the village Yes 0 0 + 0 0No 0 + 0 0 0No 0 + 0 0 0
Avg. distance to HC High 0 + 0 0 0Low + + + 0 0
Catchment area Urban + 0 0 0 0Rural 0 + + 0 0
Notes. This table shows estimated average treatment effects for subgroups of health centers. Each pair ofsubgroup effects is derived from a separate regression, estimated using Equation 3. The table displays thecoefficient on Treatment for the base category (such as for example HC2) and the linear combination of thecoefficient on Treatment and on the interaction between Treatment and an indicator variable describing thespecific subset (such as for example Treat + Treat * HC3 for HC3). For continuous variables, High indicatesthat a health center’s value for the given variable is at or above the median, Low indicates that it is below themedian. + indicates a positive coefficient significant at least at the .1 level, - indicates a negative coefficientsignificant at least at the .1 level, and 0 indicates an insignificant coefficient. A dark shade of gray indicatessignificance at the 99% level, medium gray at the 95% level, and light gray at the 90% level.
A third facility-level characteristic we investigate is the availability of alternative health careoptions. The more numerous the alternative sources of health care, the greater the likelihood thatcommunity members will respond to the receipt of information about poor service provision at theirown health center by exiting rather than exercising voice. This leads us to expect stronger treat-ment effects in health centers with fewer nearby alternative health care options (which we measurein terms of the share of self-reported visits to the sampled health center versus other governmenthealth centers, private health centers, or traditional healers at baseline). In keeping with expecta-tions, we find that exposure to ACT Health is associated with greater improvements in treatmentquality, and also increases in utilization, in places where people have fewer alternative health careoptions. Patient satisfaction, meanwhile, is affected by treatment only in areas where alternativehealth care options are more plentiful (perhaps because patient satisfaction is only recorded among
22
households that use the health center, and those that are dissatisfied select out).
Finally, we test whether the extent to which health workers are embedded in the communitiesin the catchment area—attending church there, sending their children to school, living there—moderates treatment effects. In line with Tsai (2007), we may expect health workers who aremore embedded in local social networks to be more susceptible to informal pressure and thus morelikely to improve their behavior in response to the community dialogues and interface meetings.We find mixed support for this hypothesis: we find statistically significant increases in patientsatisfaction only in health centers where health workers were more embedded in the community,while treatment quality increased regardless of the degree to which staff were embedded.
5.4.2 Catchment Area Characteristics
In addition to these facility-level attributes, we also test for varying treatment effects across catch-ment areas with different characteristics. The first of these is the catchment area’s collective actionpotential at baseline. This is likely to be important insofar as the intervention depends on the abil-ity of community members to work together to monitor health center staff and sanction them ifthey are found to be underperforming. We measure the community’s collective action potential byconstructing a z-score index of two components: ethnic homogeneity and the share of people whosay they believe they could mobilize members of their community to press for improved healthcare. The rationale for the first component stems from the large literature indicating that ethni-cally diverse communities have a more difficult time achieving collective ends (e.g., Miguel andGugerty (2005), Khwaja (2009), Algan et al. (2016)). Consistent with the findings in this litera-ture, Bjorkman and Svensson (2010) report that the impact of the P2P intervention was stronger inhealth centers that were located in more ethnically homogeneous districts. We, however, find thatexposure to the intervention has significant effects on treatment quality only in catchment areaswith lower collective action potential.40 Patient satisfaction, meanwhile, increases in areas withboth high and low collective action potential.
Insofar as ACT Health is about community monitoring, we might expect communities that arealready actively engaged in monitoring to respond more strongly to the intervention than commu-nities whose baseline levels of monitoring are lower. On the other hand, to the extent that ACTHealth does in fact generate community monitoring, we might expect treatment effects to be largerin communities where such monitoring was not already taking place. We test these expectations bycomparing outcomes in communities whose baseline community monitoring index values (as de-fined in Appendix A) are above and below the median. We find that patient satisfaction increasesin both types of health centers, while effects on treatment quality are only significant in healthcenters with low initial levels of community monitoring.
Another catchment area-level characteristic that may affect treatment uptake is the commu-nity’s baseline level of efficacy. As Lieberman, Posner and Tsai (2014) argue, even individuals whoare motivated to act by the receipt of information about poor service delivery may be dissuaded
40One reason for the different findings in Bjorkman and Svensson (2010) and in our own analysis is that we aremeasuring ethnic heterogeneity at different levels. Bjorkman and Svensson (2010) measure diversity at the districtlevel, whereas we measure it at the level of the catchment area—the more relevant unit if we want to capture thecollective action potential of the community whose mobilization may affect the health center staff’s behavior.
23
from mobilizing if they do not believe they have the power to effect change. The implication is thatwe would expect communities in which baseline levels of efficacy (as measured by our efficacy in-dex, described in Appendix A) are above the median to respond more strongly to the intervention.On the other hand, to the extent that programming in ACT Health is meant to be efficacy-boosting,we might expect to see communities with lower baseline levels of efficacy exhibiting the strongesttreatment effects. We find that both treatment quality and patient satisfaction increased irrespectiveof the baseline level of efficacy in a community.
The intensity of health-oriented NGO activity in the catchment area might also condition theimpact of ACT Health, although it is not theoretically clear whether the presence of other NGOsshould attenuate our estimates of treatment effects (via diminishing returns of exposure to NGOhealth programming) or amplify them (by reinforcing the impact of exposure to the new pro-gramming). We address this issue by leveraging answers to a question asked in a survey of localcouncil (LC1) chairs about whether there were other NGOs in the village dealing with health is-sues. Consistent with the attenuating effect of exposure to other NGO programming, we find thatthe positive impact of ACT Health on treatment quality is only significant in areas in which otherhealth-oriented NGOs are absent.
Finally, the intervention may have been more likely to have an impact in areas where theaverage distance between households and the health center is relatively low by making it easierto gather, share information, and check on the facility and its staff. We might also expect tofind different effects areas that are more or less rural. We find evidence that treatment effects onutilization are only significant in urban areas and in places with a low distance between householdsand the health center. Effects on treatment quality and patient satisfaction, meanwhile, are drivenby the intervention’s impact in rural areas and places with a low distance between households andthe health center.
6 Discussion
The primary objective of our evaluation was to test whether the ACT Health program—and, byextension, interventions like it that aim to improve local service delivery through information pro-vision and community mobilization—generated improvements in the health outcomes of citizensliving in proximity to treated clinics. Although we do find evidence for the program’s effects onthe quality of care provided at those clinics, we find no impact on health outcomes per se. Theseresults are robust to numerous alternative specifications, including an exploration of treatment ef-fects in subsets of health centers, communities, and households where theory would have led us toexpect to find stronger effects of exposure to the intervention.
Beyond these main results, two other findings have important implications for the literatureon service provision and accountability. The first is our finding that exposure to the interventioncauses patients to say they were more satisfied with the quality of the care they receive at theirlocal health center. The second is the lack of evidence we find that the intervention had any effecton citizens’ monitoring behavior. We discuss each in turn.
24
6.1 Patient Satisfaction
In light of the evidence that ACT Health led to improvements in treatment quality—and that theseimprovements were already apparent by midline (see Appendix E.7)—our findings with respect topatient satisfaction make sense: the increase in patients’ satisfaction with their care is plausibly aresponse to the positive changes in health providers’ behavior, as captured in our treatment qualityindex.41 Since these changes in provider behavior were not associated with measurable changesin actual health outcomes, we can infer that patient satisfaction may be rooted in the characterof patients’ interactions with their health care providers rather than in improvements in healthoutcomes that these interactions might generate.42
An alternative interpretation is that our findings on patient satisfaction are due less to changesin health provider behavior than to the participatory nature of the ACT Health intervention. Otherstudies have found similar increases in citizen satisfaction following community members’ par-ticipation in interventions that involve consultation and/or direct participation in decision-making,even when the interventions have no tangible effects on other outcomes. For example, Olken(2010) finds that Indonesian villagers whose communities were randomly assigned to choose localdevelopment projects by direct plebiscite rather than through meetings of representative coun-cils (as was the practice prior to the intervention) were much more satisfied with the outcome ofthe process, even though the projects selected were no different. Beath, Christia and Enikolopov(2017) find similarly that citizens in Afghanistan who participated directly in the selection of localdevelopment projects were significantly more satisfied with the outcome than those whose projectswere chosen by elected village elites, even when the projects selected were equally in keeping withtheir preferences.
These findings suggest that including non-elite community members in decision-making pro-cesses can generate satisfaction with the outcomes generated, even if the outcomes themselves areunaffected by the community members’ participation. These effects may be particularly strongin settings like Indonesia and Afghanistan—and also Uganda—where, for reasons of elite captureor status differentials between regular citizens and service providers, community members rarelyhave their opinions taken seriously by elites and are ordinarily shut out of participation in collec-tive decision-making. In such contexts, simply being asked for one’s views and being in a positionto interact on an equal basis with comparatively high status service providers (even if just in afacilitated meeting) may alter citizens’ subjective perceptions of the performance of the actors andinstitutions that they are later asked to evaluate.43
41Consistent with this interpretation, we find suggestive evidence that changes in treatment quality between baselineand midline are associated with changes in patient satisfaction between midline and endline (see Appendix E.5).However, as seen in Table 2, this tracking does not hold within all subgroups.
42This is a common finding in the medical literature. For example, see Kahn et al. (2015).43This logic raises the possibility that the treatment quality effects we estimate might be driven by respondents’
rosier views of health providers. We believe we can rule this out for two reasons. First, four of the nine componentsof the treatment quality index (including the crucial drug availability measure) were measured directly by our researchteam during its initial unannounced visit to the health center, and are thus not susceptible to reporting bias by respon-dents who might have been pleased with having been included in the study. Second, as discussed in Section 4.2.3above, 80 percent of our household survey respondents reported that they had not participated in the community orinterface meetings, and could therefore not have been affected by having been included in the deliberative process orbeing treated as equals with higher status doctors and nurses.
25

An interesting wrinkle in our patient satisfaction findings is that they are absent at midline (seeAppendix E.7). In contrast to the findings in Beath, Christia and Enikolopov (2017), who reportthat satisfaction decays during the two years between their midline and endline surveys, we findthat patient satisfaction takes time to grow. This fact holds out the possibility that there mightbe longer-term consequences for health outcomes that we are not (yet) in a position to measure:if patients who are satisfied with the quality of the care they receive from their health center aremore likely to seek treatment when they are ill (recall that, at baseline, 33 percent of householdsthat reported having a health condition that required care chose to self-treat), then improvementsin patient satisfaction may lead to increases in downstream utilization that, in turn, may lead toimprovements in health outcomes in the future. This possibility is consistent with the fact thatwhile our estimate for the impact of exposure to ACT Health on utilization rates is still below thethreshold of statistical significance at endline, it is greater than at midline (point estimate=0.029at endline versus -0.009 at midline).
6.2 No Evidence of Community Monitoring
Equally important as our null findings with respect to utilization, health outcomes, and child mor-tality is the lack of evidence we find for treatment effects on community monitoring. In the litera-ture on transparency and accountability, the whole rationale for providing information to citizens isthat it will put them in a better position to monitor and sanction underperforming service providers(Khemani, 2007; Mansuri and Rao, 2013; World Bank, 2016). The ACT Health intervention, whichincluded not just information provision but also hands-on mobilization of community members toencourage them to use the information they received to scrutinize the behavior of their local healthproviders and hold them accountable for poor performance, provides a strong test of this presumedcausal channel. Our finding that ACT Health had no impact on any of our measures of commu-nity monitoring, but that treatment quality nonetheless improved in health centers exposed to theintervention, therefore raises questions about the salience of this broadly accepted mechanism.
The lack of evidence for community monitoring comes not just from the null effects on thethree intermediate outcome indices that capture aspects of community monitoring (as highlightedin Section 5.2) but also from the specific index components that most directly measure citizens’abilities to monitor and apply bottom-up pressure on health workers (see Appendix E.2 for details).For example, the household questionnaire asked respondents whether they thought that engagedcommunity members would find out if a health worker did not report for work or did not providethe effort that he/she should in caring for patients. Seventy-three percent of households in thecontrol group answered these questions in the affirmative, suggesting that citizens’ confidence intheir ability to detect poor health service delivery was already fairly high prior to the interven-tion.44 However, among those exposed to the intervention, we see no increase in this confidence.Similarly, while 45 percent of households at baseline reported that they thought that communitymembers were responsible for making sure health workers came to work and provided high qualityhealth services, exposure to the ACT Health programming generated no increase in this sense ofresponsibility for monitoring. Survey respondents in households located in treated villages wereslightly more likely to report at midline that they thought they had a say in how health centers
44These questions were not asked at baseline. The 73 percent figure comes from the control group at midline.
26

provided health care to their community, that they could pressure a health worker to report to workon time if the worker were regularly coming late, and that they could pressure a health worker toexert better effort in caring for patients. However, these effects disappeared by endline. To the ex-tent that sustained confidence in one’s ability to effect change—efficacy—is a necessary conditionfor citizens to invest in applying bottom-up pressure on health providers, these findings may helpaccount for why we see such weak effects on citizen monitoring.
Notwithstanding the theoretical and policy appeal of the community monitoring approach,bottom-up pressure is extremely difficult to mobilize. Collective action problems may simplybe too hard to overcome; citizens’ efficacy and sense of responsibility for monitoring health careproviders may be too weak; formal institutions such as local councils may be moribund and/orcorrupt, and therefore unable to support citizens’ monitoring efforts; and, compared to the othermore immediate problems people face, health care may be insufficiently important to justify theinvestments in time and energy that the monitoring approach assumes community members willbe willing to make to try to effect change (Lieberman, Posner and Tsai, 2014).
Although commonly invoked to provide theoretical justification for a bottom-up, information-focused approach to improving service delivery, the logic of the principal agent framework alsohelps explain the limits of such a strategy. As explicated in the classic theoretical treatments ofRoss (1973), Arrow (1974), and Holmstrom (1979), and more recently summarized in Besley(2007), the crux of the principal-agent problem lies in two inherent characteristics of the relation-ship between any actor and the agent to whom she has delegated responsibility for completinga task. The first is that the principal cannot directly observe the actions of the agent—whetherhe comes to work on time (or at all), how hard he works, whether he has been wasteful with re-sources, etc. The second is that the outcome the principal observes is affected by factors outside ofthe agent’s control. This makes it very difficult for the principal to make a clear inference about theagent’s actions from the outcome that she observes (whether the task is completed expeditiouslyand with what quality). Simply supplying community members with information about the out-comes that have been achieved at the health center or how these outcomes compare with districtaverages (which is precisely the kind of information the CRC provides) does nothing to solve theproblem of the health workers’ effort being unobservable. If outcomes are found to be deficient,community members will have no way of knowing whether the poor performance stems from loweffort by the health center staff or, as the health workers will certainly claim, from circumstancesoutside of their control—underfunding, staff shortages, delays in the delivery of drugs and othersupplies, or other factors.
These considerations are reinforced by the absence in the setting we study of another key factorstressed in principal-agent models—the ability to sanction. To the extent that information provisionworks, it may be that it only does where citizens have actual leverage over the frontline serviceproviders they are being encouraged to monitor. In our study context—as in many developingcountry settings where interventions like ACT Health have been deployed—it is difficult to imaginehow even highly mobilized citizens would be able to sanction underperforming service providers.45
45Citizen monitoring interventions aimed at shaping the behavior of elected officials over whom citizens in principlehave sanctioning power via their votes may be more promising (World Bank, 2016). Grossman and Michelitch (2018)find that Ugandan politicians about whom performance information was circulated to voters did in fact perform better.However, this positive effect was limited to competitive constituencies—that is, settings where citizens possessed real
27
Absent the ability to sanction, investments in monitoring may appear futile, and thus not be made.
But if citizens lack the power to sanction frontline health care providers from the bottom-up, what about the local government officials who oversee them? Can this alternative set ofprincipals—who, by virtue of their formal oversight role and/or their connections with actorshigher up in the government who do have the ability to sanction underperforming health careworkers—successfully apply pressure from the top down? Although ACT Health did not explicitlyinvolve district- or subcounty-level government health officials in its programming, such officialswere informed of the intervention and invited to attend the community and interface meetings, andour implementing partners kept careful records of whether or not such officials did, in fact, attendthe meetings (see Appendix H.2). Where they did, the effect of the intervention on treatment qual-ity nearly doubled (see Appendix E.5). This result is highly suggestive of the power of top-downmonitoring to improve the performance of frontline service providers.46
While our results suggest that the ACT Health intervention did (at least modestly) change thebehavior of health care providers, they also suggest that these changes were not due to bottom-uppressure from citizens. It may be satisfying from a democratic theory perspective to think thatwe can “harness transparency and citizen engagement” (to borrow the sub-title of a recent WorldBank study) or that the answer to the problem of poor service delivery lies in giving “power to thepeople.” But mobilizing citizens to monitor and apply pressure on frontline providers may not bethe most powerful strategy for improving the quality of health care and other services. Our findingssuggest that more direct engagement with service providers, and perhaps top-down monitoring bygovernment officials, may be a more promising approach.
7 Reconciling the Divergent Results in ACT Health and P2P
How can we reconcile the divergent findings in ACT Health and the original P2P study? WhereasBjorkman and Svensson (2009) report strong effects on citizen monitoring, treatment practices,immunization rates, utilization, and health outcomes, we find effects only on treatment quality,and no statistically significant impact on utilization, health outcomes or child mortality.47 Wediscuss several possible sources of these different findings.48
leverage over the politicians. Interestingly, these effects seem to have been produced by politicians anticipating thatvoters would withdraw their support if they received unflattering information about their performance, not by theactual withdrawal of support by disenchanted voters. So even these positive results provide only weak evidence forthe power of citizen action. For similar findings regarding voters’ weak responses to information about politicians’performance, see the studies in Dunning et al. (Forthcoming).
46Raffler (2017) finds similarly that Ugandan councilors are effective in monitoring local bureaucrats, althoughonly when they can call on Members of Parliament or local media as external levers. The findings are also consistentwith World Bank (2016), which concludes that ”a key condition for successful local action is the signal by higher-tiergovernment departments that local citizen action would be taken seriously and used by leaders with power...to holdlocal officials accountable” (p. 199).
47We also find significant effects on patient satisfaction, but this is not an outcome that Bjorkman and Svensson(2009) measure.
48The differences highlighted in the discussion that follows are summarized in Appendix G.
28
7.1 Different Baselines
A first possible answer lies in the ten year interval between the P2P and ACT Health interventions—the former in 2004-2005; the latter in 2014-2016. Health outcomes in Uganda improved markedlyduring this period. Under-five mortality fell from 128 to 64 per 1,000 live births; the share ofbirths attended by a skilled provider rose from 42 percent to 74 percent; the incidence of stuntingfell from 38 percent to 29 percent; wasting fell from 6.1 percent to 3.6 percent; and the share ofchildren aged 12-23 months receiving all of their basic vaccinations rose from 46 to 55 percent(Uganda Bureau of Statistics, 2007, 2017).49 In addition, the volume of health-related program-ming in rural Uganda increased significantly over that time span. Appendix Table G1 comparesthe two samples. Given the magnitude of these differences, we cannot rule out the possibility thatdiffering baseline conditions may be responsible for the differences we see across the two studies.It may simply be easier to improve health outcomes when they are starting at a lower baselinelevel, or when the health intervention space is less crowded.50
7.2 Different Samples
P2P and ACT Health were implemented in different parts of Uganda, with districts from the CentralRegion overrepresented in the P2P sample (4 of 9) and underrepresented in the ACT Health sample(just 2 of 16).51 Although both studies block randomized their treatment assignments by district toensure that district-level variation in local conditions would not bias estimates of treatment effects,such district-level variation might account for the differences in the estimated impacts of treatmentacross the two studies, given the different districts included in each sample. We investigated thispossibility by sub-setting our analyses by region and find that our null results on utilization, healthoutcomes, and child mortality are found in all four regions (results not shown). This suggests thatthe contrasting findings in P2P and ACT Health do not stem from the different districts in whichthe two programs were implemented.
Another difference between P2P and ACT Health is the levels of health centers included ineach study. Whereas P2P was implemented only in HC3s, ACT Health was implemented in bothHC3s and HC2s. As discussed in Section 5.4.1, health centers at these two levels differ in severalways that may affect treatment uptake. To test whether the inclusion of HC2s in our sample, aswell as the different baseline health conditions discussed above, might be responsible for the twostudies’ divergent findings, we re-ran our analysis in the sub-sample of HC3s whose average base-line child mortality rates were within one standard deviation of those reported at baseline in P2P(see Appendix E.10). This is a small set of units (just 29 health centers), but it is the sample mostcomparable to the one studied in P2P. When we restrict our analysis in this manner, we estimate
49Stunting and wasting are defined as height-for-age and weight-for-height, respectively, that are more than 2 stan-dard deviations below the median of the WHO child growth standards.
50This may account for why, in preliminary results, Dube, Haushofer and Siddiqi (2018) find treatment impactson utilization and child mortality (although not on service quality, patient satisfaction, or other health outcomes) in aP2P-inspired community monitoring health intervention in Sierra Leone: the under-five mortality rate in Sierra Leoneat the time of their study was 182 per 1,000 live births—even higher than in Uganda at the time of P2P.
51Of the 25 districts included in the two studies—9 in P2P; 16 in ACT Health—there was only one overlappingdistrict, Apac.
29
a statistically significant decline in child mortality rates. This reinforces the suggestion that thedifferent samples and baseline conditions in ACT Health and P2P may indeed be relevant—at leastfor this one important outcome. However, given that we see no effects on utilization or treatmentquality, as well as a statistically significant decrease in the health outcomes index—all of whichwe would expect to move in concert with child mortality—we hesitate to put too much weight onthis finding. We also note that the significant child mortality results in this restricted sample do notsurvive the False Discovery Rate adjustment and are not robust to aggregating to the health centerlevel or to dropping control variables or fixed effects. Similarly, we note a significant increase incommunity monitoring in the restricted sample, which is, however, not robust to the dropping ofdistrict fixed effects, aggregation to the health center level, and a difference-in-difference estima-tion (see Appendix E.10).
7.3 Program Implementation and Data Collection
A third set of possible answers lies in subtle differences in the ways the P2P and ACT Healthprograms were implemented. One possibility that we believe we can rule out with confidence isthat the (largely) null results in ACT Health might be a product of poor program implementation.GOAL Uganda went to great lengths to train and monitor its local partners, and collected copiousdata on the implementation of its programming.52 These data confirm that the programming wascarried out faithfully.
A more promising explanation lies in the different ways P2P and ACT Health worked with im-plementing partners to run the two interventions. P2P was implemented by 18 community-basedorganizations (CBOs) that had been active, primarily in health-related programming, in 64 percentof the treatment communities and 48 percent of the control communities prior to the intervention(Bjorkman and Svensson, 2009). It is possible, therefore, that the CBOs’ prior work in the P2Ptreatment areas bolstered the intervention’s impact, either through the social connections that CBOmembers had fostered with the community (which made their mobilization efforts more effectiveand potentially increased community members’ confidence that they could sanction underperform-ing health providers), because their prior work had increased the communities’ collective actionpotential (similar to the findings in Fearon, Humphreys and Weinstein (2015)), due to the specif-ically health-related programming they had undertaken prior to the P2P intervention (which laidthe groundwork for the programming in P2P), or because CBOs chose to work in places wherecitizens and health providers were thought to be more responsive. Donato and Garcia Mosqueira(Forthcoming) raise this issue in their replication and extension of Bjorkman and Svensson’s anal-ysis.53 They show that the addition of a control for prior CBO presence and an interaction betweenprior CBO presence and treatment assignment leads to a reduction in the magnitude of some ofthe estimated effects reported in P2P. Their findings suggest the possibility that the interventionwas more effective in places where CBOs had previously worked.54 ACT Health, by contrast, was
52For further details of GOAL’s monitoring efforts, see Appendix H.2.53P2P was one of 35 influential studies for which the International Initiative for Impact Evaluation (3ie) sponsored an
internal replication. Internal replications use data from the original study in order to check the validity and robustnessof its estimations and recommendations.
54For a nuanced discussion of this issue, see Blair et al. (2018).
30
implemented in partnership with four organizations that had not previously worked in the villagesin which they were deployed.55
Another potential explanation for the differences in findings lies in the different amount of timethe implementing teams spent in each community during their first mobilization visits (one half-day in ACT Health versus two half-days in P2P), and in the average number of participants in thecommunity meetings (100 in ACT Health versus 150 in P2P). Such reductions in the intensity of theintervention are common when programs are scaled up (Grossman, Humphreys and Sacramone-Lutz, 2016; Banerjee et al., 2017), and it is at least possible that this reduction in meeting sizeand time spent in the community may have generated weaker treatment effects on health outcomesin ACT Health. However, while P2P may have been more intense up front, ACT Health’s longertimeframe allowed for three follow-up meetings prior to endline data collection (with averagemeeting size of 41 participants) compared to just one follow-up meeting in P2P. So there are alsoreasons for expecting ACT Health to have had a greater impact than P2P.
Finally, the P2P intervention, but not ACT Health, included a role playing exercise as part ofthe interface meeting in which community members and health center staff pretended they werein each others’ positions. To the extent that such an exercise creates opportunities for discussingsensitive issues such as absenteeism or fosters a deeper appreciation of the challenges faced by theother actor in the principal-agent relationship, its absence from the ACT Health programming mayhave reduced its impact.
7.4 Variable Operationalization and Econometric Specifications
A fourth possible source of the divergent findings in ACT Health and P2P lies in the differentvariable operationalizations and statistical tests used in the two studies. We adopted somewhatdifferent outcome measures and made slightly different modeling choices where we felt that mod-ifications to the empirical strategy employed in P2P would generate stronger tests, or in order tobetter align our analyses with best practices in the public health field.56 The inclusion of HC2s inour study also required changes to some of our outcome measures.57
To test whether our contrasting findings stem from these differences, we used Bjorkman andSvensson’s own specifications and variable operationalizations to replicate the main tables inBjorkman and Svensson (2009) using our own midline and endline data.58 As we show in Ap-pendix F, we are unable to replicate the P2P findings with respect to monitoring and information,
55We note that the practice of locating interventions in areas where implementing partners had prior experience iscommon practice in development programming. However, this design choice has implications for external validityand for scalability to settings beyond those where CBOs had previously worked.
56A key example of the latter is our decision to measure child mortality using a life table approach (see AppendixD for details).
57Since delivery services are generally not provided at HC2s, we dropped delivery and antenatal visits from ourutilization index to create a measure that could be applied across all units. We show in Appendix E.5 that adding thesecomponents back into our utilization index does not change our null findings with respect to utilization.
58Our analysis is based on the code provided to us by Katherine Donato and Adrian Garcia Mosqueira (the repli-cation team that 3ie sponsored to replicate P2P), which they received from Bjorkman and Svensson. We were notprovided access to Bjorkman and Svensson’s original code.
31
immunization, utilization/coverage, or health outcomes. We infer that the differences between theresults on these outcomes in ACT Health and P2P are not due to the different specifications orvariable definitions used in each study.
Notwithstanding our attempt to model ACT Health as closely as possible on P2P, our discus-sion of the many differences across the two studies with respect to study populations, baselineconditions, program implementation, variable operationalization, and econometric specificationsunderscores just how challenging it is to replicate (and, by doing so, attempt to confirm or discon-firm the findings of) a prior field experiment.59 It suggests that whether one puts greater stock inthe original study or the subsequent one depends less on a judgment that one study or the otheris “right” than on an appraisal of each study’s power to detect treatment effects, an assessmentof the appropriateness of the econometric specifications and variable operationalizations that wereemployed to evaluate program impact, and on the match between each study’s sample and the pop-ulation to which one seeks to apply the findings. On these grounds, we view our evaluation of ACTHealth as providing the more definitive answer to the question of whether bottom-up approachesto improving health outcomes are likely to be successful in settings like contemporary Uganda.
8 Conclusion
One of the most influential ideas in development circles in recent years is that service deliveryshortfalls in developing countries stem from an “information gap” that prevents citizens from hold-ing local service providers accountable for poor performance (Khemani, 2007; Mansuri and Rao,2013; Kosack and Fung, 2014; World Bank, 2016). The presumed solution to this problem is toprovide citizens with information—often in the form of a report card—about the quality of servicesbeing provided to their community, sometimes along with information about government standardsthat are supposed to be (but are often not) met and/or comparative information about the quality ofservice provision in other communities. Armed with this information, it is thought that citizens canthen apply pressure on underperforming service providers, who will respond by improving theirperformance.
The findings of our evaluation of the ACT Health program—a large-scale community mon-itoring intervention modeled precisely on the received wisdom about the power of informationto initiate this causal process—raise questions about the usefulness of this development strategy.While we find evidence for marginal effects of the intervention on treatment quality, we find noevidence for its impact on utilization or health outcomes (including child mortality)—the bottom-line outcomes that development practitioners ultimately want to affect. We also find no evidencethat the intervention caused citizens to more closely monitor their local health care providers or toapply pressure on those who were revealed to be underperforming.
Our findings with respect to treatment quality suggest that providing information about servicequality can indeed lead to (small) changes in the behavior of frontline service providers. But our
59Indeed, our view is that the ACT Health should be seen not as a “replication” of P2P but as what Clemens (2017)terms a “robustness test,” since it employs different code from that used in the original study data gathered from botha different population and at a different time.
32

findings with respect to community monitoring indicate that the link between information provi-sion and provider behavior does not run through citizen pressure. Indeed, our findings regardingthe impact of having government officials present during the intervention suggest that providinginformation to top-down principals may be a stronger lever for changing the behavior of frontlinehealth providers than mobilizing pressure from the bottom-up. Moreover, our robust null resultwith respect to health outcomes (including child mortality) suggest that changes in the behaviorof health providers does not necessarily lead to measurable improvements in the well being ofthe community that the health providers serve—at least for the health outcomes we measure andwithin the time frame we study.60
Our results underscore the difficulty in changing bottom-line health outcomes and suggest thata sharper distinction should be made between outcomes that may be directly affected by a devel-opment intervention, such as health provider behavior, and outcomes that are products of morecomplex causal processes in which the outcomes that the intervention can plausibly move mayonly play a minor role, such as utilization and child health.
References
Algan, Yann, Camille Hemet, David Laitin et al. 2016. “The social effects of ethnic diversity atthe local level: A natural experiment with exogenous residential allocation.” Journal of PoliticalEconomy 124(3):696–733.
Andrabi, Tahir, Jishnu Das and Asim Ijaz Khwaja. 2017. “Report cards: The impact of providingschool and child test scores on educational markets.” American Economic Review 107(6).
Arinaitwe, Solomon. 2017. “Drug thefts mar hospitals as patients bear brunt.” Daily Monitor .
Arrow, Kenneth. 1974. “Essays in the theory of risk-bearing.” Journal of Business 47(1).
Banerjee, Abhijit, Rema Hanna, Jordan Kyle, Benjamin A. Olken and Sudarno Sumarto. 2018.“Tangible information and citizen empowerment: Identification cards and food subsidy programsin Indonesia.” Journal of Political Economy 126(2):451–491.
Banerjee, Abhijit, Rukmini Banerji, Esther Duflo, Rachel Glennerster and Stuti Khemani. 2010.“Pitfalls of participatory programs: Evidence from a randomized evaluation in education in India.”American Economic Journal: Economic Policy 2(1):1–30.
Banerjee, Abhijit, Rukmini Banerji, James Berry, Esther Duflo, Harini Kannan, Shobhini Mukerji,Marc Shotland and Michael Walton. 2017. “From proof of concept to scalable policies: Challengesand solutions, with an application.” Journal of Economic Perspectives 31(4):73–102.
60While we think it is unlikely, we cannot rule out that we would have found treatment effects on other healthoutcomes—for example, disease rates or disability affected life years—had we measured them. We also cannot dismissthe possibility that the process of behavioral change created by an intervention like ACT Health takes more than 20months to generate discernible effects on health outcomes or child mortality. If this is the case, then we measured ouroutcomes too soon. We can, however, rule out with some confidence that we measured our outcomes too late, sinceour null findings are little changed when we examine midline rather than endline data.
33

Barr, Abigail, Frederick Mugisha, Pieter Serneels and Andrew Zeitlin. 2012. “Information andcollective action in community-based monitoring of schools: Field and lab experimental evidencefrom Uganda.” Working paper.
Beath, Andrew, Fotini Christia and Ruben Enikolopov. 2017. “Direct democracy and resource al-location: Experimental evidence from Afghanistan.” Journal of Development Economics 124:199–213.
Benjamini, Yoav and Yosef Hochberg. 1995. “Controlling the false discovery rate: A practical andpowerful approach to multiple testing.” Journal of the Royal Statistical Society. Series B (Method-ological) pp. 289–300.
Besley, Timothy. 2007. Principled agents? The political economy of good government. OxfordUniversity Press.
Bjorkman, Martina and Jakob Svensson. 2009. “Power to the people: Evidence from a random-ized field experiment of a community-based monitoring project in Uganda.” Quarterly Journal ofEconomics 124(2):735–769.
Bjorkman, Martina and Jakob Svensson. 2010. “When is community-based monitoring effective?Evidence from a randomized experiment in primary health in Uganda.” Journal of the EuropeanEconomic Association 8(2-3):571–581.
Bjorkman Nyqvist, Martina, Andrea Guariso, Jakob Svensson and David Yanagizawa-Drott. 2016.“Effect of a micro entrepreneur-based community health delivery program on under-five mortalityin Uganda: A cluster-randomized controlled trial.”.
Bjorkman Nyqvist, Martina, Damien de Walque and Jakob Svensson. 2017. “Experimental ev-idence on the long-run impact of community-based monitoring.” American Economic Journal:Applied Economics 9(1):33–69.
Blair, Graeme, Jasper Cooper, Alexander Coppock and Macartan Humphreys. 2018. “Declaringand diagnosing research designs.” Working paper.
Clemens, Michael A. 2017. “The meaning of failed replications: A review and proposal.” Journalof Economic Surveys 31(1):326–342.
Cox, D. R. 1972. “Regression Models and Life-Tables.” Journal of the Royal Statistical Society34(2):187–220.
Donato, Katherine and Adrian Garcia Mosqueira. Forthcoming. “Information improves providerbehaviour: A replication study of a community-based monitoring programme in Uganda.” Journalof Development Studies .
Dube, Oindrila, Johannes Haushofer and Bilal Siddiqi. 2018. “Top-down or bottom-up? Impactsof community monitoring and government awards on health care in Sierra Leone.” Working Paper.
Dunning, Thad, Guy Grossman, Macartan Humphreys, Susan D. Hyde, and Craig McIntosh. Forth-coming. Metaketa 1: The limits of electoral accountability. Cambridge University Press.
34

Fearon, James D, Macartan Humphreys and Jeremy M Weinstein. 2015. “How does develop-ment assistance affect collective action capacity? Results from a field experiment in post-conflictLiberia.” American Political Science Review 109(3):450–469.
Fiala, Nathan and Patrick Premand. 2017. “Social accountability and service delivery: Evidencefrom a large-scale experiment in Uganda.”.
Grossman, Guy and Kristin Michelitch. 2018. “Information dissemination, competitive pressure,and politician performance between elections: A field experiment in Uganda.” American PoliticalScience Review 112(2).
Grossman, Guy, Macartan Humphreys and Gabriella Sacramone-Lutz. 2016. “Information tech-nology and political engagement: Mixed evidence from Uganda.” Working paper.
Group, United Nations Development, United Nations Population Fund and United Nations. Statis-tical Division. 2003. Indicators for monitoring the Millennium Development Goals: definitions,rationale, concepts and sources. Vol. 95 United Nations Publications.
Holmstrom, Bengt. 1979. “Moral hazard and observability.” The Bell Journal of Economics pp. 74–91.
Imai, Kosuke, Luke Keele and Dustin Tingley. 2010. “A general approach to causal mediationanalysis.” Psychological Methods 15(4):309.
Kahn, Steven A., James C. Iannuzzi, Nicole A. Stassen, Paul E. Bankey and Mark Gestring. 2015.“Measuring satisfaction: factors that drive hospital consumer assessment of healthcare providersand systems survey responses in a trauma and acute care surgery population.” The American Sur-geon 81(5):537–543.
Keefer, Philip and Stuti Khemani. 2014. “Mass media and public education: The effects of accessto community radio in Benin.” Journal of Development Economics 109:57–72.
Khemani, Stuti. 2007. “Can information campaigns overcome political obstacles to serving thepoor?” The Politics of Service Delivery in Democracies: Better Access for the Poor pp. 56–69.
Khwaja, Asim Ijaz. 2009. “Can good projects succeed in bad communities?” Journal of PublicEconomics 93(7):899–916.
Kling, Jeffrey R., Jeffrey B. Liebman and Lawrence F. Katz. 2007. “Experimental analysis ofneighborhood effects.” Econometrica 75(1):83–119.
Kosack, Stephen and Archon Fung. 2014. “Does transparency improve governance?” AnnualReview of Political Science 17:65–87.
Lieberman, Evan S., Daniel N. Posner and Lily L. Tsai. 2014. “Does information lead to moreactive citizenship? Evidence from an education intervention in rural Kenya.” World Development60(August):69–83.
Lin, Winston, Donald Green and Alexander Coppock. 2016. “Standard operating procedures: ASafety net for pre-analysis plans.” PS: Political Science & Politics 49(3):495–499.
35

Lin, Winston et al. 2013. “Agnostic notes on regression adjustments to experimental data: Reex-amining Freedman’s critique.” The Annals of Applied Statistics 7(1):295–318.
Mansuri, Ghazala and Vijayendra Rao. 2013. Localizing development: Does participation work?Washington, DC: World Bank.
Miguel, Edward and Mary Kay Gugerty. 2005. “Ethnic diversity, social sanctions, and publicgoods in Kenya.” Journal of Public Economics 89(11):2325–2368.
Molina, Ezequiel, Laura Carella, Ana Pacheco, Guillermo Cruces and Leonardo Gasparini. 2016.“Community monitoring interventions to curb corruption and increase access and quality of servicedelivery in low-and middle-income countries: a systematic review.” Campbell Systematic Reviews12.
Olken, Benjamin. 2007. “Monitoring corruption: Evidence from a field experiment in Indonesia.”Journal of Political Economy 115(2):200–249.
Olken, Benjamin. 2010. “Political institutions and local public goods: Evidence from a fieldexperiment in Indonesia.” American Political Science Review 104(7):243–267.
Pandey, Priyanka, Sangeeta Goyal and Venkatesh Sundararaman. 2009. “Community participationin public schools: Impact of information campaigns in three Indian states.” Education Economics17(3):355–75.
Pradhan, Menno, Daniel Suryadarma, Amanda Beatty, Maisy Wong, Arya Gaduh, Arminda Alis-jahbana and Rima Prama Artha. 2009. “Improving educational quality through enhancing commu-nity participation: Results from a randomized field experiment in Indonesia.” American EconomicJournal: Applied Economics 6(2):105–126.
Raffler, Pia. 2017. “Does political oversight of the bureaucracy increase accountability? Fieldexperimental evidence from an electoral autocracy.” Working paper.
Rosner, Bernard. 2015. Fundamentals of Biostatistics. Nelson Education.
Ross, Stephen A. 1973. “The economic theory of agency: The principal’s problem.” The AmericanEconomic Review 63(2):134–139.
Rowland, Donald T. 2003. “Demographic methods and concepts.” OUP Catalogue .
Rutaremwa, Gideon, Stephen Ojiambo Wandera, Tapiwa Jhamba, Edith Akiror and Angela Ki-conco. 2015. “Determinants of maternal health service utilization in Uganda.” BMC Health Ser-vices Research 15:271.
Rutstein, Shea Oscar and Guillermo Rojas. 2006. “Guide to DHS statistics.” Calverton, MD: ORCMacro .
Tsai, Lily L. 2007. “Solidary groups, informal accountability, and local public goods provision inrural China.” American Political Science Review 101(2):355–372.
36

Uganda Bureau of Statistics. 2007. Uganda Demographic and Health Survey, 2006. Kampala,Uganda: Bureau of Statistics.
Uganda Bureau of Statistics. 2017. Uganda Demographic and Health Survey 2016. Kampala,Uganda: Bureau of Statistics.
Uganda Ministry of Health. 2017. Annual health sector performance report, 2016-2017. Kampala,Uganda: Ministry of Health.
UNICEF. 2017. Levels and trends in child mortality. Technical report New York: .
World Bank. 2004. World Development Report 2004: Making services work for poor people.Washington, DC: World Bank.
World Bank. 2016. Making politics work for development: Harnessing transparency and citizenengagement. Washington, DC: World Bank.
37

Appendices
A Intermediate Outcomes 39
B Procedures to Ensure Data Quality 41
C Attrition, Balance, and Spillover 43
D Measuring Child Mortality 45
E Supporting Tables 47
E.1 Main Outcomes . . . . . . . . . . . . . . . . . . . . . . . . . . . . . . . . . . . . 47
E.2 Intermediate Outcomes . . . . . . . . . . . . . . . . . . . . . . . . . . . . . . . . 55
E.3 Treatment Effects on Subgroups of Health Centers . . . . . . . . . . . . . . . . . 61
E.4 Robustness Checks for Endline Results . . . . . . . . . . . . . . . . . . . . . . . 65
E.5 Additional Analyses . . . . . . . . . . . . . . . . . . . . . . . . . . . . . . . . . . 72
E.6 Main Results, by Treatment Arm . . . . . . . . . . . . . . . . . . . . . . . . . . . 77
E.7 Midline Results . . . . . . . . . . . . . . . . . . . . . . . . . . . . . . . . . . . . 85
E.8 Nonparametric Results . . . . . . . . . . . . . . . . . . . . . . . . . . . . . . . . 93
E.9 Multiple Comparison Corrections . . . . . . . . . . . . . . . . . . . . . . . . . . 94
E.10 Outcomes in Sub-samples Matching P2P . . . . . . . . . . . . . . . . . . . . . . . 94
F Replication of Tables in Power to the People 97
G Comparison of ACT Health and Power to the People 103
H Implementation of ACT Health 105
H.1 Implementing Organizations . . . . . . . . . . . . . . . . . . . . . . . . . . . . . 105
H.2 Implementation Monitoring . . . . . . . . . . . . . . . . . . . . . . . . . . . . . . 105
H.3 Intervention Materials . . . . . . . . . . . . . . . . . . . . . . . . . . . . . . . . . 110
38

A Intermediate Outcomes
The components of the seven intermediate outcome indices are as follows:
Citizen knowledge- Number of patients’ rights that the household head is able to name correctly- Number of patients’ responsibilities that the household head is able to name correctly- Number of services offered at the health center that the household head is able to name
correctly
Health center staff knowledge- Number of patients’ rights that HC staff is able to name correctly- Number of patients’ responsibilities that the HC staff is able to name correctly
Efficacy- Whether the household head thinks she has “a lot” or “some” influence in making the village
a better place to live- Whether the household head agrees that “People like you have a say about how the govern-
ment provides health care to your community.”- Whether the household head agrees that “People like you have a say about how health facil-
ities provide health care to your community.”- Whether the household head thinks that she has “a lot” or “some” power to improve the
quality of health care at her local HC- Whether the household head thinks she would be able to pressure a health worker to report
to work on time if the worker were regularly coming late- Whether the household head thinks she would be able to pressure a health worker to exert
better effort in caring for patients
Community responsibility- Whether the household head thinks she is responsible for making sure that health workers
come to work and provide high quality health services- Whether the household thinks that community members are responsible for making sure
health workers come to work and provide high quality health services
39

Community monitoring61
- Whether household members report having attended LC1 meetings in the last year- Whether household members who attended the LC1 meeting reported that the local HC was
discussed- Whether household members think that engaged community members would find out if a
health worker at the HC did not provide the effort that he/she should in caring for his/herpatients
- Whether household members think that engaged community members would find out if ahealth worker did not report for work.
Relationship between health care workers and the community- Whether HC staff report being “satisfied” or “very satisfied” with their relationship with the
community- Whether household members report being “satisfied” or “very satisfied” with their relation-
ship with the HC staff- Whether household members say they trust the workers at the HC- Whether household members did not say that the HC staff would “refuse to see me” or
“behave hostilely toward me” if they had a complaint about the quality of services at the HCand decided to talk to the facility staff
Health center transparency- Whether a poster showing the HC’s opening and closing hours was visible during the unan-
nounced visit to the HC- Whether a staff duty roster was displayed publicly during the unannounced visit to the HC- Whether a suggestion box was present during the unannounced visit to the HC- Whether information was posted listing services provided at the HC during the unannounced
visit to the HC- Whether information was posted about patients’ rights and responsibilities during the an-
nounced visit to the HC
61We deviate from our pre-analysis plan by dropping from the community monitoring index two components relat-ing to activities by the Health Unit Management Committee (HUMC): the frequency of HUMC monitoring, measuredat the HC level, and whether household members received information from the HUMC. Our reasoning for droppingthese two components is that HUMCs consist of both health workers and community members. Thus, we cannotdisentangle whether changes HUMC activity are due to behavior changes among health workers, which would bemore in line with a top-down accountability mechanisms, or among community members. To more cleanly measurebottom-up monitoring, we deem it prudent to only include components that relate to the behavior and perceptions ofcommunity members. Our findings regarding the impact of treatment on community monitoring are unchanged if weretain these two index components.
40
B Procedures to Ensure Data Quality
The IPA ACT Health project team followed a standard set of procedures and processes developedby IPA over the years to manage large-scale academic research projects. These protocols includespecific requirements for adhering to human subjects’ regulations, developing survey instruments,fielding data collection teams, implementing data quality reviews, and producing and cleaningdatasets for analysis.
The ACT Health project submitted research protocols for the three waves of data collectionto both a local IRB committee (Mildmay/MUREC and UNCST) and to IPA’s own internal IRBreview committee (#2127). The project team worked closely with local authorities and receivedapprovals for its work from the Office of the President, the Ugandan Ministry of Health, and fromthe chief administrative officers and district health officers in each of the 16 districts in which theproject was implemented.
All personnel who handled the data and identified surveys in the field were required to obtainIRB training certificates. All field officers (including surveyors) signed confidentiality forms andadministered informed consent to every respondent.
Data collection was undertaken in four distinct steps by teams headed by a research associateand consisting of field managers, team leaders, enumerators (health center, household, and anthro-pometric), mobilizers, trackers, and auditors.
1. Mobilization: A team of trained mobilizers contacted targeted households a day prior tothe start of data collection to alert them to the survey work to come and to document thelocations in which surveys would be administered. The conditions of the studied healthcenter was assessed, staff attendance was recorded, and drug supplies were checked duringa surprise visit to the health center on the same day. In-charges were notified to prepare therelevant records for the enumeration team’s visit the following day.
2. Enumeration: The enumeration team completed four different surveys.
(a) Household Survey: Household enumerators completed an average three to four surveysa day. The household survey took about one and a half hours to complete. Enumer-ators were instructed to interview the female head of the household. In the event thatthe female household head was no longer living in the house (at midline or endline),enumerators were instructed to follow the decision tree below to interview the correctperson. During the interview, enumerators were asked to assess the number of childrenunder five present in the household and to complete a form that household memberswould later give to anthropometric enumerators during their visits. At the end of theinterview, contact forms were given to the household with instructions on how to reportany comments to the HR management or IRB committee.
(b) Anthropometric Survey: Anthropometric enumerators were specially trained to mea-sure the height, weight and middle-upper arm circumference of all children in thehousehold under 5 years old. Anthropometric enumerators were in charge of collect-ing the form left by household enumerators to ensure that the household survey wasadministered.
41

(c) Health Center Survey: Each health center enumerator (three per team) completed onesurvey a day. The survey consisted of interviewing the in-charges (at endline, a surveyof other staff members was also added), assessing the quality of the health center, andcollecting administrative reports (HMIS, PHC funds, etc.). Health center enumerators’visits were announced but could not take place the day of an immunization campaign,when health center staff were occupied. Health center enumerators were instructed totake pictures of administrative report pages with their PDA to prevent misreporting.These pictures were deleted each evening by the field team leaders.
(d) LC1 Survey: Team Leaders were responsible for the LC1 surveys, which involvedinterviewing the LC1 chairman about the characteristic of the village (rural/urban), itssocial cohesion, the political affiliations of officials, and other topics.
3. Tracking: Household that could not be found on the day of the enumeration were tracked bya team of trackers who were also trained to do the anthropometric survey. Tracking sheetswere given to trackers by field managers after receiving approval from the research associate,following the decision tree below.
4. Auditing: Auditors performed back checks and spot checks (with field managers) on dailybasis. Auditors received auditing sheets from the research associate once household datacollection was finalized. They reported the findings of their investigations and handled theirsurveys directly to the research associate.
The IPA ACT Health survey team followed a set of standard operating procedures to ensurehigh quality data collection. These included:
• High quality training for everyone involved in the data collection: A total of four differentteams of 75 enumerators worked in the 16 different districts. Mobilizers, enumerators, au-ditors and team leaders went through one-week trainings before being selected, including asoft launch to put in practice what they had learned.
• High-frequency checks: Specific survey questions that were susceptible to typos or inco-herence were audited every evening by the research associates and field managers to ensuredata quality. Daily feedback was provided to enumerators based on the findings from themonitoring, back checks, and high-frequency checks.
• Back checks: During the survey itself, data auditors re-surveyed a random sub-sample ofsurvey participants (on a portion of the survey) to monitor enumerators’ performance and toconfirm that enumerators were interviewing the correct respondents. Field managers moni-tored their teams and accompanied each enumerator at least once every week.
• Monitoring and supervision of data collection: Research associates traveled with the surveyteam throughout the five months of the data collection and across the 16 different districtsto supervise the data collection process. Field managers were present in the villages inwhich enumeration was ongoing on daily basis in order to monitor the data collection andperform spot checks on randomly selected enumerators. Principal investigators were updatedin weekly calls about the data collection and were consulted to solve problems as they arose.
42
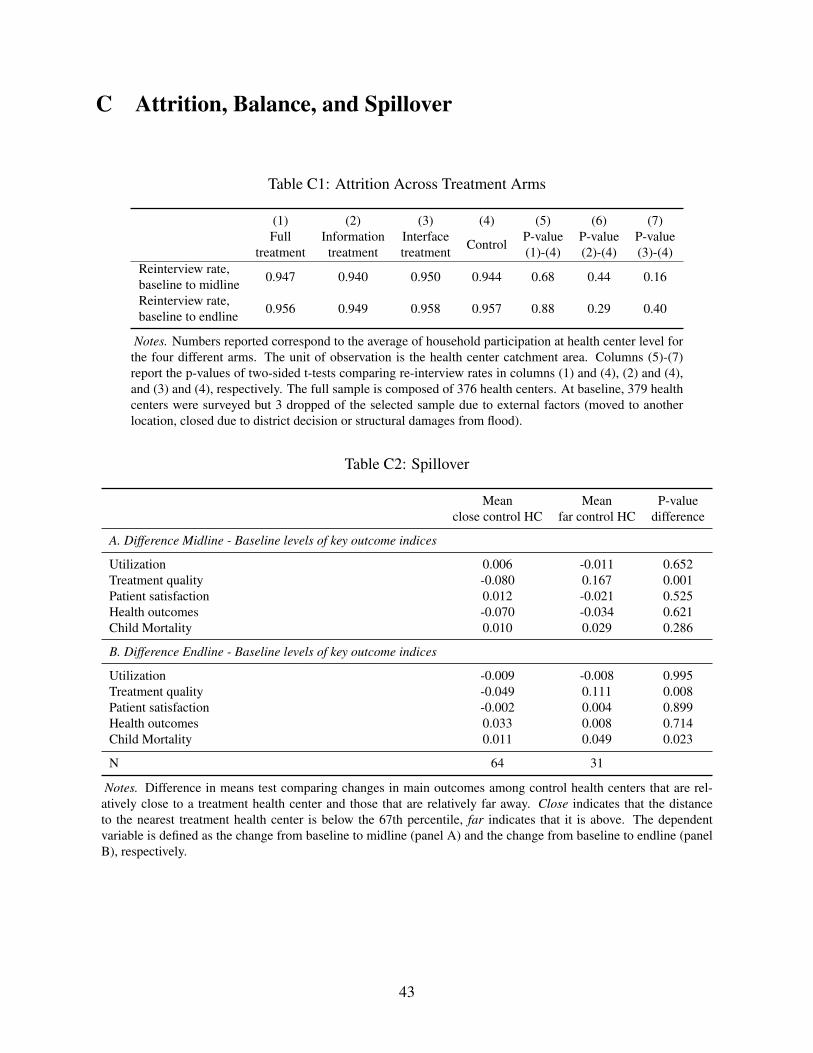
C Attrition, Balance, and Spillover
Table C1: Attrition Across Treatment Arms
(1) (2) (3) (4) (5) (6) (7)Full
treatmentInformationtreatment
Interfacetreatment Control P-value
(1)-(4)P-value(2)-(4)
P-value(3)-(4)
Reinterview rate,baseline to midline 0.947 0.940 0.950 0.944 0.68 0.44 0.16
Reinterview rate,baseline to endline 0.956 0.949 0.958 0.957 0.88 0.29 0.40
Notes. Numbers reported correspond to the average of household participation at health center level forthe four different arms. The unit of observation is the health center catchment area. Columns (5)-(7)report the p-values of two-sided t-tests comparing re-interview rates in columns (1) and (4), (2) and (4),and (3) and (4), respectively. The full sample is composed of 376 health centers. At baseline, 379 healthcenters were surveyed but 3 dropped of the selected sample due to external factors (moved to anotherlocation, closed due to district decision or structural damages from flood).
Table C2: Spillover
Meanclose control HC
Meanfar control HC
P-valuedifference
A. Difference Midline - Baseline levels of key outcome indices
Utilization 0.006 -0.011 0.652Treatment quality -0.080 0.167 0.001Patient satisfaction 0.012 -0.021 0.525Health outcomes -0.070 -0.034 0.621Child Mortality 0.010 0.029 0.286
B. Difference Endline - Baseline levels of key outcome indices
Utilization -0.009 -0.008 0.995Treatment quality -0.049 0.111 0.008Patient satisfaction -0.002 0.004 0.899Health outcomes 0.033 0.008 0.714Child Mortality 0.011 0.049 0.023
N 64 31
Notes. Difference in means test comparing changes in main outcomes among control health centers that are rel-atively close to a treatment health center and those that are relatively far away. Close indicates that the distanceto the nearest treatment health center is below the 67th percentile, far indicates that it is above. The dependentvariable is defined as the change from baseline to midline (panel A) and the change from baseline to endline (panelB), respectively.
43
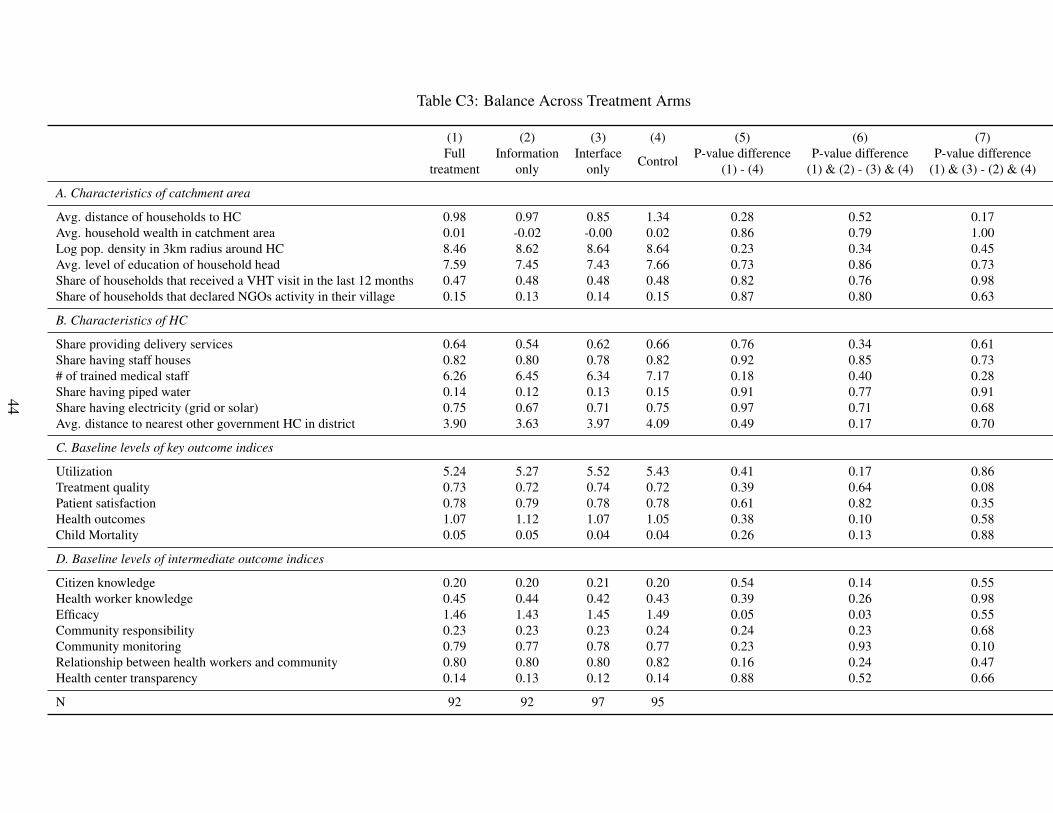
Table C3: Balance Across Treatment Arms
(1) (2) (3) (4) (5) (6) (7)Full
treatmentInformation
onlyInterface
only Control P-value difference(1) - (4)
P-value difference(1) & (2) - (3) & (4)
P-value difference(1) & (3) - (2) & (4)
A. Characteristics of catchment area
Avg. distance of households to HC 0.98 0.97 0.85 1.34 0.28 0.52 0.17Avg. household wealth in catchment area 0.01 -0.02 -0.00 0.02 0.86 0.79 1.00Log pop. density in 3km radius around HC 8.46 8.62 8.64 8.64 0.23 0.34 0.45Avg. level of education of household head 7.59 7.45 7.43 7.66 0.73 0.86 0.73Share of households that received a VHT visit in the last 12 months 0.47 0.48 0.48 0.48 0.82 0.76 0.98Share of households that declared NGOs activity in their village 0.15 0.13 0.14 0.15 0.87 0.80 0.63
B. Characteristics of HC
Share providing delivery services 0.64 0.54 0.62 0.66 0.76 0.34 0.61Share having staff houses 0.82 0.80 0.78 0.82 0.92 0.85 0.73# of trained medical staff 6.26 6.45 6.34 7.17 0.18 0.40 0.28Share having piped water 0.14 0.12 0.13 0.15 0.91 0.77 0.91Share having electricity (grid or solar) 0.75 0.67 0.71 0.75 0.97 0.71 0.68Avg. distance to nearest other government HC in district 3.90 3.63 3.97 4.09 0.49 0.17 0.70
C. Baseline levels of key outcome indices
Utilization 5.24 5.27 5.52 5.43 0.41 0.17 0.86Treatment quality 0.73 0.72 0.74 0.72 0.39 0.64 0.08Patient satisfaction 0.78 0.79 0.78 0.78 0.61 0.82 0.35Health outcomes 1.07 1.12 1.07 1.05 0.38 0.10 0.58Child Mortality 0.05 0.05 0.04 0.04 0.26 0.13 0.88
D. Baseline levels of intermediate outcome indices
Citizen knowledge 0.20 0.20 0.21 0.20 0.54 0.14 0.55Health worker knowledge 0.45 0.44 0.42 0.43 0.39 0.26 0.98Efficacy 1.46 1.43 1.45 1.49 0.05 0.03 0.55Community responsibility 0.23 0.23 0.23 0.24 0.24 0.23 0.68Community monitoring 0.79 0.77 0.78 0.77 0.23 0.93 0.10Relationship between health workers and community 0.80 0.80 0.80 0.82 0.16 0.24 0.47Health center transparency 0.14 0.13 0.12 0.14 0.88 0.52 0.66
N 92 92 97 95
44
D Measuring Child Mortality
We use three different approaches to measure child mortality rates: a child-level indicator forwhether a specific child is alive or dead in a given month, a synthetic cohort approach to calculatemortality rates per health center catchment area, which is similar to the method used in the Demo-graphic and Health Surveys (DHS), and the share of children who died in a catchment area, whichmirrors the vital statistics approach used in Bjorkman and Svensson (2009). We describe each inturn.
Originally, we planned to use a vital statistics approach to measure mortality rates, since thiswas the main approach used in Bjorkman and Svensson (2009).62 The vital statistics method usesa simple ratio of deaths under a certain age to live births during a recall period (Group, Fund andDivision, 2003). However, we updated our pre-analysis plan to prioritize the synthetic cohort lifetable approach because it offered a more precise measure of mortality. The difference in the datarequired for each method is that the synthetic life table approach requires the dates (month andyear) of birth and death for every child that died during the recall period. In contrast, the vitalstatistics approach only requires asking if any child under the age of five had died in the last 12months and the age they were when they died.
At endline, we collected the month of birth and, if applicable, death, also retrospectively for allchildren recorded during baseline and midline. Since the birth and death of children in the familyis a very salient event, we are in this case not concerned about recall bias. To the contrary, thesecond, retrospective round of data collection of the month and age of death proved to be a helpfulverification exercise, during which it became evident that a considerable share of the children thathad been reported as having died in the past 12 months during baseline or midline had in fact diedmuch earlier.
With this life table data, we are able to use an even more nuanced measure of child mortality.Since we have the month of birth and, if applicable, death, for all 20,598 children in our sampledhouseholds who were ever under the age of five or unborn at baseline and still lived in the household(if alive) at either midline or endline, we are able to create a panel dataset indicating whether eachchild is dead or alive in a given month over the course of the 36 month study period.63 This dataset,in turn, allows us to run child-level survival analyses using a Cox proportional hazards model(Cox, 1972), an estimation approach widely used for the analysis of survival rates (Rosner, 2015).We privilege this approach throughout the paper, while showing results from the (pre-registered)synthetic cohort approach in the appendix.
Child-level indicatorA 36-month panel dataset for 20,598 children (some of whom are born into the panel at a laterstage or age out of it), indicating for each month whether a child is dead or alive.
62Bjorkman and Svensson (2009) also use an alternative measure, a binary indicator for child death during the recallperiod.
63Twelve month recall period prior to the baseline, 12 months between baseline and midline, and 12 months betweenmidline and endline.
45
Synthetic cohort life tableThe synthetic cohort life table approach is similar to the method used in the Demographic andHealth Surveys (DHS) as described in Rutstein and Rojas (2006) and Rowland (2003).64 Theapproach calculates the probability of dying before a certain age (expressed per 1,000 births) bydividing the total number of deaths under that age by the total number of child years of exposureto the risk of dying.
Calculating the mortality rate using this approach involved the following steps:
- Step 1: Create an age variable for each month of the recall period between 12 months priorto the baseline and the endline survey. Our baseline survey was conducted between Au-gust and December, 2014 and the endline was conducted between August and Decemberof 2016. We therefore created a variable for the age in months beginning in August 2013:ageaug13; agesep13; . . .; agedec13; . . . ; agedec16.
- Step 2: Create a binary variable for the month that a child died: diedaug13; . . . ; dieddec16.
- Step 3: Create an age at death variable for each month: agediedaug13; . . . ; agedieddec16.
- Step 4: For each month, find the total number alive at each age, 0-59 months.
- Step 5: Sum the total number for each age across all months. (Use the mean number foreach age of the current and previous months.)
- Step 6: For each month, find the total number that died at each age.
- Step 7: Sum the total number that died at each age across all months.
- Step 8: Calculate the mortality rate for each age in months (number of deaths at age A/totalnumber of months at age A).
- Step 9: Calculate the survival rate for each age in months (1-mortality rate).
- Step 10: Calculate the overall survival rate by multiplying the individual age-specific sur-vival rates across the relevant ages (i.e. 0-59 months for under-five survival rate).
- Step 11: Find the overall mortality rate (1-survival rate).
Vital statistics approach
The vital statistics approach calculates child mortality as the ratio of dead children in a givenage bracket over all children in a given age bracket, dead or alive, calculated per catchment area.
64The approach has also been used to measure child mortality rates in a randomized evaluation of a communityhealth promoter program in Uganda implemented by Living Goods and BRAC (Bjorkman Nyqvist et al., 2016).
46
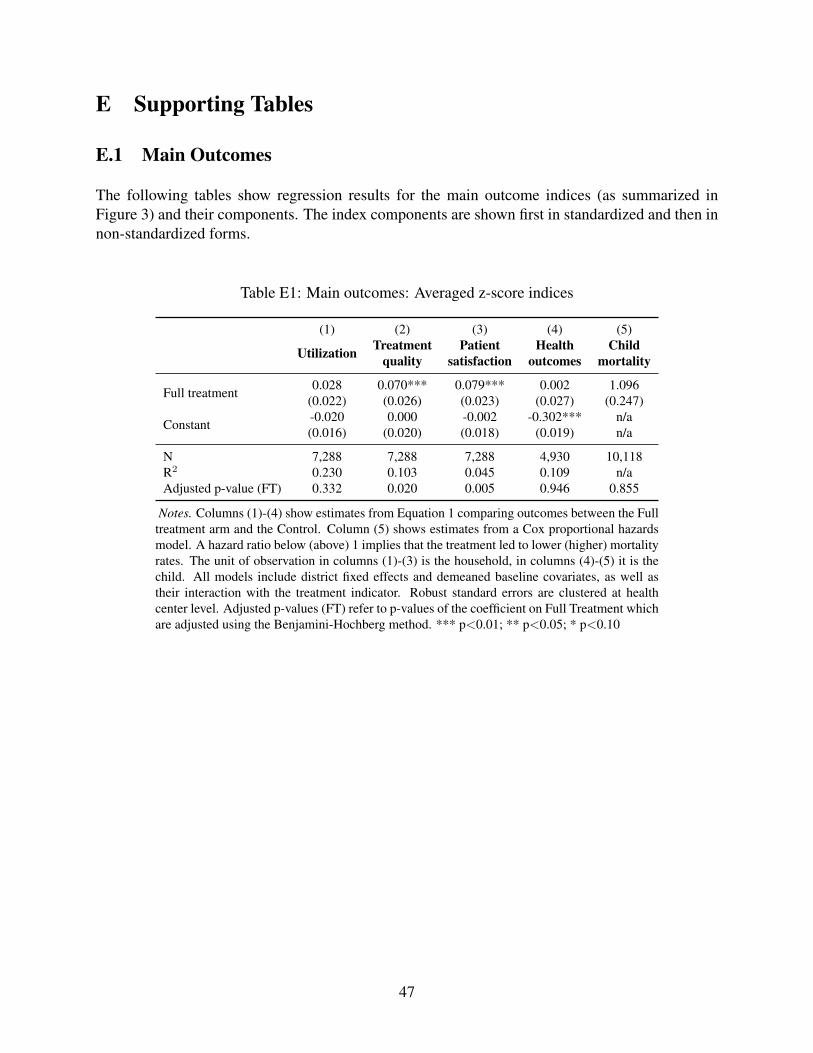
E Supporting Tables
E.1 Main Outcomes
The following tables show regression results for the main outcome indices (as summarized inFigure 3) and their components. The index components are shown first in standardized and then innon-standardized forms.
Table E1: Main outcomes: Averaged z-score indices
(1) (2) (3) (4) (5)
Utilization Treatmentquality
Patientsatisfaction
Healthoutcomes
Childmortality
Full treatment 0.028 0.070*** 0.079*** 0.002 1.096(0.022) (0.026) (0.023) (0.027) (0.247)
Constant -0.020 0.000 -0.002 -0.302*** n/a(0.016) (0.020) (0.018) (0.019) n/a
N 7,288 7,288 7,288 4,930 10,118R2 0.230 0.103 0.045 0.109 n/aAdjusted p-value (FT) 0.332 0.020 0.005 0.946 0.855
Notes. Columns (1)-(4) show estimates from Equation 1 comparing outcomes between the Fulltreatment arm and the Control. Column (5) shows estimates from a Cox proportional hazardsmodel. A hazard ratio below (above) 1 implies that the treatment led to lower (higher) mortalityrates. The unit of observation in columns (1)-(3) is the household, in columns (4)-(5) it is thechild. All models include district fixed effects and demeaned baseline covariates, as well astheir interaction with the treatment indicator. Robust standard errors are clustered at healthcenter level. Adjusted p-values (FT) refer to p-values of the coefficient on Full Treatment whichare adjusted using the Benjamini-Hochberg method. *** p<0.01; ** p<0.05; * p<0.10
47
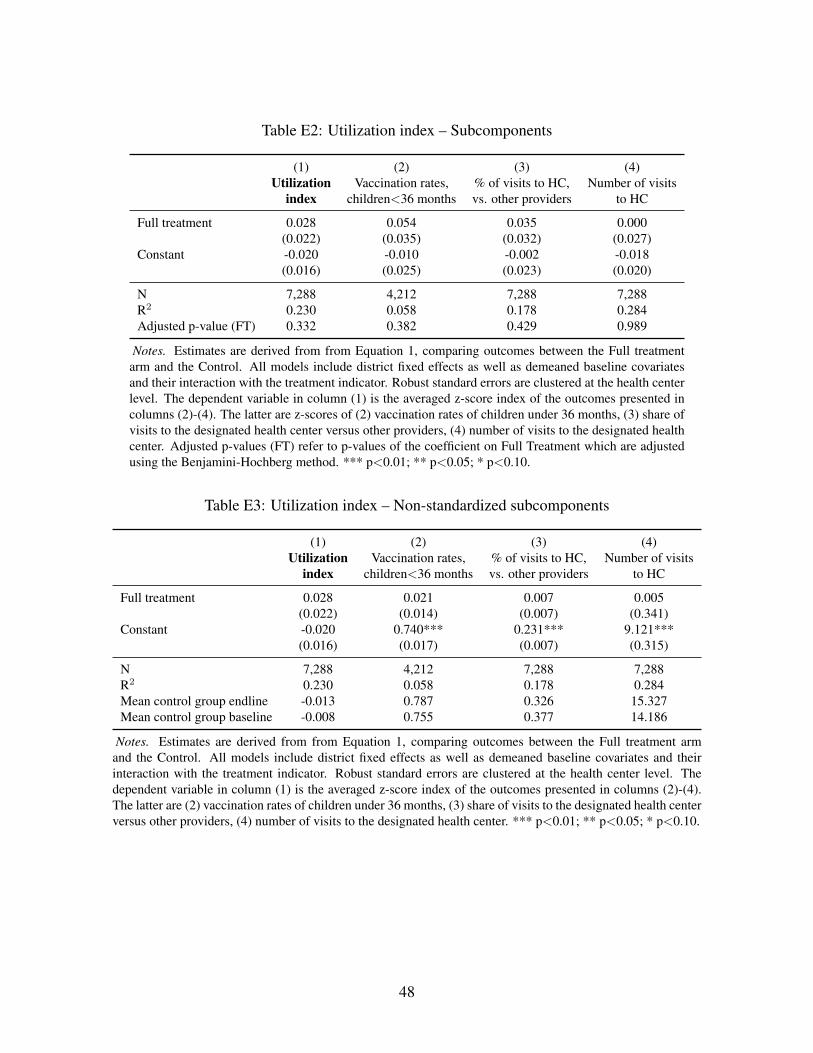
Table E2: Utilization index – Subcomponents
(1) (2) (3) (4)Utilization
indexVaccination rates,
children<36 months% of visits to HC,vs. other providers
Number of visitsto HC
Full treatment 0.028 0.054 0.035 0.000(0.022) (0.035) (0.032) (0.027)
Constant -0.020 -0.010 -0.002 -0.018(0.016) (0.025) (0.023) (0.020)
N 7,288 4,212 7,288 7,288R2 0.230 0.058 0.178 0.284Adjusted p-value (FT) 0.332 0.382 0.429 0.989
Notes. Estimates are derived from from Equation 1, comparing outcomes between the Full treatmentarm and the Control. All models include district fixed effects as well as demeaned baseline covariatesand their interaction with the treatment indicator. Robust standard errors are clustered at the health centerlevel. The dependent variable in column (1) is the averaged z-score index of the outcomes presented incolumns (2)-(4). The latter are z-scores of (2) vaccination rates of children under 36 months, (3) share ofvisits to the designated health center versus other providers, (4) number of visits to the designated healthcenter. Adjusted p-values (FT) refer to p-values of the coefficient on Full Treatment which are adjustedusing the Benjamini-Hochberg method. *** p<0.01; ** p<0.05; * p<0.10.
Table E3: Utilization index – Non-standardized subcomponents
(1) (2) (3) (4)Utilization
indexVaccination rates,
children<36 months% of visits to HC,vs. other providers
Number of visitsto HC
Full treatment 0.028 0.021 0.007 0.005(0.022) (0.014) (0.007) (0.341)
Constant -0.020 0.740*** 0.231*** 9.121***(0.016) (0.017) (0.007) (0.315)
N 7,288 4,212 7,288 7,288R2 0.230 0.058 0.178 0.284Mean control group endline -0.013 0.787 0.326 15.327Mean control group baseline -0.008 0.755 0.377 14.186
Notes. Estimates are derived from from Equation 1, comparing outcomes between the Full treatment armand the Control. All models include district fixed effects as well as demeaned baseline covariates and theirinteraction with the treatment indicator. Robust standard errors are clustered at the health center level. Thedependent variable in column (1) is the averaged z-score index of the outcomes presented in columns (2)-(4).The latter are (2) vaccination rates of children under 36 months, (3) share of visits to the designated health centerversus other providers, (4) number of visits to the designated health center. *** p<0.01; ** p<0.05; * p<0.10.
48
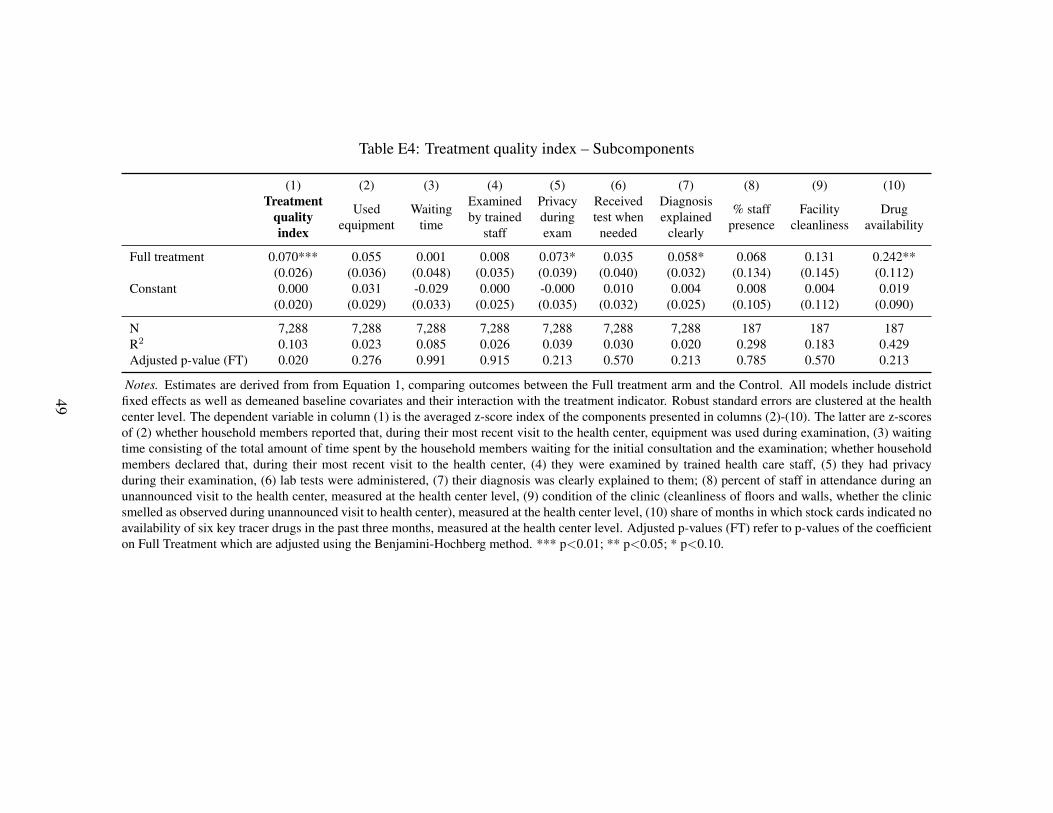
Table E4: Treatment quality index – Subcomponents
(1) (2) (3) (4) (5) (6) (7) (8) (9) (10)Treatment
qualityindex
Usedequipment
Waitingtime
Examinedby trained
staff
Privacyduringexam
Receivedtest whenneeded
Diagnosisexplained
clearly
% staffpresence
Facilitycleanliness
Drugavailability
Full treatment 0.070*** 0.055 0.001 0.008 0.073* 0.035 0.058* 0.068 0.131 0.242**(0.026) (0.036) (0.048) (0.035) (0.039) (0.040) (0.032) (0.134) (0.145) (0.112)
Constant 0.000 0.031 -0.029 0.000 -0.000 0.010 0.004 0.008 0.004 0.019(0.020) (0.029) (0.033) (0.025) (0.035) (0.032) (0.025) (0.105) (0.112) (0.090)
N 7,288 7,288 7,288 7,288 7,288 7,288 7,288 187 187 187R2 0.103 0.023 0.085 0.026 0.039 0.030 0.020 0.298 0.183 0.429Adjusted p-value (FT) 0.020 0.276 0.991 0.915 0.213 0.570 0.213 0.785 0.570 0.213
Notes. Estimates are derived from from Equation 1, comparing outcomes between the Full treatment arm and the Control. All models include districtfixed effects as well as demeaned baseline covariates and their interaction with the treatment indicator. Robust standard errors are clustered at the healthcenter level. The dependent variable in column (1) is the averaged z-score index of the components presented in columns (2)-(10). The latter are z-scoresof (2) whether household members reported that, during their most recent visit to the health center, equipment was used during examination, (3) waitingtime consisting of the total amount of time spent by the household members waiting for the initial consultation and the examination; whether householdmembers declared that, during their most recent visit to the health center, (4) they were examined by trained health care staff, (5) they had privacyduring their examination, (6) lab tests were administered, (7) their diagnosis was clearly explained to them; (8) percent of staff in attendance during anunannounced visit to the health center, measured at the health center level, (9) condition of the clinic (cleanliness of floors and walls, whether the clinicsmelled as observed during unannounced visit to health center), measured at the health center level, (10) share of months in which stock cards indicated noavailability of six key tracer drugs in the past three months, measured at the health center level. Adjusted p-values (FT) refer to p-values of the coefficienton Full Treatment which are adjusted using the Benjamini-Hochberg method. *** p<0.01; ** p<0.05; * p<0.10.
49
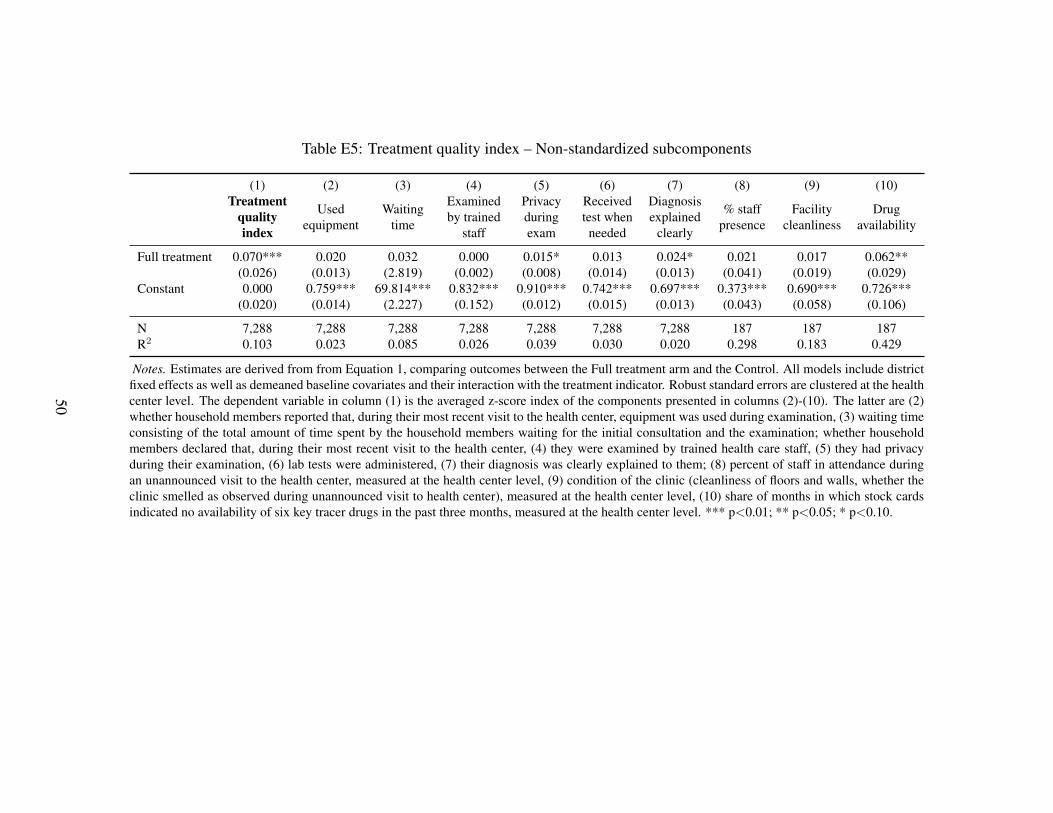
Table E5: Treatment quality index – Non-standardized subcomponents
(1) (2) (3) (4) (5) (6) (7) (8) (9) (10)Treatment
qualityindex
Usedequipment
Waitingtime
Examinedby trained
staff
Privacyduringexam
Receivedtest whenneeded
Diagnosisexplained
clearly
% staffpresence
Facilitycleanliness
Drugavailability
Full treatment 0.070*** 0.020 0.032 0.000 0.015* 0.013 0.024* 0.021 0.017 0.062**(0.026) (0.013) (2.819) (0.002) (0.008) (0.014) (0.013) (0.041) (0.019) (0.029)
Constant 0.000 0.759*** 69.814*** 0.832*** 0.910*** 0.742*** 0.697*** 0.373*** 0.690*** 0.726***(0.020) (0.014) (2.227) (0.152) (0.012) (0.015) (0.013) (0.043) (0.058) (0.106)
N 7,288 7,288 7,288 7,288 7,288 7,288 7,288 187 187 187R2 0.103 0.023 0.085 0.026 0.039 0.030 0.020 0.298 0.183 0.429
Notes. Estimates are derived from from Equation 1, comparing outcomes between the Full treatment arm and the Control. All models include districtfixed effects as well as demeaned baseline covariates and their interaction with the treatment indicator. Robust standard errors are clustered at the healthcenter level. The dependent variable in column (1) is the averaged z-score index of the components presented in columns (2)-(10). The latter are (2)whether household members reported that, during their most recent visit to the health center, equipment was used during examination, (3) waiting timeconsisting of the total amount of time spent by the household members waiting for the initial consultation and the examination; whether householdmembers declared that, during their most recent visit to the health center, (4) they were examined by trained health care staff, (5) they had privacyduring their examination, (6) lab tests were administered, (7) their diagnosis was clearly explained to them; (8) percent of staff in attendance duringan unannounced visit to the health center, measured at the health center level, (9) condition of the clinic (cleanliness of floors and walls, whether theclinic smelled as observed during unannounced visit to health center), measured at the health center level, (10) share of months in which stock cardsindicated no availability of six key tracer drugs in the past three months, measured at the health center level. *** p<0.01; ** p<0.05; * p<0.10.
50
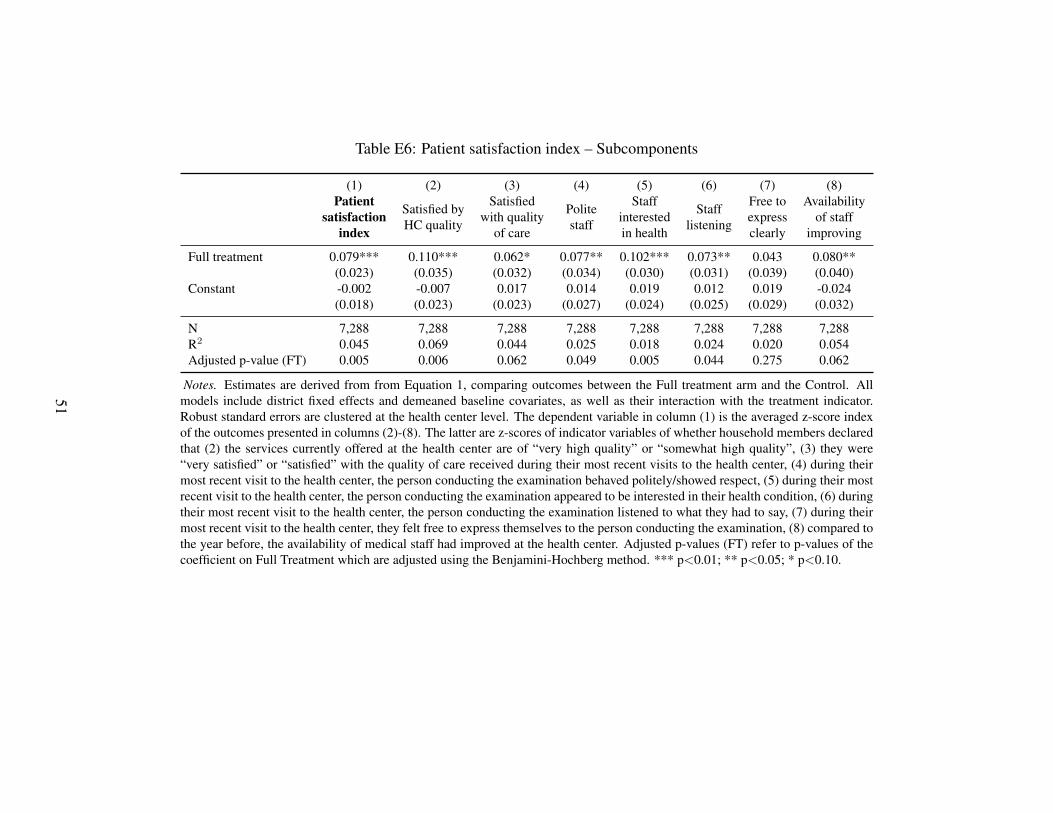
Table E6: Patient satisfaction index – Subcomponents
(1) (2) (3) (4) (5) (6) (7) (8)Patient
satisfactionindex
Satisfied byHC quality
Satisfiedwith quality
of care
Politestaff
Staffinterestedin health
Stafflistening
Free toexpressclearly
Availabilityof staff
improving
Full treatment 0.079*** 0.110*** 0.062* 0.077** 0.102*** 0.073** 0.043 0.080**(0.023) (0.035) (0.032) (0.034) (0.030) (0.031) (0.039) (0.040)
Constant -0.002 -0.007 0.017 0.014 0.019 0.012 0.019 -0.024(0.018) (0.023) (0.023) (0.027) (0.024) (0.025) (0.029) (0.032)
N 7,288 7,288 7,288 7,288 7,288 7,288 7,288 7,288R2 0.045 0.069 0.044 0.025 0.018 0.024 0.020 0.054Adjusted p-value (FT) 0.005 0.006 0.062 0.049 0.005 0.044 0.275 0.062
Notes. Estimates are derived from from Equation 1, comparing outcomes between the Full treatment arm and the Control. Allmodels include district fixed effects and demeaned baseline covariates, as well as their interaction with the treatment indicator.Robust standard errors are clustered at the health center level. The dependent variable in column (1) is the averaged z-score indexof the outcomes presented in columns (2)-(8). The latter are z-scores of indicator variables of whether household members declaredthat (2) the services currently offered at the health center are of “very high quality” or “somewhat high quality”, (3) they were“very satisfied” or “satisfied” with the quality of care received during their most recent visits to the health center, (4) during theirmost recent visit to the health center, the person conducting the examination behaved politely/showed respect, (5) during their mostrecent visit to the health center, the person conducting the examination appeared to be interested in their health condition, (6) duringtheir most recent visit to the health center, the person conducting the examination listened to what they had to say, (7) during theirmost recent visit to the health center, they felt free to express themselves to the person conducting the examination, (8) compared tothe year before, the availability of medical staff had improved at the health center. Adjusted p-values (FT) refer to p-values of thecoefficient on Full Treatment which are adjusted using the Benjamini-Hochberg method. *** p<0.01; ** p<0.05; * p<0.10.
51
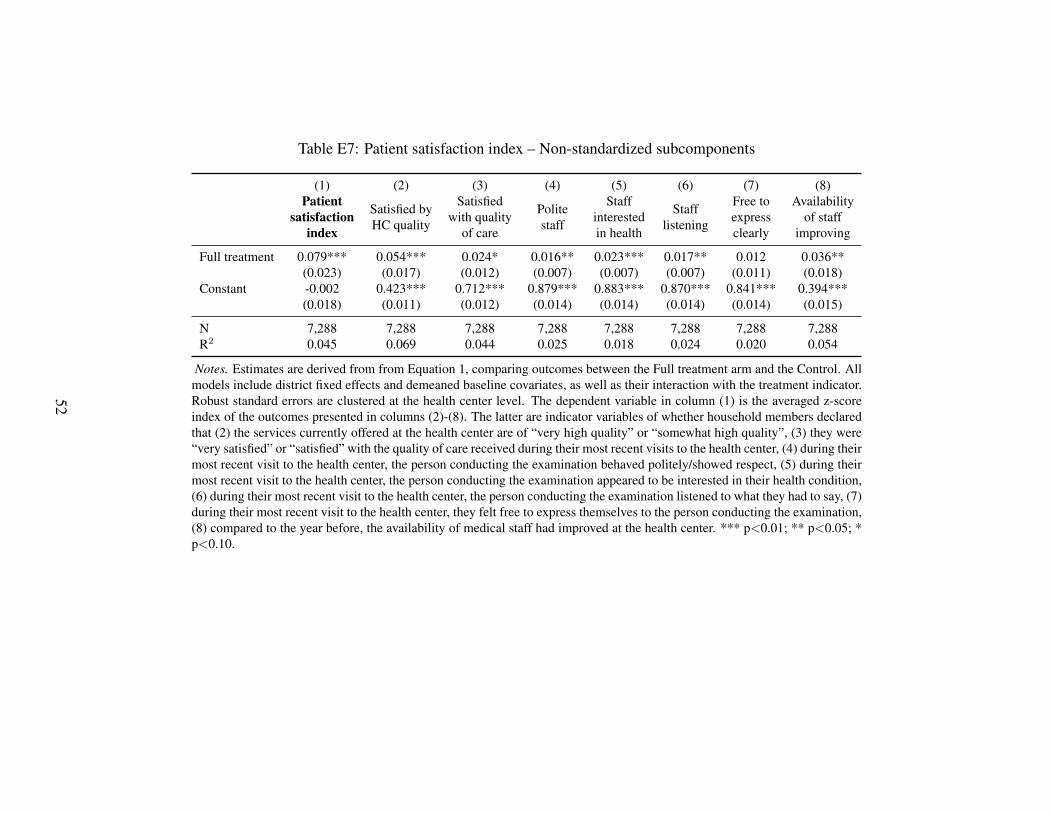
Table E7: Patient satisfaction index – Non-standardized subcomponents
(1) (2) (3) (4) (5) (6) (7) (8)Patient
satisfactionindex
Satisfied byHC quality
Satisfiedwith quality
of care
Politestaff
Staffinterestedin health
Stafflistening
Free toexpressclearly
Availabilityof staff
improving
Full treatment 0.079*** 0.054*** 0.024* 0.016** 0.023*** 0.017** 0.012 0.036**(0.023) (0.017) (0.012) (0.007) (0.007) (0.007) (0.011) (0.018)
Constant -0.002 0.423*** 0.712*** 0.879*** 0.883*** 0.870*** 0.841*** 0.394***(0.018) (0.011) (0.012) (0.014) (0.014) (0.014) (0.014) (0.015)
N 7,288 7,288 7,288 7,288 7,288 7,288 7,288 7,288R2 0.045 0.069 0.044 0.025 0.018 0.024 0.020 0.054
Notes. Estimates are derived from from Equation 1, comparing outcomes between the Full treatment arm and the Control. Allmodels include district fixed effects and demeaned baseline covariates, as well as their interaction with the treatment indicator.Robust standard errors are clustered at the health center level. The dependent variable in column (1) is the averaged z-scoreindex of the outcomes presented in columns (2)-(8). The latter are indicator variables of whether household members declaredthat (2) the services currently offered at the health center are of “very high quality” or “somewhat high quality”, (3) they were“very satisfied” or “satisfied” with the quality of care received during their most recent visits to the health center, (4) during theirmost recent visit to the health center, the person conducting the examination behaved politely/showed respect, (5) during theirmost recent visit to the health center, the person conducting the examination appeared to be interested in their health condition,(6) during their most recent visit to the health center, the person conducting the examination listened to what they had to say, (7)during their most recent visit to the health center, they felt free to express themselves to the person conducting the examination,(8) compared to the year before, the availability of medical staff had improved at the health center. *** p<0.01; ** p<0.05; *p<0.10.
52
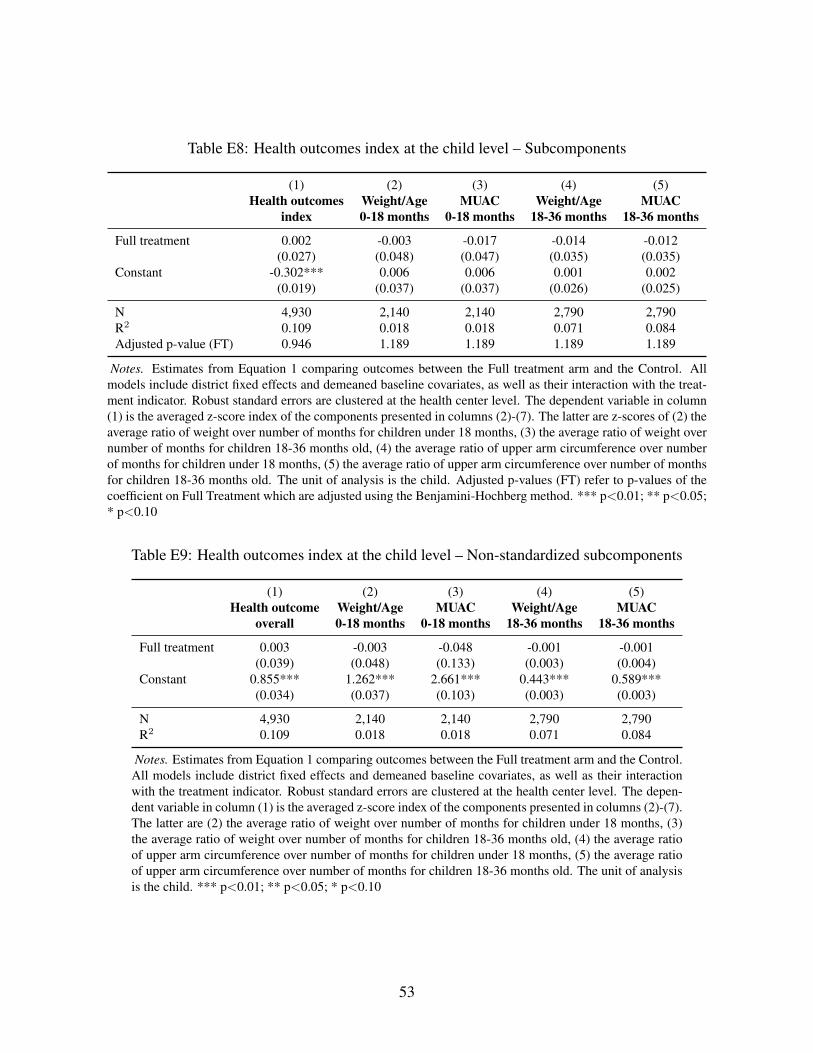
Table E8: Health outcomes index at the child level – Subcomponents
(1) (2) (3) (4) (5)Health outcomes
indexWeight/Age0-18 months
MUAC0-18 months
Weight/Age18-36 months
MUAC18-36 months
Full treatment 0.002 -0.003 -0.017 -0.014 -0.012(0.027) (0.048) (0.047) (0.035) (0.035)
Constant -0.302*** 0.006 0.006 0.001 0.002(0.019) (0.037) (0.037) (0.026) (0.025)
N 4,930 2,140 2,140 2,790 2,790R2 0.109 0.018 0.018 0.071 0.084Adjusted p-value (FT) 0.946 1.189 1.189 1.189 1.189
Notes. Estimates from Equation 1 comparing outcomes between the Full treatment arm and the Control. Allmodels include district fixed effects and demeaned baseline covariates, as well as their interaction with the treat-ment indicator. Robust standard errors are clustered at the health center level. The dependent variable in column(1) is the averaged z-score index of the components presented in columns (2)-(7). The latter are z-scores of (2) theaverage ratio of weight over number of months for children under 18 months, (3) the average ratio of weight overnumber of months for children 18-36 months old, (4) the average ratio of upper arm circumference over numberof months for children under 18 months, (5) the average ratio of upper arm circumference over number of monthsfor children 18-36 months old. The unit of analysis is the child. Adjusted p-values (FT) refer to p-values of thecoefficient on Full Treatment which are adjusted using the Benjamini-Hochberg method. *** p<0.01; ** p<0.05;* p<0.10
Table E9: Health outcomes index at the child level – Non-standardized subcomponents
(1) (2) (3) (4) (5)Health outcome
overallWeight/Age0-18 months
MUAC0-18 months
Weight/Age18-36 months
MUAC18-36 months
Full treatment 0.003 -0.003 -0.048 -0.001 -0.001(0.039) (0.048) (0.133) (0.003) (0.004)
Constant 0.855*** 1.262*** 2.661*** 0.443*** 0.589***(0.034) (0.037) (0.103) (0.003) (0.003)
N 4,930 2,140 2,140 2,790 2,790R2 0.109 0.018 0.018 0.071 0.084
Notes. Estimates from Equation 1 comparing outcomes between the Full treatment arm and the Control.All models include district fixed effects and demeaned baseline covariates, as well as their interactionwith the treatment indicator. Robust standard errors are clustered at the health center level. The depen-dent variable in column (1) is the averaged z-score index of the components presented in columns (2)-(7).The latter are (2) the average ratio of weight over number of months for children under 18 months, (3)the average ratio of weight over number of months for children 18-36 months old, (4) the average ratioof upper arm circumference over number of months for children under 18 months, (5) the average ratioof upper arm circumference over number of months for children 18-36 months old. The unit of analysisis the child. *** p<0.01; ** p<0.05; * p<0.10
53
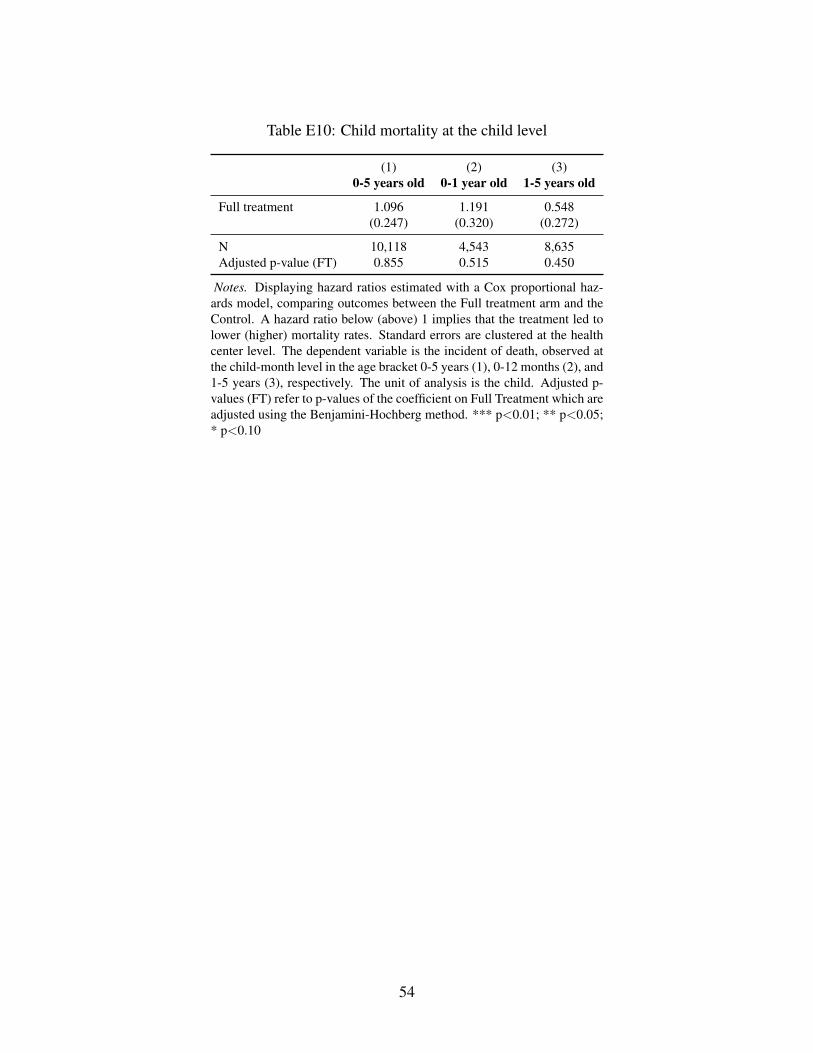
Table E10: Child mortality at the child level
(1) (2) (3)0-5 years old 0-1 year old 1-5 years old
Full treatment 1.096 1.191 0.548(0.247) (0.320) (0.272)
N 10,118 4,543 8,635Adjusted p-value (FT) 0.855 0.515 0.450
Notes. Displaying hazard ratios estimated with a Cox proportional haz-ards model, comparing outcomes between the Full treatment arm and theControl. A hazard ratio below (above) 1 implies that the treatment led tolower (higher) mortality rates. Standard errors are clustered at the healthcenter level. The dependent variable is the incident of death, observed atthe child-month level in the age bracket 0-5 years (1), 0-12 months (2), and1-5 years (3), respectively. The unit of analysis is the child. Adjusted p-values (FT) refer to p-values of the coefficient on Full Treatment which areadjusted using the Benjamini-Hochberg method. *** p<0.01; ** p<0.05;* p<0.10
54
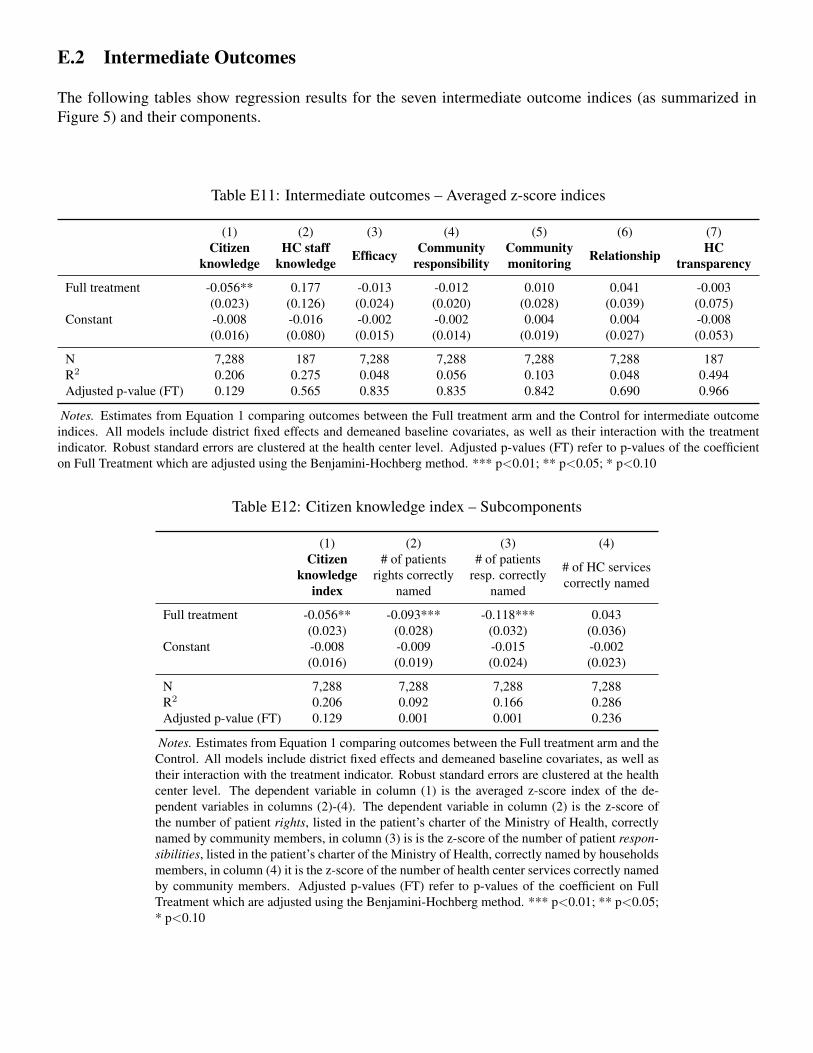
E.2 Intermediate Outcomes
The following tables show regression results for the seven intermediate outcome indices (as summarized inFigure 5) and their components.
Table E11: Intermediate outcomes – Averaged z-score indices
(1) (2) (3) (4) (5) (6) (7)Citizen
knowledgeHC staff
knowledge Efficacy Communityresponsibility
Communitymonitoring Relationship HC
transparency
Full treatment -0.056** 0.177 -0.013 -0.012 0.010 0.041 -0.003(0.023) (0.126) (0.024) (0.020) (0.028) (0.039) (0.075)
Constant -0.008 -0.016 -0.002 -0.002 0.004 0.004 -0.008(0.016) (0.080) (0.015) (0.014) (0.019) (0.027) (0.053)
N 7,288 187 7,288 7,288 7,288 7,288 187R2 0.206 0.275 0.048 0.056 0.103 0.048 0.494Adjusted p-value (FT) 0.129 0.565 0.835 0.835 0.842 0.690 0.966
Notes. Estimates from Equation 1 comparing outcomes between the Full treatment arm and the Control for intermediate outcomeindices. All models include district fixed effects and demeaned baseline covariates, as well as their interaction with the treatmentindicator. Robust standard errors are clustered at the health center level. Adjusted p-values (FT) refer to p-values of the coefficienton Full Treatment which are adjusted using the Benjamini-Hochberg method. *** p<0.01; ** p<0.05; * p<0.10
Table E12: Citizen knowledge index – Subcomponents
(1) (2) (3) (4)Citizen
knowledgeindex
# of patientsrights correctly
named
# of patientsresp. correctly
named
# of HC servicescorrectly named
Full treatment -0.056** -0.093*** -0.118*** 0.043(0.023) (0.028) (0.032) (0.036)
Constant -0.008 -0.009 -0.015 -0.002(0.016) (0.019) (0.024) (0.023)
N 7,288 7,288 7,288 7,288R2 0.206 0.092 0.166 0.286Adjusted p-value (FT) 0.129 0.001 0.001 0.236
Notes. Estimates from Equation 1 comparing outcomes between the Full treatment arm and theControl. All models include district fixed effects and demeaned baseline covariates, as well astheir interaction with the treatment indicator. Robust standard errors are clustered at the healthcenter level. The dependent variable in column (1) is the averaged z-score index of the de-pendent variables in columns (2)-(4). The dependent variable in column (2) is the z-score ofthe number of patient rights, listed in the patient’s charter of the Ministry of Health, correctlynamed by community members, in column (3) is is the z-score of the number of patient respon-sibilities, listed in the patient’s charter of the Ministry of Health, correctly named by householdsmembers, in column (4) it is the z-score of the number of health center services correctly namedby community members. Adjusted p-values (FT) refer to p-values of the coefficient on FullTreatment which are adjusted using the Benjamini-Hochberg method. *** p<0.01; ** p<0.05;* p<0.10
55
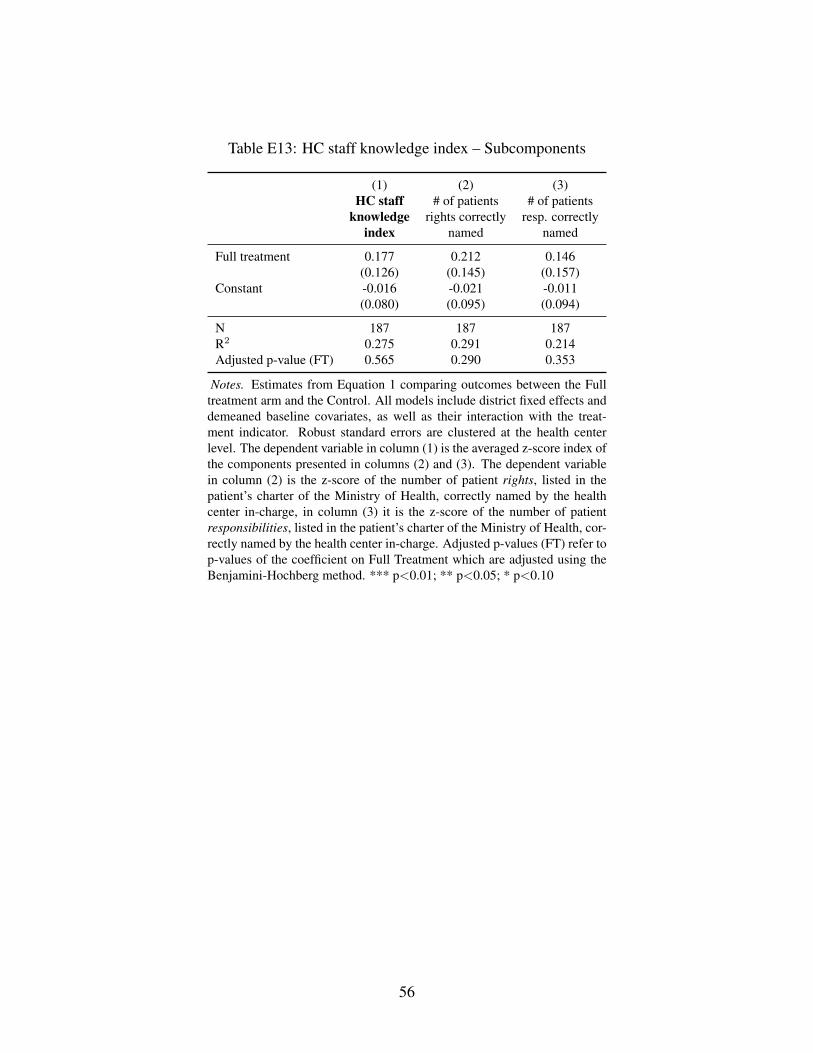
Table E13: HC staff knowledge index – Subcomponents
(1) (2) (3)HC staff
knowledgeindex
# of patientsrights correctly
named
# of patientsresp. correctly
named
Full treatment 0.177 0.212 0.146(0.126) (0.145) (0.157)
Constant -0.016 -0.021 -0.011(0.080) (0.095) (0.094)
N 187 187 187R2 0.275 0.291 0.214Adjusted p-value (FT) 0.565 0.290 0.353
Notes. Estimates from Equation 1 comparing outcomes between the Fulltreatment arm and the Control. All models include district fixed effects anddemeaned baseline covariates, as well as their interaction with the treat-ment indicator. Robust standard errors are clustered at the health centerlevel. The dependent variable in column (1) is the averaged z-score index ofthe components presented in columns (2) and (3). The dependent variablein column (2) is the z-score of the number of patient rights, listed in thepatient’s charter of the Ministry of Health, correctly named by the healthcenter in-charge, in column (3) it is the z-score of the number of patientresponsibilities, listed in the patient’s charter of the Ministry of Health, cor-rectly named by the health center in-charge. Adjusted p-values (FT) refer top-values of the coefficient on Full Treatment which are adjusted using theBenjamini-Hochberg method. *** p<0.01; ** p<0.05; * p<0.10
56
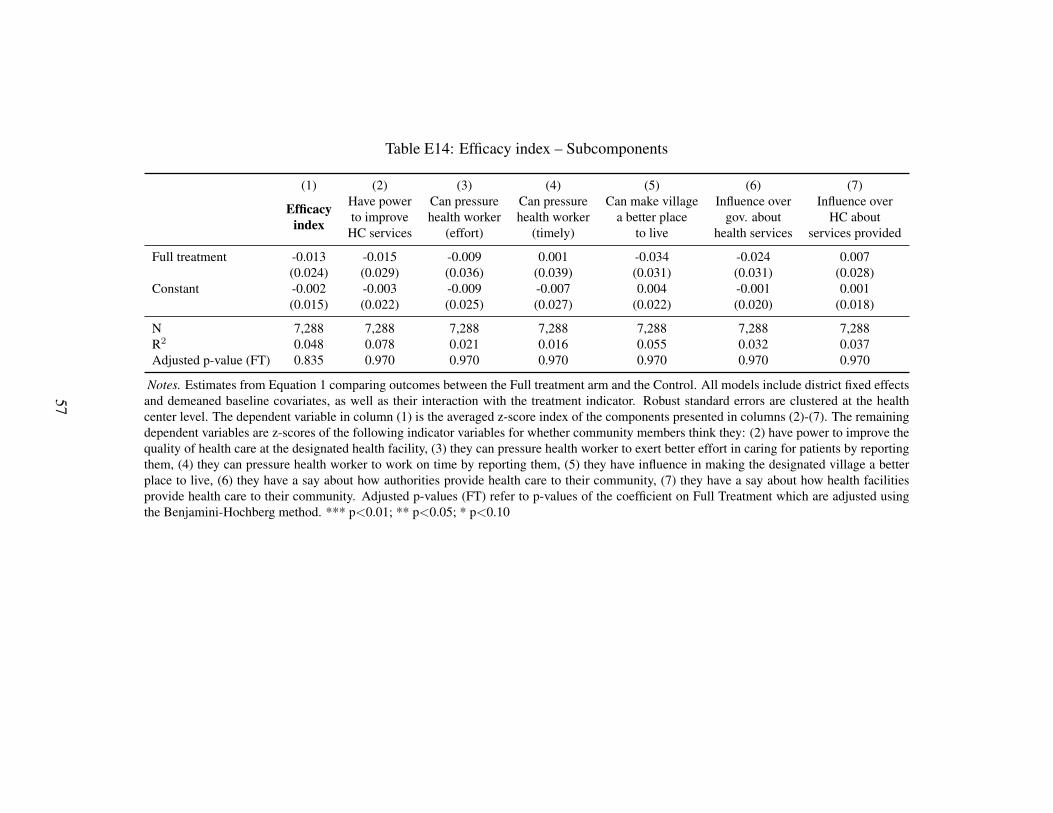
Table E14: Efficacy index – Subcomponents
(1) (2) (3) (4) (5) (6) (7)
Efficacyindex
Have powerto improve
HC services
Can pressurehealth worker
(effort)
Can pressurehealth worker
(timely)
Can make villagea better place
to live
Influence overgov. about
health services
Influence overHC about
services provided
Full treatment -0.013 -0.015 -0.009 0.001 -0.034 -0.024 0.007(0.024) (0.029) (0.036) (0.039) (0.031) (0.031) (0.028)
Constant -0.002 -0.003 -0.009 -0.007 0.004 -0.001 0.001(0.015) (0.022) (0.025) (0.027) (0.022) (0.020) (0.018)
N 7,288 7,288 7,288 7,288 7,288 7,288 7,288R2 0.048 0.078 0.021 0.016 0.055 0.032 0.037Adjusted p-value (FT) 0.835 0.970 0.970 0.970 0.970 0.970 0.970
Notes. Estimates from Equation 1 comparing outcomes between the Full treatment arm and the Control. All models include district fixed effectsand demeaned baseline covariates, as well as their interaction with the treatment indicator. Robust standard errors are clustered at the healthcenter level. The dependent variable in column (1) is the averaged z-score index of the components presented in columns (2)-(7). The remainingdependent variables are z-scores of the following indicator variables for whether community members think they: (2) have power to improve thequality of health care at the designated health facility, (3) they can pressure health worker to exert better effort in caring for patients by reportingthem, (4) they can pressure health worker to work on time by reporting them, (5) they have influence in making the designated village a betterplace to live, (6) they have a say about how authorities provide health care to their community, (7) they have a say about how health facilitiesprovide health care to their community. Adjusted p-values (FT) refer to p-values of the coefficient on Full Treatment which are adjusted usingthe Benjamini-Hochberg method. *** p<0.01; ** p<0.05; * p<0.10
57
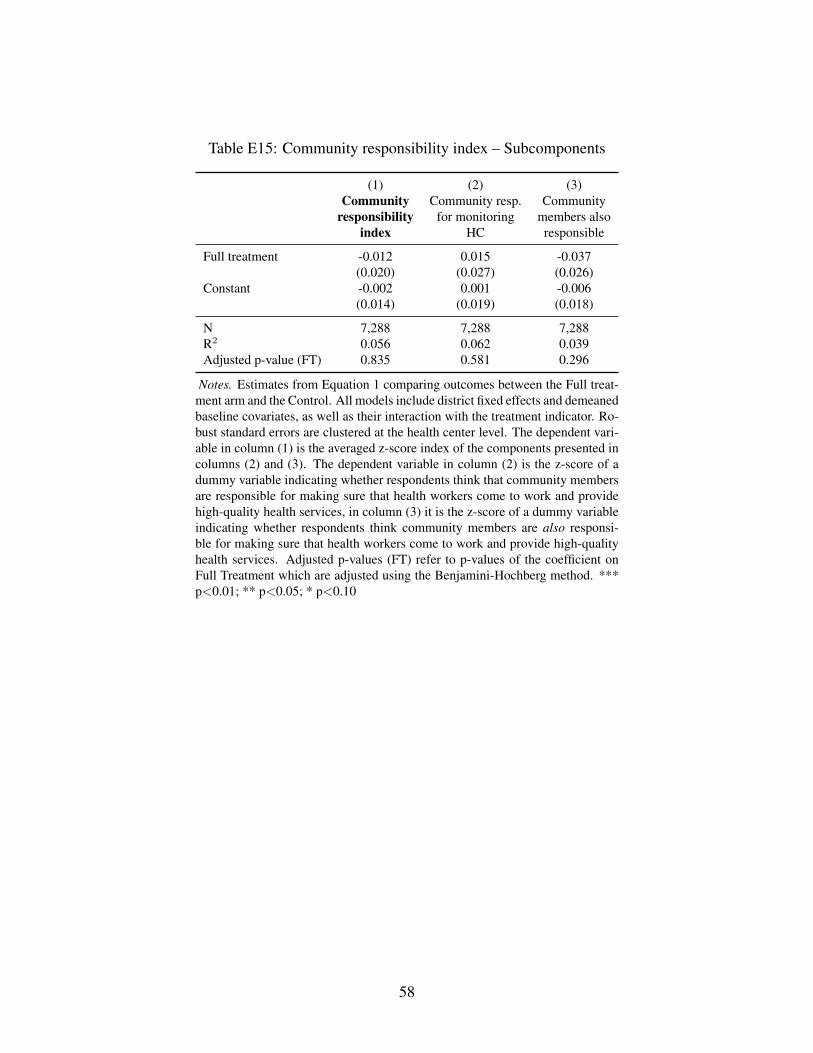
Table E15: Community responsibility index – Subcomponents
(1) (2) (3)Community
responsibilityindex
Community resp.for monitoring
HC
Communitymembers alsoresponsible
Full treatment -0.012 0.015 -0.037(0.020) (0.027) (0.026)
Constant -0.002 0.001 -0.006(0.014) (0.019) (0.018)
N 7,288 7,288 7,288R2 0.056 0.062 0.039Adjusted p-value (FT) 0.835 0.581 0.296
Notes. Estimates from Equation 1 comparing outcomes between the Full treat-ment arm and the Control. All models include district fixed effects and demeanedbaseline covariates, as well as their interaction with the treatment indicator. Ro-bust standard errors are clustered at the health center level. The dependent vari-able in column (1) is the averaged z-score index of the components presented incolumns (2) and (3). The dependent variable in column (2) is the z-score of adummy variable indicating whether respondents think that community membersare responsible for making sure that health workers come to work and providehigh-quality health services, in column (3) it is the z-score of a dummy variableindicating whether respondents think community members are also responsi-ble for making sure that health workers come to work and provide high-qualityhealth services. Adjusted p-values (FT) refer to p-values of the coefficient onFull Treatment which are adjusted using the Benjamini-Hochberg method. ***p<0.01; ** p<0.05; * p<0.10
58
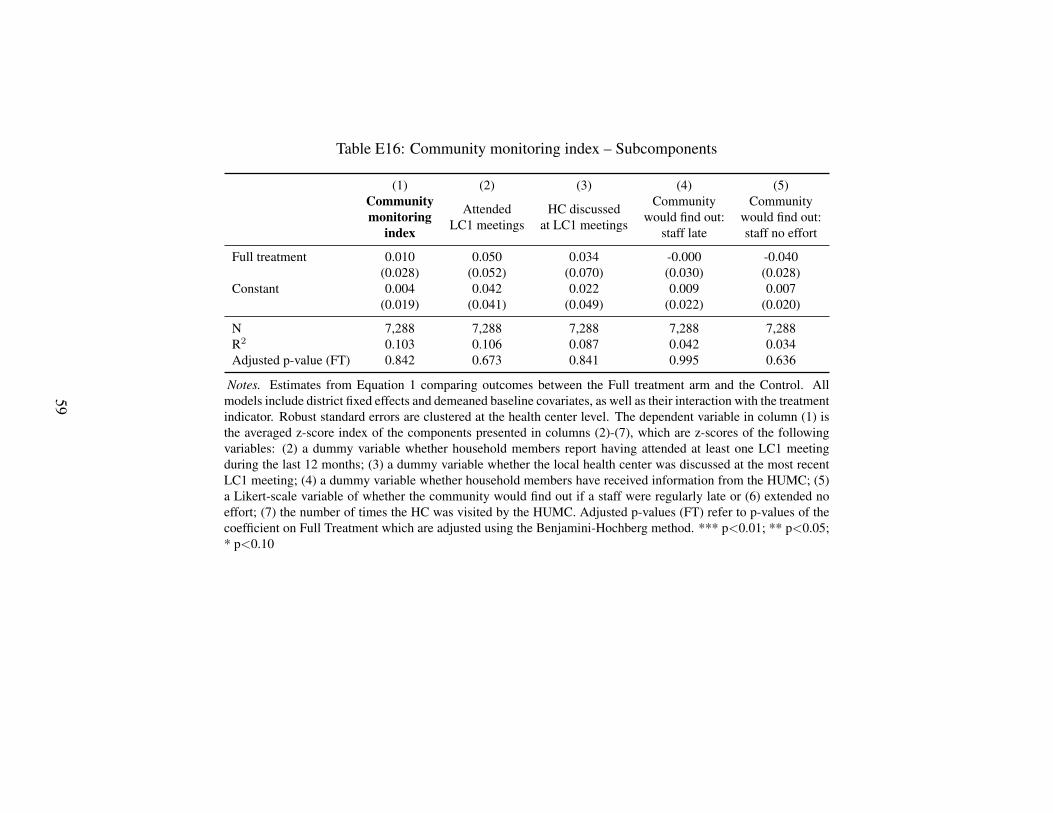
Table E16: Community monitoring index – Subcomponents
(1) (2) (3) (4) (5)Communitymonitoring
index
AttendedLC1 meetings
HC discussedat LC1 meetings
Communitywould find out:
staff late
Communitywould find out:staff no effort
Full treatment 0.010 0.050 0.034 -0.000 -0.040(0.028) (0.052) (0.070) (0.030) (0.028)
Constant 0.004 0.042 0.022 0.009 0.007(0.019) (0.041) (0.049) (0.022) (0.020)
N 7,288 7,288 7,288 7,288 7,288R2 0.103 0.106 0.087 0.042 0.034Adjusted p-value (FT) 0.842 0.673 0.841 0.995 0.636
Notes. Estimates from Equation 1 comparing outcomes between the Full treatment arm and the Control. Allmodels include district fixed effects and demeaned baseline covariates, as well as their interaction with the treatmentindicator. Robust standard errors are clustered at the health center level. The dependent variable in column (1) isthe averaged z-score index of the components presented in columns (2)-(7), which are z-scores of the followingvariables: (2) a dummy variable whether household members report having attended at least one LC1 meetingduring the last 12 months; (3) a dummy variable whether the local health center was discussed at the most recentLC1 meeting; (4) a dummy variable whether household members have received information from the HUMC; (5)a Likert-scale variable of whether the community would find out if a staff were regularly late or (6) extended noeffort; (7) the number of times the HC was visited by the HUMC. Adjusted p-values (FT) refer to p-values of thecoefficient on Full Treatment which are adjusted using the Benjamini-Hochberg method. *** p<0.01; ** p<0.05;* p<0.10
59
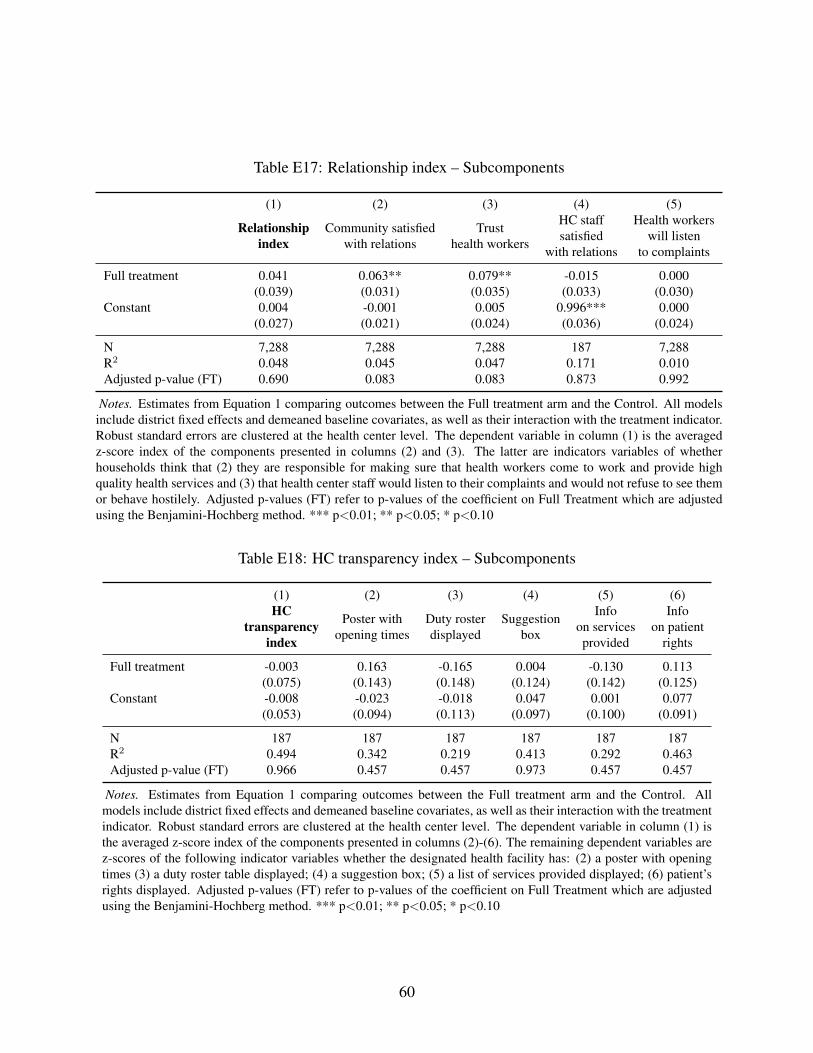
Table E17: Relationship index – Subcomponents
(1) (2) (3) (4) (5)
Relationshipindex
Community satisfiedwith relations
Trusthealth workers
HC staffsatisfied
with relations
Health workerswill listen
to complaints
Full treatment 0.041 0.063** 0.079** -0.015 0.000(0.039) (0.031) (0.035) (0.033) (0.030)
Constant 0.004 -0.001 0.005 0.996*** 0.000(0.027) (0.021) (0.024) (0.036) (0.024)
N 7,288 7,288 7,288 187 7,288R2 0.048 0.045 0.047 0.171 0.010Adjusted p-value (FT) 0.690 0.083 0.083 0.873 0.992
Notes. Estimates from Equation 1 comparing outcomes between the Full treatment arm and the Control. All modelsinclude district fixed effects and demeaned baseline covariates, as well as their interaction with the treatment indicator.Robust standard errors are clustered at the health center level. The dependent variable in column (1) is the averagedz-score index of the components presented in columns (2) and (3). The latter are indicators variables of whetherhouseholds think that (2) they are responsible for making sure that health workers come to work and provide highquality health services and (3) that health center staff would listen to their complaints and would not refuse to see themor behave hostilely. Adjusted p-values (FT) refer to p-values of the coefficient on Full Treatment which are adjustedusing the Benjamini-Hochberg method. *** p<0.01; ** p<0.05; * p<0.10
Table E18: HC transparency index – Subcomponents
(1) (2) (3) (4) (5) (6)HC
transparencyindex
Poster withopening times
Duty rosterdisplayed
Suggestionbox
Infoon servicesprovided
Infoon patient
rights
Full treatment -0.003 0.163 -0.165 0.004 -0.130 0.113(0.075) (0.143) (0.148) (0.124) (0.142) (0.125)
Constant -0.008 -0.023 -0.018 0.047 0.001 0.077(0.053) (0.094) (0.113) (0.097) (0.100) (0.091)
N 187 187 187 187 187 187R2 0.494 0.342 0.219 0.413 0.292 0.463Adjusted p-value (FT) 0.966 0.457 0.457 0.973 0.457 0.457
Notes. Estimates from Equation 1 comparing outcomes between the Full treatment arm and the Control. Allmodels include district fixed effects and demeaned baseline covariates, as well as their interaction with the treatmentindicator. Robust standard errors are clustered at the health center level. The dependent variable in column (1) isthe averaged z-score index of the components presented in columns (2)-(6). The remaining dependent variables arez-scores of the following indicator variables whether the designated health facility has: (2) a poster with openingtimes (3) a duty roster table displayed; (4) a suggestion box; (5) a list of services provided displayed; (6) patient’srights displayed. Adjusted p-values (FT) refer to p-values of the coefficient on Full Treatment which are adjustedusing the Benjamini-Hochberg method. *** p<0.01; ** p<0.05; * p<0.10
60
E.3 Treatment Effects on Subgroups of Health Centers
The following table provides further details on the results discussed in Section 5.4. It shows es-timated average treatment effects for subgroups of health centers. Each set of subgroup effects isderived from a separate regression, estimated using Equation 3. The table displays the coefficienton Treatment for the base category (for example, HC2) and the linear combination of the coeffi-cient on Treatment and on the interaction between Treatment and an indicator variable describingthe specific subset (for example, Treat + Treat * HC3 for HC3).
61
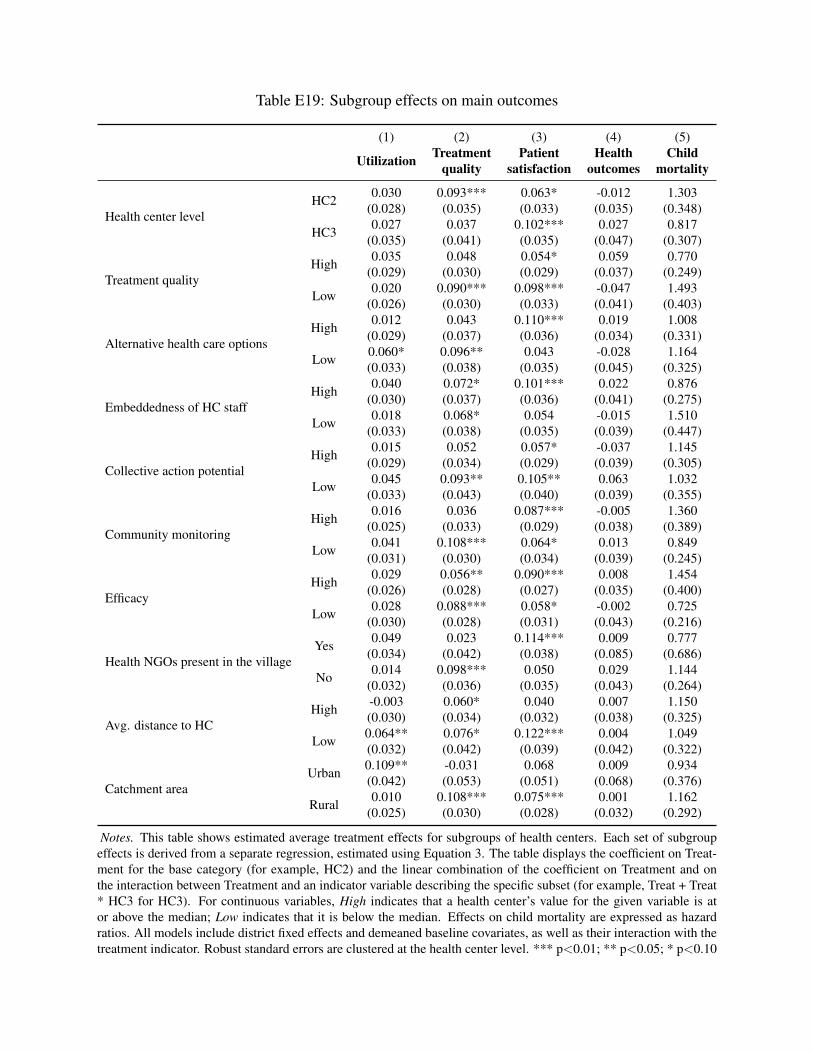
Table E19: Subgroup effects on main outcomes
(1) (2) (3) (4) (5)
Utilization Treatmentquality
Patientsatisfaction
Healthoutcomes
Childmortality
Health center levelHC2 0.030 0.093*** 0.063* -0.012 1.303
(0.028) (0.035) (0.033) (0.035) (0.348)
HC3 0.027 0.037 0.102*** 0.027 0.817(0.035) (0.041) (0.035) (0.047) (0.307)
Treatment qualityHigh 0.035 0.048 0.054* 0.059 0.770
(0.029) (0.030) (0.029) (0.037) (0.249)
Low 0.020 0.090*** 0.098*** -0.047 1.493(0.026) (0.030) (0.033) (0.041) (0.403)
Alternative health care optionsHigh 0.012 0.043 0.110*** 0.019 1.008
(0.029) (0.037) (0.036) (0.034) (0.331)
Low 0.060* 0.096** 0.043 -0.028 1.164(0.033) (0.038) (0.035) (0.045) (0.325)
Embeddedness of HC staffHigh 0.040 0.072* 0.101*** 0.022 0.876
(0.030) (0.037) (0.036) (0.041) (0.275)
Low 0.018 0.068* 0.054 -0.015 1.510(0.033) (0.038) (0.035) (0.039) (0.447)
Collective action potentialHigh 0.015 0.052 0.057* -0.037 1.145
(0.029) (0.034) (0.029) (0.039) (0.305)
Low 0.045 0.093** 0.105** 0.063 1.032(0.033) (0.043) (0.040) (0.039) (0.355)
Community monitoringHigh 0.016 0.036 0.087*** -0.005 1.360
(0.025) (0.033) (0.029) (0.038) (0.389)
Low 0.041 0.108*** 0.064* 0.013 0.849(0.031) (0.030) (0.034) (0.039) (0.245)
EfficacyHigh 0.029 0.056** 0.090*** 0.008 1.454
(0.026) (0.028) (0.027) (0.035) (0.400)
Low 0.028 0.088*** 0.058* -0.002 0.725(0.030) (0.028) (0.031) (0.043) (0.216)
Health NGOs present in the villageYes 0.049 0.023 0.114*** 0.009 0.777
(0.034) (0.042) (0.038) (0.085) (0.686)
No 0.014 0.098*** 0.050 0.029 1.144(0.032) (0.036) (0.035) (0.043) (0.264)
Avg. distance to HCHigh -0.003 0.060* 0.040 0.007 1.150
(0.030) (0.034) (0.032) (0.038) (0.325)
Low 0.064** 0.076* 0.122*** 0.004 1.049(0.032) (0.042) (0.039) (0.042) (0.322)
Catchment areaUrban 0.109** -0.031 0.068 0.009 0.934
(0.042) (0.053) (0.051) (0.068) (0.376)
Rural 0.010 0.108*** 0.075*** 0.001 1.162(0.025) (0.030) (0.028) (0.032) (0.292)
Notes. This table shows estimated average treatment effects for subgroups of health centers. Each set of subgroupeffects is derived from a separate regression, estimated using Equation 3. The table displays the coefficient on Treat-ment for the base category (for example, HC2) and the linear combination of the coefficient on Treatment and onthe interaction between Treatment and an indicator variable describing the specific subset (for example, Treat + Treat* HC3 for HC3). For continuous variables, High indicates that a health center’s value for the given variable is ator above the median; Low indicates that it is below the median. Effects on child mortality are expressed as hazardratios. All models include district fixed effects and demeaned baseline covariates, as well as their interaction with thetreatment indicator. Robust standard errors are clustered at the health center level. *** p<0.01; ** p<0.05; * p<0.10
62
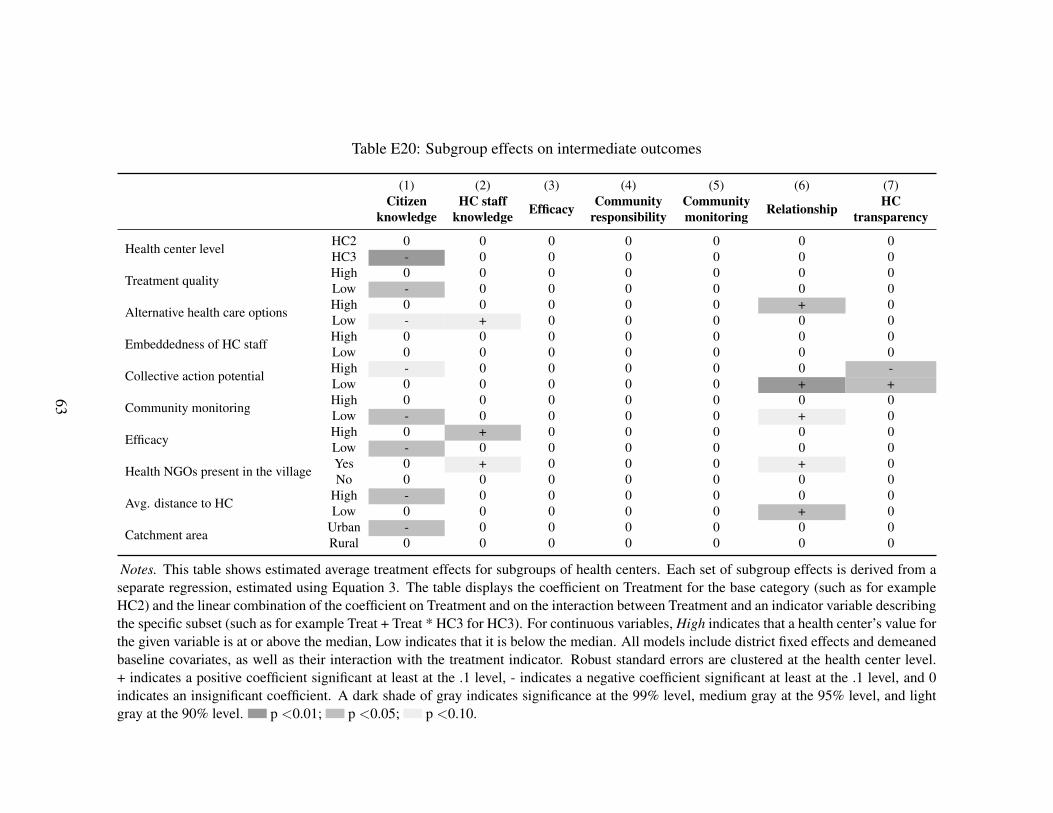
Table E20: Subgroup effects on intermediate outcomes
(1) (2) (3) (4) (5) (6) (7)Citizen
knowledgeHC staff
knowledge Efficacy Communityresponsibility
Communitymonitoring Relationship HC
transparency
Health center level HC2 0 0 0 0 0 0 0HC3 - 0 0 0 0 0 0
Treatment quality High 0 0 0 0 0 0 0Low - 0 0 0 0 0 0
Alternative health care options High 0 0 0 0 0 + 0Low - + 0 0 0 0 0
Embeddedness of HC staff High 0 0 0 0 0 0 0Low 0 0 0 0 0 0 0
Collective action potential High - 0 0 0 0 0 -Low 0 0 0 0 0 + +
Community monitoring High 0 0 0 0 0 0 0Low - 0 0 0 0 + 0
Efficacy High 0 + 0 0 0 0 0Low - 0 0 0 0 0 0
Health NGOs present in the village Yes 0 + 0 0 0 + 0No 0 0 0 0 0 0 0
Avg. distance to HC High - 0 0 0 0 0 0Low 0 0 0 0 0 + 0
Catchment area Urban - 0 0 0 0 0 0Rural 0 0 0 0 0 0 0
Notes. This table shows estimated average treatment effects for subgroups of health centers. Each set of subgroup effects is derived from aseparate regression, estimated using Equation 3. The table displays the coefficient on Treatment for the base category (such as for exampleHC2) and the linear combination of the coefficient on Treatment and on the interaction between Treatment and an indicator variable describingthe specific subset (such as for example Treat + Treat * HC3 for HC3). For continuous variables, High indicates that a health center’s value forthe given variable is at or above the median, Low indicates that it is below the median. All models include district fixed effects and demeanedbaseline covariates, as well as their interaction with the treatment indicator. Robust standard errors are clustered at the health center level.+ indicates a positive coefficient significant at least at the .1 level, - indicates a negative coefficient significant at least at the .1 level, and 0indicates an insignificant coefficient. A dark shade of gray indicates significance at the 99% level, medium gray at the 95% level, and lightgray at the 90% level. p <0.01; p <0.05; p <0.10.
63
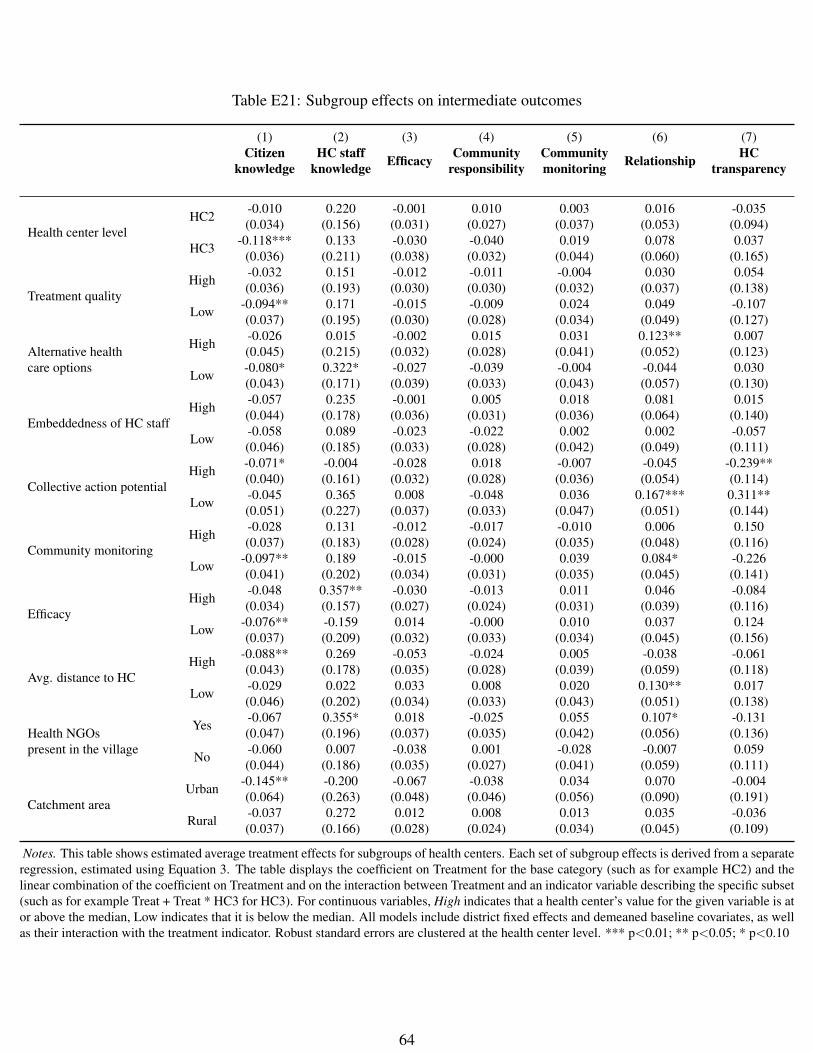
Table E21: Subgroup effects on intermediate outcomes
(1) (2) (3) (4) (5) (6) (7)Citizen
knowledgeHC staff
knowledge Efficacy Communityresponsibility
Communitymonitoring Relationship HC
transparency
Health center levelHC2 -0.010 0.220 -0.001 0.010 0.003 0.016 -0.035
(0.034) (0.156) (0.031) (0.027) (0.037) (0.053) (0.094)
HC3 -0.118*** 0.133 -0.030 -0.040 0.019 0.078 0.037(0.036) (0.211) (0.038) (0.032) (0.044) (0.060) (0.165)
Treatment qualityHigh -0.032 0.151 -0.012 -0.011 -0.004 0.030 0.054
(0.036) (0.193) (0.030) (0.030) (0.032) (0.037) (0.138)
Low -0.094** 0.171 -0.015 -0.009 0.024 0.049 -0.107(0.037) (0.195) (0.030) (0.028) (0.034) (0.049) (0.127)
Alternative healthcare options
High -0.026 0.015 -0.002 0.015 0.031 0.123** 0.007(0.045) (0.215) (0.032) (0.028) (0.041) (0.052) (0.123)
Low -0.080* 0.322* -0.027 -0.039 -0.004 -0.044 0.030(0.043) (0.171) (0.039) (0.033) (0.043) (0.057) (0.130)
Embeddedness of HC staffHigh -0.057 0.235 -0.001 0.005 0.018 0.081 0.015
(0.044) (0.178) (0.036) (0.031) (0.036) (0.064) (0.140)
Low -0.058 0.089 -0.023 -0.022 0.002 0.002 -0.057(0.046) (0.185) (0.033) (0.028) (0.042) (0.049) (0.111)
Collective action potentialHigh -0.071* -0.004 -0.028 0.018 -0.007 -0.045 -0.239**
(0.040) (0.161) (0.032) (0.028) (0.036) (0.054) (0.114)
Low -0.045 0.365 0.008 -0.048 0.036 0.167*** 0.311**(0.051) (0.227) (0.037) (0.033) (0.047) (0.051) (0.144)
Community monitoringHigh -0.028 0.131 -0.012 -0.017 -0.010 0.006 0.150
(0.037) (0.183) (0.028) (0.024) (0.035) (0.048) (0.116)
Low -0.097** 0.189 -0.015 -0.000 0.039 0.084* -0.226(0.041) (0.202) (0.034) (0.031) (0.035) (0.045) (0.141)
EfficacyHigh -0.048 0.357** -0.030 -0.013 0.011 0.046 -0.084
(0.034) (0.157) (0.027) (0.024) (0.031) (0.039) (0.116)
Low -0.076** -0.159 0.014 -0.000 0.010 0.037 0.124(0.037) (0.209) (0.032) (0.033) (0.034) (0.045) (0.156)
Avg. distance to HCHigh -0.088** 0.269 -0.053 -0.024 0.005 -0.038 -0.061
(0.043) (0.178) (0.035) (0.028) (0.039) (0.059) (0.118)
Low -0.029 0.022 0.033 0.008 0.020 0.130** 0.017(0.046) (0.202) (0.034) (0.033) (0.043) (0.051) (0.138)
Health NGOspresent in the village
Yes -0.067 0.355* 0.018 -0.025 0.055 0.107* -0.131(0.047) (0.196) (0.037) (0.035) (0.042) (0.056) (0.136)
No -0.060 0.007 -0.038 0.001 -0.028 -0.007 0.059(0.044) (0.186) (0.035) (0.027) (0.041) (0.059) (0.111)
Catchment areaUrban -0.145** -0.200 -0.067 -0.038 0.034 0.070 -0.004
(0.064) (0.263) (0.048) (0.046) (0.056) (0.090) (0.191)
Rural -0.037 0.272 0.012 0.008 0.013 0.035 -0.036(0.037) (0.166) (0.028) (0.024) (0.034) (0.045) (0.109)
Notes. This table shows estimated average treatment effects for subgroups of health centers. Each set of subgroup effects is derived from a separateregression, estimated using Equation 3. The table displays the coefficient on Treatment for the base category (such as for example HC2) and thelinear combination of the coefficient on Treatment and on the interaction between Treatment and an indicator variable describing the specific subset(such as for example Treat + Treat * HC3 for HC3). For continuous variables, High indicates that a health center’s value for the given variable is ator above the median, Low indicates that it is below the median. All models include district fixed effects and demeaned baseline covariates, as wellas their interaction with the treatment indicator. Robust standard errors are clustered at the health center level. *** p<0.01; ** p<0.05; * p<0.10
64
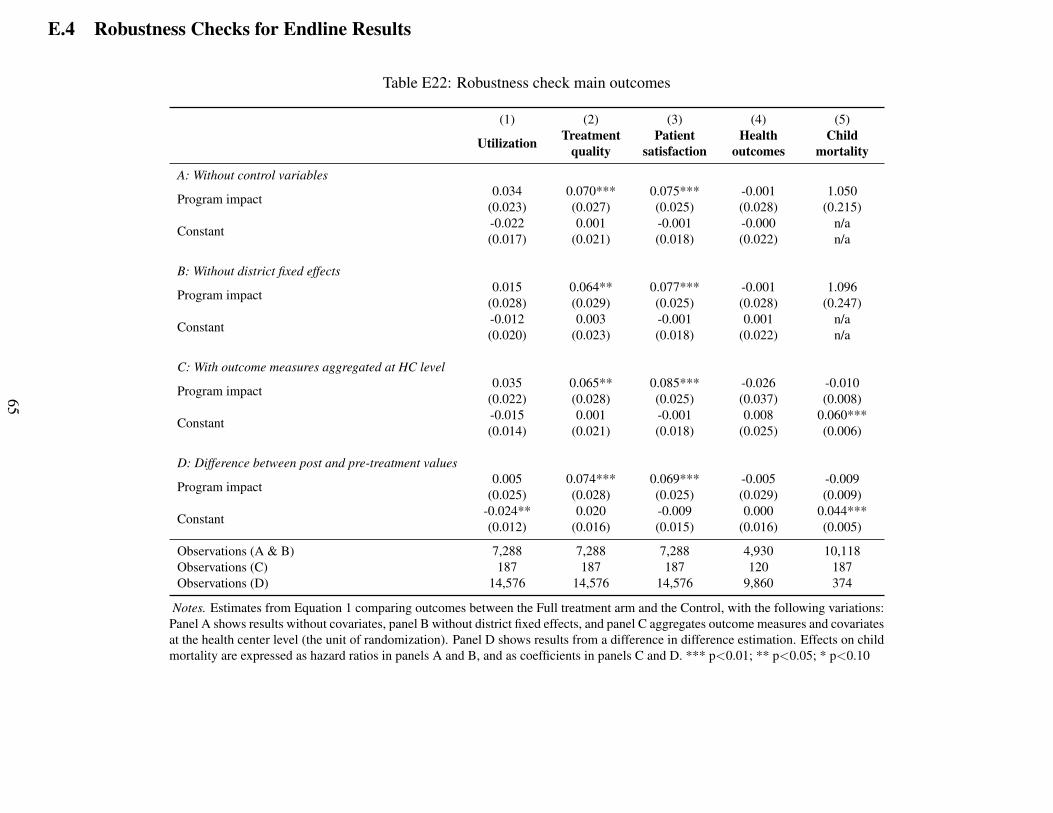
E.4 Robustness Checks for Endline Results
Table E22: Robustness check main outcomes
(1) (2) (3) (4) (5)
Utilization Treatmentquality
Patientsatisfaction
Healthoutcomes
Childmortality
A: Without control variables
Program impact 0.034 0.070*** 0.075*** -0.001 1.050(0.023) (0.027) (0.025) (0.028) (0.215)
Constant -0.022 0.001 -0.001 -0.000 n/a(0.017) (0.021) (0.018) (0.022) n/a
B: Without district fixed effects
Program impact 0.015 0.064** 0.077*** -0.001 1.096(0.028) (0.029) (0.025) (0.028) (0.247)
Constant -0.012 0.003 -0.001 0.001 n/a(0.020) (0.023) (0.018) (0.022) n/a
C: With outcome measures aggregated at HC level
Program impact 0.035 0.065** 0.085*** -0.026 -0.010(0.022) (0.028) (0.025) (0.037) (0.008)
Constant -0.015 0.001 -0.001 0.008 0.060***(0.014) (0.021) (0.018) (0.025) (0.006)
D: Difference between post and pre-treatment values
Program impact 0.005 0.074*** 0.069*** -0.005 -0.009(0.025) (0.028) (0.025) (0.029) (0.009)
Constant -0.024** 0.020 -0.009 0.000 0.044***(0.012) (0.016) (0.015) (0.016) (0.005)
Observations (A & B) 7,288 7,288 7,288 4,930 10,118Observations (C) 187 187 187 120 187Observations (D) 14,576 14,576 14,576 9,860 374
Notes. Estimates from Equation 1 comparing outcomes between the Full treatment arm and the Control, with the following variations:Panel A shows results without covariates, panel B without district fixed effects, and panel C aggregates outcome measures and covariatesat the health center level (the unit of randomization). Panel D shows results from a difference in difference estimation. Effects on childmortality are expressed as hazard ratios in panels A and B, and as coefficients in panels C and D. *** p<0.01; ** p<0.05; * p<0.10
65
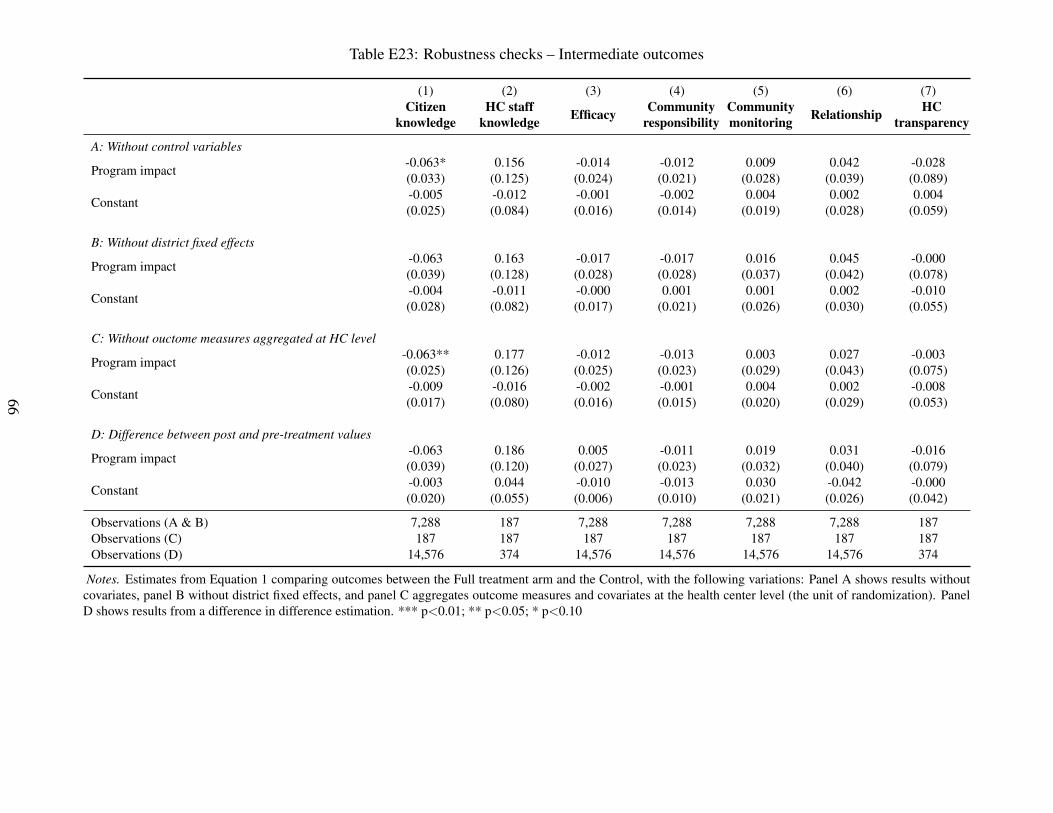
Table E23: Robustness checks – Intermediate outcomes
(1) (2) (3) (4) (5) (6) (7)Citizen
knowledgeHC staff
knowledge Efficacy Communityresponsibility
Communitymonitoring Relationship HC
transparency
A: Without control variables
Program impact -0.063* 0.156 -0.014 -0.012 0.009 0.042 -0.028(0.033) (0.125) (0.024) (0.021) (0.028) (0.039) (0.089)
Constant -0.005 -0.012 -0.001 -0.002 0.004 0.002 0.004(0.025) (0.084) (0.016) (0.014) (0.019) (0.028) (0.059)
B: Without district fixed effects
Program impact -0.063 0.163 -0.017 -0.017 0.016 0.045 -0.000(0.039) (0.128) (0.028) (0.028) (0.037) (0.042) (0.078)
Constant -0.004 -0.011 -0.000 0.001 0.001 0.002 -0.010(0.028) (0.082) (0.017) (0.021) (0.026) (0.030) (0.055)
C: Without ouctome measures aggregated at HC level
Program impact -0.063** 0.177 -0.012 -0.013 0.003 0.027 -0.003(0.025) (0.126) (0.025) (0.023) (0.029) (0.043) (0.075)
Constant -0.009 -0.016 -0.002 -0.001 0.004 0.002 -0.008(0.017) (0.080) (0.016) (0.015) (0.020) (0.029) (0.053)
D: Difference between post and pre-treatment values
Program impact -0.063 0.186 0.005 -0.011 0.019 0.031 -0.016(0.039) (0.120) (0.027) (0.023) (0.032) (0.040) (0.079)
Constant -0.003 0.044 -0.010 -0.013 0.030 -0.042 -0.000(0.020) (0.055) (0.006) (0.010) (0.021) (0.026) (0.042)
Observations (A & B) 7,288 187 7,288 7,288 7,288 7,288 187Observations (C) 187 187 187 187 187 187 187Observations (D) 14,576 374 14,576 14,576 14,576 14,576 374
Notes. Estimates from Equation 1 comparing outcomes between the Full treatment arm and the Control, with the following variations: Panel A shows results withoutcovariates, panel B without district fixed effects, and panel C aggregates outcome measures and covariates at the health center level (the unit of randomization). PanelD shows results from a difference in difference estimation. *** p<0.01; ** p<0.05; * p<0.10
66
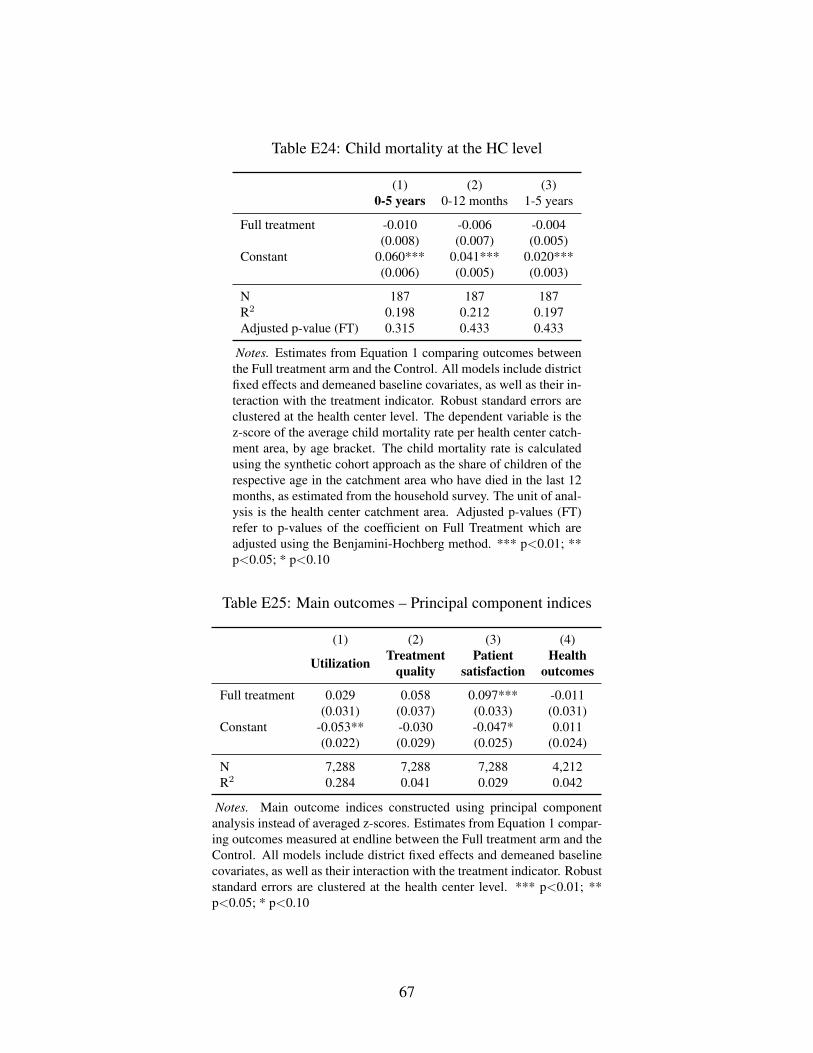
Table E24: Child mortality at the HC level
(1) (2) (3)0-5 years 0-12 months 1-5 years
Full treatment -0.010 -0.006 -0.004(0.008) (0.007) (0.005)
Constant 0.060*** 0.041*** 0.020***(0.006) (0.005) (0.003)
N 187 187 187R2 0.198 0.212 0.197Adjusted p-value (FT) 0.315 0.433 0.433
Notes. Estimates from Equation 1 comparing outcomes betweenthe Full treatment arm and the Control. All models include districtfixed effects and demeaned baseline covariates, as well as their in-teraction with the treatment indicator. Robust standard errors areclustered at the health center level. The dependent variable is thez-score of the average child mortality rate per health center catch-ment area, by age bracket. The child mortality rate is calculatedusing the synthetic cohort approach as the share of children of therespective age in the catchment area who have died in the last 12months, as estimated from the household survey. The unit of anal-ysis is the health center catchment area. Adjusted p-values (FT)refer to p-values of the coefficient on Full Treatment which areadjusted using the Benjamini-Hochberg method. *** p<0.01; **p<0.05; * p<0.10
Table E25: Main outcomes – Principal component indices
(1) (2) (3) (4)
Utilization Treatmentquality
Patientsatisfaction
Healthoutcomes
Full treatment 0.029 0.058 0.097*** -0.011(0.031) (0.037) (0.033) (0.031)
Constant -0.053** -0.030 -0.047* 0.011(0.022) (0.029) (0.025) (0.024)
N 7,288 7,288 7,288 4,212R2 0.284 0.041 0.029 0.042
Notes. Main outcome indices constructed using principal componentanalysis instead of averaged z-scores. Estimates from Equation 1 compar-ing outcomes measured at endline between the Full treatment arm and theControl. All models include district fixed effects and demeaned baselinecovariates, as well as their interaction with the treatment indicator. Robuststandard errors are clustered at the health center level. *** p<0.01; **p<0.05; * p<0.10
67
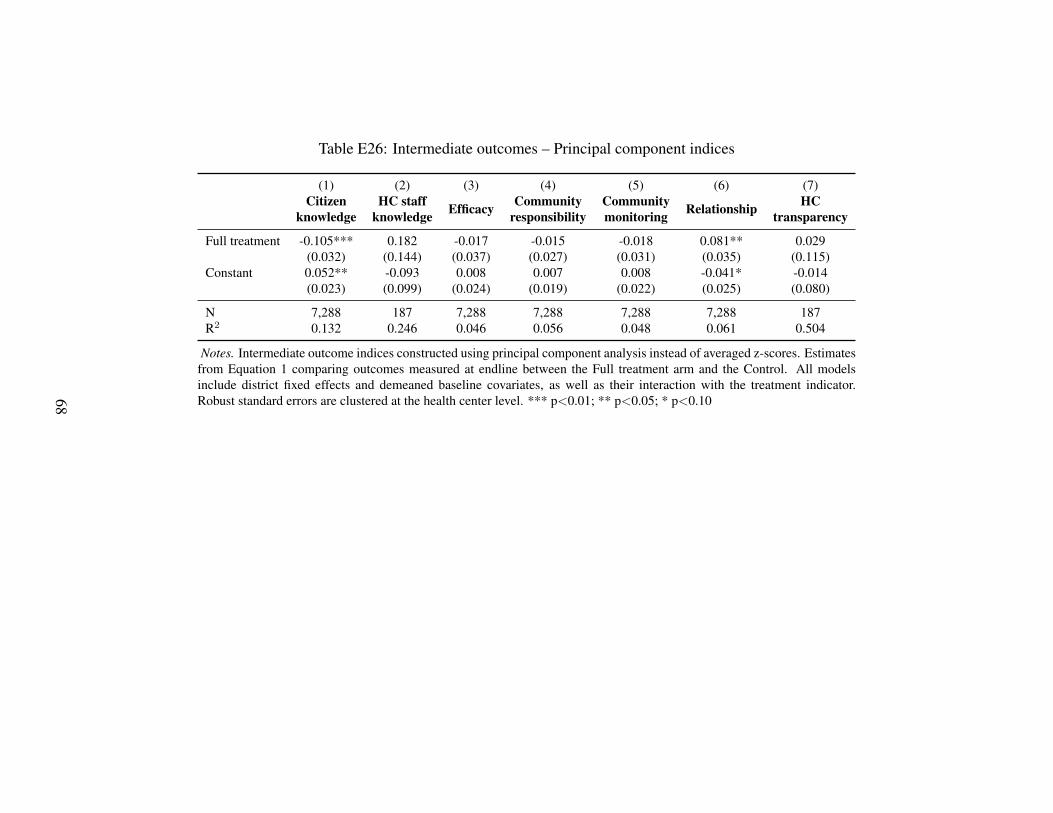
Table E26: Intermediate outcomes – Principal component indices
(1) (2) (3) (4) (5) (6) (7)Citizen
knowledgeHC staff
knowledge Efficacy Communityresponsibility
Communitymonitoring Relationship HC
transparency
Full treatment -0.105*** 0.182 -0.017 -0.015 -0.018 0.081** 0.029(0.032) (0.144) (0.037) (0.027) (0.031) (0.035) (0.115)
Constant 0.052** -0.093 0.008 0.007 0.008 -0.041* -0.014(0.023) (0.099) (0.024) (0.019) (0.022) (0.025) (0.080)
N 7,288 187 7,288 7,288 7,288 7,288 187R2 0.132 0.246 0.046 0.056 0.048 0.061 0.504
Notes. Intermediate outcome indices constructed using principal component analysis instead of averaged z-scores. Estimatesfrom Equation 1 comparing outcomes measured at endline between the Full treatment arm and the Control. All modelsinclude district fixed effects and demeaned baseline covariates, as well as their interaction with the treatment indicator.Robust standard errors are clustered at the health center level. *** p<0.01; ** p<0.05; * p<0.1068
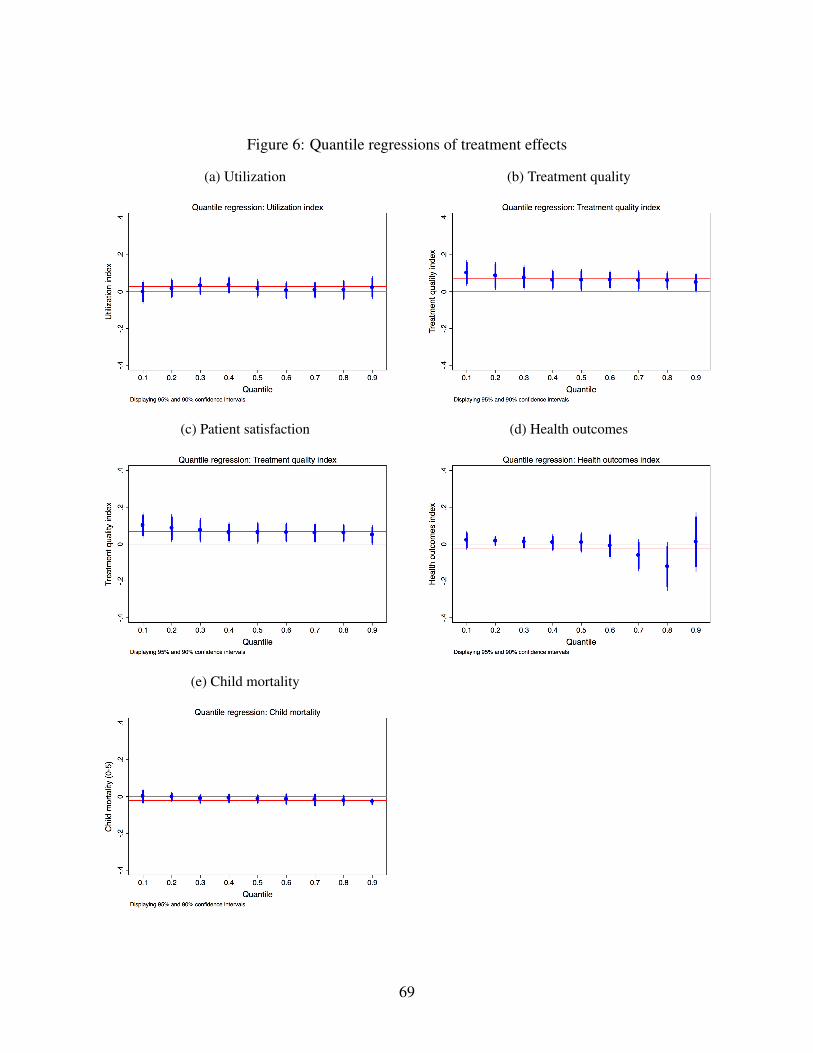
Figure 6: Quantile regressions of treatment effects
(a) Utilization (b) Treatment quality
(c) Patient satisfaction (d) Health outcomes
(e) Child mortality
69
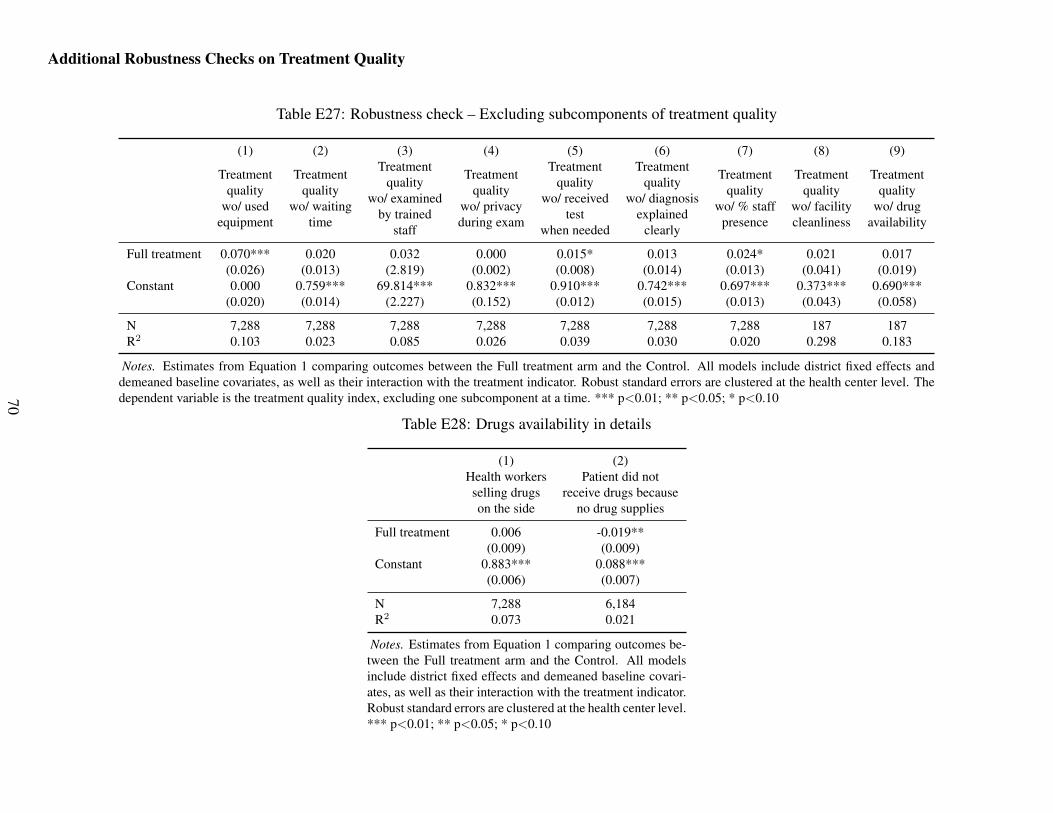
Additional Robustness Checks on Treatment Quality
Table E27: Robustness check – Excluding subcomponents of treatment quality
(1) (2) (3) (4) (5) (6) (7) (8) (9)
Treatmentquality
wo/ usedequipment
Treatmentquality
wo/ waitingtime
Treatmentquality
wo/ examinedby trained
staff
Treatmentquality
wo/ privacyduring exam
Treatmentquality
wo/ receivedtest
when needed
Treatmentquality
wo/ diagnosisexplained
clearly
Treatmentquality
wo/ % staffpresence
Treatmentquality
wo/ facilitycleanliness
Treatmentquality
wo/ drugavailability
Full treatment 0.070*** 0.020 0.032 0.000 0.015* 0.013 0.024* 0.021 0.017(0.026) (0.013) (2.819) (0.002) (0.008) (0.014) (0.013) (0.041) (0.019)
Constant 0.000 0.759*** 69.814*** 0.832*** 0.910*** 0.742*** 0.697*** 0.373*** 0.690***(0.020) (0.014) (2.227) (0.152) (0.012) (0.015) (0.013) (0.043) (0.058)
N 7,288 7,288 7,288 7,288 7,288 7,288 7,288 187 187R2 0.103 0.023 0.085 0.026 0.039 0.030 0.020 0.298 0.183
Notes. Estimates from Equation 1 comparing outcomes between the Full treatment arm and the Control. All models include district fixed effects anddemeaned baseline covariates, as well as their interaction with the treatment indicator. Robust standard errors are clustered at the health center level. Thedependent variable is the treatment quality index, excluding one subcomponent at a time. *** p<0.01; ** p<0.05; * p<0.10
Table E28: Drugs availability in details
(1) (2)Health workersselling drugson the side
Patient did notreceive drugs because
no drug supplies
Full treatment 0.006 -0.019**(0.009) (0.009)
Constant 0.883*** 0.088***(0.006) (0.007)
N 7,288 6,184R2 0.073 0.021
Notes. Estimates from Equation 1 comparing outcomes be-tween the Full treatment arm and the Control. All modelsinclude district fixed effects and demeaned baseline covari-ates, as well as their interaction with the treatment indicator.Robust standard errors are clustered at the health center level.*** p<0.01; ** p<0.05; * p<0.10
70
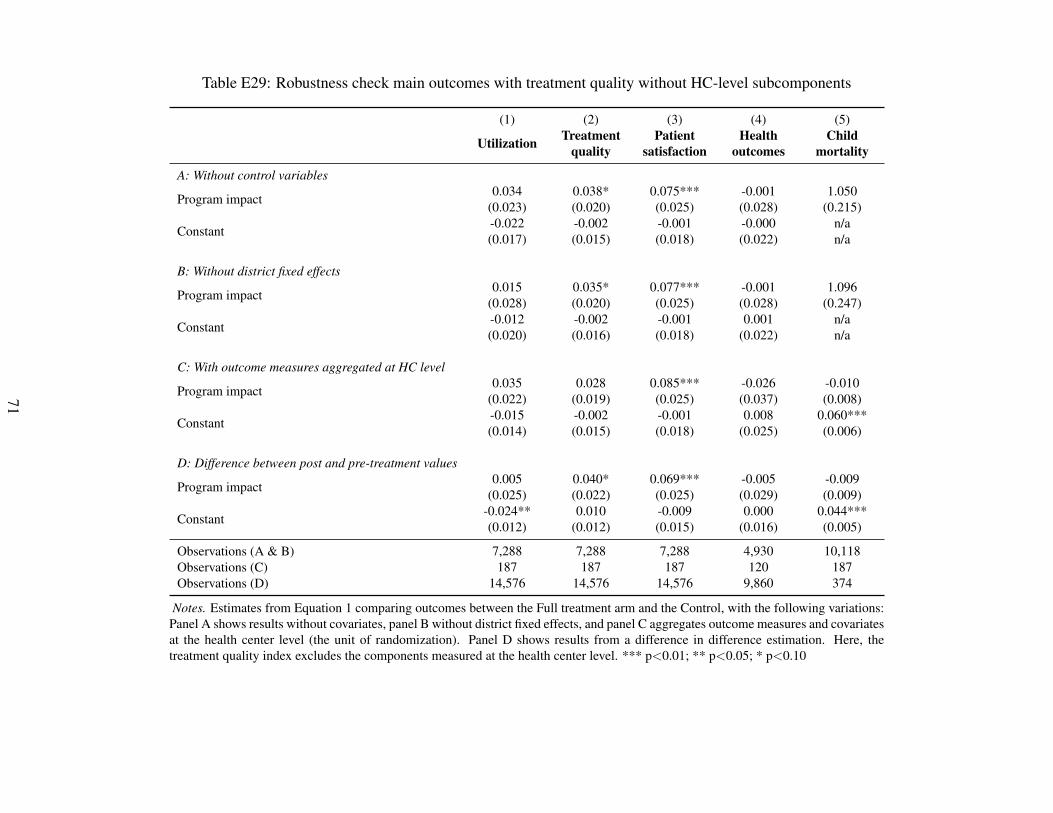
Table E29: Robustness check main outcomes with treatment quality without HC-level subcomponents
(1) (2) (3) (4) (5)
Utilization Treatmentquality
Patientsatisfaction
Healthoutcomes
Childmortality
A: Without control variables
Program impact 0.034 0.038* 0.075*** -0.001 1.050(0.023) (0.020) (0.025) (0.028) (0.215)
Constant -0.022 -0.002 -0.001 -0.000 n/a(0.017) (0.015) (0.018) (0.022) n/a
B: Without district fixed effects
Program impact 0.015 0.035* 0.077*** -0.001 1.096(0.028) (0.020) (0.025) (0.028) (0.247)
Constant -0.012 -0.002 -0.001 0.001 n/a(0.020) (0.016) (0.018) (0.022) n/a
C: With outcome measures aggregated at HC level
Program impact 0.035 0.028 0.085*** -0.026 -0.010(0.022) (0.019) (0.025) (0.037) (0.008)
Constant -0.015 -0.002 -0.001 0.008 0.060***(0.014) (0.015) (0.018) (0.025) (0.006)
D: Difference between post and pre-treatment values
Program impact 0.005 0.040* 0.069*** -0.005 -0.009(0.025) (0.022) (0.025) (0.029) (0.009)
Constant -0.024** 0.010 -0.009 0.000 0.044***(0.012) (0.012) (0.015) (0.016) (0.005)
Observations (A & B) 7,288 7,288 7,288 4,930 10,118Observations (C) 187 187 187 120 187Observations (D) 14,576 14,576 14,576 9,860 374
Notes. Estimates from Equation 1 comparing outcomes between the Full treatment arm and the Control, with the following variations:Panel A shows results without covariates, panel B without district fixed effects, and panel C aggregates outcome measures and covariatesat the health center level (the unit of randomization). Panel D shows results from a difference in difference estimation. Here, thetreatment quality index excludes the components measured at the health center level. *** p<0.01; ** p<0.05; * p<0.10
71
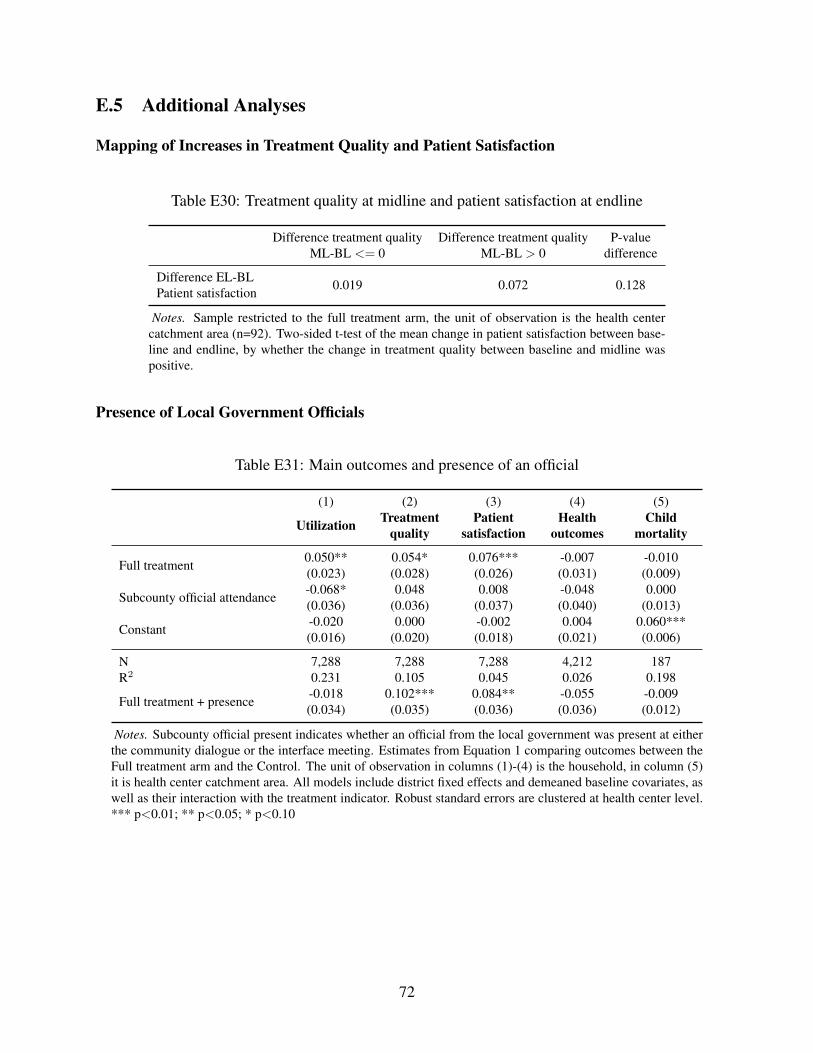
E.5 Additional Analyses
Mapping of Increases in Treatment Quality and Patient Satisfaction
Table E30: Treatment quality at midline and patient satisfaction at endline
Difference treatment qualityML-BL <= 0
Difference treatment qualityML-BL > 0
P-valuedifference
Difference EL-BLPatient satisfaction 0.019 0.072 0.128
Notes. Sample restricted to the full treatment arm, the unit of observation is the health centercatchment area (n=92). Two-sided t-test of the mean change in patient satisfaction between base-line and endline, by whether the change in treatment quality between baseline and midline waspositive.
Presence of Local Government Officials
Table E31: Main outcomes and presence of an official
(1) (2) (3) (4) (5)
Utilization Treatmentquality
Patientsatisfaction
Healthoutcomes
Childmortality
Full treatment 0.050** 0.054* 0.076*** -0.007 -0.010(0.023) (0.028) (0.026) (0.031) (0.009)
Subcounty official attendance -0.068* 0.048 0.008 -0.048 0.000(0.036) (0.036) (0.037) (0.040) (0.013)
Constant -0.020 0.000 -0.002 0.004 0.060***(0.016) (0.020) (0.018) (0.021) (0.006)
N 7,288 7,288 7,288 4,212 187R2 0.231 0.105 0.045 0.026 0.198
Full treatment + presence -0.018 0.102*** 0.084** -0.055 -0.009(0.034) (0.035) (0.036) (0.036) (0.012)
Notes. Subcounty official present indicates whether an official from the local government was present at eitherthe community dialogue or the interface meeting. Estimates from Equation 1 comparing outcomes between theFull treatment arm and the Control. The unit of observation in columns (1)-(4) is the household, in column (5)it is health center catchment area. All models include district fixed effects and demeaned baseline covariates, aswell as their interaction with the treatment indicator. Robust standard errors are clustered at health center level.*** p<0.01; ** p<0.05; * p<0.10
72
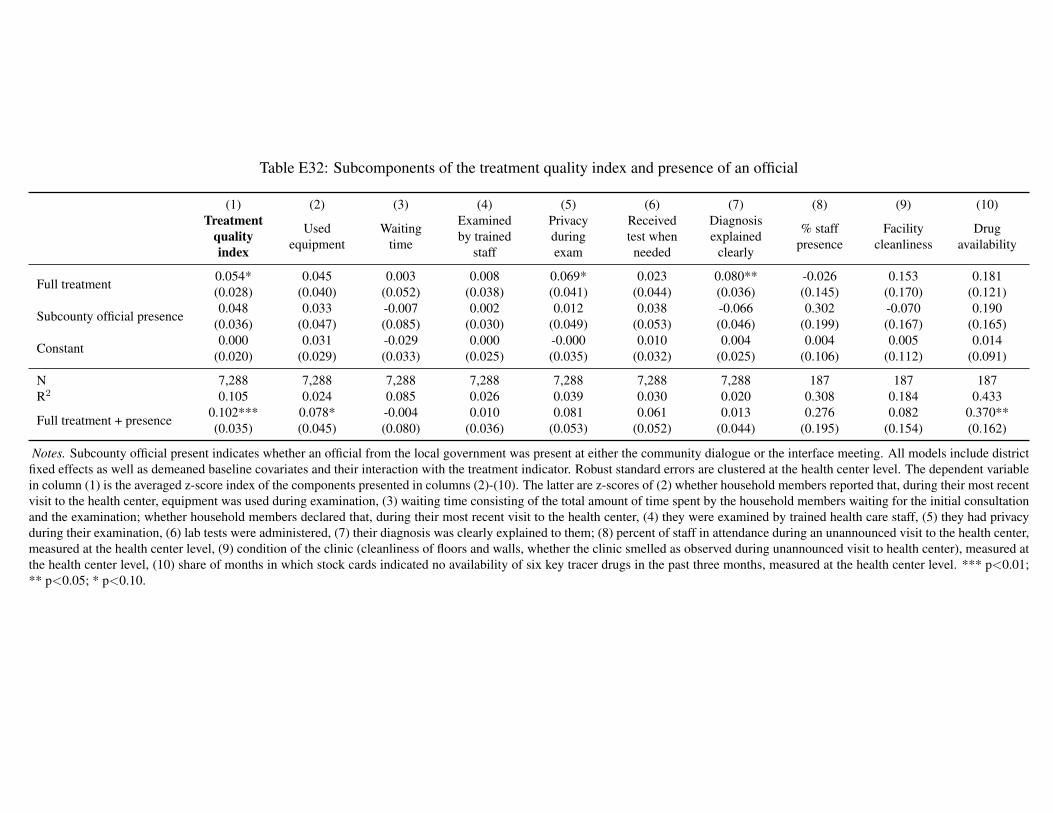
Table E32: Subcomponents of the treatment quality index and presence of an official
(1) (2) (3) (4) (5) (6) (7) (8) (9) (10)Treatment
qualityindex
Usedequipment
Waitingtime
Examinedby trained
staff
Privacyduringexam
Receivedtest whenneeded
Diagnosisexplained
clearly
% staffpresence
Facilitycleanliness
Drugavailability
Full treatment 0.054* 0.045 0.003 0.008 0.069* 0.023 0.080** -0.026 0.153 0.181(0.028) (0.040) (0.052) (0.038) (0.041) (0.044) (0.036) (0.145) (0.170) (0.121)
Subcounty official presence 0.048 0.033 -0.007 0.002 0.012 0.038 -0.066 0.302 -0.070 0.190(0.036) (0.047) (0.085) (0.030) (0.049) (0.053) (0.046) (0.199) (0.167) (0.165)
Constant 0.000 0.031 -0.029 0.000 -0.000 0.010 0.004 0.004 0.005 0.014(0.020) (0.029) (0.033) (0.025) (0.035) (0.032) (0.025) (0.106) (0.112) (0.091)
N 7,288 7,288 7,288 7,288 7,288 7,288 7,288 187 187 187R2 0.105 0.024 0.085 0.026 0.039 0.030 0.020 0.308 0.184 0.433
Full treatment + presence 0.102*** 0.078* -0.004 0.010 0.081 0.061 0.013 0.276 0.082 0.370**(0.035) (0.045) (0.080) (0.036) (0.053) (0.052) (0.044) (0.195) (0.154) (0.162)
Notes. Subcounty official present indicates whether an official from the local government was present at either the community dialogue or the interface meeting. All models include districtfixed effects as well as demeaned baseline covariates and their interaction with the treatment indicator. Robust standard errors are clustered at the health center level. The dependent variablein column (1) is the averaged z-score index of the components presented in columns (2)-(10). The latter are z-scores of (2) whether household members reported that, during their most recentvisit to the health center, equipment was used during examination, (3) waiting time consisting of the total amount of time spent by the household members waiting for the initial consultationand the examination; whether household members declared that, during their most recent visit to the health center, (4) they were examined by trained health care staff, (5) they had privacyduring their examination, (6) lab tests were administered, (7) their diagnosis was clearly explained to them; (8) percent of staff in attendance during an unannounced visit to the health center,measured at the health center level, (9) condition of the clinic (cleanliness of floors and walls, whether the clinic smelled as observed during unannounced visit to health center), measured atthe health center level, (10) share of months in which stock cards indicated no availability of six key tracer drugs in the past three months, measured at the health center level. *** p<0.01;** p<0.05; * p<0.10.
73
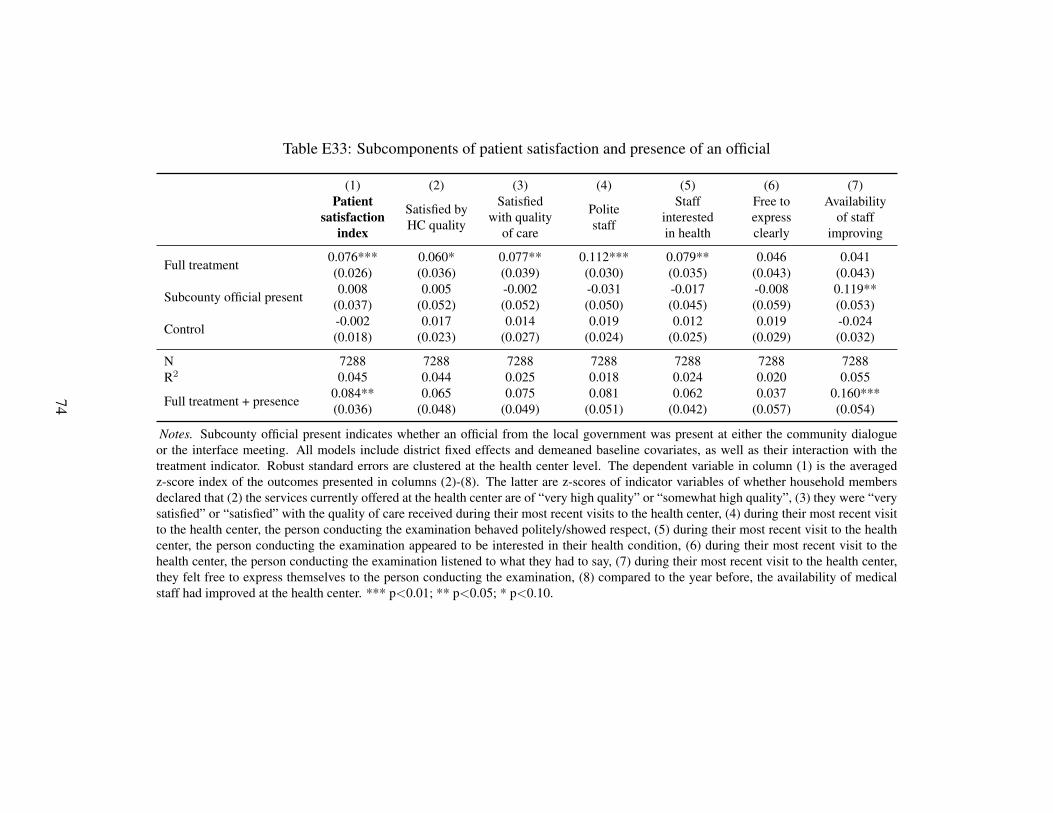
Table E33: Subcomponents of patient satisfaction and presence of an official
(1) (2) (3) (4) (5) (6) (7)Patient
satisfactionindex
Satisfied byHC quality
Satisfiedwith quality
of care
Politestaff
Staffinterestedin health
Free toexpressclearly
Availabilityof staff
improving
Full treatment 0.076*** 0.060* 0.077** 0.112*** 0.079** 0.046 0.041(0.026) (0.036) (0.039) (0.030) (0.035) (0.043) (0.043)
Subcounty official present 0.008 0.005 -0.002 -0.031 -0.017 -0.008 0.119**(0.037) (0.052) (0.052) (0.050) (0.045) (0.059) (0.053)
Control -0.002 0.017 0.014 0.019 0.012 0.019 -0.024(0.018) (0.023) (0.027) (0.024) (0.025) (0.029) (0.032)
N 7288 7288 7288 7288 7288 7288 7288R2 0.045 0.044 0.025 0.018 0.024 0.020 0.055
Full treatment + presence 0.084** 0.065 0.075 0.081 0.062 0.037 0.160***(0.036) (0.048) (0.049) (0.051) (0.042) (0.057) (0.054)
Notes. Subcounty official present indicates whether an official from the local government was present at either the community dialogueor the interface meeting. All models include district fixed effects and demeaned baseline covariates, as well as their interaction with thetreatment indicator. Robust standard errors are clustered at the health center level. The dependent variable in column (1) is the averagedz-score index of the outcomes presented in columns (2)-(8). The latter are z-scores of indicator variables of whether household membersdeclared that (2) the services currently offered at the health center are of “very high quality” or “somewhat high quality”, (3) they were “verysatisfied” or “satisfied” with the quality of care received during their most recent visits to the health center, (4) during their most recent visitto the health center, the person conducting the examination behaved politely/showed respect, (5) during their most recent visit to the healthcenter, the person conducting the examination appeared to be interested in their health condition, (6) during their most recent visit to thehealth center, the person conducting the examination listened to what they had to say, (7) during their most recent visit to the health center,they felt free to express themselves to the person conducting the examination, (8) compared to the year before, the availability of medicalstaff had improved at the health center. *** p<0.01; ** p<0.05; * p<0.10.
74
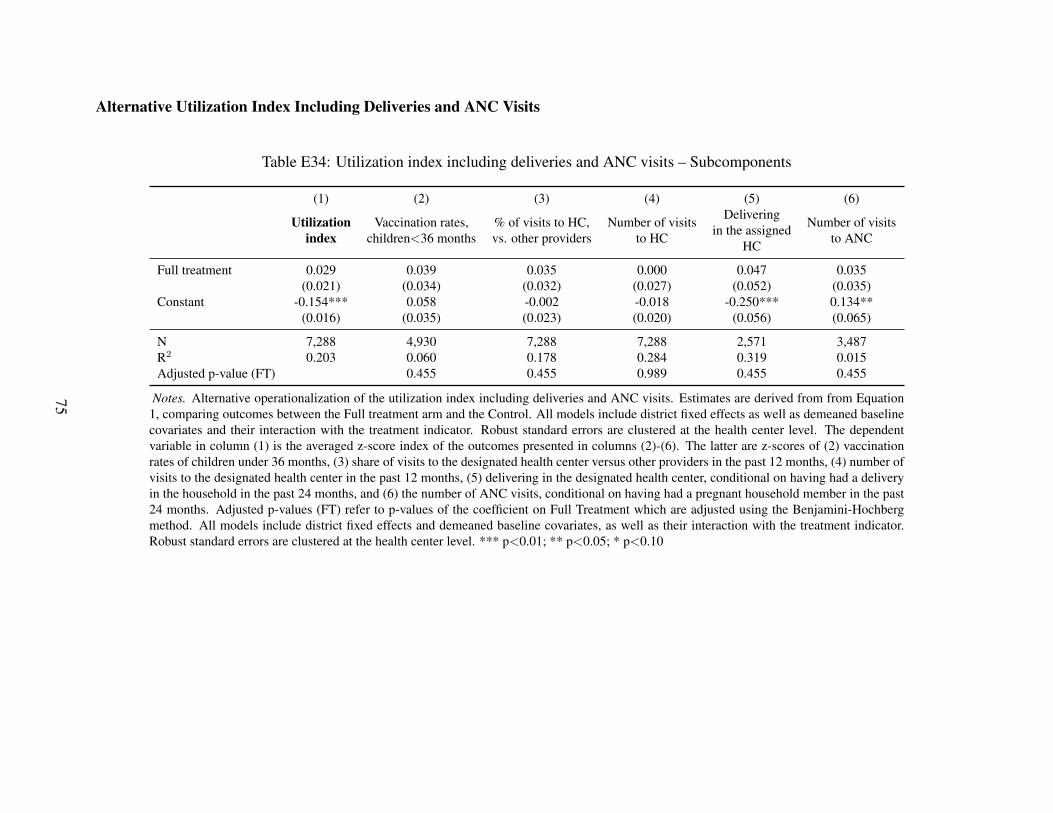
Alternative Utilization Index Including Deliveries and ANC Visits
Table E34: Utilization index including deliveries and ANC visits – Subcomponents
(1) (2) (3) (4) (5) (6)
Utilizationindex
Vaccination rates,children<36 months
% of visits to HC,vs. other providers
Number of visitsto HC
Deliveringin the assigned
HC
Number of visitsto ANC
Full treatment 0.029 0.039 0.035 0.000 0.047 0.035(0.021) (0.034) (0.032) (0.027) (0.052) (0.035)
Constant -0.154*** 0.058 -0.002 -0.018 -0.250*** 0.134**(0.016) (0.035) (0.023) (0.020) (0.056) (0.065)
N 7,288 4,930 7,288 7,288 2,571 3,487R2 0.203 0.060 0.178 0.284 0.319 0.015Adjusted p-value (FT) 0.455 0.455 0.989 0.455 0.455
Notes. Alternative operationalization of the utilization index including deliveries and ANC visits. Estimates are derived from from Equation1, comparing outcomes between the Full treatment arm and the Control. All models include district fixed effects as well as demeaned baselinecovariates and their interaction with the treatment indicator. Robust standard errors are clustered at the health center level. The dependentvariable in column (1) is the averaged z-score index of the outcomes presented in columns (2)-(6). The latter are z-scores of (2) vaccinationrates of children under 36 months, (3) share of visits to the designated health center versus other providers in the past 12 months, (4) number ofvisits to the designated health center in the past 12 months, (5) delivering in the designated health center, conditional on having had a deliveryin the household in the past 24 months, and (6) the number of ANC visits, conditional on having had a pregnant household member in the past24 months. Adjusted p-values (FT) refer to p-values of the coefficient on Full Treatment which are adjusted using the Benjamini-Hochbergmethod. All models include district fixed effects and demeaned baseline covariates, as well as their interaction with the treatment indicator.Robust standard errors are clustered at the health center level. *** p<0.01; ** p<0.05; * p<0.10
75
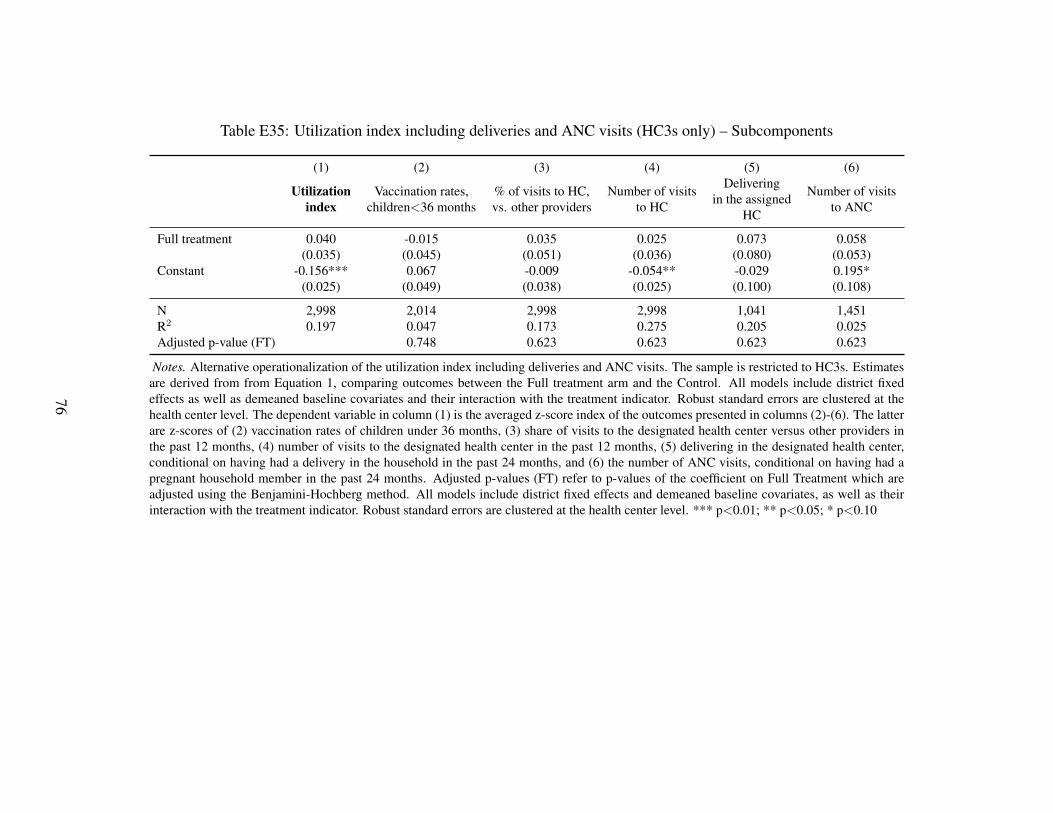
Table E35: Utilization index including deliveries and ANC visits (HC3s only) – Subcomponents
(1) (2) (3) (4) (5) (6)
Utilizationindex
Vaccination rates,children<36 months
% of visits to HC,vs. other providers
Number of visitsto HC
Deliveringin the assigned
HC
Number of visitsto ANC
Full treatment 0.040 -0.015 0.035 0.025 0.073 0.058(0.035) (0.045) (0.051) (0.036) (0.080) (0.053)
Constant -0.156*** 0.067 -0.009 -0.054** -0.029 0.195*(0.025) (0.049) (0.038) (0.025) (0.100) (0.108)
N 2,998 2,014 2,998 2,998 1,041 1,451R2 0.197 0.047 0.173 0.275 0.205 0.025Adjusted p-value (FT) 0.748 0.623 0.623 0.623 0.623
Notes. Alternative operationalization of the utilization index including deliveries and ANC visits. The sample is restricted to HC3s. Estimatesare derived from from Equation 1, comparing outcomes between the Full treatment arm and the Control. All models include district fixedeffects as well as demeaned baseline covariates and their interaction with the treatment indicator. Robust standard errors are clustered at thehealth center level. The dependent variable in column (1) is the averaged z-score index of the outcomes presented in columns (2)-(6). The latterare z-scores of (2) vaccination rates of children under 36 months, (3) share of visits to the designated health center versus other providers inthe past 12 months, (4) number of visits to the designated health center in the past 12 months, (5) delivering in the designated health center,conditional on having had a delivery in the household in the past 24 months, and (6) the number of ANC visits, conditional on having had apregnant household member in the past 24 months. Adjusted p-values (FT) refer to p-values of the coefficient on Full Treatment which areadjusted using the Benjamini-Hochberg method. All models include district fixed effects and demeaned baseline covariates, as well as theirinteraction with the treatment indicator. Robust standard errors are clustered at the health center level. *** p<0.01; ** p<0.05; * p<0.10
76
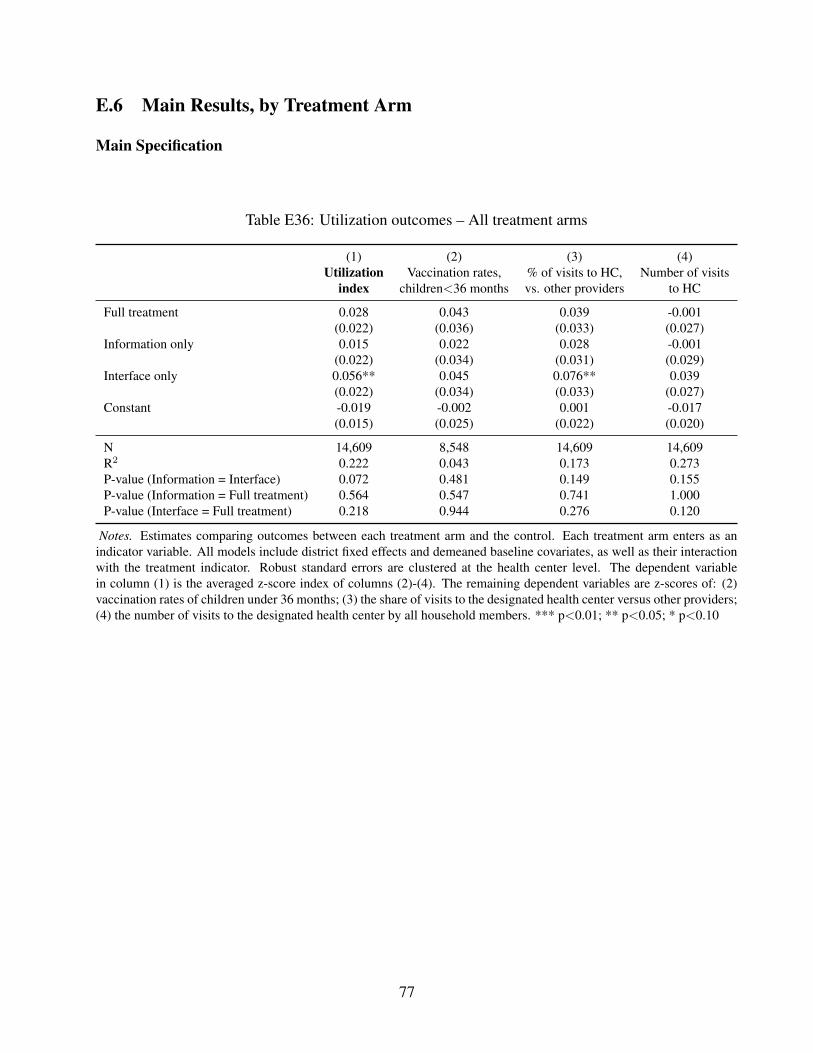
E.6 Main Results, by Treatment Arm
Main Specification
Table E36: Utilization outcomes – All treatment arms
(1) (2) (3) (4)Utilization
indexVaccination rates,
children<36 months% of visits to HC,vs. other providers
Number of visitsto HC
Full treatment 0.028 0.043 0.039 -0.001(0.022) (0.036) (0.033) (0.027)
Information only 0.015 0.022 0.028 -0.001(0.022) (0.034) (0.031) (0.029)
Interface only 0.056** 0.045 0.076** 0.039(0.022) (0.034) (0.033) (0.027)
Constant -0.019 -0.002 0.001 -0.017(0.015) (0.025) (0.022) (0.020)
N 14,609 8,548 14,609 14,609R2 0.222 0.043 0.173 0.273P-value (Information = Interface) 0.072 0.481 0.149 0.155P-value (Information = Full treatment) 0.564 0.547 0.741 1.000P-value (Interface = Full treatment) 0.218 0.944 0.276 0.120
Notes. Estimates comparing outcomes between each treatment arm and the control. Each treatment arm enters as anindicator variable. All models include district fixed effects and demeaned baseline covariates, as well as their interactionwith the treatment indicator. Robust standard errors are clustered at the health center level. The dependent variablein column (1) is the averaged z-score index of columns (2)-(4). The remaining dependent variables are z-scores of: (2)vaccination rates of children under 36 months; (3) the share of visits to the designated health center versus other providers;(4) the number of visits to the designated health center by all household members. *** p<0.01; ** p<0.05; * p<0.10
77
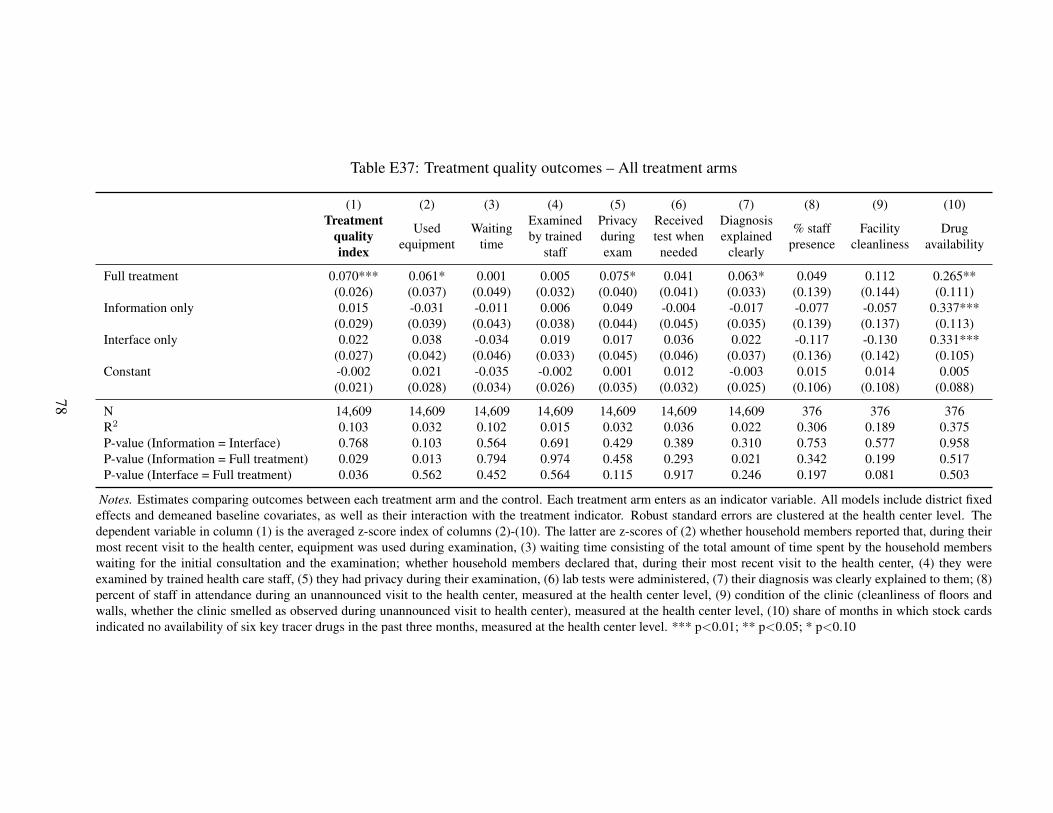
Table E37: Treatment quality outcomes – All treatment arms
(1) (2) (3) (4) (5) (6) (7) (8) (9) (10)Treatment
qualityindex
Usedequipment
Waitingtime
Examinedby trained
staff
Privacyduringexam
Receivedtest whenneeded
Diagnosisexplained
clearly
% staffpresence
Facilitycleanliness
Drugavailability
Full treatment 0.070*** 0.061* 0.001 0.005 0.075* 0.041 0.063* 0.049 0.112 0.265**(0.026) (0.037) (0.049) (0.032) (0.040) (0.041) (0.033) (0.139) (0.144) (0.111)
Information only 0.015 -0.031 -0.011 0.006 0.049 -0.004 -0.017 -0.077 -0.057 0.337***(0.029) (0.039) (0.043) (0.038) (0.044) (0.045) (0.035) (0.139) (0.137) (0.113)
Interface only 0.022 0.038 -0.034 0.019 0.017 0.036 0.022 -0.117 -0.130 0.331***(0.027) (0.042) (0.046) (0.033) (0.045) (0.046) (0.037) (0.136) (0.142) (0.105)
Constant -0.002 0.021 -0.035 -0.002 0.001 0.012 -0.003 0.015 0.014 0.005(0.021) (0.028) (0.034) (0.026) (0.035) (0.032) (0.025) (0.106) (0.108) (0.088)
N 14,609 14,609 14,609 14,609 14,609 14,609 14,609 376 376 376R2 0.103 0.032 0.102 0.015 0.032 0.036 0.022 0.306 0.189 0.375P-value (Information = Interface) 0.768 0.103 0.564 0.691 0.429 0.389 0.310 0.753 0.577 0.958P-value (Information = Full treatment) 0.029 0.013 0.794 0.974 0.458 0.293 0.021 0.342 0.199 0.517P-value (Interface = Full treatment) 0.036 0.562 0.452 0.564 0.115 0.917 0.246 0.197 0.081 0.503
Notes. Estimates comparing outcomes between each treatment arm and the control. Each treatment arm enters as an indicator variable. All models include district fixedeffects and demeaned baseline covariates, as well as their interaction with the treatment indicator. Robust standard errors are clustered at the health center level. Thedependent variable in column (1) is the averaged z-score index of columns (2)-(10). The latter are z-scores of (2) whether household members reported that, during theirmost recent visit to the health center, equipment was used during examination, (3) waiting time consisting of the total amount of time spent by the household memberswaiting for the initial consultation and the examination; whether household members declared that, during their most recent visit to the health center, (4) they wereexamined by trained health care staff, (5) they had privacy during their examination, (6) lab tests were administered, (7) their diagnosis was clearly explained to them; (8)percent of staff in attendance during an unannounced visit to the health center, measured at the health center level, (9) condition of the clinic (cleanliness of floors andwalls, whether the clinic smelled as observed during unannounced visit to health center), measured at the health center level, (10) share of months in which stock cardsindicated no availability of six key tracer drugs in the past three months, measured at the health center level. *** p<0.01; ** p<0.05; * p<0.10
78
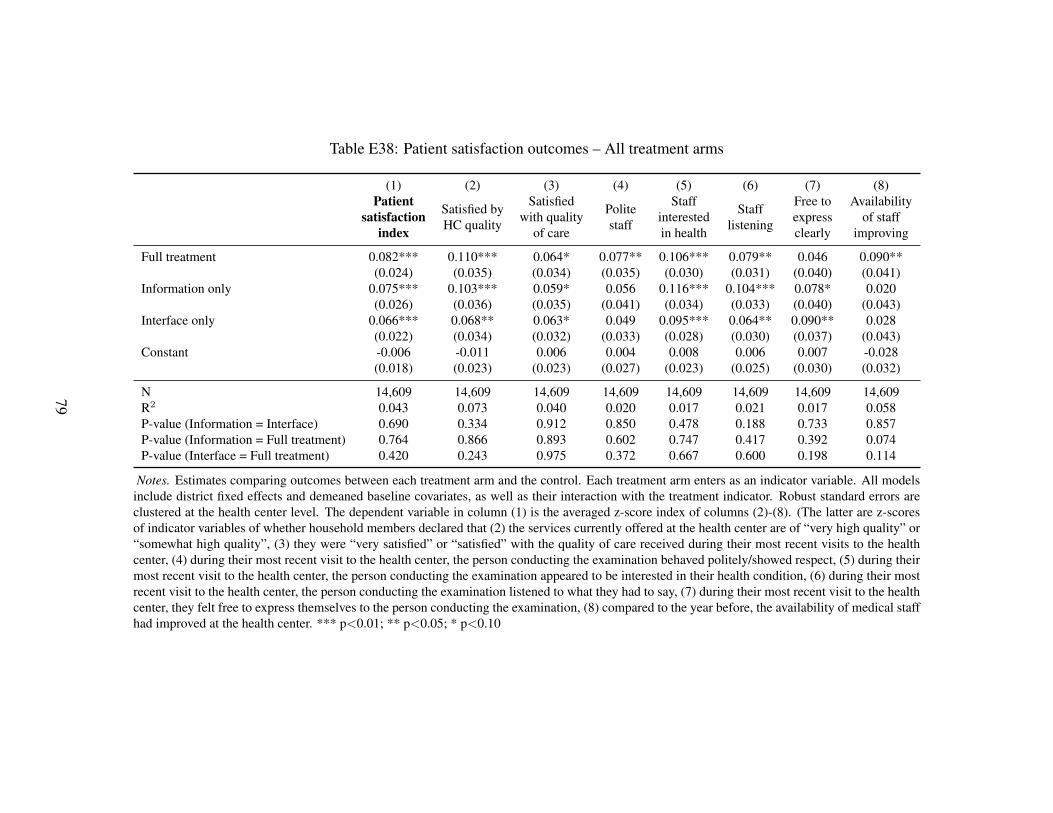
Table E38: Patient satisfaction outcomes – All treatment arms
(1) (2) (3) (4) (5) (6) (7) (8)Patient
satisfactionindex
Satisfied byHC quality
Satisfiedwith quality
of care
Politestaff
Staffinterestedin health
Stafflistening
Free toexpressclearly
Availabilityof staff
improving
Full treatment 0.082*** 0.110*** 0.064* 0.077** 0.106*** 0.079** 0.046 0.090**(0.024) (0.035) (0.034) (0.035) (0.030) (0.031) (0.040) (0.041)
Information only 0.075*** 0.103*** 0.059* 0.056 0.116*** 0.104*** 0.078* 0.020(0.026) (0.036) (0.035) (0.041) (0.034) (0.033) (0.040) (0.043)
Interface only 0.066*** 0.068** 0.063* 0.049 0.095*** 0.064** 0.090** 0.028(0.022) (0.034) (0.032) (0.033) (0.028) (0.030) (0.037) (0.043)
Constant -0.006 -0.011 0.006 0.004 0.008 0.006 0.007 -0.028(0.018) (0.023) (0.023) (0.027) (0.023) (0.025) (0.030) (0.032)
N 14,609 14,609 14,609 14,609 14,609 14,609 14,609 14,609R2 0.043 0.073 0.040 0.020 0.017 0.021 0.017 0.058P-value (Information = Interface) 0.690 0.334 0.912 0.850 0.478 0.188 0.733 0.857P-value (Information = Full treatment) 0.764 0.866 0.893 0.602 0.747 0.417 0.392 0.074P-value (Interface = Full treatment) 0.420 0.243 0.975 0.372 0.667 0.600 0.198 0.114
Notes. Estimates comparing outcomes between each treatment arm and the control. Each treatment arm enters as an indicator variable. All modelsinclude district fixed effects and demeaned baseline covariates, as well as their interaction with the treatment indicator. Robust standard errors areclustered at the health center level. The dependent variable in column (1) is the averaged z-score index of columns (2)-(8). (The latter are z-scoresof indicator variables of whether household members declared that (2) the services currently offered at the health center are of “very high quality” or“somewhat high quality”, (3) they were “very satisfied” or “satisfied” with the quality of care received during their most recent visits to the healthcenter, (4) during their most recent visit to the health center, the person conducting the examination behaved politely/showed respect, (5) during theirmost recent visit to the health center, the person conducting the examination appeared to be interested in their health condition, (6) during their mostrecent visit to the health center, the person conducting the examination listened to what they had to say, (7) during their most recent visit to the healthcenter, they felt free to express themselves to the person conducting the examination, (8) compared to the year before, the availability of medical staffhad improved at the health center. *** p<0.01; ** p<0.05; * p<0.10
79
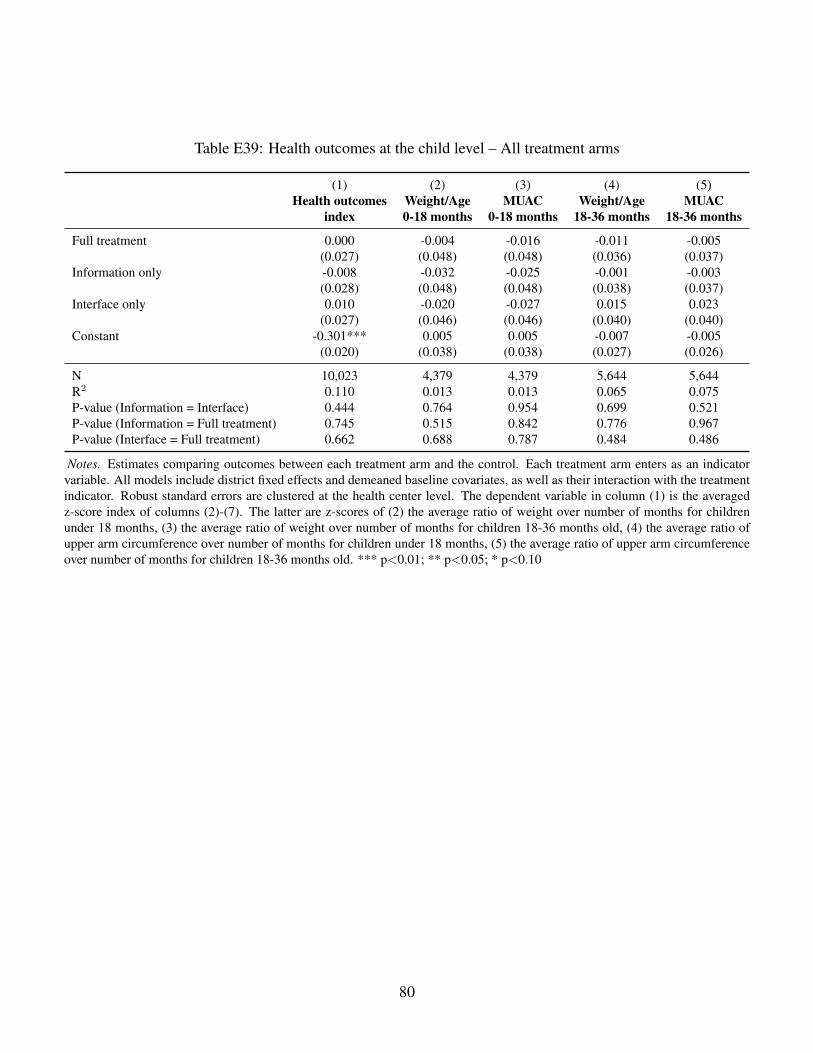
Table E39: Health outcomes at the child level – All treatment arms
(1) (2) (3) (4) (5)Health outcomes
indexWeight/Age0-18 months
MUAC0-18 months
Weight/Age18-36 months
MUAC18-36 months
Full treatment 0.000 -0.004 -0.016 -0.011 -0.005(0.027) (0.048) (0.048) (0.036) (0.037)
Information only -0.008 -0.032 -0.025 -0.001 -0.003(0.028) (0.048) (0.048) (0.038) (0.037)
Interface only 0.010 -0.020 -0.027 0.015 0.023(0.027) (0.046) (0.046) (0.040) (0.040)
Constant -0.301*** 0.005 0.005 -0.007 -0.005(0.020) (0.038) (0.038) (0.027) (0.026)
N 10,023 4,379 4,379 5,644 5,644R2 0.110 0.013 0.013 0.065 0.075P-value (Information = Interface) 0.444 0.764 0.954 0.699 0.521P-value (Information = Full treatment) 0.745 0.515 0.842 0.776 0.967P-value (Interface = Full treatment) 0.662 0.688 0.787 0.484 0.486
Notes. Estimates comparing outcomes between each treatment arm and the control. Each treatment arm enters as an indicatorvariable. All models include district fixed effects and demeaned baseline covariates, as well as their interaction with the treatmentindicator. Robust standard errors are clustered at the health center level. The dependent variable in column (1) is the averagedz-score index of columns (2)-(7). The latter are z-scores of (2) the average ratio of weight over number of months for childrenunder 18 months, (3) the average ratio of weight over number of months for children 18-36 months old, (4) the average ratio ofupper arm circumference over number of months for children under 18 months, (5) the average ratio of upper arm circumferenceover number of months for children 18-36 months old. *** p<0.01; ** p<0.05; * p<0.10
80
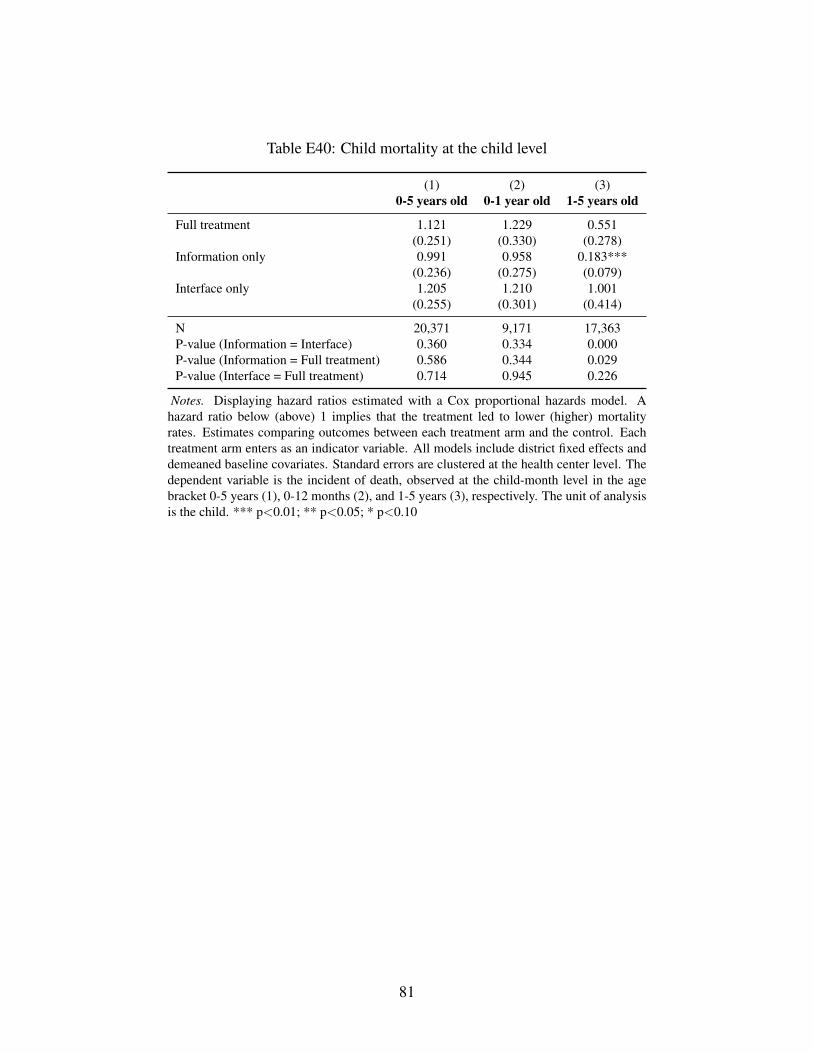
Table E40: Child mortality at the child level
(1) (2) (3)0-5 years old 0-1 year old 1-5 years old
Full treatment 1.121 1.229 0.551(0.251) (0.330) (0.278)
Information only 0.991 0.958 0.183***(0.236) (0.275) (0.079)
Interface only 1.205 1.210 1.001(0.255) (0.301) (0.414)
N 20,371 9,171 17,363P-value (Information = Interface) 0.360 0.334 0.000P-value (Information = Full treatment) 0.586 0.344 0.029P-value (Interface = Full treatment) 0.714 0.945 0.226
Notes. Displaying hazard ratios estimated with a Cox proportional hazards model. Ahazard ratio below (above) 1 implies that the treatment led to lower (higher) mortalityrates. Estimates comparing outcomes between each treatment arm and the control. Eachtreatment arm enters as an indicator variable. All models include district fixed effects anddemeaned baseline covariates. Standard errors are clustered at the health center level. Thedependent variable is the incident of death, observed at the child-month level in the agebracket 0-5 years (1), 0-12 months (2), and 1-5 years (3), respectively. The unit of analysisis the child. *** p<0.01; ** p<0.05; * p<0.10
81
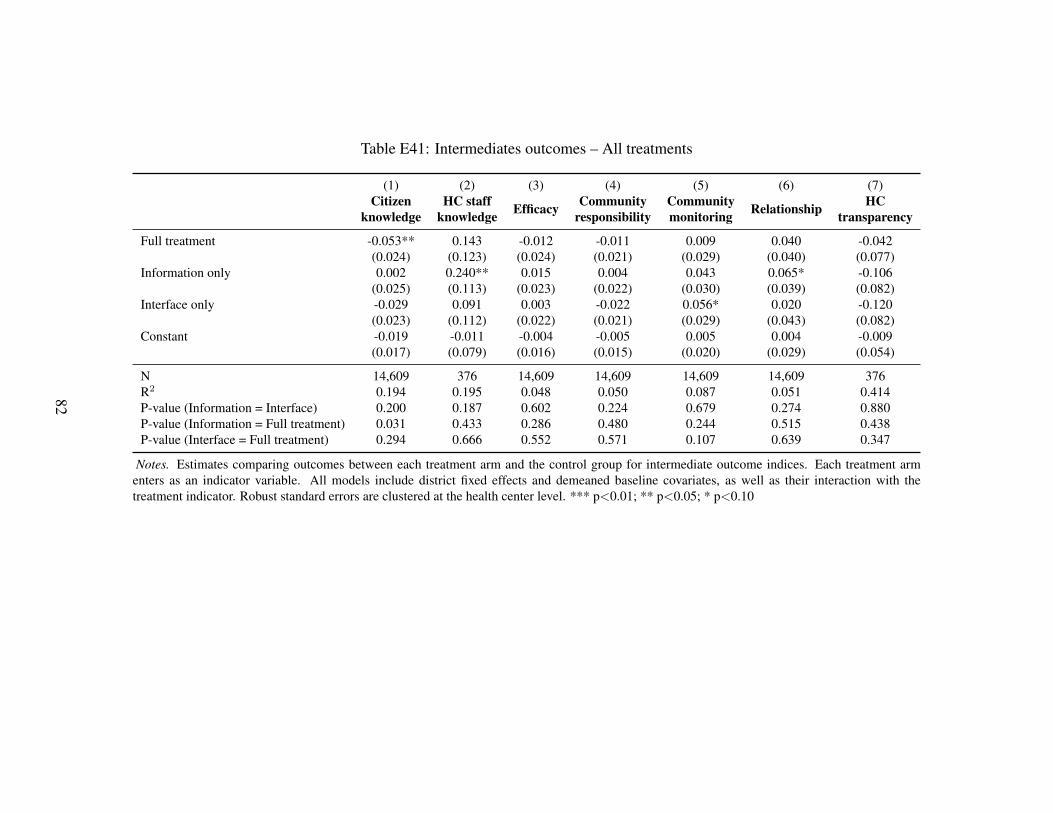
Table E41: Intermediates outcomes – All treatments
(1) (2) (3) (4) (5) (6) (7)Citizen
knowledgeHC staff
knowledge Efficacy Communityresponsibility
Communitymonitoring Relationship HC
transparency
Full treatment -0.053** 0.143 -0.012 -0.011 0.009 0.040 -0.042(0.024) (0.123) (0.024) (0.021) (0.029) (0.040) (0.077)
Information only 0.002 0.240** 0.015 0.004 0.043 0.065* -0.106(0.025) (0.113) (0.023) (0.022) (0.030) (0.039) (0.082)
Interface only -0.029 0.091 0.003 -0.022 0.056* 0.020 -0.120(0.023) (0.112) (0.022) (0.021) (0.029) (0.043) (0.082)
Constant -0.019 -0.011 -0.004 -0.005 0.005 0.004 -0.009(0.017) (0.079) (0.016) (0.015) (0.020) (0.029) (0.054)
N 14,609 376 14,609 14,609 14,609 14,609 376R2 0.194 0.195 0.048 0.050 0.087 0.051 0.414P-value (Information = Interface) 0.200 0.187 0.602 0.224 0.679 0.274 0.880P-value (Information = Full treatment) 0.031 0.433 0.286 0.480 0.244 0.515 0.438P-value (Interface = Full treatment) 0.294 0.666 0.552 0.571 0.107 0.639 0.347
Notes. Estimates comparing outcomes between each treatment arm and the control group for intermediate outcome indices. Each treatment armenters as an indicator variable. All models include district fixed effects and demeaned baseline covariates, as well as their interaction with thetreatment indicator. Robust standard errors are clustered at the health center level. *** p<0.01; ** p<0.05; * p<0.10
82
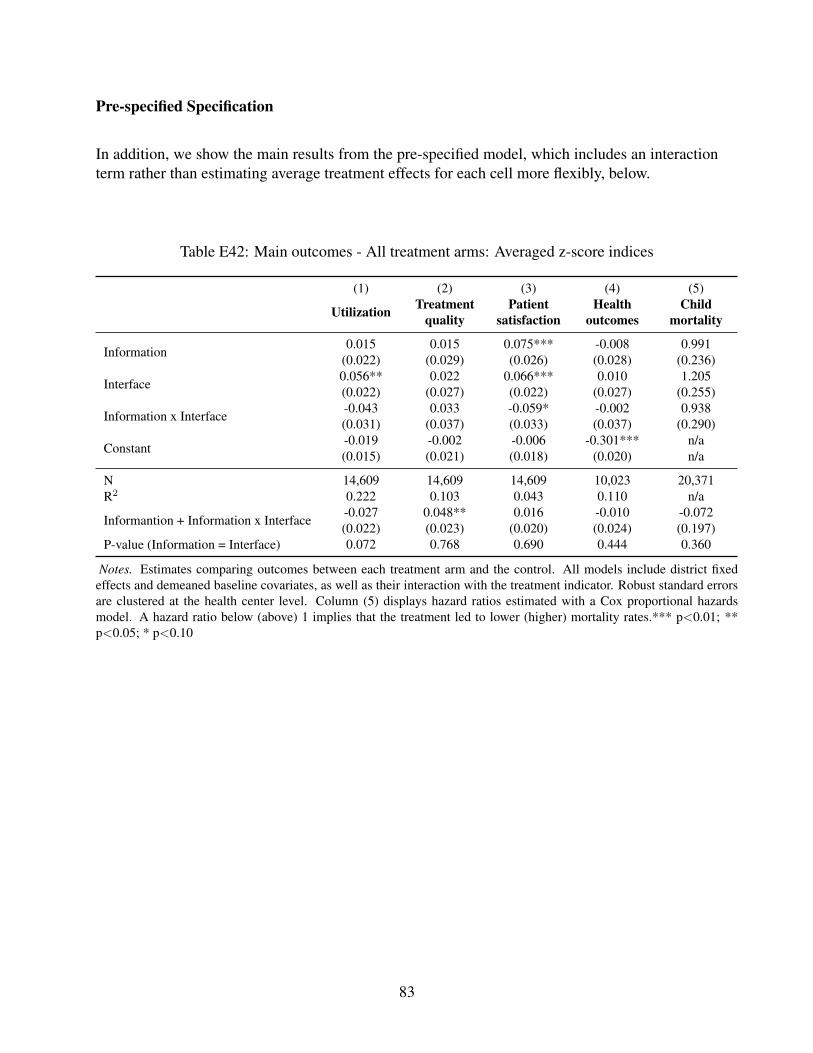
Pre-specified Specification
In addition, we show the main results from the pre-specified model, which includes an interactionterm rather than estimating average treatment effects for each cell more flexibly, below.
Table E42: Main outcomes - All treatment arms: Averaged z-score indices
(1) (2) (3) (4) (5)
Utilization Treatmentquality
Patientsatisfaction
Healthoutcomes
Childmortality
Information 0.015 0.015 0.075*** -0.008 0.991(0.022) (0.029) (0.026) (0.028) (0.236)
Interface 0.056** 0.022 0.066*** 0.010 1.205(0.022) (0.027) (0.022) (0.027) (0.255)
Information x Interface -0.043 0.033 -0.059* -0.002 0.938(0.031) (0.037) (0.033) (0.037) (0.290)
Constant -0.019 -0.002 -0.006 -0.301*** n/a(0.015) (0.021) (0.018) (0.020) n/a
N 14,609 14,609 14,609 10,023 20,371R2 0.222 0.103 0.043 0.110 n/a
Informantion + Information x Interface -0.027 0.048** 0.016 -0.010 -0.072(0.022) (0.023) (0.020) (0.024) (0.197)
P-value (Information = Interface) 0.072 0.768 0.690 0.444 0.360
Notes. Estimates comparing outcomes between each treatment arm and the control. All models include district fixedeffects and demeaned baseline covariates, as well as their interaction with the treatment indicator. Robust standard errorsare clustered at the health center level. Column (5) displays hazard ratios estimated with a Cox proportional hazardsmodel. A hazard ratio below (above) 1 implies that the treatment led to lower (higher) mortality rates.*** p<0.01; **p<0.05; * p<0.10
83
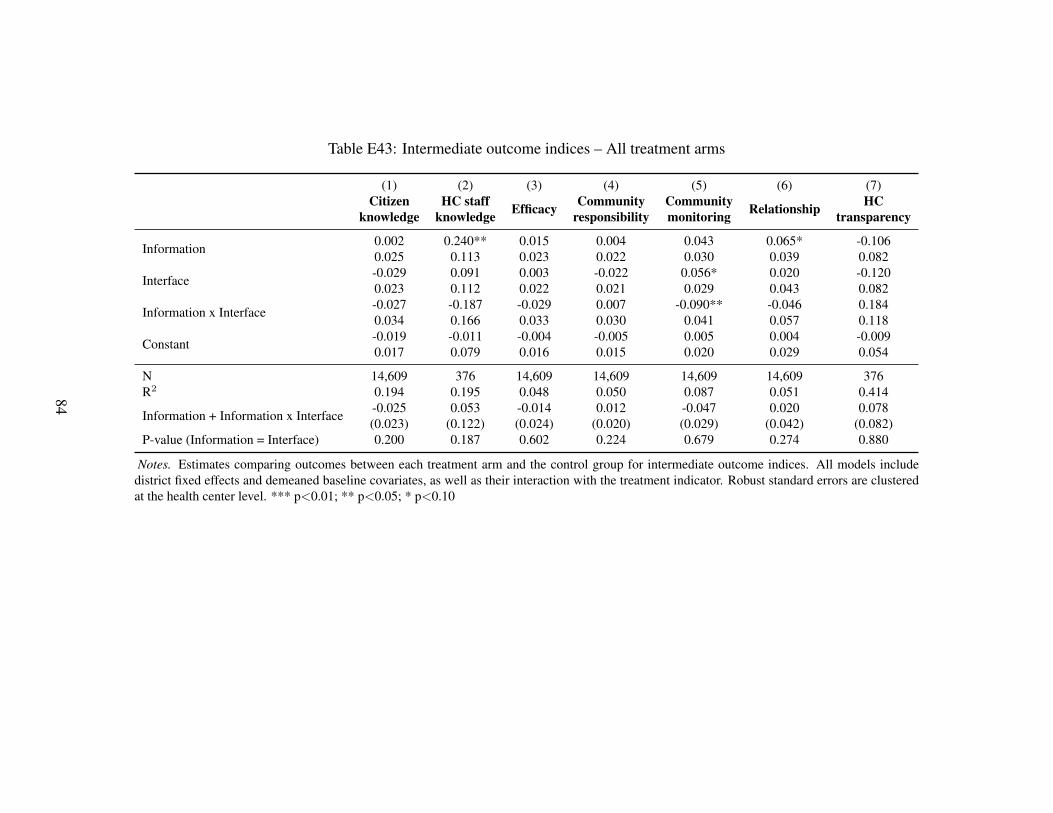
Table E43: Intermediate outcome indices – All treatment arms
(1) (2) (3) (4) (5) (6) (7)Citizen
knowledgeHC staff
knowledge Efficacy Communityresponsibility
Communitymonitoring Relationship HC
transparency
Information 0.002 0.240** 0.015 0.004 0.043 0.065* -0.1060.025 0.113 0.023 0.022 0.030 0.039 0.082
Interface -0.029 0.091 0.003 -0.022 0.056* 0.020 -0.1200.023 0.112 0.022 0.021 0.029 0.043 0.082
Information x Interface -0.027 -0.187 -0.029 0.007 -0.090** -0.046 0.1840.034 0.166 0.033 0.030 0.041 0.057 0.118
Constant -0.019 -0.011 -0.004 -0.005 0.005 0.004 -0.0090.017 0.079 0.016 0.015 0.020 0.029 0.054
N 14,609 376 14,609 14,609 14,609 14,609 376R2 0.194 0.195 0.048 0.050 0.087 0.051 0.414
Information + Information x Interface -0.025 0.053 -0.014 0.012 -0.047 0.020 0.078(0.023) (0.122) (0.024) (0.020) (0.029) (0.042) (0.082)
P-value (Information = Interface) 0.200 0.187 0.602 0.224 0.679 0.274 0.880
Notes. Estimates comparing outcomes between each treatment arm and the control group for intermediate outcome indices. All models includedistrict fixed effects and demeaned baseline covariates, as well as their interaction with the treatment indicator. Robust standard errors are clusteredat the health center level. *** p<0.01; ** p<0.05; * p<0.10
84
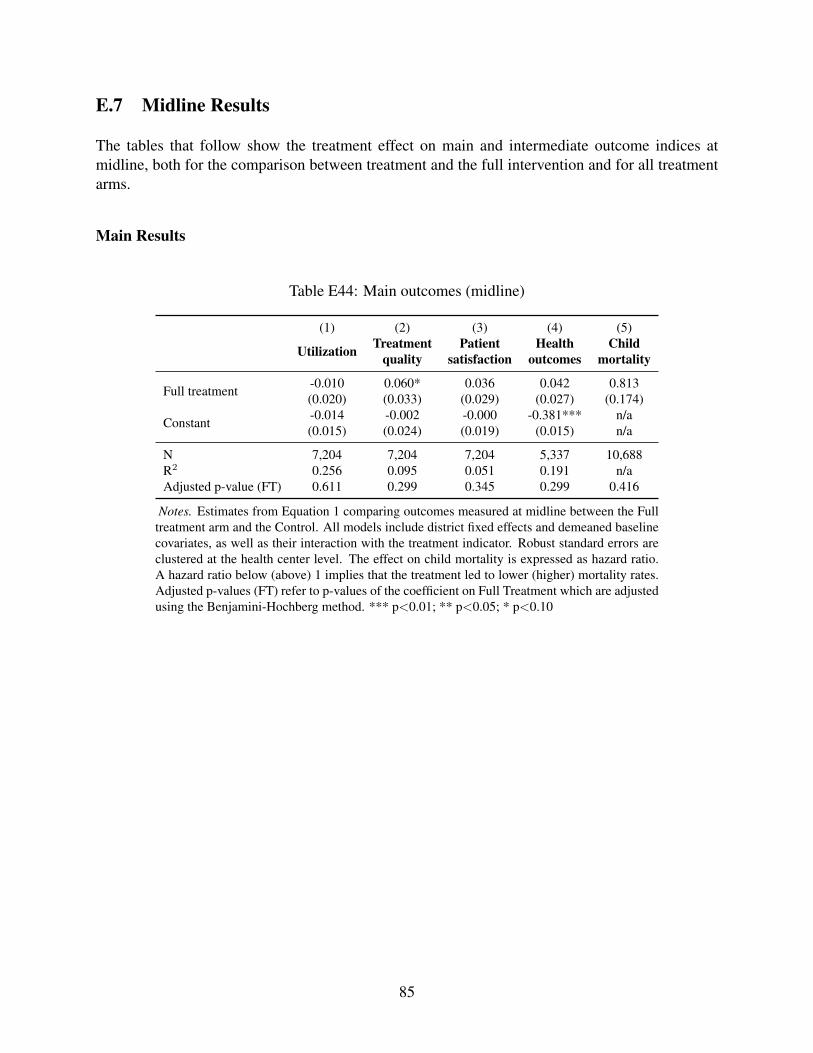
E.7 Midline Results
The tables that follow show the treatment effect on main and intermediate outcome indices atmidline, both for the comparison between treatment and the full intervention and for all treatmentarms.
Main Results
Table E44: Main outcomes (midline)
(1) (2) (3) (4) (5)
Utilization Treatmentquality
Patientsatisfaction
Healthoutcomes
Childmortality
Full treatment -0.010 0.060* 0.036 0.042 0.813(0.020) (0.033) (0.029) (0.027) (0.174)
Constant -0.014 -0.002 -0.000 -0.381*** n/a(0.015) (0.024) (0.019) (0.015) n/a
N 7,204 7,204 7,204 5,337 10,688R2 0.256 0.095 0.051 0.191 n/aAdjusted p-value (FT) 0.611 0.299 0.345 0.299 0.416
Notes. Estimates from Equation 1 comparing outcomes measured at midline between the Fulltreatment arm and the Control. All models include district fixed effects and demeaned baselinecovariates, as well as their interaction with the treatment indicator. Robust standard errors areclustered at the health center level. The effect on child mortality is expressed as hazard ratio.A hazard ratio below (above) 1 implies that the treatment led to lower (higher) mortality rates.Adjusted p-values (FT) refer to p-values of the coefficient on Full Treatment which are adjustedusing the Benjamini-Hochberg method. *** p<0.01; ** p<0.05; * p<0.10
85
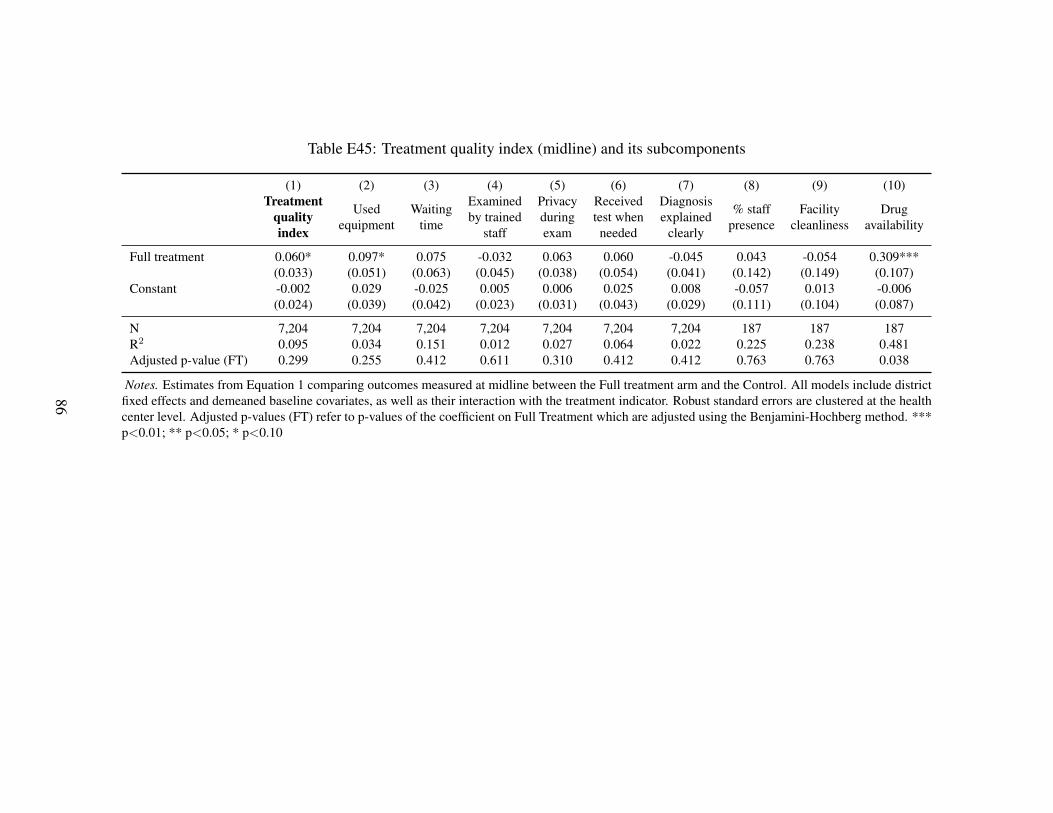
Table E45: Treatment quality index (midline) and its subcomponents
(1) (2) (3) (4) (5) (6) (7) (8) (9) (10)Treatment
qualityindex
Usedequipment
Waitingtime
Examinedby trained
staff
Privacyduringexam
Receivedtest whenneeded
Diagnosisexplained
clearly
% staffpresence
Facilitycleanliness
Drugavailability
Full treatment 0.060* 0.097* 0.075 -0.032 0.063 0.060 -0.045 0.043 -0.054 0.309***(0.033) (0.051) (0.063) (0.045) (0.038) (0.054) (0.041) (0.142) (0.149) (0.107)
Constant -0.002 0.029 -0.025 0.005 0.006 0.025 0.008 -0.057 0.013 -0.006(0.024) (0.039) (0.042) (0.023) (0.031) (0.043) (0.029) (0.111) (0.104) (0.087)
N 7,204 7,204 7,204 7,204 7,204 7,204 7,204 187 187 187R2 0.095 0.034 0.151 0.012 0.027 0.064 0.022 0.225 0.238 0.481Adjusted p-value (FT) 0.299 0.255 0.412 0.611 0.310 0.412 0.412 0.763 0.763 0.038
Notes. Estimates from Equation 1 comparing outcomes measured at midline between the Full treatment arm and the Control. All models include districtfixed effects and demeaned baseline covariates, as well as their interaction with the treatment indicator. Robust standard errors are clustered at the healthcenter level. Adjusted p-values (FT) refer to p-values of the coefficient on Full Treatment which are adjusted using the Benjamini-Hochberg method. ***p<0.01; ** p<0.05; * p<0.10
86
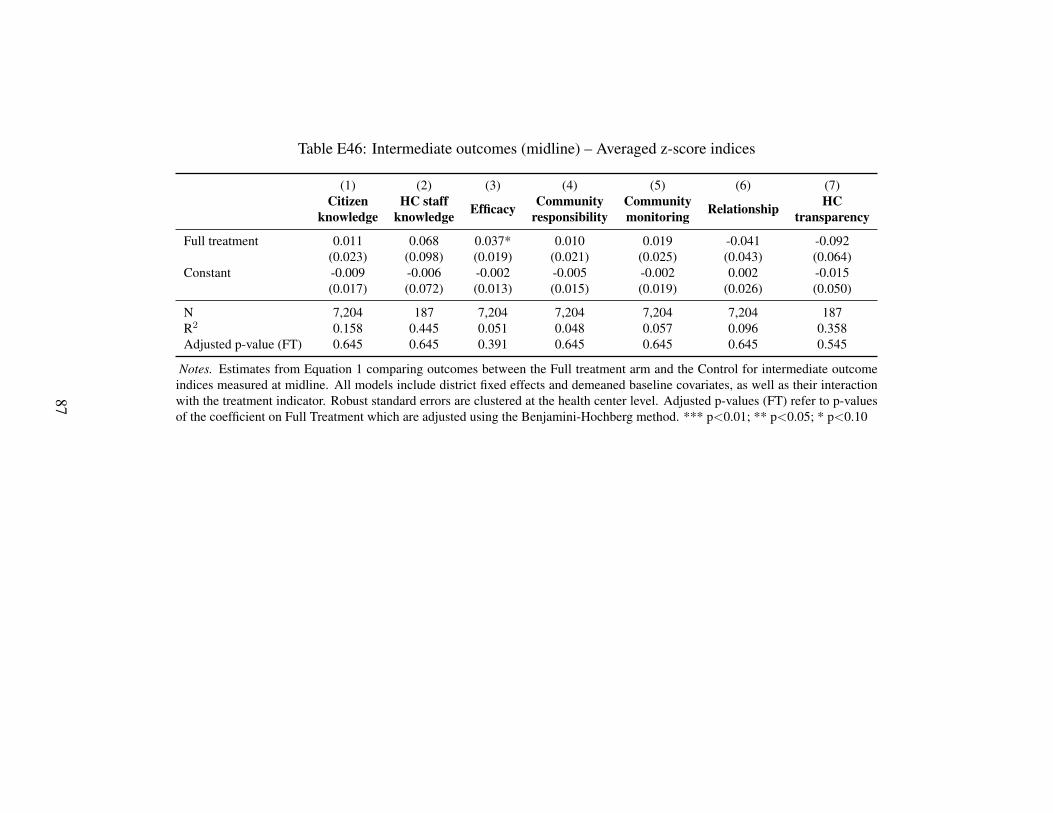
Table E46: Intermediate outcomes (midline) – Averaged z-score indices
(1) (2) (3) (4) (5) (6) (7)Citizen
knowledgeHC staff
knowledge Efficacy Communityresponsibility
Communitymonitoring Relationship HC
transparency
Full treatment 0.011 0.068 0.037* 0.010 0.019 -0.041 -0.092(0.023) (0.098) (0.019) (0.021) (0.025) (0.043) (0.064)
Constant -0.009 -0.006 -0.002 -0.005 -0.002 0.002 -0.015(0.017) (0.072) (0.013) (0.015) (0.019) (0.026) (0.050)
N 7,204 187 7,204 7,204 7,204 7,204 187R2 0.158 0.445 0.051 0.048 0.057 0.096 0.358Adjusted p-value (FT) 0.645 0.645 0.391 0.645 0.645 0.645 0.545
Notes. Estimates from Equation 1 comparing outcomes between the Full treatment arm and the Control for intermediate outcomeindices measured at midline. All models include district fixed effects and demeaned baseline covariates, as well as their interactionwith the treatment indicator. Robust standard errors are clustered at the health center level. Adjusted p-values (FT) refer to p-valuesof the coefficient on Full Treatment which are adjusted using the Benjamini-Hochberg method. *** p<0.01; ** p<0.05; * p<0.10
87
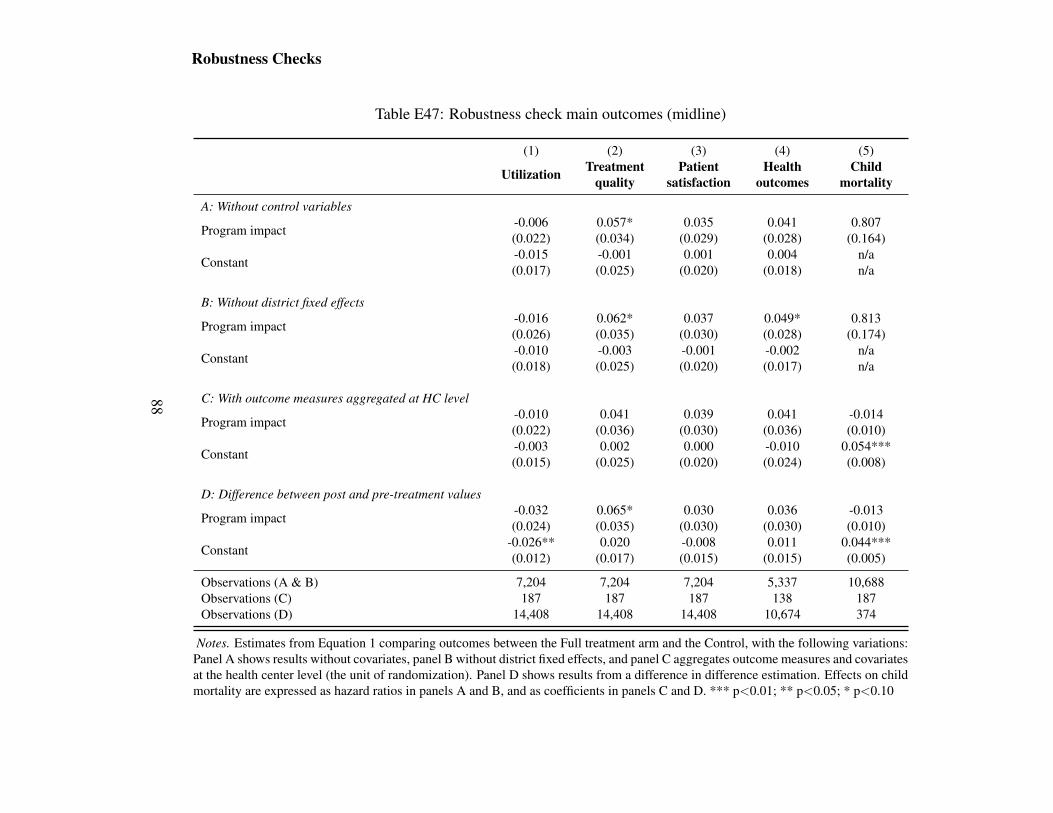
Robustness Checks
Table E47: Robustness check main outcomes (midline)
(1) (2) (3) (4) (5)
Utilization Treatmentquality
Patientsatisfaction
Healthoutcomes
Childmortality
A: Without control variables
Program impact -0.006 0.057* 0.035 0.041 0.807(0.022) (0.034) (0.029) (0.028) (0.164)
Constant -0.015 -0.001 0.001 0.004 n/a(0.017) (0.025) (0.020) (0.018) n/a
B: Without district fixed effects
Program impact -0.016 0.062* 0.037 0.049* 0.813(0.026) (0.035) (0.030) (0.028) (0.174)
Constant -0.010 -0.003 -0.001 -0.002 n/a(0.018) (0.025) (0.020) (0.017) n/a
C: With outcome measures aggregated at HC level
Program impact -0.010 0.041 0.039 0.041 -0.014(0.022) (0.036) (0.030) (0.036) (0.010)
Constant -0.003 0.002 0.000 -0.010 0.054***(0.015) (0.025) (0.020) (0.024) (0.008)
D: Difference between post and pre-treatment values
Program impact -0.032 0.065* 0.030 0.036 -0.013(0.024) (0.035) (0.030) (0.030) (0.010)
Constant -0.026** 0.020 -0.008 0.011 0.044***(0.012) (0.017) (0.015) (0.015) (0.005)
Observations (A & B) 7,204 7,204 7,204 5,337 10,688Observations (C) 187 187 187 138 187Observations (D) 14,408 14,408 14,408 10,674 374
Notes. Estimates from Equation 1 comparing outcomes between the Full treatment arm and the Control, with the following variations:Panel A shows results without covariates, panel B without district fixed effects, and panel C aggregates outcome measures and covariatesat the health center level (the unit of randomization). Panel D shows results from a difference in difference estimation. Effects on childmortality are expressed as hazard ratios in panels A and B, and as coefficients in panels C and D. *** p<0.01; ** p<0.05; * p<0.10
88
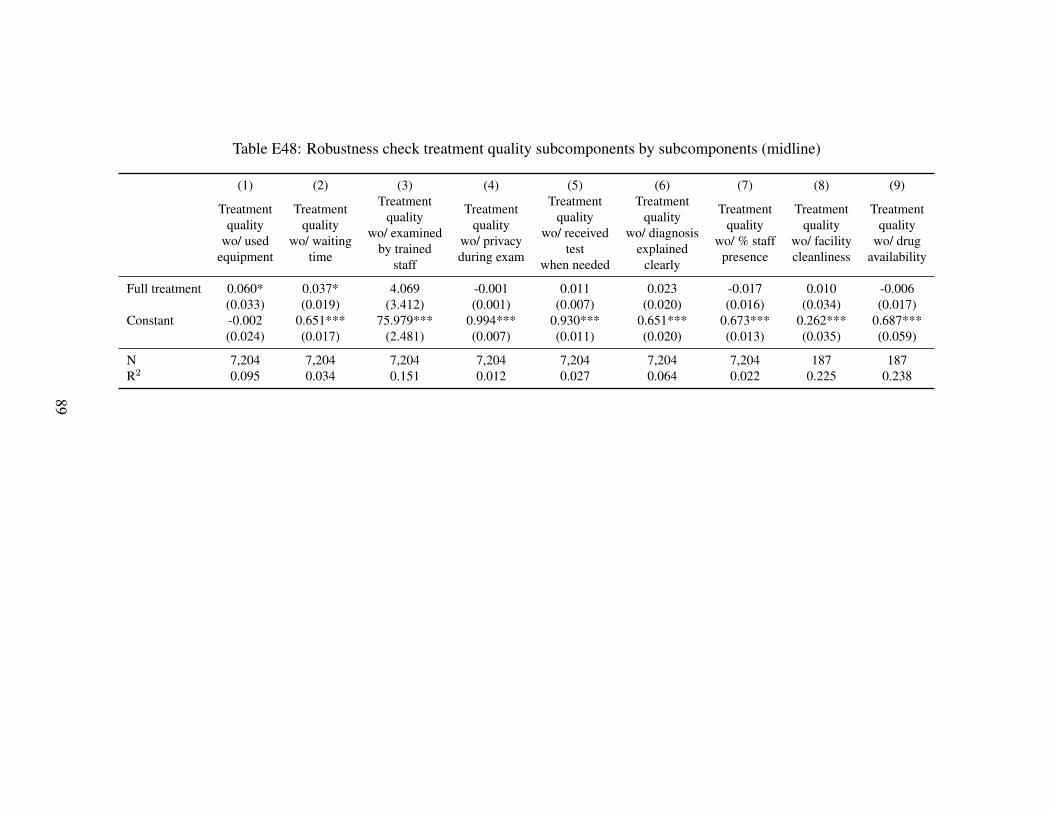
Table E48: Robustness check treatment quality subcomponents by subcomponents (midline)
(1) (2) (3) (4) (5) (6) (7) (8) (9)
Treatmentquality
wo/ usedequipment
Treatmentquality
wo/ waitingtime
Treatmentquality
wo/ examinedby trained
staff
Treatmentquality
wo/ privacyduring exam
Treatmentquality
wo/ receivedtest
when needed
Treatmentquality
wo/ diagnosisexplained
clearly
Treatmentquality
wo/ % staffpresence
Treatmentquality
wo/ facilitycleanliness
Treatmentquality
wo/ drugavailability
Full treatment 0.060* 0.037* 4.069 -0.001 0.011 0.023 -0.017 0.010 -0.006(0.033) (0.019) (3.412) (0.001) (0.007) (0.020) (0.016) (0.034) (0.017)
Constant -0.002 0.651*** 75.979*** 0.994*** 0.930*** 0.651*** 0.673*** 0.262*** 0.687***(0.024) (0.017) (2.481) (0.007) (0.011) (0.020) (0.013) (0.035) (0.059)
N 7,204 7,204 7,204 7,204 7,204 7,204 7,204 187 187R2 0.095 0.034 0.151 0.012 0.027 0.064 0.022 0.225 0.238
89
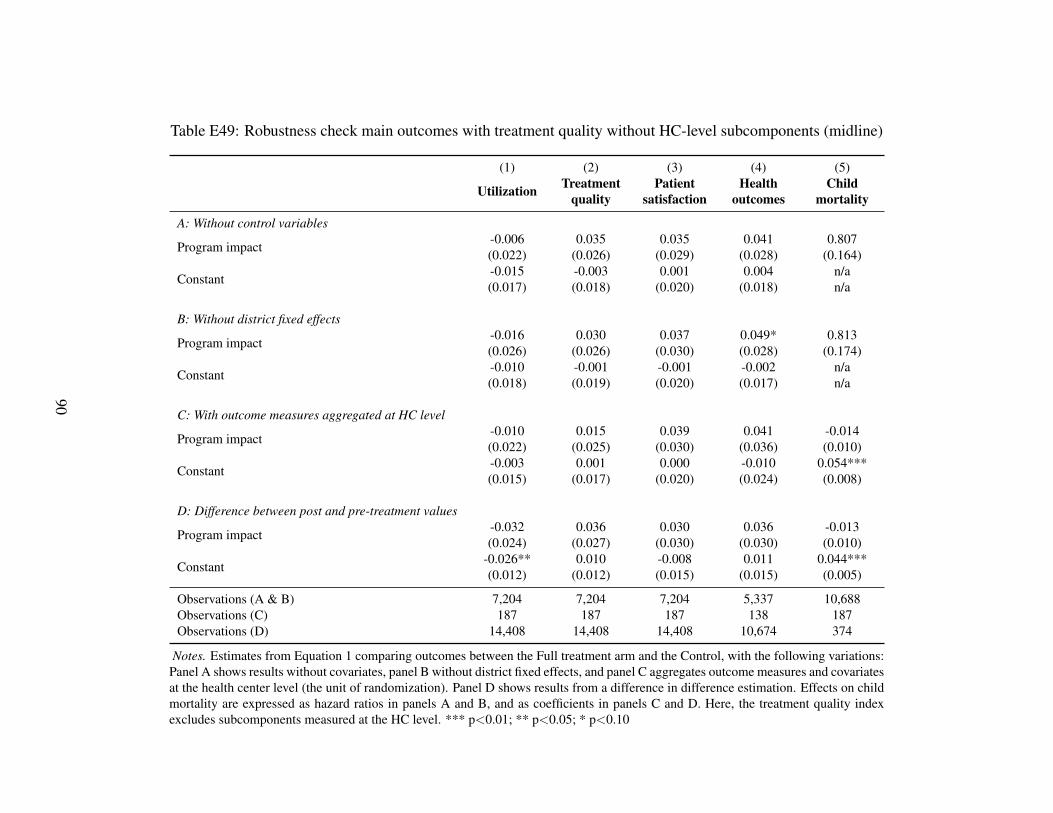
Table E49: Robustness check main outcomes with treatment quality without HC-level subcomponents (midline)
(1) (2) (3) (4) (5)
Utilization Treatmentquality
Patientsatisfaction
Healthoutcomes
Childmortality
A: Without control variables
Program impact -0.006 0.035 0.035 0.041 0.807(0.022) (0.026) (0.029) (0.028) (0.164)
Constant -0.015 -0.003 0.001 0.004 n/a(0.017) (0.018) (0.020) (0.018) n/a
B: Without district fixed effects
Program impact -0.016 0.030 0.037 0.049* 0.813(0.026) (0.026) (0.030) (0.028) (0.174)
Constant -0.010 -0.001 -0.001 -0.002 n/a(0.018) (0.019) (0.020) (0.017) n/a
C: With outcome measures aggregated at HC level
Program impact -0.010 0.015 0.039 0.041 -0.014(0.022) (0.025) (0.030) (0.036) (0.010)
Constant -0.003 0.001 0.000 -0.010 0.054***(0.015) (0.017) (0.020) (0.024) (0.008)
D: Difference between post and pre-treatment values
Program impact -0.032 0.036 0.030 0.036 -0.013(0.024) (0.027) (0.030) (0.030) (0.010)
Constant -0.026** 0.010 -0.008 0.011 0.044***(0.012) (0.012) (0.015) (0.015) (0.005)
Observations (A & B) 7,204 7,204 7,204 5,337 10,688Observations (C) 187 187 187 138 187Observations (D) 14,408 14,408 14,408 10,674 374
Notes. Estimates from Equation 1 comparing outcomes between the Full treatment arm and the Control, with the following variations:Panel A shows results without covariates, panel B without district fixed effects, and panel C aggregates outcome measures and covariatesat the health center level (the unit of randomization). Panel D shows results from a difference in difference estimation. Effects on childmortality are expressed as hazard ratios in panels A and B, and as coefficients in panels C and D. Here, the treatment quality indexexcludes subcomponents measured at the HC level. *** p<0.01; ** p<0.05; * p<0.10
90
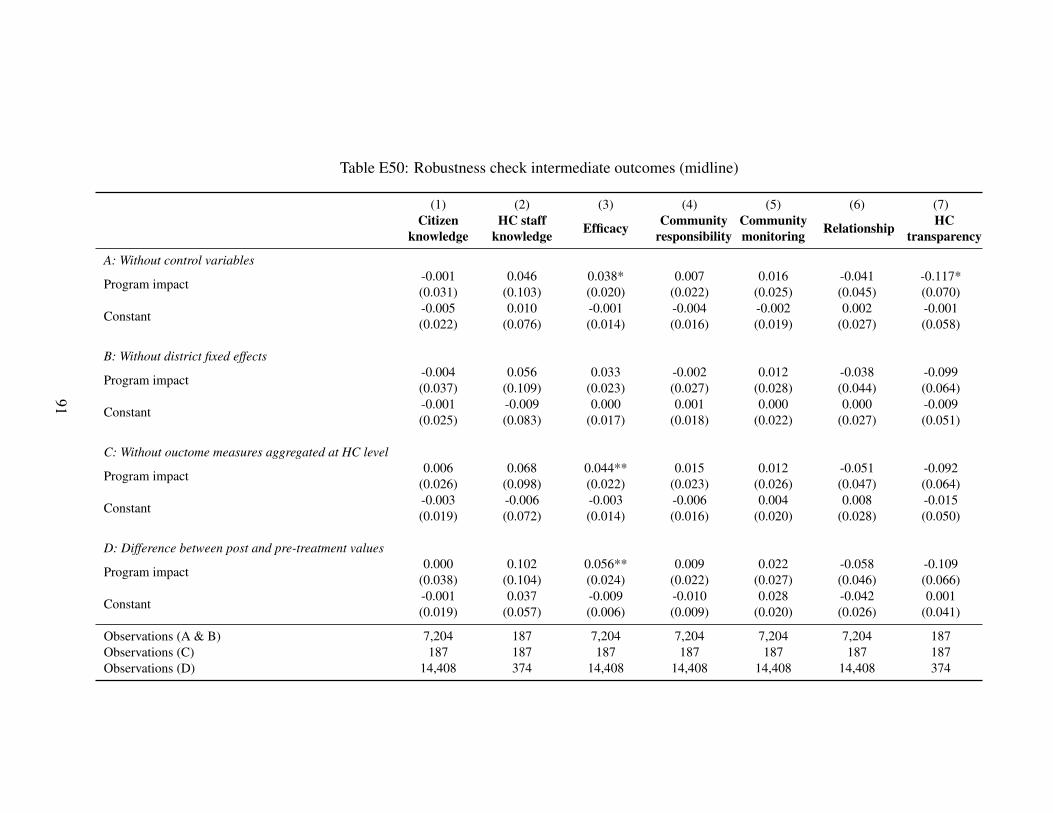
Table E50: Robustness check intermediate outcomes (midline)
(1) (2) (3) (4) (5) (6) (7)Citizen
knowledgeHC staff
knowledge Efficacy Communityresponsibility
Communitymonitoring Relationship HC
transparency
A: Without control variables
Program impact -0.001 0.046 0.038* 0.007 0.016 -0.041 -0.117*(0.031) (0.103) (0.020) (0.022) (0.025) (0.045) (0.070)
Constant -0.005 0.010 -0.001 -0.004 -0.002 0.002 -0.001(0.022) (0.076) (0.014) (0.016) (0.019) (0.027) (0.058)
B: Without district fixed effects
Program impact -0.004 0.056 0.033 -0.002 0.012 -0.038 -0.099(0.037) (0.109) (0.023) (0.027) (0.028) (0.044) (0.064)
Constant -0.001 -0.009 0.000 0.001 0.000 0.000 -0.009(0.025) (0.083) (0.017) (0.018) (0.022) (0.027) (0.051)
C: Without ouctome measures aggregated at HC level
Program impact 0.006 0.068 0.044** 0.015 0.012 -0.051 -0.092(0.026) (0.098) (0.022) (0.023) (0.026) (0.047) (0.064)
Constant -0.003 -0.006 -0.003 -0.006 0.004 0.008 -0.015(0.019) (0.072) (0.014) (0.016) (0.020) (0.028) (0.050)
D: Difference between post and pre-treatment values
Program impact 0.000 0.102 0.056** 0.009 0.022 -0.058 -0.109(0.038) (0.104) (0.024) (0.022) (0.027) (0.046) (0.066)
Constant -0.001 0.037 -0.009 -0.010 0.028 -0.042 0.001(0.019) (0.057) (0.006) (0.009) (0.020) (0.026) (0.041)
Observations (A & B) 7,204 187 7,204 7,204 7,204 7,204 187Observations (C) 187 187 187 187 187 187 187Observations (D) 14,408 374 14,408 14,408 14,408 14,408 374
91
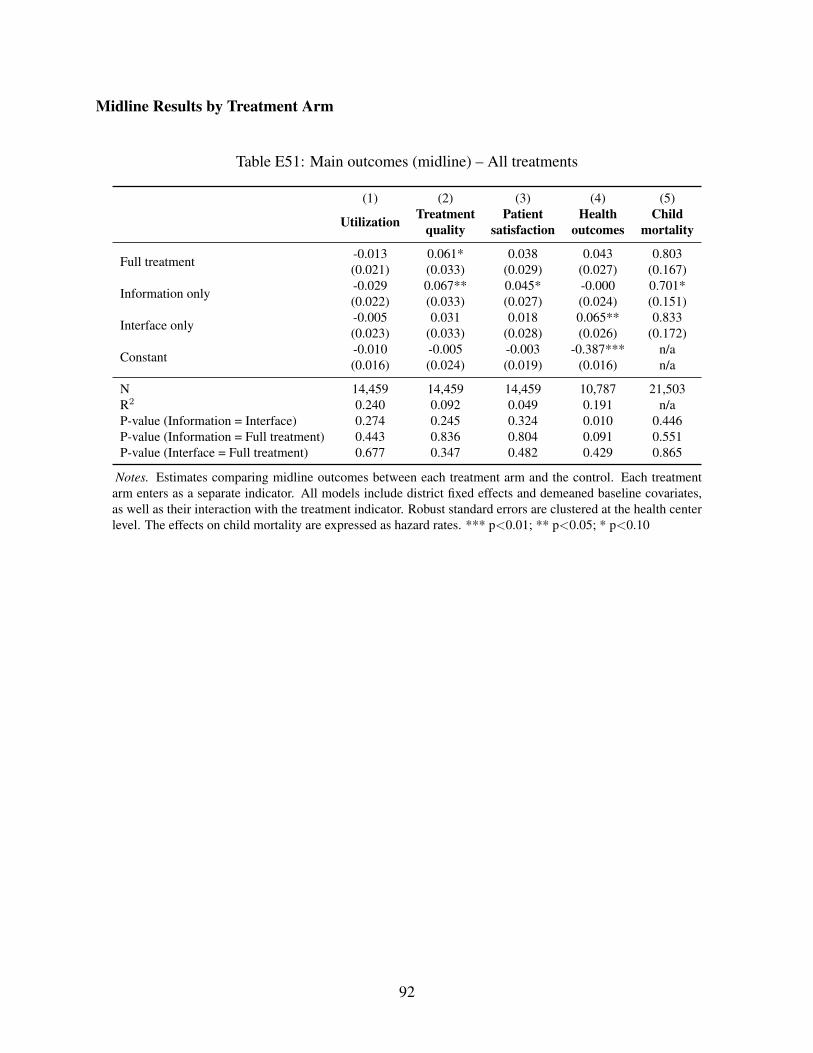
Midline Results by Treatment Arm
Table E51: Main outcomes (midline) – All treatments
(1) (2) (3) (4) (5)
Utilization Treatmentquality
Patientsatisfaction
Healthoutcomes
Childmortality
Full treatment -0.013 0.061* 0.038 0.043 0.803(0.021) (0.033) (0.029) (0.027) (0.167)
Information only -0.029 0.067** 0.045* -0.000 0.701*(0.022) (0.033) (0.027) (0.024) (0.151)
Interface only -0.005 0.031 0.018 0.065** 0.833(0.023) (0.033) (0.028) (0.026) (0.172)
Constant -0.010 -0.005 -0.003 -0.387*** n/a(0.016) (0.024) (0.019) (0.016) n/a
N 14,459 14,459 14,459 10,787 21,503R2 0.240 0.092 0.049 0.191 n/aP-value (Information = Interface) 0.274 0.245 0.324 0.010 0.446P-value (Information = Full treatment) 0.443 0.836 0.804 0.091 0.551P-value (Interface = Full treatment) 0.677 0.347 0.482 0.429 0.865
Notes. Estimates comparing midline outcomes between each treatment arm and the control. Each treatmentarm enters as a separate indicator. All models include district fixed effects and demeaned baseline covariates,as well as their interaction with the treatment indicator. Robust standard errors are clustered at the health centerlevel. The effects on child mortality are expressed as hazard rates. *** p<0.01; ** p<0.05; * p<0.10
92
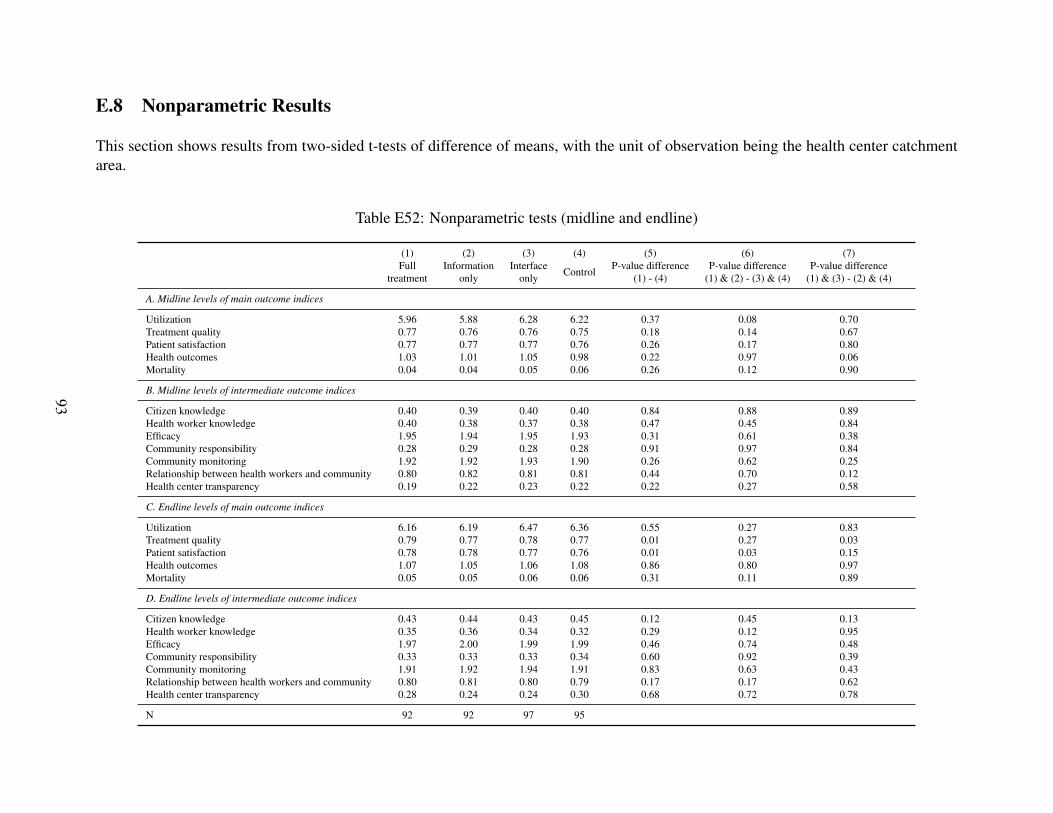
E.8 Nonparametric Results
This section shows results from two-sided t-tests of difference of means, with the unit of observation being the health center catchmentarea.
Table E52: Nonparametric tests (midline and endline)
(1) (2) (3) (4) (5) (6) (7)Full
treatmentInformation
onlyInterface
only Control P-value difference(1) - (4)
P-value difference(1) & (2) - (3) & (4)
P-value difference(1) & (3) - (2) & (4)
A. Midline levels of main outcome indices
Utilization 5.96 5.88 6.28 6.22 0.37 0.08 0.70Treatment quality 0.77 0.76 0.76 0.75 0.18 0.14 0.67Patient satisfaction 0.77 0.77 0.77 0.76 0.26 0.17 0.80Health outcomes 1.03 1.01 1.05 0.98 0.22 0.97 0.06Mortality 0.04 0.04 0.05 0.06 0.26 0.12 0.90
B. Midline levels of intermediate outcome indices
Citizen knowledge 0.40 0.39 0.40 0.40 0.84 0.88 0.89Health worker knowledge 0.40 0.38 0.37 0.38 0.47 0.45 0.84Efficacy 1.95 1.94 1.95 1.93 0.31 0.61 0.38Community responsibility 0.28 0.29 0.28 0.28 0.91 0.97 0.84Community monitoring 1.92 1.92 1.93 1.90 0.26 0.62 0.25Relationship between health workers and community 0.80 0.82 0.81 0.81 0.44 0.70 0.12Health center transparency 0.19 0.22 0.23 0.22 0.22 0.27 0.58
C. Endline levels of main outcome indices
Utilization 6.16 6.19 6.47 6.36 0.55 0.27 0.83Treatment quality 0.79 0.77 0.78 0.77 0.01 0.27 0.03Patient satisfaction 0.78 0.78 0.77 0.76 0.01 0.03 0.15Health outcomes 1.07 1.05 1.06 1.08 0.86 0.80 0.97Mortality 0.05 0.05 0.06 0.06 0.31 0.11 0.89
D. Endline levels of intermediate outcome indices
Citizen knowledge 0.43 0.44 0.43 0.45 0.12 0.45 0.13Health worker knowledge 0.35 0.36 0.34 0.32 0.29 0.12 0.95Efficacy 1.97 2.00 1.99 1.99 0.46 0.74 0.48Community responsibility 0.33 0.33 0.33 0.34 0.60 0.92 0.39Community monitoring 1.91 1.92 1.94 1.91 0.83 0.63 0.43Relationship between health workers and community 0.80 0.81 0.80 0.79 0.17 0.17 0.62Health center transparency 0.28 0.24 0.24 0.30 0.68 0.72 0.78
N 92 92 97 95
93
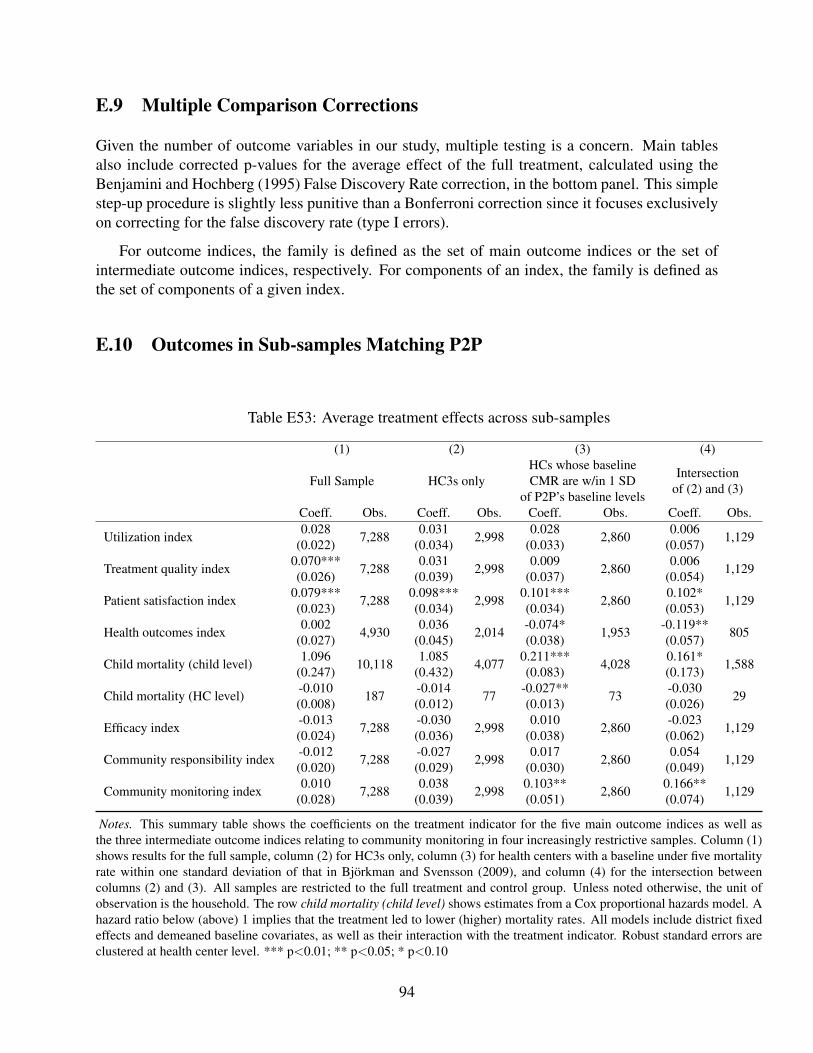
E.9 Multiple Comparison Corrections
Given the number of outcome variables in our study, multiple testing is a concern. Main tablesalso include corrected p-values for the average effect of the full treatment, calculated using theBenjamini and Hochberg (1995) False Discovery Rate correction, in the bottom panel. This simplestep-up procedure is slightly less punitive than a Bonferroni correction since it focuses exclusivelyon correcting for the false discovery rate (type I errors).
For outcome indices, the family is defined as the set of main outcome indices or the set ofintermediate outcome indices, respectively. For components of an index, the family is defined asthe set of components of a given index.
E.10 Outcomes in Sub-samples Matching P2P
Table E53: Average treatment effects across sub-samples
(1) (2) (3) (4)
Full Sample HC3s onlyHCs whose baselineCMR are w/in 1 SD
of P2P’s baseline levels
Intersectionof (2) and (3)
Coeff. Obs. Coeff. Obs. Coeff. Obs. Coeff. Obs.
Utilization index 0.028 7,288 0.031 2,998 0.028 2,860 0.006 1,129(0.022) (0.034) (0.033) (0.057)
Treatment quality index 0.070*** 7,288 0.031 2,998 0.009 2,860 0.006 1,129(0.026) (0.039) (0.037) (0.054)
Patient satisfaction index 0.079*** 7,288 0.098*** 2,998 0.101*** 2,860 0.102* 1,129(0.023) (0.034) (0.034) (0.053)
Health outcomes index 0.002 4,930 0.036 2,014 -0.074* 1,953 -0.119** 805(0.027) (0.045) (0.038) (0.057)
Child mortality (child level) 1.096 10,118 1.085 4,077 0.211*** 4,028 0.161* 1,588(0.247) (0.432) (0.083) (0.173)
Child mortality (HC level) -0.010 187 -0.014 77 -0.027** 73 -0.030 29(0.008) (0.012) (0.013) (0.026)
Efficacy index -0.013 7,288 -0.030 2,998 0.010 2,860 -0.023 1,129(0.024) (0.036) (0.038) (0.062)
Community responsibility index -0.012 7,288 -0.027 2,998 0.017 2,860 0.054 1,129(0.020) (0.029) (0.030) (0.049)
Community monitoring index 0.010 7,288 0.038 2,998 0.103** 2,860 0.166** 1,129(0.028) (0.039) (0.051) (0.074)
Notes. This summary table shows the coefficients on the treatment indicator for the five main outcome indices as well asthe three intermediate outcome indices relating to community monitoring in four increasingly restrictive samples. Column (1)shows results for the full sample, column (2) for HC3s only, column (3) for health centers with a baseline under five mortalityrate within one standard deviation of that in Bjorkman and Svensson (2009), and column (4) for the intersection betweencolumns (2) and (3). All samples are restricted to the full treatment and control group. Unless noted otherwise, the unit ofobservation is the household. The row child mortality (child level) shows estimates from a Cox proportional hazards model. Ahazard ratio below (above) 1 implies that the treatment led to lower (higher) mortality rates. All models include district fixedeffects and demeaned baseline covariates, as well as their interaction with the treatment indicator. Robust standard errors areclustered at health center level. *** p<0.01; ** p<0.05; * p<0.10
94
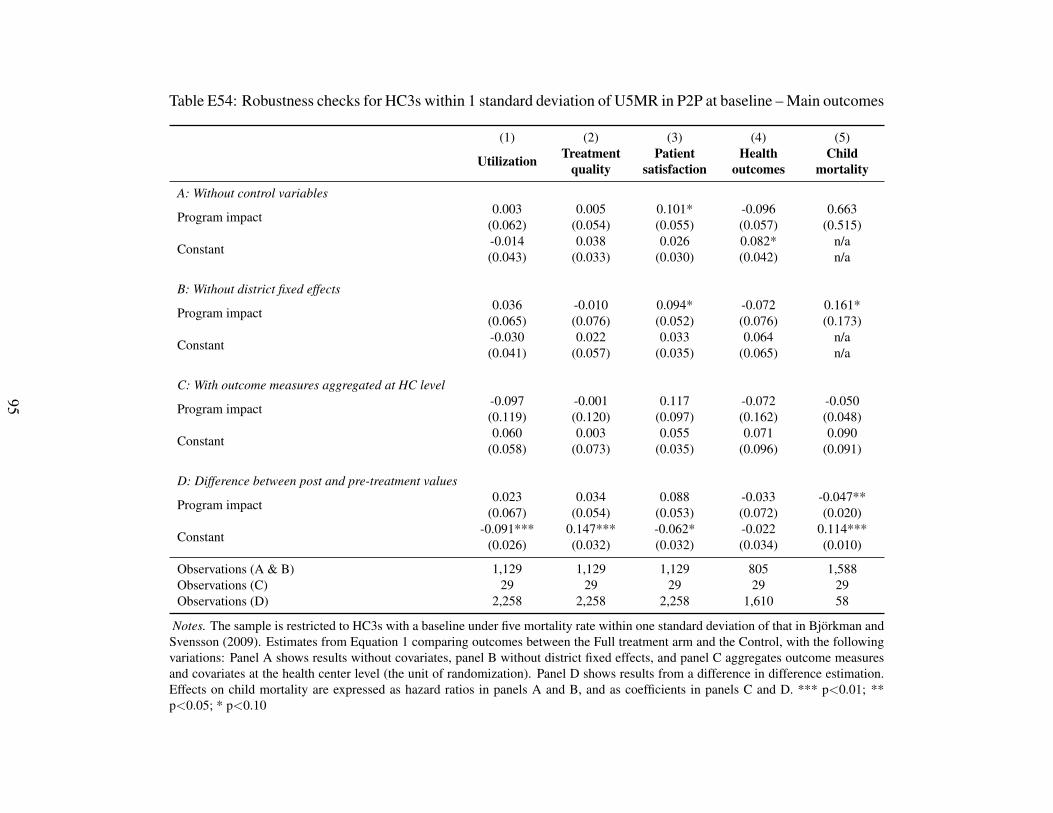
Table E54: Robustness checks for HC3s within 1 standard deviation of U5MR in P2P at baseline – Main outcomes
(1) (2) (3) (4) (5)
Utilization Treatmentquality
Patientsatisfaction
Healthoutcomes
Childmortality
A: Without control variables
Program impact 0.003 0.005 0.101* -0.096 0.663(0.062) (0.054) (0.055) (0.057) (0.515)
Constant -0.014 0.038 0.026 0.082* n/a(0.043) (0.033) (0.030) (0.042) n/a
B: Without district fixed effects
Program impact 0.036 -0.010 0.094* -0.072 0.161*(0.065) (0.076) (0.052) (0.076) (0.173)
Constant -0.030 0.022 0.033 0.064 n/a(0.041) (0.057) (0.035) (0.065) n/a
C: With outcome measures aggregated at HC level
Program impact -0.097 -0.001 0.117 -0.072 -0.050(0.119) (0.120) (0.097) (0.162) (0.048)
Constant 0.060 0.003 0.055 0.071 0.090(0.058) (0.073) (0.035) (0.096) (0.091)
D: Difference between post and pre-treatment values
Program impact 0.023 0.034 0.088 -0.033 -0.047**(0.067) (0.054) (0.053) (0.072) (0.020)
Constant -0.091*** 0.147*** -0.062* -0.022 0.114***(0.026) (0.032) (0.032) (0.034) (0.010)
Observations (A & B) 1,129 1,129 1,129 805 1,588Observations (C) 29 29 29 29 29Observations (D) 2,258 2,258 2,258 1,610 58
Notes. The sample is restricted to HC3s with a baseline under five mortality rate within one standard deviation of that in Bjorkman andSvensson (2009). Estimates from Equation 1 comparing outcomes between the Full treatment arm and the Control, with the followingvariations: Panel A shows results without covariates, panel B without district fixed effects, and panel C aggregates outcome measuresand covariates at the health center level (the unit of randomization). Panel D shows results from a difference in difference estimation.Effects on child mortality are expressed as hazard ratios in panels A and B, and as coefficients in panels C and D. *** p<0.01; **p<0.05; * p<0.10
95
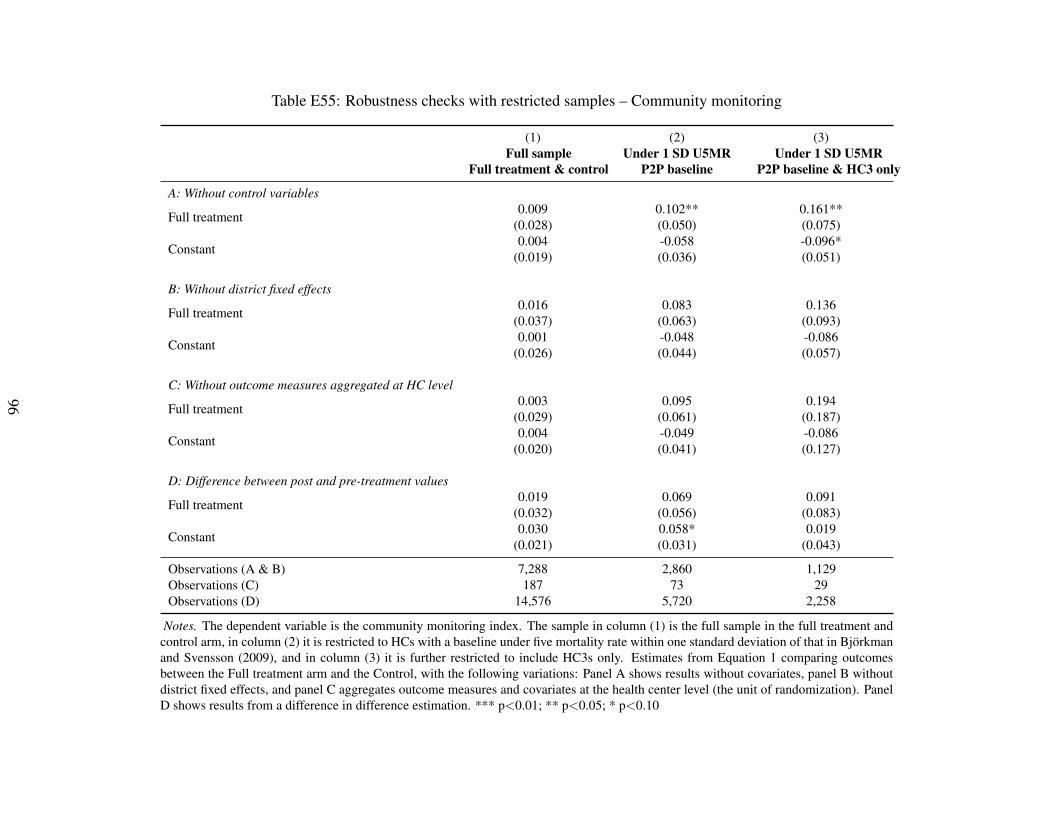
Table E55: Robustness checks with restricted samples – Community monitoring
(1) (2) (3)Full sample
Full treatment & controlUnder 1 SD U5MR
P2P baselineUnder 1 SD U5MR
P2P baseline & HC3 only
A: Without control variables
Full treatment 0.009 0.102** 0.161**(0.028) (0.050) (0.075)
Constant 0.004 -0.058 -0.096*(0.019) (0.036) (0.051)
B: Without district fixed effects
Full treatment 0.016 0.083 0.136(0.037) (0.063) (0.093)
Constant 0.001 -0.048 -0.086(0.026) (0.044) (0.057)
C: Without outcome measures aggregated at HC level
Full treatment 0.003 0.095 0.194(0.029) (0.061) (0.187)
Constant 0.004 -0.049 -0.086(0.020) (0.041) (0.127)
D: Difference between post and pre-treatment values
Full treatment 0.019 0.069 0.091(0.032) (0.056) (0.083)
Constant 0.030 0.058* 0.019(0.021) (0.031) (0.043)
Observations (A & B) 7,288 2,860 1,129Observations (C) 187 73 29Observations (D) 14,576 5,720 2,258
Notes. The dependent variable is the community monitoring index. The sample in column (1) is the full sample in the full treatment andcontrol arm, in column (2) it is restricted to HCs with a baseline under five mortality rate within one standard deviation of that in Bjorkmanand Svensson (2009), and in column (3) it is further restricted to include HC3s only. Estimates from Equation 1 comparing outcomesbetween the Full treatment arm and the Control, with the following variations: Panel A shows results without covariates, panel B withoutdistrict fixed effects, and panel C aggregates outcome measures and covariates at the health center level (the unit of randomization). PanelD shows results from a difference in difference estimation. *** p<0.01; ** p<0.05; * p<0.10
96
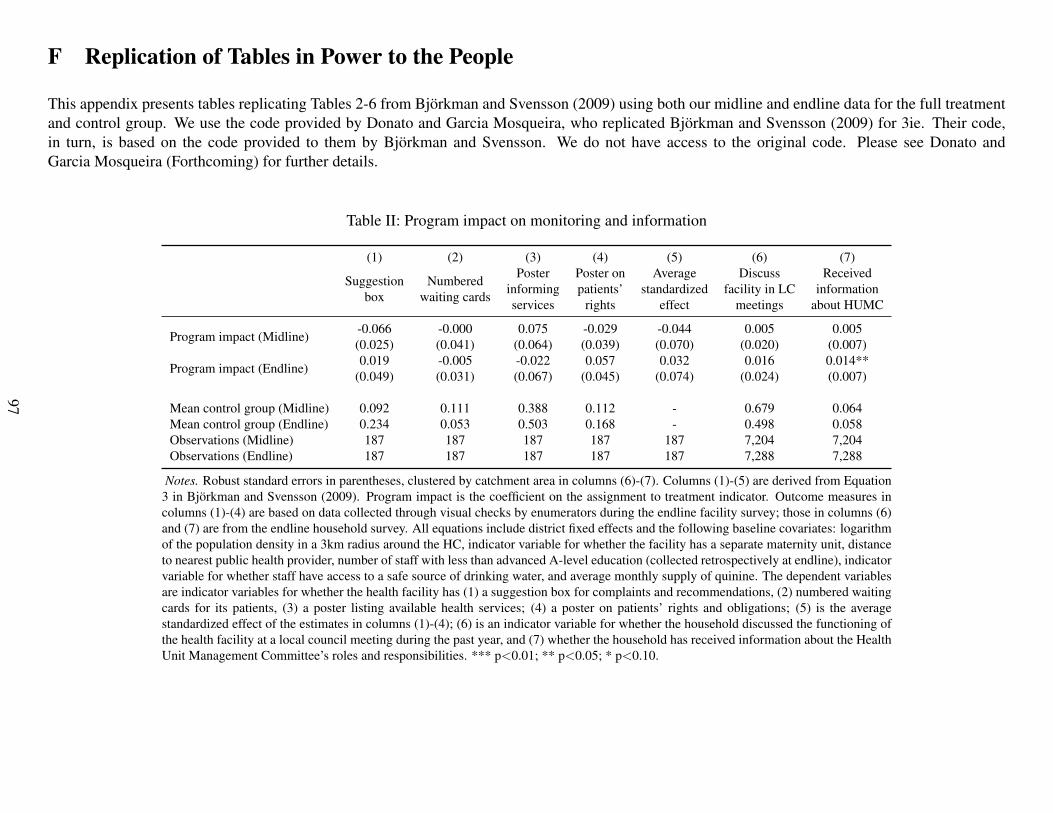
F Replication of Tables in Power to the People
This appendix presents tables replicating Tables 2-6 from Bjorkman and Svensson (2009) using both our midline and endline data for the full treatmentand control group. We use the code provided by Donato and Garcia Mosqueira, who replicated Bjorkman and Svensson (2009) for 3ie. Their code,in turn, is based on the code provided to them by Bjorkman and Svensson. We do not have access to the original code. Please see Donato andGarcia Mosqueira (Forthcoming) for further details.
Table II: Program impact on monitoring and information
(1) (2) (3) (4) (5) (6) (7)
Suggestionbox
Numberedwaiting cards
Posterinformingservices
Poster onpatients’
rights
Averagestandardized
effect
Discussfacility in LC
meetings
Receivedinformation
about HUMC
Program impact (Midline) -0.066 -0.000 0.075 -0.029 -0.044 0.005 0.005(0.025) (0.041) (0.064) (0.039) (0.070) (0.020) (0.007)
Program impact (Endline) 0.019 -0.005 -0.022 0.057 0.032 0.016 0.014**(0.049) (0.031) (0.067) (0.045) (0.074) (0.024) (0.007)
Mean control group (Midline) 0.092 0.111 0.388 0.112 - 0.679 0.064Mean control group (Endline) 0.234 0.053 0.503 0.168 - 0.498 0.058Observations (Midline) 187 187 187 187 187 7,204 7,204Observations (Endline) 187 187 187 187 187 7,288 7,288
Notes. Robust standard errors in parentheses, clustered by catchment area in columns (6)-(7). Columns (1)-(5) are derived from Equation3 in Bjorkman and Svensson (2009). Program impact is the coefficient on the assignment to treatment indicator. Outcome measures incolumns (1)-(4) are based on data collected through visual checks by enumerators during the endline facility survey; those in columns (6)and (7) are from the endline household survey. All equations include district fixed effects and the following baseline covariates: logarithmof the population density in a 3km radius around the HC, indicator variable for whether the facility has a separate maternity unit, distanceto nearest public health provider, number of staff with less than advanced A-level education (collected retrospectively at endline), indicatorvariable for whether staff have access to a safe source of drinking water, and average monthly supply of quinine. The dependent variablesare indicator variables for whether the health facility has (1) a suggestion box for complaints and recommendations, (2) numbered waitingcards for its patients, (3) a poster listing available health services; (4) a poster on patients’ rights and obligations; (5) is the averagestandardized effect of the estimates in columns (1)-(4); (6) is an indicator variable for whether the household discussed the functioning ofthe health facility at a local council meeting during the past year, and (7) whether the household has received information about the HealthUnit Management Committee’s roles and responsibilities. *** p<0.01; ** p<0.05; * p<0.10.
97
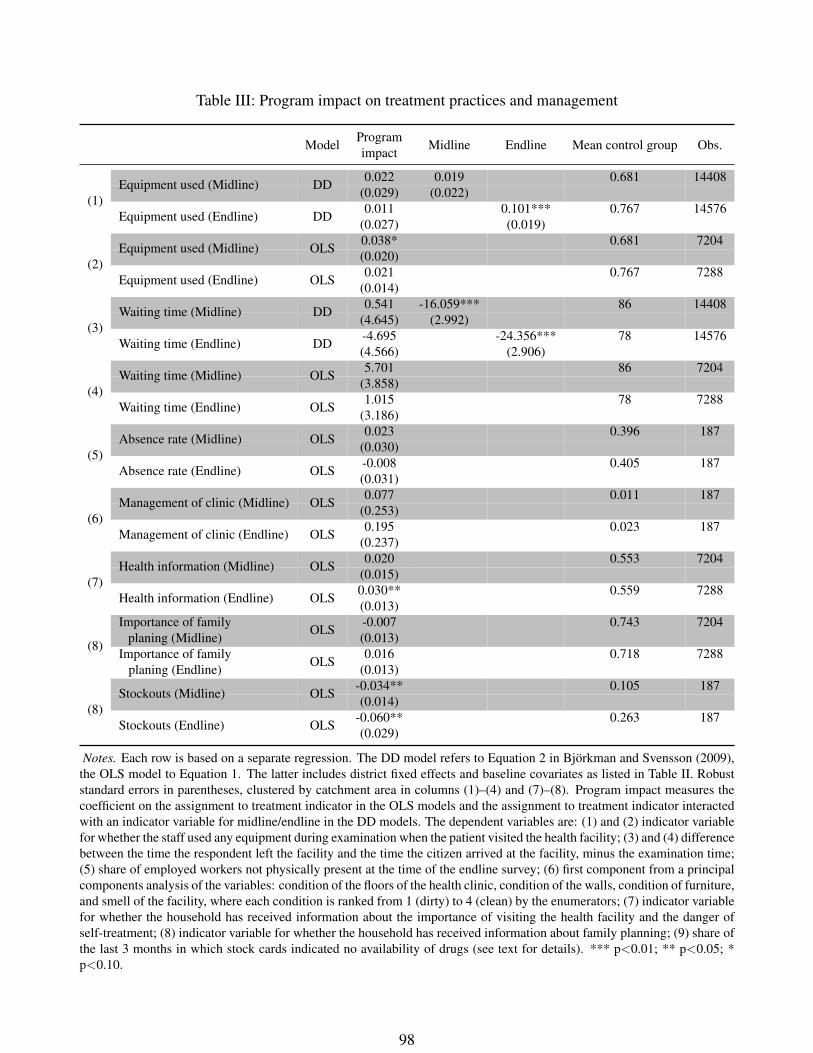
Table III: Program impact on treatment practices and management
Model Programimpact Midline Endline Mean control group Obs.
(1)
0.022 0.019 0.681 14408Equipment used (Midline) DD (0.029) (0.022)
Equipment used (Endline) DD 0.011 0.101*** 0.767 14576(0.027) (0.019)
(2)
0.038* 0.681 7204Equipment used (Midline) OLS (0.020)
Equipment used (Endline) OLS 0.021 0.767 7288(0.014)
(3)
0.541 -16.059*** 86 14408Waiting time (Midline) DD (4.645) (2.992)
Waiting time (Endline) DD -4.695 -24.356*** 78 14576(4.566) (2.906)
(4)
5.701 86 7204Waiting time (Midline) OLS (3.858)
Waiting time (Endline) OLS 1.015 78 7288(3.186)
(5)
0.023 0.396 187Absence rate (Midline) OLS (0.030)
Absence rate (Endline) OLS -0.008 0.405 187(0.031)
(6)
0.077 0.011 187Management of clinic (Midline) OLS (0.253)
Management of clinic (Endline) OLS 0.195 0.023 187(0.237)
(7)
0.020 0.553 7204Health information (Midline) OLS (0.015)
Health information (Endline) OLS 0.030** 0.559 7288(0.013)
(8)
-0.007 0.743 7204Importance of familyplaning (Midline) OLS (0.013)
Importance of familyplaning (Endline) OLS 0.016 0.718 7288
(0.013)
(8)
-0.034** 0.105 187Stockouts (Midline) OLS (0.014)
Stockouts (Endline) OLS -0.060** 0.263 187(0.029)
Notes. Each row is based on a separate regression. The DD model refers to Equation 2 in Bjorkman and Svensson (2009),the OLS model to Equation 1. The latter includes district fixed effects and baseline covariates as listed in Table II. Robuststandard errors in parentheses, clustered by catchment area in columns (1)–(4) and (7)–(8). Program impact measures thecoefficient on the assignment to treatment indicator in the OLS models and the assignment to treatment indicator interactedwith an indicator variable for midline/endline in the DD models. The dependent variables are: (1) and (2) indicator variablefor whether the staff used any equipment during examination when the patient visited the health facility; (3) and (4) differencebetween the time the respondent left the facility and the time the citizen arrived at the facility, minus the examination time;(5) share of employed workers not physically present at the time of the endline survey; (6) first component from a principalcomponents analysis of the variables: condition of the floors of the health clinic, condition of the walls, condition of furniture,and smell of the facility, where each condition is ranked from 1 (dirty) to 4 (clean) by the enumerators; (7) indicator variablefor whether the household has received information about the importance of visiting the health facility and the danger ofself-treatment; (8) indicator variable for whether the household has received information about family planning; (9) share ofthe last 3 months in which stock cards indicated no availability of drugs (see text for details). *** p<0.01; ** p<0.05; *p<0.10.
98
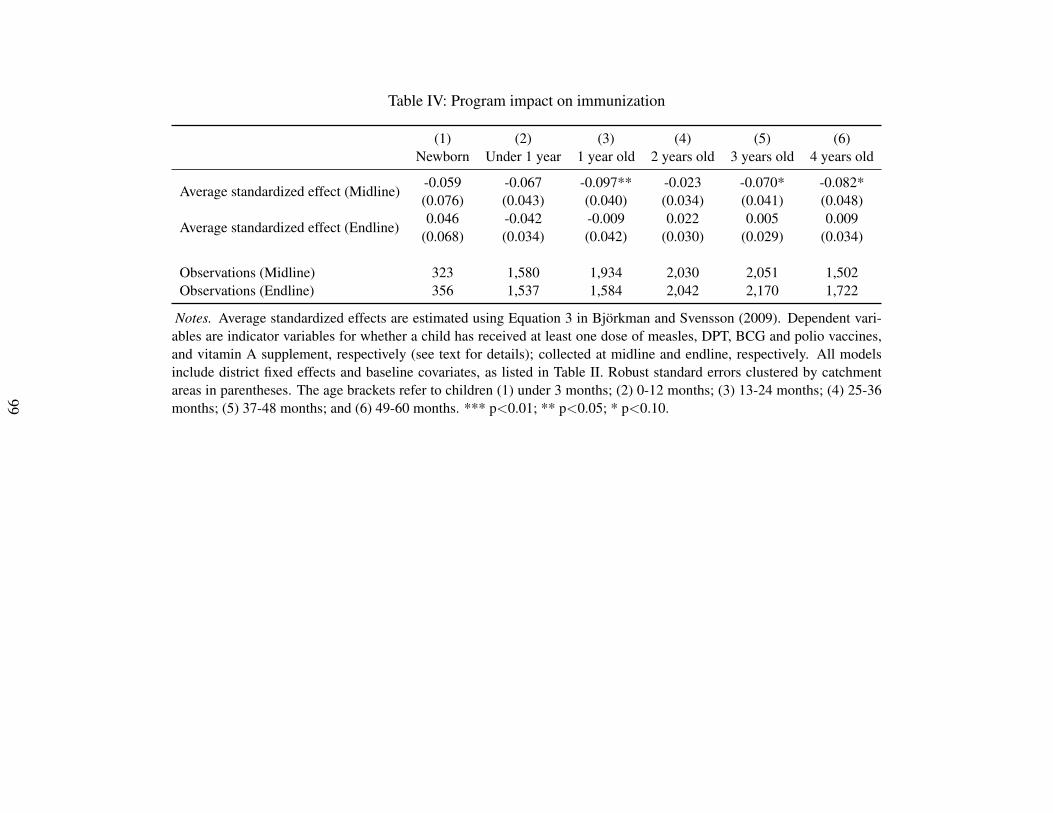
Table IV: Program impact on immunization
(1) (2) (3) (4) (5) (6)Newborn Under 1 year 1 year old 2 years old 3 years old 4 years old
Average standardized effect (Midline) -0.059 -0.067 -0.097** -0.023 -0.070* -0.082*(0.076) (0.043) (0.040) (0.034) (0.041) (0.048)
Average standardized effect (Endline) 0.046 -0.042 -0.009 0.022 0.005 0.009(0.068) (0.034) (0.042) (0.030) (0.029) (0.034)
Observations (Midline) 323 1,580 1,934 2,030 2,051 1,502Observations (Endline) 356 1,537 1,584 2,042 2,170 1,722
Notes. Average standardized effects are estimated using Equation 3 in Bjorkman and Svensson (2009). Dependent vari-ables are indicator variables for whether a child has received at least one dose of measles, DPT, BCG and polio vaccines,and vitamin A supplement, respectively (see text for details); collected at midline and endline, respectively. All modelsinclude district fixed effects and baseline covariates, as listed in Table II. Robust standard errors clustered by catchmentareas in parentheses. The age brackets refer to children (1) under 3 months; (2) 0-12 months; (3) 13-24 months; (4) 25-36months; (5) 37-48 months; and (6) 49-60 months. *** p<0.01; ** p<0.05; * p<0.10.
99
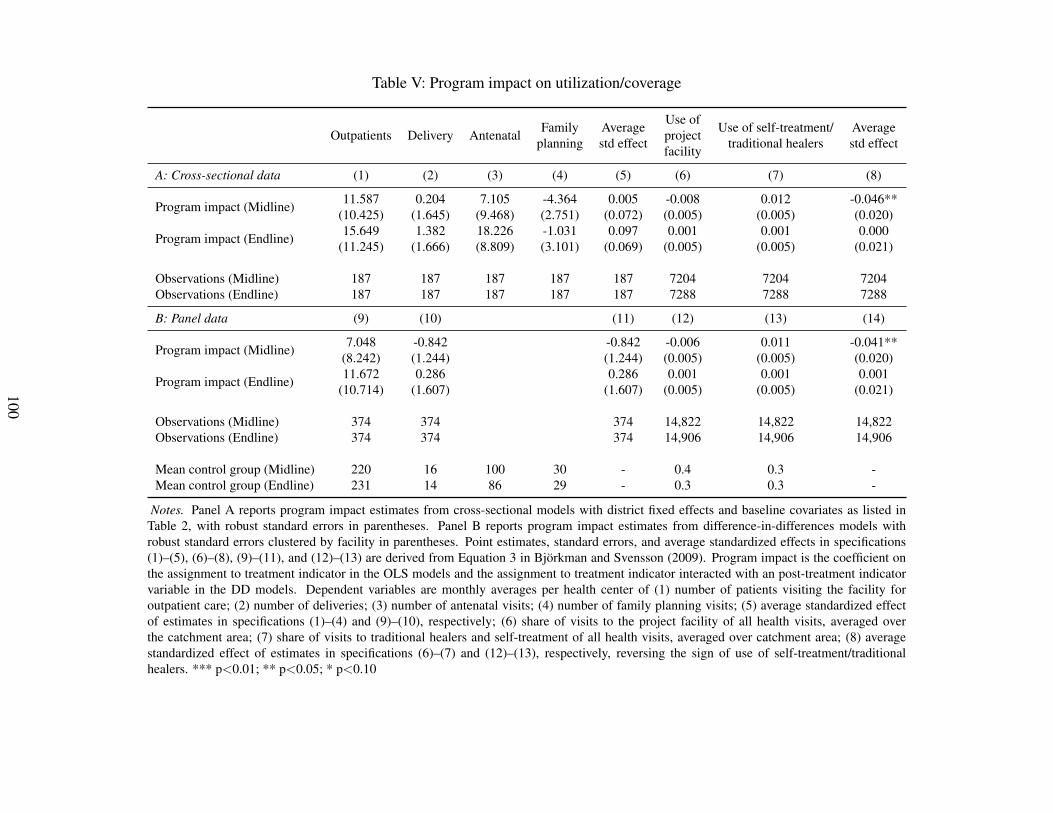
Table V: Program impact on utilization/coverage
Outpatients Delivery Antenatal Familyplanning
Averagestd effect
Use ofprojectfacility
Use of self-treatment/traditional healers
Averagestd effect
A: Cross-sectional data (1) (2) (3) (4) (5) (6) (7) (8)
Program impact (Midline) 11.587 0.204 7.105 -4.364 0.005 -0.008 0.012 -0.046**(10.425) (1.645) (9.468) (2.751) (0.072) (0.005) (0.005) (0.020)
Program impact (Endline) 15.649 1.382 18.226 -1.031 0.097 0.001 0.001 0.000(11.245) (1.666) (8.809) (3.101) (0.069) (0.005) (0.005) (0.021)
Observations (Midline) 187 187 187 187 187 7204 7204 7204Observations (Endline) 187 187 187 187 187 7288 7288 7288
B: Panel data (9) (10) (11) (12) (13) (14)
Program impact (Midline) 7.048 -0.842 -0.842 -0.006 0.011 -0.041**(8.242) (1.244) (1.244) (0.005) (0.005) (0.020)
Program impact (Endline) 11.672 0.286 0.286 0.001 0.001 0.001(10.714) (1.607) (1.607) (0.005) (0.005) (0.021)
Observations (Midline) 374 374 374 14,822 14,822 14,822Observations (Endline) 374 374 374 14,906 14,906 14,906
Mean control group (Midline) 220 16 100 30 - 0.4 0.3 -Mean control group (Endline) 231 14 86 29 - 0.3 0.3 -
Notes. Panel A reports program impact estimates from cross-sectional models with district fixed effects and baseline covariates as listed inTable 2, with robust standard errors in parentheses. Panel B reports program impact estimates from difference-in-differences models withrobust standard errors clustered by facility in parentheses. Point estimates, standard errors, and average standardized effects in specifications(1)–(5), (6)–(8), (9)–(11), and (12)–(13) are derived from Equation 3 in Bjorkman and Svensson (2009). Program impact is the coefficient onthe assignment to treatment indicator in the OLS models and the assignment to treatment indicator interacted with an post-treatment indicatorvariable in the DD models. Dependent variables are monthly averages per health center of (1) number of patients visiting the facility foroutpatient care; (2) number of deliveries; (3) number of antenatal visits; (4) number of family planning visits; (5) average standardized effectof estimates in specifications (1)–(4) and (9)–(10), respectively; (6) share of visits to the project facility of all health visits, averaged overthe catchment area; (7) share of visits to traditional healers and self-treatment of all health visits, averaged over catchment area; (8) averagestandardized effect of estimates in specifications (6)–(7) and (12)–(13), respectively, reversing the sign of use of self-treatment/traditionalhealers. *** p<0.01; ** p<0.05; * p<0.10
100
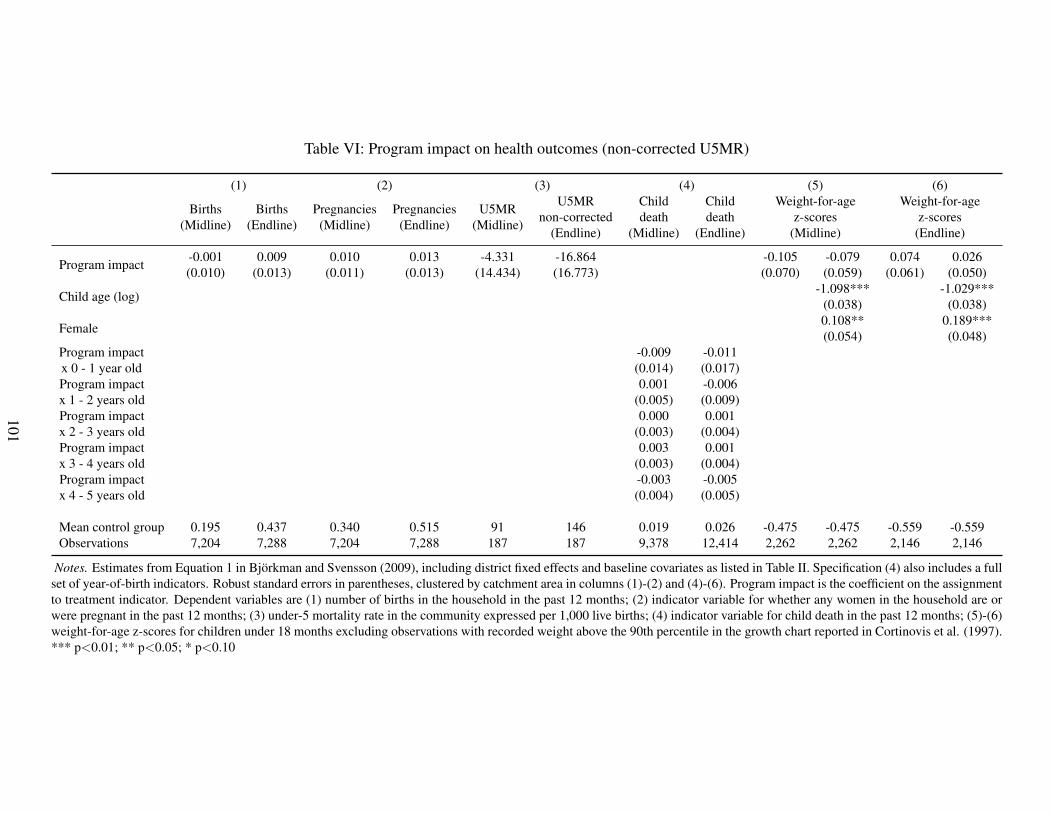
Table VI: Program impact on health outcomes (non-corrected U5MR)
(1) (2) (3) (4) (5) (6)
Births(Midline)
Births(Endline)
Pregnancies(Midline)
Pregnancies(Endline)
U5MR(Midline)
U5MRnon-corrected
(Endline)
Childdeath
(Midline)
Childdeath
(Endline)
Weight-for-agez-scores
(Midline)
Weight-for-agez-scores
(Endline)
Program impact -0.001 0.009 0.010 0.013 -4.331 -16.864 -0.105 -0.079 0.074 0.026(0.010) (0.013) (0.011) (0.013) (14.434) (16.773) (0.070) (0.059) (0.061) (0.050)
Child age (log) -1.098*** -1.029***(0.038) (0.038)
Female 0.108** 0.189***(0.054) (0.048)
Program impactx 0 - 1 year old
-0.009 -0.011(0.014) (0.017)
Program impactx 1 - 2 years old
0.001 -0.006(0.005) (0.009)
Program impactx 2 - 3 years old
0.000 0.001(0.003) (0.004)
Program impactx 3 - 4 years old
0.003 0.001(0.003) (0.004)
Program impactx 4 - 5 years old
-0.003 -0.005(0.004) (0.005)
Mean control group 0.195 0.437 0.340 0.515 91 146 0.019 0.026 -0.475 -0.475 -0.559 -0.559Observations 7,204 7,288 7,204 7,288 187 187 9,378 12,414 2,262 2,262 2,146 2,146
Notes. Estimates from Equation 1 in Bjorkman and Svensson (2009), including district fixed effects and baseline covariates as listed in Table II. Specification (4) also includes a fullset of year-of-birth indicators. Robust standard errors in parentheses, clustered by catchment area in columns (1)-(2) and (4)-(6). Program impact is the coefficient on the assignmentto treatment indicator. Dependent variables are (1) number of births in the household in the past 12 months; (2) indicator variable for whether any women in the household are orwere pregnant in the past 12 months; (3) under-5 mortality rate in the community expressed per 1,000 live births; (4) indicator variable for child death in the past 12 months; (5)-(6)weight-for-age z-scores for children under 18 months excluding observations with recorded weight above the 90th percentile in the growth chart reported in Cortinovis et al. (1997).*** p<0.01; ** p<0.05; * p<0.10
101
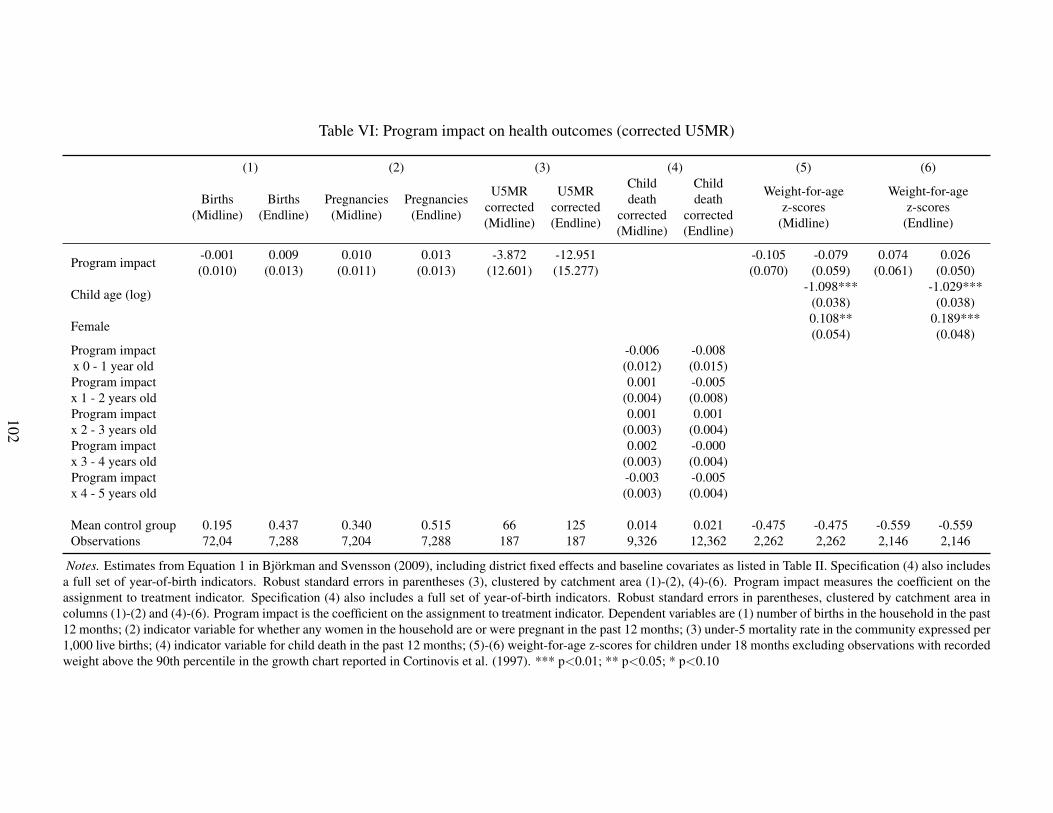
Table VI: Program impact on health outcomes (corrected U5MR)
(1) (2) (3) (4) (5) (6)
Births(Midline)
Births(Endline)
Pregnancies(Midline)
Pregnancies(Endline)
U5MRcorrected(Midline)
U5MRcorrected(Endline)
Childdeath
corrected(Midline)
Childdeath
corrected(Endline)
Weight-for-agez-scores
(Midline)
Weight-for-agez-scores
(Endline)
Program impact -0.001 0.009 0.010 0.013 -3.872 -12.951 -0.105 -0.079 0.074 0.026(0.010) (0.013) (0.011) (0.013) (12.601) (15.277) (0.070) (0.059) (0.061) (0.050)
Child age (log) -1.098*** -1.029***(0.038) (0.038)
Female 0.108** 0.189***(0.054) (0.048)
Program impactx 0 - 1 year old
-0.006 -0.008(0.012) (0.015)
Program impactx 1 - 2 years old
0.001 -0.005(0.004) (0.008)
Program impactx 2 - 3 years old
0.001 0.001(0.003) (0.004)
Program impactx 3 - 4 years old
0.002 -0.000(0.003) (0.004)
Program impactx 4 - 5 years old
-0.003 -0.005(0.003) (0.004)
Mean control group 0.195 0.437 0.340 0.515 66 125 0.014 0.021 -0.475 -0.475 -0.559 -0.559Observations 72,04 7,288 7,204 7,288 187 187 9,326 12,362 2,262 2,262 2,146 2,146
Notes. Estimates from Equation 1 in Bjorkman and Svensson (2009), including district fixed effects and baseline covariates as listed in Table II. Specification (4) also includesa full set of year-of-birth indicators. Robust standard errors in parentheses (3), clustered by catchment area (1)-(2), (4)-(6). Program impact measures the coefficient on theassignment to treatment indicator. Specification (4) also includes a full set of year-of-birth indicators. Robust standard errors in parentheses, clustered by catchment area incolumns (1)-(2) and (4)-(6). Program impact is the coefficient on the assignment to treatment indicator. Dependent variables are (1) number of births in the household in the past12 months; (2) indicator variable for whether any women in the household are or were pregnant in the past 12 months; (3) under-5 mortality rate in the community expressed per1,000 live births; (4) indicator variable for child death in the past 12 months; (5)-(6) weight-for-age z-scores for children under 18 months excluding observations with recordedweight above the 90th percentile in the growth chart reported in Cortinovis et al. (1997). *** p<0.01; ** p<0.05; * p<0.10
102
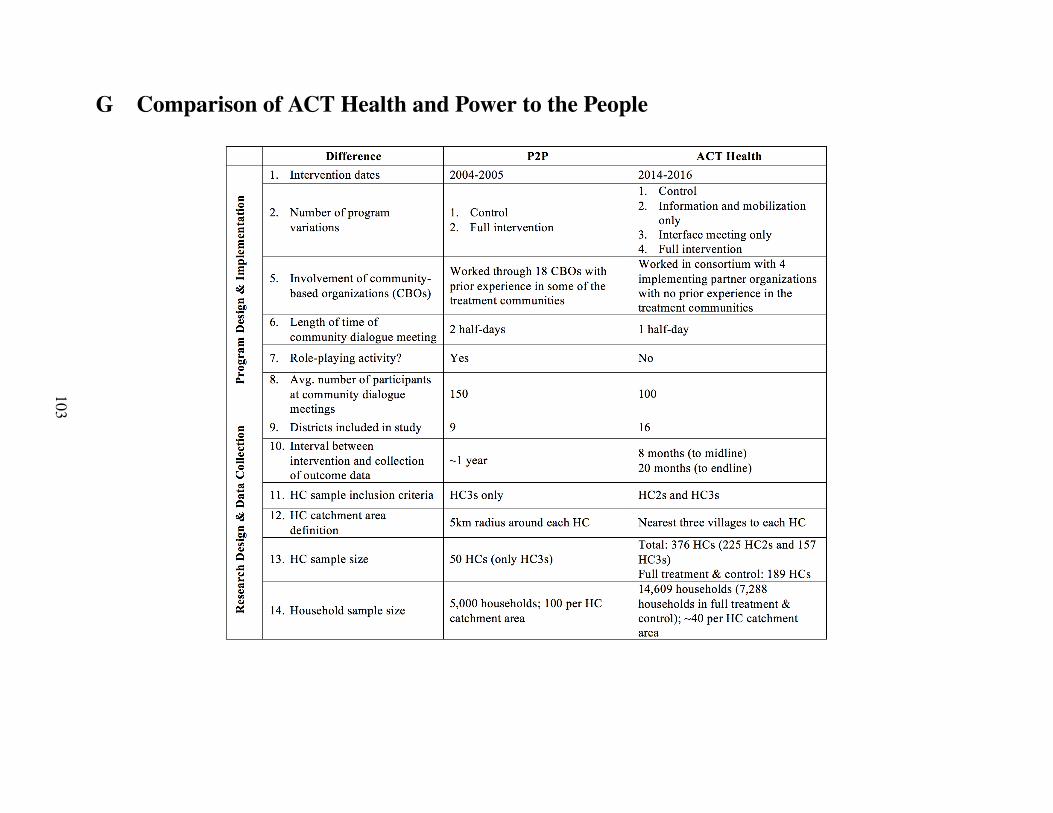
G Comparison of ACT Health and Power to the People
103
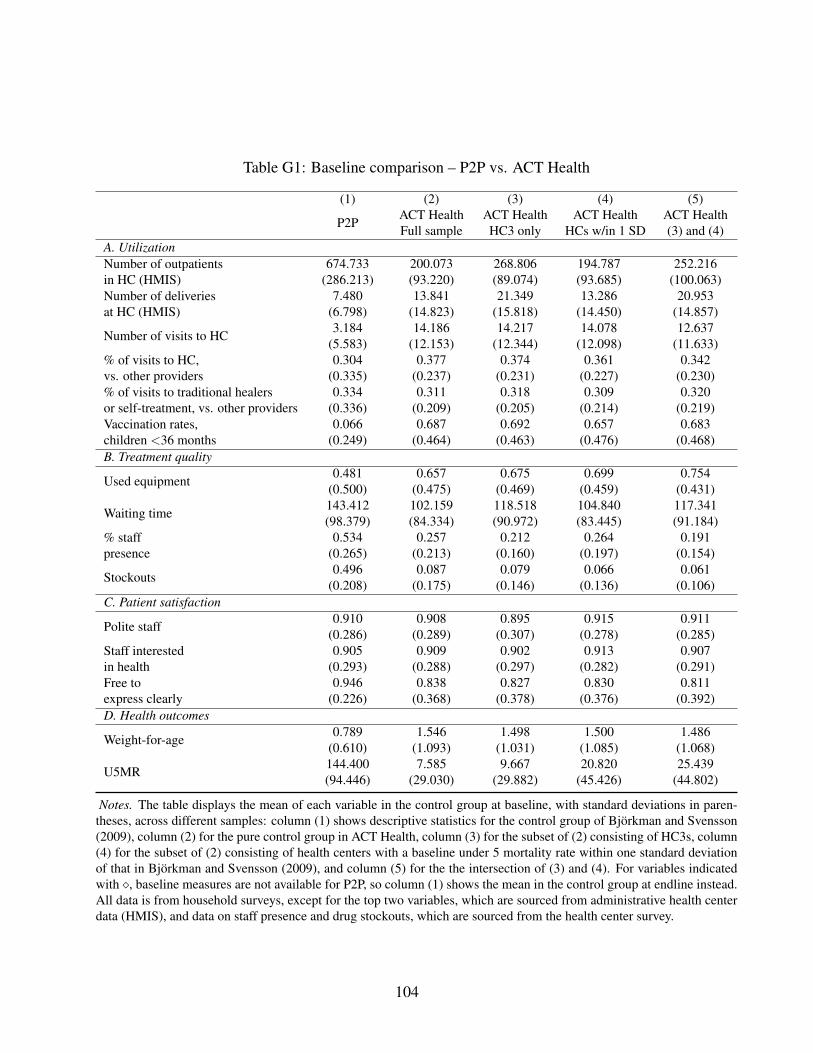
Table G1: Baseline comparison – P2P vs. ACT Health
(1) (2) (3) (4) (5)
P2P ACT HealthFull sample
ACT HealthHC3 only
ACT HealthHCs w/in 1 SD
ACT Health(3) and (4)
A. UtilizationNumber of outpatientsin HC (HMIS)
674.733 200.073 268.806 194.787 252.216(286.213) (93.220) (89.074) (93.685) (100.063)
Number of deliveriesat HC (HMIS)
7.480 13.841 21.349 13.286 20.953(6.798) (14.823) (15.818) (14.450) (14.857)
Number of visits to HC 3.184 14.186 14.217 14.078 12.637(5.583) (12.153) (12.344) (12.098) (11.633)
% of visits to HC,vs. other providers
0.304 0.377 0.374 0.361 0.342(0.335) (0.237) (0.231) (0.227) (0.230)
% of visits to traditional healersor self-treatment, vs. other providers
0.334 0.311 0.318 0.309 0.320(0.336) (0.209) (0.205) (0.214) (0.219)
Vaccination rates,children <36 months
0.066 0.687 0.692 0.657 0.683(0.249) (0.464) (0.463) (0.476) (0.468)
B. Treatment quality
Used equipment 0.481 0.657 0.675 0.699 0.754(0.500) (0.475) (0.469) (0.459) (0.431)
Waiting time 143.412 102.159 118.518 104.840 117.341(98.379) (84.334) (90.972) (83.445) (91.184)
% staffpresence
0.534 0.257 0.212 0.264 0.191(0.265) (0.213) (0.160) (0.197) (0.154)
Stockouts 0.496 0.087 0.079 0.066 0.061(0.208) (0.175) (0.146) (0.136) (0.106)
C. Patient satisfaction
Polite staff 0.910 0.908 0.895 0.915 0.911(0.286) (0.289) (0.307) (0.278) (0.285)
Staff interestedin health
0.905 0.909 0.902 0.913 0.907(0.293) (0.288) (0.297) (0.282) (0.291)
Free toexpress clearly
0.946 0.838 0.827 0.830 0.811(0.226) (0.368) (0.378) (0.376) (0.392)
D. Health outcomes
Weight-for-age 0.789 1.546 1.498 1.500 1.486(0.610) (1.093) (1.031) (1.085) (1.068)
U5MR 144.400 7.585 9.667 20.820 25.439(94.446) (29.030) (29.882) (45.426) (44.802)
Notes. The table displays the mean of each variable in the control group at baseline, with standard deviations in paren-theses, across different samples: column (1) shows descriptive statistics for the control group of Bjorkman and Svensson(2009), column (2) for the pure control group in ACT Health, column (3) for the subset of (2) consisting of HC3s, column(4) for the subset of (2) consisting of health centers with a baseline under 5 mortality rate within one standard deviationof that in Bjorkman and Svensson (2009), and column (5) for the the intersection of (3) and (4). For variables indicatedwith ⇧, baseline measures are not available for P2P, so column (1) shows the mean in the control group at endline instead.All data is from household surveys, except for the top two variables, which are sourced from administrative health centerdata (HMIS), and data on staff presence and drug stockouts, which are sourced from the health center survey.
104
H Implementation of ACT Health
H.1 Implementing Organizations
The Irish NGO, GOAL, launched the ACT Health program in 2014 with funding from DFID. Theprogram was implemented by three Ugandan regional partners across 15 districts and by GOALUganda in one district. All three regional partners had prior experience working on communitymobilization and/or public health, and already had a strong footprint in the region, if not the dis-tricts, they implemented ACT Health in. In particular, the Coalition for Health Promotion andSocial Development (HEPS), which was founded in 2000, focused on access to health care andessential medicines, maternal health rights, community-based empowerment work, and health ad-vocacy prior to becoming involved in the implementation of ACT Health. The Multi-CommunityBased Development Initiative (MUCOBADI) was started by HIV positive teachers in 2000 and fo-cused on HIV prevention, access to primary health care, community mobilization, and livelihooddevelopment. Finally, the Kabarole Research and Resource Centre (KRC), which was foundedin 1996, focused on leadership mobilization, good governance, and research and advocacy. Twoof the three regional partners, HEPS and MUCOBADI, were actively involved in the design andimplementation of a pilot of the ACT Health program in Bugiri district. Organizational leadershipaside, implementing staff for the intervention were specifically recruited for the program and hadto have prior experience in community mobilization and/or public health. All implementing staffunderwent extensive training and were continuously monitored and supervised by GOAL Uganda.
H.2 Implementation Monitoring
GOAL ensured fidelity to both the intervention and the randomized impact evaluation protocolthrough several quality control measures.
- Detailed procedure manuals for each of the three variations of the program (the full program,the information and mobilization program—called separate dialogues by GOAL—and theinterface-only program). These manuals were used for training and as a reference to ensurethat all partners had clear and precise instructions regarding every detail of the intervention.These manuals were used for training and as a reference so that all implementing partnershad clear and precise instructions of every detail of the interventions.
- Extensive monitoring data captured in an online monitoring database, which tracked thedates and numbers of people participating in each dialogue. The database also includes theactions agreed upon in the action plans and social contracts developed during the dialogues,and tracked their progress at each follow-up meeting. The reports include data on the datesand number of people participating for each program activity, including HC and communitymeetings, interface meetings, and each of the follow-up meetings. They also record all theactions agreed to in the action plans and social contracts and track their progress at thefollow-up meetings.
- Direct observation by GOAL’s monitoring team. To assure quality across the life of the in-tervention, GOAL had “mentor” managers and monitoring, evaluation, and learning (MEL)
105

officers embedded within the teams of each partner organization to provide direct supportand programmatic guidance, as needed. Mentor manager and MEL officers observed a por-tion of each partner’s dialogues and follow-ups for quality assurance purposes. In particular,97% of health centers were monitored at least once by either a mentor manager or MELofficer (see Section E of Table H1 for more details). During these direct observations, of-ficers recorded information about facilitator behavior, the presentation of the citizen reportcards, the nature of participation during the meeting, and whether the action plans and socialcontracts met certain quality criteria. The feedback tool for these observations is reproducedbelow.
- Issues tracking. GOAL tracked issues as they came up during implementation. They gavefield teams a detailed protocol of issues to watch out for and flag. Issues were shared withthe evaluation team and solutions were jointly decided to resolve the issues.
106
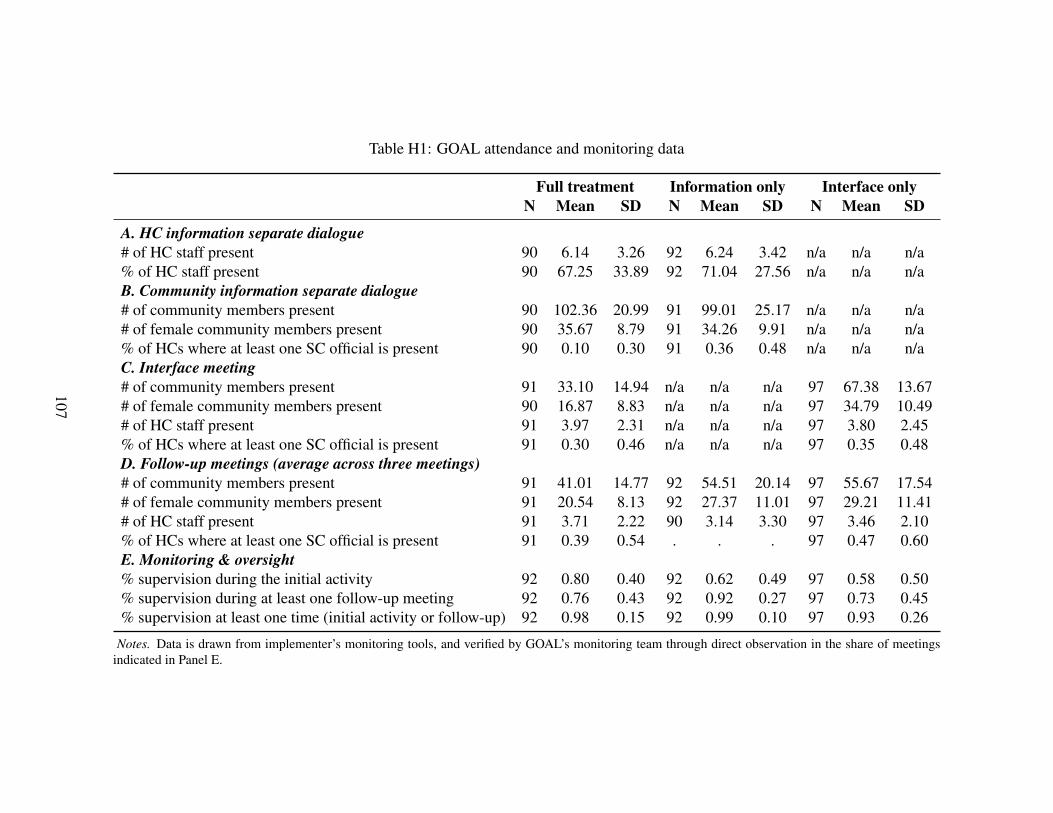
Table H1: GOAL attendance and monitoring data
Full treatment Information only Interface onlyN Mean SD N Mean SD N Mean SD
A. HC information separate dialogue# of HC staff present 90 6.14 3.26 92 6.24 3.42 n/a n/a n/a% of HC staff present 90 67.25 33.89 92 71.04 27.56 n/a n/a n/aB. Community information separate dialogue# of community members present 90 102.36 20.99 91 99.01 25.17 n/a n/a n/a# of female community members present 90 35.67 8.79 91 34.26 9.91 n/a n/a n/a% of HCs where at least one SC official is present 90 0.10 0.30 91 0.36 0.48 n/a n/a n/aC. Interface meeting# of community members present 91 33.10 14.94 n/a n/a n/a 97 67.38 13.67# of female community members present 90 16.87 8.83 n/a n/a n/a 97 34.79 10.49# of HC staff present 91 3.97 2.31 n/a n/a n/a 97 3.80 2.45% of HCs where at least one SC official is present 91 0.30 0.46 n/a n/a n/a 97 0.35 0.48D. Follow-up meetings (average across three meetings)# of community members present 91 41.01 14.77 92 54.51 20.14 97 55.67 17.54# of female community members present 91 20.54 8.13 92 27.37 11.01 97 29.21 11.41# of HC staff present 91 3.71 2.22 90 3.14 3.30 97 3.46 2.10% of HCs where at least one SC official is present 91 0.39 0.54 . . . 97 0.47 0.60E. Monitoring & oversight% supervision during the initial activity 92 0.80 0.40 92 0.62 0.49 97 0.58 0.50% supervision during at least one follow-up meeting 92 0.76 0.43 92 0.92 0.27 97 0.73 0.45% supervision at least one time (initial activity or follow-up) 92 0.98 0.15 92 0.99 0.10 97 0.93 0.26
Notes. Data is drawn from implementer’s monitoring tools, and verified by GOAL’s monitoring team through direct observation in the share of meetingsindicated in Panel E.
107
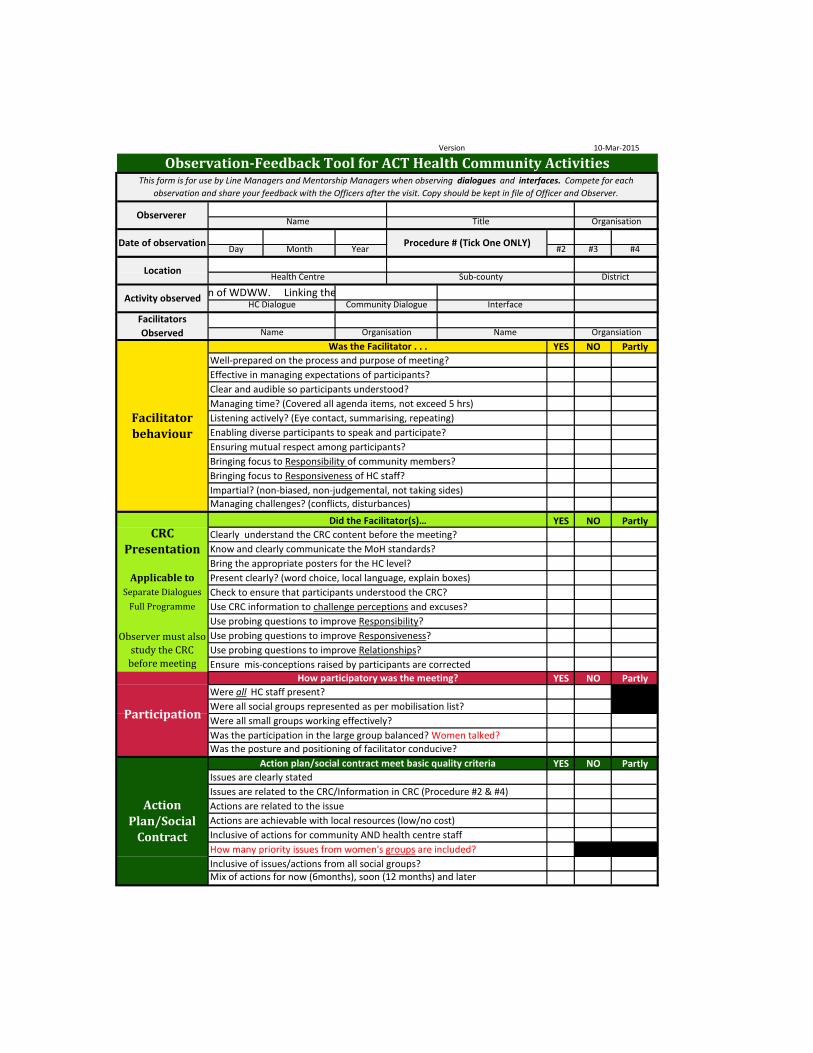
Version
Day Month Year #2 #3 #4
YES NO Partly
YES NO Partly
YES NO Partly
YES NO PartlyIssues are clearly stated
How many priority issues from women's groups are included?
Action Plan/Social
Contract Inclusive of actions for community AND health centre staff
Mix of actions for now (6months), soon (12 months) and later Inclusive of issues/actions from all social groups?
Actions are related to the issueActions are achievable with local resources (low/no cost)
Action plan/social contract meet basic quality criteria
Issues are related to the CRC/Information in CRC (Procedure #2 & #4)
Facilitator behaviour
Procedure # (Tick One ONLY)
Location
Activity observed
Facilitators Observed
Were all small groups working effectively?
Observer must also study the CRC
before meeting
Was the Facilitator . . .
Effective in managing expectations of participants?
Listening actively? (Eye contact, summarising, repeating)
Bringing focus to Responsibility of community members?
Enabling diverse participants to speak and participate? Ensuring mutual respect among participants?
Bringing focus to Responsiveness of HC staff?
Clear and audible so participants understood?
Participation
How participatory was the meeting?
Separate Dialogues
CRC Presentation
Applicable to
Clearly understand the CRC content before the meeting?Know and clearly communicate the MoH standards?
Use CRC information to challenge perceptions and excuses?
Was the posture and positioning of facilitator conducive?
Managing time? (Covered all agenda items, not exceed 5 hrs)
Name OrgansiationName Organisation
Well-prepared on the process and purpose of meeting?
Were all HC staff present? Were all social groups represented as per mobilisation list?
Bring the appropriate posters for the HC level?Present clearly? (word choice, local language, explain boxes)Check to ensure that participants understood the CRC?
Use probing questions to improve Responsibility?Use probing questions to improve Responsiveness?Use probing questions to improve Relationships?
Was the participation in the large group balanced? Women talked?
Impartial? (non-biased, non-judgemental, not taking sides)Managing challenges? (conflicts, disturbances)
Did the Facilitator(s)…
Ensure mis-conceptions raised by participants are corrected
Observerer
Date of observation
Community Dialogue Interface Brain storm in the session for WDWW. Sharng the purpose of the collection of WDWW. Linking the information to National WDWW to get the information at National Level.
10-Mar-2015
Observation-Feedback Tool for ACT Health Community ActivitiesThis form is for use by Line Managers and Mentorship Managers when observing dialogues and interfaces. Compete for each
observation and share your feedback with the Officers after the visit. Copy should be kept in file of Officer and Observer.
Name Title Organisation
Health Centre Sub-county
Full Programme
District
HC Dialogue

Day Month Year #2 #3 #4Procedure # (Tick One ONLY)
Location
Activity observed
Facilitators Observed
Was the Facilitator . . .Name OrgansiationName Organisation
Observerer
Date of observation
Community Dialogue Interface Brain storm in the session for WDWW. Sharng the purpose of the collection of WDWW. Linking the information to National WDWW to get the information at National Level.
Observation-Feedback Tool for ACT Health Community ActivitiesThis form is for use by Line Managers and Mentorship Managers when observing dialogues and interfaces. Compete for each
observation and share your feedback with the Officers after the visit. Copy should be kept in file of Officer and Observer.
Name Title Organisation
Health Centre Sub-county District
HC Dialogue
1)
2)
3)
1)
2)
3)
Observer FacilitatorName Name
Signature SignatureDate of sharing with facilitator Date of discussing with facilitator
The ACT Health programme has a component of on-the-job training and support. This support (mentorship) is very important for continuous learning and implementation of a high quality programme. These feedback tips should be shared with the faciltiators(s) after the meeting or in a visit to the Officer shortly (within three (3) working days) of the observation.
Feedback for Facilitator/Officer
WELL DONE! These are the areas where you excelled. Thanks for your work!
There are a few things you can work on for next time. Let me know how I can support you best.
As an observer, what do you think participants in this community feel about the ACT Health programme?
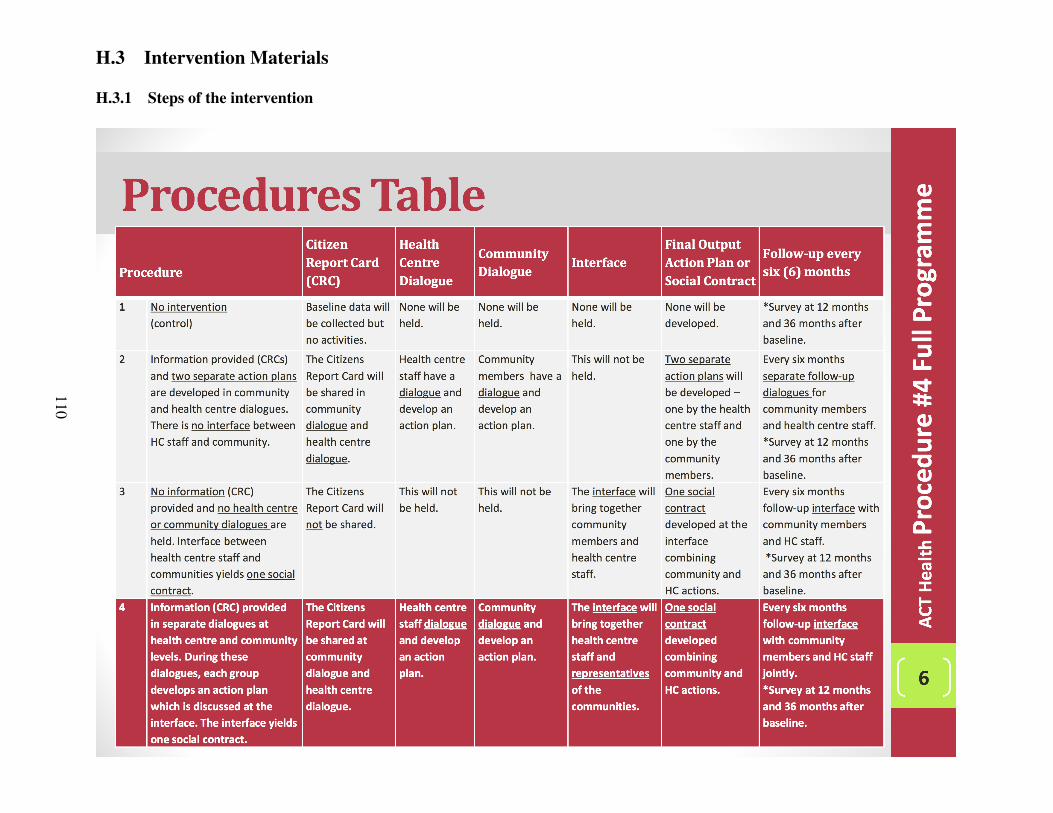
H.3 Intervention Materials
H.3.1 Steps of the intervention
110
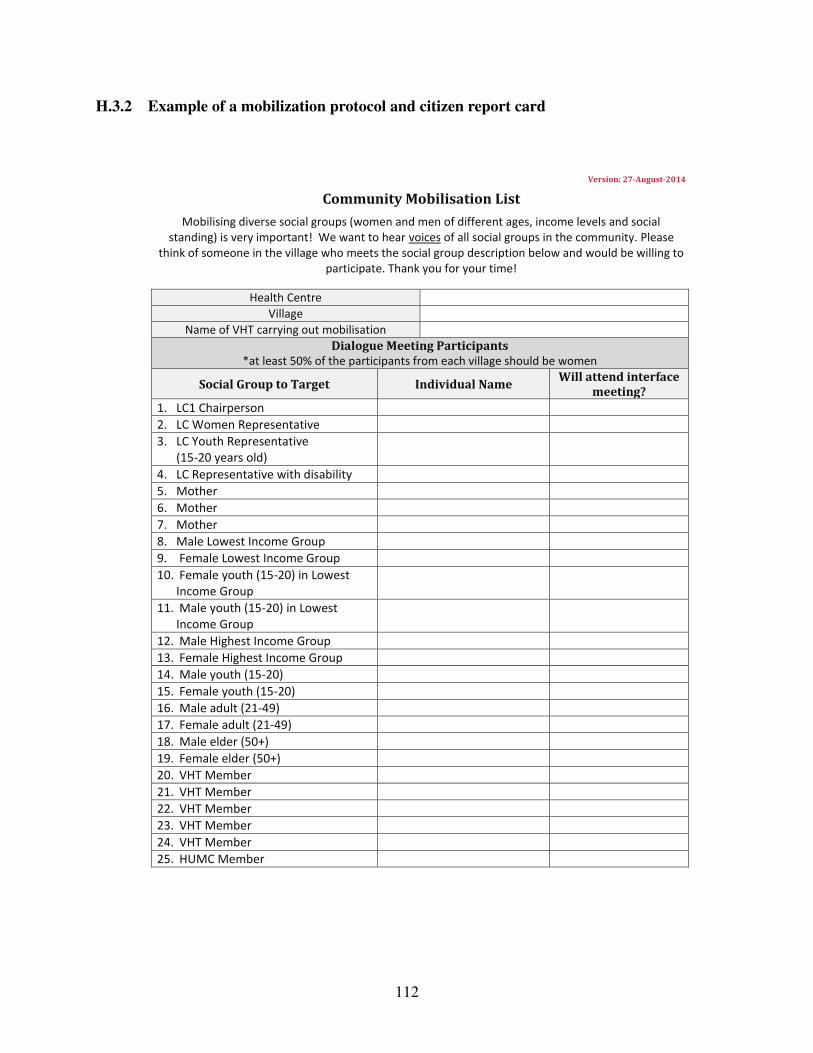
H.3.2 Example of a mobilization protocol and citizen report card
Version: 27-August-2014
Community Mobilisation List
Mobilising diverse social groups (women and men of different ages, income levels and social standing) is very important! We want to hear voices of all social groups in the community. Please
think of someone in the village who meets the social group description below and would be willing to participate. Thank you for your time!
Health Centre Village
Name of VHT carrying out mobilisation Dialogue Meeting Participants
*at least 50% of the participants from each village should be women
Social Group to Target Individual Name Will attend interface meeting?
1. LC1 Chairperson 2. LC Women Representative 3. LC Youth Representative
(15-20 years old)
4. LC Representative with disability 5. Mother 6. Mother 7. Mother 8. Male Lowest Income Group 9. Female Lowest Income Group 10. Female youth (15-20) in Lowest
Income Group
11. Male youth (15-20) in Lowest Income Group
12. Male Highest Income Group 13. Female Highest Income Group 14. Male youth (15-20) 15. Female youth (15-20) 16. Male adult (21-49) 17. Female adult (21-49) 18. Male elder (50+) 19. Female elder (50+) 20. VHT Member 21. VHT Member 22. VHT Member 23. VHT Member 24. VHT Member 25. HUMC Member
112

1 Kagote Health Centre (HC III) Citizen Report Card
Kagote Health Center III
Kabarole District
Citizen Report Card
Survey dates: 10th October 2014 to 26th October 2014
Report Card Prepared: 27th October 2014
Responsibility Responsiveness Relationships Individuals have good health-seeking behaviour. They seek
preventive care (ANC, immunisations, testing, etc.) and go
early for treatment of illness to avoid complications.
Health Center staff use resources effectively and provide care as per Ministry of Health standards in the Uganda National Minimum Health
Care Package (UNMHCP).
Mutual understanding and trust between community members and health Center staff. Includes better
understanding of each other’s constraints.
Note: This Citizens Report Card has been compiled from responses to household surveys and HC staff interviews.
2 Kagote Health Centre (HC III) Citizen Report Card
Rights and Responsibilities Issue Households say Health Center says Who could name at least 5 health rights and entitlements
0% Could name 3
Health Rights Some Major Health Rights in Uganda Patient’s Charter Right to choose Right to complaint and redress Right to access essential medicine Right to access information Right to privacy and confidentiality
Health Responsibilities Health Responsibilities include Responsibility to be healthy Responsibility to participate
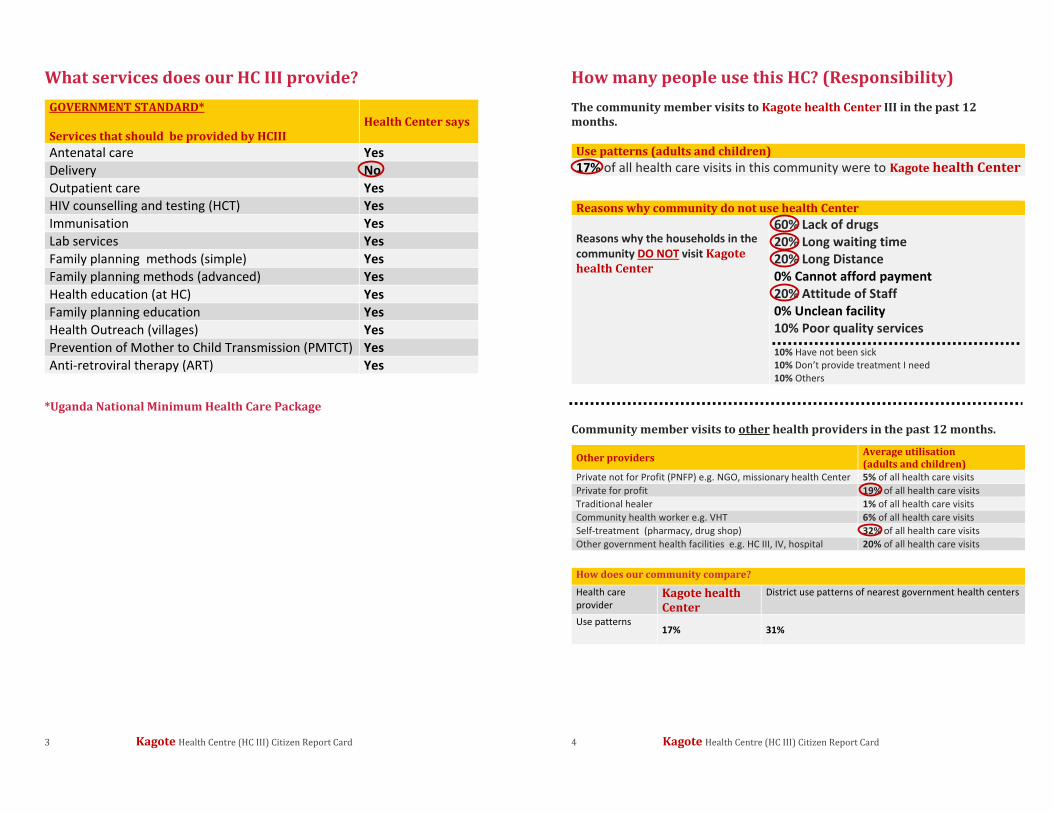
3 Kagote Health Centre (HC III) Citizen Report Card
What services does our HC III provide? GOVERNMENT STANDARD* Services that should be provided by HCIII
Health Center says
Antenatal care Yes Delivery No Outpatient care Yes HIV counselling and testing (HCT) Yes Immunisation Yes Lab services Yes Family planning methods (simple) Yes Family planning methods (advanced) Yes Health education (at HC) Yes Family planning education Yes Health Outreach (villages) Yes Prevention of Mother to Child Transmission (PMTCT) Yes Anti-retroviral therapy (ART) Yes
*Uganda National Minimum Health Care Package
4 Kagote Health Centre (HC III) Citizen Report Card
How many people use this HC? (Responsibility) The community member visits to Kagote health Center III in the past 12 months. Use patterns (adults and children) 17% of all health care visits in this community were to Kagote health Center
Reasons why community do not use health Center Reasons why the households in the community DO NOT visit Kagote health Center
60% Lack of drugs 20% Long waiting time 20% Long Distance 0% Cannot afford payment 20% Attitude of Staff 0% Unclean facility 10% Poor quality services
10% Have not been sick 10% Don’t provide treatment I need 10% Others
Community member visits to other health providers in the past 12 months.
Other providers Average utilisation (adults and children)
Private not for Profit (PNFP) e.g. NGO, missionary health Center 5% of all health care visits Private for profit 19% of all health care visits Traditional healer 1% of all health care visits Community health worker e.g. VHT 6% of all health care visits Self-treatment (pharmacy, drug shop) 32% of all health care visits Other government health facilities e.g. HC III, IV, hospital 20% of all health care visits
How does our community compare? Health care provider
Kagote health Center
District use patterns of nearest government health centers
Use patterns 17% 31%
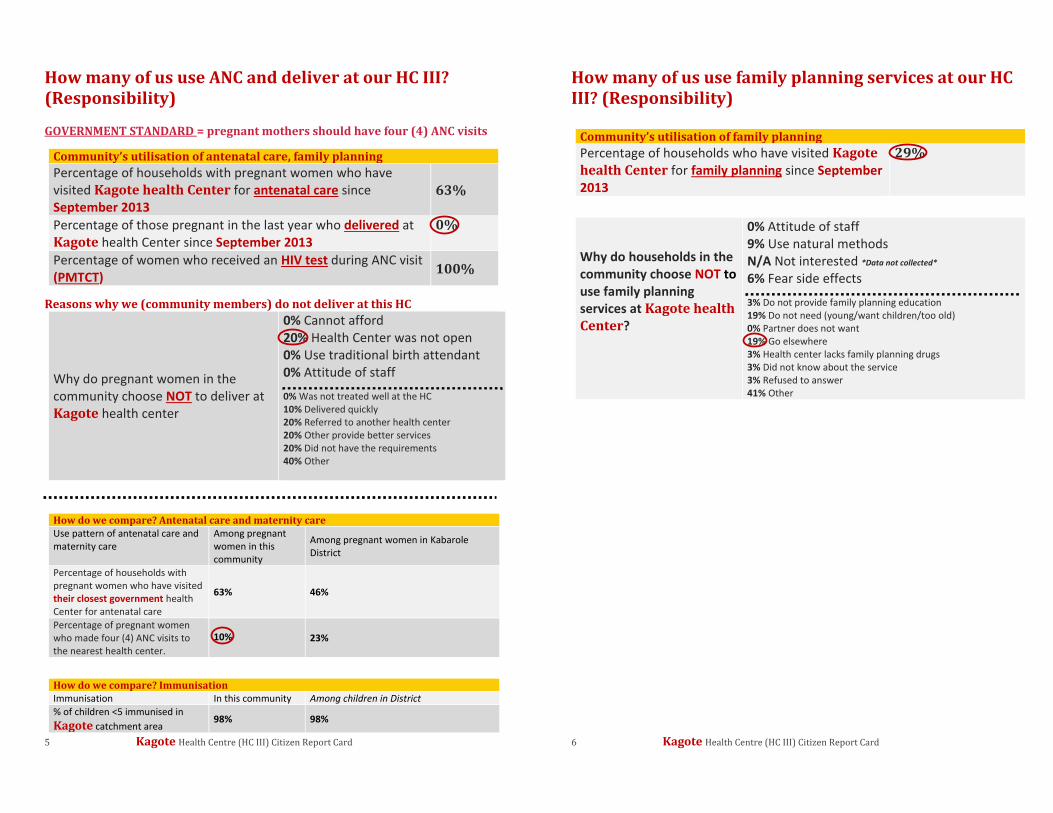
5 Kagote Health Centre (HC III) Citizen Report Card
How many of us use ANC and deliver at our HC III? (Responsibility)
GOVERNMENT STANDARD = pregnant mothers should have four (4) ANC visits
Community’s utilisation of antenatal care, family planning Percentage of households with pregnant women who have visited Kagote health Center for antenatal care since September 2013
63%
Percentage of those pregnant in the last year who delivered at Kagote health Center since September 2013
0%
Percentage of women who received an HIV test during ANC visit (PMTCT) 100%
Reasons why we (community members) do not deliver at this HC
Why do pregnant women in the community choose NOT to deliver at Kagote health center
0% Cannot afford 20% Health Center was not open 0% Use traditional birth attendant 0% Attitude of staff
0% Was not treated well at the HC 10% Delivered quickly 20% Referred to another health center 20% Other provide better services 20% Did not have the requirements 40% Other
How do we compare? Antenatal care and maternity care Use pattern of antenatal care and maternity care
Among pregnant women in this community
Among pregnant women in Kabarole District
Percentage of households with pregnant women who have visited their closest government health Center for antenatal care
63% 46%
Percentage of pregnant women who made four (4) ANC visits to the nearest health center.
10% 23%
How do we compare? Immunisation Immunisation In this community Among children in District % of children <5 immunised in Kagote catchment area
98% 98%
6 Kagote Health Centre (HC III) Citizen Report Card
How many of us use family planning services at our HC III? (Responsibility)
Community’s utilisation of family planning Percentage of households who have visited Kagote health Center for family planning since September 2013
29%
Why do households in the community choose NOT to use family planning services at Kagote health Center?
0% Attitude of staff 9% Use natural methods N/A Not interested *Data not collected*
6% Fear side effects
3% Do not provide family planning education 19% Do not need (young/want children/too old) 0% Partner does not want 19% Go elsewhere 3% Health center lacks family planning drugs 3% Did not know about the service 3% Refused to answer 41% Other
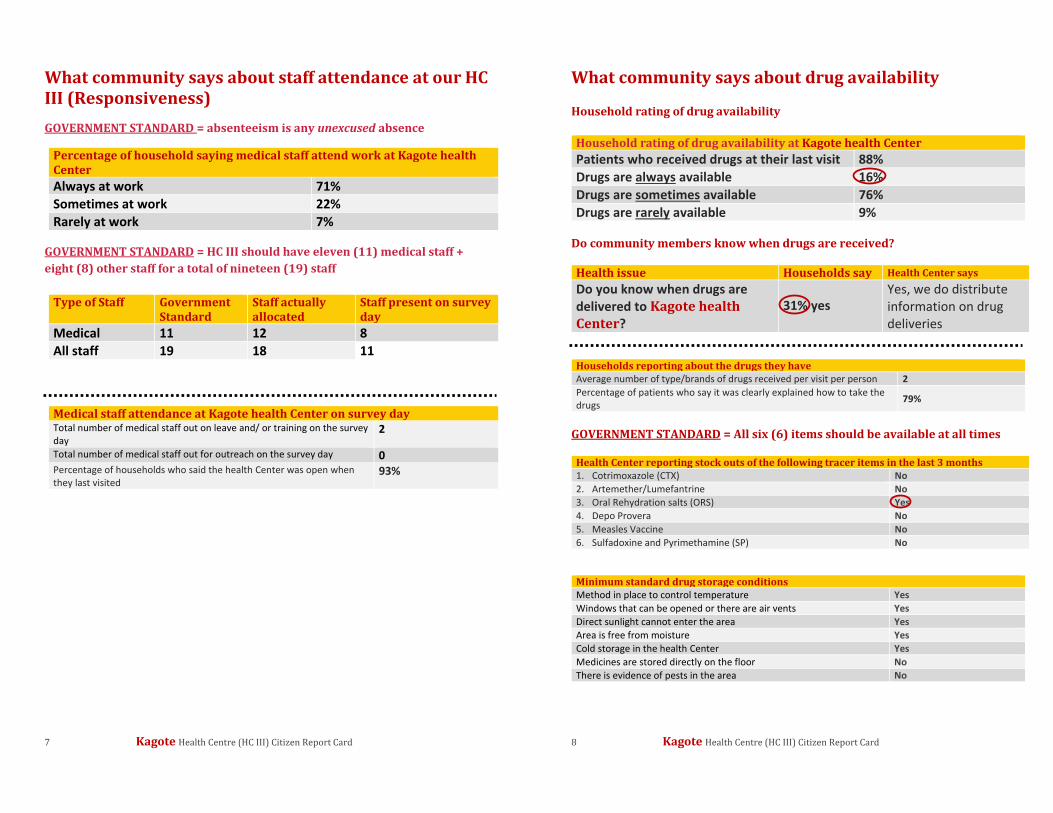
7 Kagote Health Centre (HC III) Citizen Report Card
What community says about staff attendance at our HC III (Responsiveness) GOVERNMENT STANDARD = absenteeism is any unexcused absence
Percentage of household saying medical staff attend work at Kagote health Center Always at work 71% Sometimes at work 22% Rarely at work 7%
GOVERNMENT STANDARD = HC III should have eleven (11) medical staff + eight (8) other staff for a total of nineteen (19) staff
Type of Staff Government Standard
Staff actually allocated
Staff present on survey day
Medical 11 12 8 All staff 19 18 11
Medical staff attendance at Kagote health Center on survey day Total number of medical staff out on leave and/ or training on the survey day
2
Total number of medical staff out for outreach on the survey day 0 Percentage of households who said the health Center was open when they last visited
93%
8 Kagote Health Centre (HC III) Citizen Report Card
What community says about drug availability Household rating of drug availability Household rating of drug availability at Kagote health Center Patients who received drugs at their last visit 88% Drugs are always available 16% Drugs are sometimes available 76% Drugs are rarely available 9%
Do community members know when drugs are received? Health issue Households say Health Center says Do you know when drugs are delivered to Kagote health Center?
31% yes Yes, we do distribute information on drug deliveries
Households reporting about the drugs they have Average number of type/brands of drugs received per visit per person 2 Percentage of patients who say it was clearly explained how to take the drugs 79%
GOVERNMENT STANDARD = All six (6) items should be available at all times
Health Center reporting stock outs of the following tracer items in the last 3 months 1. Cotrimoxazole (CTX) No 2. Artemether/Lumefantrine No 3. Oral Rehydration salts (ORS) Yes 4. Depo Provera No 5. Measles Vaccine No 6. Sulfadoxine and Pyrimethamine (SP) No
Minimum standard drug storage conditions Method in place to control temperature Yes Windows that can be opened or there are air vents Yes Direct sunlight cannot enter the area Yes Area is free from moisture Yes Cold storage in the health Center Yes Medicines are stored directly on the floor No There is evidence of pests in the area No
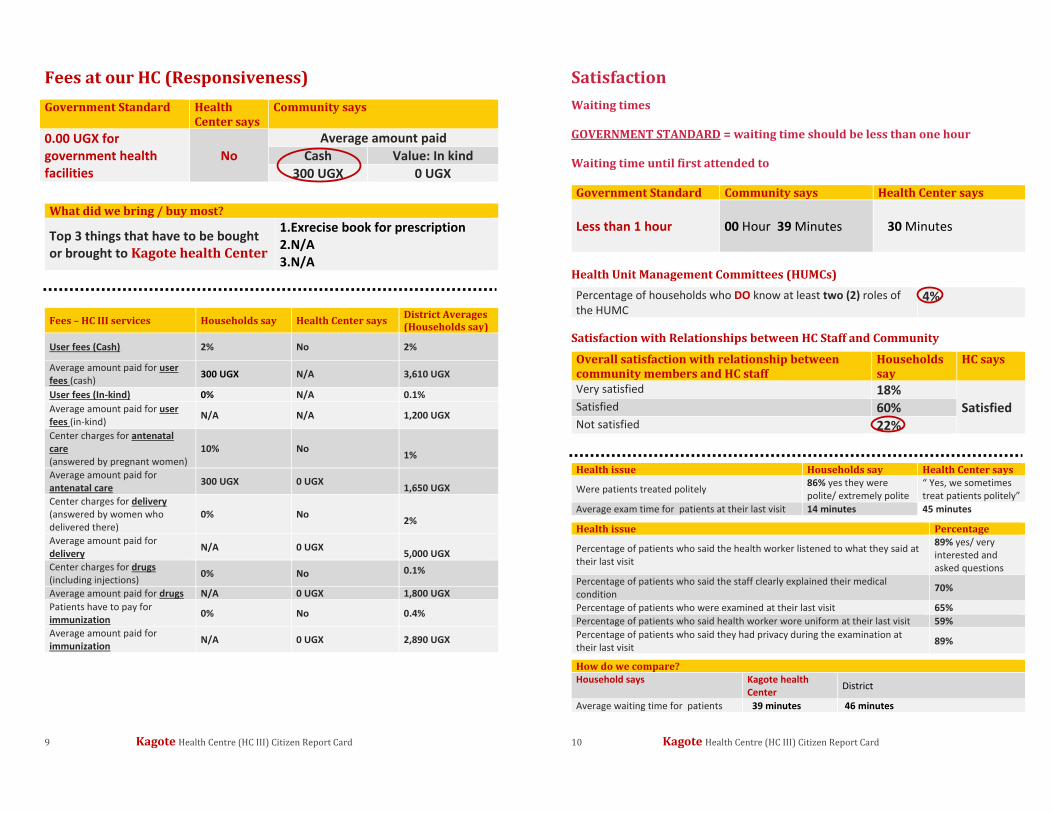
9 Kagote Health Centre (HC III) Citizen Report Card
Fees at our HC (Responsiveness) Government Standard Health
Center says Community says
0.00 UGX for government health facilities
No Average amount paid
Cash Value: In kind 300 UGX 0 UGX
What did we bring / buy most?
Top 3 things that have to be bought or brought to Kagote health Center
1.Exrecise book for prescription 2.N/A 3.N/A
Fees – HC III services Households say Health Center says District Averages (Households say)
User fees (Cash) 2% No 2%
Average amount paid for user fees (cash) 300 UGX N/A 3,610 UGX
User fees (In-kind) 0% N/A 0.1% Average amount paid for user fees (in-kind) N/A N/A 1,200 UGX
Center charges for antenatal care (answered by pregnant women)
10% No 1%
Average amount paid for antenatal care 300 UGX 0 UGX
1,650 UGX Center charges for delivery (answered by women who delivered there)
0% No 2%
Average amount paid for delivery N/A 0 UGX
5,000 UGX Center charges for drugs (including injections) 0% No 0.1%
Average amount paid for drugs N/A 0 UGX 1,800 UGX Patients have to pay for immunization 0% No 0.4%
Average amount paid for immunization N/A 0 UGX 2,890 UGX
10 Kagote Health Centre (HC III) Citizen Report Card
Satisfaction Waiting times GOVERNMENT STANDARD = waiting time should be less than one hour Waiting time until first attended to Government Standard Community says Health Center says Less than 1 hour
00 Hour 39 Minutes 30 Minutes
Health Unit Management Committees (HUMCs)
Percentage of households who DO know at least two (2) roles of the HUMC
4%
Satisfaction with Relationships between HC Staff and Community
Overall satisfaction with relationship between community members and HC staff
Households say
HC says
Very satisfied 18% Satisfied Satisfied 60%
Not satisfied 22%
Health issue Households say Health Center says
Were patients treated politely 86% yes they were polite/ extremely polite
“ Yes, we sometimes treat patients politely”
Average exam time for patients at their last visit 14 minutes 45 minutes
Health issue Percentage
Percentage of patients who said the health worker listened to what they said at their last visit
89% yes/ very interested and asked questions
Percentage of patients who said the staff clearly explained their medical condition 70%
Percentage of patients who were examined at their last visit 65% Percentage of patients who said health worker wore uniform at their last visit 59% Percentage of patients who said they had privacy during the examination at their last visit 89%
How do we compare? Household says Kagote health
Center District
Average waiting time for patients 39 minutes 46 minutes
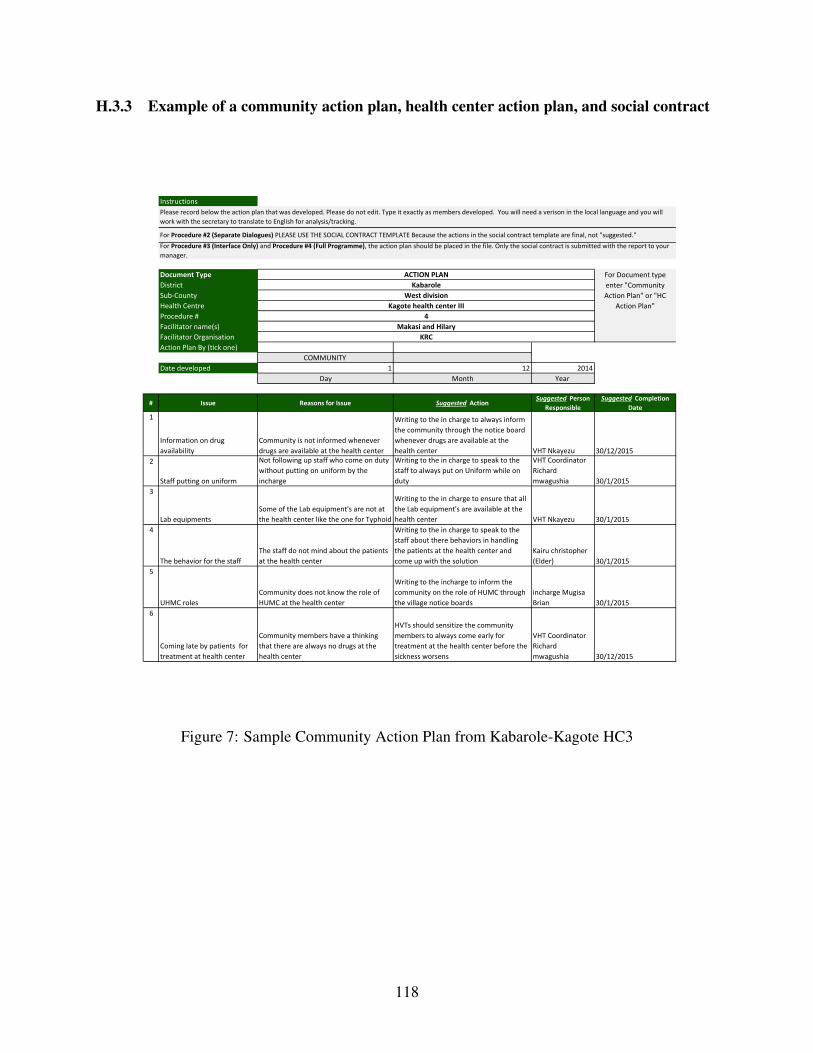
H.3.3 Example of a community action plan, health center action plan, and social contract
Instructions
Document Type District Sub-CountyHealth CentreProcedure # Facilitator name(s)Facilitator OrganisationAction Plan By (tick one)
COMMUNITY Date developed 1 12 2014
Day Month Year
# Issue Reasons for Issue Suggested Action Suggested Person
ResponsibleSuggested Completion
Date1
Information on drug availability
Community is not informed whenever drugs are available at the health center
Writing to the in charge to always inform the community through the notice board whenever drugs are available at the health center VHT Nkayezu 30/12/2015
2
Staff putting on uniform
Not following up staff who come on duty without putting on uniform by the incharge
Writing to the in charge to speak to the staff to always put on Uniform while on duty
VHT Coordinator Richard mwagushia 30/1/2015
3
Lab equipmentsSome of the Lab equipment's are not at the health center like the one for Typhoid
Writing to the in charge to ensure that all the Lab equipment's are available at the health center VHT Nkayezu 30/1/2015
4
The behavior for the staffThe staff do not mind about the patients at the health center
Writing to the in charge to speak to the staff about there behaviors in handling the patients at the health center and come up with the solution
Kairu christopher (Elder) 30/1/2015
5
UHMC rolesCommunity does not know the role of HUMC at the health center
Writing to the incharge to inform the community on the role of HUMC through the village notice boards
incharge Mugisa Brian 30/1/2015
6
Coming late by patients for treatment at health center
Community members have a thinking that there are always no drugs at the health center
HVTs should sensitize the community members to always come early for treatment at the health center before the sickness worsens
VHT Coordinator Richard mwagushia 30/12/2015
KRC
Please record below the action plan that was developed. Please do not edit. Type it exactly as members developed. You will need a verison in the local language and you will work with the secretary to translate to English for analysis/tracking.
For Procedure #2 (Separate Dialogues) PLEASE USE THE SOCIAL CONTRACT TEMPLATE Because the actions in the social contract template are final, not "suggested."For Procedure #3 (Interface Only) and Procedure #4 (Full Programme), the action plan should be placed in the file. Only the social contract is submitted with the report to your manager.
ACTION PLAN For Document type enter "Community Action Plan" or "HC
Action Plan"
KabaroleWest division
Kagote health center III4
Makasi and Hilary
Figure 7: Sample Community Action Plan from Kabarole-Kagote HC3
118
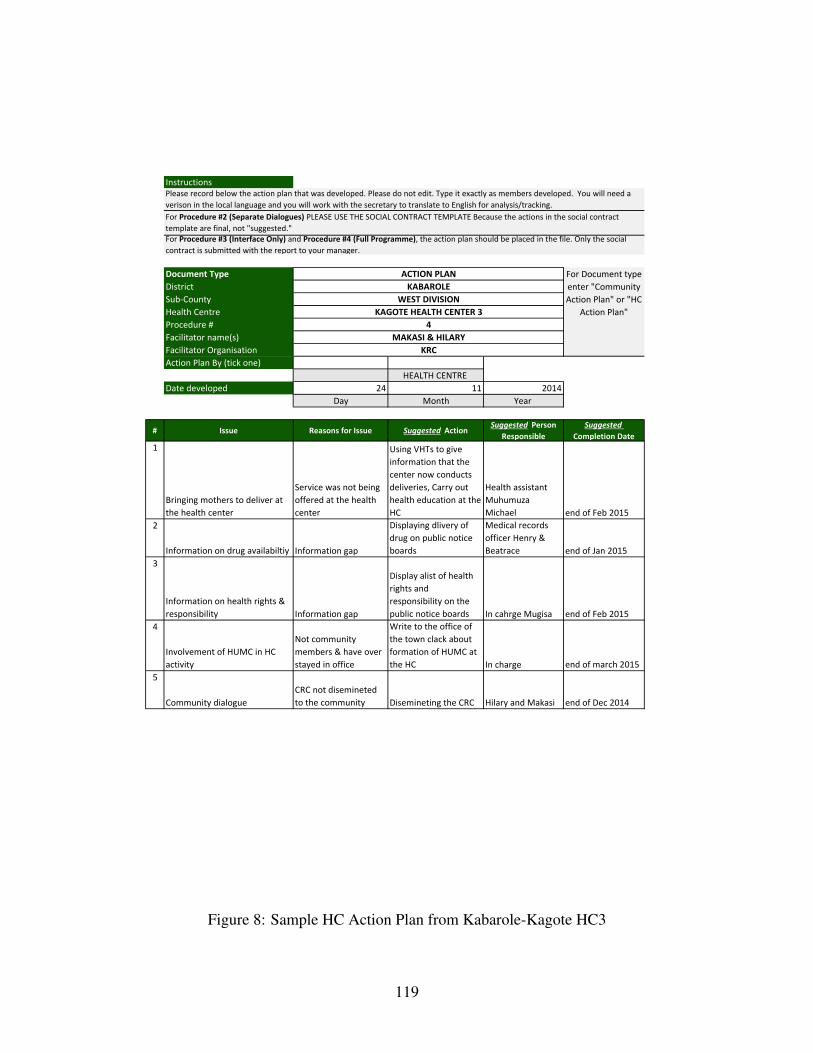
Instructions
Document Type District Sub-CountyHealth CentreProcedure # Facilitator name(s)Facilitator OrganisationAction Plan By (tick one)
HEALTH CENTRE Date developed 24 11 2014
Day Month Year
# Issue Reasons for Issue Suggested Action Suggested Person
ResponsibleSuggested
Completion Date1
Bringing mothers to deliver at the health center
Service was not being offered at the health center
Using VHTs to give information that the center now conducts deliveries, Carry out health education at the HC
Health assistant Muhumuza Michael end of Feb 2015
2
Information on drug availabiltiy Information gap
Displaying dlivery of drug on public notice boards
Medical records officer Henry & Beatrace end of Jan 2015
3
Information on health rights & responsibility Information gap
Display alist of health rights and responsibility on the public notice boards In cahrge Mugisa end of Feb 2015
4
Involvement of HUMC in HC activity
Not community members & have over stayed in office
Write to the office of the town clack about formation of HUMC at the HC In charge end of march 2015
5
Community dialogueCRC not disemineted to the community Disemineting the CRC Hilary and Makasi end of Dec 2014
KRC
Please record below the action plan that was developed. Please do not edit. Type it exactly as members developed. You will need a verison in the local language and you will work with the secretary to translate to English for analysis/tracking.For Procedure #2 (Separate Dialogues) PLEASE USE THE SOCIAL CONTRACT TEMPLATE Because the actions in the social contract template are final, not "suggested."For Procedure #3 (Interface Only) and Procedure #4 (Full Programme), the action plan should be placed in the file. Only the social contract is submitted with the report to your manager.
ACTION PLAN For Document type enter "Community Action Plan" or "HC
Action Plan"
KABAROLEWEST DIVISION
KAGOTE HEALTH CENTER 34
MAKASI & HILARY
Figure 8: Sample HC Action Plan from Kabarole-Kagote HC3
119
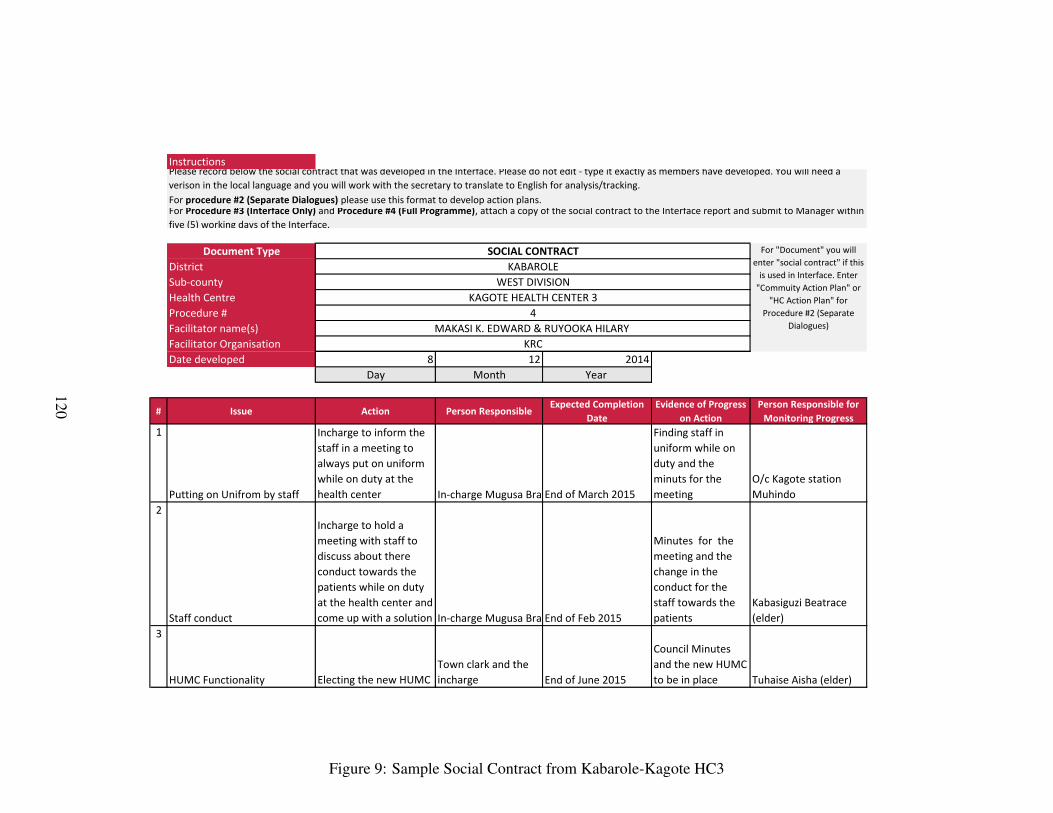
Instructions
Document TypeDistrict Sub-countyHealth CentreProcedure # Facilitator name(s)Facilitator OrganisationDate developed 8 12 2014
Day Month Year
# Issue Action Person ResponsibleExpected Completion
DateEvidence of Progress
on ActionPerson Responsible for
Monitoring Progress1
Putting on Unifrom by staff
Incharge to inform the staff in a meeting to always put on uniform while on duty at the health center In-charge Mugusa BrainEnd of March 2015
Finding staff in uniform while on duty and the minuts for the meeting
O/c Kagote station Muhindo
2
Staff conduct
Incharge to hold a meeting with staff to discuss about there conduct towards the patients while on duty at the health center and come up with a solution In-charge Mugusa BrainEnd of Feb 2015
Minutes for the meeting and the change in the conduct for the staff towards the patients
Kabasiguzi Beatrace (elder)
3
HUMC Functionality Electing the new HUMCTown clark and the incharge End of June 2015
Council Minutes and the new HUMC to be in place Tuhaise Aisha (elder)
KRC
Please record below the social contract that was developed in the Interface. Please do not edit - type it exactly as members have developed. You will need a verison in the local language and you will work with the secretary to translate to English for analysis/tracking.For procedure #2 (Separate Dialogues) please use this format to develop action plans.For Procedure #3 (Interface Only) and Procedure #4 (Full Programme), attach a copy of the social contract to the Interface report and submit to Manager within five (5) working days of the Interface.
SOCIAL CONTRACT For "Document" you will enter "social contract" if this
is used in Interface. Enter "Commuity Action Plan" or
"HC Action Plan" for Procedure #2 (Separate
Dialogues)
KABAROLEWEST DIVISION
KAGOTE HEALTH CENTER 34
MAKASI K. EDWARD & RUYOOKA HILARY
Figure 9: Sample Social Contract from Kabarole-Kagote HC3
120