Embed Size (px)
Citation preview
The water footprintof consumption in the UK
Prof. dr. Arjen Hoekstra
University of Twente – the Netherlands
www.waterfootprint.org
Overview
- Freshwater scarcity & pollution
- The water footprint of- our daily commodities- meat- bio-energy
- What can we do?
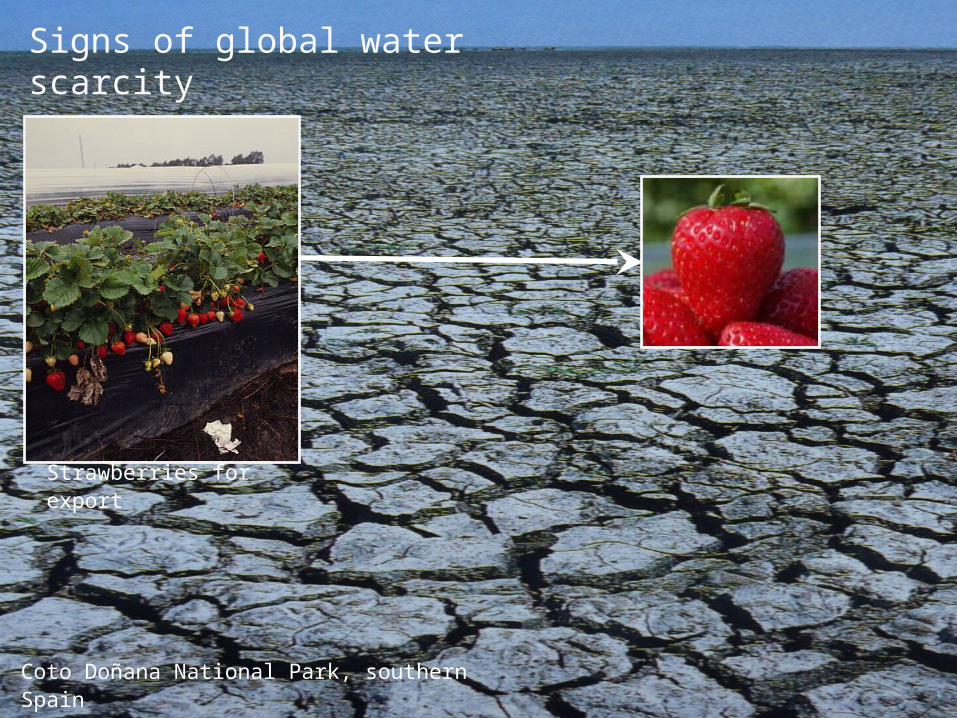
Coto Doñana National Park, southern Spain
Strawberries for export
Signs of global water scarcity
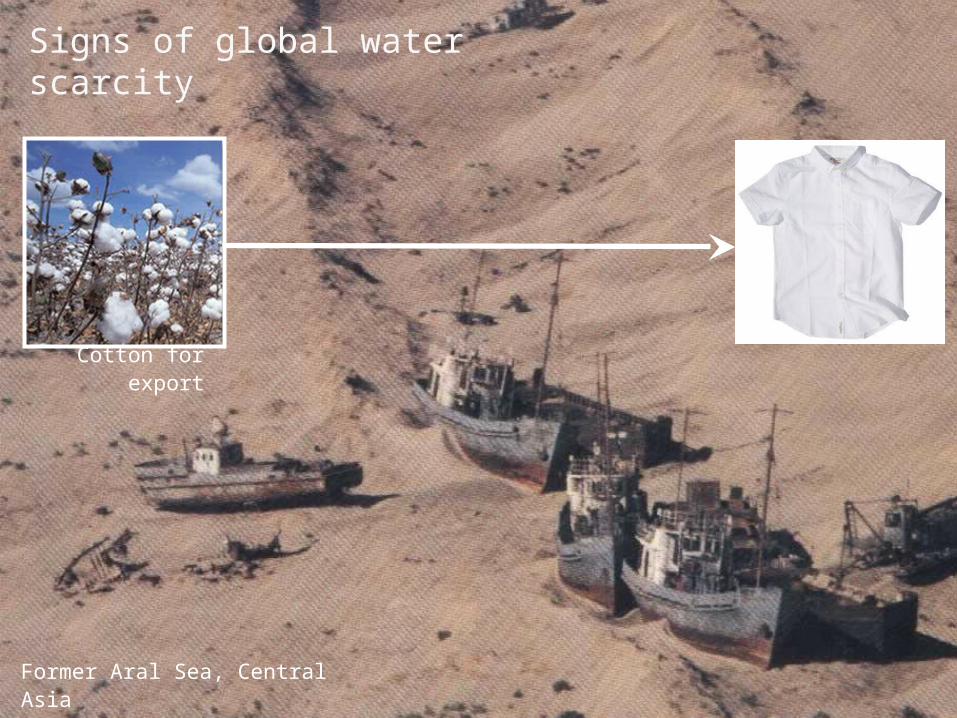
Former Aral Sea, Central Asia
Cotton for export
Signs of global water scarcity
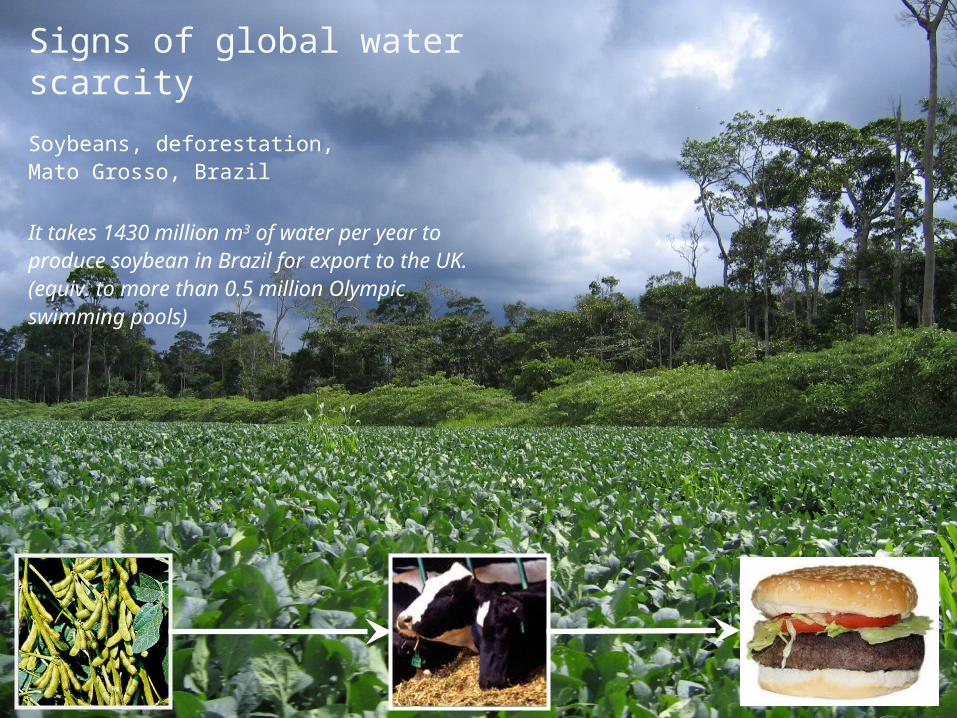
Soybeans, deforestation,Mato Grosso, Brazil
It takes 1430 million m3 of water per year to produce soybean in Brazil for export to the UK.(equiv. to more than 0.5 million Olympic swimming pools)
Signs of global water scarcity
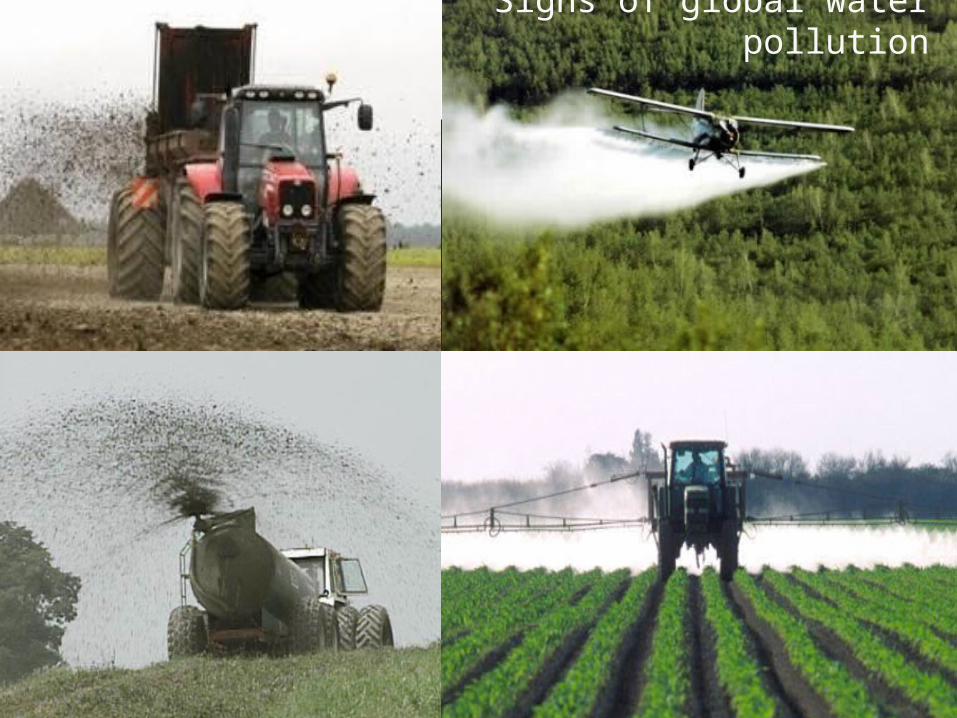
Signs of global water pollution
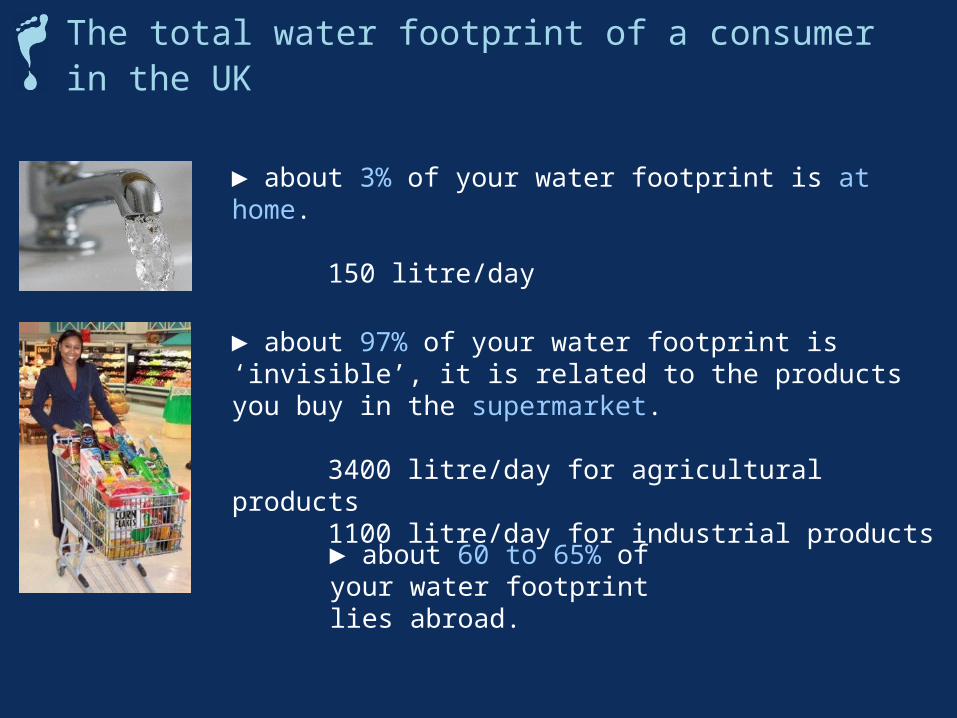
The total water footprint of a consumer in the UK
► about 3% of your water footprint is at home.
150 litre/day
► about 60 to 65% of your water footprint lies abroad.
► about 97% of your water footprint is ‘invisible’, it is related to the products you buy in the supermarket.
3400 litre/day for agricultural products1100 litre/day for industrial products
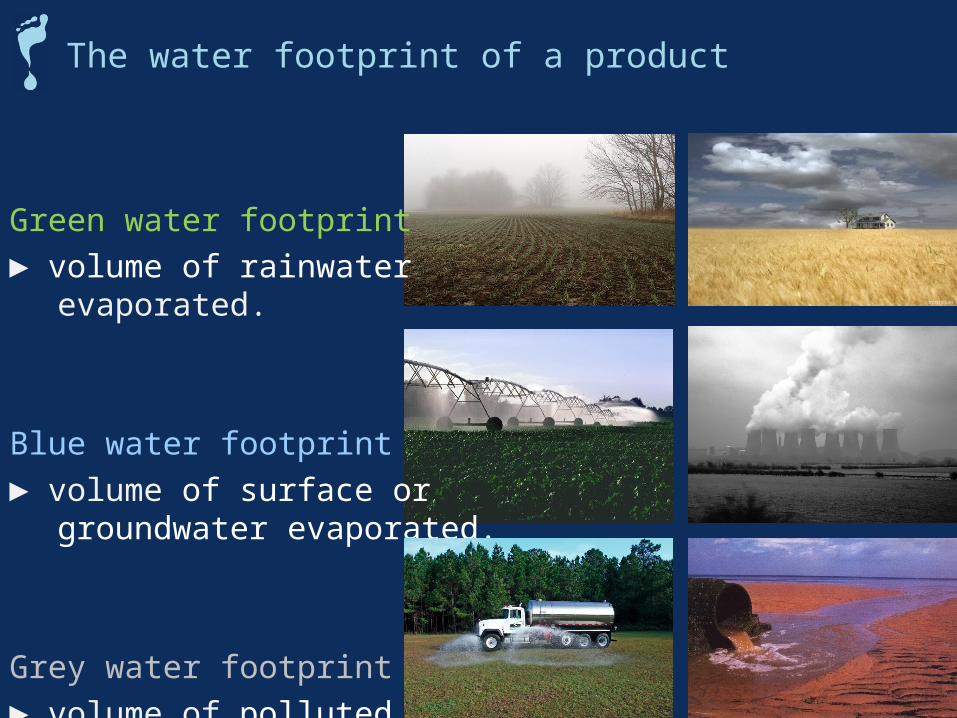
Green water footprint
► volume of rainwater evaporated.
Blue water footprint
► volume of surface or groundwater evaporated.
Grey water footprint
► volume of polluted water.
The water footprint of a product
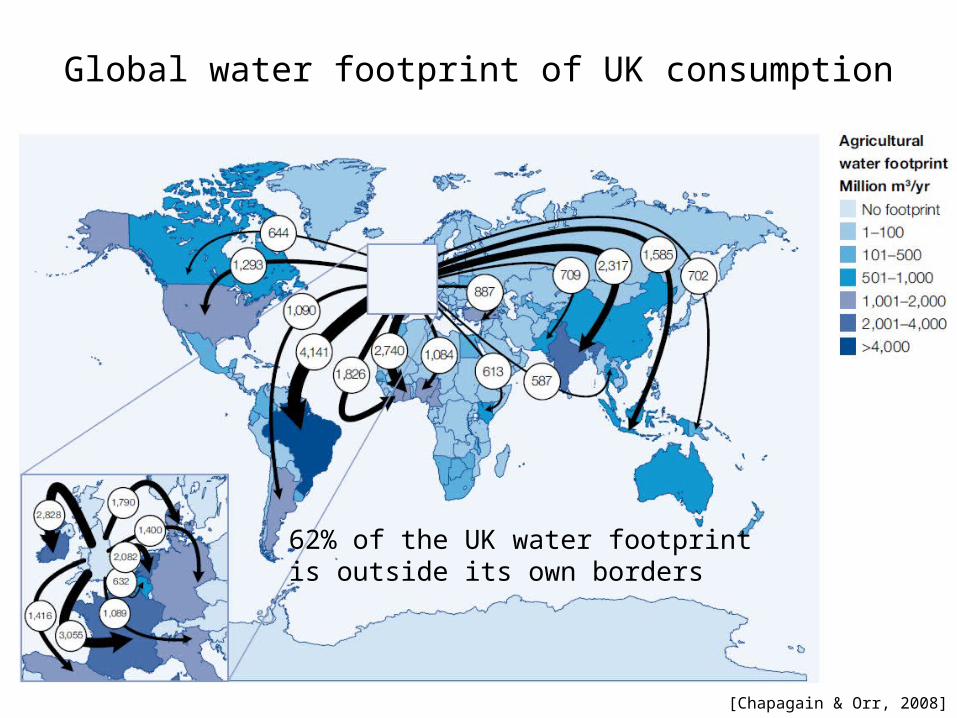
Global water footprint of UK consumption
62% of the UK water footprintis outside its own borders
[Chapagain & Orr, 2008]
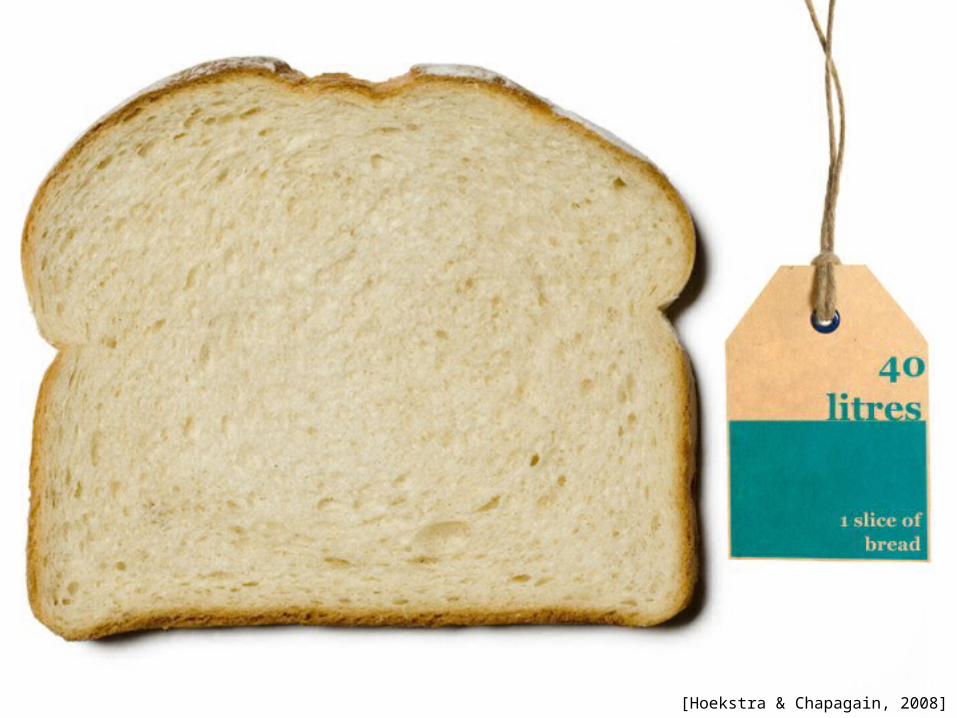
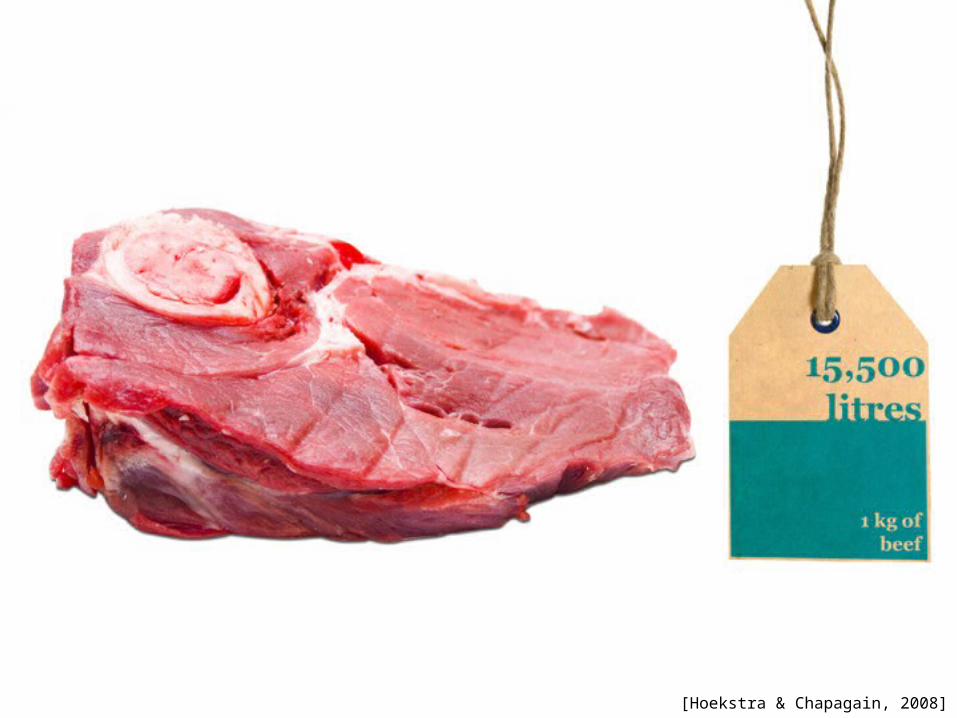
[Hoekstra & Chapagain, 2008]
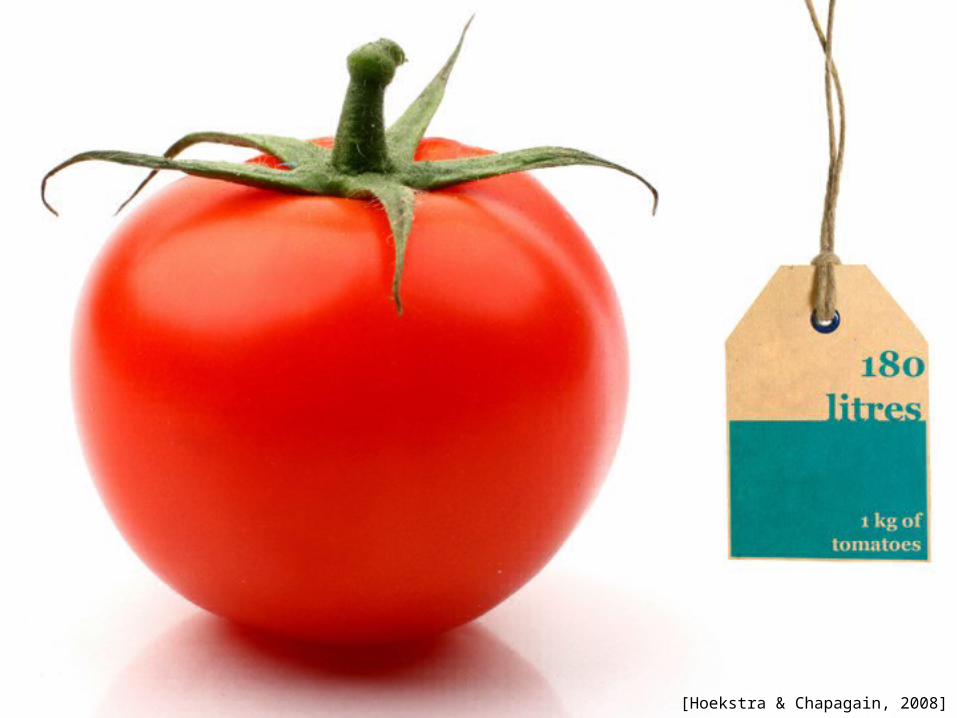
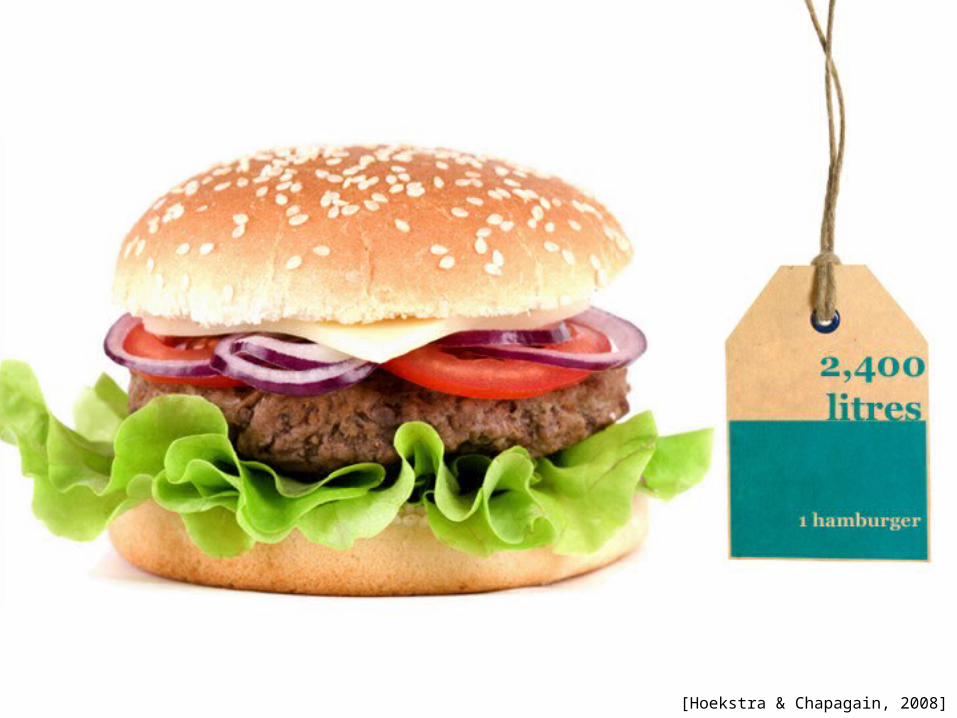
[Hoekstra & Chapagain, 2008]
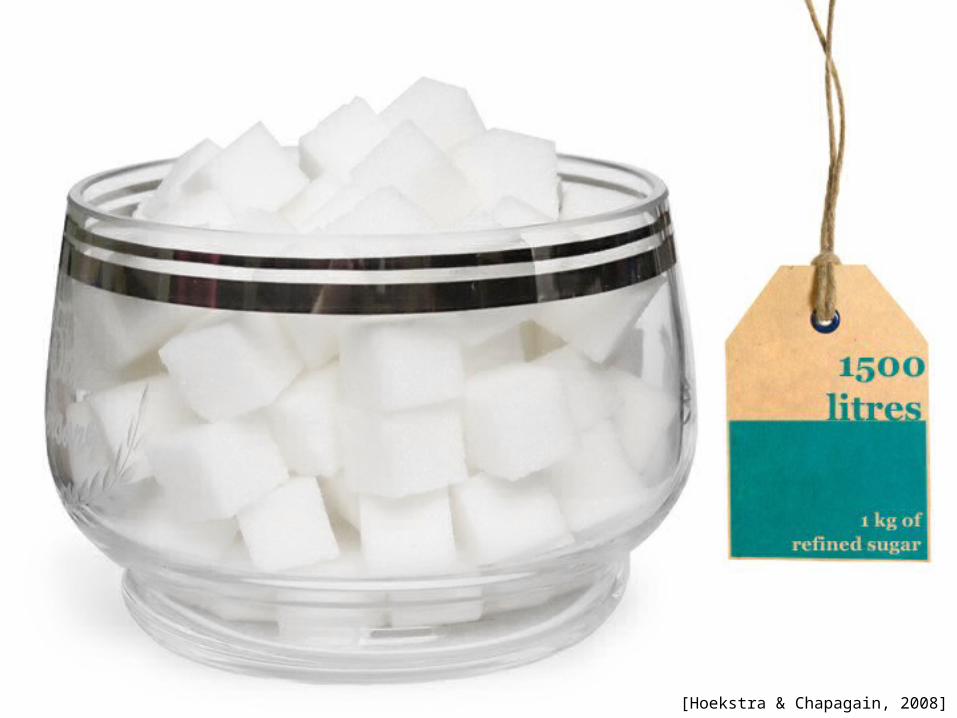
[Hoekstra & Chapagain, 2008]
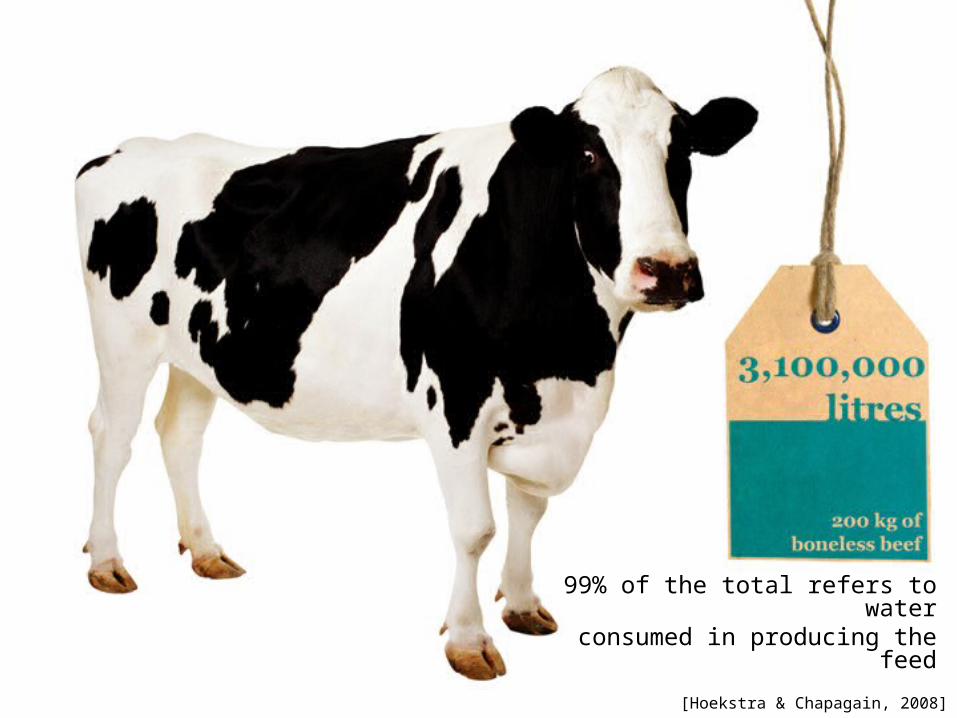
[Hoekstra & Chapagain, 2008]
99% of the total refers to waterconsumed in producing the feed
[Hoekstra & Chapagain, 2008]
[Hoekstra & Chapagain, 2008]
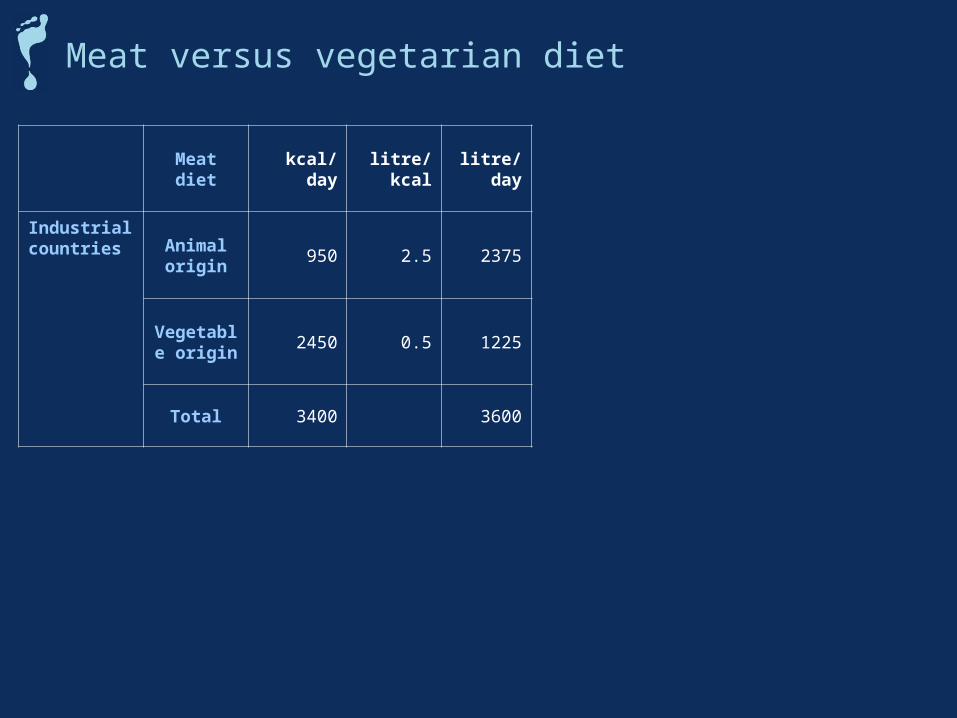
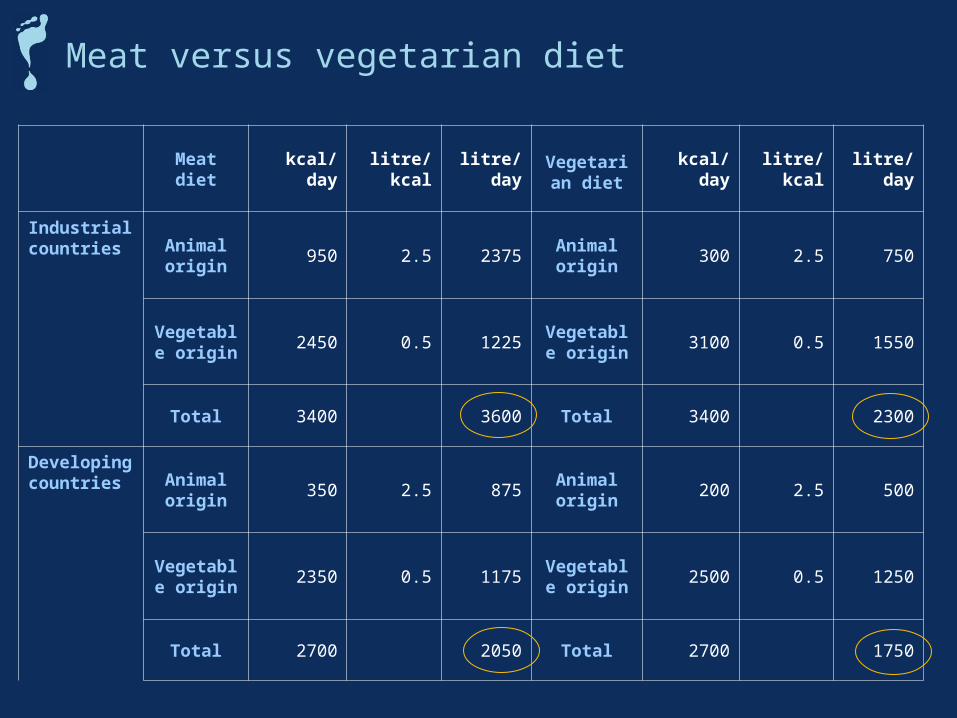
Meat versus vegetarian diet
Meat diet kcal/day litre/kcal litre/day Vegetarian diet
kcal/day litre/kcal litre/day
Industrial countries Animal
origin950 2.5 2375
Animal origin
300 2.5 750
Vegetable origin
2450 0.5 1225Vegetable
origin3100 0.5 1550
Total 3400 3600 Total 3400 2300
Developing countries Animal
origin350 2.5 875
Animal origin
200 2.5 500
Vegetable origin
2350 0.5 1175Vegetable
origin2500 0.5 1250
Total 2700 2050 Total 2700 1750
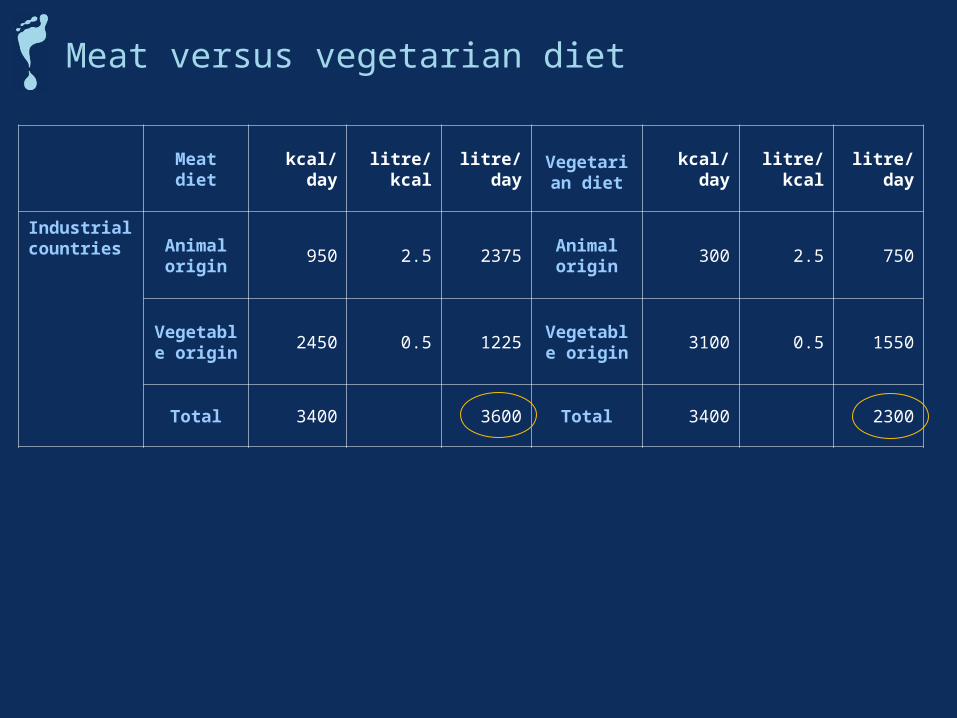
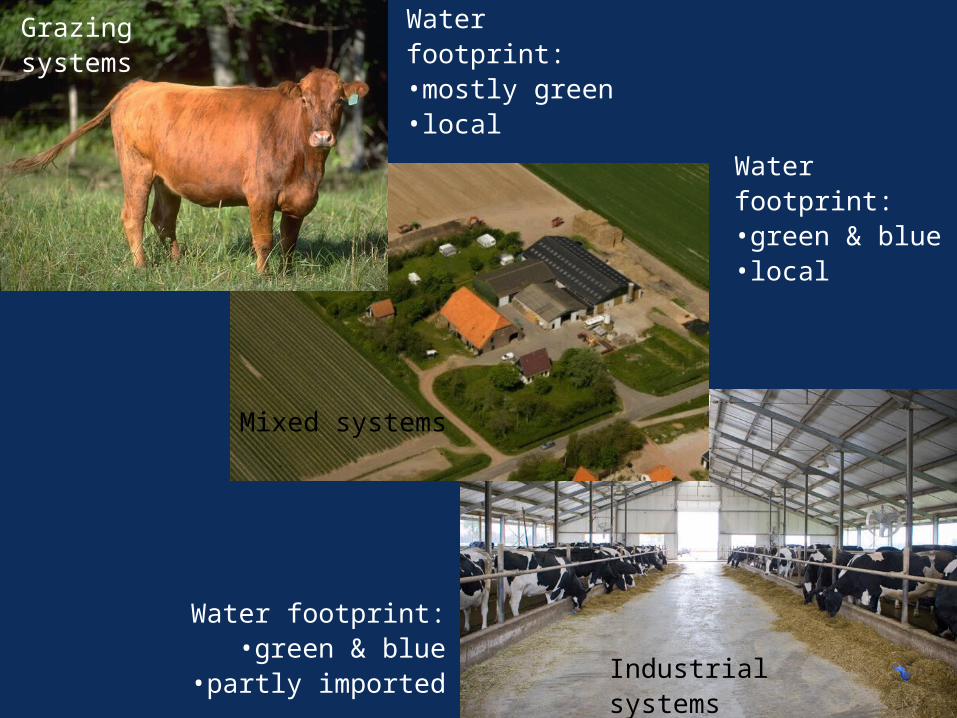
Industrial systems
Mixed systems
Grazing systems Water footprint: •mostly green•local
Water footprint:•green & blue
•partly imported
Water footprint:•green & blue•local
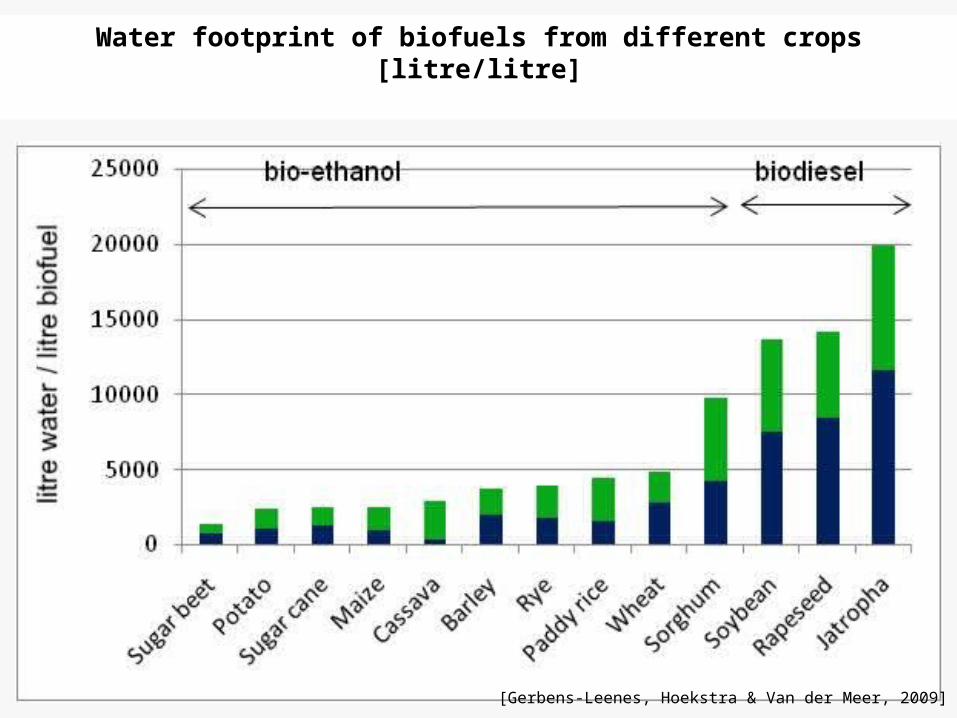
Water footprint of biofuels from different crops [litre/litre]
[Gerbens-Leenes, Hoekstra & Van der Meer, 2009]
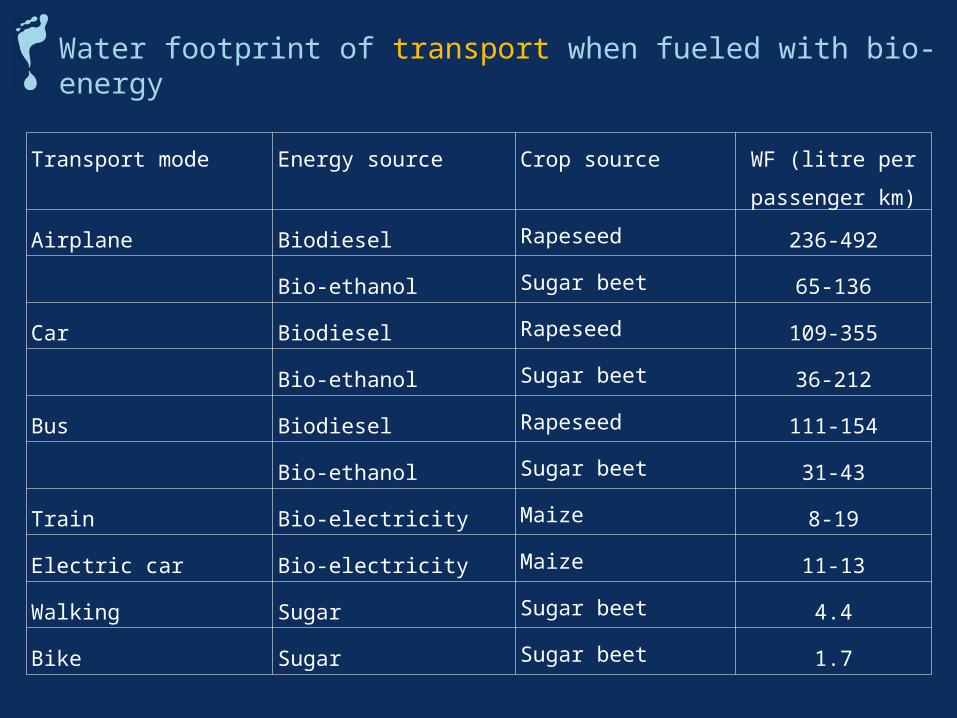
Transport mode Energy source Crop source WF (litre per
passenger km)
Airplane Biodiesel Rapeseed 236-492
Bio-ethanol Sugar beet 65-136
Car Biodiesel Rapeseed 109-355
Bio-ethanol Sugar beet 36-212
Bus Biodiesel Rapeseed 111-154
Bio-ethanol Sugar beet 31-43
Train Bio-electricity Maize 8-19
Electric car Bio-electricity Maize 11-13
Walking Sugar Sugar beet 4.4
Bike Sugar Sugar beet 1.7
Water footprint of transport when fueled with bio-energy
What can we do?
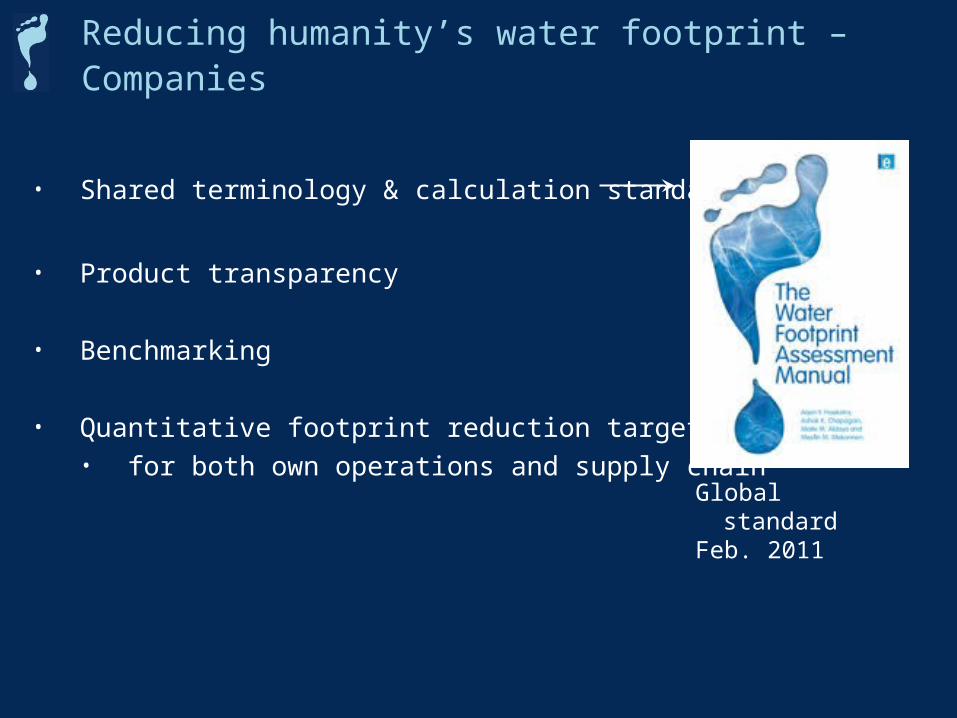
• Shared terminology & calculation standards
• Product transparency
• Benchmarking
• Quantitative footprint reduction targets• for both own operations and supply chain
Reducing humanity’s water footprint – Companies
Global standardFeb. 2011
• Embed water footprint assessment in national water policy making.
• Promote coherence between water and other governmental policies: environmental, agricultural, energy, trade, foreign policy.
• Reduce the own organizational water footprint
• Promote product transparency
Reducing humanity’s water footprint – Government
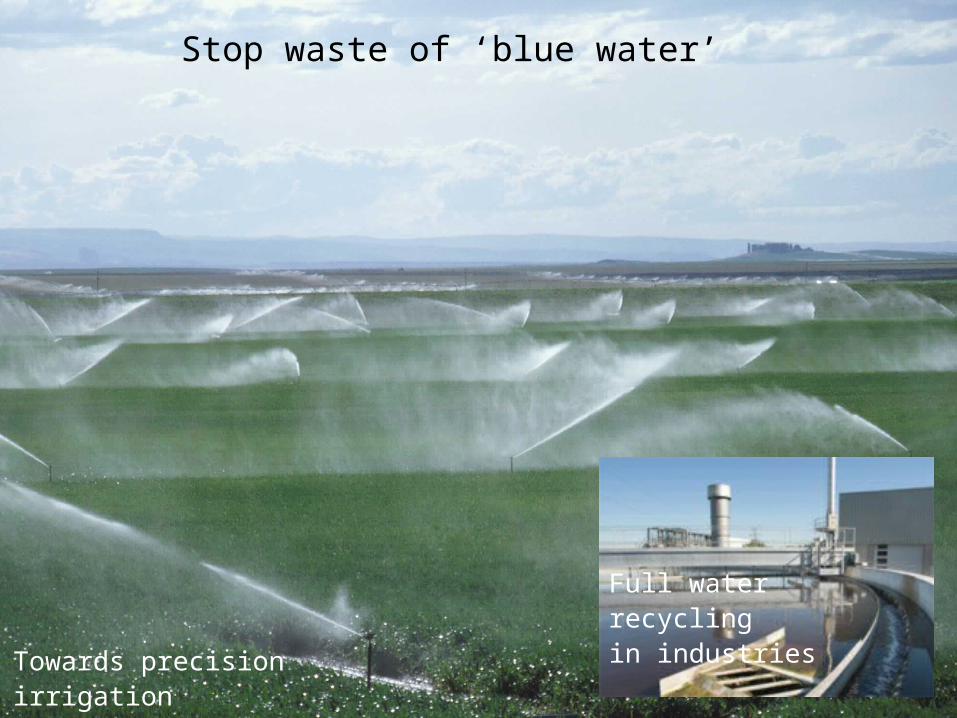
Stop waste of ‘blue water’
Towards precision irrigation
Full water recyclingin industries
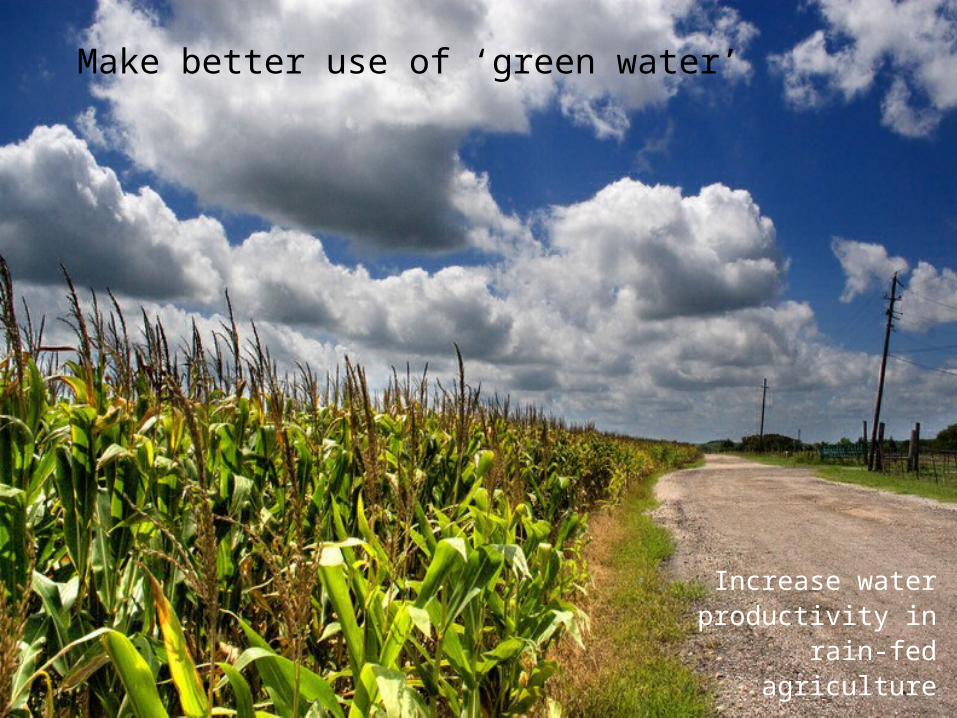
Increase water productivity in
rain-fedagriculture
Make better use of ‘green water’
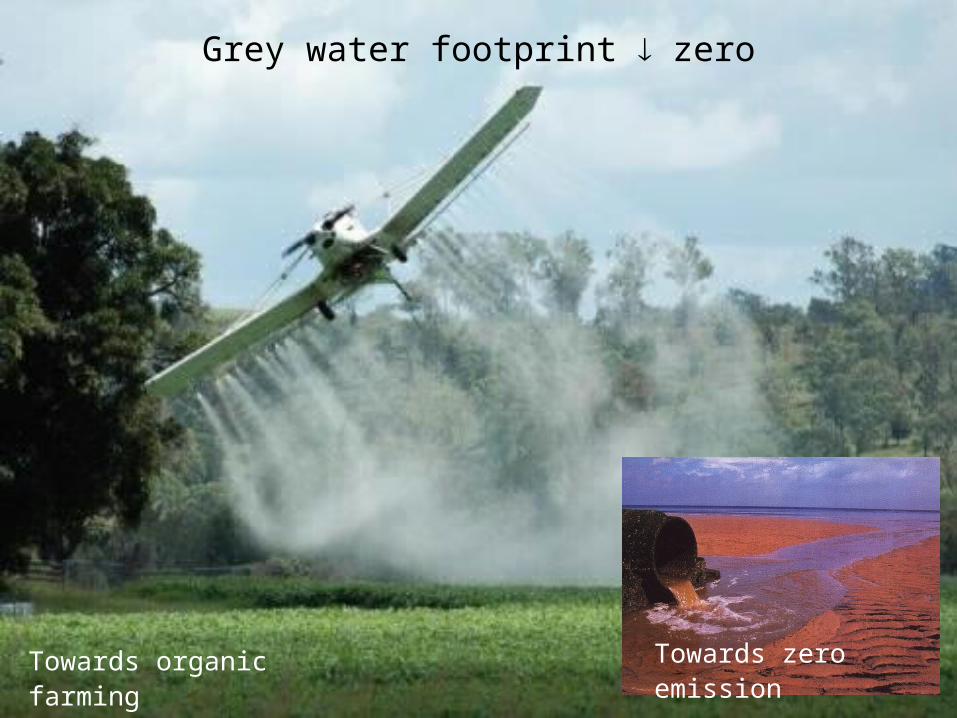
Grey water footprint zero
Towards organic farming Towards zero emission