Embed Size (px)
Citation preview
TRAFFIC IMPACT STUDY FOR:
THE WALMART MARKET CITY OF MILWAUKEE, MILWAUKEE COUNTY, WISCONSIN
DATE SUBMITTED: March 31, 2011
PREPARED FOR: McClure Engineering Associates, Inc. 5417 North 118th Court Milwaukee, WI 53225 Phone: (414) 616-4880 Contact Person: Justin Johnson, P.E. PREPARED BY: Traffic Analysis & Design, Inc. N36 W7505 Buchanan Street Cedarburg, WI 53012 Phone: (800) 605-3091 Contact Person: Michael May, P.E., PTOE (WisDOT TIA Certification # SE05-804-030) “I certify that this Traffic Impact Analysis has been prepared by me or under my immediate supervision and that I have experience and training in the field of traffic and transportation engineering.” ______________________ Michael May, P.E., PTOE Wisconsin Registration #37622-006 Traffic Analysis & Design, Inc.

The Walmart Market Traffic Impact Analysis
Table of Contents LIST OF EXHIBITS ....................................................................................................................... ii
LIST OF APPENDICES ................................................................................................................ iii
CHAPTER I – INTRODUCTION & EXECUTIVE SUMMARY..................................................1
Part A – Purpose of Report and Study Objectives .......................................................................1
Part B – Study Area & Development Description .......................................................................1
Part C – Recommended Improvements .......................................................................................2
Part D – Neighborhood Concerns ................................................................................................4
Part E – Conclusion .....................................................................................................................6
CHAPTER II – PROPOSED DEVELOPMENT .............................................................................7
Part A – On-Site Development ....................................................................................................7
Part B – Study Area .....................................................................................................................7
Part C – Off-Site Development ....................................................................................................8
Part D – Site Accessibility ...........................................................................................................8
CHAPTER III – ANALYSIS OF EXISTING CONDITIONS ......................................................10
Part A – Existing Physical Characteristics .................................................................................10
Part B – Existing/Background Traffic Volumes ........................................................................10
Part C – Background Traffic Level of Service ..........................................................................10
Part D – Sources of Data ............................................................................................................11
CHAPTER IV – DEVELOPMENT TRAFFIC .............................................................................12
Part A – Development Traffic Forecasting ................................................................................12
Part B – Determination of Total Traffic ....................................................................................12
CHAPTER V – ANALYSIS OF TOTAL TRAFFIC CONDITIONS...........................................13
Part A – Total Traffic Capacity Level of Service ......................................................................13
Part B – Queueing Analysis .......................................................................................................13
Part C – Intersection Sight Distance ..........................................................................................13
CHAPTER VI – RECOMMENDATIONS AND CONCLUSION ...............................................16
Part A – Recommended Improvements .....................................................................................16
Part B – Neighborhood Concerns ..............................................................................................18
Part C – Conclusion ...................................................................................................................19
The Walmart Market - Milwaukee, Wisconsin March 31, 2011
Traffic Analysis & Design, Inc.
ii
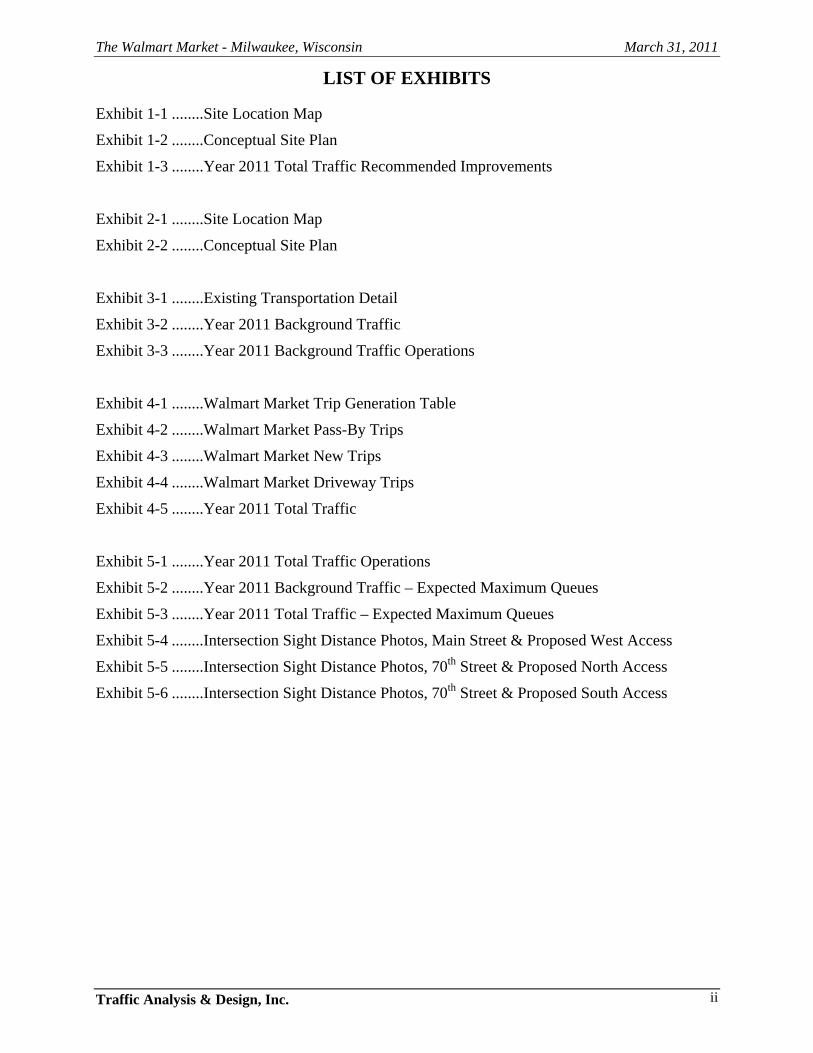
LIST OF EXHIBITS
Exhibit 1-1 ........Site Location Map
Exhibit 1-2 ........Conceptual Site Plan
Exhibit 1-3 ........Year 2011 Total Traffic Recommended Improvements
Exhibit 2-1 ........Site Location Map
Exhibit 2-2 ........Conceptual Site Plan
Exhibit 3-1 ........Existing Transportation Detail
Exhibit 3-2 ........Year 2011 Background Traffic
Exhibit 3-3 ........Year 2011 Background Traffic Operations
Exhibit 4-1 ........Walmart Market Trip Generation Table
Exhibit 4-2 ........Walmart Market Pass-By Trips
Exhibit 4-3 ........Walmart Market New Trips
Exhibit 4-4 ........Walmart Market Driveway Trips
Exhibit 4-5 ........Year 2011 Total Traffic
Exhibit 5-1 ........Year 2011 Total Traffic Operations
Exhibit 5-2 ........Year 2011 Background Traffic – Expected Maximum Queues
Exhibit 5-3 ........Year 2011 Total Traffic – Expected Maximum Queues
Exhibit 5-4 ........Intersection Sight Distance Photos, Main Street & Proposed West Access
Exhibit 5-5 ........Intersection Sight Distance Photos, 70th Street & Proposed North Access
Exhibit 5-6 ........Intersection Sight Distance Photos, 70th Street & Proposed South Access

The Walmart Market - Milwaukee, Wisconsin March 31, 2011
Traffic Analysis & Design, Inc.
iii
LIST OF APPENDICES
Appendix A .......Traffic
Existing Traffic Counts Existing Traffic Signal Timings
Appendix B .......Year 2011 Background Traffic – Analysis Outputs
Appendix C .......Year 2011 Total Traffic – Analysis Outputs

CHAPTER I – INTRODUCTION & EXECUTIVE SUMMARY
PART A – PURPOSE OF REPORT AND STUDY OBJECTIVES
A Walmart Market is proposed to be located southwest of the South 70th Street intersection with West Main Street in the City of Milwaukee. To ensure a safe and efficient roadway network upon completion of the store, Traffic Analysis & Design, Inc. conducted this traffic impact analysis (TIA) to determine the expected weekday evening and Saturday midday peak hour operating conditions and recommendations at the study area intersections both with and without the proposed development.
This report documents the procedures, findings and conclusions of the TIA. The analysis identifies recommended improvements based on existing intersection geometrics, background traffic volumes, and additional traffic expected to be generated by the Walmart Market.
PART B – STUDY AREA & DEVELOPMENT DESCRIPTION
The executive summary includes a description of the study area, description of the development and conclusions based on the findings of the TIA.
B1. Location of Study Site with Respect to Area Roadway Network
A street map illustrating the location of the proposed Walmart Market is shown in Exhibit 1-1 at the end of this chapter. A copy of the conceptual site plan is shown in Exhibit 1-2. The study area includes the following existing intersections:
Main Street & 76th Street (traffic signal);
Main Street & 75th Street (two-way stop control);
Main Street & 74th Street (two-way stop control):
Main Street & 73rd Street (two-way stop control);
Main Street & 72nd Street (two-way stop control);
Main Street & 71st Street (two-way stop control);
Main Street & Public Alley (two-way stop control);
Main Street & 70th Street (traffic signal control); and
70th Street & Dickinson Street (two-way stop control).
Access points to the Walmart Market are discussed later in this chapter and are also referred to as study area intersections.
The proposed development site is an unutilized, deteriorated parking lot bound by Main Street to the north, 72nd Street to the west, a multi-use trail (former railroad) to the south, and a public alley to the east. Jetz gas station/convenience store, Air Comfort Systems, Krause Auto Body, and other small commercial businesses are located between the public alley and the west side of 70th Street. Residential neighborhoods are located along the north side of Main Street, and Roman Electric is located along the east side of 70th Street.
B2. On-Site Development Description
The Walmart Market is to be a 39,994 square foot (sf) grocery store with drive-thru pharmacy. No developable outlots are proposed. This traffic study assumes the store will be constructed and operational in Year 2011.
Vehicular access to the Walmart Market site is proposed to be located along Main Street opposite 71st Street (west access), along 70th Street approximately halfway between Main Street and Dickinson Street (north access), and along 70th Street opposite Dickinson Street (south

The Walmart Market - Milwaukee, Wisconsin March 31, 2011
Traffic Analysis & Design, Inc.
2
access). An existing north-south alley that intersects Main Street between 71st Street and 70th Street will remain. Note that the Krause Auto Body building and the two business buildings south of Jetz gas station/convenience store will be removed to accommodate the access points to 70th Street. Jetz gas station/convenience store and the Air Comfort Systems business will remain.
Pedestrian connections are planned for the Walmart Market to/from both Main Street and 70th Street. Bicycle racks are also planned, as is a connection to the multi-use trail to the south.
Milwaukee County Transit Service Route 76, which connects Brown Deer, Milwaukee, West Allis, Greenfield and Greendale, currently travels along both 70th Street and 76th Street within the study area and will be operationally unaffected by the Walmart Market. Note that Route 44 – National Flyer and Route 44U – Fairpark-Whitnall UBUS also travel along 76th Street and will be operationally unaffected by the Walmart Market.
B3. Off-Site Development Description
No planned off-site development was identified. Note that the City of Milwaukee plans to reconstruct 70th Street and resurface Main Street in Year 2011.
B4. Site Generated Traffic
Traffic volumes expected to be generated by the Walmart Market are based on the type and density of the proposed land use, and on trip rates as published in the Institute of Transportation Engineer’s (ITE) Trip Generation Manual, 8th Edition, 2008. This manual is accepted in Wisconsin and the rest of the country as the industry standard in estimating trips to/from various land uses – including grocery stores like the Walmart Market.
The proposed Walmart Market is expected to generate approximately 125 new trips to/from the study area during a typical weekday morning peak hour (80 in/45 out), 340 new trips to/from the study area during a typical weekday evening peak hour (175 in/165 out) and 350 new trips to/from the study area during a typical Saturday midday peak hour (180 in/170 out). On a typical weekday (24 hour period), the Walmart Market is expected to generate approximately 3,270 new trips (1,635 in/1,635 out).
Based on discussions with Walmart Market Operations, the Walmart Market site is expected to be serviced by between 15 and 20 delivery vehicles on a given day. The deliveries are distributed throughout the day for logistical purposes. All trucks to/from the Walmart Market will be accommodated and focused at the south access along 70th Street.
PART C – RECOMMENDED IMPROVEMENTS
C1. Level of Service Definition
The study area intersections were analyzed based on the procedures set forth in the 2000 Highway Capacity Manual (HCM). This manual is accepted in Wisconsin and the rest of the country as the industry standard in estimating operations at both signalized and unsignalized intersections.
Intersection operation is defined by “level of service” (LOS), a quantitative measure that refers to the overall quality of flow at an intersection ranging from very good, represented by LOS ‘A’, to very poor, represented by LOS ‘F’. LOS D or better operations (fewer than 35-seconds of average vehicle delay at stop sign controlled intersections, fewer than 55-seconds of average vehicle delay at traffic signal controlled intersections) are defined as acceptable peak hour operating conditions.

The Walmart Market - Milwaukee, Wisconsin March 31, 2011
Traffic Analysis & Design, Inc.
3
C2. Year 2011 Background Traffic Recommended Improvements
The Year 2011 background traffic analysis assumes the Walmart Market does not occur. The analysis was conducted using existing intersection geometrics, traffic controls and signal timings. Based on the capacity analysis, no improvements are necessary to accommodate operations under background traffic volumes. Traffic signalized intersections operate acceptably at LOS C or better conditions. Stop-sign controlled intersections along Main Street operate acceptably at LOS B or better conditions.
Note that the City of Milwaukee should consider replacing the bridge rail along the east side of 70th Street, south of Dickinson Street, with a more see-through solution to improve sight-distance for motorists currently turning from Dickinson Street onto 70th Street. This improvement, which is not related to the Walmart Market in any way, would address an existing sight distance concern for the neighborhood east of 70th Street.
C3. Year 2011 Total Traffic Recommended Improvements
Year 2011 total traffic volumes assume the full build-out of the Walmart Market. The following improvements, shown in Exhibit 1-3, are recommended to accommodate the Year 2011 total traffic.
Main Street & 76th Street
No improvements are anticipated to be necessary.
Main Street & 75th Street
No improvements are anticipated to be necessary.
Main Street & 74th Street
No improvements are anticipated to be necessary.
Main Street & 73rd Street
No improvements are anticipated to be necessary.
Main Street & 72nd Street
No improvements are anticipated to be necessary.
Main Street & 71st Street/Proposed West Access
Construct the Walmart Market west access on the south side of Main Street opposite 71st Street. No exclusive turn lanes are necessary.
Install a stop sign to control the Walmart Market northbound approach. Note that “DO NOT ENTER” signs currently exist along the north side of Main Street to inform motorists exiting the site that 71st Street is one-way southbound only.
Main Street & Public Alley
Install a stop sign to control the public alley northbound approach.
Main Street & 70th Street
No improvements are anticipated to be necessary.

The Walmart Market - Milwaukee, Wisconsin March 31, 2011
Traffic Analysis & Design, Inc.
4
70th Street & Proposed North Access
Construct the Walmart Market north access on the west side of 70th Street approximately half-way between Main Street and Dickinson Street. No exclusive turn lanes are necessary.
Install a stop sign to control the Walmart Market eastbound approach.
70th Street & Proposed South Access
Construct the Walmart Market south access on the west side of 70th Street opposite Dickinson Street. No exclusive turn lanes are necessary.
Install a stop sign to control the Walmart Market eastbound approach. Note that poor sight-distance exists at the access looking south for passenger vehicles, but not for delivery trucks, due to the height of the existing bridge abutment/railing on the west side of 70th Street. Install a MUTCD-compliant “RIGHT-TURN ONLY” sign with an additional sign stating “EXCEPT DELIVERY TRUCKS” to improve the safety of the intersection.
General Improvements
Recall that the Jetz gas station/convenience store and Air Comfort Systems business are expected to remain when the Walmart Market access points to 70th Street are constructed. Both businesses, as well as the Roman Electric business on the east side of 70th Street, have off-site parking accommodations. Consideration may be given to removing parking on the west side of 70th Street to improve visibility for motorists exiting the Walmart Market, Jetz, and HVAC sites. Consideration may also be given to removing parking on the south side of Main Street along the Walmart Market property to improve visibility for motorists exiting the west access and the existing public alley.
The traffic-signalized intersections are expected to continue to operate acceptably at LOS C or better conditions. Stop-sign controlled intersections along Main Street are expected to continue to operate acceptably at LOS B or better conditions. These operations make sense, as 1) Main Street currently services low volumes of traffic to/from the neighborhoods to the north and 2) the Walmart Market site adds a relatively low incremental increase in traffic to Main Street. Traffic exiting the north access along 70th Street is expected to operate acceptably at LOS D or better conditions, and traffic exiting the south access along 70th Street is expected to operate acceptably at LOS B or better conditions.
PART D – NEIGHBORHOOD CONCERNS
A public information meeting (PIM) was conducted for the Walmart Market site at Juneau High School on February 28th, 2011. Representatives of the property owner, representatives of Walmart Market, and representatives of the City of Milwaukee were present to take note of the concerns of the surrounding residents. This section of the report is provided to address traffic-related concerns raised at the meeting that relate to the Walmart Market.
D1. Truck Traffic on Main Street
Residents at the February PIM stated they had concerns with Walmart delivery truck traffic along Main Street, as well as truck headlights directed northbound into homes. Note that the conceptual site plan at the time included a truck access along Main Street between 71st Street and 72nd Street, as well as loading docks along the west side of the building with trucks positioned facing north towards Main Street.

The Walmart Market - Milwaukee, Wisconsin March 31, 2011
Traffic Analysis & Design, Inc.
5
To address this concern, the latest Walmart Market site plan has been reconfigured in a manner that will only accommodate delivery trucks along 70th Street. More specifically, the loading docks have been placed along the south side of the proposed building with trucks positioned facing south, the truck access along Main Street between 71st Street and 72nd Street has been removed, and the internal site layout is such that delivery trucks will not be able to physically make turns within the site to reach Main Street. With the IH-94 interchange with 70th Street to the north, truck drivers will not use Main Street to reach their destinations since it is much faster and convenient to utilize the 70th Street interchange.
D2. Walmart Market Traffic on Residential Streets
A concern was raised at the February PIM that Walmart Market would increase traffic on residential streets north of Main Street.
Motorists take the path of least perceived resistance to reach their destinations. As such, traffic to/from IH-94 will access the Walmart Market site most efficiently from the 70th Street interchange rather than from the 84th Street interchange/ramp collector system due to fewer stops and conflicts. Traffic to/from the north and south on 76th Street and 70th Street would access the site most efficiently from the 76th Street and 70th Street intersections with Main Street rather than the ramp collector system or neighborhoods for the same reasons. Therefore, it reasonable to expect that the only Walmart Market traffic anticipated to utilize the residential streets north of Main Street would be that traffic generated by the residents themselves.
D3. Traffic Signal Wait Times
A concern was raised at the February PIM that it takes multiple cycles to clear the traffic signals from Main Street to either 70th Street or 76th Street during rush hours, and that Walmart Market traffic would make wait times considerably longer.
Site observations and the traffic analysis performed at both intersections show that such an operation does not occur during rush hours. A relatively short surge in traffic due to an office release or the egress of Dawes heavy vehicles (both located along Main Street) may occur from time to time during the day and cause a motorist to miss a signal cycle. However, the analysis shows that these operations are not exacerbated by the Walmart Market site – even during its busiest hours of the day – and that outside of these short and few surges the signals operate acceptably at LOS C or better conditions.
D4. State Fair Park Special Event Traffic
Residents at the February PIM stated they experience heavy traffic due to State Fair Park events – most notably during the 11 days of State Fair. Residents stated that traffic utilizing Main Street is heavy during this time and makes it difficult for them to enter/exit the neighborhood. The stated concern of residents is that the Walmart Market site will further add to the congestion and make it more difficult to enter/exit the neighborhood during such an event.
It is important to note that the Wisconsin State Fair is a special 11-day event and that restricting development to accommodate traffic that occurs for only 3-percent of the year is generally undesirable. It is also important to note that the Walmart Market contribution of traffic to Main Street is minimal compared to the volume expected due to State Fair and that the remaining 97-percent of the year operations are well within acceptable operation levels/available roadway capacity. That being stated, Main Street is currently utilized as a two-lane undivided street with wide parking lanes, and the homes within the neighborhood have private garages/parking areas for personal vehicles. Consideration could be given to restricting parking along Main Street during the short 11-day event, and adjust traffic signal timings accordingly, to aid in moving traffic to/from State Fair Park and the neighborhoods. Such an improvement suggestion is not
The Walmart Market - Milwaukee, Wisconsin March 31, 2011
Traffic Analysis & Design, Inc.
6
caused by the Walmart Market, but is suggested by Traffic Analysis & Design, Inc. for the City of Milwaukee’s consideration in easing an existing State Fair traffic condition.
PART E – CONCLUSION
All movements at the study area intersections are expected to operate safely and efficiently with the improvements identified in this TIA.

03-31-11
EXHIBIT 1-1
SITE LOCATION MAP - WALMART MARKET
MILWAUKEE, WISCONSIN
N
NOT TO SCALE
ProposedWalmart
Market Site

03-31-11
EXHIBIT 1-2
CONCEPTUAL SITE PLAN - WALMART MARKET
MILWAUKEE, WISCONSIN
N
NOT TO SCALE

PROPOSED
NORTH ACCESS
PU
BL
IC
AL
LE
Y
MAIN STREET
76th
ST
RE
ET
74th
ST
RE
ET
PA
RK
ING
LO
T
72n
d S
TR
EE
T
70th
ST
RE
ET
LEGEND
XX’(+XX’)N/C
Traffic SignalStop SignLane ConfigurationRecommended Lane ConfigurationTurn Bay Length (in Feet)Change over PreviousNo Change
EXHIBIT 1-3
YEAR 2011 TOTAL TRAFFIC: RECOMMENDED IMPROVEMENTS
MILWAUKEE, WISCONSIN
75th
ST
RE
ET
73rd
ST
RE
ET
71st
ST
RE
ET
100’
(N/C
)
(N/C
) 95
’
DICKINSON
STREET
MAIN STREET
ON
E W
AY
PR
OP
OS
ED
WE
ST
AC
CE
SS
PROPOSED
SOUTH ACCESS
* Install “STOP” sign on west leg.
* Install “STOP” sign on south leg.
* Install “STOP” sign on south leg.
* Install “STOP” sign on west leg.* Install “RIGHT-TURN ONLY” and
“EXCEPT DELIVERY TRUCKS”signs on west leg.
N
NOT TO SCALE
Multi-Use
Trail
03-31-11

The Walmart Market - Milwaukee, Wisconsin March 31, 2011
Traffic Analysis & Design, Inc.
7
CHAPTER II – PROPOSED DEVELOPMENT
PART A – ON-SITE DEVELOPMENT
A1. Development Site Location
A Walmart Market is proposed to be located southwest of the South 70th Street intersection with West Main Street in the City of Milwaukee. A street map illustrating the location of the proposed is shown in Exhibit 2-1 at the end of this chapter. A copy of the conceptual site plan is shown in Exhibit 2-2.
A2. Surrounding Land Use
The proposed development site is an unutilized, deteriorated parking lot bound by Main Street to the north, 72nd Street to the west, a multi-use trail (former railroad) to the south, and a public alley to the east. Jetz gas station/convenience store, Air Comfort Systems, Krause Auto Body, and other small commercial businesses are located between the public alley and the west side of 70th Street. Residential neighborhoods are located along the north side of Main Street, and Roman Electric is located along the east side of 70th Street.
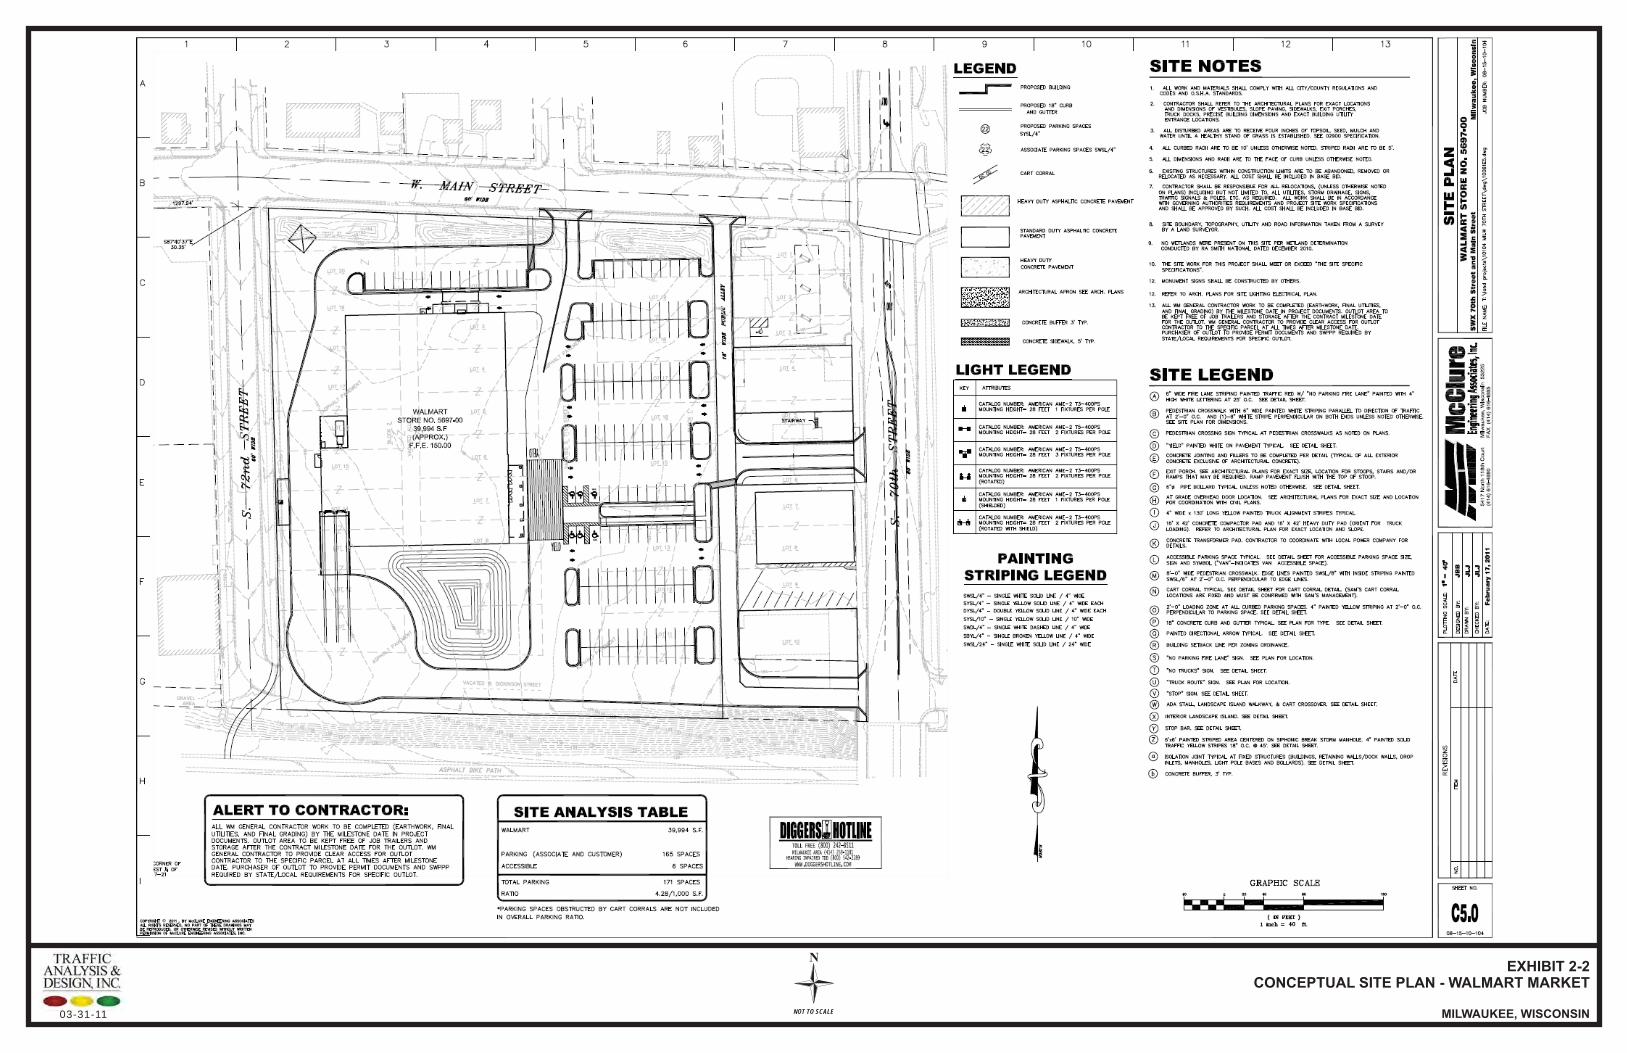
A3. Conceptual Site Plan & Phasing/Timing
The Walmart Market is to be a 39,994 square foot (sf) grocery store with drive-thru pharmacy. No developable outlots are proposed. This traffic study assumes the store will be constructed and operational in Year 2011.
Vehicular access to the Walmart Market site is proposed to be located along Main Street opposite 71st Street (west access), along 70th Street approximately halfway between Main Street and Dickinson Street (north access), and along 70th Street opposite Dickinson Street (south access). An existing north-south alley that intersects Main Street between 71st Street and 70th Street will remain. Note that the Krause Auto Body building and the two business buildings south of Jetz gas station/convenience store will be removed to accommodate the access points to 70th Street. Jetz gas station/convenience store and the Air Comfort Systems business will remain.
Pedestrian connections are planned for the Walmart Market to/from both Main Street and 70th Street. Bicycle racks are also planned, as is a connection to the multi-use trail to the south.
PART B – STUDY AREA
B1. Influence Area
The area of primary influence for Walmart Market includes surrounding neighborhoods in the City of Milwaukee and the City of West Allis.
B2. Area of Traffic Impact
The study area includes the following existing intersections:
Main Street & 76th Street (traffic signal);
Main Street & 75th Street (two-way stop control);
Main Street & 74th Street (two-way stop control):
Main Street & 73rd Street (two-way stop control);
Main Street & 72nd Street (two-way stop control);
Main Street & 71st Street (two-way stop control);
Main Street & Public Alley (two-way stop control);
Main Street & 70th Street (traffic signal control); and
The Walmart Market - Milwaukee, Wisconsin March 31, 2011
Traffic Analysis & Design, Inc.
8
70th Street & Dickinson Street (two-way stop control).
Access points to the Walmart Market, described previously, are also referred to as study area intersections.
PART C – OFF-SITE DEVELOPMENT
No planned off-site development was identified. Note that the City of Milwaukee plans to reconstruct 70th Street and resurface Main Street in Year 2011.
PART D – SITE ACCESSIBILITY
D1. Study Area Roadways
The study area roadways are discussed below:
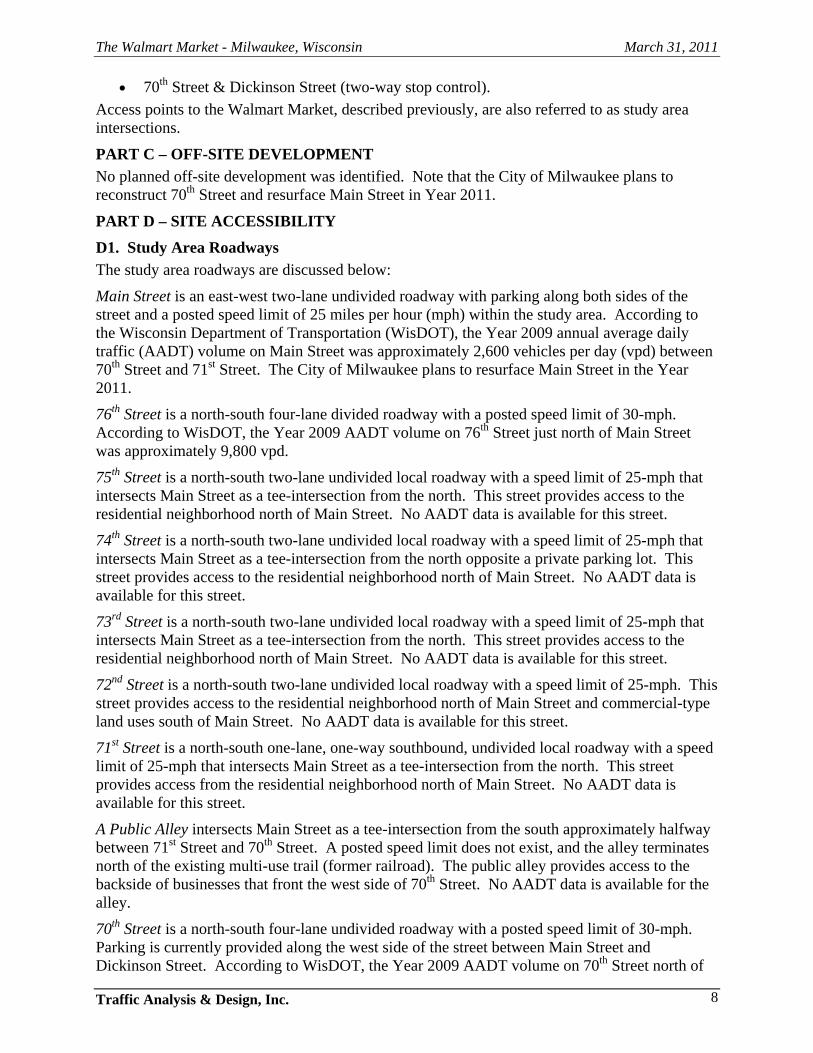
Main Street is an east-west two-lane undivided roadway with parking along both sides of the street and a posted speed limit of 25 miles per hour (mph) within the study area. According to the Wisconsin Department of Transportation (WisDOT), the Year 2009 annual average daily traffic (AADT) volume on Main Street was approximately 2,600 vehicles per day (vpd) between 70th Street and 71st Street. The City of Milwaukee plans to resurface Main Street in the Year 2011.
76th Street is a north-south four-lane divided roadway with a posted speed limit of 30-mph. According to WisDOT, the Year 2009 AADT volume on 76th Street just north of Main Street was approximately 9,800 vpd.
75th Street is a north-south two-lane undivided local roadway with a speed limit of 25-mph that intersects Main Street as a tee-intersection from the north. This street provides access to the residential neighborhood north of Main Street. No AADT data is available for this street.
74th Street is a north-south two-lane undivided local roadway with a speed limit of 25-mph that intersects Main Street as a tee-intersection from the north opposite a private parking lot. This street provides access to the residential neighborhood north of Main Street. No AADT data is available for this street.
73rd Street is a north-south two-lane undivided local roadway with a speed limit of 25-mph that intersects Main Street as a tee-intersection from the north. This street provides access to the residential neighborhood north of Main Street. No AADT data is available for this street.
72nd Street is a north-south two-lane undivided local roadway with a speed limit of 25-mph. This street provides access to the residential neighborhood north of Main Street and commercial-type land uses south of Main Street. No AADT data is available for this street.
71st Street is a north-south one-lane, one-way southbound, undivided local roadway with a speed limit of 25-mph that intersects Main Street as a tee-intersection from the north. This street provides access from the residential neighborhood north of Main Street. No AADT data is available for this street.
A Public Alley intersects Main Street as a tee-intersection from the south approximately halfway between 71st Street and 70th Street. A posted speed limit does not exist, and the alley terminates north of the existing multi-use trail (former railroad). The public alley provides access to the backside of businesses that front the west side of 70th Street. No AADT data is available for the alley.
70th Street is a north-south four-lane undivided roadway with a posted speed limit of 30-mph. Parking is currently provided along the west side of the street between Main Street and Dickinson Street. According to WisDOT, the Year 2009 AADT volume on 70th Street north of

The Walmart Market - Milwaukee, Wisconsin March 31, 2011
Traffic Analysis & Design, Inc.
9
Main Street was approximately 15,900 vpd. The Year 2008 AADT volume on 70th Street south of Dickinson Street was approximately 14,100 vpd. The City of Milwaukee plans to reconstruct 70th Street in the Year 2011.
Dickinson Street is an east-west two-lane undivided roadway with a posted speed limit of 25-mph that intersects 70th Street as a tee intersection from the east. This street provides access to the residential neighborhood east of 70th Street. No AADT data is available for this street.
D2. Existing Alternative Modes of Transportation
Pedestrian sidewalks are currently located along the both sides of Main Street, 70th Street, 71st Street, 72nd Street, 73rd Street, 74th Street, 75th Street, and 76th Street. No dedicated pedestrian facilities are provided along Dickinson Street. A multi-use trail exists on a former railroad right-of-way that runs east-west south of Dickinson Street. No other bicycle accommodations are provided.
Milwaukee County Transit Service Route 76, which connects Brown Deer, Milwaukee, West Allis, Greenfield and Greendale, currently travels along both 70th Street and 76th Street within the study area. Route 44 – National Flyer and Route 44U – Fairpark-Whitnall UBUS also travel along 76th Street.

03-31-11
EXHIBIT 2-1
SITE LOCATION MAP - WALMART MARKET
MILWAUKEE, WISCONSIN
ProposedWalmart
Market Site
N
NOT TO SCALE
03-31-11
EXHIBIT 2-2
CONCEPTUAL SITE PLAN - WALMART MARKET
MILWAUKEE, WISCONSIN
N
NOT TO SCALE

The Walmart Market - Milwaukee, Wisconsin March 31, 2011
Traffic Analysis & Design, Inc.
10
CHAPTER III – ANALYSIS OF EXISTING CONDITIONS
PART A – EXISTING PHYSICAL CHARACTERISTICS
Exhibit 3-1 shows the existing transportation detail for the study area intersections. More specifically, the exhibit illustrates intersection lane configurations, intersection traffic controls, posted speed limits, and approximate intersection spacing.
PART B – EXISTING/BACKGROUND TRAFFIC VOLUMES
Weekday evening and Saturday midday peak hour turning movement counts were conducted prior to conducting any traffic analysis. The following table summarizes the date each count was conducted.
Intersection: Weekday PM Saturday MID
Main Street & 76th Street 1/13/2011 1/15/2011 Main Street & 75th Street 1/13/2011 1/15/2011 Main Street & 74th Street 1/11/2011 1/15/2011 Main Street & 73rd Street 1/12/2011 1/15/2011 Main Street & 72nd Street 1/12/2011 1/15/2011 Main Street & 71st Street 1/12/2011 1/15/2011 Main Street & 70th Street 1/13/2011 1/15/2011
70th Street & Dickinson Street 1/13/2011 1/15/2011
The weekday evening and Saturday midday peak hours were determined to be 4:30 to 5:30pm and 11:15am to 12:15pm. Copies of the existing traffic counts and related calculations are included in Appendix A.
The development is planned to be built in the Year 2011. Therefore, no growth rate was applied to the existing traffic volumes. However, since the counts were conducted in January of 2011, the counts were seasonally adjusted then balanced using WisDOT seasonal factors for urban collectors. The seasonal growth rate increased the January of 2011 volumes by a factor of 1.087, or an 8.7-percent increase. The seasonally adjusted volumes have been labeled Year 2011 background traffic volumes and are shown in Exhibit 3-2.
PART C – BACKGROUND TRAFFIC LEVEL OF SERVICE
C1. Level of Service Definitions
The study area intersections were analyzed based on the procedures set forth in the 2000 Highway Capacity Manual (HCM). Intersection operation is defined by “level of service”. Level of service (LOS) is a quantitative measure that refers to the overall quality of flow at an intersection ranging from very good, represented by LOS ‘A’, to very poor, represented by LOS ‘F’. For the purpose of this study, LOS D was used to define acceptable peak hour operating conditions. Descriptions of the various levels of service are as follows:
LOS A is the highest level of service that can be achieved. Under this condition, intersection approaches appear quite open, turning movements are easily made, and nearly all drivers find freedom of operation. At signalized and unsignalized intersections, average delays are less than 10 seconds. LOS B represents stable operation. At signalized intersections, average vehicle delays are 10 to 20 seconds. At unsignalized intersections, average delays are 10 to 15 seconds.

The Walmart Market - Milwaukee, Wisconsin March 31, 2011
Traffic Analysis & Design, Inc.
11
LOS C still represents stable operation, but periodic backups of a few vehicles may develop behind turning vehicles. Most drivers begin to feel restricted, but not objectionably so. At signalized intersections, average vehicle delays are 20 to 35 seconds. At unsignalized intersections, average delays are 15 to 25 seconds. LOS D represents increasing traffic restrictions as the intersection approaches instability. Delays to approaching vehicles may be substantial during short peaks within the peak period, but periodic clearance of long lines occurs, thus preventing excessive backups. At signalized intersections, average vehicle delays are 35 to 55 seconds. At unsignalized intersections, average delays are 25 to 35 seconds. LOS E represents the capacity of the intersection. At signalized intersections, average vehicle delays are 55 to 80 seconds. At unsignalized intersections, average delays are 35 to 50 seconds. LOS F represents jammed conditions where the intersection is over capacity and acceptable gaps for unsignalized intersections in the mainline traffic flow are minimal. At signalized intersections, average vehicle delays exceed 80 seconds. At unsignalized intersections, average delays exceed 50 seconds.
C2. Year 2011 Background Traffic Operations – With Improvements
Exhibit 3-3 shows the Year 2011 background traffic (no development) peak hour operating conditions at the study area intersections. The Year 2011 background traffic analysis was conducted using the existing lane configurations shown in Exhibit 3-1, the Year 2011 background traffic volumes shown in Exhibit 3-2, and the existing traffic signal timings obtained from the City of Milwaukee and included in Appendix A.
As shown in Exhibit 3-3, traffic signalized intersections currently operate acceptably at LOS C or better conditions. Stop-sign controlled intersections along Main Street operate acceptably at LOS B or better conditions. The westbound approach of Dickinson Street operates at LOS E conditions for 10 vehicles in the weekday evening peak hour. Since the approach services a low volume of traffic, operates well outside the weekday evening peak hour, has a volume-to-capacity (v/c) ratio of 0.12 (desirably less than 1.00), and alternative access exists via the Main Street intersection with 70th Street, this LOS E condition does not warrant correction.
PART D – SOURCES OF DATA
The following sources of data were obtained for use in conducting this traffic study:
Turning movement traffic counts – Traffic Analysis & Design, Inc.
Existing transportation detail – Traffic Analysis & Design, Inc.
Traffic signal timings & roadway resurfacing/reconstruction projects – City of Milwaukee
On-site development information – McClure Engineering Associates, Inc.
Transit information – Milwaukee County Transit Service via http://www.ridemcts.com

03-31-11
EXHIBIT 3-1
EXISTING TRANSPORTATION DETAIL
MILWAUKEE, WISCONSIN
N
NOT TO SCALE
PU
BL
IC
AL
LE
Y
MAIN STREET
76th
ST
RE
ET
74th
ST
RE
ET
PA
RK
ING
LO
T
72n
d S
TR
EE
T
70th
ST
RE
ET
LEGEND
XX’~XX’
Traffic SignalStop SignLane ConfigurationTurn Bay Length (in Feet)Approximate Intersection Spacing (in Feet)
75th
ST
RE
ET
73rd
ST
RE
ET
71st
ST
RE
ET
100’
95’
DICKINSON
STREET
MAIN STREET
ON
E W
AY
KRAUSE
AUTO BODY
30mph
25mph
25mph
25mph
25mph
25mph
25mph
30mph
Multi-Use
Trail
~340’ ~320’
~320’
~325’ ~325’ ~155’ ~170’
~4
95
’

(60) [25](25) [20](65) [40]
[20] (35)[20] (20)[40] (50)
(35)
[25]
(560
) [2
35]
(35)
[10]
[15]
(20
)[2
55] (
395)
[25]
(40
)
MAIN STREET
76th
ST
RE
ET
(5) [5](125) [70](5) [N]
[N] (N)[55] (80)
[N] (5)
(N)
[5]
(N)
[N]
(N)
[N]
[5] (
25)
[N] (
10)
[N] (
35)
74th
ST
RE
ET
PA
RK
ING
LO
T
(10) [5](120) [65](N) [5]
[5] (5)[45] (105)
[N] (5)
(10)
[5]
(N)
[N]
(5)
[5]
[] (
)5
5[N
] (N
)[5
] (5)
72n
d S
TR
EE
T
70th
ST
RE
ET
LEGEND
(XX)[XX]
N
Weekday Evening Peak Hour (4:30-5:30 PM)Saturday Midday Peak Hour (11:15 AM-12:15 PM)Negligible - Less than 5 vehicles per hour
EXHIBIT 3-2
YEAR 2011 BACKGROUND TRAFFIC
MILWAUKEE, WISCONSIN
75th
ST
RE
ET
[5] (10)[50] (85)
(5) [N](145) [80]
(5)
[5]
(N)
[5]
73rd
ST
RE
ET
[5] (5)[50] (110)
(5) [5](130) [70]
(5)
[5]
(5)
[N]
(125) [70](N) [N]
[60] (130)[N] (N)
(10) [15](65) [25](120) [70]
[25] (60)[35] (70)[40] (45)
(25)
[40]
(465
) [3
65]
(10)
[5]
[35]
(60
)[3
35] (
990)
[60]
(10
0)
KRAUSE
AUTO BODY
DICKINSON
STREET
(5) [5](N) [N](5) [5]
(N)
[N]
(620
) [4
75]
(5)
[5]
[N] (
N)
[440
] (11
80)
[20]
(60
)
MAIN STREET
N
NOT TO SCALE
PU
BL
IC
AL
LE
Y
71st
ST
RE
ET
ON
E W
AY
(125) [70]
[55] (115)
(5)
[5]
(15)
[5]
[N] (N)[N] (N)[N] (N)
[N] (
N)
[N] (
N)
03-31-11

EXHIBIT 3-3
YEAR 2011 BACKGROUND TRAFFIC OPERATIONS
MILWAUKEE, WISCONSIN
LT TH RT LT TH RT LT TH RT LT TH RT
PM C C C C C C A A A A A A
SAT C C C C C C A A A A A A
PM A * - - * * - - - A - A
SAT A * - - * * - - - A - A
PM A * * A * * A A A B B B
SAT A * * A * * A A A A A A
PM A * - - * * - - - A - A
SAT A * - - * * - - - A - A
PM A * * A * * B B B A A A
SAT A * * A * * A A A A A A
PM - * - - * - - - - B - B
SAT - * - - * - - - - A - A
PM - * * A * - A - A - - -
SAT - * * A * - A - A - - -
PM B B B C C C A B B A A A
SAT B B B B B B A A A A A A
PM E1
E1
E1
E2
E2
E2 A * * A * *
SAT C C C B B B A * * A * *
Two-Way
Stop Sign
Main Street & 72nd StreetTwo-Way
Stop Sign
Main Street & 71st StreetTwo-Way
Stop Sign
Main Street & 70th StreetTraffic
Signal
Southbound
Main Street & 76th StreetTraffic
Signal
Main Street & 73rd StreetTwo-Way
Stop Sign
Main Street & Public AlleyTwo-Way
Stop Sign
Main Street & 75th StreetTwo-Way
Stop Sign
Main Street & 74th Street
Year 2011 Background Traffic Operations
With Existing Geometrics and Traffic Control
Intersection
Traffic
Control
Peak
Hour
Level of Service per Movement by Approach
Eastbound Westbound Northbound
2. 9.4-sec of average delay beyond LOS D/E threshold, 10 vehicles. Operational improvements not necessary
1. 4.2-sec of average delay beyond LOS D/E threshold, <5 vehicles. Operational improvements not necessary
Notes: (-) indicates a movement that is not possible or is prohibited. (*) indicates uncontrolled or free-flow movement.
70th Street & Dickinson Street/
Krause Auto Body Access
Two-Way
Stop Sign
03-31-11

The Walmart Market - Milwaukee, Wisconsin March 31, 2011
Traffic Analysis & Design, Inc.
12
CHAPTER IV – DEVELOPMENT TRAFFIC
PART A – DEVELOPMENT TRAFFIC FORECASTING
To address future traffic impacts along study area roadways and at the intersections adjacent to the development, it is necessary to identify the hourly and daily volume of traffic generated by the development. The expected traffic volumes generated by the Walmart Market development are based on the type and size of the proposed land use, and on trip rates as published in the Institute of Transportation Engineer’s (ITE) Trip Generation Manual, 8th Edition, 2008.
A1. Trip Generation & Distribution
The trip generation and distribution for the Walmart Market is shown in Exhibit 4-1. The trip distribution was based on the location of surrounding populated areas and on the existing AADT traffic patterns of the surrounding roadways.
As shown in Exhibit 4-1, the proposed Walmart Market is expected to generate approximately 125 new trips to/from the study area during a typical weekday morning peak hour (80 in/45 out), 340 new trips to/from the study area during a typical weekday evening peak hour (175 in/165 out) and 350 new trips to/from the study area during a typical Saturday midday peak hour (180 in/170 out). On a typical weekday (24 hour period), the Walmart Market is expected to generate approximately 3,270 new trips (1,635 in/1,635 out).
A2. Mode Split
Though accessible to pedestrian, bicycle, and transit users, the primary mode to/from the Walmart Market development is expected to be personal motorized vehicle. Therefore, no trip reductions were taken for other modes. As such, the analysis assumes a more conservative and higher vehicle volume scenario.
A3. Determination of Linked and Pass-by Trip Traffic
Linked trips occur when a patron or employee visits more than one land use within a site without leaving the site. Since no other users are planned for the Walmart Market site, linked trips will not occur.
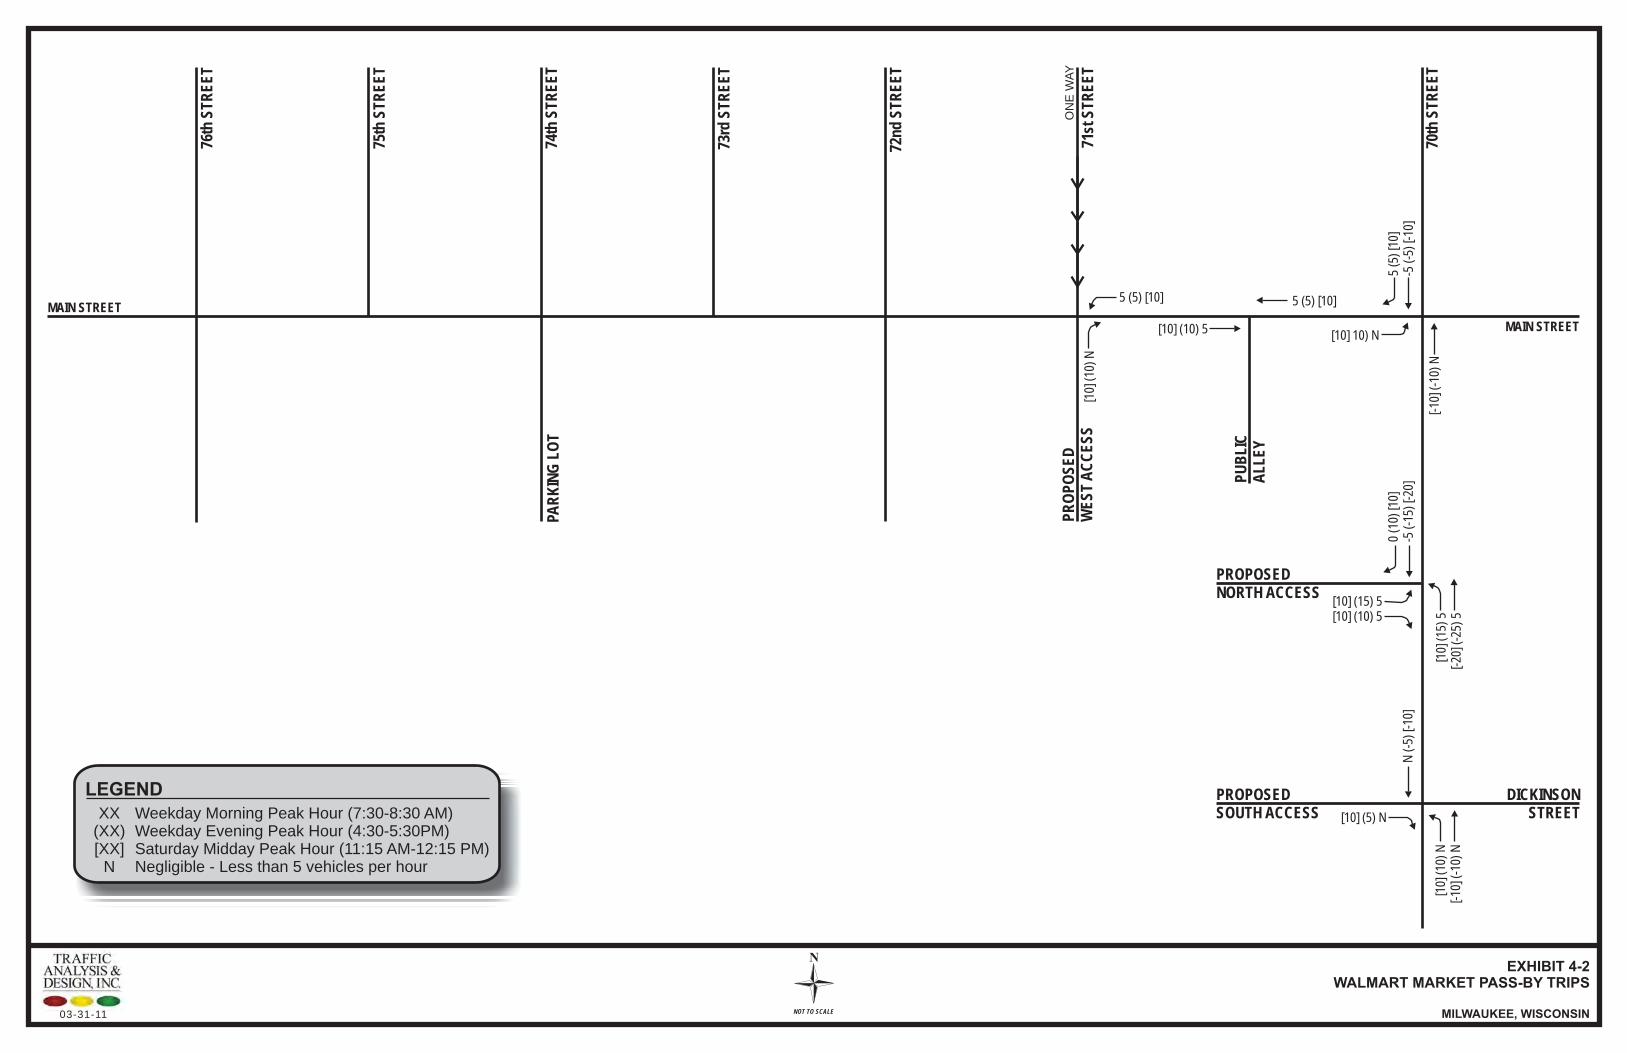
Pass-by trips occur when motorists on the adjacent roadway system stop off at a development prior to continuing on their intended route. For example, a motorist southbound on 70th Street stops at the Walmart Market prior to continuing southbound on 70th Street. Approximately 15-percent of the total driveway trips for the development are expected to be a result of pass-by trips. Per the ITE Trip Generation Manual, this percentage is well within the pass-by rate ranges seen at other grocery stores in the United States. Further, the resulting pass-by trip figures were not allowed to exceed 10-percent of the existing traffic along 70th Street per guidance in the ITE Trip Generation Manual. The Walmart Market pass-by trips are shown in Exhibit 4-2.
A4. Trip Assignment
New trips (i.e. total trips minus linked trips minus pass-by trips) expected to be generated by Walmart Market were assigned based on the trip distribution shown in Exhibit 4-1. The Walmart Market new trips are shown in Exhibit 4-3.
The Walmart Market pass-by trips (Exhibit 4-2) were added to the Walmart Market new trips (Exhibit 4-3) to determine the Walmart Market driveway trips shown in Exhibit 4-4.
PART B – DETERMINATION OF TOTAL TRAFFIC
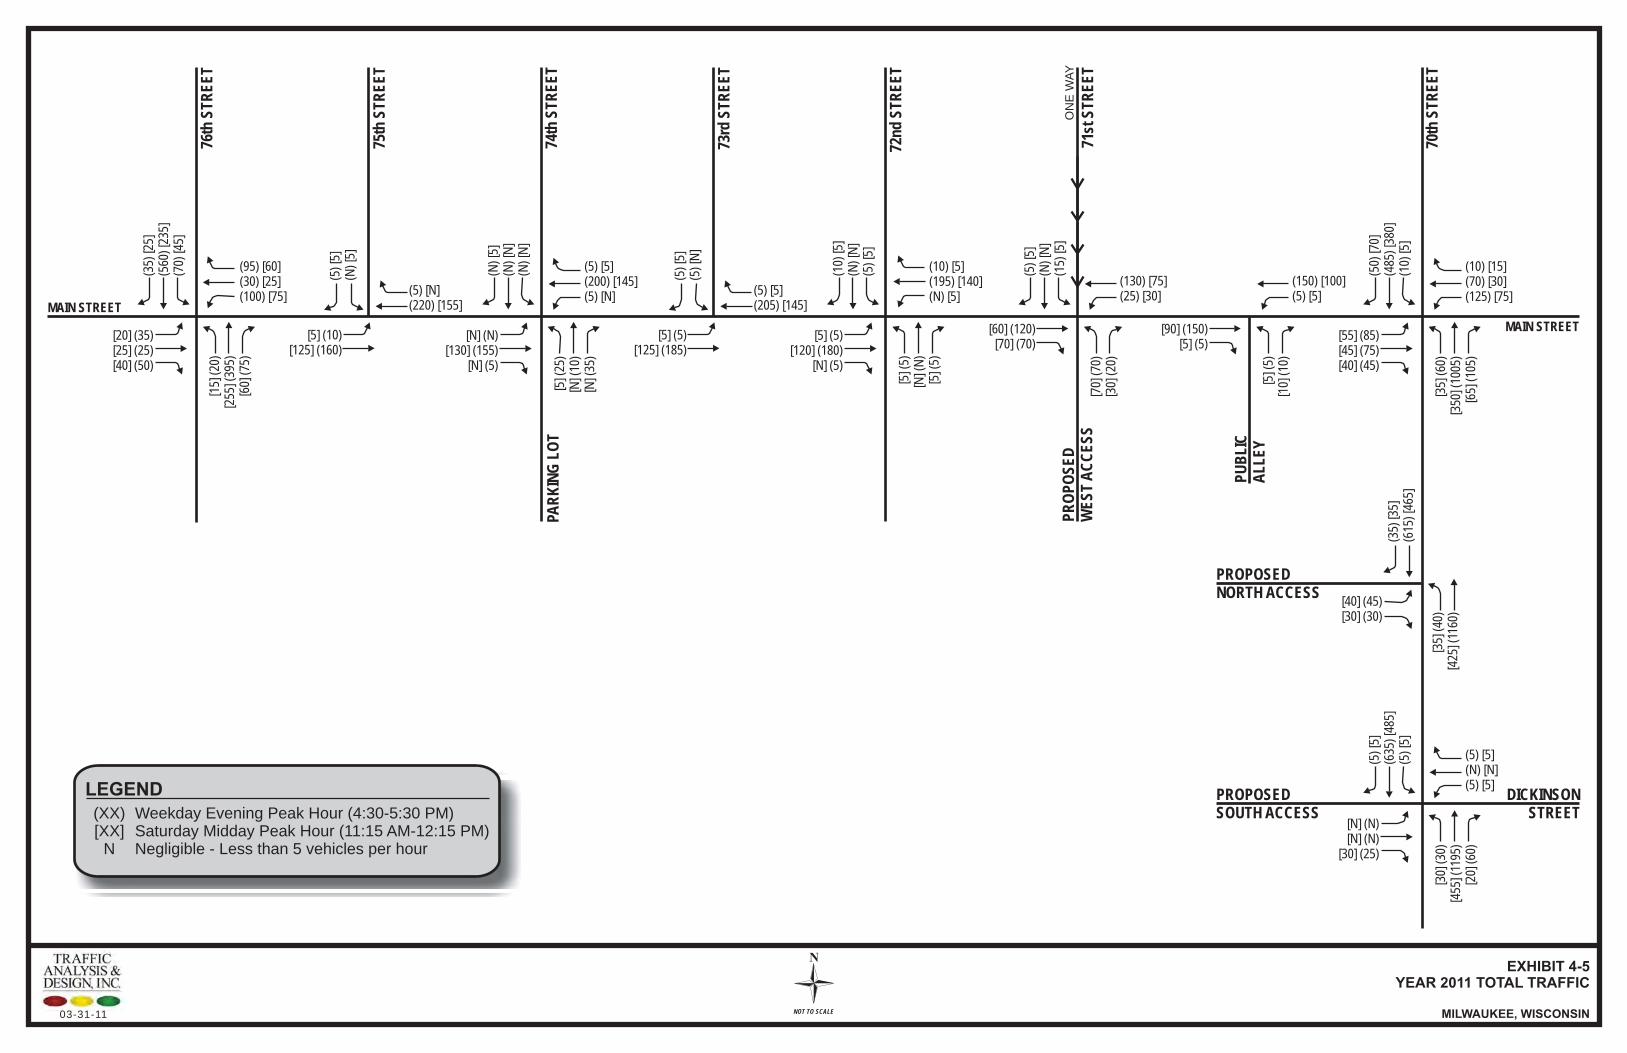
Year 2011 total traffic volumes, shown in Exhibit 4-5, were determined by adding the Year 2011 background traffic volumes (Exhibit 3-2) to the Walmart Market driveway trips (Exhibit 4-4).

03-31-11
EXHIBIT 4-1
WALMART MARKET TRIP GENERATION TABLE
MILWAUKEE, WISCONSIN
In Out Total In Out Total In Out Total
4,090 90 55 145 215 205 420 220 210 430
(102.24) (61%) (39%) (3.59) (51%) (49%) (10.50) (51%) (49%) (10.81)
4,090 90 55 145 215 205 420 220 210 430
Minus Pass-by Trips * 20% 820 10 10 20 40 40 80 40 40 80
3,270 80 45 125 175 165 340 180 170 350
TRIP DISTRIBUTIONNorth on 76th Street 20% 650 15 10 35 35 35 35
South on 76th Street 20% 650 15 10 35 35 35 35
North on 70th Street 25% 820 20 10 45 40 45 45
South on 70th Street 25% 820 20 10 45 40 45 40
West on Main Street 3% 100 5 0 5 5 5 5
East on Main Street 7% 230 5 5 10 10 15 10
100% 3270 80 45 175 165 180 170
Total Correct? TRUE TRUE TRUE TRUE TRUE TRUE TRUE
Total Driveway Trips
Total New Trips
* Pass-by trips taken from driveway trips. The ins/outs were made equal, as every in needs an equal out.
Walmart 850 40 x 1,000 SF
Walmart Market Trip Generation Table
Land Use
ITE
Code Proposed Size
Weekday
Daily
AM Peak PM Peak SAT Peak
MAIN STREET
76th
ST
RE
ET
74th
ST
RE
ET
PA
RK
ING
LO
T
72n
d S
TR
EE
T
PR
OP
OS
ED
WE
ST
AC
CE
SS
70th
ST
RE
ET
EXHIBIT 4-2
WALMART MARKET PASS-BY TRIPS
MILWAUKEE, WISCONSIN
75th
ST
RE
ET
73rd
ST
RE
ET
5 (5) [10]
[10]
(10
) N
[10] 10) N
5 (5
) [1
0]-5
(-5
) [-
10]
[-10
] (-1
0) N
0 (1
0) [1
0]-5
(-1
5) [-
20]
[10]
(15
) 5
[-20
] (-2
5) 5
[10] (15) 5[10] (10) 5
PROPOSED
NORTH ACCESS
PROPOSED
SOUTH ACCESS
DICKINSON
STREET[10] (5) N
N (
-5)
[-10
]
[10]
(10
) N
[-10
] (-1
0) N
MAIN STREET
N
NOT TO SCALE
LEGEND
XX(XX)[XX]
N
Weekday Morning Peak Hour (7:30-8:30 AM)Weekday Evening Peak Hour (4:30-5:30PM)Saturday Midday Peak Hour (11:15 AM-12:15 PM)Negligible - Less than 5 vehicles per hour
PU
BL
IC
AL
LE
Y
71st
ST
RE
ET
ON
E W
AY
5 (5) [10]
[10] (10) 5
03-31-11

10 (35) [35]N (5) [5]10 (35) [35]
[5] (5) 5
15 (
35)
[35]
[35]
(35
) 15
MAIN STREET
76th
ST
RE
ET
74th
ST
RE
ET
PA
RK
ING
LO
T
72n
d S
TR
EE
T
N (5) [5]10 (20) [20]
[5] (5) 5[70] (70) 30
[70]
(70
) 20
[20]
(10
) 5
70th
ST
RE
ET
EXHIBIT 4-3
WALMART MARKET NEW TRIPS
MILWAUKEE, WISCONSIN
75th
ST
RE
ET
20 (75) [75]
73rd
ST
RE
ET
10 (20) [20]5 (5) [5]
[20] (10) 5[5] (5) 5
[5] (
5) N
[10]
(10
) 5
5 (5) [5]N (5) [5]
[20] (15) 5[10] (5) 5
10 (
20)
[20]
10 (
25)
[25]
[25]
(25
) 5
[5] (
5) N
5 (2
5) [2
5]5
(5)
[5]
[25]
(25
) 10
[N] (
N)
N
[30] (30) 5[20] (20) 5
PROPOSED
NORTH ACCESS
PROPOSED
SOUTH ACCESS
DICKINSON
STREET
MAIN STREET[75] (75) 35
N
NOT TO SCALE
PU
BL
IC
AL
LE
Y
71st
ST
RE
ET
ON
E W
AY
PR
OP
OS
ED
WE
ST
AC
CE
SS
LEGEND
XX(XX)[XX]
N
Weekday Morning Peak Hour (7:30-8:30 AM)Weekday Evening Peak Hour (4:30-5:30PM)Saturday Midday Peak Hour (11:15 AM-12:15 PM)Negligible - Less than 5 vehicles per hour
20 (75) [75]
[75] (75) 35
20 (75) [75]
[75] (75) 35
20 (75) [75]
[75] (75) 35
5 (5
) [5
]5
(20)
[20]
[20]
(20
) 10
[25]
(25
) 10
[N] (N) N[20] (20) 5
03-31-11

EXHIBIT 4-4
WALMART MARKET DRIVEWAY TRIPS
MILWAUKEE, WISCONSIN
N
NOT TO SCALE
10 (35) [35]N (5) [5]10 (35) [35]
[5] (5) 5
15 (
35)
[35]
[35]
(35
) 15
MAIN STREET
76th
ST
RE
ET
74th
ST
RE
ET
PA
RK
ING
LO
T
72n
d S
TR
EE
T
N (5) [5]15 (25) [30]
[5] (5) 5[70] (70) 30
[70]
(70
) 20
[30]
(20
) 5
70th
ST
RE
ET
75th
ST
RE
ET
20 (75) [75]
73rd
ST
RE
ET
15 (25) [30]5 (5) [5]
[30] (20) 5[5] (5) 5
[5] (
5) N
[10]
(10
) 5
5 (5) [5]N (5) [5]
[30] (25) 5[10] (5) 5
15 (
25)
[30]
5 (2
0) [1
5]
[15]
(15
) 5
[5] (
5) N
5 (3
5) [3
5]N
(-1
0) [-
15]
[35]
(40
) 15
[-20
] (-2
5) -
5
[40] (45) 10[30] (30) 10
PROPOSED
NORTH ACCESS
PROPOSED
SOUTH ACCESS
DICKINSON
STREET
MAIN STREET[75] (75) 35
PU
BL
IC
AL
LE
Y
71st
ST
RE
ET
ON
E W
AY
PR
OP
OS
ED
WE
ST
AC
CE
SS
LEGEND
XX(XX)[XX]
N
Weekday Morning Peak Hour (7:30-8:30 AM)Weekday Evening Peak Hour (4:30-5:30PM)Saturday Midday Peak Hour (11:15 AM-12:15 PM)Negligible - Less than 5 vehicles per hour
20 (75) [75]
[75] (75) 35
20 (75) [75]
[75] (75) 35
20 (75) [75]
[75] (75) 35
5 (5
) [5
]5
(15)
[10]
[30]
(30
) 10
[15]
(15
) 10
[N] (N) N[30] (25) 5
03-31-11
(95) [60](30) [25](100) [75]
[20] (35)[25] (25)[40] (50)
(35)
[25]
(560
) [2
35]
(70)
[45]
[15]
(20
)[2
55] (
395)
[60]
(75
)
MAIN STREET
76th
ST
RE
ET
(5) [5](200) [145](5) [N]
[N] (N)[130] (155)
[N] (5)
(N)
[5]
(N)
[N]
(N)
[N]
[5] (
25)
[N] (
10)
[N] (
35)
74th
ST
RE
ET
PA
RK
ING
LO
T
(10) [5](195) [140](N) [5]
[5] (5)[120] (180)
[N] (5)
(10)
[5]
(N)
[N]
(5)
[5]
[] (
)5
5[N
] (N
)[5
] (5)
72n
d S
TR
EE
T
PR
OP
OS
ED
WE
ST
AC
CE
SS
70th
ST
RE
ET
EXHIBIT 4-5
YEAR 2011 TOTAL TRAFFIC
MILWAUKEE, WISCONSIN
75th
ST
RE
ET
[5] (10)[125] (160)
(5) [N](220) [155]
(5)
[5]
(N)
[5]
73rd
ST
RE
ET
[5] (5)[125] (185)
(5) [5](205) [145]
(5)
[5]
(5)
[N]
(150) [100](5) [5]
[90] (150)[5] (5)
[5] (
5)[1
0] (
10)
(10) [15](70) [30](125) [75]
[55] (85)[45] (75)[40] (45)
(50)
[70]
(485
) [3
80]
(10)
[5]
[35]
(60
)[3
50] (
1005
)[6
5] (
105)
(35)
[35]
(615
) [4
65]
[35]
(40
)[4
25] (
1160
)
[40] (45)[30] (30)
PROPOSED
NORTH ACCESS
PROPOSED
SOUTH ACCESS
DICKINSON
STREET
(5) [5](N) [N](5) [5]
[N] (N)[N] (N)
[30] (25)
(5)
[5]
(635
) [4
85]
(5)
[5]
[30]
(30
)[4
55] (
1195
)[2
0] (
60)
MAIN STREET
N
NOT TO SCALE
LEGEND
(XX)[XX]
N
Weekday Evening Peak Hour (4:30-5:30 PM)Saturday Midday Peak Hour (11:15 AM-12:15 PM)Negligible - Less than 5 vehicles per hour
(130) [75](25) [30]
[60] (120)[70] (70)
(5)
[5]
(N)
[N]
(15)
[5]
[70]
(70
)[3
0] (
20)
PU
BL
IC
AL
LE
Y
71st
ST
RE
ET
ON
E W
AY
03-31-11
The Walmart Market - Milwaukee, Wisconsin March 31, 2011
Traffic Analysis & Design, Inc.
13
CHAPTER V – ANALYSIS OF TOTAL TRAFFIC CONDITIONS
PART A – TOTAL TRAFFIC CAPACITY LEVEL OF SERVICE
A1. Year 2011 Total Traffic Operating Conditions – Without Improvements
Exhibit 5-1 shows the Year 2011 total traffic (with Walmart Market) peak hour operating conditions at the study area intersections without improvements. The Year 2011 total traffic analysis was conducted using the existing lane configurations shown in Exhibit 3-1, the Year 2011 total traffic volumes shown in Exhibit 4-5, and the existing traffic signal timings obtained from the City of Milwaukee and included in Appendix A.
As shown in Exhibit 5-1, the traffic-signalized intersections of Main Street with 76th Street and 70th Street are expected to continue to operate acceptably at LOS C or better conditions. Stop-sign controlled intersections along Main Street are expected to continue to operate acceptably at LOS B or better conditions. These operations make sense, as 1) Main Street currently services low volumes of traffic to/from the neighborhoods to the north and 2) the Walmart Market site adds a relatively low incremental increase in traffic to Main Street. Traffic exiting the north access along 70th Street is expected to operate acceptably at LOS D or better conditions, and traffic exiting the south access along 70th Street is expected to operate acceptably at LOS B or better conditions.
The westbound approach of Dickinson Street is expected to operate at LOS F conditions for 10 vehicles in the weekday evening peak hour. Since the approach services a low volume of traffic, operates well outside the weekday evening peak hour, has a volume-to-capacity (v/c) ratio of 0.15 (desirably less than 1.00), and alternative access exists via the Main Street intersection with 70th Street, this LOS F condition does not warrant correction. Note that the existing volume at the intersection is the same and operates at LOS E with a v/c ratio of 0.12.
PART B – QUEUEING ANALYSIS
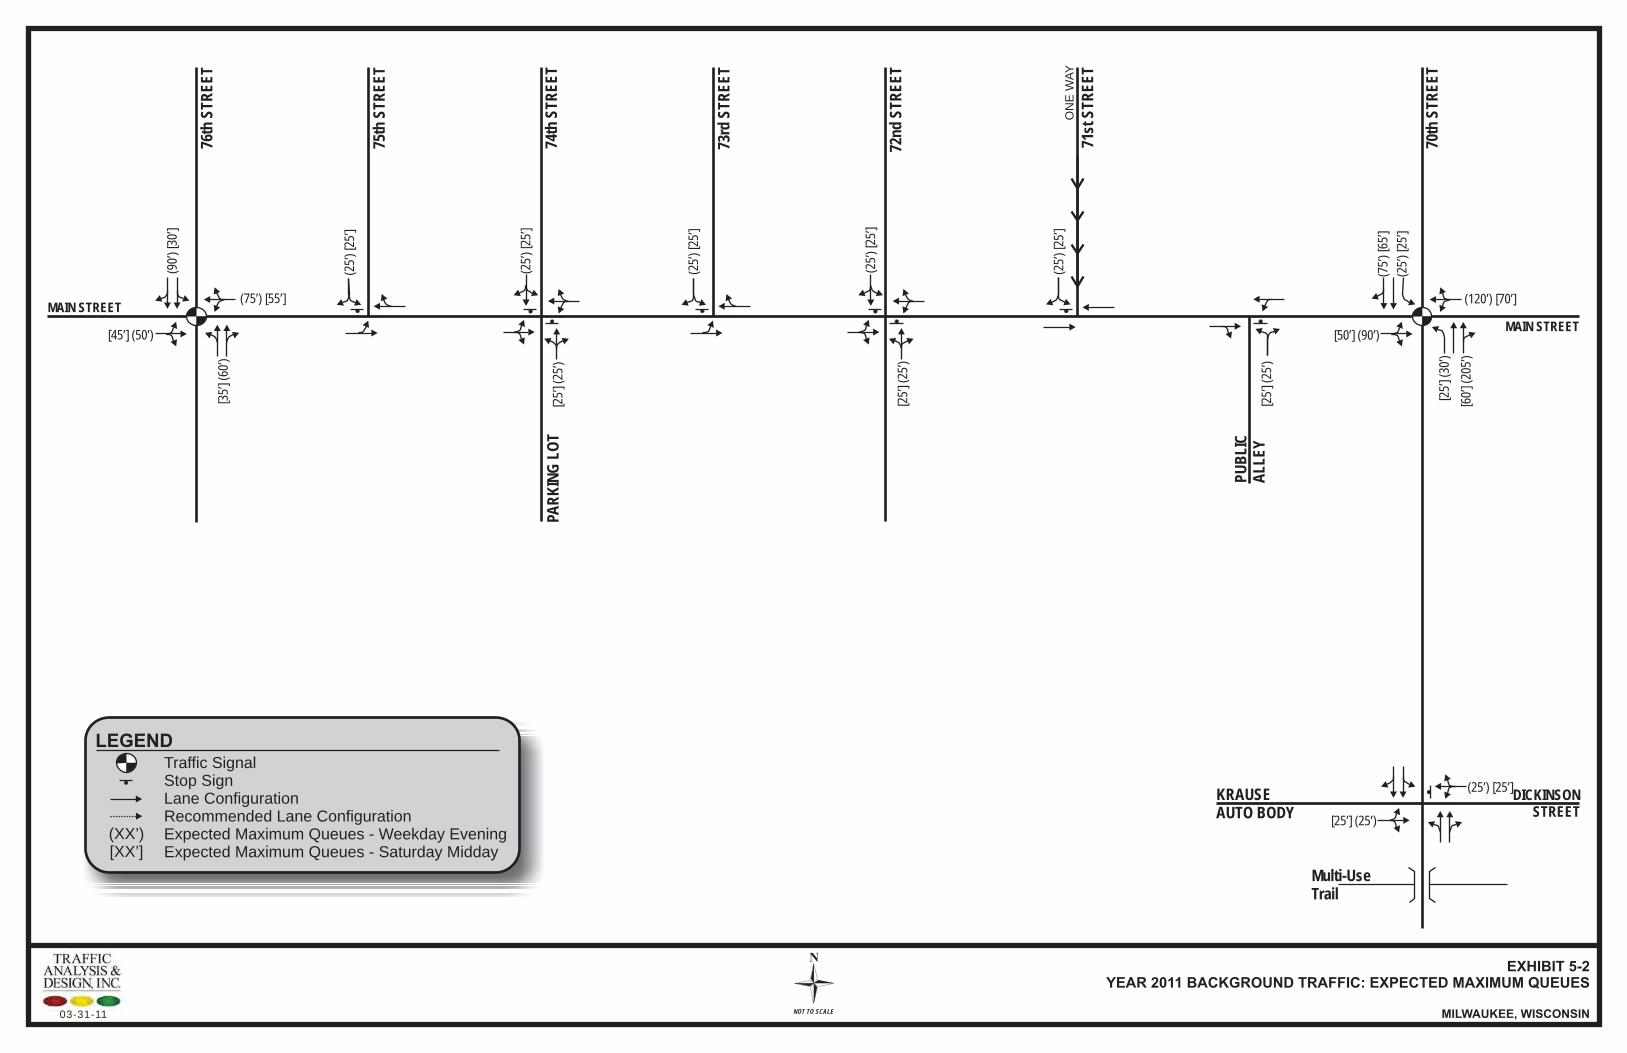
To estimate storage length requirements for turn bays at the study area intersections, a queuing analysis has been conducted. Note that the 50th percentile and 95th percentile probable queue lengths were checked against available turn bay lengths and intersection spacing to see if improvements are necessary. The following is a list of where the results of the queuing analysis can be found.
Year 2011 Background Traffic – Exhibit 5-4
Year 2011 Total Traffic – Exhibit 5-5
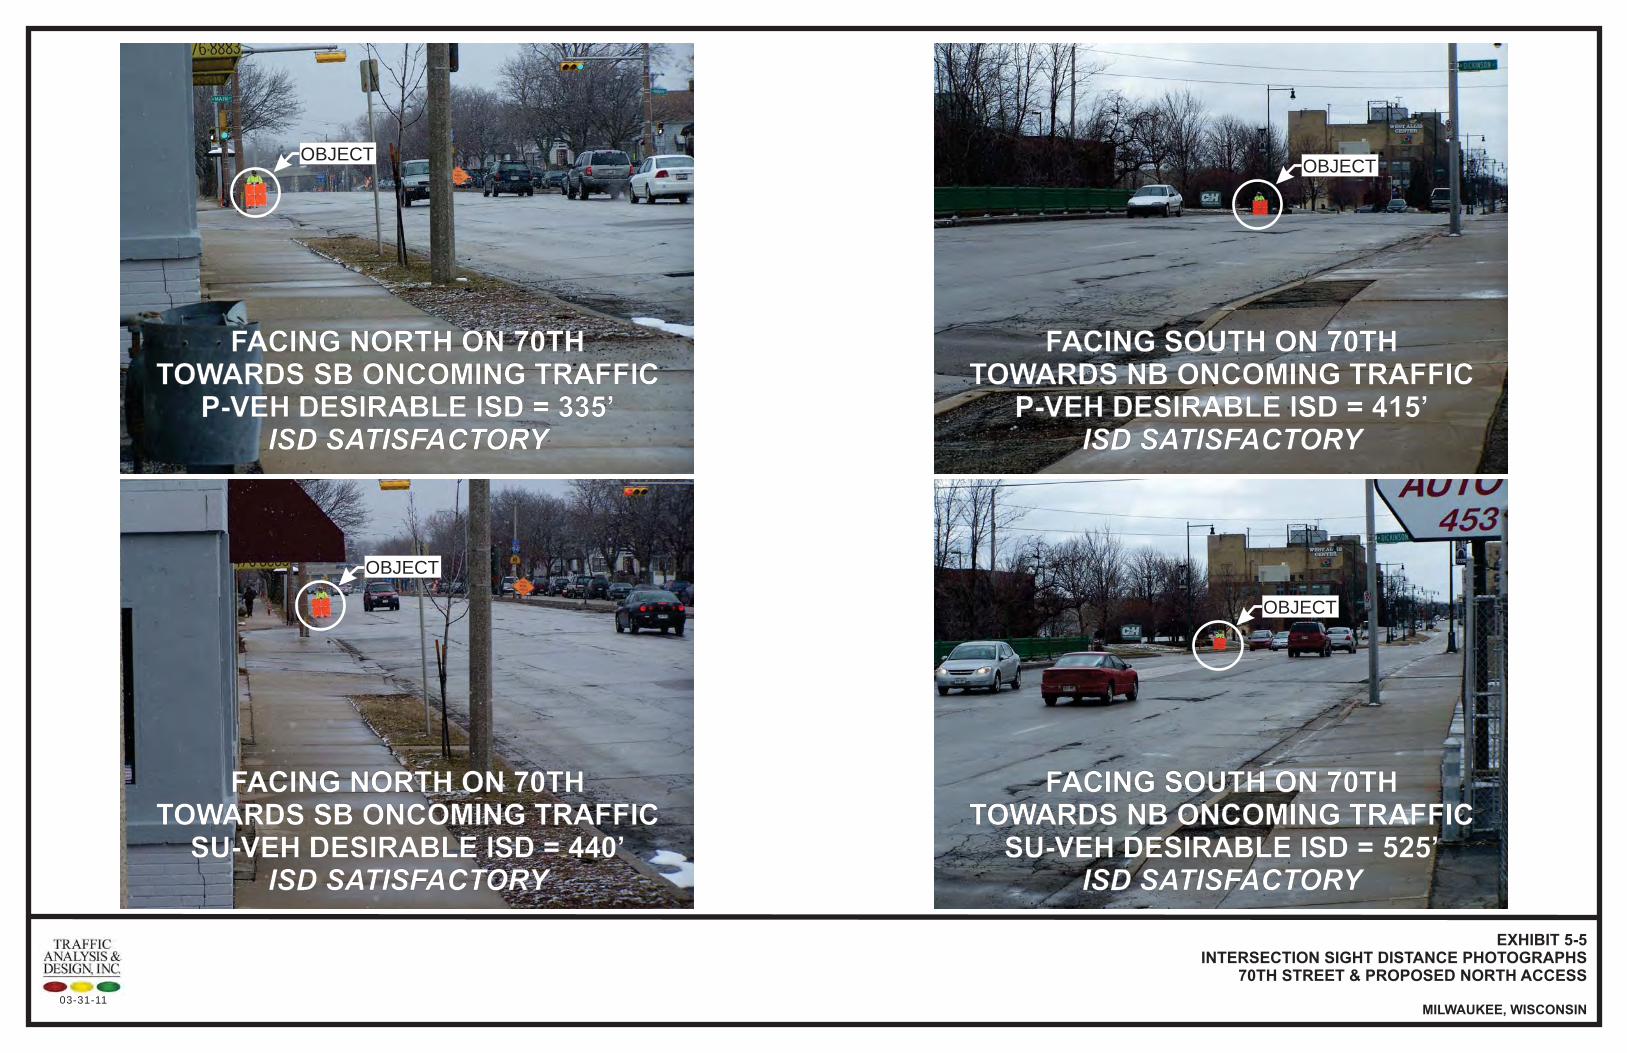
PART C – INTERSECTION SIGHT DISTANCE
Note that the intersection sight distance (ISD) measurements and photographs are based on approximate intersection placement and on in-field observation by Traffic Analysis & Design, Inc. The party responsible for designing the intersections is responsible for cross-checking, verifying and designing for all applicable sight distances.
All new or improved intersections throughout the study area should be designed for ISD in accordance with the latest edition of the American Association of State Highway Transportation Officials (AASHTO) A Policy on Geometric Design of Highways and Streets. ISD has been checked at the following locations:
The Walmart Market - Milwaukee, Wisconsin March 31, 2011
Traffic Analysis & Design, Inc.
14
Main Street & Proposed West Access 70th Street & Proposed North Access 70th Street & Proposed South Access opposite Dickinson Street
C1. Main Street & Proposed West Access ISD
ISD for the Main Street intersection with the proposed Walmart Market west access, which is proposed to be constructed opposite 71st Street, was conducted using the following parameters:
A design speed of 5 mph above the posted speed limit, or 30 mph.
A passenger vehicle (P-vehicle) eye height of 3.5 feet and a single-unit trunk (SU-vehicle) eye height of 7.6 feet, located 14.6-feet south of the Main Street curb line.
The height of the object to be seen on Main Street of 3.5-feet.
ISD from the proposed west access controls the necessary measurements, as the distances are greater than the distances needed for a vehicle on Main Street making a westbound left-turn onto the west access. All calculations are provided in Appendix A. As shown in Exhibit 5-4, ISD is expected to be met in both directions of Main Street at the proposed west access.
C2. 70th Street & Proposed North Access ISD
ISD for the 70th Street intersection with the proposed Walmart Market north access, which is proposed to be constructed approximately halfway between Main Street and Dickinson Street, was conducted using the following parameters:
A design speed of 5 mph above the posted speed limit, or 35 mph.
A passenger vehicle (P-vehicle) eye height of 3.5 feet and a single-unit trunk (SU-vehicle) eye height of 7.6 feet, located 14.6-feet west of the 70th Street curb line. The curb-to-vehicle distance was maximized since a building currently exists, but will be taken as part of the development, within the 14.6-feet distance.
The height of the object to be seen on 70th Street of 3.5-feet.
ISD from the proposed north access controls the necessary measurements, as the distances are greater than the distances needed for a vehicle on 70th Street making a northbound left-turn onto the north access. All calculations are provided in Appendix A. As shown in Exhibit 5-5, ISD is expected to be met in both directions of 70th Street at the proposed north access.
C3. 70th Street & Proposed South Access ISD
ISD for the 70th Street intersection with the proposed Walmart Market south access, which is proposed to be constructed opposite Dickinson Street, was conducted using the following parameters:
A design speed of 5 mph above the posted speed limit, or 35 mph.
A passenger vehicle (P-vehicle) eye height of 3.5 feet and a semi-trunk (WB-vehicle) eye height of 7.6 feet, located 14.6-feet west of the 70th Street curb line.
The height of the object to be seen on 70th Street of 3.5-feet.
ISD from the proposed south access controls the necessary measurements, as the distances are greater than the distances needed for a vehicle on 70th Street making a northbound left-turn onto the north access. All calculations are provided in Appendix A.
As shown in Exhibit 5-6, ISD is expected to be met for both P-vehicle and WB-vehicle motorists looking north at southbound oncoming traffic. ISD is expected to be met for the WB-vehicle

The Walmart Market - Milwaukee, Wisconsin March 31, 2011
Traffic Analysis & Design, Inc.
15
motorists, but not the P-vehicle motorists, looking south at northbound oncoming traffic. Note that, if a P-vehicle motorist is able to position themselves approximately 10-feet west of the curb line rather than the 14.6-feet used for design in the AASHTO GDHS (which most P-vehicles can do) the ISD would be met. Improvements to address the ISD deficiency are discussed in the Chapter I and Chapter IV recommendations.

03-31-11
EXHIBIT 5-1
YEAR 2011 TOTAL TRAFFIC OPERATIONS
MILWAUKEE, WISCONSIN
LT TH RT LT TH RT LT TH RT LT TH RT
PM B B B C C C A A A A A A
SAT C C C C C C A A A A A A
PM A * - - * * - - - A - A
SAT A * - - * * - - - A - A
PM A * * A * * B B B B B B
SAT A * * A * * B B B A A A
PM A * - - * * - - - B - B
SAT A * - - * * - - - A - A
PM A * * A * * B B B B B B
SAT A * * A * * B B B B B B
PM - * * A * - B - B B B B
SAT - * * A * - B - B B B B
PM - * * A * - A - A - - -
SAT - * * A * - A - A - - -
PM C C C C C C A B B A A A
SAT B B B B B B A A A A A A
PM D - D - - - A * - - * *
SAT C - C - - - A * - - * *
PM B B B F1
F1
F1 A * * A * *
SAT B B B C C C A * * A * *
Notes: (-) indicates a movement that is not possible or is prohibited. (*) indicates uncontrolled or free-flow movement.
1. 22.0-sec of average delay beyond LOS D/E threshold, 10 vehicles. Operational improvements not necessary
Main Street & 70th StreetTraffic
Signal
Main Street & Public AlleyTwo-Way
Stop Sign
70th Street &
Proposed North Access
Two-Way
Stop Sign
70th Street & Dickinson Street/
Proposed South Access
Two-Way
Stop Sign
Main Street & 73rd StreetTwo-Way
Stop Sign
Main Street & 72nd StreetTwo-Way
Stop Sign
Main Street & 71st Street/
Proposed West Access
Two-Way
Stop Sign
Southbound
Main Street & 76th StreetTraffic
Signal
Main Street & 75th StreetTwo-Way
Stop Sign
Main Street & 74th StreetTwo-Way
Stop Sign
Year 2011 Total Traffic Operations
With Recommended Geometrics and Traffic Control
Intersection
Traffic
Control
Peak
Hour
Level of Service per Movement by Approach
Eastbound Westbound Northbound
KRAUSE
AUTO BODY
MAIN STREET
76th
ST
RE
ET
74th
ST
RE
ET
PA
RK
ING
LO
T
72n
d S
TR
EE
T
70th
ST
RE
ET
LEGEND
Traffic SignalStop SignLane ConfigurationRecommended Lane ConfigurationExpected Maximum Queues - Weekday EveningExpected Maximum Queues - Saturday Midday
EXHIBIT 5-2
YEAR 2011 BACKGROUND TRAFFIC: EXPECTED MAXIMUM QUEUES
MILWAUKEE, WISCONSIN
75th
ST
RE
ET
73rd
ST
RE
ET
(75’
) [6
5’]
(25’
) [2
5’]
[25’
] (30
’)
[60’
] (20
5’)
DICKINSON
STREET
MAIN STREET
(75’) [55’]
[45’] (50’)
(90’
) [3
0’]
[35’
] (60
’)
(25’
) [2
5’]
[25’
] (25
’)
[50’] (90’)
(120’) [70’]
N
NOT TO SCALE
(XX’)[XX’]
(25’
) [2
5’]
(25’
) [2
5’]
[25’
] (25
’)
(25’
) [2
5’]
PU
BL
IC
AL
LE
Y
71st
ST
RE
ET
ON
E W
AY
(25’
) [2
5’]
[25’
] (25
’)
[25’] (25’)
(25’) [25’]
Multi-Use
Trail
03-31-11

MAIN STREET
76th
ST
RE
ET
74th
ST
RE
ET
PA
RK
ING
LO
T
72n
d S
TR
EE
T
70th
ST
RE
ET
75th
ST
RE
ET
73rd
ST
RE
ET
(85’
) [7
0’]
(25’
) [2
5’]
[25’
] (30
’)
[60’
] (21
0’)
DICKINSON
STREET
MAIN STREET
(105’) [85’]
[45’] (50’)
(120
’) [4
5’]
[45’
] (75
’)
(25’
) [2
5’]
[25’
] (25
’)
[75’] (110’)
(125’) [75’]
(25’
) [2
5’]
(25’
) [2
5’]
[25’
] (25
’)
(25’
) [2
5’]
PU
BL
IC
AL
LE
Y
71st
ST
RE
ET
ON
E W
AY
(25’
) [2
5’]
[25’
] (25
’)
[25’] (25’)
(25’) [25’]
EXHIBIT 5-3
YEAR 2011 TOTAL TRAFFIC: EXPECTED MAXIMUM QUEUES
MILWAUKEE, WISCONSIN
[25’] (40’)
N
NOT TO SCALE
PROPOSED
NORTH ACCESS
PR
OP
OS
ED
WE
ST
AC
CE
SS
[25’
] (25
’)
PROPOSED
SOUTH ACCESS
Multi-Use
Trail
LEGEND
Traffic SignalStop SignLane ConfigurationRecommended Lane ConfigurationExpected Maximum Queues - Weekday EveningExpected Maximum Queues - Saturday Midday
(XX’)[XX’]
03-31-11

03-31-11
EXHIBIT
INTERSECTION SIGHT DISTANCE PHOTOGRAPHS
MAIN STREET & PROPOSED WEST ACCESS
5-4
MILWAUKEE, WISCONSIN
FACING WEST ON MAIN
TOWARDS EB ONCOMING TRAFFIC
P-VEH DESIRABLE ISD = 290’
ISD SATISFACTORY
FACING WEST ON MAIN
TOWARDS EB ONCOMING TRAFFIC
P-VEH DESIRABLE ISD = 290’
ISD SATISFACTORY
OBJECT
FACING WEST ON MAIN
TOWARDS EB ONCOMING TRAFFIC
SU-VEH DESIRABLE ISD = 375’
ISD SATISFACTORY
FACING WEST ON MAIN
TOWARDS EB ONCOMING TRAFFIC
SU-VEH DESIRABLE ISD = 375’
ISD SATISFACTORY
OBJECT
FACING EAST ON MAIN
TOWARDS WB ONCOMING TRAFFIC
P-VEH DESIRABLE ISD = 355’
ISD SATISFACTORY
FACING EAST ON MAIN
TOWARDS WB ONCOMING TRAFFIC
P-VEH DESIRABLE ISD = 355’
ISD SATISFACTORY
OBJECT
FACING EAST ON MAIN
TOWARDS WB ONCOMING TRAFFIC
SU-VEH DESIRABLE ISD = 450’
ISD SATISFACTORY
FACING EAST ON MAIN
TOWARDS WB ONCOMING TRAFFIC
SU-VEH DESIRABLE ISD = 450’
ISD SATISFACTORY
OBJECT
03-31-11
EXHIBIT
INTERSECTION SIGHT DISTANCE PHOTOGRAPHS
70TH STREET & PROPOSED NORTH ACCESS
5-5
MILWAUKEE, WISCONSIN
FACING NORTH ON 70TH
TOWARDS SB ONCOMING TRAFFIC
P-VEH DESIRABLE ISD = 335’
ISD SATISFACTORY
FACING NORTH ON 70TH
TOWARDS SB ONCOMING TRAFFIC
P-VEH DESIRABLE ISD = 335’
ISD SATISFACTORY
OBJECT
FACING NORTH ON 70TH
TOWARDS SB ONCOMING TRAFFIC
SU-VEH DESIRABLE ISD = 440’
ISD SATISFACTORY
FACING NORTH ON 70TH
TOWARDS SB ONCOMING TRAFFIC
SU-VEH DESIRABLE ISD = 440’
ISD SATISFACTORY
OBJECT
FACING SOUTH ON 70TH
TOWARDS NB ONCOMING TRAFFIC
P-VEH DESIRABLE ISD = 415’
ISD SATISFACTORY
FACING SOUTH ON 70TH
TOWARDS NB ONCOMING TRAFFIC
P-VEH DESIRABLE ISD = 415’
ISD SATISFACTORY
OBJECT
FACING SOUTH ON 70TH
TOWARDS NB ONCOMING TRAFFIC
SU-VEH DESIRABLE ISD = 525’
ISD SATISFACTORY
FACING SOUTH ON 70TH
TOWARDS NB ONCOMING TRAFFIC
SU-VEH DESIRABLE ISD = 525’
ISD SATISFACTORY
OBJECT

03-31-11
EXHIBIT
INTERSECTION SIGHT DISTANCE PHOTOGRAPHS
70TH STREET & PROPOSED SOUTH ACCESS
5-6
MILWAUKEE, WISCONSIN
FACING NORTH ON 70TH
TOWARDS SB ONCOMING TRAFFIC
P-VEH DESIRABLE ISD = 335’
ISD SATISFACTORY
FACING NORTH ON 70TH
TOWARDS SB ONCOMING TRAFFIC
P-VEH DESIRABLE ISD = 335’
ISD SATISFACTORY
OBJECT
FACING NORTH ON 70TH
TOWARDS SB ONCOMING TRAFFIC
WB-VEH DESIRABLE ISD = 540’
ISD SATISFACTORY
FACING NORTH ON 70TH
TOWARDS SB ONCOMING TRAFFIC
WB-VEH DESIRABLE ISD = 540’
ISD SATISFACTORY
OBJECT
FACING SOUTH ON 70TH
TOWARDS NB ONCOMING TRAFFIC
P-VEH DESIRABLE ISD = 415’
ISD 14.6’ BACK FROM CURBNOT MET*PICTURE SHOWS ISD 10’ BACK FROM CURB*
FACING SOUTH ON 70TH
TOWARDS NB ONCOMING TRAFFIC
P-VEH DESIRABLE ISD = 415’
ISD 14.6’ BACK FROM CURBNOT MET*PICTURE SHOWS ISD 10’ BACK FROM CURB*
OBJECT
FACING SOUTH ON 70TH
TOWARDS NB ONCOMING TRAFFIC
WB-VEH DESIRABLE ISD = 630’
ISD SATISFACTORY
FACING SOUTH ON 70TH
TOWARDS NB ONCOMING TRAFFIC
WB-VEH DESIRABLE ISD = 630’
ISD SATISFACTORY
OBJECT
The Walmart Market - Milwaukee, Wisconsin March 31, 2011
Traffic Analysis & Design, Inc.
16
CHAPTER VI – RECOMMENDATIONS AND CONCLUSION
PART A – RECOMMENDED IMPROVEMENTS
A1. Level of Service Definition
The study area intersections were analyzed based on the procedures set forth in the 2000 Highway Capacity Manual (HCM). This manual is accepted in Wisconsin and the rest of the country as the industry standard in estimating operations at both signalized and unsignalized intersections.
Intersection operation is defined by “level of service” (LOS), a quantitative measure that refers to the overall quality of flow at an intersection ranging from very good, represented by LOS ‘A’, to very poor, represented by LOS ‘F’. LOS D or better operations (fewer than 35-seconds of average vehicle delay at stop sign controlled intersections, fewer than 55-seconds of average vehicle delay at traffic signal controlled intersections) are defined as acceptable peak hour operating conditions.
A2. Year 2011 Background Traffic Recommended Improvements
The Year 2011 background traffic analysis assumes the Walmart Market does not occur. The analysis was conducted using existing intersection geometrics, traffic controls and signal timings. Based on the capacity analysis, no improvements are necessary to accommodate operations under background traffic volumes. Traffic signalized intersections operate acceptably at LOS C or better conditions. Stop-sign controlled intersections along Main Street operate acceptably at LOS B or better conditions.
Note that the City of Milwaukee should consider replacing the bridge rail along the east side of 70th Street, south of Dickinson Street, with a more see-through solution to improve sight-distance for motorists currently turning from Dickinson Street onto 70th Street. This improvement, which is not related to the Walmart Market in any way, would address an existing sight distance concern for the neighborhood east of 70th Street.
A3. Year 2011 Total Traffic Recommended Improvements
Year 2011 total traffic volumes assume the full build-out of the Walmart Market. The following improvements, shown in Exhibit 1-3 at the end of Chapter I, are recommended to accommodate the Year 2011 total traffic.
Main Street & 76th Street
No improvements are anticipated to be necessary.
Main Street & 75th Street
No improvements are anticipated to be necessary.
Main Street & 74th Street
No improvements are anticipated to be necessary.
Main Street & 73rd Street
No improvements are anticipated to be necessary.
Main Street & 72nd Street
No improvements are anticipated to be necessary.
The Walmart Market - Milwaukee, Wisconsin March 31, 2011
Traffic Analysis & Design, Inc.
17
Main Street & 71st Street/Proposed West Access
Construct the Walmart Market west access on the south side of Main Street opposite 71st Street. No exclusive turn lanes are necessary.
Install a stop sign to control the Walmart Market northbound approach. Note that “DO NOT ENTER” signs currently exist along the north side of Main Street to inform motorists exiting the site that 71st Street is one-way southbound only.
Main Street & Public Alley
Install a stop sign to control the public alley northbound approach.
Main Street & 70th Street
No improvements are anticipated to be necessary.
70th Street & Proposed North Access
Construct the Walmart Market north access on the west side of 70th Street approximately half-way between Main Street and Dickinson Street. No exclusive turn lanes are necessary.
Install a stop sign to control the Walmart Market eastbound approach.
70th Street & Proposed South Access
Construct the Walmart Market south access on the west side of 70th Street opposite Dickinson Street. No exclusive turn lanes are necessary.
Install a stop sign to control the Walmart Market eastbound approach. Note that poor sight-distance exists at the access looking south for passenger vehicles, but not for delivery trucks, due to the height of the existing bridge abutment/railing on the west side of 70th Street. Install a MUTCD-compliant “RIGHT-TURN ONLY” sign with an additional sign stating “EXCEPT DELIVERY TRUCKS” to improve the safety of the intersection.
General Improvements
Recall that the Jetz gas station/convenience store and Air Comfort Systems business are expected to remain when the Walmart Market access points to 70th Street are constructed. Both businesses, as well as the Roman Electric business on the east side of 70th Street, have off-site parking accommodations. Consideration may be given to removing parking on the west side of 70th Street to improve visibility for motorists exiting the Walmart Market, Jetz, and HVAC sites. Consideration may also be given to removing parking on the south side of Main Street along the Walmart Market property to improve visibility for motorists exiting the west access and the existing public alley.
The traffic-signalized intersections are expected to continue to operate acceptably at LOS C or better conditions. Stop-sign controlled intersections along Main Street are expected to continue to operate acceptably at LOS B or better conditions. These operations make sense, as 1) Main Street currently services low volumes of traffic to/from the neighborhoods to the north and 2) the Walmart Market site adds a relatively low incremental increase in traffic to Main Street. Traffic exiting the north access along 70th Street is expected to operate acceptably at LOS D or better conditions, and traffic exiting the south access along 70th Street is expected to operate acceptably at LOS B or better conditions.
The Walmart Market - Milwaukee, Wisconsin March 31, 2011
Traffic Analysis & Design, Inc.
18
PART B – NEIGHBORHOOD CONCERNS
A public information meeting (PIM) was conducted for the Walmart Market site at Juneau High School on February 28th, 2011. Representatives of the property owner, representatives of Walmart Market, and representatives of the City of Milwaukee were present to take note of the concerns of the surrounding residents. This section of the report is provided to address traffic-related concerns raised at the meeting that relate to the Walmart Market.
B1. Truck Traffic on Main Street
Residents at the February PIM stated they had concerns with Walmart delivery truck traffic along Main Street, as well as truck headlights directed northbound into homes. Note that the conceptual site plan at the time included a truck access along Main Street between 71st Street and 72nd Street, as well as loading docks along the west side of the building with trucks positioned facing north towards Main Street.
To address this concern, the latest Walmart Market site plan has been reconfigured in a manner that will only accommodate delivery trucks along 70th Street. More specifically, the loading docks have been placed along the south side of the proposed building with trucks positioned facing south, the truck access along Main Street between 71st Street and 72nd Street has been removed, and the internal site layout is such that delivery trucks will not be able to physically make turns within the site to reach Main Street. With the IH-94 interchange with 70th Street to the north, truck drivers will not use Main Street to reach their destinations since it is much faster and convenient to utilize the 70th Street interchange.
B2. Walmart Market Traffic on Residential Streets
A concern was raised at the February PIM that Walmart Market would increase traffic on residential streets north of Main Street.
Motorists take the path of least perceived resistance to reach their destinations. As such, traffic to/from IH-94 will access the Walmart Market site most efficiently from the 70th Street interchange rather than from the 84th Street interchange/ramp collector system due to fewer stops and conflicts. Traffic to/from the north and south on 76th Street and 70th Street would access the site most efficiently from the 76th Street and 70th Street intersections with Main Street rather than the ramp collector system or neighborhoods for the same reasons. Therefore, it reasonable to expect that the only Walmart Market traffic anticipated to utilize the residential streets north of Main Street would be that traffic generated by the residents themselves.
B3. Traffic Signal Wait Times
A concern was raised at the February PIM that it takes multiple cycles to clear the traffic signals from Main Street to either 70th Street or 76th Street during rush hours, and that Walmart Market traffic would make wait times considerably longer.
Site observations and the traffic analysis performed at both intersections show that such an operation does not occur during rush hours. A relatively short surge in traffic due to an office release or the egress of Dawes heavy vehicles (both located along Main Street) may occur from time to time during the day and cause a motorist to miss a signal cycle. However, the analysis shows that these operations are not exacerbated by the Walmart Market site – even during its busiest hours of the day – and that outside of these short and few surges the signals operate acceptably at LOS C or better conditions.
B4. State Fair Park Special Event Traffic
Residents at the February PIM stated they experience heavy traffic due to State Fair Park events – most notably during the 11 days of State Fair. Residents stated that traffic utilizing Main Street
The Walmart Market - Milwaukee, Wisconsin March 31, 2011
Traffic Analysis & Design, Inc.
19
is heavy during this time and makes it difficult for them to enter/exit the neighborhood. The stated concern of residents is that the Walmart Market site will further add to the congestion and make it more difficult to enter/exit the neighborhood during such an event.
It is important to note that the Wisconsin State Fair is a special 11-day event and that restricting development to accommodate traffic that occurs for only 3-percent of the year is generally undesirable. It is also important to note that the Walmart Market contribution of traffic to Main Street is minimal compared to the volume expected due to State Fair and that the remaining 97-percent of the year operations are well within acceptable operation levels/available roadway capacity. That being stated, Main Street is currently utilized as a two-lane undivided street with wide parking lanes, and the homes within the neighborhood have private garages/parking areas for personal vehicles. Consideration could be given to restricting parking along Main Street during the short 11-day event, and adjust traffic signal timings accordingly, to aid in moving traffic to/from State Fair Park and the neighborhoods. Such an improvement suggestion is not caused by the Walmart Market, but is suggested by Traffic Analysis & Design, Inc. for the City of Milwaukee’s consideration in easing an existing State Fair traffic condition.
PART C – CONCLUSION
All movements at the study area intersections are expected to operate safely and efficiently with the improvements identified in this TIA.

The Walmart Market - Milwaukee, Wisconsin March 31, 2011
Traffic Analysis & Design, Inc.
APPENDIX A
TRAFFIC

The Walmart Market - Milwaukee, Wisconsin March 31, 2011
Traffic Analysis & Design, Inc. C:\JOBS\1223 WalMart 70th-Main Milwaukee\Report - TIA\Appendix 110331.docx
APPENDIX A
Existing Traffic Counts

PEAK HOUR TURNING MOVEMENT COUNT SUMMARY
Intersection:County:Traffic Control:Project:
A.M. PEAKThursday, January 13, 2011 TotalTRAFFIC VOLUMES 70th Street From North DickensonStreet From East 70th Street From South Driveway From West VehicleStart Time Right Thru Left Ped/Bike Right Thru Left Ped/Bike Right Thru Left Ped/Bike Right Thru Left Ped/Bike Volumes
7:30 AM 2 192 0 0 2 0 3 0 3 128 1 0 1 0 0 0 3327:45 AM 0 293 1 0 0 0 4 0 8 122 0 0 0 0 0 0 4288:00 AM 1 256 0 0 1 0 4 1 3 92 0 0 0 0 0 0 3578:15 AM 0 199 0 0 2 0 0 0 3 89 0 1 0 0 0 2 293Peak Hour Volume 3 940 1 0 5 0 11 1 17 431 1 1 1 0 0 2 1,410U-Turn Hourly Volume 0 0 0 0 0
By Approach 944 16 449 1 1,410TRUCK PERCENTAGES
% Single Unit Trucks 0.0% 1.0% 0.0% 0.0% 0.0% 0.0% 0.0% 2.6% 0.0% 0.0% 0.0% 0.0% 1.4%% Heavy Trucks 0.0% 0.3% 0.0% 0.0% 0.0% 0.0% 0.0% 0.4% 0.0% 0.0% 0.0% 0.0% 0.4%% Trucks (Total) 0.0% 1.3% 0.0% 0.0% 0.0% 0.0% 0.0% 3.0% 0.0% 0.0% 0.0% 0.0%
By Approach 1.3% 0.0% 2.9% 0.0%PEAK HOUR FACTORS
Peak Hour Factor (PHF) 0.38 0.80 0.25 0.63 0 0.69 0.53 0.84 0.25 0.25 0 0By Approach 0.80 0.80 0.85 0.25
HOURLY VOLUME-ROUNDED 5 940 0 0 5 0 10 1 15 430 0 1 0 0 0 2By Approach 945 15 445 0
M.D. PEAKFriday, January 14, 2011 TotalTRAFFIC VOLUMES 70th Street From North DickensonStreet From East 70th Street From South Driveway From West VehicleStart Time Right Thru Left Ped/Bike Right Thru Left Ped/Bike Right Thru Left Ped/Bike Right Thru Left Ped/Bike Volumes
12:15 PM 1 154 0 0 1 0 3 0 4 156 1 0 0 0 0 1 32012:30 PM 0 182 1 0 0 0 2 1 8 151 1 0 0 0 0 1 34512:45 PM 0 172 0 0 1 0 8 1 6 130 1 0 0 0 0 0 3181:00 PM 0 159 0 0 1 0 2 2 5 145 2 0 0 0 0 0 314Peak Hour Volume 1 667 1 0 3 0 15 4 23 582 5 0 0 0 0 2 1,297U-Turn Hourly Volume 0 0 1 0 1
By Approach 669 18 610 0 1,297TRUCK PERCENTAGES
% Single Unit Trucks 0.0% 2.4% 0.0% 0.0% 0.0% 0.0% 4.3% 2.7% 0.0% 0.0% 0.0% 0.0% 2.5%% Heavy Trucks 0.0% 1.2% 0.0% 0.0% 0.0% 0.0% 0.0% 0.7% 0.0% 0.0% 0.0% 0.0% 0.9%% Trucks (Total) 0.0% 3.6% 0.0% 0.0% 0.0% 0.0% 4.3% 3.4% 0.0% 0.0% 0.0% 0.0%
By Approach 3.6% 0.0% 3.4% 0.0%PEAK HOUR FACTORS
Peak Hour Factor (PHF) 0.25 0.92 0.25 0.75 0 0.47 0.72 0.93 0.63 0 0 0By Approach 0.91 0.50 0.95 0
HOURLY VOLUME-ROUNDED 0 665 0 0 5 0 15 4 25 580 5 0 0 0 0 2By Approach 665 20 610 0
P.M. PEAKThursday, January 13, 2011 TotalTRAFFIC VOLUMES 70th Street From North DickensonStreet From East 70th Street From South Driveway From West VehicleStart Time Right Thru Left Ped/Bike Right Thru Left Ped/Bike Right Thru Left Ped/Bike Right Thru Left Ped/Bike Volumes
4:30 PM 0 134 0 0 2 0 1 2 13 303 0 0 0 0 0 0 4534:45 PM 0 151 4 0 0 0 2 0 10 211 0 0 0 0 0 0 3785:00 PM 0 142 0 0 1 0 2 3 16 307 0 0 1 0 0 0 4695:15 PM 0 145 0 0 1 1 0 0 15 264 0 0 0 0 0 0 426Peak Hour Volume 0 572 4 0 4 1 5 5 54 1,085 0 0 1 0 0 0 1,726U-Turn Hourly Volume 0 0 0 0 0
By Approach 576 10 1,139 1 1,726TRUCK PERCENTAGES
% Single Unit Trucks 0.0% 0.3% 0.0% 0.0% 0.0% 0.0% 0.0% 0.6% 0.0% 0.0% 0.0% 0.0% 0.5%% Heavy Trucks 0.0% 0.2% 0.0% 0.0% 0.0% 0.0% 0.0% 0.0% 0.0% 0.0% 0.0% 0.0% 0.1%% Trucks (Total) 0.0% 0.5% 0.0% 0.0% 0.0% 0.0% 0.0% 0.6% 0.0% 0.0% 0.0% 0.0%
By Approach 0.5% 0.0% 0.6% 0.0%PEAK HOUR FACTORS
Peak Hour Factor (PHF) 0 0.95 0.25 0.50 0.25 0.63 0.84 0.88 0 0.25 0 0By Approach 0.93 0.83 0.88 0.25
HOURLY VOLUME-ROUNDED 0 570 5 0 5 0 5 5 55 1,085 0 0 0 0 0 0By Approach 575 10 1,140 0
DOT Growth Factor Group: None Used
Adjustment Factor Used: 1.000Notes: U-turn volumes included in left-turn volumes.
70th Street and DickensonStreetMilwaukeeTwo-Way Stop
1,405
Milwaukee Main Street
1,725
0.92
1.8%
0.82
0.6%
1,295
3.5%
0.94

PEAK HOUR TURNING MOVEMENT COUNT SUMMARY
Intersection:County:Traffic Control:Project:
M.D. PEAKSaturday, January 15, 2011 TotalTRAFFIC VOLUMES 70th Street From North DickensonStreet From East 70th Street From South Driveway From West VehicleStart Time Right Thru Left Ped/Bike Right Thru Left Ped/Bike Right Thru Left Ped/Bike Right Thru Left Ped/Bike Volumes
11:15 AM 0 117 0 0 3 0 3 0 6 96 0 0 0 0 0 1 22511:30 AM 0 101 2 0 3 0 0 0 5 96 0 0 0 0 1 0 20811:45 AM 0 114 1 0 0 0 2 0 4 116 0 0 0 0 0 1 23712:00 PM 0 102 0 0 0 0 1 1 5 98 0 0 0 0 0 1 206Peak Hour Volume 0 434 3 0 6 0 6 1 20 406 0 0 0 0 1 3 876U-Turn Hourly Volume 0 0 0 0 0
By Approach 437 12 426 1 876TRUCK PERCENTAGES
% Single Unit Trucks 0.0% 1.4% 0.0% 0.0% 0.0% 0.0% 0.0% 1.2% 0.0% 0.0% 0.0% 0.0% 1.3%% Heavy Trucks 0.0% 0.0% 0.0% 0.0% 0.0% 0.0% 0.0% 0.5% 0.0% 0.0% 0.0% 0.0% 0.2%% Trucks (Total) 0.0% 1.4% 0.0% 0.0% 0.0% 0.0% 0.0% 1.7% 0.0% 0.0% 0.0% 0.0%
By Approach 1.4% 0.0% 1.6% 0.0%PEAK HOUR FACTORS
Peak Hour Factor (PHF) 0 0.93 0.38 0.50 0 0.50 0.83 0.88 0 0 0 0.25By Approach 0.93 0.50 0.89 0.25
HOURLY VOLUME-ROUNDED 0 435 5 0 5 0 5 1 20 405 0 0 0 0 0 3By Approach 440 10 425 0
DOT Growth Factor Group: None Used
Adjustment Factor Used: 1.000Notes: U-turn volumes included in left-turn volumes.
70th Street and DickensonStreetMilwaukeeTwo-Way StopMilwaukee Main Street
875
1.5%
0.92

PEAK HOUR TURNING MOVEMENT COUNT SUMMARY
Intersection:County:Traffic Control:Project:
A.M. PEAKThursday, January 13, 2011 TotalTRAFFIC VOLUMES 70th Street From North Main Street From East 70th Street From South Main Street From West VehicleStart Time Right Thru Left Ped/Bike Right Thru Left Ped/Bike Right Thru Left Ped/Bike Right Thru Left Ped/Bike Volumes
7:30 AM 8 167 3 1 10 12 23 0 13 89 5 0 11 16 9 1 3667:45 AM 17 217 5 1 4 15 37 2 15 103 8 2 17 14 9 0 4618:00 AM 18 242 3 0 2 11 20 0 14 75 4 1 14 7 13 2 4238:15 AM 7 171 1 0 5 10 20 0 3 88 2 4 11 13 8 0 339Peak Hour Volume 50 797 12 2 21 48 100 2 45 355 19 7 53 50 39 3 1,589U-Turn Hourly Volume 0 0 0 0 0
By Approach 859 169 419 142 1,589TRUCK PERCENTAGES
% Single Unit Trucks 2.0% 1.9% 8.3% 9.5% 6.2% 2.0% 0.0% 4.5% 5.3% 0.0% 6.0% 2.6% 2.8%% Heavy Trucks 0.0% 0.9% 0.0% 0.0% 0.0% 0.0% 0.0% 2.0% 10.5% 1.9% 0.0% 0.0% 1.1%% Trucks (Total) 2.0% 2.8% 8.3% 9.5% 6.2% 2.0% 0.0% 6.5% 15.8% 1.9% 6.0% 2.6%
By Approach 2.8% 4.1% 6.2% 3.5%PEAK HOUR FACTORS
Peak Hour Factor (PHF) 0.69 0.82 0.60 0.53 0.80 0.68 0.75 0.86 0.59 0.78 0.78 0.75By Approach 0.82 0.75 0.83 0.89
HOURLY VOLUME-ROUNDED 50 795 10 2 20 50 100 2 45 355 20 7 55 50 40 3By Approach 855 170 420 145
M.D. PEAKThursday, January 13, 2011 TotalTRAFFIC VOLUMES 70th Street From North Main Street From East 70th Street From South Main Street From West VehicleStart Time Right Thru Left Ped/Bike Right Thru Left Ped/Bike Right Thru Left Ped/Bike Right Thru Left Ped/Bike Volumes
12:15 PM 4 119 1 3 0 3 24 0 12 132 11 0 11 4 8 4 32912:30 PM 14 153 0 0 1 12 12 0 15 121 3 3 13 8 8 0 36012:45 PM 10 140 6 0 0 7 18 3 9 111 8 2 11 4 8 0 3321:00 PM 8 132 6 0 4 12 26 1 9 131 4 1 7 6 10 1 355Peak Hour Volume 36 544 13 3 5 34 80 4 45 495 26 6 42 22 34 5 1,376U-Turn Hourly Volume 0 0 0 0 0
By Approach 593 119 566 98 1,376TRUCK PERCENTAGES
% Single Unit Trucks 2.8% 1.7% 0.0% 0.0% 0.0% 0.0% 0.0% 3.2% 0.0% 7.1% 0.0% 2.9% 2.2%% Heavy Trucks 0.0% 1.2% 0.0% 0.0% 0.0% 0.0% 0.0% 1.0% 0.0% 2.4% 0.0% 0.0% 0.9%% Trucks (Total) 2.8% 2.9% 0.0% 0.0% 0.0% 0.0% 0.0% 4.2% 0.0% 9.5% 0.0% 2.9%
By Approach 2.8% 0.0% 3.7% 5.1%PEAK HOUR FACTORS
Peak Hour Factor (PHF) 0.64 0.89 0.54 0.31 0.71 0.77 0.75 0.94 0.59 0.81 0.69 0.85By Approach 0.89 0.71 0.91 0.84
HOURLY VOLUME-ROUNDED 35 545 15 3 5 35 80 4 45 495 25 6 40 20 35 5By Approach 595 120 565 95
P.M. PEAKThursday, January 13, 2011 TotalTRAFFIC VOLUMES 70th Street From North Main Street From East 70th Street From South Main Street From West VehicleStart Time Right Thru Left Ped/Bike Right Thru Left Ped/Bike Right Thru Left Ped/Bike Right Thru Left Ped/Bike Volumes
4:30 PM 6 107 2 0 3 24 23 0 29 246 13 0 9 16 15 0 4934:45 PM 8 116 3 0 1 12 26 0 17 176 10 0 13 15 18 2 4155:00 PM 4 101 3 0 2 10 26 2 23 270 11 1 9 22 11 0 4925:15 PM 5 106 4 0 4 16 34 0 21 218 18 0 7 14 10 0 457Peak Hour Volume 23 430 12 0 10 62 109 2 90 910 52 1 38 67 54 2 1,857U-Turn Hourly Volume 0 0 0 0 0
By Approach 465 181 1,052 159 1,857TRUCK PERCENTAGES
% Single Unit Trucks 0.0% 0.7% 0.0% 10.0% 1.6% 0.0% 0.0% 0.4% 3.8% 0.0% 0.0% 0.0% 0.6%% Heavy Trucks 4.3% 0.2% 0.0% 0.0% 0.0% 0.0% 0.0% 0.1% 0.0% 0.0% 0.0% 0.0% 0.2%% Trucks (Total) 4.3% 0.9% 0.0% 10.0% 1.6% 0.0% 0.0% 0.5% 3.8% 0.0% 0.0% 0.0%
By Approach 1.0% 1.1% 0.6% 0.0%PEAK HOUR FACTORS
Peak Hour Factor (PHF) 0.72 0.93 0.75 0.63 0.65 0.80 0.78 0.84 0.72 0.73 0.76 0.75By Approach 0.92 0.84 0.87 0.86
HOURLY VOLUME-ROUNDED 25 430 10 0 10 60 110 2 90 910 50 1 40 65 55 2By Approach 465 180 1,050 160
DOT Growth Factor Group: None Used
Adjustment Factor Used: 1.000Notes: U-turn volumes included in left-turn volumes.
70th Street and Main StreetMilwaukeeTraffic Signal
1,590
Milwaukee Main Street
1,855
0.94
3.9%
0.86
0.8%
1,375
3.1%
0.96

PEAK HOUR TURNING MOVEMENT COUNT SUMMARY
Intersection:County:Traffic Control:Project:
M.D. PEAKSaturday, January 15, 2011 TotalTRAFFIC VOLUMES 70th Street From North Main Street From East 70th Street From South Main Street From West VehicleStart Time Right Thru Left Ped/Bike Right Thru Left Ped/Bike Right Thru Left Ped/Bike Right Thru Left Ped/Bike Volumes
11:15 AM 6 75 1 1 6 7 26 0 16 73 8 2 12 10 8 0 24811:30 AM 7 92 3 0 2 9 12 1 9 79 4 4 3 7 6 2 23311:45 AM 13 94 2 6 2 4 18 0 19 87 11 1 9 5 6 6 27012:00 PM 8 75 1 0 5 5 7 1 10 73 5 1 10 6 7 1 212Peak Hour Volume 34 336 7 7 15 25 63 2 54 312 28 8 34 28 27 9 963U-Turn Hourly Volume 0 0 0 0 0
By Approach 377 103 394 89 963TRUCK PERCENTAGES
% Single Unit Trucks 0.0% 1.5% 0.0% 0.0% 0.0% 1.6% 1.9% 0.6% 3.6% 0.0% 0.0% 0.0% 1.0%% Heavy Trucks 0.0% 0.0% 0.0% 0.0% 0.0% 0.0% 0.0% 0.4% 3.5% 0.0% 0.0% 0.0% 0.2%% Trucks (Total) 0.0% 1.5% 0.0% 0.0% 0.0% 1.6% 1.9% 1.0% 7.1% 0.0% 0.0% 0.0%
By Approach 1.3% 1.0% 1.6% 0.0%PEAK HOUR FACTORS
Peak Hour Factor (PHF) 0.65 0.89 0.58 0.63 0.69 0.61 0.71 0.90 0.64 0.71 0.70 0.84By Approach 0.86 0.66 0.84 0.74
HOURLY VOLUME-ROUNDED 35 335 5 7 15 25 65 2 55 310 30 8 35 30 25 9By Approach 375 105 395 90
DOT Growth Factor Group: None Used
Adjustment Factor Used: 1.000Notes: U-turn volumes included in left-turn volumes.
965
1.2%
0.89
70th Street and Main StreetMilwaukeeTraffic SignalMilwaukee Main Street

PEAK HOUR TURNING MOVEMENT COUNT SUMMARY
Intersection:County:Traffic Control:Project:
A.M. PEAKThursday, January 13, 2011 TotalTRAFFIC VOLUMES 71st Street From North Main Street From East Main Street From West VehicleStart Time Right Thru Left Ped/Bike Right Thru Left Ped/Bike Right Thru Left Ped/Bike Right Thru Left Ped/Bike Volumes
7:30 AM 1 0 1 0 0 20 1 0 0 0 0 1 0 24 0 0 477:45 AM 2 0 2 0 0 18 0 0 0 0 0 1 0 26 0 0 488:00 AM 0 0 2 0 0 26 0 0 0 0 0 0 0 17 0 0 458:15 AM 2 0 1 0 0 14 0 0 0 0 0 1 0 17 0 0 34Peak Hour Volume 5 0 6 0 0 78 1 0 0 0 0 3 0 84 0 0 174U-Turn Hourly Volume 0 1 0 0 1
By Approach 11 79 0 84 174TRUCK PERCENTAGES
% Single Unit Trucks 0.0% 0.0% 0.0% 0.0% 5.1% 0.0% 0.0% 0.0% 0.0% 0.0% 7.1% 0.0% 5.8%% Heavy Trucks 0.0% 0.0% 0.0% 0.0% 0.0% 0.0% 0.0% 0.0% 0.0% 0.0% 0.0% 0.0% 0.0%% Trucks (Total) 0.0% 0.0% 0.0% 0.0% 5.1% 0.0% 0.0% 0.0% 0.0% 0.0% 7.1% 0.0%
By Approach 0.0% 5.1% 0.0% 7.1%PEAK HOUR FACTORS
Peak Hour Factor (PHF) 0.63 0 0.75 0 0.75 0.25 0 0 0 0 0.81 0By Approach 0.69 0.76 0 0.81
HOURLY VOLUME-ROUNDED 5 0 5 0 0 80 0 0 0 0 0 3 0 85 0 0By Approach 10 80 0 85
M.D. PEAKWednesday, January 12, 2011 TotalTRAFFIC VOLUMES 71st Street From North Main Street From East Main Street From West VehicleStart Time Right Thru Left Ped/Bike Right Thru Left Ped/Bike Right Thru Left Ped/Bike Right Thru Left Ped/Bike Volumes
12:15 PM 0 0 3 0 0 14 0 0 0 0 0 0 0 13 0 0 3012:30 PM 0 0 0 1 0 20 0 1 0 0 0 1 0 21 0 0 4112:45 PM 0 0 3 0 0 13 0 0 0 0 0 0 0 16 0 2 321:00 PM 0 0 2 0 0 9 0 1 0 0 0 0 0 10 0 0 21Peak Hour Volume 0 0 8 1 0 56 0 2 0 0 0 1 0 60 0 2 124U-Turn Hourly Volume 0 0 0 0 0
By Approach 8 56 0 60 124TRUCK PERCENTAGES
% Single Unit Trucks 0.0% 0.0% 0.0% 0.0% 1.8% 0.0% 0.0% 0.0% 0.0% 0.0% 0.0% 0.0% 0.8%% Heavy Trucks 0.0% 0.0% 0.0% 0.0% 1.8% 0.0% 0.0% 0.0% 0.0% 0.0% 0.0% 0.0% 0.8%% Trucks (Total) 0.0% 0.0% 0.0% 0.0% 3.6% 0.0% 0.0% 0.0% 0.0% 0.0% 0.0% 0.0%
By Approach 0.0% 3.6% 0.0% 0.0%PEAK HOUR FACTORS
Peak Hour Factor (PHF) 0 0 0.67 0 0.70 0 0 0 0 0 0.71 0By Approach 0.67 0.70 0 0.71
HOURLY VOLUME-ROUNDED 0 0 10 1 0 55 0 2 0 0 0 1 0 60 0 2By Approach 10 55 0 60
P.M. PEAKThursday, January 13, 2011 TotalTRAFFIC VOLUMES 71st Street From North Main Street From East Main Street From West VehicleStart Time Right Thru Left Ped/Bike Right Thru Left Ped/Bike Right Thru Left Ped/Bike Right Thru Left Ped/Bike Volumes
4:30 PM 2 0 5 0 0 21 0 0 0 0 0 1 0 18 0 0 464:45 PM 1 0 3 0 0 12 0 2 0 0 0 0 0 24 0 0 405:00 PM 2 0 2 0 0 26 0 1 0 0 0 0 0 32 1 0 635:15 PM 1 0 4 7 0 24 0 1 0 0 0 1 0 16 0 2 45Peak Hour Volume 6 0 14 7 0 83 0 4 0 0 0 2 0 90 1 2 194U-Turn Hourly Volume 0 0 0 0 0
By Approach 20 83 0 91 194TRUCK PERCENTAGES
% Single Unit Trucks 0.0% 0.0% 0.0% 0.0% 3.6% 0.0% 0.0% 0.0% 0.0% 0.0% 1.1% 0.0% 2.1%% Heavy Trucks 0.0% 0.0% 0.0% 0.0% 0.0% 0.0% 0.0% 0.0% 0.0% 0.0% 0.0% 0.0% 0.0%% Trucks (Total) 0.0% 0.0% 0.0% 0.0% 3.6% 0.0% 0.0% 0.0% 0.0% 0.0% 1.1% 0.0%
By Approach 0.0% 3.6% 0.0% 1.1%PEAK HOUR FACTORS
Peak Hour Factor (PHF) 0.75 0 0.70 0 0.80 0 0 0 0 0 0.70 0.25By Approach 0.71 0.80 0 0.69
HOURLY VOLUME-ROUNDED 5 0 15 7 0 85 0 4 0 0 0 2 0 90 0 2By Approach 20 85 0 90
DOT Growth Factor Group: None Used
Adjustment Factor Used: 1.000Notes: U-turn volumes included in left-turn volumes.
71st Street and Main StreetMilwaukeeTwo-Way Stop
175
Milwaukee Main Street
195
0.77
5.8%
0.91
2.1%
125
1.6%
0.76

PEAK HOUR TURNING MOVEMENT COUNT SUMMARY
Intersection:County:Traffic Control:Project:
M.D. PEAKSaturday, January 15, 2011 TotalTRAFFIC VOLUMES 71st Street From North Main Street From East Main Street From West VehicleStart Time Right Thru Left Ped/Bike Right Thru Left Ped/Bike Right Thru Left Ped/Bike Right Thru Left Ped/Bike Volumes
11:15 AM 1 0 2 0 1 16 0 0 0 0 0 0 0 11 0 0 3111:30 AM 1 0 0 1 0 18 0 1 0 0 0 0 0 12 0 0 3111:45 AM 1 0 2 0 0 23 0 0 0 0 0 1 0 11 0 0 3712:00 PM 0 0 2 0 0 9 0 0 0 0 0 0 0 11 0 0 22Peak Hour Volume 3 0 6 1 1 66 0 1 0 0 0 1 0 45 0 0 121U-Turn Hourly Volume 0 0 0 0 0
By Approach 9 67 0 45 121TRUCK PERCENTAGES
% Single Unit Trucks 0.0% 0.0% 0.0% 0.0% 0.0% 0.0% 0.0% 0.0% 0.0% 0.0% 0.0% 0.0% 0.0%% Heavy Trucks 0.0% 0.0% 0.0% 0.0% 3.0% 0.0% 0.0% 0.0% 0.0% 0.0% 0.0% 0.0% 1.7%% Trucks (Total) 0.0% 0.0% 0.0% 0.0% 3.0% 0.0% 0.0% 0.0% 0.0% 0.0% 0.0% 0.0%
By Approach 0.0% 3.0% 0.0% 0.0%PEAK HOUR FACTORS
Peak Hour Factor (PHF) 0.75 0 0.75 0.25 0.72 0 0 0 0 0 0.94 0By Approach 0.75 0.73 0 0.94
HOURLY VOLUME-ROUNDED 5 0 5 1 0 65 0 1 0 0 0 1 0 45 0 0By Approach 10 65 0 45
DOT Growth Factor Group: None Used
Adjustment Factor Used: 1.000Notes: U-turn volumes included in left-turn volumes.
120
1.7%
0.82
71st Street and Main StreetMilwaukeeTwo-Way StopMilwaukee Main Street

PEAK HOUR TURNING MOVEMENT COUNT SUMMARY
Intersection:County:Traffic Control:Project:
P.M. PEAKWednesday, January 12, 2011 TotalTRAFFIC VOLUMES 72nd Street From North Main Street From East 72nd Street From South Main Street From West VehicleStart Time Right Thru Left Ped/Bike Right Thru Left Ped/Bike Right Thru Left Ped/Bike Right Thru Left Ped/Bike Volumes
4:30 PM 4 0 0 0 4 20 0 0 0 0 2 2 1 19 0 0 504:45 PM 1 0 0 0 1 11 0 0 1 0 0 0 2 21 1 0 385:00 PM 0 0 1 0 3 25 0 0 0 0 0 0 1 32 2 0 645:15 PM 3 0 1 0 0 24 1 0 2 0 4 0 0 14 1 0 50Peak Hour Volume 8 0 2 0 8 80 1 0 3 0 6 2 4 86 4 0 202U-Turn Hourly Volume 0 0 0 0 0
By Approach 10 89 9 94 202TRUCK PERCENTAGES
% Single Unit Trucks 12.5% 0.0% 0.0% 0.0% 2.5% 0.0% 0.0% 0.0% 0.0% 0.0% 1.2% 0.0% 2.0%% Heavy Trucks 0.0% 0.0% 0.0% 0.0% 0.0% 0.0% 0.0% 0.0% 0.0% 0.0% 0.0% 0.0% 0.0%% Trucks (Total) 12.5% 0.0% 0.0% 0.0% 2.5% 0.0% 0.0% 0.0% 0.0% 0.0% 1.2% 0.0%
By Approach 10.0% 2.2% 0.0% 1.1%PEAK HOUR FACTORS
Peak Hour Factor (PHF) 0.50 0 0.50 0.50 0.80 0.25 0.38 0 0.38 0.50 0.67 0.50By Approach 0.63 0.79 0.38 0.67
HOURLY VOLUME-ROUNDED 10 0 0 0 10 80 0 0 5 0 5 2 5 85 5 0By Approach 10 90 10 95
DOT Growth Factor Group: None Used
Adjustment Factor Used: 1.000Notes: U-turn volumes included in left-turn volumes.
2.0%
205
0.79
72nd Street and Main StreetMilwaukeeTwo-Way StopMilwaukee Main Street

PEAK HOUR TURNING MOVEMENT COUNT SUMMARY
Intersection:County:Traffic Control:Project:
M.D. PEAKSaturday, January 15, 2011 TotalTRAFFIC VOLUMES 72nd Street From North Main Street From East 72nd Street From South Main Street From West VehicleStart Time Right Thru Left Ped/Bike Right Thru Left Ped/Bike Right Thru Left Ped/Bike Right Thru Left Ped/Bike Volumes
11:15 AM 0 0 1 0 2 14 1 0 1 0 0 0 0 8 0 0 2711:30 AM 1 0 2 1 0 17 2 0 1 0 2 0 0 10 2 0 3711:45 AM 1 0 1 0 2 19 0 0 1 0 0 1 0 11 1 0 3612:00 PM 1 0 0 0 0 10 0 0 1 0 1 0 1 11 0 0 25Peak Hour Volume 3 0 4 1 4 60 3 0 4 0 3 1 1 40 3 0 125U-Turn Hourly Volume 0 0 0 0 0
By Approach 7 67 7 44 125TRUCK PERCENTAGES
% Single Unit Trucks 0.0% 0.0% 0.0% 0.0% 0.0% 33.3% 0.0% 0.0% 33.3% 0.0% 0.0% 0.0% 1.6%% Heavy Trucks 0.0% 0.0% 0.0% 0.0% 0.0% 33.4% 0.0% 0.0% 0.0% 0.0% 0.0% 0.0% 0.8%% Trucks (Total) 0.0% 0.0% 0.0% 0.0% 0.0% 66.7% 0.0% 0.0% 33.3% 0.0% 0.0% 0.0%
By Approach 0.0% 3.0% 14.3% 0.0%PEAK HOUR FACTORS
Peak Hour Factor (PHF) 0.75 0 0.50 0.50 0.79 0.38 1.00 0 0.38 0.25 0.91 0.38By Approach 0.58 0.80 0.58 0.92
HOURLY VOLUME-ROUNDED 5 0 5 1 5 60 5 0 5 0 5 1 0 40 5 0By Approach 10 70 10 45
DOT Growth Factor Group: None Used
Adjustment Factor Used: 1.000Notes: U-turn volumes included in left-turn volumes.
72nd Street and Main StreetMilwaukeeTwo-Way StopMilwaukee Main Street
135
2.4%
0.84

PEAK HOUR TURNING MOVEMENT COUNT SUMMARY
Intersection:County:Traffic Control:Project:
P.M. PEAKWednesday, January 12, 2011 TotalTRAFFIC VOLUMES 73rd Street From North Main Street From East 73rd Street From South Main Street From West VehicleStart Time Right Thru Left Ped/Bike Right Thru Left Ped/Bike Right Thru Left Ped/Bike Right Thru Left Ped/Bike Volumes
4:30 PM 1 0 1 1 3 24 0 0 0 0 0 3 0 19 1 0 494:45 PM 1 0 2 0 0 13 0 0 0 0 0 0 0 22 0 0 385:00 PM 0 0 0 0 2 23 0 0 0 0 0 0 0 33 1 0 595:15 PM 1 0 1 0 1 28 0 0 0 0 0 0 0 15 0 0 46Peak Hour Volume 3 0 4 1 6 88 0 0 0 0 0 3 0 89 2 0 192U-Turn Hourly Volume 0 0 0 0 0
By Approach 7 94 0 91 192TRUCK PERCENTAGES
% Single Unit Trucks 0.0% 0.0% 0.0% 33.3% 3.4% 0.0% 0.0% 0.0% 0.0% 0.0% 4.5% 0.0% 4.7%% Heavy Trucks 0.0% 0.0% 0.0% 0.0% 0.0% 0.0% 0.0% 0.0% 0.0% 0.0% 0.0% 0.0% 0.0%% Trucks (Total) 0.0% 0.0% 0.0% 33.3% 3.4% 0.0% 0.0% 0.0% 0.0% 0.0% 4.5% 0.0%
By Approach 0.0% 5.3% 0.0% 4.4%PEAK HOUR FACTORS
Peak Hour Factor (PHF) 0.75 0 0.50 0.50 0.79 0 0 0 0 0 0.67 0.50By Approach 0.58 0.81 0 0.67
HOURLY VOLUME-ROUNDED 5 0 5 1 5 90 0 0 0 0 0 3 0 90 0 0By Approach 10 95 0 90
DOT Growth Factor Group: None Used
Adjustment Factor Used: 1.000Notes: U-turn volumes included in left-turn volumes.
73rd Street and Main StreetMilwaukeeTwo-Way StopMilwaukee Main Street
195
0.81
4.7%

PEAK HOUR TURNING MOVEMENT COUNT SUMMARY
Intersection:County:Traffic Control:Project:
M.D. PEAKSaturday, January 15, 2011 TotalTRAFFIC VOLUMES 73rd Street From North Main Street From East 73rd Street From South Main Street From West VehicleStart Time Right Thru Left Ped/Bike Right Thru Left Ped/Bike Right Thru Left Ped/Bike Right Thru Left Ped/Bike Volumes
11:15 AM 0 0 0 0 2 12 0 0 0 0 0 0 0 9 1 0 2411:30 AM 1 0 0 0 0 18 0 0 0 0 0 0 0 10 0 0 2911:45 AM 2 0 0 0 4 18 0 0 0 0 0 0 0 8 0 0 3212:00 PM 0 0 1 0 0 13 0 0 0 0 0 0 0 10 1 0 25Peak Hour Volume 3 0 1 0 6 61 0 0 0 0 0 0 0 37 2 0 110U-Turn Hourly Volume 0 0 0 0 0
By Approach 4 67 0 39 110TRUCK PERCENTAGES
% Single Unit Trucks 0.0% 0.0% 0.0% 0.0% 0.0% 0.0% 0.0% 0.0% 0.0% 0.0% 0.0% 0.0% 0.0%% Heavy Trucks 0.0% 0.0% 0.0% 0.0% 0.0% 0.0% 0.0% 0.0% 0.0% 0.0% 0.0% 0.0% 0.0%% Trucks (Total) 0.0% 0.0% 0.0% 0.0% 0.0% 0.0% 0.0% 0.0% 0.0% 0.0% 0.0% 0.0%
By Approach 0.0% 0.0% 0.0% 0.0%PEAK HOUR FACTORS
Peak Hour Factor (PHF) 0.38 0 0.25 0.38 0.85 0 0 0 0 0 0.93 0.50By Approach 0.50 0.76 0 0.89
HOURLY VOLUME-ROUNDED 5 0 0 0 5 60 0 0 0 0 0 0 0 35 0 0By Approach 5 65 0 35
DOT Growth Factor Group: None Used
Adjustment Factor Used: 1.000Notes: U-turn volumes included in left-turn volumes.
73rd Street and Main StreetMilwaukeeTwo-Way StopMilwaukee Main Street
105
0.0%
0.86

PEAK HOUR TURNING MOVEMENT COUNT SUMMARY
Intersection:County:Traffic Control:Project:
P.M. PEAKTuesday, January 11, 2011 TotalTRAFFIC VOLUMES 74th Street From North Main Street From East 74rh Street From South Main Street From West VehicleStart Time Right Thru Left Ped/Bike Right Thru Left Ped/Bike Right Thru Left Ped/Bike Right Thru Left Ped/Bike Volumes
4:30 PM 0 0 0 0 1 17 1 0 5 4 5 0 2 18 0 0 534:45 PM 0 1 0 0 0 22 4 0 6 0 4 0 0 11 0 0 485:00 PM 1 0 0 0 2 16 1 0 11 1 8 0 1 17 0 0 585:15 PM 0 0 0 3 0 22 1 0 8 3 6 1 0 12 0 0 52Peak Hour Volume 1 1 0 3 3 77 7 0 30 8 23 1 3 58 0 0 211U-Turn Hourly Volume 0 0 0 0 0
By Approach 2 87 61 61 211TRUCK PERCENTAGES
% Single Unit Trucks 0.0% 0.0% 0.0% 0.0% 5.2% 28.6% 0.0% 0.0% 0.0% 0.0% 5.2% 0.0% 4.3%% Heavy Trucks 0.0% 0.0% 0.0% 0.0% 0.0% 0.0% 0.0% 0.0% 0.0% 0.0% 0.0% 0.0% 0.0%% Trucks (Total) 0.0% 0.0% 0.0% 0.0% 5.2% 28.6% 0.0% 0.0% 0.0% 0.0% 5.2% 0.0%
By Approach 0.0% 6.9% 0.0% 4.9%PEAK HOUR FACTORS
Peak Hour Factor (PHF) 0.25 0.25 0 0.38 0.88 0.44 0.68 0.50 0.72 0.37 0.81 0By Approach 0.50 0.84 0.76 0.76
HOURLY VOLUME-ROUNDED 0 0 0 3 5 75 5 0 30 10 25 1 5 60 0 0By Approach 0 85 65 65
DOT Growth Factor Group: None Used
Adjustment Factor Used: 1.000Notes: U-turn volumes included in left-turn volumes.
4.3%
215
0.91
74th Street and Main StreetMilwaukeeTwo-Way StopMilwaukee Main Street
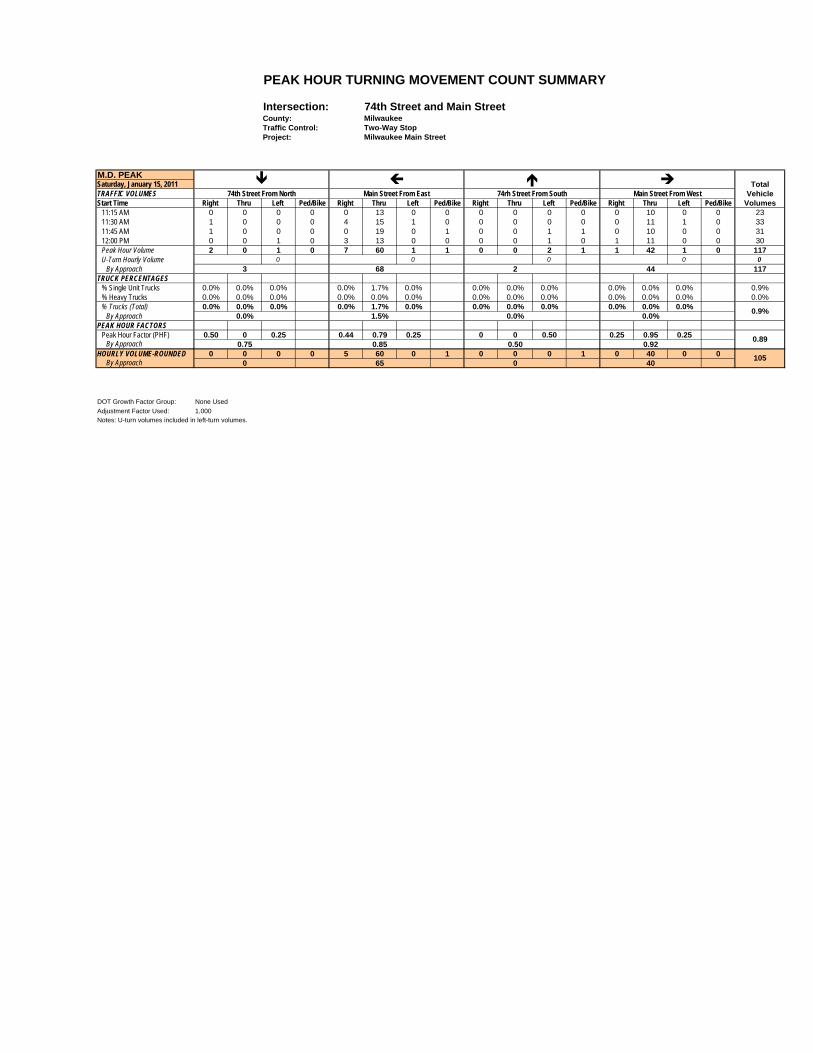
PEAK HOUR TURNING MOVEMENT COUNT SUMMARY
Intersection:County:Traffic Control:Project:
M.D. PEAKSaturday, January 15, 2011 TotalTRAFFIC VOLUMES 74th Street From North Main Street From East 74rh Street From South Main Street From West VehicleStart Time Right Thru Left Ped/Bike Right Thru Left Ped/Bike Right Thru Left Ped/Bike Right Thru Left Ped/Bike Volumes
11:15 AM 0 0 0 0 0 13 0 0 0 0 0 0 0 10 0 0 2311:30 AM 1 0 0 0 4 15 1 0 0 0 0 0 0 11 1 0 3311:45 AM 1 0 0 0 0 19 0 1 0 0 1 1 0 10 0 0 3112:00 PM 0 0 1 0 3 13 0 0 0 0 1 0 1 11 0 0 30Peak Hour Volume 2 0 1 0 7 60 1 1 0 0 2 1 1 42 1 0 117U-Turn Hourly Volume 0 0 0 0 0
By Approach 3 68 2 44 117TRUCK PERCENTAGES
% Single Unit Trucks 0.0% 0.0% 0.0% 0.0% 1.7% 0.0% 0.0% 0.0% 0.0% 0.0% 0.0% 0.0% 0.9%% Heavy Trucks 0.0% 0.0% 0.0% 0.0% 0.0% 0.0% 0.0% 0.0% 0.0% 0.0% 0.0% 0.0% 0.0%% Trucks (Total) 0.0% 0.0% 0.0% 0.0% 1.7% 0.0% 0.0% 0.0% 0.0% 0.0% 0.0% 0.0%
By Approach 0.0% 1.5% 0.0% 0.0%PEAK HOUR FACTORS
Peak Hour Factor (PHF) 0.50 0 0.25 0.44 0.79 0.25 0 0 0.50 0.25 0.95 0.25By Approach 0.75 0.85 0.50 0.92
HOURLY VOLUME-ROUNDED 0 0 0 0 5 60 0 1 0 0 0 1 0 40 0 0By Approach 0 65 0 40
DOT Growth Factor Group: None Used
Adjustment Factor Used: 1.000Notes: U-turn volumes included in left-turn volumes.
105
0.9%
0.89
74th Street and Main StreetMilwaukeeTwo-Way StopMilwaukee Main Street

PEAK HOUR TURNING MOVEMENT COUNT SUMMARY
Intersection:County:Traffic Control:Project:
P.M. PEAKThursday, January 13, 2011 TotalTRAFFIC VOLUMES 75th Street From North Main Street From East 75th Street From South Main Street From West VehicleStart Time Right Thru Left Ped/Bike Right Thru Left Ped/Bike Right Thru Left Ped/Bike Right Thru Left Ped/Bike Volumes
4:30 PM 3 0 0 0 1 42 0 0 0 0 0 0 0 14 2 0 624:45 PM 0 0 0 0 2 27 0 0 0 0 0 0 0 23 1 0 535:00 PM 0 0 1 1 2 34 0 0 0 0 0 0 0 26 3 1 665:15 PM 0 0 0 0 0 31 0 0 0 0 0 0 0 17 3 1 51Peak Hour Volume 3 0 1 1 5 134 0 0 0 0 0 0 0 80 9 2 232U-Turn Hourly Volume 0 0 0 2 2
By Approach 4 139 0 89 232TRUCK PERCENTAGES
% Single Unit Trucks 0.0% 0.0% 0.0% 20.0% 0.7% 0.0% 0.0% 0.0% 0.0% 0.0% 0.0% 0.0% 0.9%% Heavy Trucks 0.0% 0.0% 0.0% 0.0% 0.0% 0.0% 0.0% 0.0% 0.0% 0.0% 0.0% 0.0% 0.0%% Trucks (Total) 0.0% 0.0% 0.0% 20.0% 0.7% 0.0% 0.0% 0.0% 0.0% 0.0% 0.0% 0.0%
By Approach 0.0% 1.4% 0.0% 0.0%PEAK HOUR FACTORS
Peak Hour Factor (PHF) 0.25 0 0.25 0.63 0.80 0 0 0 0 0 0.77 0.75By Approach 0.33 0.81 0 0.77
HOURLY VOLUME-ROUNDED 5 0 0 1 5 135 0 0 0 0 0 0 0 80 10 2By Approach 5 140 0 90
DOT Growth Factor Group: None Used
Adjustment Factor Used: 1.000Notes: U-turn volumes included in left-turn volumes.
0.9%
235
0.88
75th Street and Main StreetMilwaukeeTwo-Way StopMilwaukee Main Street
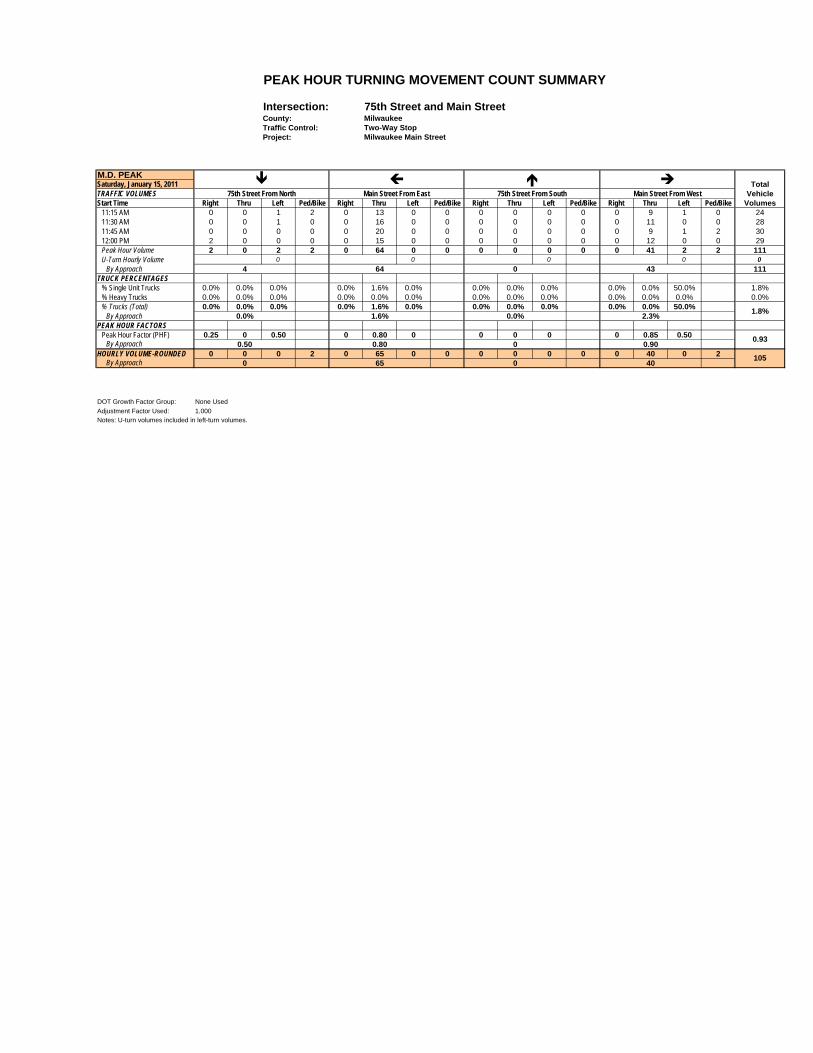
PEAK HOUR TURNING MOVEMENT COUNT SUMMARY
Intersection:County:Traffic Control:Project:
M.D. PEAKSaturday, January 15, 2011 TotalTRAFFIC VOLUMES 75th Street From North Main Street From East 75th Street From South Main Street From West VehicleStart Time Right Thru Left Ped/Bike Right Thru Left Ped/Bike Right Thru Left Ped/Bike Right Thru Left Ped/Bike Volumes
11:15 AM 0 0 1 2 0 13 0 0 0 0 0 0 0 9 1 0 2411:30 AM 0 0 1 0 0 16 0 0 0 0 0 0 0 11 0 0 2811:45 AM 0 0 0 0 0 20 0 0 0 0 0 0 0 9 1 2 3012:00 PM 2 0 0 0 0 15 0 0 0 0 0 0 0 12 0 0 29Peak Hour Volume 2 0 2 2 0 64 0 0 0 0 0 0 0 41 2 2 111U-Turn Hourly Volume 0 0 0 0 0
By Approach 4 64 0 43 111TRUCK PERCENTAGES
% Single Unit Trucks 0.0% 0.0% 0.0% 0.0% 1.6% 0.0% 0.0% 0.0% 0.0% 0.0% 0.0% 50.0% 1.8%% Heavy Trucks 0.0% 0.0% 0.0% 0.0% 0.0% 0.0% 0.0% 0.0% 0.0% 0.0% 0.0% 0.0% 0.0%% Trucks (Total) 0.0% 0.0% 0.0% 0.0% 1.6% 0.0% 0.0% 0.0% 0.0% 0.0% 0.0% 50.0%
By Approach 0.0% 1.6% 0.0% 2.3%PEAK HOUR FACTORS
Peak Hour Factor (PHF) 0.25 0 0.50 0 0.80 0 0 0 0 0 0.85 0.50By Approach 0.50 0.80 0 0.90
HOURLY VOLUME-ROUNDED 0 0 0 2 0 65 0 0 0 0 0 0 0 40 0 2By Approach 0 65 0 40
DOT Growth Factor Group: None Used
Adjustment Factor Used: 1.000Notes: U-turn volumes included in left-turn volumes.
75th Street and Main StreetMilwaukeeTwo-Way StopMilwaukee Main Street
105
1.8%
0.93

PEAK HOUR TURNING MOVEMENT COUNT SUMMARY
Intersection:County:Traffic Control:Project:
P.M. PEAKThursday, January 13, 2011 TotalTRAFFIC VOLUMES 76th Street From North Main Street From East 76th Street From South Main Street From West VehicleStart Time Right Thru Left Ped/Bike Right Thru Left Ped/Bike Right Thru Left Ped/Bike Right Thru Left Ped/Bike Volumes
4:30 PM 7 124 5 0 11 10 18 0 6 80 3 0 9 1 4 0 2784:45 PM 9 123 9 2 14 5 17 3 9 97 11 1 9 9 6 0 3185:00 PM 3 128 8 1 18 5 11 0 16 100 0 0 12 6 10 0 3175:15 PM 9 141 7 1 13 7 13 1 7 87 6 0 13 3 11 0 317Peak Hour Volume 28 516 29 4 56 27 59 4 38 364 20 1 43 19 31 0 1,230U-Turn Hourly Volume 0 0 2 0 2
By Approach 573 142 422 93 1,230TRUCK PERCENTAGES
% Single Unit Trucks 0.0% 1.4% 0.0% 1.8% 0.0% 0.0% 0.0% 1.1% 0.0% 0.0% 0.0% 6.5% 1.1%% Heavy Trucks 0.0% 0.0% 0.0% 0.0% 0.0% 0.0% 0.0% 0.0% 0.0% 0.0% 0.0% 0.0% 0.0%% Trucks (Total) 0.0% 1.4% 0.0% 1.8% 0.0% 0.0% 0.0% 1.1% 0.0% 0.0% 0.0% 6.5%
By Approach 1.3% 0.7% 1.0% 2.2%PEAK HOUR FACTORS
Peak Hour Factor (PHF) 0.78 0.91 0.81 0.78 0.68 0.82 0.59 0.91 0.45 0.83 0.53 0.70By Approach 0.91 0.91 0.90 0.83
HOURLY VOLUME-ROUNDED 30 515 30 4 55 25 60 4 40 365 20 1 45 20 30 0By Approach 575 140 425 95
DOT Growth Factor Group: None Used
Adjustment Factor Used: 1.000Notes: U-turn volumes included in left-turn volumes.
1.1%
1,235
0.97
76th Street and Main StreetMilwaukeeTraffic SignalMilwaukee Main Street

PEAK HOUR TURNING MOVEMENT COUNT SUMMARY
Intersection:County:Traffic Control:Project:
M.D. PEAKSaturday, January 08, 2011 TotalTRAFFIC VOLUMES 76th Street From North Main Street From East 76th Street From South Main Street From West VehicleStart Time Right Thru Left Ped/Bike Right Thru Left Ped/Bike Right Thru Left Ped/Bike Right Thru Left Ped/Bike Volumes
11:15 AM 6 47 1 0 3 5 9 0 7 64 4 0 10 2 6 0 16411:30 AM 6 54 1 0 12 6 13 3 3 56 4 0 8 5 1 0 16911:45 AM 7 47 3 0 6 5 8 0 5 57 6 0 7 5 5 1 16112:00 PM 5 67 2 0 2 6 7 0 8 58 2 0 11 5 7 0 180Peak Hour Volume 24 215 7 0 23 22 37 3 23 235 16 0 36 17 19 1 674U-Turn Hourly Volume 1 0 0 0 1
By Approach 246 82 274 72 674TRUCK PERCENTAGES
% Single Unit Trucks 0.0% 0.9% 0.0% 0.0% 0.0% 0.0% 0.0% 0.9% 0.0% 0.0% 0.0% 0.0% 0.6%% Heavy Trucks 0.0% 0.0% 0.0% 8.7% 0.0% 0.0% 0.0% 0.0% 0.0% 0.0% 0.0% 5.3% 0.4%% Trucks (Total) 0.0% 0.9% 0.0% 8.7% 0.0% 0.0% 0.0% 0.9% 0.0% 0.0% 0.0% 5.3%
By Approach 0.8% 2.4% 0.8% 1.4%PEAK HOUR FACTORS
Peak Hour Factor (PHF) 0.86 0.80 0.58 0.48 0.92 0.71 0.72 0.92 0.67 0.82 0.85 0.68By Approach 0.83 0.66 0.91 0.78
HOURLY VOLUME-ROUNDED 25 215 5 0 25 20 35 3 25 235 15 0 35 15 20 1By Approach 245 80 275 70
DOT Growth Factor Group: None Used
Adjustment Factor Used: 1.000Notes: U-turn volumes included in left-turn volumes.
76th Street and Main StreetMilwaukeeTraffic SignalMilwaukee Main Street
670
1.0%
0.94

File Name : Dickenson-70th SATSite Code : 00000000Start Date : 1/15/2011Page No : 1
MilwaukeeSaturday Midday
LO.
Groups Printed- Unshifted - Bank 1 - Bank 270TH ST
From NorthDICKINSON ST
From East70TH ST
From SouthDICKINSON ST
From West
Start Time Left Thru Right Peds Left Thru Right Peds Left Thru Right Peds Left Thru Right Peds Int. Total
Factor 1.0 1.0 1.0 1.0 1.0 1.0 1.0 1.0 1.0 1.0 1.0 1.0 1.0 1.0 1.0 1.0*** BREAK ***
11:00 AM 2 98 0 0 5 0 2 1 0 80 3 0 0 0 0 0 19111:15 AM 0 117 0 0 3 0 3 0 0 96 6 0 0 0 0 1 22611:30 AM 2 101 0 0 0 0 3 0 0 96 5 0 1 0 0 0 20811:45 AM 1 114 0 0 2 0 0 0 0 116 4 0 0 0 0 1 238
Total 5 430 0 0 10 0 8 1 0 388 18 0 1 0 0 2 863
12:00 PM 0 102 0 0 1 0 0 1 0 98 5 0 0 0 0 1 20812:15 PM 2 79 0 0 3 0 1 1 0 107 5 0 0 0 0 0 19812:30 PM 3 94 0 0 1 0 1 2 0 111 8 0 0 0 0 0 22012:45 PM 1 104 0 0 2 0 0 0 0 105 4 0 0 0 0 0 216
Total 6 379 0 0 7 0 2 4 0 421 22 0 0 0 0 1 842
*** BREAK ***
Grand Total 11 809 0 0 17 0 10 5 0 809 40 0 1 0 0 3 1705Apprch % 1.3 98.7 0 0 53.1 0 31.2 15.6 0 95.3 4.7 0 25 0 0 75
Total % 0.6 47.4 0 0 1 0 0.6 0.3 0 47.4 2.3 0 0.1 0 0 0.2Unshifted 11 797 0 0 17 0 10 5 0 798 40 0 1 0 0 3 1682
% Unshifted 100 98.5 0 0 100 0 100 100 0 98.6 100 0 100 0 0 100 98.7Bank 1 0 10 0 0 0 0 0 0 0 9 0 0 0 0 0 0 19
% Bank 1 0 1.2 0 0 0 0 0 0 0 1.1 0 0 0 0 0 0 1.1Bank 2 0 2 0 0 0 0 0 0 0 2 0 0 0 0 0 0 4
% Bank 2 0 0.2 0 0 0 0 0 0 0 0.2 0 0 0 0 0 0 0.2

File Name : Dickenson-70th SATSite Code : 00000000Start Date : 1/15/2011Page No : 1
MilwaukeeSaturday Midday
LO.
Groups Printed- Bank 1 - Bank 270TH ST
From NorthDICKINSON ST
From East70TH ST
From SouthDICKINSON ST
From West
Start Time Left Thru Right Peds Left Thru Right Peds Left Thru Right Peds Left Thru Right Peds Int. Total
Factor 1.0 1.0 1.0 1.0 1.0 1.0 1.0 1.0 1.0 1.0 1.0 1.0 1.0 1.0 1.0 1.0*** BREAK ***
11:00 AM 0 1 0 0 0 0 0 0 0 2 0 0 0 0 0 0 311:15 AM 0 1 0 0 0 0 0 0 0 4 0 0 0 0 0 0 511:30 AM 0 2 0 0 0 0 0 0 0 2 0 0 0 0 0 0 411:45 AM 0 0 0 0 0 0 0 0 0 1 0 0 0 0 0 0 1
Total 0 4 0 0 0 0 0 0 0 9 0 0 0 0 0 0 13
12:00 PM 0 3 0 0 0 0 0 0 0 0 0 0 0 0 0 0 312:15 PM 0 1 0 0 0 0 0 0 0 0 0 0 0 0 0 0 112:30 PM 0 3 0 0 0 0 0 0 0 2 0 0 0 0 0 0 512:45 PM 0 1 0 0 0 0 0 0 0 0 0 0 0 0 0 0 1
Total 0 8 0 0 0 0 0 0 0 2 0 0 0 0 0 0 10
*** BREAK ***
Grand Total 0 12 0 0 0 0 0 0 0 11 0 0 0 0 0 0 23Apprch % 0 100 0 0 0 0 0 0 0 100 0 0 0 0 0 0
Total % 0 52.2 0 0 0 0 0 0 0 47.8 0 0 0 0 0 0Bank 1 0 10 0 0 0 0 0 0 0 9 0 0 0 0 0 0 19
% Bank 1 0 83.3 0 0 0 0 0 0 0 81.8 0 0 0 0 0 0 82.6Bank 2 0 2 0 0 0 0 0 0 0 2 0 0 0 0 0 0 4
% Bank 2 0 16.7 0 0 0 0 0 0 0 18.2 0 0 0 0 0 0 17.4

File Name : Dickenson-70thSt 12hrSite Code : 00000000Start Date : 1/13/2011Page No : 1
MilwaukeeWeekday
AH.
Groups Printed- Unshifted - Bank 1 - Bank 270TH ST
From NorthW DICKINSON ST
From East70TH ST
From SouthW DICKINSON ST
From West
Start Time Left Thru Right Peds Left Thru Right Peds Left Thru Right Peds Left Thru Right Peds Int. Total
Factor 1.0 1.0 1.0 1.0 1.0 1.0 1.0 1.0 1.0 1.0 1.0 1.0 1.0 1.0 1.0 1.006:00 AM 1 59 0 0 0 0 3 1 0 54 2 0 0 0 0 0 12006:15 AM 2 69 0 0 2 0 0 0 0 37 3 0 0 0 0 0 11306:30 AM 2 102 0 0 0 0 0 0 1 70 0 0 0 0 0 0 17506:45 AM 4 173 0 0 2 0 3 0 0 53 5 0 0 0 0 1 241
Total 9 403 0 0 4 0 6 1 1 214 10 0 0 0 0 1 649
07:00 AM 1 150 0 0 0 0 1 0 0 76 3 0 0 0 0 0 23107:15 AM 0 160 2 0 2 0 1 0 1 94 6 0 0 0 0 0 26607:30 AM 0 192 2 0 3 0 2 0 1 128 3 0 0 0 1 0 33207:45 AM 1 293 0 0 4 0 0 0 0 122 8 0 0 0 0 0 428
Total 2 795 4 0 9 0 4 0 2 420 20 0 0 0 1 0 1257
08:00 AM 0 256 1 0 4 0 1 1 0 92 3 0 0 0 0 0 35808:15 AM 0 199 0 0 0 0 2 0 0 89 3 1 0 0 0 2 29608:30 AM 0 175 0 0 2 0 1 1 0 80 3 0 0 0 0 1 26308:45 AM 0 195 0 0 2 0 0 0 0 102 3 0 0 0 0 0 302
Total 0 825 1 0 8 0 4 2 0 363 12 1 0 0 0 3 1219
09:00 AM 0 132 0 0 1 0 1 0 0 73 5 0 0 0 0 0 21209:15 AM 0 118 0 0 1 0 0 1 1 68 1 0 1 0 1 1 19309:30 AM 0 122 0 0 2 0 1 1 0 100 4 0 0 0 2 0 23209:45 AM 3 126 0 0 1 0 4 2 0 82 4 0 1 1 1 0 225
Total 3 498 0 0 5 0 6 4 1 323 14 0 2 1 4 1 862
10:00 AM 0 107 0 0 3 0 0 2 0 89 4 0 0 0 0 1 20610:15 AM 3 109 0 0 5 0 1 1 1 116 0 0 0 0 0 0 23610:30 AM 0 119 0 0 0 0 1 0 2 102 1 0 0 0 0 1 22610:45 AM 1 117 0 0 1 0 1 1 0 99 5 0 0 0 0 0 225
Total 4 452 0 0 9 0 3 4 3 406 10 0 0 0 0 2 893
11:00 AM 1 94 0 0 1 0 1 1 0 116 7 0 0 0 0 1 22211:15 AM 3 127 0 0 2 0 1 0 0 120 1 0 0 0 0 0 25411:30 AM 0 117 0 0 4 0 2 0 0 152 5 0 1 0 0 0 28111:45 AM 0 144 1 0 4 0 3 0 1 165 7 0 0 0 0 0 325
Total 4 482 1 0 11 0 7 1 1 553 20 0 1 0 0 1 1082
12:00 PM 1 152 0 0 6 0 0 0 1 148 9 0 0 1 0 0 31812:15 PM 0 154 1 0 3 0 1 0 1 156 4 0 0 0 0 1 32112:30 PM 1 182 0 0 2 0 0 1 1 151 8 0 0 0 0 1 34712:45 PM 0 172 0 0 8 0 1 1 1 130 6 0 0 0 0 0 319
Total 2 660 1 0 19 0 2 2 4 585 27 0 0 1 0 2 1305
01:00 PM 0 159 0 0 2 0 1 2 1 145 5 1 0 0 0 0 31601:15 PM 1 128 0 1 2 0 1 1 1 145 1 0 0 0 1 3 28501:30 PM 1 120 0 0 5 0 4 1 0 137 3 0 0 0 0 1 27201:45 PM 0 130 0 0 4 0 0 0 0 130 4 1 1 0 0 0 270
Total 2 537 0 1 13 0 6 4 2 557 13 2 1 0 1 4 1143
02:00 PM 1 131 0 0 0 0 3 2 0 139 8 0 0 0 0 2 28602:15 PM 3 141 0 0 1 0 2 1 0 138 1 0 0 0 0 0 28702:30 PM 1 116 1 0 2 0 0 1 1 179 9 0 0 0 2 1 31302:45 PM 1 133 0 0 3 0 2 0 0 156 1 0 0 0 0 0 296
Total 6 521 1 0 6 0 7 4 1 612 19 0 0 0 2 3 1182
03:00 PM 1 132 1 1 3 0 1 3 2 168 3 1 1 0 0 2 31903:15 PM 3 158 0 0 4 0 1 2 1 160 7 1 0 0 2 1 34003:30 PM 1 123 0 0 3 0 2 0 0 225 12 0 0 1 0 1 36803:45 PM 2 158 0 0 3 0 2 1 2 208 3 0 0 0 0 0 379
Total 7 571 1 1 13 0 6 6 5 761 25 2 1 1 2 4 1406

File Name : Dickenson-70thSt 12hrSite Code : 00000000Start Date : 1/13/2011Page No : 2
MilwaukeeWeekday
AH.
Groups Printed- Unshifted - Bank 1 - Bank 270TH ST
From NorthW DICKINSON ST
From East70TH ST
From SouthW DICKINSON ST
From West
Start Time Left Thru Right Peds Left Thru Right Peds Left Thru Right Peds Left Thru Right Peds Int. Total
Factor 1.0 1.0 1.0 1.0 1.0 1.0 1.0 1.0 1.0 1.0 1.0 1.0 1.0 1.0 1.0 1.004:00 PM 4 133 1 0 3 0 1 1 0 268 13 0 0 0 1 2 42704:15 PM 2 159 1 0 8 0 1 0 0 222 7 0 0 0 1 0 40104:30 PM 0 134 0 0 1 0 2 2 0 303 13 0 0 0 0 0 45504:45 PM 4 151 0 0 2 0 0 0 0 211 10 0 0 0 0 0 378
Total 10 577 2 0 14 0 4 3 0 1004 43 0 0 0 2 2 1661
05:00 PM 0 142 0 0 2 0 1 3 0 307 16 0 0 0 1 0 47205:15 PM 0 145 0 0 0 1 1 0 0 264 15 0 0 0 0 0 42605:30 PM 1 129 0 0 5 0 1 1 0 195 6 0 0 0 0 0 33805:45 PM 0 121 0 0 1 0 0 1 0 161 10 0 0 0 0 0 294
Total 1 537 0 0 8 1 3 5 0 927 47 0 0 0 1 0 1530
Grand Total 50 6858 11 2 119 1 58 36 20 6725 260 5 5 3 13 23 14189Apprch % 0.7 99.1 0.2 0 55.6 0.5 27.1 16.8 0.3 95.9 3.7 0.1 11.4 6.8 29.5 52.3
Total % 0.4 48.3 0.1 0 0.8 0 0.4 0.3 0.1 47.4 1.8 0 0 0 0.1 0.2Unshifted 49 6676 11 1 117 1 56 32 18 6533 258 3 5 3 10 18 13791
% Unshifted 98 97.3 100 50 98.3 100 96.6 88.9 90 97.1 99.2 60 100 100 76.9 78.3 97.2Bank 1 1 138 0 0 2 0 2 4 0 148 2 1 0 0 3 5 306
% Bank 1 2 2 0 0 1.7 0 3.4 11.1 0 2.2 0.8 20 0 0 23.1 21.7 2.2Bank 2 0 44 0 1 0 0 0 0 2 44 0 1 0 0 0 0 92
% Bank 2 0 0.6 0 50 0 0 0 0 10 0.7 0 20 0 0 0 0 0.6

File Name : Dickenson-70thSt 12hrSite Code : 00000000Start Date : 1/13/2011Page No : 1
MilwaukeeWeekday
AH.
Groups Printed- Bank 1 - Bank 270TH ST
From NorthW DICKINSON ST
From East70TH ST
From SouthW DICKINSON ST
From West
Start Time Left Thru Right Peds Left Thru Right Peds Left Thru Right Peds Left Thru Right Peds Int. Total
Factor 1.0 1.0 1.0 1.0 1.0 1.0 1.0 1.0 1.0 1.0 1.0 1.0 1.0 1.0 1.0 1.006:00 AM 0 3 0 0 0 0 0 0 0 2 0 0 0 0 0 0 506:15 AM 0 2 0 0 1 0 0 0 0 1 1 0 0 0 0 0 506:30 AM 0 4 0 0 0 0 0 0 0 4 0 0 0 0 0 0 806:45 AM 1 0 0 0 0 0 0 0 0 2 0 0 0 0 0 0 3
Total 1 9 0 0 1 0 0 0 0 9 1 0 0 0 0 0 21
07:00 AM 0 1 0 0 0 0 0 0 0 4 0 0 0 0 0 0 507:15 AM 0 1 0 0 0 0 0 0 0 2 0 0 0 0 0 0 307:30 AM 0 2 0 0 0 0 0 0 0 5 0 0 0 0 0 0 707:45 AM 0 2 0 0 0 0 0 0 0 2 0 0 0 0 0 0 4
Total 0 6 0 0 0 0 0 0 0 13 0 0 0 0 0 0 19
08:00 AM 0 6 0 0 0 0 0 0 0 3 0 0 0 0 0 0 908:15 AM 0 2 0 0 0 0 0 0 0 3 0 0 0 0 0 0 508:30 AM 0 8 0 0 0 0 0 0 0 2 0 0 0 0 0 1 1108:45 AM 0 5 0 0 0 0 0 0 0 9 0 0 0 0 0 0 14
Total 0 21 0 0 0 0 0 0 0 17 0 0 0 0 0 1 39
09:00 AM 0 5 0 0 0 0 0 0 0 7 0 0 0 0 0 0 1209:15 AM 0 3 0 0 0 0 0 0 0 1 0 0 0 0 0 0 409:30 AM 0 2 0 0 0 0 0 1 0 6 0 0 0 0 0 0 909:45 AM 0 4 0 0 0 0 0 0 0 3 0 0 0 0 0 0 7
Total 0 14 0 0 0 0 0 1 0 17 0 0 0 0 0 0 32
10:00 AM 0 4 0 0 0 0 0 0 0 6 0 0 0 0 0 1 1110:15 AM 0 9 0 0 0 0 0 0 0 5 0 0 0 0 0 0 1410:30 AM 0 9 0 0 0 0 0 0 1 6 0 0 0 0 0 0 1610:45 AM 0 5 0 0 0 0 0 0 0 8 0 0 0 0 0 0 13
Total 0 27 0 0 0 0 0 0 1 25 0 0 0 0 0 1 54
11:00 AM 0 3 0 0 0 0 0 0 0 2 0 0 0 0 0 0 511:15 AM 0 7 0 0 0 0 0 0 0 6 0 0 0 0 0 0 1311:30 AM 0 3 0 0 0 0 0 0 0 5 0 0 0 0 0 0 811:45 AM 0 7 0 0 0 0 1 0 1 3 0 0 0 0 0 0 12
Total 0 20 0 0 0 0 1 0 1 16 0 0 0 0 0 0 38
12:00 PM 0 6 0 0 0 0 0 0 0 11 0 0 0 0 0 0 1712:15 PM 0 9 0 0 0 0 0 0 0 5 0 0 0 0 0 1 1512:30 PM 0 6 0 0 0 0 0 0 0 7 0 0 0 0 0 1 1412:45 PM 0 4 0 0 0 0 0 0 0 4 1 0 0 0 0 0 9
Total 0 25 0 0 0 0 0 0 0 27 1 0 0 0 0 2 55
01:00 PM 0 5 0 0 0 0 0 0 0 4 0 1 0 0 0 0 1001:15 PM 0 1 0 1 0 0 0 0 0 8 0 0 0 0 1 0 1101:30 PM 0 2 0 0 1 0 1 0 0 1 0 0 0 0 0 1 601:45 PM 0 4 0 0 0 0 0 0 0 4 0 0 0 0 0 0 8
Total 0 12 0 1 1 0 1 0 0 17 0 1 0 0 1 1 35
02:00 PM 0 3 0 0 0 0 0 0 0 7 0 0 0 0 0 0 1002:15 PM 0 3 0 0 0 0 0 0 0 4 0 0 0 0 0 0 702:30 PM 0 3 0 0 0 0 0 0 0 2 0 0 0 0 1 0 602:45 PM 0 0 0 0 0 0 0 0 0 7 0 0 0 0 0 0 7
Total 0 9 0 0 0 0 0 0 0 20 0 0 0 0 1 0 30
03:00 PM 0 7 0 0 0 0 0 0 0 2 0 0 0 0 0 0 903:15 PM 0 3 0 0 0 0 0 1 0 2 0 1 0 0 0 0 703:30 PM 0 6 0 0 0 0 0 0 0 5 0 0 0 0 0 0 1103:45 PM 0 4 0 0 0 0 0 1 0 7 0 0 0 0 0 0 12
Total 0 20 0 0 0 0 0 2 0 16 0 1 0 0 0 0 39
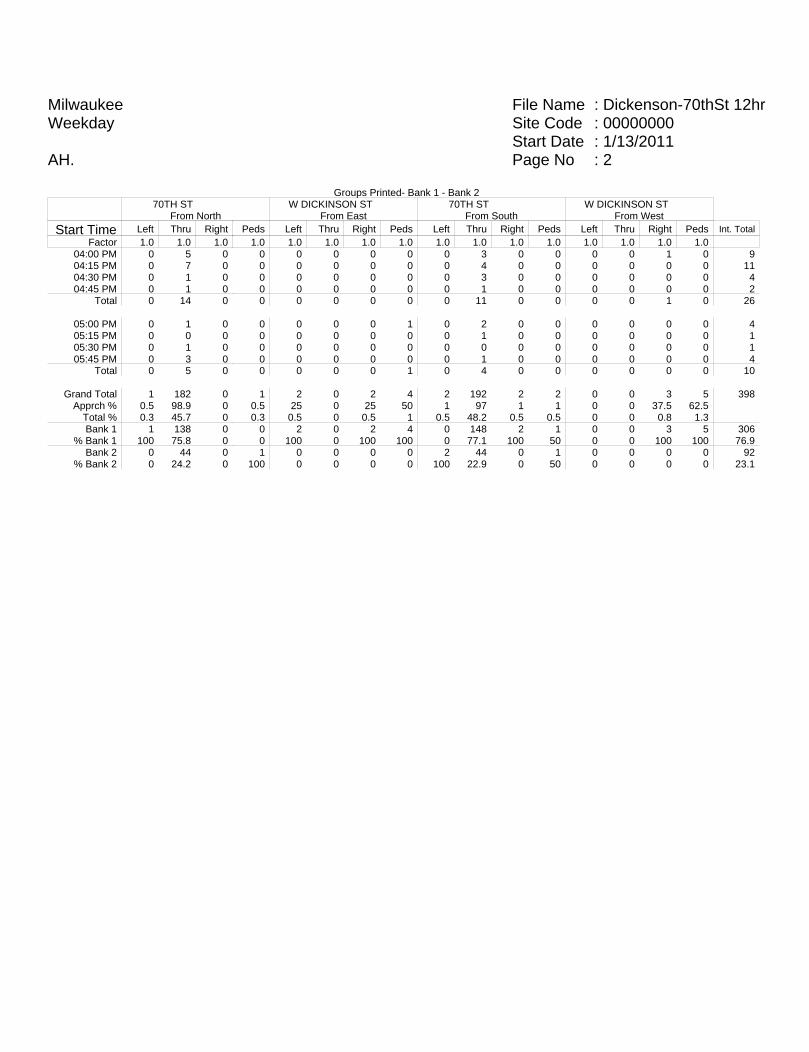
File Name : Dickenson-70thSt 12hrSite Code : 00000000Start Date : 1/13/2011Page No : 2
MilwaukeeWeekday
AH.
Groups Printed- Bank 1 - Bank 270TH ST
From NorthW DICKINSON ST
From East70TH ST
From SouthW DICKINSON ST
From West
Start Time Left Thru Right Peds Left Thru Right Peds Left Thru Right Peds Left Thru Right Peds Int. Total
Factor 1.0 1.0 1.0 1.0 1.0 1.0 1.0 1.0 1.0 1.0 1.0 1.0 1.0 1.0 1.0 1.004:00 PM 0 5 0 0 0 0 0 0 0 3 0 0 0 0 1 0 904:15 PM 0 7 0 0 0 0 0 0 0 4 0 0 0 0 0 0 1104:30 PM 0 1 0 0 0 0 0 0 0 3 0 0 0 0 0 0 404:45 PM 0 1 0 0 0 0 0 0 0 1 0 0 0 0 0 0 2
Total 0 14 0 0 0 0 0 0 0 11 0 0 0 0 1 0 26
05:00 PM 0 1 0 0 0 0 0 1 0 2 0 0 0 0 0 0 405:15 PM 0 0 0 0 0 0 0 0 0 1 0 0 0 0 0 0 105:30 PM 0 1 0 0 0 0 0 0 0 0 0 0 0 0 0 0 105:45 PM 0 3 0 0 0 0 0 0 0 1 0 0 0 0 0 0 4
Total 0 5 0 0 0 0 0 1 0 4 0 0 0 0 0 0 10
Grand Total 1 182 0 1 2 0 2 4 2 192 2 2 0 0 3 5 398Apprch % 0.5 98.9 0 0.5 25 0 25 50 1 97 1 1 0 0 37.5 62.5
Total % 0.3 45.7 0 0.3 0.5 0 0.5 1 0.5 48.2 0.5 0.5 0 0 0.8 1.3Bank 1 1 138 0 0 2 0 2 4 0 148 2 1 0 0 3 5 306
% Bank 1 100 75.8 0 0 100 0 100 100 0 77.1 100 50 0 0 100 100 76.9Bank 2 0 44 0 1 0 0 0 0 2 44 0 1 0 0 0 0 92
% Bank 2 0 24.2 0 100 0 0 0 0 100 22.9 0 50 0 0 0 0 23.1
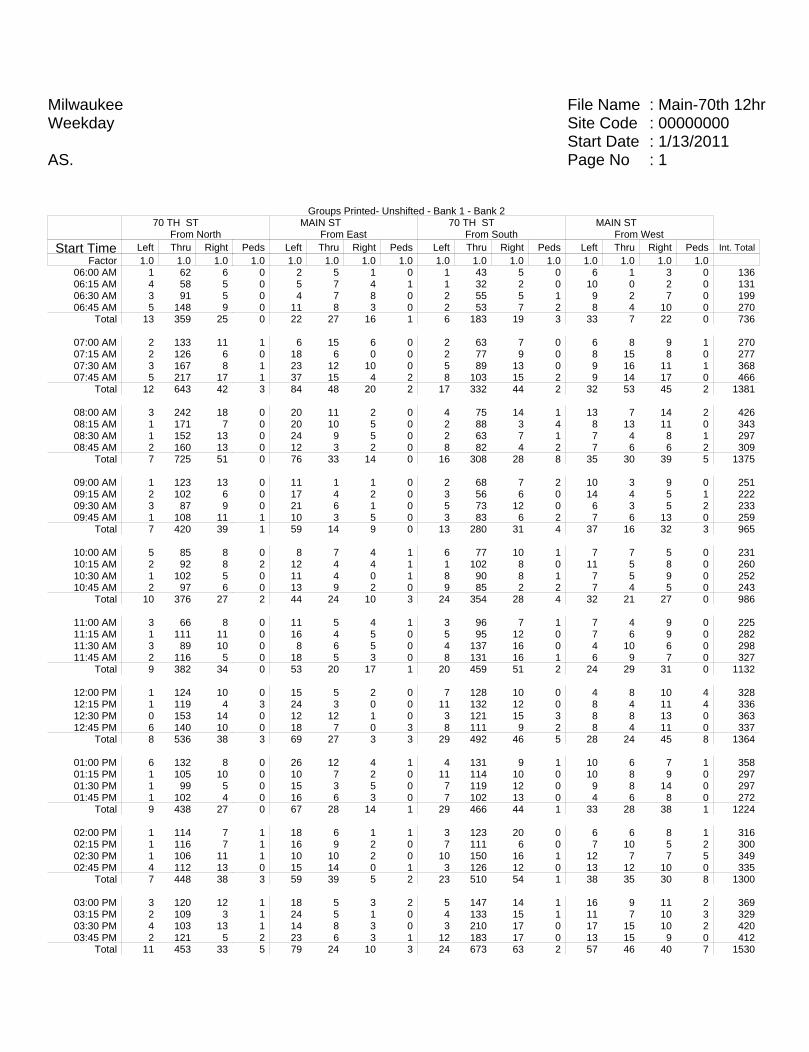
File Name : Main-70th 12hrSite Code : 00000000Start Date : 1/13/2011Page No : 1
MilwaukeeWeekday
AS.
Groups Printed- Unshifted - Bank 1 - Bank 270 TH ST
From NorthMAIN ST
From East70 TH ST
From SouthMAIN ST
From West
Start Time Left Thru Right Peds Left Thru Right Peds Left Thru Right Peds Left Thru Right Peds Int. Total
Factor 1.0 1.0 1.0 1.0 1.0 1.0 1.0 1.0 1.0 1.0 1.0 1.0 1.0 1.0 1.0 1.006:00 AM 1 62 6 0 2 5 1 0 1 43 5 0 6 1 3 0 13606:15 AM 4 58 5 0 5 7 4 1 1 32 2 0 10 0 2 0 13106:30 AM 3 91 5 0 4 7 8 0 2 55 5 1 9 2 7 0 19906:45 AM 5 148 9 0 11 8 3 0 2 53 7 2 8 4 10 0 270
Total 13 359 25 0 22 27 16 1 6 183 19 3 33 7 22 0 736
07:00 AM 2 133 11 1 6 15 6 0 2 63 7 0 6 8 9 1 27007:15 AM 2 126 6 0 18 6 0 0 2 77 9 0 8 15 8 0 27707:30 AM 3 167 8 1 23 12 10 0 5 89 13 0 9 16 11 1 36807:45 AM 5 217 17 1 37 15 4 2 8 103 15 2 9 14 17 0 466
Total 12 643 42 3 84 48 20 2 17 332 44 2 32 53 45 2 1381
08:00 AM 3 242 18 0 20 11 2 0 4 75 14 1 13 7 14 2 42608:15 AM 1 171 7 0 20 10 5 0 2 88 3 4 8 13 11 0 34308:30 AM 1 152 13 0 24 9 5 0 2 63 7 1 7 4 8 1 29708:45 AM 2 160 13 0 12 3 2 0 8 82 4 2 7 6 6 2 309
Total 7 725 51 0 76 33 14 0 16 308 28 8 35 30 39 5 1375
09:00 AM 1 123 13 0 11 1 1 0 2 68 7 2 10 3 9 0 25109:15 AM 2 102 6 0 17 4 2 0 3 56 6 0 14 4 5 1 22209:30 AM 3 87 9 0 21 6 1 0 5 73 12 0 6 3 5 2 23309:45 AM 1 108 11 1 10 3 5 0 3 83 6 2 7 6 13 0 259
Total 7 420 39 1 59 14 9 0 13 280 31 4 37 16 32 3 965
10:00 AM 5 85 8 0 8 7 4 1 6 77 10 1 7 7 5 0 23110:15 AM 2 92 8 2 12 4 4 1 1 102 8 0 11 5 8 0 26010:30 AM 1 102 5 0 11 4 0 1 8 90 8 1 7 5 9 0 25210:45 AM 2 97 6 0 13 9 2 0 9 85 2 2 7 4 5 0 243
Total 10 376 27 2 44 24 10 3 24 354 28 4 32 21 27 0 986
11:00 AM 3 66 8 0 11 5 4 1 3 96 7 1 7 4 9 0 22511:15 AM 1 111 11 0 16 4 5 0 5 95 12 0 7 6 9 0 28211:30 AM 3 89 10 0 8 6 5 0 4 137 16 0 4 10 6 0 29811:45 AM 2 116 5 0 18 5 3 0 8 131 16 1 6 9 7 0 327
Total 9 382 34 0 53 20 17 1 20 459 51 2 24 29 31 0 1132
12:00 PM 1 124 10 0 15 5 2 0 7 128 10 0 4 8 10 4 32812:15 PM 1 119 4 3 24 3 0 0 11 132 12 0 8 4 11 4 33612:30 PM 0 153 14 0 12 12 1 0 3 121 15 3 8 8 13 0 36312:45 PM 6 140 10 0 18 7 0 3 8 111 9 2 8 4 11 0 337
Total 8 536 38 3 69 27 3 3 29 492 46 5 28 24 45 8 1364
01:00 PM 6 132 8 0 26 12 4 1 4 131 9 1 10 6 7 1 35801:15 PM 1 105 10 0 10 7 2 0 11 114 10 0 10 8 9 0 29701:30 PM 1 99 5 0 15 3 5 0 7 119 12 0 9 8 14 0 29701:45 PM 1 102 4 0 16 6 3 0 7 102 13 0 4 6 8 0 272
Total 9 438 27 0 67 28 14 1 29 466 44 1 33 28 38 1 1224
02:00 PM 1 114 7 1 18 6 1 1 3 123 20 0 6 6 8 1 31602:15 PM 1 116 7 1 16 9 2 0 7 111 6 0 7 10 5 2 30002:30 PM 1 106 11 1 10 10 2 0 10 150 16 1 12 7 7 5 34902:45 PM 4 112 13 0 15 14 0 1 3 126 12 0 13 12 10 0 335
Total 7 448 38 3 59 39 5 2 23 510 54 1 38 35 30 8 1300
03:00 PM 3 120 12 1 18 5 3 2 5 147 14 1 16 9 11 2 36903:15 PM 2 109 3 1 24 5 1 0 4 133 15 1 11 7 10 3 32903:30 PM 4 103 13 1 14 8 3 0 3 210 17 0 17 15 10 2 42003:45 PM 2 121 5 2 23 6 3 1 12 183 17 0 13 15 9 0 412
Total 11 453 33 5 79 24 10 3 24 673 63 2 57 46 40 7 1530

File Name : Main-70th 12hrSite Code : 00000000Start Date : 1/13/2011Page No : 2
MilwaukeeWeekday
AS.
Groups Printed- Unshifted - Bank 1 - Bank 270 TH ST
From NorthMAIN ST
From East70 TH ST
From SouthMAIN ST
From West
Start Time Left Thru Right Peds Left Thru Right Peds Left Thru Right Peds Left Thru Right Peds Int. Total
Factor 1.0 1.0 1.0 1.0 1.0 1.0 1.0 1.0 1.0 1.0 1.0 1.0 1.0 1.0 1.0 1.004:00 PM 5 100 7 0 20 15 1 0 7 231 27 0 13 9 9 2 44604:15 PM 2 100 16 1 28 23 4 0 8 177 25 3 14 9 14 2 42604:30 PM 2 107 6 0 23 24 3 0 13 246 29 0 15 16 9 0 49304:45 PM 3 116 8 0 26 12 1 0 10 176 17 0 18 15 13 2 417
Total 12 423 37 1 97 74 9 0 38 830 98 3 60 49 45 6 1782
05:00 PM 3 101 4 0 26 10 2 2 11 270 23 1 11 22 9 0 49505:15 PM 4 106 5 0 34 16 4 0 18 218 21 0 10 14 7 0 45705:30 PM 1 98 14 0 18 15 5 0 7 153 20 0 14 12 13 0 37005:45 PM 1 95 4 0 19 11 1 1 9 118 22 1 10 9 3 0 304
Total 9 400 27 0 97 52 12 3 45 759 86 2 45 57 32 0 1626
Grand Total 114 5603 418 18 806 410 139 19 284 5646 592 37 454 395 426 40 15401Apprch % 1.9 91.1 6.8 0.3 58.7 29.8 10.1 1.4 4.3 86.1 9 0.6 34.5 30 32.4 3
Total % 0.7 36.4 2.7 0.1 5.2 2.7 0.9 0.1 1.8 36.7 3.8 0.2 2.9 2.6 2.8 0.3Unshifted 106 5423 396 16 796 393 134 18 270 5454 584 36 431 380 408 38 14883
% Unshifted 93 96.8 94.7 88.9 98.8 95.9 96.4 94.7 95.1 96.6 98.6 97.3 94.9 96.2 95.8 95 96.6Bank 1 8 124 15 2 10 17 5 1 9 131 8 1 13 12 14 2 372
% Bank 1 7 2.2 3.6 11.1 1.2 4.1 3.6 5.3 3.2 2.3 1.4 2.7 2.9 3 3.3 5 2.4Bank 2 0 56 7 0 0 0 0 0 5 61 0 0 10 3 4 0 146
% Bank 2 0 1 1.7 0 0 0 0 0 1.8 1.1 0 0 2.2 0.8 0.9 0 0.9

File Name : Main-70th 12hrSite Code : 00000000Start Date : 1/13/2011Page No : 1
MilwaukeeWeekday
AS.
Groups Printed- Bank 1 - Bank 270 TH ST
From NorthMAIN ST
From East70 TH ST
From SouthMAIN ST
From West
Start Time Left Thru Right Peds Left Thru Right Peds Left Thru Right Peds Left Thru Right Peds Int. Total
Factor 1.0 1.0 1.0 1.0 1.0 1.0 1.0 1.0 1.0 1.0 1.0 1.0 1.0 1.0 1.0 1.006:00 AM 0 4 1 0 0 0 0 0 0 2 0 0 0 0 0 0 706:15 AM 1 1 1 0 2 0 0 0 0 1 0 0 1 0 0 0 706:30 AM 0 3 0 0 0 2 1 0 0 6 0 0 2 0 1 0 1506:45 AM 1 3 0 0 0 0 0 0 0 4 0 0 2 1 0 0 11
Total 2 11 2 0 2 2 1 0 0 13 0 0 5 1 1 0 40
07:00 AM 0 1 0 0 0 1 0 0 0 5 0 0 1 0 0 0 807:15 AM 1 2 0 0 0 0 0 0 0 3 1 0 1 1 0 0 907:30 AM 0 5 0 1 0 0 0 0 0 6 0 0 1 2 0 1 1607:45 AM 1 3 0 0 1 1 0 0 2 4 0 0 0 1 1 0 14
Total 2 11 0 1 1 2 0 0 2 18 1 0 3 4 1 1 47
08:00 AM 0 10 1 0 1 0 1 0 1 5 0 0 0 0 0 0 1908:15 AM 0 4 0 0 0 2 1 0 0 8 0 0 0 0 0 0 1508:30 AM 0 6 1 0 0 0 1 0 0 4 1 0 1 0 3 1 1808:45 AM 1 5 2 0 0 1 0 0 0 8 0 0 0 0 0 0 17
Total 1 25 4 0 1 3 3 0 1 25 1 0 1 0 3 1 69
09:00 AM 0 6 0 0 0 0 0 0 0 12 0 0 0 0 0 0 1809:15 AM 0 4 0 0 2 0 0 0 0 4 0 0 3 1 1 0 1509:30 AM 0 1 0 0 0 0 0 0 0 7 0 0 0 0 0 0 809:45 AM 0 9 0 0 0 0 0 0 0 3 0 0 1 0 0 0 13
Total 0 20 0 0 2 0 0 0 0 26 0 0 4 1 1 0 54
10:00 AM 0 3 0 0 0 2 0 0 0 5 1 0 1 0 1 0 1310:15 AM 0 7 1 0 0 0 0 0 0 4 0 0 0 0 0 0 1210:30 AM 0 12 1 0 0 0 0 0 0 6 1 0 0 2 0 0 2210:45 AM 0 6 0 0 0 1 0 0 2 4 0 1 1 0 1 0 16
Total 0 28 2 0 0 3 0 0 2 19 2 1 2 2 2 0 63
11:00 AM 0 1 2 0 0 0 0 0 0 4 0 0 1 0 0 0 811:15 AM 0 7 0 0 0 0 0 0 0 6 0 0 1 0 0 0 1411:30 AM 0 3 1 0 0 0 0 0 0 5 0 0 0 0 0 0 911:45 AM 0 6 0 0 0 0 0 0 1 3 0 0 0 1 0 0 11
Total 0 17 3 0 0 0 0 0 1 18 0 0 2 1 0 0 42
12:00 PM 1 7 0 0 0 1 0 0 0 6 0 0 0 1 0 0 1612:15 PM 0 3 0 0 0 0 0 0 0 8 0 0 0 0 2 0 1312:30 PM 0 5 0 0 0 0 0 0 0 3 0 0 1 0 1 0 1012:45 PM 0 4 0 0 0 0 0 0 0 7 0 0 0 0 0 0 11
Total 1 19 0 0 0 1 0 0 0 24 0 0 1 1 3 0 50
01:00 PM 0 4 1 0 0 0 0 0 0 3 0 0 0 0 1 0 901:15 PM 0 1 0 0 0 0 0 0 1 5 1 0 0 0 0 0 801:30 PM 0 2 0 0 0 0 0 0 1 4 0 0 0 0 0 0 701:45 PM 0 2 0 0 0 0 0 0 0 2 0 0 0 1 0 0 5
Total 0 9 1 0 0 0 0 0 2 14 1 0 0 1 1 0 29
02:00 PM 0 7 0 1 0 0 0 0 0 7 1 0 0 0 0 0 1602:15 PM 0 0 0 0 1 0 0 0 0 2 0 0 1 0 0 0 402:30 PM 1 3 1 0 0 1 0 0 0 1 1 0 0 1 0 0 902:45 PM 0 1 3 0 0 1 0 0 1 5 0 0 0 0 0 0 11
Total 1 11 4 1 1 2 0 0 1 15 2 0 1 1 0 0 40
03:00 PM 0 8 1 0 0 0 0 1 1 1 0 0 1 1 1 0 1503:15 PM 0 0 0 0 0 0 0 0 0 1 0 0 0 0 1 0 203:30 PM 1 5 2 0 1 0 0 0 0 3 0 0 0 0 0 0 1203:45 PM 0 5 0 0 0 0 0 0 2 5 1 0 0 0 1 0 14
Total 1 18 3 0 1 0 0 1 3 10 1 0 1 1 3 0 43

File Name : Main-70th 12hrSite Code : 00000000Start Date : 1/13/2011Page No : 2
MilwaukeeWeekday
AS.
Groups Printed- Bank 1 - Bank 270 TH ST
From NorthMAIN ST
From East70 TH ST
From SouthMAIN ST
From West
Start Time Left Thru Right Peds Left Thru Right Peds Left Thru Right Peds Left Thru Right Peds Int. Total
Factor 1.0 1.0 1.0 1.0 1.0 1.0 1.0 1.0 1.0 1.0 1.0 1.0 1.0 1.0 1.0 1.004:00 PM 0 4 0 0 0 1 0 0 0 1 0 0 1 1 1 0 904:15 PM 0 2 2 0 2 2 0 0 0 3 0 0 1 1 1 0 1404:30 PM 0 1 1 0 0 0 1 0 0 3 0 0 0 0 0 0 604:45 PM 0 1 0 0 0 0 0 0 0 1 0 0 0 0 0 0 2
Total 0 8 3 0 2 3 1 0 0 8 0 0 2 2 2 0 31
05:00 PM 0 1 0 0 0 1 0 0 1 1 0 0 0 0 0 0 405:15 PM 0 1 0 0 0 0 0 0 1 0 0 0 0 0 0 0 205:30 PM 0 0 0 0 0 0 0 0 0 0 0 0 1 0 1 0 205:45 PM 0 1 0 0 0 0 0 0 0 1 0 0 0 0 0 0 2
Total 0 3 0 0 0 1 0 0 2 2 0 0 1 0 1 0 10
Grand Total 8 180 22 2 10 17 5 1 14 192 8 1 23 15 18 2 518Apprch % 3.8 84.9 10.4 0.9 30.3 51.5 15.2 3 6.5 89.3 3.7 0.5 39.7 25.9 31 3.4
Total % 1.5 34.7 4.2 0.4 1.9 3.3 1 0.2 2.7 37.1 1.5 0.2 4.4 2.9 3.5 0.4Bank 1 8 124 15 2 10 17 5 1 9 131 8 1 13 12 14 2 372
% Bank 1 100 68.9 68.2 100 100 100 100 100 64.3 68.2 100 100 56.5 80 77.8 100 71.8Bank 2 0 56 7 0 0 0 0 0 5 61 0 0 10 3 4 0 146
% Bank 2 0 31.1 31.8 0 0 0 0 0 35.7 31.8 0 0 43.5 20 22.2 0 28.2

File Name : Main-70th SATSite Code : 00000000Start Date : 1/15/2011Page No : 1
MilwaukeeSaturday Midday
TA.
Groups Printed- Unshifted - Bank 1 - Bank 270TH STREET
From NorthMAIN STREET
From East70TH STREET
From SouthMAIN STREET
From West
Start Time Left Thru Right Peds Left Thru Right Peds Left Thru Right Peds Left Thru Right Peds Int. Total
Factor 1.0 1.0 1.0 1.0 1.0 1.0 1.0 1.0 1.0 1.0 1.0 1.0 1.0 1.0 1.0 1.0*** BREAK ***
11:00 AM 5 73 2 0 21 8 4 0 1 67 10 1 9 7 8 0 21611:15 AM 1 75 6 1 26 7 6 0 8 73 16 2 8 10 12 0 25111:30 AM 3 92 7 0 12 9 2 1 4 79 9 4 6 7 3 2 24011:45 AM 2 94 13 6 18 4 2 0 11 87 19 1 6 5 9 6 283
Total 11 334 28 7 77 28 14 1 24 306 54 8 29 29 32 8 990
12:00 PM 1 75 8 0 7 5 5 1 5 73 10 1 7 6 10 1 21512:15 PM 4 59 7 0 15 6 1 3 4 87 20 3 6 4 5 1 22512:30 PM 2 76 7 0 10 3 2 0 5 87 13 3 8 8 8 0 23212:45 PM 2 92 4 0 9 5 2 0 8 79 15 0 2 6 8 1 233
Total 9 302 26 0 41 19 10 4 22 326 58 7 23 24 31 3 905
*** BREAK ***
Grand Total 20 636 54 7 118 47 24 5 46 632 112 15 52 53 63 11 1895Apprch % 2.8 88.7 7.5 1 60.8 24.2 12.4 2.6 5.7 78.5 13.9 1.9 29.1 29.6 35.2 6.1
Total % 1.1 33.6 2.8 0.4 6.2 2.5 1.3 0.3 2.4 33.4 5.9 0.8 2.7 2.8 3.3 0.6Unshifted 20 624 53 7 117 47 24 5 44 626 111 15 52 53 62 11 1871
% Unshifted 100 98.1 98.1 100 99.2 100 100 100 95.7 99.1 99.1 100 100 100 98.4 100 98.7Bank 1 0 10 0 0 1 0 0 0 1 5 1 0 0 0 1 0 19
% Bank 1 0 1.6 0 0 0.8 0 0 0 2.2 0.8 0.9 0 0 0 1.6 0 1Bank 2 0 2 1 0 0 0 0 0 1 1 0 0 0 0 0 0 5
% Bank 2 0 0.3 1.9 0 0 0 0 0 2.2 0.2 0 0 0 0 0 0 0.3

File Name : Main-70th SATSite Code : 00000000Start Date : 1/15/2011Page No : 1
MilwaukeeSaturday Midday
TA.
Groups Printed- Bank 1 - Bank 270TH STREET
From NorthMAIN STREET
From East70TH STREET
From SouthMAIN STREET
From West
Start Time Left Thru Right Peds Left Thru Right Peds Left Thru Right Peds Left Thru Right Peds Int. Total
Factor 1.0 1.0 1.0 1.0 1.0 1.0 1.0 1.0 1.0 1.0 1.0 1.0 1.0 1.0 1.0 1.0*** BREAK ***
11:00 AM 0 1 0 0 0 0 0 0 0 1 0 0 0 0 0 0 211:15 AM 0 1 0 0 0 0 0 0 1 2 0 0 0 0 0 0 411:30 AM 0 1 0 0 1 0 0 0 1 0 1 0 0 0 0 0 411:45 AM 0 1 0 0 0 0 0 0 0 1 0 0 0 0 0 0 2
Total 0 4 0 0 1 0 0 0 2 4 1 0 0 0 0 0 12
12:00 PM 0 2 0 0 0 0 0 0 0 0 0 0 0 0 0 0 212:15 PM 0 1 0 0 0 0 0 0 0 0 0 0 0 0 0 0 112:30 PM 0 4 1 0 0 0 0 0 0 2 0 0 0 0 1 0 812:45 PM 0 1 0 0 0 0 0 0 0 0 0 0 0 0 0 0 1
Total 0 8 1 0 0 0 0 0 0 2 0 0 0 0 1 0 12
*** BREAK ***
Grand Total 0 12 1 0 1 0 0 0 2 6 1 0 0 0 1 0 24Apprch % 0 92.3 7.7 0 100 0 0 0 22.2 66.7 11.1 0 0 0 100 0
Total % 0 50 4.2 0 4.2 0 0 0 8.3 25 4.2 0 0 0 4.2 0Bank 1 0 10 0 0 1 0 0 0 1 5 1 0 0 0 1 0 19
% Bank 1 0 83.3 0 0 100 0 0 0 50 83.3 100 0 0 0 100 0 79.2Bank 2 0 2 1 0 0 0 0 0 1 1 0 0 0 0 0 0 5
% Bank 2 0 16.7 100 0 0 0 0 0 50 16.7 0 0 0 0 0 0 20.8

File Name : Main-71st 12hrSite Code : 00000000Start Date : 1/12/2011Page No : 1
MilwaukeeWeekday
AS.
Groups Printed- Unshifted - Bank 1 - Bank 271ST ST
From NorthMAIN ST
From East71ST ST
From SouthMAIN ST
From West
Start Time Left Thru Right Peds Left Thru Right Peds Left Thru Right Peds Left Thru Right Peds Int. Total
06:00 AM 1 0 2 0 0 8 0 0 0 0 0 0 0 5 0 0 1606:15 AM 1 0 0 0 0 8 0 1 0 0 0 0 0 3 0 0 1306:30 AM 2 0 0 0 0 9 0 0 0 0 0 2 0 7 0 0 2006:45 AM 3 0 0 0 0 8 0 0 0 0 0 0 0 13 0 0 24
Total 7 0 2 0 0 33 0 1 0 0 0 2 0 28 0 0 73
07:00 AM 3 0 0 0 0 17 0 0 0 0 0 0 0 14 0 0 3407:15 AM 6 0 1 0 0 9 0 0 0 0 0 0 0 21 0 0 3707:30 AM 1 0 1 0 0 20 0 1 0 0 0 1 0 24 0 0 4807:45 AM 2 0 2 0 0 18 0 0 0 0 0 1 0 26 0 0 49
Total 12 0 4 0 0 64 0 1 0 0 0 2 0 85 0 0 168
08:00 AM 2 0 0 0 0 26 0 0 0 0 0 0 0 17 0 0 4508:15 AM 1 0 2 0 0 14 0 0 0 0 0 1 0 17 0 0 3508:30 AM 2 0 1 0 0 24 0 0 0 0 0 0 0 20 0 0 4708:45 AM 2 0 0 0 0 14 0 0 0 0 0 0 0 12 0 0 28
Total 7 0 3 0 0 78 0 0 0 0 0 1 0 66 0 0 155
09:00 AM 1 0 3 0 0 14 0 0 0 0 0 0 0 12 0 2 3209:15 AM 0 0 0 0 0 13 0 0 0 0 0 1 0 11 0 0 2509:30 AM 2 0 0 1 0 19 0 0 0 0 0 0 0 14 0 0 3609:45 AM 3 0 0 0 0 18 0 0 0 0 0 0 0 12 0 0 33
Total 6 0 3 1 0 64 0 0 0 0 0 1 0 49 0 2 126
10:00 AM 2 0 2 0 0 25 0 0 0 0 0 0 0 12 0 0 4110:15 AM 3 0 0 0 0 13 0 0 0 0 0 0 0 9 0 0 2510:30 AM 2 0 1 2 0 11 0 0 0 0 0 0 0 11 0 0 2710:45 AM 1 0 1 0 0 9 0 0 0 0 0 0 0 6 0 0 17
Total 8 0 4 2 0 58 0 0 0 0 0 0 0 38 0 0 110
11:00 AM 3 0 1 0 0 13 0 0 0 0 0 0 0 9 0 0 2611:15 AM 1 0 2 0 0 20 0 0 0 0 0 0 0 9 0 0 3211:30 AM 2 0 0 0 0 15 0 0 0 0 0 0 0 18 0 0 3511:45 AM 0 0 0 0 0 11 0 0 0 0 0 2 1 14 0 0 28
Total 6 0 3 0 0 59 0 0 0 0 0 2 1 50 0 0 121
12:00 PM 0 0 1 0 0 16 0 0 0 0 0 0 0 12 0 0 2912:15 PM 3 0 0 0 0 14 0 0 0 0 0 0 0 13 0 0 3012:30 PM 0 0 0 1 0 20 0 1 0 0 0 1 0 21 0 0 4412:45 PM 3 0 0 0 0 13 0 0 0 0 0 0 0 16 0 2 34
Total 6 0 1 1 0 63 0 1 0 0 0 1 0 62 0 2 137
01:00 PM 2 0 0 0 0 9 0 1 0 0 0 0 0 10 0 0 2201:15 PM 1 0 1 1 0 16 0 1 0 0 0 1 0 10 0 0 3101:30 PM 2 0 1 0 0 19 0 0 0 0 0 0 0 13 0 0 3501:45 PM 3 0 0 0 0 20 0 0 0 0 0 0 0 20 0 0 43
Total 8 0 2 1 0 64 0 2 0 0 0 1 0 53 0 0 131
02:00 PM 1 0 4 0 0 21 0 0 0 1 0 0 0 22 0 0 4902:15 PM 0 0 1 2 0 20 0 0 0 0 0 0 0 15 0 0 3802:30 PM 2 0 3 0 0 20 0 0 0 0 0 0 0 18 0 0 4302:45 PM 0 0 1 0 0 29 0 0 0 0 0 0 0 13 0 0 43
Total 3 0 9 2 0 90 0 0 0 1 0 0 0 68 0 0 173
03:00 PM 5 0 0 0 0 26 0 0 0 0 0 0 0 16 0 0 4703:15 PM 2 0 0 0 0 24 0 1 0 0 0 3 0 22 0 0 5203:30 PM 4 0 0 1 0 18 0 0 0 0 0 0 0 19 0 0 4203:45 PM 2 0 2 0 0 21 0 0 0 0 0 0 0 18 0 0 43
Total 13 0 2 1 0 89 0 1 0 0 0 3 0 75 0 0 184
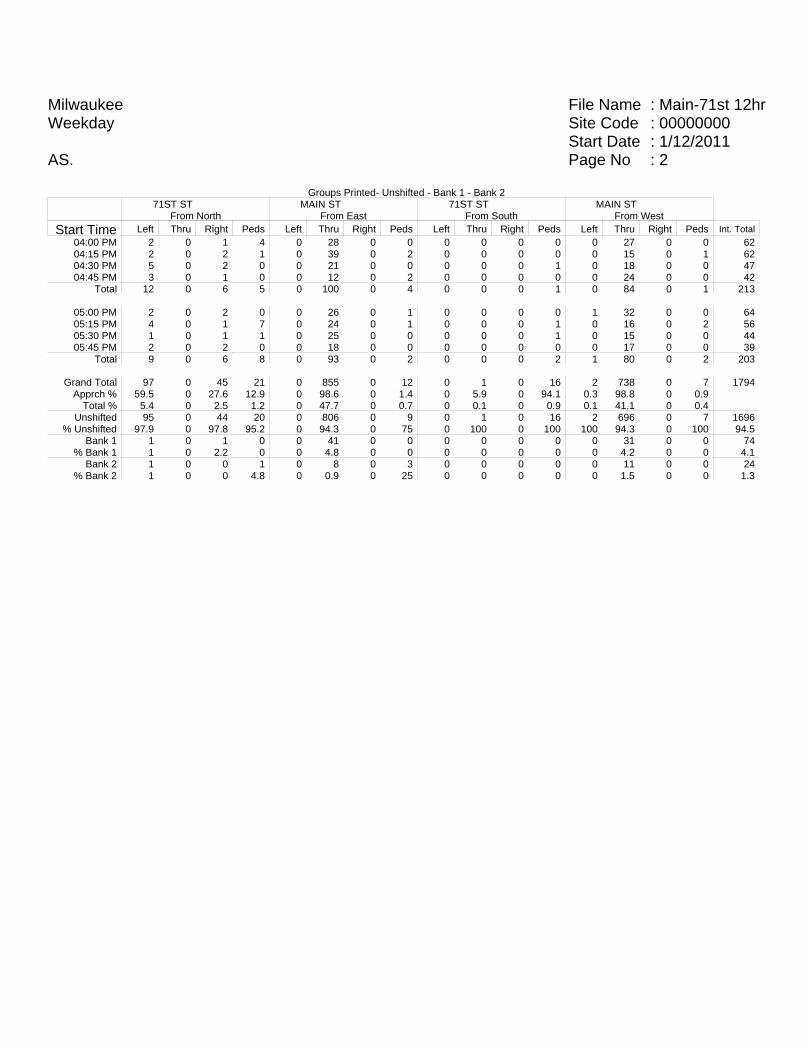
File Name : Main-71st 12hrSite Code : 00000000Start Date : 1/12/2011Page No : 2
MilwaukeeWeekday
AS.
Groups Printed- Unshifted - Bank 1 - Bank 271ST ST
From NorthMAIN ST
From East71ST ST
From SouthMAIN ST
From West
Start Time Left Thru Right Peds Left Thru Right Peds Left Thru Right Peds Left Thru Right Peds Int. Total
04:00 PM 2 0 1 4 0 28 0 0 0 0 0 0 0 27 0 0 6204:15 PM 2 0 2 1 0 39 0 2 0 0 0 0 0 15 0 1 6204:30 PM 5 0 2 0 0 21 0 0 0 0 0 1 0 18 0 0 4704:45 PM 3 0 1 0 0 12 0 2 0 0 0 0 0 24 0 0 42
Total 12 0 6 5 0 100 0 4 0 0 0 1 0 84 0 1 213
05:00 PM 2 0 2 0 0 26 0 1 0 0 0 0 1 32 0 0 6405:15 PM 4 0 1 7 0 24 0 1 0 0 0 1 0 16 0 2 5605:30 PM 1 0 1 1 0 25 0 0 0 0 0 1 0 15 0 0 4405:45 PM 2 0 2 0 0 18 0 0 0 0 0 0 0 17 0 0 39
Total 9 0 6 8 0 93 0 2 0 0 0 2 1 80 0 2 203
Grand Total 97 0 45 21 0 855 0 12 0 1 0 16 2 738 0 7 1794Apprch % 59.5 0 27.6 12.9 0 98.6 0 1.4 0 5.9 0 94.1 0.3 98.8 0 0.9
Total % 5.4 0 2.5 1.2 0 47.7 0 0.7 0 0.1 0 0.9 0.1 41.1 0 0.4Unshifted 95 0 44 20 0 806 0 9 0 1 0 16 2 696 0 7 1696
% Unshifted 97.9 0 97.8 95.2 0 94.3 0 75 0 100 0 100 100 94.3 0 100 94.5Bank 1 1 0 1 0 0 41 0 0 0 0 0 0 0 31 0 0 74
% Bank 1 1 0 2.2 0 0 4.8 0 0 0 0 0 0 0 4.2 0 0 4.1Bank 2 1 0 0 1 0 8 0 3 0 0 0 0 0 11 0 0 24
% Bank 2 1 0 0 4.8 0 0.9 0 25 0 0 0 0 0 1.5 0 0 1.3

File Name : Main-71st 12hrSite Code : 00000000Start Date : 1/12/2011Page No : 1
MilwaukeeWeekday
AS.
Groups Printed- Bank 1 - Bank 271ST ST
From NorthMAIN ST
From East71ST ST
From SouthMAIN ST
From West
Start Time Left Thru Right Peds Left Thru Right Peds Left Thru Right Peds Left Thru Right Peds Int. Total
06:00 AM 0 0 0 0 0 3 0 0 0 0 0 0 0 1 0 0 406:15 AM 0 0 0 0 0 2 0 1 0 0 0 0 0 1 0 0 406:30 AM 0 0 0 0 0 4 0 0 0 0 0 0 0 0 0 0 406:45 AM 0 0 0 0 0 0 0 0 0 0 0 0 0 3 0 0 3
Total 0 0 0 0 0 9 0 1 0 0 0 0 0 5 0 0 15
07:00 AM 0 0 0 0 0 1 0 0 0 0 0 0 0 2 0 0 307:15 AM 0 0 0 0 0 0 0 0 0 0 0 0 0 1 0 0 107:30 AM 0 0 0 0 0 0 0 1 0 0 0 0 0 3 0 0 407:45 AM 0 0 0 0 0 2 0 0 0 0 0 0 0 2 0 0 4
Total 0 0 0 0 0 3 0 1 0 0 0 0 0 8 0 0 12
08:00 AM 0 0 0 0 0 1 0 0 0 0 0 0 0 0 0 0 108:15 AM 0 0 0 0 0 1 0 0 0 0 0 0 0 1 0 0 208:30 AM 0 0 0 0 0 3 0 0 0 0 0 0 0 3 0 0 608:45 AM 0 0 0 0 0 0 0 0 0 0 0 0 0 1 0 0 1
Total 0 0 0 0 0 5 0 0 0 0 0 0 0 5 0 0 10
09:00 AM 1 0 0 0 0 0 0 0 0 0 0 0 0 0 0 0 109:15 AM 0 0 0 0 0 1 0 0 0 0 0 0 0 2 0 0 309:30 AM 0 0 0 0 0 2 0 0 0 0 0 0 0 0 0 0 209:45 AM 0 0 0 0 0 1 0 0 0 0 0 0 0 2 0 0 3
Total 1 0 0 0 0 4 0 0 0 0 0 0 0 4 0 0 9
10:00 AM 0 0 0 0 0 0 0 0 0 0 0 0 0 2 0 0 210:15 AM 0 0 0 0 0 1 0 0 0 0 0 0 0 0 0 0 110:30 AM 0 0 0 1 0 0 0 0 0 0 0 0 0 0 0 0 110:45 AM 0 0 0 0 0 2 0 0 0 0 0 0 0 2 0 0 4
Total 0 0 0 1 0 3 0 0 0 0 0 0 0 4 0 0 8
11:00 AM 1 0 0 0 0 1 0 0 0 0 0 0 0 0 0 0 211:15 AM 0 0 0 0 0 1 0 0 0 0 0 0 0 1 0 0 211:30 AM 0 0 0 0 0 1 0 0 0 0 0 0 0 1 0 0 2
Total 1 0 0 0 0 3 0 0 0 0 0 0 0 2 0 0 6
12:15 PM 0 0 0 0 0 1 0 0 0 0 0 0 0 0 0 0 1
Total 0 0 0 0 0 1 0 0 0 0 0 0 0 0 0 0 1
01:00 PM 0 0 0 0 0 1 0 0 0 0 0 0 0 0 0 0 101:15 PM 0 0 0 0 0 0 0 0 0 0 0 0 0 1 0 0 101:30 PM 0 0 0 0 0 1 0 0 0 0 0 0 0 0 0 0 101:45 PM 0 0 0 0 0 1 0 0 0 0 0 0 0 1 0 0 2
Total 0 0 0 0 0 3 0 0 0 0 0 0 0 2 0 0 5
02:00 PM 0 0 1 0 0 0 0 0 0 0 0 0 0 1 0 0 2
02:30 PM 0 0 0 0 0 1 0 0 0 0 0 0 0 0 0 0 102:45 PM 0 0 0 0 0 3 0 0 0 0 0 0 0 0 0 0 3
Total 0 0 1 0 0 4 0 0 0 0 0 0 0 1 0 0 6
03:00 PM 0 0 0 0 0 0 0 0 0 0 0 0 0 1 0 0 103:15 PM 0 0 0 0 0 2 0 1 0 0 0 0 0 1 0 0 403:30 PM 0 0 0 0 0 1 0 0 0 0 0 0 0 0 0 0 103:45 PM 0 0 0 0 0 2 0 0 0 0 0 0 0 1 0 0 3
Total 0 0 0 0 0 5 0 1 0 0 0 0 0 3 0 0 9
04:00 PM 0 0 0 0 0 2 0 0 0 0 0 0 0 3 0 0 5

File Name : Main-71st 12hrSite Code : 00000000Start Date : 1/12/2011Page No : 2
MilwaukeeWeekday
AS.
Groups Printed- Bank 1 - Bank 271ST ST
From NorthMAIN ST
From East71ST ST
From SouthMAIN ST
From West
Start Time Left Thru Right Peds Left Thru Right Peds Left Thru Right Peds Left Thru Right Peds Int. Total
04:15 PM 0 0 0 0 0 4 0 0 0 0 0 0 0 2 0 0 604:30 PM 0 0 0 0 0 1 0 0 0 0 0 0 0 1 0 0 2
Total 0 0 0 0 0 7 0 0 0 0 0 0 0 6 0 0 13
05:15 PM 0 0 0 0 0 2 0 0 0 0 0 0 0 0 0 0 205:30 PM 0 0 0 0 0 0 0 0 0 0 0 0 0 1 0 0 105:45 PM 0 0 0 0 0 0 0 0 0 0 0 0 0 1 0 0 1
Total 0 0 0 0 0 2 0 0 0 0 0 0 0 2 0 0 4
Grand Total 2 0 1 1 0 49 0 3 0 0 0 0 0 42 0 0 98Apprch % 50 0 25 25 0 94.2 0 5.8 0 0 0 0 0 100 0 0
Total % 2 0 1 1 0 50 0 3.1 0 0 0 0 0 42.9 0 0Bank 1 1 0 1 0 0 41 0 0 0 0 0 0 0 31 0 0 74
% Bank 1 50 0 100 0 0 83.7 0 0 0 0 0 0 0 73.8 0 0 75.5Bank 2 1 0 0 1 0 8 0 3 0 0 0 0 0 11 0 0 24
% Bank 2 50 0 0 100 0 16.3 0 100 0 0 0 0 0 26.2 0 0 24.5

File Name : Main-71st SATSite Code : 00000000Start Date : 1/15/2011Page No : 1
MilwaukeeSaturday Midday
R&PA.
Groups Printed- Unshifted - Bank 1 - Bank 271ST ST
From NorthMAIN ST
From East71ST ST
From SouthMAIN ST
From West
Start Time Left Thru Right Peds Left Thru Right Peds Left Thru Right Peds Left Thru Right Peds Int. Total
Factor 1.0 1.0 1.0 1.0 1.0 1.0 1.0 1.0 1.0 1.0 1.0 1.0 1.0 1.0 1.0 1.0*** BREAK ***
11:00 AM 4 0 2 0 0 7 0 0 0 0 0 0 0 15 0 0 2811:15 AM 2 0 1 0 0 16 1 0 0 0 0 0 0 11 0 0 3111:30 AM 0 0 1 1 0 18 0 1 0 0 0 0 0 12 0 0 3311:45 AM 2 0 1 0 0 23 0 0 0 0 0 1 0 11 0 0 38
Total 8 0 5 1 0 64 1 1 0 0 0 1 0 49 0 0 130
12:00 PM 2 0 0 0 0 9 0 0 0 0 0 0 0 11 0 0 2212:15 PM 3 0 4 0 0 13 0 0 0 0 0 0 0 8 0 0 2812:30 PM 3 0 0 0 0 14 0 0 0 0 0 0 0 16 0 0 3312:45 PM 2 0 1 1 0 14 0 1 0 0 0 0 0 10 0 0 29
Total 10 0 5 1 0 50 0 1 0 0 0 0 0 45 0 0 112
*** BREAK ***
Grand Total 18 0 10 2 0 114 1 2 0 0 0 1 0 94 0 0 242Apprch % 60 0 33.3 6.7 0 97.4 0.9 1.7 0 0 0 100 0 100 0 0
Total % 7.4 0 4.1 0.8 0 47.1 0.4 0.8 0 0 0 0.4 0 38.8 0 0Unshifted 18 0 10 2 0 111 1 1 0 0 0 1 0 94 0 0 238
% Unshifted 100 0 100 100 0 97.4 100 50 0 0 0 100 0 100 0 0 98.3Bank 1 0 0 0 0 0 0 0 0 0 0 0 0 0 0 0 0 0
% Bank 1 0 0 0 0 0 0 0 0 0 0 0 0 0 0 0 0 0Bank 2 0 0 0 0 0 3 0 1 0 0 0 0 0 0 0 0 4
% Bank 2 0 0 0 0 0 2.6 0 50 0 0 0 0 0 0 0 0 1.7
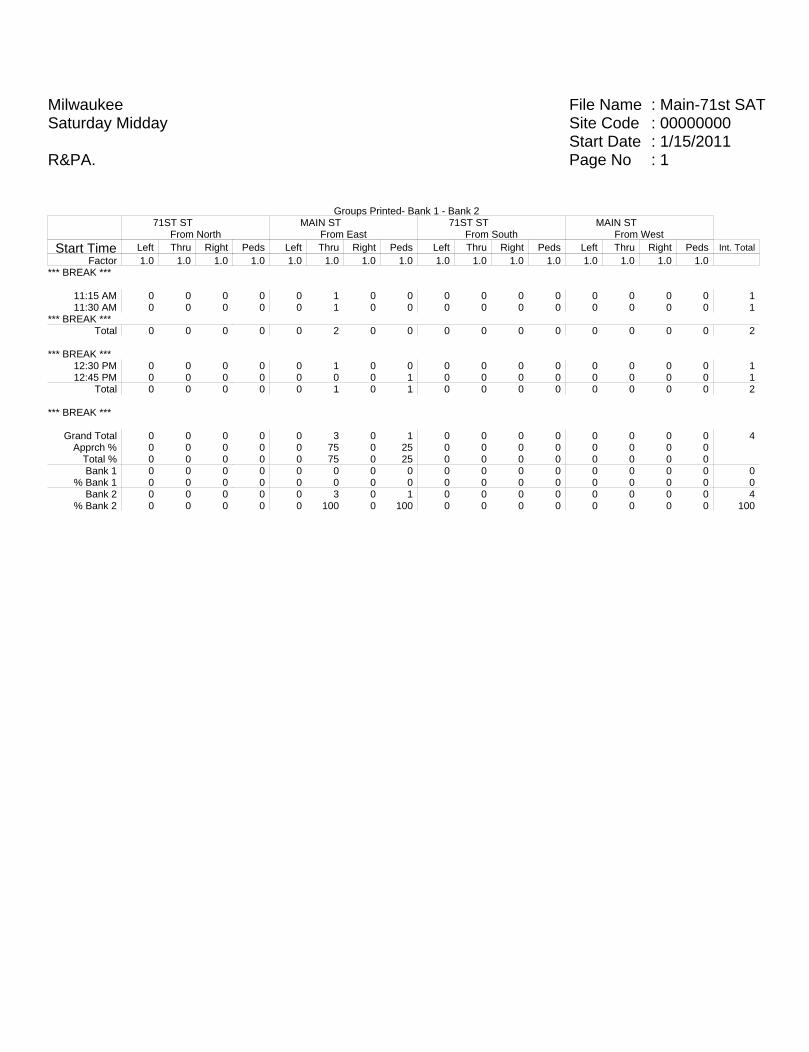
File Name : Main-71st SATSite Code : 00000000Start Date : 1/15/2011Page No : 1
MilwaukeeSaturday Midday
R&PA.
Groups Printed- Bank 1 - Bank 271ST ST
From NorthMAIN ST
From East71ST ST
From SouthMAIN ST
From West
Start Time Left Thru Right Peds Left Thru Right Peds Left Thru Right Peds Left Thru Right Peds Int. Total
Factor 1.0 1.0 1.0 1.0 1.0 1.0 1.0 1.0 1.0 1.0 1.0 1.0 1.0 1.0 1.0 1.0*** BREAK ***
11:15 AM 0 0 0 0 0 1 0 0 0 0 0 0 0 0 0 0 111:30 AM 0 0 0 0 0 1 0 0 0 0 0 0 0 0 0 0 1
*** BREAK ***Total 0 0 0 0 0 2 0 0 0 0 0 0 0 0 0 0 2
*** BREAK ***12:30 PM 0 0 0 0 0 1 0 0 0 0 0 0 0 0 0 0 112:45 PM 0 0 0 0 0 0 0 1 0 0 0 0 0 0 0 0 1
Total 0 0 0 0 0 1 0 1 0 0 0 0 0 0 0 0 2
*** BREAK ***
Grand Total 0 0 0 0 0 3 0 1 0 0 0 0 0 0 0 0 4Apprch % 0 0 0 0 0 75 0 25 0 0 0 0 0 0 0 0
Total % 0 0 0 0 0 75 0 25 0 0 0 0 0 0 0 0Bank 1 0 0 0 0 0 0 0 0 0 0 0 0 0 0 0 0 0
% Bank 1 0 0 0 0 0 0 0 0 0 0 0 0 0 0 0 0 0Bank 2 0 0 0 0 0 3 0 1 0 0 0 0 0 0 0 0 4
% Bank 2 0 0 0 0 0 100 0 100 0 0 0 0 0 0 0 0 100

File Name : Main-72nd St PMSite Code : 00000000Start Date : 1/12/2011Page No : 1
MilwaukeeWeekday
AH.
Groups Printed- Unshifted - Bank 1 - Bank 272ND STREET
From NorthMAIN STREET
From East72ND STREET
From SouthMAIN STREET
From West
Start Time Left Thru Right Peds Left Thru Right Peds Left Thru Right Peds Left Thru Right Peds Int. Total
03:00 PM 1 0 0 0 1 21 2 0 1 0 5 0 1 11 1 0 4403:15 PM 0 0 3 0 2 16 3 0 0 0 2 1 2 19 1 0 4903:30 PM 0 0 0 1 1 17 0 0 3 0 4 0 2 16 2 0 4603:45 PM 0 0 3 0 3 17 3 0 4 0 3 2 0 14 1 0 50
Total 1 0 6 1 7 71 8 0 8 0 14 3 5 60 5 0 189
04:00 PM 0 0 2 4 1 26 2 0 3 0 1 0 0 26 2 0 6704:15 PM 0 0 1 0 0 41 0 0 0 0 0 1 0 14 1 0 5804:30 PM 0 0 4 0 0 20 4 0 2 0 0 2 0 19 1 0 5204:45 PM 0 0 1 0 0 11 1 0 0 0 1 0 1 21 2 0 38
Total 0 0 8 4 1 98 7 0 5 0 2 3 1 80 6 0 215
05:00 PM 1 0 0 0 0 25 3 0 0 0 0 0 2 32 1 0 6405:15 PM 1 0 3 0 1 24 0 0 4 0 2 0 1 14 0 0 5005:30 PM 0 0 0 2 0 26 1 0 0 0 0 0 0 18 0 0 4705:45 PM 0 0 0 0 0 19 1 0 0 0 1 0 1 16 0 0 38
Total 2 0 3 2 1 94 5 0 4 0 3 0 4 80 1 0 199
Grand Total 3 0 17 7 9 263 20 0 17 0 19 6 10 220 12 0 603Apprch % 11.1 0 63 25.9 3.1 90.1 6.8 0 40.5 0 45.2 14.3 4.1 90.9 5 0
Total % 0.5 0 2.8 1.2 1.5 43.6 3.3 0 2.8 0 3.2 1 1.7 36.5 2 0Unshifted 3 0 16 7 7 258 20 0 17 0 19 6 10 214 11 0 588
% Unshifted 100 0 94.1 100 77.8 98.1 100 0 100 0 100 100 100 97.3 91.7 0 97.5Bank 1 0 0 1 0 2 5 0 0 0 0 0 0 0 5 1 0 14
% Bank 1 0 0 5.9 0 22.2 1.9 0 0 0 0 0 0 0 2.3 8.3 0 2.3Bank 2 0 0 0 0 0 0 0 0 0 0 0 0 0 1 0 0 1
% Bank 2 0 0 0 0 0 0 0 0 0 0 0 0 0 0.5 0 0 0.2
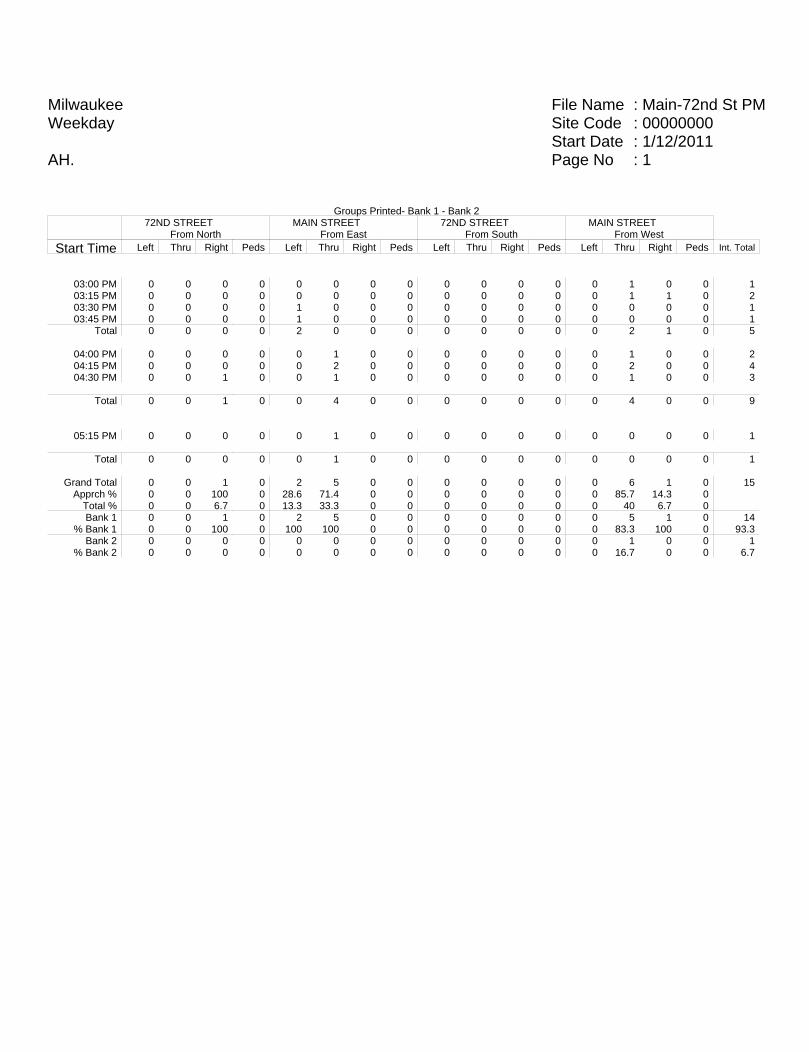
File Name : Main-72nd St PMSite Code : 00000000Start Date : 1/12/2011Page No : 1
MilwaukeeWeekday
AH.
Groups Printed- Bank 1 - Bank 272ND STREET
From NorthMAIN STREET
From East72ND STREET
From SouthMAIN STREET
From West
Start Time Left Thru Right Peds Left Thru Right Peds Left Thru Right Peds Left Thru Right Peds Int. Total
03:00 PM 0 0 0 0 0 0 0 0 0 0 0 0 0 1 0 0 103:15 PM 0 0 0 0 0 0 0 0 0 0 0 0 0 1 1 0 203:30 PM 0 0 0 0 1 0 0 0 0 0 0 0 0 0 0 0 103:45 PM 0 0 0 0 1 0 0 0 0 0 0 0 0 0 0 0 1
Total 0 0 0 0 2 0 0 0 0 0 0 0 0 2 1 0 5
04:00 PM 0 0 0 0 0 1 0 0 0 0 0 0 0 1 0 0 204:15 PM 0 0 0 0 0 2 0 0 0 0 0 0 0 2 0 0 404:30 PM 0 0 1 0 0 1 0 0 0 0 0 0 0 1 0 0 3
Total 0 0 1 0 0 4 0 0 0 0 0 0 0 4 0 0 9
05:15 PM 0 0 0 0 0 1 0 0 0 0 0 0 0 0 0 0 1
Total 0 0 0 0 0 1 0 0 0 0 0 0 0 0 0 0 1
Grand Total 0 0 1 0 2 5 0 0 0 0 0 0 0 6 1 0 15Apprch % 0 0 100 0 28.6 71.4 0 0 0 0 0 0 0 85.7 14.3 0
Total % 0 0 6.7 0 13.3 33.3 0 0 0 0 0 0 0 40 6.7 0Bank 1 0 0 1 0 2 5 0 0 0 0 0 0 0 5 1 0 14
% Bank 1 0 0 100 0 100 100 0 0 0 0 0 0 0 83.3 100 0 93.3Bank 2 0 0 0 0 0 0 0 0 0 0 0 0 0 1 0 0 1
% Bank 2 0 0 0 0 0 0 0 0 0 0 0 0 0 16.7 0 0 6.7
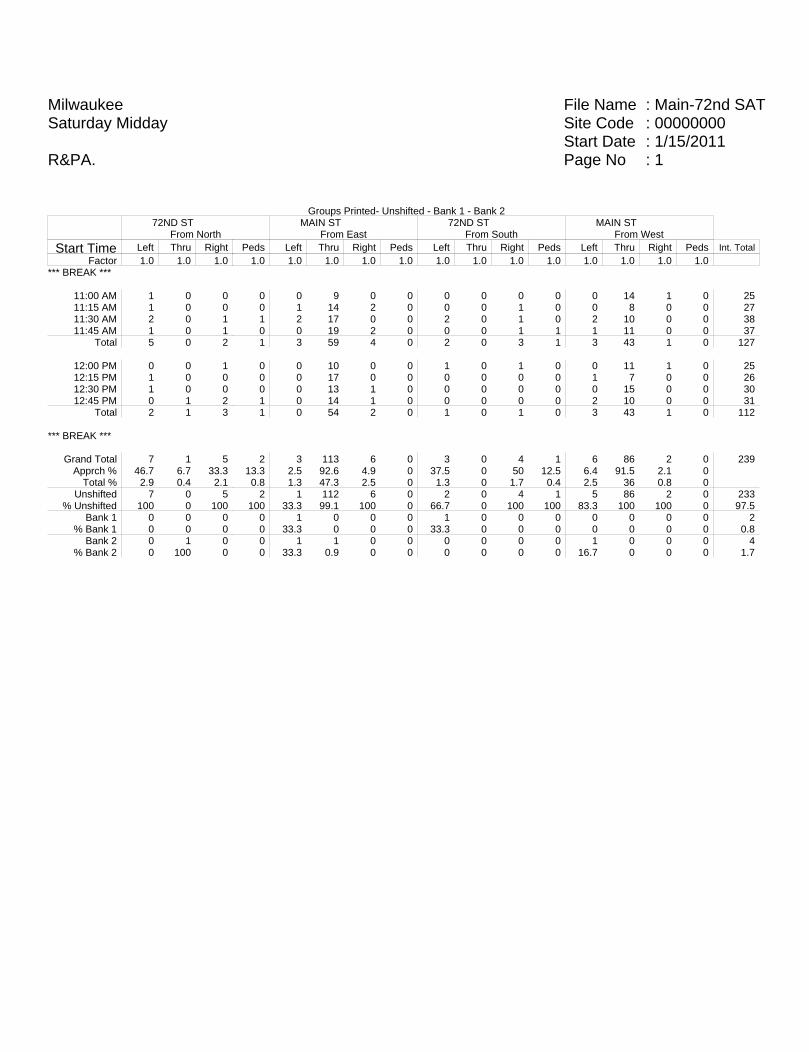
File Name : Main-72nd SATSite Code : 00000000Start Date : 1/15/2011Page No : 1
MilwaukeeSaturday Midday
R&PA.
Groups Printed- Unshifted - Bank 1 - Bank 272ND ST
From NorthMAIN ST
From East72ND ST
From SouthMAIN ST
From West
Start Time Left Thru Right Peds Left Thru Right Peds Left Thru Right Peds Left Thru Right Peds Int. Total
Factor 1.0 1.0 1.0 1.0 1.0 1.0 1.0 1.0 1.0 1.0 1.0 1.0 1.0 1.0 1.0 1.0*** BREAK ***
11:00 AM 1 0 0 0 0 9 0 0 0 0 0 0 0 14 1 0 2511:15 AM 1 0 0 0 1 14 2 0 0 0 1 0 0 8 0 0 2711:30 AM 2 0 1 1 2 17 0 0 2 0 1 0 2 10 0 0 3811:45 AM 1 0 1 0 0 19 2 0 0 0 1 1 1 11 0 0 37
Total 5 0 2 1 3 59 4 0 2 0 3 1 3 43 1 0 127
12:00 PM 0 0 1 0 0 10 0 0 1 0 1 0 0 11 1 0 2512:15 PM 1 0 0 0 0 17 0 0 0 0 0 0 1 7 0 0 2612:30 PM 1 0 0 0 0 13 1 0 0 0 0 0 0 15 0 0 3012:45 PM 0 1 2 1 0 14 1 0 0 0 0 0 2 10 0 0 31
Total 2 1 3 1 0 54 2 0 1 0 1 0 3 43 1 0 112
*** BREAK ***
Grand Total 7 1 5 2 3 113 6 0 3 0 4 1 6 86 2 0 239Apprch % 46.7 6.7 33.3 13.3 2.5 92.6 4.9 0 37.5 0 50 12.5 6.4 91.5 2.1 0
Total % 2.9 0.4 2.1 0.8 1.3 47.3 2.5 0 1.3 0 1.7 0.4 2.5 36 0.8 0Unshifted 7 0 5 2 1 112 6 0 2 0 4 1 5 86 2 0 233
% Unshifted 100 0 100 100 33.3 99.1 100 0 66.7 0 100 100 83.3 100 100 0 97.5Bank 1 0 0 0 0 1 0 0 0 1 0 0 0 0 0 0 0 2
% Bank 1 0 0 0 0 33.3 0 0 0 33.3 0 0 0 0 0 0 0 0.8Bank 2 0 1 0 0 1 1 0 0 0 0 0 0 1 0 0 0 4
% Bank 2 0 100 0 0 33.3 0.9 0 0 0 0 0 0 16.7 0 0 0 1.7

File Name : Main-72nd SATSite Code : 00000000Start Date : 1/15/2011Page No : 1
MilwaukeeSaturday Midday
R&PA.
Groups Printed- Bank 1 - Bank 272ND ST
From NorthMAIN ST
From East72ND ST
From SouthMAIN ST
From West
Start Time Left Thru Right Peds Left Thru Right Peds Left Thru Right Peds Left Thru Right Peds Int. Total
Factor 1.0 1.0 1.0 1.0 1.0 1.0 1.0 1.0 1.0 1.0 1.0 1.0 1.0 1.0 1.0 1.0*** BREAK ***
11:15 AM 0 0 0 0 1 0 0 0 0 0 0 0 0 0 0 0 111:30 AM 0 0 0 0 1 0 0 0 1 0 0 0 0 0 0 0 2
*** BREAK ***Total 0 0 0 0 2 0 0 0 1 0 0 0 0 0 0 0 3
*** BREAK ***12:30 PM 0 0 0 0 0 1 0 0 0 0 0 0 0 0 0 0 112:45 PM 0 1 0 0 0 0 0 0 0 0 0 0 1 0 0 0 2
Total 0 1 0 0 0 1 0 0 0 0 0 0 1 0 0 0 3
*** BREAK ***
Grand Total 0 1 0 0 2 1 0 0 1 0 0 0 1 0 0 0 6Apprch % 0 100 0 0 66.7 33.3 0 0 100 0 0 0 100 0 0 0
Total % 0 16.7 0 0 33.3 16.7 0 0 16.7 0 0 0 16.7 0 0 0Bank 1 0 0 0 0 1 0 0 0 1 0 0 0 0 0 0 0 2
% Bank 1 0 0 0 0 50 0 0 0 100 0 0 0 0 0 0 0 33.3Bank 2 0 1 0 0 1 1 0 0 0 0 0 0 1 0 0 0 4
% Bank 2 0 100 0 0 50 100 0 0 0 0 0 0 100 0 0 0 66.7
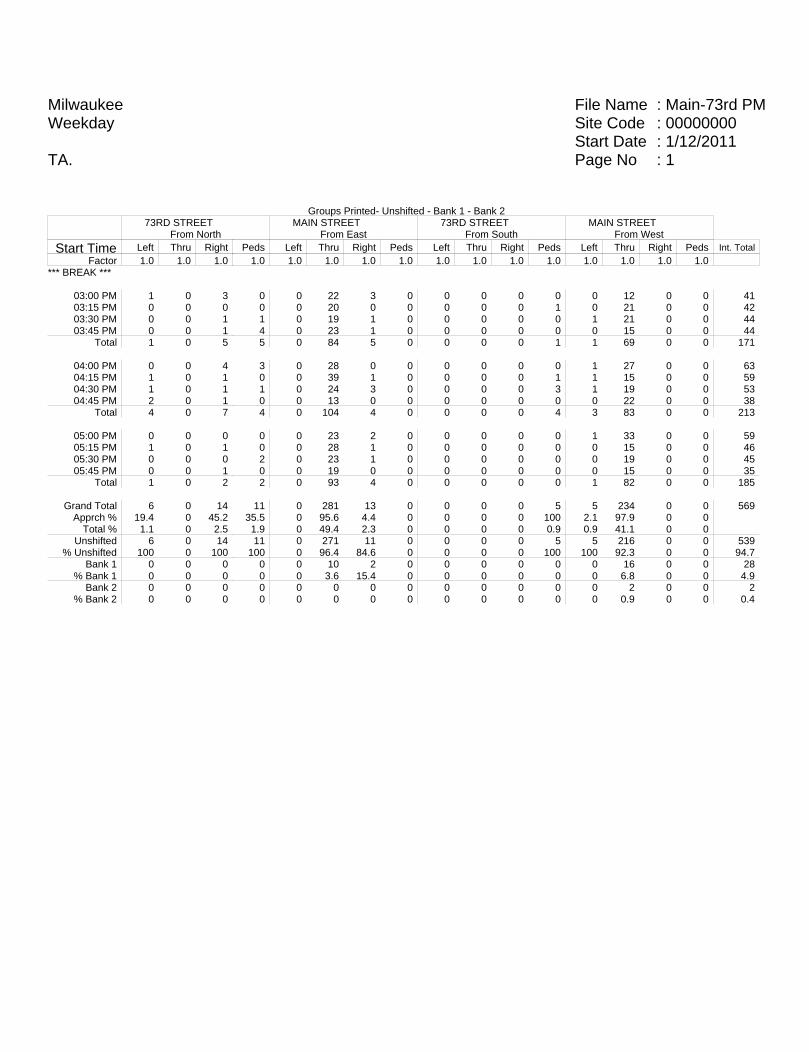
File Name : Main-73rd PMSite Code : 00000000Start Date : 1/12/2011Page No : 1
MilwaukeeWeekday
TA.
Groups Printed- Unshifted - Bank 1 - Bank 273RD STREET
From NorthMAIN STREET
From East73RD STREET
From SouthMAIN STREET
From West
Start Time Left Thru Right Peds Left Thru Right Peds Left Thru Right Peds Left Thru Right Peds Int. Total
Factor 1.0 1.0 1.0 1.0 1.0 1.0 1.0 1.0 1.0 1.0 1.0 1.0 1.0 1.0 1.0 1.0*** BREAK ***
03:00 PM 1 0 3 0 0 22 3 0 0 0 0 0 0 12 0 0 4103:15 PM 0 0 0 0 0 20 0 0 0 0 0 1 0 21 0 0 4203:30 PM 0 0 1 1 0 19 1 0 0 0 0 0 1 21 0 0 4403:45 PM 0 0 1 4 0 23 1 0 0 0 0 0 0 15 0 0 44
Total 1 0 5 5 0 84 5 0 0 0 0 1 1 69 0 0 171
04:00 PM 0 0 4 3 0 28 0 0 0 0 0 0 1 27 0 0 6304:15 PM 1 0 1 0 0 39 1 0 0 0 0 1 1 15 0 0 5904:30 PM 1 0 1 1 0 24 3 0 0 0 0 3 1 19 0 0 5304:45 PM 2 0 1 0 0 13 0 0 0 0 0 0 0 22 0 0 38
Total 4 0 7 4 0 104 4 0 0 0 0 4 3 83 0 0 213
05:00 PM 0 0 0 0 0 23 2 0 0 0 0 0 1 33 0 0 5905:15 PM 1 0 1 0 0 28 1 0 0 0 0 0 0 15 0 0 4605:30 PM 0 0 0 2 0 23 1 0 0 0 0 0 0 19 0 0 4505:45 PM 0 0 1 0 0 19 0 0 0 0 0 0 0 15 0 0 35
Total 1 0 2 2 0 93 4 0 0 0 0 0 1 82 0 0 185
Grand Total 6 0 14 11 0 281 13 0 0 0 0 5 5 234 0 0 569Apprch % 19.4 0 45.2 35.5 0 95.6 4.4 0 0 0 0 100 2.1 97.9 0 0
Total % 1.1 0 2.5 1.9 0 49.4 2.3 0 0 0 0 0.9 0.9 41.1 0 0Unshifted 6 0 14 11 0 271 11 0 0 0 0 5 5 216 0 0 539
% Unshifted 100 0 100 100 0 96.4 84.6 0 0 0 0 100 100 92.3 0 0 94.7Bank 1 0 0 0 0 0 10 2 0 0 0 0 0 0 16 0 0 28
% Bank 1 0 0 0 0 0 3.6 15.4 0 0 0 0 0 0 6.8 0 0 4.9Bank 2 0 0 0 0 0 0 0 0 0 0 0 0 0 2 0 0 2
% Bank 2 0 0 0 0 0 0 0 0 0 0 0 0 0 0.9 0 0 0.4

File Name : Main-73rd PMSite Code : 00000000Start Date : 1/12/2011Page No : 1
MilwaukeeWeekday
TA.
Groups Printed- Bank 1 - Bank 273RD STREET
From NorthMAIN STREET
From East73RD STREET
From SouthMAIN STREET
From West
Start Time Left Thru Right Peds Left Thru Right Peds Left Thru Right Peds Left Thru Right Peds Int. Total
Factor 1.0 1.0 1.0 1.0 1.0 1.0 1.0 1.0 1.0 1.0 1.0 1.0 1.0 1.0 1.0 1.0*** BREAK ***
03:00 PM 0 0 0 0 0 0 0 0 0 0 0 0 0 1 0 0 103:15 PM 0 0 0 0 0 1 0 0 0 0 0 0 0 2 0 0 303:30 PM 0 0 0 0 0 0 0 0 0 0 0 0 0 1 0 0 103:45 PM 0 0 0 0 0 1 0 0 0 0 0 0 0 2 0 0 3
Total 0 0 0 0 0 2 0 0 0 0 0 0 0 6 0 0 8
04:00 PM 0 0 0 0 0 1 0 0 0 0 0 0 0 3 0 0 404:15 PM 0 0 0 0 0 4 0 0 0 0 0 0 0 3 0 0 704:30 PM 0 0 0 0 0 1 2 0 0 0 0 0 0 2 0 0 504:45 PM 0 0 0 0 0 0 0 0 0 0 0 0 0 1 0 0 1
Total 0 0 0 0 0 6 2 0 0 0 0 0 0 9 0 0 17
05:00 PM 0 0 0 0 0 0 0 0 0 0 0 0 0 1 0 0 105:15 PM 0 0 0 0 0 2 0 0 0 0 0 0 0 0 0 0 205:30 PM 0 0 0 0 0 0 0 0 0 0 0 0 0 2 0 0 2
*** BREAK ***Total 0 0 0 0 0 2 0 0 0 0 0 0 0 3 0 0 5
Grand Total 0 0 0 0 0 10 2 0 0 0 0 0 0 18 0 0 30Apprch % 0 0 0 0 0 83.3 16.7 0 0 0 0 0 0 100 0 0
Total % 0 0 0 0 0 33.3 6.7 0 0 0 0 0 0 60 0 0Bank 1 0 0 0 0 0 10 2 0 0 0 0 0 0 16 0 0 28
% Bank 1 0 0 0 0 0 100 100 0 0 0 0 0 0 88.9 0 0 93.3Bank 2 0 0 0 0 0 0 0 0 0 0 0 0 0 2 0 0 2
% Bank 2 0 0 0 0 0 0 0 0 0 0 0 0 0 11.1 0 0 6.7

File Name : Main-73rd SATSite Code : 00000000Start Date : 1/15/2011Page No : 1
MilwaukeeSaturday Midday
JH.
Groups Printed- Unshifted - Bank 1 - Bank 273RD STREET
From NorthMAIN STREET
From East73RD STREET
From SouthMAIN STREET
From West
Start Time Left Thru Right Peds Left Thru Right Peds Left Thru Right Peds Left Thru Right Peds Int. Total
Factor 1.0 1.0 1.0 1.0 1.0 1.0 1.0 1.0 1.0 1.0 1.0 1.0 1.0 1.0 1.0 1.0*** BREAK ***
11:00 AM 1 0 1 0 0 12 0 0 0 0 0 0 1 11 0 0 2611:15 AM 0 0 0 0 0 12 2 0 0 0 0 0 1 9 0 0 2411:30 AM 0 0 1 0 0 18 0 0 0 0 0 0 0 10 0 0 2911:45 AM 0 0 2 0 0 18 4 0 0 0 0 0 0 8 0 0 32
Total 1 0 4 0 0 60 6 0 0 0 0 0 2 38 0 0 111
12:00 PM 1 0 0 0 0 13 0 0 0 0 0 0 1 10 0 0 2512:15 PM 2 0 0 0 0 15 1 0 0 0 0 0 0 6 0 0 2412:30 PM 1 0 2 1 0 12 1 0 0 0 0 0 2 15 0 0 3412:45 PM 0 0 0 0 0 12 1 0 0 0 0 0 0 6 0 0 19
Total 4 0 2 1 0 52 3 0 0 0 0 0 3 37 0 0 102
*** BREAK ***
Grand Total 5 0 6 1 0 112 9 0 0 0 0 0 5 75 0 0 213Apprch % 41.7 0 50 8.3 0 92.6 7.4 0 0 0 0 0 6.2 93.8 0 0
Total % 2.3 0 2.8 0.5 0 52.6 4.2 0 0 0 0 0 2.3 35.2 0 0Unshifted 5 0 6 1 0 112 9 0 0 0 0 0 5 75 0 0 213
% Unshifted 100 0 100 100 0 100 100 0 0 0 0 0 100 100 0 0 100Bank 1 0 0 0 0 0 0 0 0 0 0 0 0 0 0 0 0 0
% Bank 1 0 0 0 0 0 0 0 0 0 0 0 0 0 0 0 0 0Bank 2 0 0 0 0 0 0 0 0 0 0 0 0 0 0 0 0 0
% Bank 2 0 0 0 0 0 0 0 0 0 0 0 0 0 0 0 0 0

File Name : Main-73rd SATSite Code : 00000000Start Date : 1/15/2011Page No : 1
MilwaukeeSaturday Midday
JH.
Groups Printed- Bank 1 - Bank 273RD STREET
From NorthMAIN STREET
From East73RD STREET
From SouthMAIN STREET
From West
Start Time Left Thru Right Peds Left Thru Right Peds Left Thru Right Peds Left Thru Right Peds Int. Total
Factor 1.0 1.0 1.0 1.0 1.0 1.0 1.0 1.0 1.0 1.0 1.0 1.0 1.0 1.0 1.0 1.0*** BREAK ***
Grand Total 0 0 0 0 0 0 0 0 0 0 0 0 0 0 0 0 0Apprch % 0 0 0 0 0 0 0 0 0 0 0 0 0 0 0 0
Total % Bank 1 0
% Bank 1 0 0 0 0 0 0 0 0 0 0 0 0 0 0 0 0 0Bank 2 0
% Bank 2 0 0 0 0 0 0 0 0 0 0 0 0 0 0 0 0 0

File Name : Main - 74th PMSite Code : 00000000Start Date : 1/11/2011Page No : 1
MilwaukeeWeekday
LO.
Groups Printed- Unshifted - Bank 1 - Bank 274TH ST
From NorthMAIN ST
From East74TH ST
From SouthMAIN ST
From West
Start Time Left Thru Right Peds Left Thru Right Peds Left Thru Right Peds Left Thru Right Peds Int. Total
Factor 1.0 1.0 1.0 1.0 1.0 1.0 1.0 1.0 1.0 1.0 1.0 1.0 1.0 1.0 1.0 1.0*** BREAK ***
03:00 PM 0 0 2 0 4 25 1 0 5 1 0 0 0 15 0 1 5403:15 PM 0 0 1 2 3 21 0 0 6 3 3 1 1 17 0 0 5803:30 PM 1 0 0 2 0 13 0 1 2 1 3 2 0 18 1 0 4403:45 PM 0 0 1 0 4 17 1 0 3 0 7 0 0 11 1 0 45
Total 1 0 4 4 11 76 2 1 16 5 13 3 1 61 2 1 201
04:00 PM 0 0 3 1 2 18 0 0 5 0 1 0 1 12 1 0 4404:15 PM 0 0 0 0 0 26 0 0 6 2 5 1 1 11 0 0 5204:30 PM 0 0 0 0 1 17 1 0 5 4 5 0 0 18 2 0 5304:45 PM 0 1 0 0 4 22 0 0 4 0 6 0 0 11 0 0 48
Total 0 1 3 1 7 83 1 0 20 6 17 1 2 52 3 0 197
05:00 PM 0 0 1 0 1 16 2 0 8 1 11 0 0 17 1 0 5805:15 PM 0 0 0 3 1 22 0 0 6 3 8 1 0 12 0 0 5605:30 PM 0 0 0 0 5 24 0 0 1 0 3 0 0 11 0 0 4405:45 PM 0 0 2 0 1 15 0 0 1 0 0 0 0 14 0 0 33
Total 0 0 3 3 8 77 2 0 16 4 22 1 0 54 1 0 191
Grand Total 1 1 10 8 26 236 5 1 52 15 52 5 3 167 6 1 589Apprch % 5 5 50 40 9.7 88.1 1.9 0.4 41.9 12.1 41.9 4 1.7 94.4 3.4 0.6
Total % 0.2 0.2 1.7 1.4 4.4 40.1 0.8 0.2 8.8 2.5 8.8 0.8 0.5 28.4 1 0.2Unshifted 1 1 10 8 20 228 5 1 51 15 50 5 3 151 5 1 555
% Unshifted 100 100 100 100 76.9 96.6 100 100 98.1 100 96.2 100 100 90.4 83.3 100 94.2Bank 1 0 0 0 0 6 8 0 0 1 0 2 0 0 16 1 0 34
% Bank 1 0 0 0 0 23.1 3.4 0 0 1.9 0 3.8 0 0 9.6 16.7 0 5.8Bank 2 0 0 0 0 0 0 0 0 0 0 0 0 0 0 0 0 0
% Bank 2 0 0 0 0 0 0 0 0 0 0 0 0 0 0 0 0 0

File Name : Main - 74th PMSite Code : 00000000Start Date : 1/11/2011Page No : 1
MilwaukeeWeekday
LO.
Groups Printed- Bank 1 - Bank 274TH ST
From NorthMAIN ST
From East74TH ST
From SouthMAIN ST
From West
Start Time Left Thru Right Peds Left Thru Right Peds Left Thru Right Peds Left Thru Right Peds Int. Total
Factor 1.0 1.0 1.0 1.0 1.0 1.0 1.0 1.0 1.0 1.0 1.0 1.0 1.0 1.0 1.0 1.0*** BREAK ***
03:00 PM 0 0 0 0 1 2 0 0 1 0 0 0 0 0 0 0 403:15 PM 0 0 0 0 1 0 0 0 0 0 1 0 0 4 0 0 603:30 PM 0 0 0 0 0 1 0 0 0 0 0 0 0 1 0 0 203:45 PM 0 0 0 0 1 0 0 0 0 0 1 0 0 3 1 0 6
Total 0 0 0 0 3 3 0 0 1 0 2 0 0 8 1 0 18
*** BREAK ***04:15 PM 0 0 0 0 0 1 0 0 0 0 0 0 0 3 0 0 404:30 PM 0 0 0 0 0 0 0 0 0 0 0 0 0 2 0 0 204:45 PM 0 0 0 0 2 2 0 0 0 0 0 0 0 0 0 0 4
Total 0 0 0 0 2 3 0 0 0 0 0 0 0 5 0 0 10
05:00 PM 0 0 0 0 0 1 0 0 0 0 0 0 0 0 0 0 105:15 PM 0 0 0 0 0 1 0 0 0 0 0 0 0 1 0 0 205:30 PM 0 0 0 0 1 0 0 0 0 0 0 0 0 1 0 0 205:45 PM 0 0 0 0 0 0 0 0 0 0 0 0 0 1 0 0 1
Total 0 0 0 0 1 2 0 0 0 0 0 0 0 3 0 0 6
Grand Total 0 0 0 0 6 8 0 0 1 0 2 0 0 16 1 0 34Apprch % 0 0 0 0 42.9 57.1 0 0 33.3 0 66.7 0 0 94.1 5.9 0
Total % 0 0 0 0 17.6 23.5 0 0 2.9 0 5.9 0 0 47.1 2.9 0Bank 1 0 0 0 0 6 8 0 0 1 0 2 0 0 16 1 0 34
% Bank 1 0 0 0 0 100 100 0 0 100 0 100 0 0 100 100 0 100Bank 2 0 0 0 0 0 0 0 0 0 0 0 0 0 0 0 0 0
% Bank 2 0 0 0 0 0 0 0 0 0 0 0 0 0 0 0 0 0
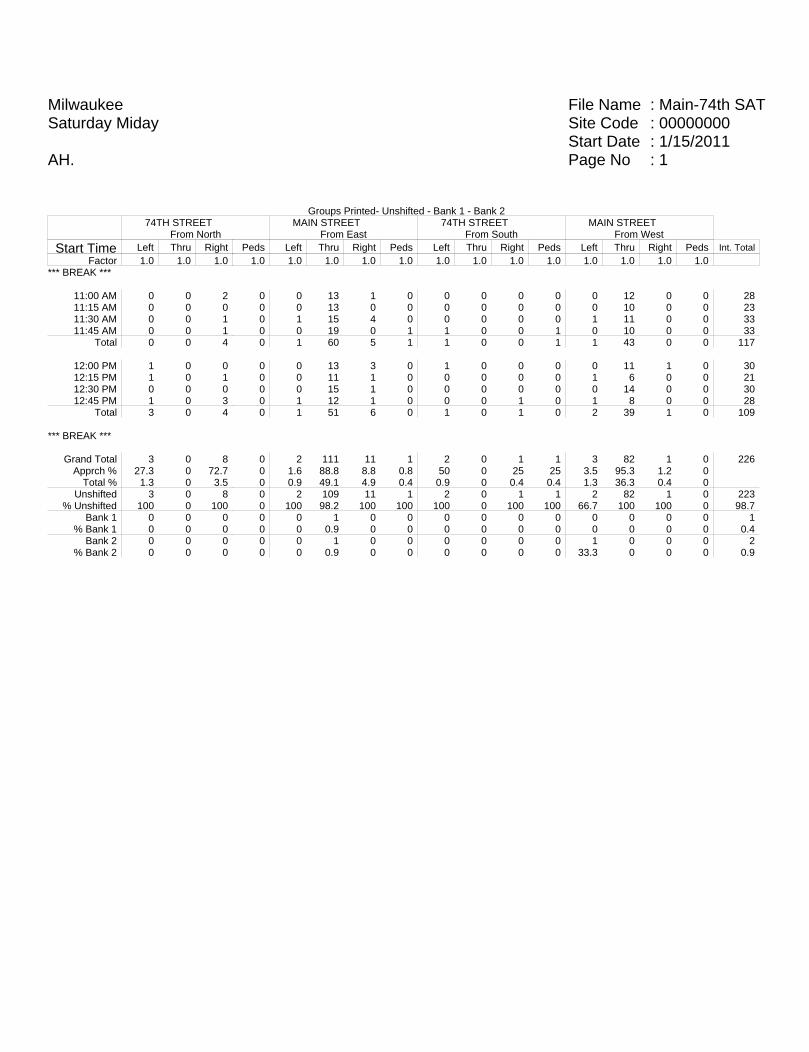
File Name : Main-74th SATSite Code : 00000000Start Date : 1/15/2011Page No : 1
MilwaukeeSaturday Miday
AH.
Groups Printed- Unshifted - Bank 1 - Bank 274TH STREET
From NorthMAIN STREET
From East74TH STREET
From SouthMAIN STREET
From West
Start Time Left Thru Right Peds Left Thru Right Peds Left Thru Right Peds Left Thru Right Peds Int. Total
Factor 1.0 1.0 1.0 1.0 1.0 1.0 1.0 1.0 1.0 1.0 1.0 1.0 1.0 1.0 1.0 1.0*** BREAK ***
11:00 AM 0 0 2 0 0 13 1 0 0 0 0 0 0 12 0 0 2811:15 AM 0 0 0 0 0 13 0 0 0 0 0 0 0 10 0 0 2311:30 AM 0 0 1 0 1 15 4 0 0 0 0 0 1 11 0 0 3311:45 AM 0 0 1 0 0 19 0 1 1 0 0 1 0 10 0 0 33
Total 0 0 4 0 1 60 5 1 1 0 0 1 1 43 0 0 117
12:00 PM 1 0 0 0 0 13 3 0 1 0 0 0 0 11 1 0 3012:15 PM 1 0 1 0 0 11 1 0 0 0 0 0 1 6 0 0 2112:30 PM 0 0 0 0 0 15 1 0 0 0 0 0 0 14 0 0 3012:45 PM 1 0 3 0 1 12 1 0 0 0 1 0 1 8 0 0 28
Total 3 0 4 0 1 51 6 0 1 0 1 0 2 39 1 0 109
*** BREAK ***
Grand Total 3 0 8 0 2 111 11 1 2 0 1 1 3 82 1 0 226Apprch % 27.3 0 72.7 0 1.6 88.8 8.8 0.8 50 0 25 25 3.5 95.3 1.2 0
Total % 1.3 0 3.5 0 0.9 49.1 4.9 0.4 0.9 0 0.4 0.4 1.3 36.3 0.4 0Unshifted 3 0 8 0 2 109 11 1 2 0 1 1 2 82 1 0 223
% Unshifted 100 0 100 0 100 98.2 100 100 100 0 100 100 66.7 100 100 0 98.7Bank 1 0 0 0 0 0 1 0 0 0 0 0 0 0 0 0 0 1
% Bank 1 0 0 0 0 0 0.9 0 0 0 0 0 0 0 0 0 0 0.4Bank 2 0 0 0 0 0 1 0 0 0 0 0 0 1 0 0 0 2
% Bank 2 0 0 0 0 0 0.9 0 0 0 0 0 0 33.3 0 0 0 0.9
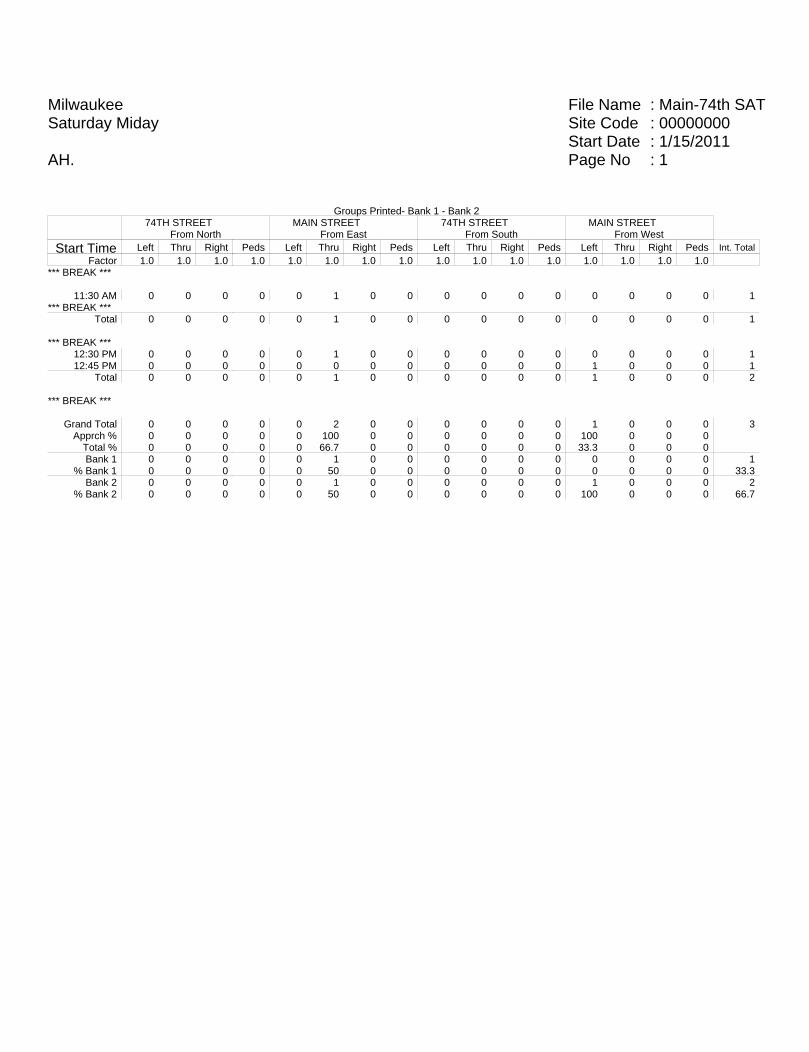
File Name : Main-74th SATSite Code : 00000000Start Date : 1/15/2011Page No : 1
MilwaukeeSaturday Miday
AH.
Groups Printed- Bank 1 - Bank 274TH STREET
From NorthMAIN STREET
From East74TH STREET
From SouthMAIN STREET
From West
Start Time Left Thru Right Peds Left Thru Right Peds Left Thru Right Peds Left Thru Right Peds Int. Total
Factor 1.0 1.0 1.0 1.0 1.0 1.0 1.0 1.0 1.0 1.0 1.0 1.0 1.0 1.0 1.0 1.0*** BREAK ***
11:30 AM 0 0 0 0 0 1 0 0 0 0 0 0 0 0 0 0 1*** BREAK ***
Total 0 0 0 0 0 1 0 0 0 0 0 0 0 0 0 0 1
*** BREAK ***12:30 PM 0 0 0 0 0 1 0 0 0 0 0 0 0 0 0 0 112:45 PM 0 0 0 0 0 0 0 0 0 0 0 0 1 0 0 0 1
Total 0 0 0 0 0 1 0 0 0 0 0 0 1 0 0 0 2
*** BREAK ***
Grand Total 0 0 0 0 0 2 0 0 0 0 0 0 1 0 0 0 3Apprch % 0 0 0 0 0 100 0 0 0 0 0 0 100 0 0 0
Total % 0 0 0 0 0 66.7 0 0 0 0 0 0 33.3 0 0 0Bank 1 0 0 0 0 0 1 0 0 0 0 0 0 0 0 0 0 1
% Bank 1 0 0 0 0 0 50 0 0 0 0 0 0 0 0 0 0 33.3Bank 2 0 0 0 0 0 1 0 0 0 0 0 0 1 0 0 0 2
% Bank 2 0 0 0 0 0 50 0 0 0 0 0 0 100 0 0 0 66.7

File Name : Main-75th PMSite Code : 00000000Start Date : 1/13/2011Page No : 1
MilwaukeeWeekday PM
AH.
Groups Printed- Unshifted - Bank 1 - Bank 275TH ST
From NorthMAIN ST
From East75TH ST
From SouthMAIN ST
From West
Start Time Left Thru Right Peds Left Thru Right Peds Left Thru Right Peds Left Thru Right Peds Int. Total
Factor 1.0 1.0 1.0 1.0 1.0 1.0 1.0 1.0 1.0 1.0 1.0 1.0 1.0 1.0 1.0 1.0*** BREAK ***
03:00 PM 0 0 0 0 0 24 2 0 0 0 0 0 1 12 0 0 3903:15 PM 1 0 0 1 0 19 0 0 0 0 0 0 1 21 0 0 4303:30 PM 0 0 2 0 0 15 0 0 0 0 0 0 1 17 0 0 3503:45 PM 0 0 0 0 0 33 0 0 0 0 0 0 1 15 0 0 49
Total 1 0 2 1 0 91 2 0 0 0 0 0 4 65 0 0 166
04:00 PM 0 0 2 0 0 37 0 1 0 0 0 0 1 19 0 1 6104:15 PM 0 0 0 0 0 41 0 0 0 0 0 0 0 17 0 0 5804:30 PM 0 0 3 0 0 42 1 0 0 0 0 0 1 14 0 1 6204:45 PM 0 0 0 0 0 27 2 0 0 0 0 0 0 23 0 1 53
Total 0 0 5 0 0 147 3 1 0 0 0 0 2 73 0 3 234
05:00 PM 1 0 0 1 0 34 2 0 0 0 0 0 3 26 0 1 6805:15 PM 0 0 0 0 0 31 0 0 0 0 0 0 3 17 0 1 5205:30 PM 0 0 0 0 0 25 2 0 0 0 0 0 1 17 0 1 4605:45 PM 0 0 0 0 0 24 0 1 0 0 0 0 1 8 0 1 35
Total 1 0 0 1 0 114 4 1 0 0 0 0 8 68 0 4 201
Grand Total 2 0 7 2 0 352 9 2 0 0 0 0 14 206 0 7 601Apprch % 18.2 0 63.6 18.2 0 97 2.5 0.6 0 0 0 0 6.2 90.7 0 3.1
Total % 0.3 0 1.2 0.3 0 58.6 1.5 0.3 0 0 0 0 2.3 34.3 0 1.2Unshifted 2 0 7 2 0 348 8 2 0 0 0 0 14 198 0 3 584
% Unshifted 100 0 100 100 0 98.9 88.9 100 0 0 0 0 100 96.1 0 42.9 97.2Bank 1 0 0 0 0 0 3 1 0 0 0 0 0 0 8 0 0 12
% Bank 1 0 0 0 0 0 0.9 11.1 0 0 0 0 0 0 3.9 0 0 2Bank 2 0 0 0 0 0 1 0 0 0 0 0 0 0 0 0 4 5
% Bank 2 0 0 0 0 0 0.3 0 0 0 0 0 0 0 0 0 57.1 0.8

File Name : Main-75th PMSite Code : 00000000Start Date : 1/13/2011Page No : 1
MilwaukeeWeekday PM
AH.
Groups Printed- Bank 1 - Bank 275TH ST
From NorthMAIN ST
From East75TH ST
From SouthMAIN ST
From West
Start Time Left Thru Right Peds Left Thru Right Peds Left Thru Right Peds Left Thru Right Peds Int. Total
Factor 1.0 1.0 1.0 1.0 1.0 1.0 1.0 1.0 1.0 1.0 1.0 1.0 1.0 1.0 1.0 1.0*** BREAK ***
03:00 PM 0 0 0 0 0 0 0 0 0 0 0 0 0 1 0 0 1*** BREAK ***
03:30 PM 0 0 0 0 0 0 0 0 0 0 0 0 0 1 0 0 103:45 PM 0 0 0 0 0 1 0 0 0 0 0 0 0 0 0 0 1
Total 0 0 0 0 0 1 0 0 0 0 0 0 0 2 0 0 3
04:00 PM 0 0 0 0 0 1 0 0 0 0 0 0 0 2 0 1 404:15 PM 0 0 0 0 0 1 0 0 0 0 0 0 0 4 0 0 504:30 PM 0 0 0 0 0 0 0 0 0 0 0 0 0 0 0 1 104:45 PM 0 0 0 0 0 0 0 0 0 0 0 0 0 0 0 1 1
Total 0 0 0 0 0 2 0 0 0 0 0 0 0 6 0 3 11
05:00 PM 0 0 0 0 0 0 1 0 0 0 0 0 0 0 0 0 105:15 PM 0 0 0 0 0 1 0 0 0 0 0 0 0 0 0 0 1
*** BREAK ***05:45 PM 0 0 0 0 0 0 0 0 0 0 0 0 0 0 0 1 1
Total 0 0 0 0 0 1 1 0 0 0 0 0 0 0 0 1 3
Grand Total 0 0 0 0 0 4 1 0 0 0 0 0 0 8 0 4 17Apprch % 0 0 0 0 0 80 20 0 0 0 0 0 0 66.7 0 33.3
Total % 0 0 0 0 0 23.5 5.9 0 0 0 0 0 0 47.1 0 23.5Bank 1 0 0 0 0 0 3 1 0 0 0 0 0 0 8 0 0 12
% Bank 1 0 0 0 0 0 75 100 0 0 0 0 0 0 100 0 0 70.6Bank 2 0 0 0 0 0 1 0 0 0 0 0 0 0 0 0 4 5
% Bank 2 0 0 0 0 0 25 0 0 0 0 0 0 0 0 0 100 29.4
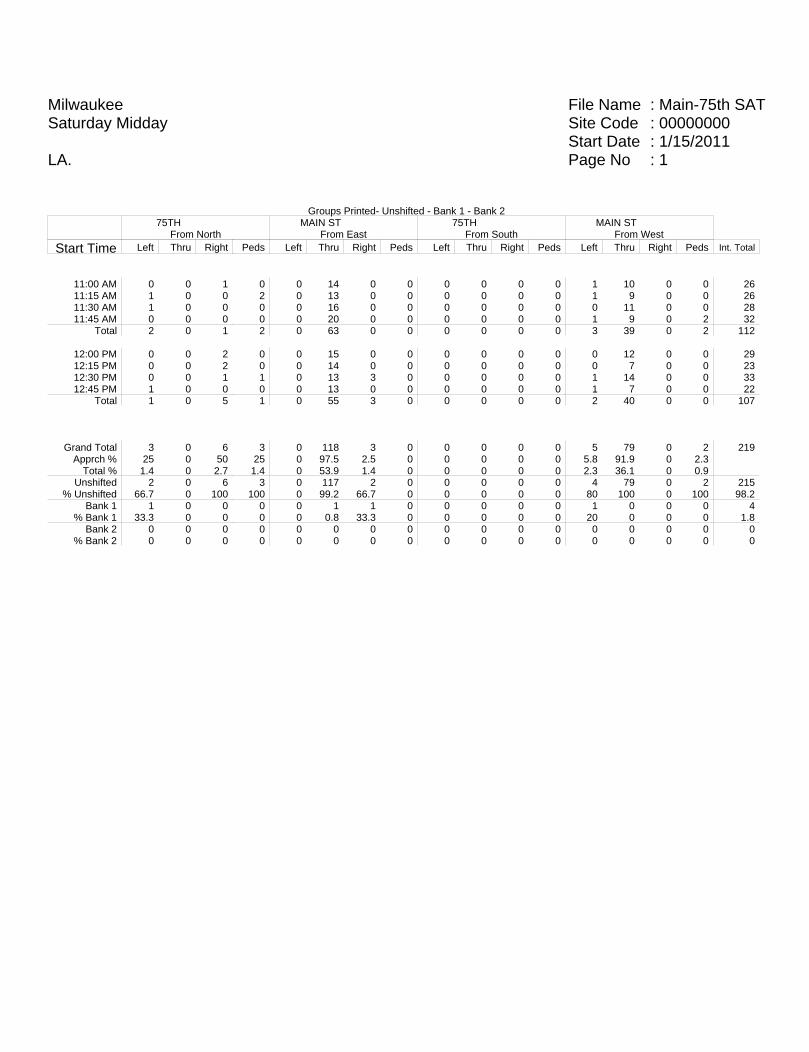
File Name : Main-75th SATSite Code : 00000000Start Date : 1/15/2011Page No : 1
MilwaukeeSaturday Midday
LA.
Groups Printed- Unshifted - Bank 1 - Bank 275TH
From NorthMAIN ST
From East75TH
From SouthMAIN ST
From West
Start Time Left Thru Right Peds Left Thru Right Peds Left Thru Right Peds Left Thru Right Peds Int. Total
11:00 AM 0 0 1 0 0 14 0 0 0 0 0 0 1 10 0 0 2611:15 AM 1 0 0 2 0 13 0 0 0 0 0 0 1 9 0 0 2611:30 AM 1 0 0 0 0 16 0 0 0 0 0 0 0 11 0 0 2811:45 AM 0 0 0 0 0 20 0 0 0 0 0 0 1 9 0 2 32
Total 2 0 1 2 0 63 0 0 0 0 0 0 3 39 0 2 112
12:00 PM 0 0 2 0 0 15 0 0 0 0 0 0 0 12 0 0 2912:15 PM 0 0 2 0 0 14 0 0 0 0 0 0 0 7 0 0 2312:30 PM 0 0 1 1 0 13 3 0 0 0 0 0 1 14 0 0 3312:45 PM 1 0 0 0 0 13 0 0 0 0 0 0 1 7 0 0 22
Total 1 0 5 1 0 55 3 0 0 0 0 0 2 40 0 0 107
Grand Total 3 0 6 3 0 118 3 0 0 0 0 0 5 79 0 2 219Apprch % 25 0 50 25 0 97.5 2.5 0 0 0 0 0 5.8 91.9 0 2.3
Total % 1.4 0 2.7 1.4 0 53.9 1.4 0 0 0 0 0 2.3 36.1 0 0.9Unshifted 2 0 6 3 0 117 2 0 0 0 0 0 4 79 0 2 215
% Unshifted 66.7 0 100 100 0 99.2 66.7 0 0 0 0 0 80 100 0 100 98.2Bank 1 1 0 0 0 0 1 1 0 0 0 0 0 1 0 0 0 4
% Bank 1 33.3 0 0 0 0 0.8 33.3 0 0 0 0 0 20 0 0 0 1.8Bank 2 0 0 0 0 0 0 0 0 0 0 0 0 0 0 0 0 0
% Bank 2 0 0 0 0 0 0 0 0 0 0 0 0 0 0 0 0 0
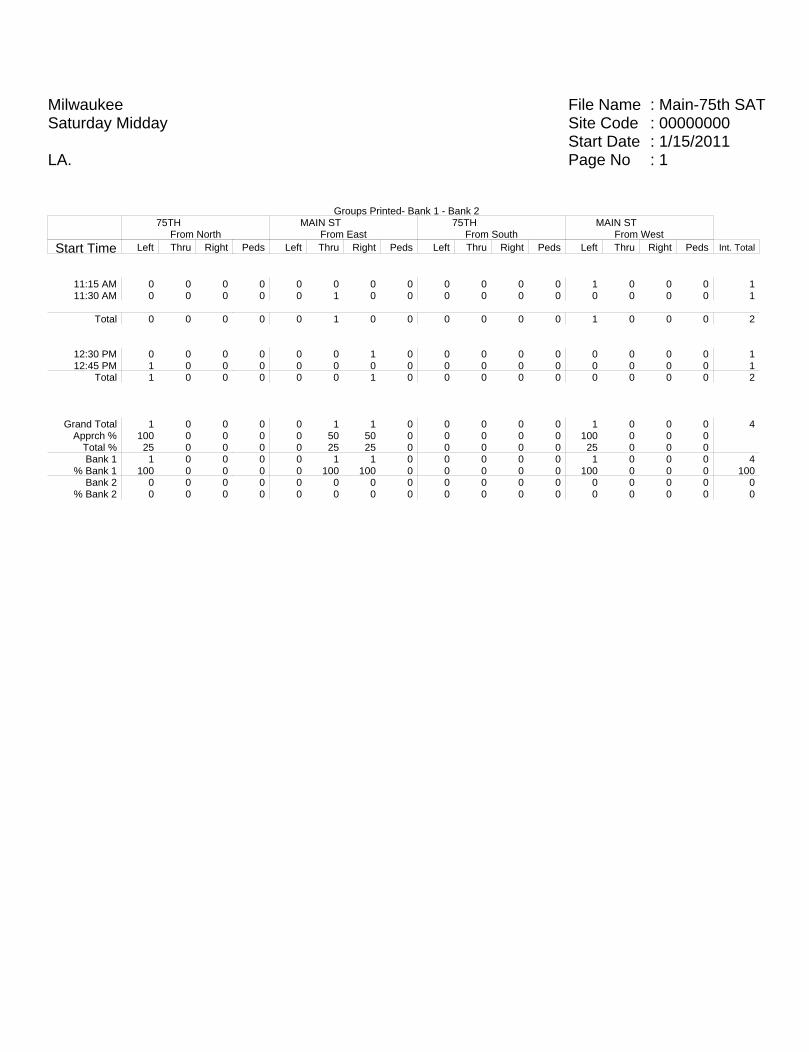
File Name : Main-75th SATSite Code : 00000000Start Date : 1/15/2011Page No : 1
MilwaukeeSaturday Midday
LA.
Groups Printed- Bank 1 - Bank 275TH
From NorthMAIN ST
From East75TH
From SouthMAIN ST
From West
Start Time Left Thru Right Peds Left Thru Right Peds Left Thru Right Peds Left Thru Right Peds Int. Total
11:15 AM 0 0 0 0 0 0 0 0 0 0 0 0 1 0 0 0 111:30 AM 0 0 0 0 0 1 0 0 0 0 0 0 0 0 0 0 1
Total 0 0 0 0 0 1 0 0 0 0 0 0 1 0 0 0 2
12:30 PM 0 0 0 0 0 0 1 0 0 0 0 0 0 0 0 0 112:45 PM 1 0 0 0 0 0 0 0 0 0 0 0 0 0 0 0 1
Total 1 0 0 0 0 0 1 0 0 0 0 0 0 0 0 0 2
Grand Total 1 0 0 0 0 1 1 0 0 0 0 0 1 0 0 0 4Apprch % 100 0 0 0 0 50 50 0 0 0 0 0 100 0 0 0
Total % 25 0 0 0 0 25 25 0 0 0 0 0 25 0 0 0Bank 1 1 0 0 0 0 1 1 0 0 0 0 0 1 0 0 0 4
% Bank 1 100 0 0 0 0 100 100 0 0 0 0 0 100 0 0 0 100Bank 2 0 0 0 0 0 0 0 0 0 0 0 0 0 0 0 0 0
% Bank 2 0 0 0 0 0 0 0 0 0 0 0 0 0 0 0 0 0

File Name : Main-76th PMSite Code : 00000000Start Date : 1/13/2011Page No : 1
MilwaukeeWeekday PM
LO.
Groups Printed- Unshifted - Bank 1 - Bank 276TH ST
From NorthMAIN ST
From East76TH ST
From SouthMAIN ST
From West
Start Time Left Thru Right Peds Left Thru Right Peds Left Thru Right Peds Left Thru Right Peds Int. Total
Factor 1.0 1.0 1.0 1.0 1.0 1.0 1.0 1.0 1.0 1.0 1.0 1.0 1.0 1.0 1.0 1.0*** BREAK ***
03:00 PM 7 77 6 0 11 4 9 1 2 88 8 0 4 2 3 1 22303:15 PM 9 139 1 1 6 6 5 0 2 88 9 0 2 3 3 0 27403:30 PM 7 94 3 0 6 1 12 1 2 84 8 1 3 1 2 1 22603:45 PM 7 82 2 0 9 4 15 1 2 76 6 0 2 1 7 0 214
Total 30 392 12 1 32 15 41 3 8 336 31 1 11 7 15 2 937
04:00 PM 10 91 2 0 20 2 15 1 2 89 11 1 1 5 8 1 25904:15 PM 7 114 4 0 15 4 20 0 2 90 9 1 3 2 2 0 27304:30 PM 5 124 7 0 18 10 11 0 3 80 6 0 4 1 9 0 27804:45 PM 9 123 9 2 17 5 14 3 11 97 9 1 6 9 9 0 324
Total 31 452 22 2 70 21 60 4 18 356 35 3 14 17 28 1 1134
05:00 PM 8 128 3 1 11 5 18 0 0 100 16 0 10 6 12 0 31805:15 PM 7 141 9 1 13 7 13 1 4 87 7 2 11 3 13 0 31905:30 PM 7 121 5 0 13 9 10 0 1 93 6 1 2 6 9 0 28305:45 PM 4 88 8 2 12 9 3 2 3 91 3 1 6 3 8 0 243
Total 26 478 25 4 49 30 44 3 8 371 32 4 29 18 42 0 1163
Grand Total 87 1322 59 7 151 66 145 10 34 1063 98 8 54 42 85 3 3234Apprch % 5.9 89.6 4 0.5 40.6 17.7 39 2.7 2.8 88.4 8.1 0.7 29.3 22.8 46.2 1.6
Total % 2.7 40.9 1.8 0.2 4.7 2 4.5 0.3 1.1 32.9 3 0.2 1.7 1.3 2.6 0.1Unshifted 75 1302 58 7 150 65 141 10 34 1046 97 3 52 40 84 2 3166
% Unshifted 86.2 98.5 98.3 100 99.3 98.5 97.2 100 100 98.4 99 37.5 96.3 95.2 98.8 66.7 97.9Bank 1 10 20 1 0 1 1 4 0 0 17 1 0 2 2 1 1 61
% Bank 1 11.5 1.5 1.7 0 0.7 1.5 2.8 0 0 1.6 1 0 3.7 4.8 1.2 33.3 1.9Bank 2 2 0 0 0 0 0 0 0 0 0 0 5 0 0 0 0 7
% Bank 2 2.3 0 0 0 0 0 0 0 0 0 0 62.5 0 0 0 0 0.2
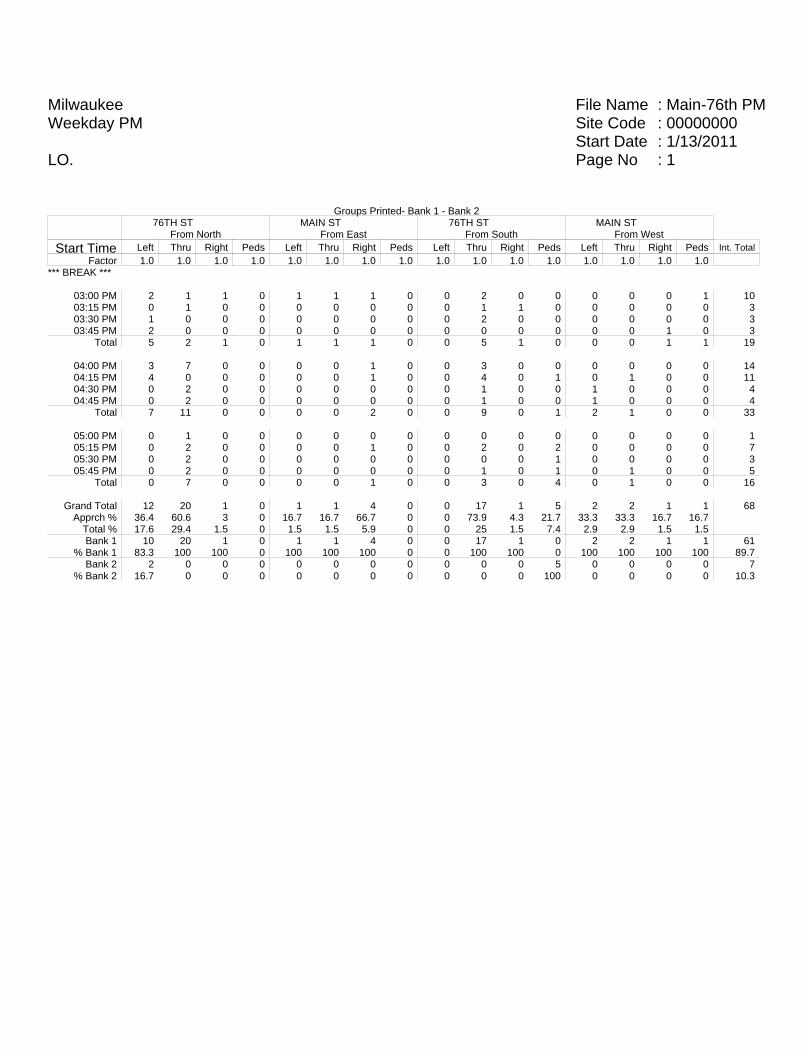
File Name : Main-76th PMSite Code : 00000000Start Date : 1/13/2011Page No : 1
MilwaukeeWeekday PM
LO.
Groups Printed- Bank 1 - Bank 276TH ST
From NorthMAIN ST
From East76TH ST
From SouthMAIN ST
From West
Start Time Left Thru Right Peds Left Thru Right Peds Left Thru Right Peds Left Thru Right Peds Int. Total
Factor 1.0 1.0 1.0 1.0 1.0 1.0 1.0 1.0 1.0 1.0 1.0 1.0 1.0 1.0 1.0 1.0*** BREAK ***
03:00 PM 2 1 1 0 1 1 1 0 0 2 0 0 0 0 0 1 1003:15 PM 0 1 0 0 0 0 0 0 0 1 1 0 0 0 0 0 303:30 PM 1 0 0 0 0 0 0 0 0 2 0 0 0 0 0 0 303:45 PM 2 0 0 0 0 0 0 0 0 0 0 0 0 0 1 0 3
Total 5 2 1 0 1 1 1 0 0 5 1 0 0 0 1 1 19
04:00 PM 3 7 0 0 0 0 1 0 0 3 0 0 0 0 0 0 1404:15 PM 4 0 0 0 0 0 1 0 0 4 0 1 0 1 0 0 1104:30 PM 0 2 0 0 0 0 0 0 0 1 0 0 1 0 0 0 404:45 PM 0 2 0 0 0 0 0 0 0 1 0 0 1 0 0 0 4
Total 7 11 0 0 0 0 2 0 0 9 0 1 2 1 0 0 33
05:00 PM 0 1 0 0 0 0 0 0 0 0 0 0 0 0 0 0 105:15 PM 0 2 0 0 0 0 1 0 0 2 0 2 0 0 0 0 705:30 PM 0 2 0 0 0 0 0 0 0 0 0 1 0 0 0 0 305:45 PM 0 2 0 0 0 0 0 0 0 1 0 1 0 1 0 0 5
Total 0 7 0 0 0 0 1 0 0 3 0 4 0 1 0 0 16
Grand Total 12 20 1 0 1 1 4 0 0 17 1 5 2 2 1 1 68Apprch % 36.4 60.6 3 0 16.7 16.7 66.7 0 0 73.9 4.3 21.7 33.3 33.3 16.7 16.7
Total % 17.6 29.4 1.5 0 1.5 1.5 5.9 0 0 25 1.5 7.4 2.9 2.9 1.5 1.5Bank 1 10 20 1 0 1 1 4 0 0 17 1 0 2 2 1 1 61
% Bank 1 83.3 100 100 0 100 100 100 0 0 100 100 0 100 100 100 100 89.7Bank 2 2 0 0 0 0 0 0 0 0 0 0 5 0 0 0 0 7
% Bank 2 16.7 0 0 0 0 0 0 0 0 0 0 100 0 0 0 0 10.3
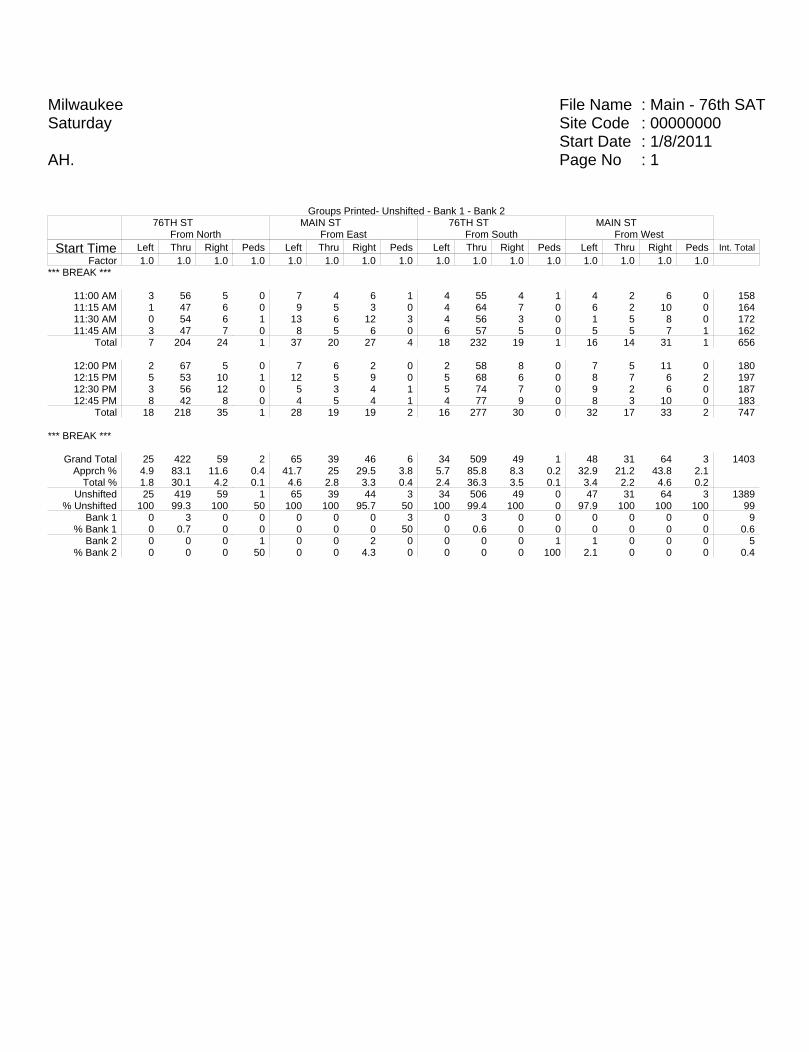
File Name : Main - 76th SATSite Code : 00000000Start Date : 1/8/2011Page No : 1
MilwaukeeSaturday
AH.
Groups Printed- Unshifted - Bank 1 - Bank 276TH ST
From NorthMAIN ST
From East76TH ST
From SouthMAIN ST
From West
Start Time Left Thru Right Peds Left Thru Right Peds Left Thru Right Peds Left Thru Right Peds Int. Total
Factor 1.0 1.0 1.0 1.0 1.0 1.0 1.0 1.0 1.0 1.0 1.0 1.0 1.0 1.0 1.0 1.0*** BREAK ***
11:00 AM 3 56 5 0 7 4 6 1 4 55 4 1 4 2 6 0 15811:15 AM 1 47 6 0 9 5 3 0 4 64 7 0 6 2 10 0 16411:30 AM 0 54 6 1 13 6 12 3 4 56 3 0 1 5 8 0 17211:45 AM 3 47 7 0 8 5 6 0 6 57 5 0 5 5 7 1 162
Total 7 204 24 1 37 20 27 4 18 232 19 1 16 14 31 1 656
12:00 PM 2 67 5 0 7 6 2 0 2 58 8 0 7 5 11 0 18012:15 PM 5 53 10 1 12 5 9 0 5 68 6 0 8 7 6 2 19712:30 PM 3 56 12 0 5 3 4 1 5 74 7 0 9 2 6 0 18712:45 PM 8 42 8 0 4 5 4 1 4 77 9 0 8 3 10 0 183
Total 18 218 35 1 28 19 19 2 16 277 30 0 32 17 33 2 747
*** BREAK ***
Grand Total 25 422 59 2 65 39 46 6 34 509 49 1 48 31 64 3 1403Apprch % 4.9 83.1 11.6 0.4 41.7 25 29.5 3.8 5.7 85.8 8.3 0.2 32.9 21.2 43.8 2.1
Total % 1.8 30.1 4.2 0.1 4.6 2.8 3.3 0.4 2.4 36.3 3.5 0.1 3.4 2.2 4.6 0.2Unshifted 25 419 59 1 65 39 44 3 34 506 49 0 47 31 64 3 1389
% Unshifted 100 99.3 100 50 100 100 95.7 50 100 99.4 100 0 97.9 100 100 100 99Bank 1 0 3 0 0 0 0 0 3 0 3 0 0 0 0 0 0 9
% Bank 1 0 0.7 0 0 0 0 0 50 0 0.6 0 0 0 0 0 0 0.6Bank 2 0 0 0 1 0 0 2 0 0 0 0 1 1 0 0 0 5
% Bank 2 0 0 0 50 0 0 4.3 0 0 0 0 100 2.1 0 0 0 0.4
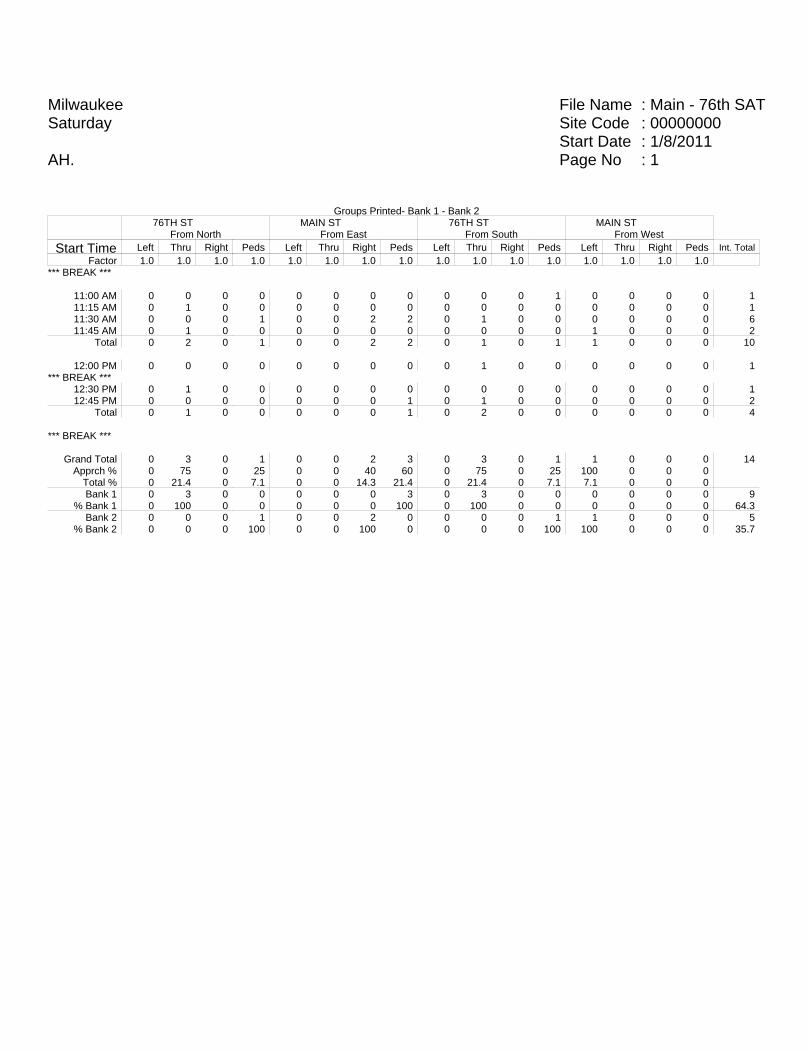
File Name : Main - 76th SATSite Code : 00000000Start Date : 1/8/2011Page No : 1
MilwaukeeSaturday
AH.
Groups Printed- Bank 1 - Bank 276TH ST
From NorthMAIN ST
From East76TH ST
From SouthMAIN ST
From West
Start Time Left Thru Right Peds Left Thru Right Peds Left Thru Right Peds Left Thru Right Peds Int. Total
Factor 1.0 1.0 1.0 1.0 1.0 1.0 1.0 1.0 1.0 1.0 1.0 1.0 1.0 1.0 1.0 1.0*** BREAK ***
11:00 AM 0 0 0 0 0 0 0 0 0 0 0 1 0 0 0 0 111:15 AM 0 1 0 0 0 0 0 0 0 0 0 0 0 0 0 0 111:30 AM 0 0 0 1 0 0 2 2 0 1 0 0 0 0 0 0 611:45 AM 0 1 0 0 0 0 0 0 0 0 0 0 1 0 0 0 2
Total 0 2 0 1 0 0 2 2 0 1 0 1 1 0 0 0 10
12:00 PM 0 0 0 0 0 0 0 0 0 1 0 0 0 0 0 0 1*** BREAK ***
12:30 PM 0 1 0 0 0 0 0 0 0 0 0 0 0 0 0 0 112:45 PM 0 0 0 0 0 0 0 1 0 1 0 0 0 0 0 0 2
Total 0 1 0 0 0 0 0 1 0 2 0 0 0 0 0 0 4
*** BREAK ***
Grand Total 0 3 0 1 0 0 2 3 0 3 0 1 1 0 0 0 14Apprch % 0 75 0 25 0 0 40 60 0 75 0 25 100 0 0 0
Total % 0 21.4 0 7.1 0 0 14.3 21.4 0 21.4 0 7.1 7.1 0 0 0Bank 1 0 3 0 0 0 0 0 3 0 3 0 0 0 0 0 0 9
% Bank 1 0 100 0 0 0 0 0 100 0 100 0 0 0 0 0 0 64.3Bank 2 0 0 0 1 0 0 2 0 0 0 0 1 1 0 0 0 5
% Bank 2 0 0 0 100 0 0 100 0 0 0 0 100 100 0 0 0 35.7

The Walmart Market - Milwaukee, Wisconsin March 31, 2011
Traffic Analysis & Design, Inc. C:\JOBS\1223 WalMart 70th-Main Milwaukee\Report - TIA\Appendix 110331.docx
APPENDIX A
Existing Traffic Signal Timings

ELECTRICAL: FUNCTION KE
Y
VA
L
OFFSET 1 24 OFFSET 1 39 OFFSET 1 OFFSET 1
# OF INTER 6 8 OFFSET 2 OFFSET 2 OFFSET 2 OFFSET 2
TYPE OF CAB. 7 2 OFFSET 3 OFFSET 3 OFFSET 3 OFFSET 3
OFFSET 4 OFFSET 4 OFFSET 4 OFFSET 4
FLASHING PROGRAM : ACT. 1 LOCK 0 MAX. MAX. MAX. MAX.
ACT. 2 LOCK 1 DWELL DWELL DWELL DWELL
ACT. 1 DELAY 2
1 2 3 4 5 6 7 8 ACT. 2 DELAY 3
8 X X PRE-EMPT 1 LOCK 5 60 0 0 0 60 0 0 0 0 0 0 0 0 0 0 0
9 X X PRE-EMPT 2 LOCK 6 SP
1
SP
2
SP
3
SP
4
SP
1
SP
2
SP
3
SP
4
SP
1
SP
2
SP
3
SP
4
SP
1
SP
2
SP
3
SP
4
A PRE-EMPT 3 LOCK 7 1 21 21
B PRE-EMPT 1 DELAY 8 2 10 10
C PRE-EMPT 2 DELAY 9 3 4 4
AUXILLARY EQUIPMENT: PRE-EMPT 3 DELAY A 4 1.5 1.5
5 7 7
LONG POWER DOWN 0 4 6 11 11
SHORT POWER DOWN 1 4 7 4 4
PROGRAM: 8 1.5 1.5
ACT. SIGNAL PLAN 2 9
ACT. CYCLE 3 10
ACT. SPLIT 4 11
ACT. OFFSET 5 12
RESET INTERVAL 6 13
# OF CYCLES 7 14
NO T.B.C. FALL BACK 8 15
CRD. FROM ACT. MSTR. 9 16
17
DWELL METHOD A A 0 18
COORD. MODE E 1 19
COORD. MASTER F 20
TIME IN SERVICE: SYSTEM DATA: 21
MASTER: KEARNEY AND 68TH 22
SIGNAL #: PRO. CL.: KEARNEY AND 68TH 23
FL. CL.: LOCAL 24
LOCATION: DESIGNED BY: DRAWN BY: SUPERSEDES:
CHECKED BY: APPROVED BY: SUPERSEDED BY:
DATE:
JCB
KAL
WP #62-2465 @ 44' E. OF C.C. IN ALLEY
ENTRANCE N. OF MAIN ST.
1/5/07S. 70TH ST.
1/17/07 @ 0750
3044
W. MAIN ST.
&
C+C+KEY
CYCLE 1
INT
ER
VA
L CYCLE LENGTH
SEC
FL
AS
H
D+4+KEY
B+1+KEY
OU
TP
UT
2 #4 LTP SERVICE FED FROM WEPCO
CYCLE 2 CYCLE 3 CYCLE 4
36 36
DRG. NO.: B-07-503-T
SEC SEC SEC
CYCLE LENGTH
B-00-562-TJCB
CYCLE 2: 1500-1800 HRS. EX. S/S/H
CYCLE LENGTH CYCLE LENGTH
B+3+KEY
SPECIAL ACT. FUNCTIONS
FLASH BOOSTER RELAY FOR FLASH
(2300-0600 HRS.)
2300-0600 HRS.; N/S-YELLOW, E/W-RED
AS
SIG
N.
B.T.E. E.S. - DPW - CITY OF MILWAUKEE - GJG W9FT PROGRAM - 170 CONTROLLER PAGE 1 OF 4

SIGNAL PLAN #1
1 2 3 4 5 6 7 8 9 10 11 12 13 14 15 16 17 18 19 20 21 22 23 24 25 26 27 28 29 30 31 32 33 34 35 36 37 38 39 401 1 1 1 1 1 1 1 1 5 12 2 2 F 2 2 2 5 23 3 3 F 3 3 3 1 4 5 34 4 4 4 4 4 4 1 1.5 5 45 5 5 5 5 5 5 5 56 6 6 6 6 6 F 5 67 7 7 7 7 7 F 1 4 5 78 8 8 8 8 8 8 1 1.5 5 89 9
10 1011 1112 1213 1314 1415 1516 1617 1718 1819 1920 2021 2122 2223 2324 24
LOCATION : CYCLE XFER 1 FLASH ENTRY 8 DWELL 1 PLAN OPERATES DATE SUPERSEDES B-00-562-T
SPLIT XFER 1 FLASH EXIT 1 INITALIZATION 1 ALL TIMES EX. FLASH 1/5/07 SUPERSEDED BYDESIGNED BY: DRAWN BY CHECKED BY APPROVED BY
JCB JCB KAL
W. MAIN ST.
&
S. 70TH ST.B-07-503-TDRG. NO.:
INT
ER
VA
L
AC
TU
AT
#1
RE
SE
T N
O. 1
AC
TU
AT
#2
R Y G R Y G
PR
EE
MP
TIO
N X
FE
R
PL
AN
XF
ER
INT
ER
VA
L
RE
SE
T N
O 2
TR
AN
SIT
ION
AU
TO
TIM
ING
MIN
. T
IMIN
G
RE
SP
ON
SE
G R Y GDW W R Y - - - -DW W - - -
" " N/S
X-W
AL
KS
"WB
MA
IN
" ""NB
70
TH
" " SB
70
TH
SP
AR
E
" " " SP
AR
E
" " E/W
X-W
AL
KS
"EB
MA
IN
-
" SP
AR
EB.T.E. E.S. - D.P.W. - CITY OF MILWAUKEE - GJG W9FT PROGRAM - 170 CONTROLLER PAGE 2 OF 4
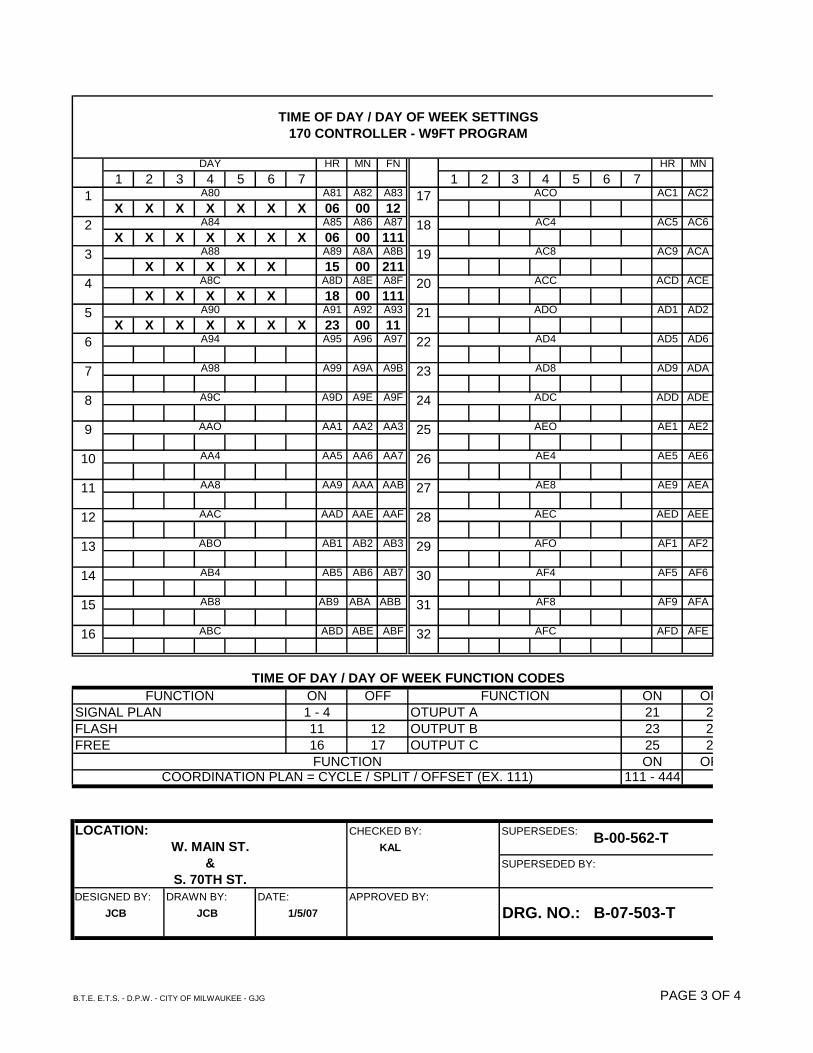
HR MN FN HR MN
1 2 3 4 5 6 7 1 2 3 4 5 6 7A81 A82 A83 AC1 AC2
X X X X X X X 06 00 12A85 A86 A87 AC5 AC6
X X X X X X X 06 00 111A89 A8A A8B AC9 ACA
X X X X X 15 00 211A8D A8E A8F ACD ACE
X X X X X 18 00 111A91 A92 A93 AD1 AD2
X X X X X X X 23 00 11A95 A96 A97 AD5 AD6
A99 A9A A9B AD9 ADA
A9D A9E A9F ADD ADE
AA1 AA2 AA3 AE1 AE2
AA5 AA6 AA7 AE5 AE6
AA9 AAA AAB AE9 AEA
AAD AAE AAF AED AEE
AB1 AB2 AB3 AF1 AF2
AB5 AB6 AB7 AF5 AF6
AB9 ABA ABB AF9 AFA
ABD ABE ABF AFD AFE
LOCATION: CHECKED BY: SUPERSEDES:
KAL
SUPERSEDED BY:
DESIGNED BY: DRAWN BY: DATE: APPROVED BY:
JCB JCB 1/5/07
W. MAIN ST.
&
S. 70TH ST.
FUNCTIONCOORDINATION PLAN = CYCLE / SPLIT / OFFSET (EX. 111)
DRG. NO.: B-07-503-T
ON111 - 444
OFF
B-00-562-T
FLASH
FUNCTIONOTUPUT AOUTPUT BOUTPUT C17
ON1 - 411
2224
FUNCTIONSIGNAL PLAN
26
ON212325FREE
A98
A9C
AAO
AA4
16
TIME OF DAY / DAY OF WEEK FUNCTION CODES
OFF
12
OFF
28
29
30
31
32
A84
A88
A8C
A90
A94 22
23
24
25
26
27
AEC
AFO
AF4
AF8
AFC
17
18
19
20
21
AD4
AD8
ADC
AEO
AE4
AE8
AAC
ABO
AB4
AB8
ABC
ACO
AC4
AC8
ACC
ADO
AA8
16
DAY
A80
12
13
14
15
8
2
3
9
10
11
4
5
6
7
TIME OF DAY / DAY OF WEEK SETTINGS
170 CONTROLLER - W9FT PROGRAM
1
B.T.E. E.T.S. - D.P.W. - CITY OF MILWAUKEE - GJG PAGE 3 OF 4

FN
AC3
AC7
ACB
ACF
AD3
AD7
ADB
ADF
AE3
AE7
AEB
AEF
AF3
AF7
AFB
AFF
B-07-503-T
OFF
B-00-562-T
222426
TIME OF DAY / DAY OF WEEK FUNCTION CODES
OFF
TIME OF DAY / DAY OF WEEK SETTINGS
170 CONTROLLER - W9FT PROGRAM
B.T.E. E.T.S. - D.P.W. - CITY OF MILWAUKEE - GJG PAGE 3 OF 4

303-8 CABINET
1 2 3 4 5 6 7 8 9 10 11 12 13 14 15 16
LOCATION:
2 3 4 5 6 7 8 9 10 11 12 13 14 15 16
3 4 5 6 7 8 9 10 11 12 13 14 15 16
4 5 6 7 8 9 10 11 12 13 14 15 16
SHADED COMBINATIONS 5 6 7 8 9 10 11 12 13 14 15 16
ARE NOT PERMITTED 6 7 8 9 10 11 12 13 14 15 16
DIODES FOR CONFLICTING 7 8 9 10 11 12 13 14 15 16
INDICATIONS 8 9 10 11 12 13 14 15 16
9 10 11 12 13 14 15 16
CABINET SWITCH LOCATIONS 10 11 12 13 14 15 16
1 2 3 4 5 6 11 12 13 14 15 16
12 13 14 15 16
13 14 15 16
CONFLICT MONITOR CONNECTIONS 14 15 16
15 16
1Y 2Y 9G 3Y 4Y 9Y 16
1G 2G 13G 3G 4G 14G
MONITOR IN SERVICE: 9/7/00 @ 0937
DRG. NO: B-07-503-T
NB
70T
H
E/W
X-W
AL
KS
N/S
X-W
AL
KS
SP
AR
E
EB
MA
IN
WB
MA
IN
SP
AR
E
SP
AR
E
W. MAIN ST.
&
S. 70TH ST.
DIRECTION
PHASE
SB
70T
H
B.T.E. E.S. - D.P.W. - CITY OF MILWAUKEE - GJG PAGE 4 OF 4

1 2 3 4 5 6 7 8
0 X X
1 X X
2
3
4 X X X X
5 X X X
6 X X X X
7 X X X X
8
9 X X
A
B
C
D
E
F
PHASE 5 OVERLAP
B
PHASE 1: PHASE 6 OVERLAP
C
PHASE 2: PHASE 7 OVERLAP
D
PHASE 3: PHASE 8 OVERLAP
E
W. X-WALK
SPARE
NB 76TH
E. X-WALK
ASSIGNMENT DESCRIPTION
SPARE
FUNCTION87
20
7
41
1FUNCTION 6543KE
Y
MAX I 0 41 20
MAX II / HFDW 1
7WALK 2 7
7FDW 3 7 13
MAX INITIAL 4
MIN GREEN 5 14 10 14 10
TIME BEFORE REDUCTION 6
TIME TO REDUCE 7
OBSERVE GAP 8
PASSAGE 9 3 3
MINIMUM GAP A
4
ADDED / ACTUATION B
YELLOW C 4 3.5
D 1.5 2.5
LEAD PHASES
DUAL ENTRY
RED REVERT E
VEHICLE RECALL
PED. RECALL
RED LOCK
YELLOW LOCK
PERMIT
PED PHASES
3.5
1.5
OVERLAP A
OVERLAP B
SERVICE:
3 #4/1 #8 LTP FED FROM CONT.
CAB. KEARNEY AND 76TH MAIN
C.B. @ 70TH & O'CONNOR CAB.
WALK II F
RED CLEARANCE
0100-0630 HRS.)
PHASE FUNCTIONS (0 + KEY)
KE
Y
2
170 CONTROLLER W4IKS PROGRAM
FLASH PROGRAM:
2100-0630 HRS.; N/S-YELLOW, INTERSECTION PROGRAMMING DATA E/W-RED (EX. STATE FAIR -
PHASE
SPARE
PAGE 0 (NORMAL) - DO NOT PAGE COPY
PHASE - TIMING DATA (PHASE + KEY)
EXCLUSIVE
SIM GAP
SEQ TIMING
2.5
OVERLAP C
OVERLAP D
START UP GREEN
ACT.
WB MAIN
SB 76TH
EB MAIN
S. X-WALK
ACT.
SPARE
PHASE 4: OVERLAP OVERLAPA F
TIME IN: PROGRAM: SYSTEM DATA
TIMER:
SIGNAL NO:
PROGRAM INST:
AUXILLARY EQUIPMENT:
CHECKED BY: APPROVED BY: SUPERSEDED BY: SUPERSEDES:
DESIGNED BY: DRAWN BY: DATE:
POLICE HANDCORD INPUT CARD FOR
SPECIAL EVENTS
MASTER:
PRO. CL.:
FL. CL.: LOCAL
KEARNEY AND 68TH
LOCAL
KAL
JCB 2/22/07JCB
(90 SEC./CYCLE)
CRD. PL. 7: 0630-0900 HRS. EX. S/S/H
AND DURING STATE FAIR
B-05-812-T
DRAWING NO: B-07-539-T
&
S. 76TH ST.
W. MAIN ST.
ACT.
3/6/07 @ 1250
W4IKS.37
3026
WB MAIN
LOCATION:
PAGE 0: ALL TIMES EX. STATE FAIR
(60 SEC./CYCLE)
PAGE 1, CRD. PL. 2: AT ALL TIMES
EX. FLASH DURING STATE FAIR.
I.S.D. - D.P.W. - CITY OF MILWAUKEE - GJG PAGE 1 OF 7

1 2 3 4 5 6 7 8
0 X X
1 X X
2
3
4 X X X X
5 X X X
6 X X X X
7 X X X X
8
9 X X
A
B
C
D
E
F
PHASE 5 OVERLAP
B
PHASE 1: PHASE 6 OVERLAP
C
PHASE 2: PHASE 7 OVERLAP
D
SPARE EB MAIN ACT.
E. X-WALK
SB 76TH SPARE
W. X-WALK
PHASE SPARE
ASSIGNMENT DESCRIPTION
SPARE NB 76TH
SIM GAP
EXCLUSIVE
WALK II F
RED REVERT E
2.5 1.5 2.5 OVERLAP D
4 3.5 OVERLAP C
RED CLEARANCE D 1.5
YELLOW C 4 3.5
OVERLAP B
OVERLAP A
ADDED / ACTUATION B
MINIMUM GAP A
3 3 START UP GREEN
SEQ TIMING
PASSAGE 9
OBSERVE GAP 8
DUAL ENTRY
LEAD PHASES
TIME TO REDUCE 7
TIME BEFORE REDUCTION 6
12 14 12 PED PHASES
PERMIT
MIN GREEN 5 14
MAX INITIAL 4
7 13 YELLOW LOCK
7 7 RED LOCK
FDW 3 7
WALK 2 7
PED. RECALL
69 30 VEHICLE RECALL
MAX II / HFDW 1
MAX I 0 69 30
KE
Y
FUNCTION 1 2 3 4 5 6 7
PAGE 1 (STATE FAIR) - DO NOT PAGE COPY
PHASE - TIMING DATA (PHASE + KEY) PHASE FUNCTIONS (0 + KEY)K
EY
8 FUNCTION
SERVICE:
170 CONTROLLER W4IKS PROGRAM 3 #4/1 #8 LTP FED FROM CONT.
CAB. KEARNEY AND 76TH MAIN C.B.
@ 70TH & O'CONNOR CAB.
INTERSECTION PROGRAMMING DATAFLASH PROGRAM:
0100-0630 HRS.; N/S-YELLOW,
E/W-RED
PHASE 3: PHASE 8 OVERLAP
E
WB MAIN ACT.
SPARE EB MAIN ACT.S. X-WALK
PHASE 4: OVERLAP OVERLAPA F
TIME IN: PROGRAM: SYSTEM DATA
TIMER:
SIGNAL NO:
PROGRAM INST:
AUXILLARY EQUIPMENT:
CHECKED BY: APPROVED BY: SUPERSEDED BY: SUPERSEDES:
DESIGNED BY: DRAWN BY: DATE:
PRO. CL.: LOCAL
B-05-812-TKAL
DRAWING NO: B-07-539-TJCB 2/22/07JCB
&POLICE HANDCORD INPUT CARD FOR
S. 76TH ST.SPECIAL EVENTS
LOCAL
W. MAIN ST.
LOCATION:
CRD. PL. 7: 0630-0900 HRS. EX. S/S/H
AND DURING STATE FAIR
3026 EX. FLASH DURING STATE FAIR.
PAGE 0: ALL TIMES EX. STATE FAIR
W4IKS.37 (60 SEC./CYCLE)
PAGE 1, CRD. PL. 2: AT ALL TIMES
(90 SEC./CYCLE) FL. CL.:
WB MAIN ACT.
3/6/07 @ 1250MASTER: KEARNEY AND 68TH
PAGE 2 OF 7

1 2 3 4 5 6 7 8 90 60 90 60
12 0 0 0
34 34 44 34
56 0 0 0
78 34 44 34
9 49 88 43
A 0 0 0
B 15 15 15
1 2 3 4 5 6 7 8 1 2 3 4 5 6 7COORD PLAN 1 COORD PLAN 6
LEAD PHASES C X X X X LEAD PHASES CCOORD PHASES D X X COORD PHASES DPERM 2 PHASES E PERM 2 PHASES EMIN RECALL F X X MIN RECALL FCOORD PLAN 2 COORD PLAN 7
LEAD PHASES C X X X X LEAD PHASES C X X X X
COORD PHASES D X X COORD PHASES D X X
PERM 2 PHASES E PERM 2 PHASES EMIN RECALL F X X MIN RECALL F X X
COORD PLAN 3 COORD PLAN 8
LEAD PHASES C LEAD PHASES CCOORD PHASES D COORD PHASES DPERM 2 PHASES E PERM 2 PHASES EMIN RECALL F MIN RECALL FCOORD PLAN 4 COORD PLAN 9
LEAD PHASES C LEAD PHASES CCOORD PHASES D COORD PHASES DPERM 2 PHASES E PERM 2 PHASES EMIN RECALL F MIN RECALL F
COORD PLAN 5 LOCATION:
LEAD PHASES CCOORD PHASES DPERM 2 PHASES E DATE: SUPERSEDES: B-05-812-T
MIN RECALL F 2/22/07 SUPERSEDED:
DESIGNED BY: DRAWN BY: CHECKED BY: APPROVED:
JCB JCB KAL
FUNCTION
KE
Y PHASE
DRAWING: B-07-539-T
W. MAIN ST.
&
S. 76TH ST.
FORCE OFF PH 5FORCE OFF PH 6
FUNCTION
KE
Y PHASE
MAXIMUM DWELL
FORCE OFF PH 7FORCE OFF PH 8OFFSET (SECONDS)PERMISSIVE LENGTH
FORCE OFF PH 4
FORCE OFF PH 1FORCE OFF PH 2FORCE OFF PH 3
170 CONTROLLER - 4IKS
PROGRAM COORDINATION DATA
CYCLE LENGTH
COORDINATION PLANFUNCTION
I.S.D - D.P.W. - CITY OF MILWAUKEE - GJG PAGE 3 OF 7

8PHASE
B-07-539-T
W. MAIN ST.
&
S. 76TH ST.
170 CONTROLLER - 4IKS
PROGRAM COORDINATION DATA
I.S.D - D.P.W. - CITY OF MILWAUKEE - GJG PAGE 3 OF 7
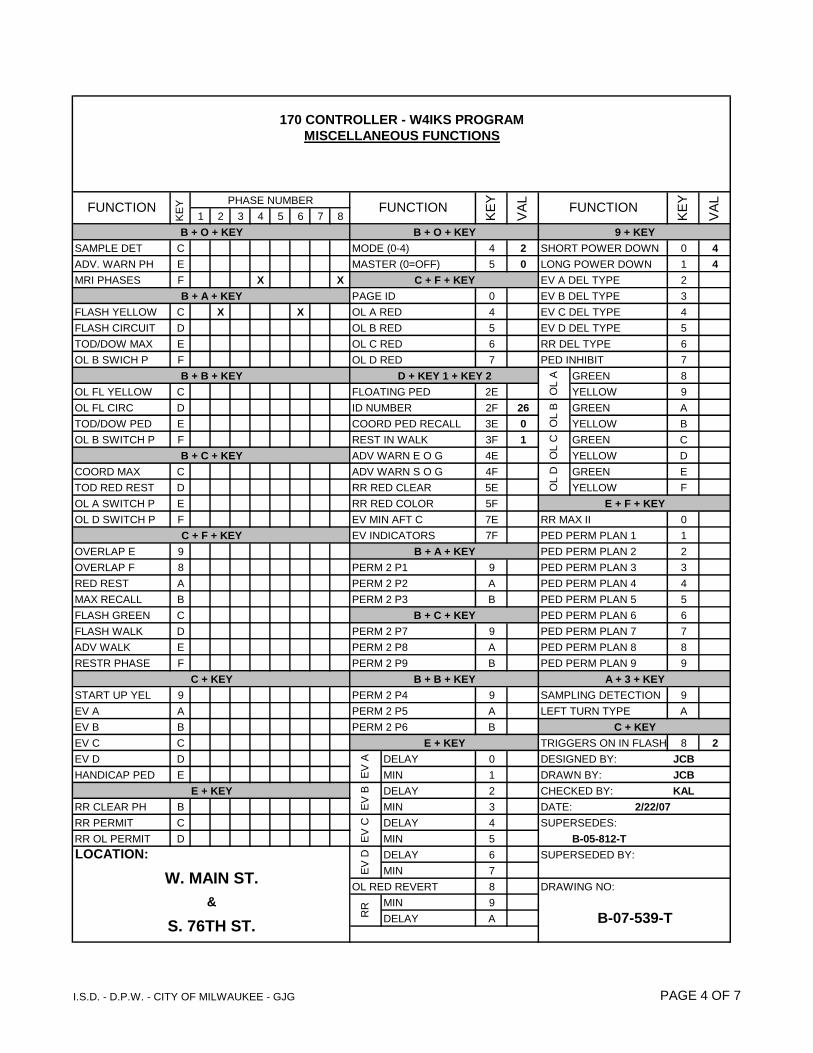
1 2 3 4 5 6 7 8
C 4 2 0 4
E 5 0 1 4
F X X 2
0 3
C X X 4 4
D 5 5
E 6 6
F 7 7
8
C 2E 9
D 2F 26 A
E 3E 0 B
F 3F 1 C
4E D
C 4F E
D 5E F
E 5F
F 7E 0
7F 1
9 2
8 9 3
A A 4
B B 5
C 6
D 9 7
E A 8
F B 9
9 9 9
A A A
B B
C 8 2
D 0 JCB
E 1 JCB
2 KAL
B 3
C 4 SUPERSEDES:
D 5 B-05-812-T
LOCATION: 6 SUPERSEDED BY:
7
8 DRAWING NO:
9
A B-07-539-T
170 CONTROLLER - W4IKS PROGRAM
MISCELLANEOUS FUNCTIONS
CHECKED BY:
DATE: 2/22/07
TRIGGERS ON IN FLASH
C + KEY
DESIGNED BY:
DRAWN BY:MIN
E + KEY
PED PERM PLAN 9
A + 3 + KEY
SAMPLING DETECTION
PED PERM PLAN 4
PED PERM PLAN 5
PED PERM PLAN 6
PED PERM PLAN 7
B + O + KEY
PHASE NUMBERFUNCTION
KE
Y
LEFT TURN TYPE
RR MAX II
PED PERM PLAN 1
PED PERM PLAN 2
PED PERM PLAN 3
PED PERM PLAN 8
FLASH CIRCUIT
TOD/DOW MAX
OL B SWICH P
OL FL YELLOW
B + B + KEY
SAMPLE DET
ADV. WARN PH
MRI PHASES
FLASH YELLOW
B + A + KEY
TOD RED REST
OL A SWITCH P
OL D SWITCH P
OVERLAP E
C + F + KEY
OL FL CIRC
TOD/DOW PED
OL B SWITCH P
COORD MAX
B + C + KEY
FLASH WALK
ADV WALK
RESTR PHASE
START UP YEL
C + KEY
OVERLAP F
RED REST
MAX RECALL
FLASH GREEN
HANDICAP PED
RR CLEAR PH
RR PERMIT
RR OL PERMIT
E + KEY
EV A
EV B
EV C
EV D
W. MAIN ST.
S. 76TH ST.
&
FUNCTION
MASTER (0=OFF)
PAGE ID
OL A RED
OL B RED
OL C RED
OL D RED
VA
L
B + O + KEY 9 + KEY
MODE (0-4)
KE
Y
VA
L
FUNCTION
KE
Y
ADV WARN E O G
ADV WARN S O G
RR RED CLEAR
RR RED COLOR
FLOATING PED
ID NUMBER
COORD PED RECALL
REST IN WALK
PERM 2 P9
EV MIN AFT C
EV INDICATORS
PERM 2 P1
PERM 2 P2
B + A + KEY
MIN
DELAY
EV
BE
V C DELAY
MIN
DELAY
MIN
MIN
DELAY
D + KEY 1 + KEY 2E
V D
PERM 2 P4
PERM 2 P5
PERM 2 P6
EV
A DELAY
PERM 2 P3
PERM 2 P7
PERM 2 P8
C + F + KEY
OL RED REVERT
SHORT POWER DOWN
LONG POWER DOWN
EV A DEL TYPE
EV B DEL TYPE
EV C DEL TYPE
EV D DEL TYPE
RR DEL TYPE
PED INHIBIT
OL A GREEN
YELLOW
OL B GREEN
YELLOW
E + F + KEY
RR
OL C GREEN
YELLOW
OL D GREEN
YELLOW
B + B + KEY
B + C + KEY
I.S.D. - D.P.W. - CITY OF MILWAUKEE - GJG PAGE 4 OF 7

HR MN FN HR MN
1 2 3 4 5 6 7 1 2 3 4 5 6 781 82 83 C1 C2
X X X X X X X 00 00 10085 86 87 C5 C6
X X X X X X X 06 30 3289 8A 8B C9 CA
X X X X X 06 30 78D 8E 8F CD CE
X X X X X 09 00 191 92 93 D1 D2
X X X X X X X 21 00 3395 96 97 D5 D6
99 9A 9B D9 DA
9D 9E 9F DD DE
A1 A2 A3 E1 E2
A5 A6 A7 E5 E6
A9 AAE AB E9 EA
AD AE AF ED EE
B1 B2 B3 F1 F2
B5 B6 B7 F5 F6
B9 BA BB F9 FA
BD BE BF FD FE
LOCATION: CHECKED BY: SUPERSEDES:
KAL
SUPERSEDED BY:
DESIGNED BY: DRAWN BY: DATE: APPROVED BY:
JCB JCB 2/22/07
PED RECALL 29 28
FLASH 33
RED REST
FUNCTIONOUTPUT BOUTPUT COUTPUT D26
ON1-15
25
82
83
FUNCTIONCOORDINATION PLAN
84
ON72
73
74MAX RECALL
98
9C
AO
A4
27
TIME OF DAY / DAY OF WEEK FUNCTION CODES
OFF
24
OFF
28
29
30
31
32
84
88
8C
90
94 22
23
24
25
26
27
EC
FO
F4
F8
FC
17
18
19
20
21
D4
D8
DC
EO
E4
E8
AC
BO
B4
B8
BC
CO
C4
C8
CC
DO
A8
16
DAY
80
12
13
14
15
8
2
3
9
10
11
4
5
6
7
170 CONTROLLER - W4IKS PROGRAM
TIME BASED COORDINATION PARAMETERS
NORMAL OPERATION (PAGE 0)
1
DRG. NO.: B-07-539-T
TIME TRANSFER (PAGE 1) 101
TIME TRANSFER (PAGE 2) 102
B-05-812-T
100TIME TRANSFER (PAGE 0)32
MAX II 129 128WALK II 55 54
S. 76TH ST.
OUTPUT A 71 81
W. MAIN ST.&
I.S.D - D.P.W. - CITY OF MILWAUKEE - GJG PAGE 5 OF 7

FN
C3
C7
CB
CF
D3
D7
DB
DF
E3
E7
EB
EF
F3
F7
FB
FF
82
83
84
TIME OF DAY / DAY OF WEEK FUNCTION CODES
OFF
170 CONTROLLER - W4IKS PROGRAM
TIME BASED COORDINATION PARAMETERS
NORMAL OPERATION (PAGE 0)
B-07-539-T
B-05-812-T
128
I.S.D - D.P.W. - CITY OF MILWAUKEE - GJG PAGE 5 OF 7
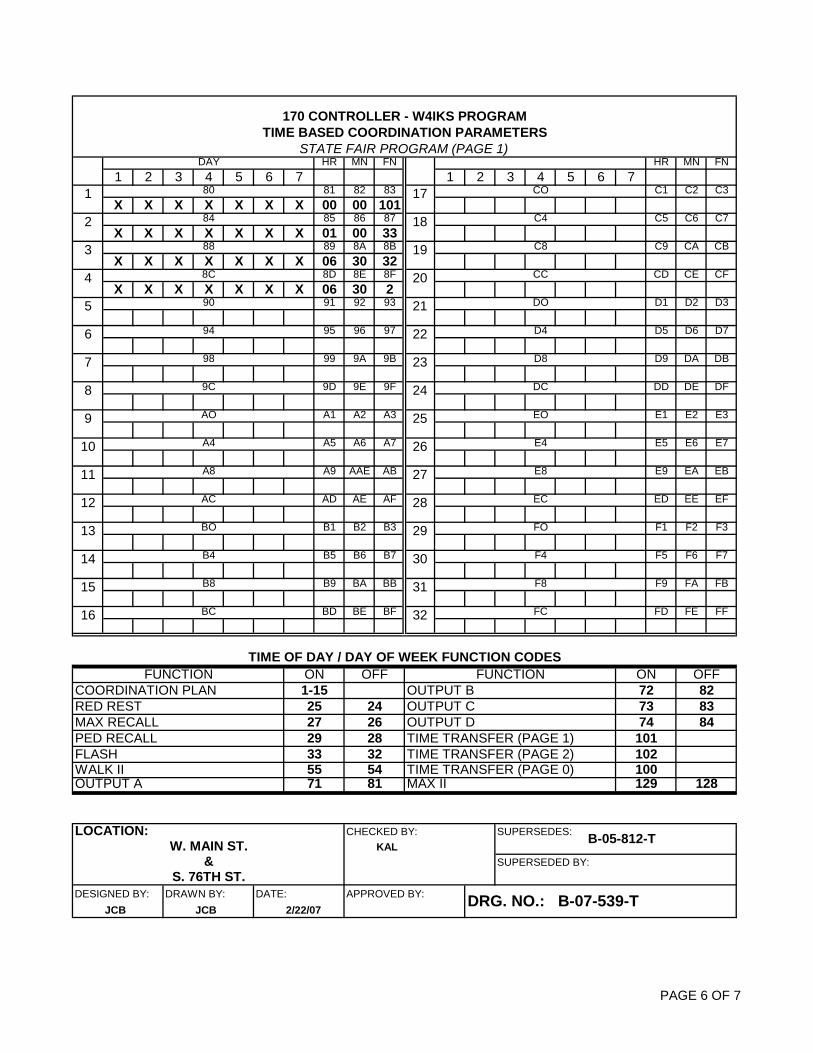
HR MN FN HR MN FN
1 2 3 4 5 6 7 1 2 3 4 5 6 781 82 83 C1 C2 C3
X X X X X X X 00 00 10185 86 87 C5 C6 C7
X X X X X X X 01 00 3389 8A 8B C9 CA CB
X X X X X X X 06 30 328D 8E 8F CD CE CF
X X X X X X X 06 30 291 92 93 D1 D2 D3
95 96 97 D5 D6 D7
99 9A 9B D9 DA DB
9D 9E 9F DD DE DF
A1 A2 A3 E1 E2 E3
A5 A6 A7 E5 E6 E7
A9 AAE AB E9 EA EB
AD AE AF ED EE EF
B1 B2 B3 F1 F2 F3
B5 B6 B7 F5 F6 F7
B9 BA BB F9 FA FB
BD BE BF FD FE FF
LOCATION: CHECKED BY: SUPERSEDES:
KAL
SUPERSEDED BY:
DESIGNED BY: DRAWN BY: DATE: APPROVED BY:
JCB JCB 2/22/07
&S. 76TH ST.
DRG. NO.: B-07-539-T
129 128
B-05-812-TW. MAIN ST.
OUTPUT A 71 81 MAX II
FLASH 33WALK II 55 54 TIME TRANSFER (PAGE 0)
32 TIME TRANSFER (PAGE 2)
74 84
101
100
MAX RECALL 27 26 OUTPUT D
102
PED RECALL 29 28 TIME TRANSFER (PAGE 1)
82COORDINATION PLAN 1-15
RED REST 25 24
OFF
16 BC 32 FC
73 83OUTPUT COUTPUT B 72
15 B8 31 F8
TIME OF DAY / DAY OF WEEK FUNCTION CODES
FUNCTION ON OFF FUNCTION ON
13 BO 29 FO
14 B4 30 F4
11 A8 27 E8
12 AC 28 EC
9 AO 25 EO
10 A4 26 E4
7 98 23 D8
8 9C 24 DC
5 90 21 DO
6 94 22 D4
3 88 19 C8
4 8C 20 CC
1 80 17 CO
2 84 18 C4
170 CONTROLLER - W4IKS PROGRAM
TIME BASED COORDINATION PARAMETERS
STATE FAIR PROGRAM (PAGE 1)DAY
PAGE 6 OF 7
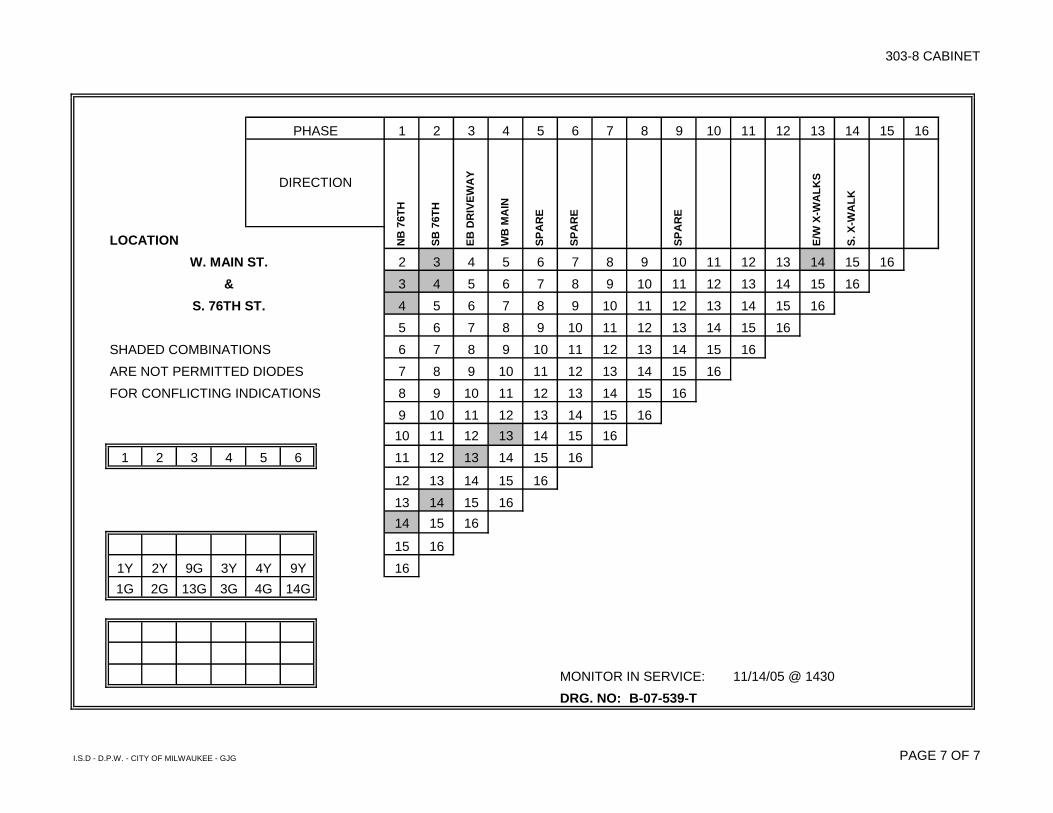
303-8 CABINET
1 2 3 4 5 6 7 8 9 10 11 12 13 14 15 16
LOCATION
2 3 4 5 6 7 8 9 10 11 12 13 14 15 16
3 4 5 6 7 8 9 10 11 12 13 14 15 16
4 5 6 7 8 9 10 11 12 13 14 15 16
5 6 7 8 9 10 11 12 13 14 15 16
SHADED COMBINATIONS 6 7 8 9 10 11 12 13 14 15 16
ARE NOT PERMITTED DIODES 7 8 9 10 11 12 13 14 15 16
FOR CONFLICTING INDICATIONS 8 9 10 11 12 13 14 15 16
9 10 11 12 13 14 15 16
10 11 12 13 14 15 16
1 2 3 4 5 6 11 12 13 14 15 16
12 13 14 15 16
13 14 15 16
14 15 16
15 16
1Y 2Y 9G 3Y 4Y 9Y 16
1G 2G 13G 3G 4G 14G
MONITOR IN SERVICE: 11/14/05 @ 1430
DRG. NO: B-07-539-T
NB
76T
H
E/W
X-W
AL
KS
S.
X-W
AL
K
SP
AR
E
EB
DR
IVE
WA
Y
WB
MA
IN
SP
AR
E
SP
AR
E
W. MAIN ST.
&
S. 76TH ST.
DIRECTION
PHASE
SB
76T
H
I.S.D - D.P.W. - CITY OF MILWAUKEE - GJG PAGE 7 OF 7

The Walmart Market - Milwaukee, Wisconsin March 31, 2011
Traffic Analysis & Design, Inc. C:\JOBS\1223 WalMart 70th-Main Milwaukee\Report - TIA\Appendix 110331.docx
APPENDIX B
YEAR 2011 BACKGROUND TRAFFIC
PEAK HOUR ANALYSIS OUTPUTS
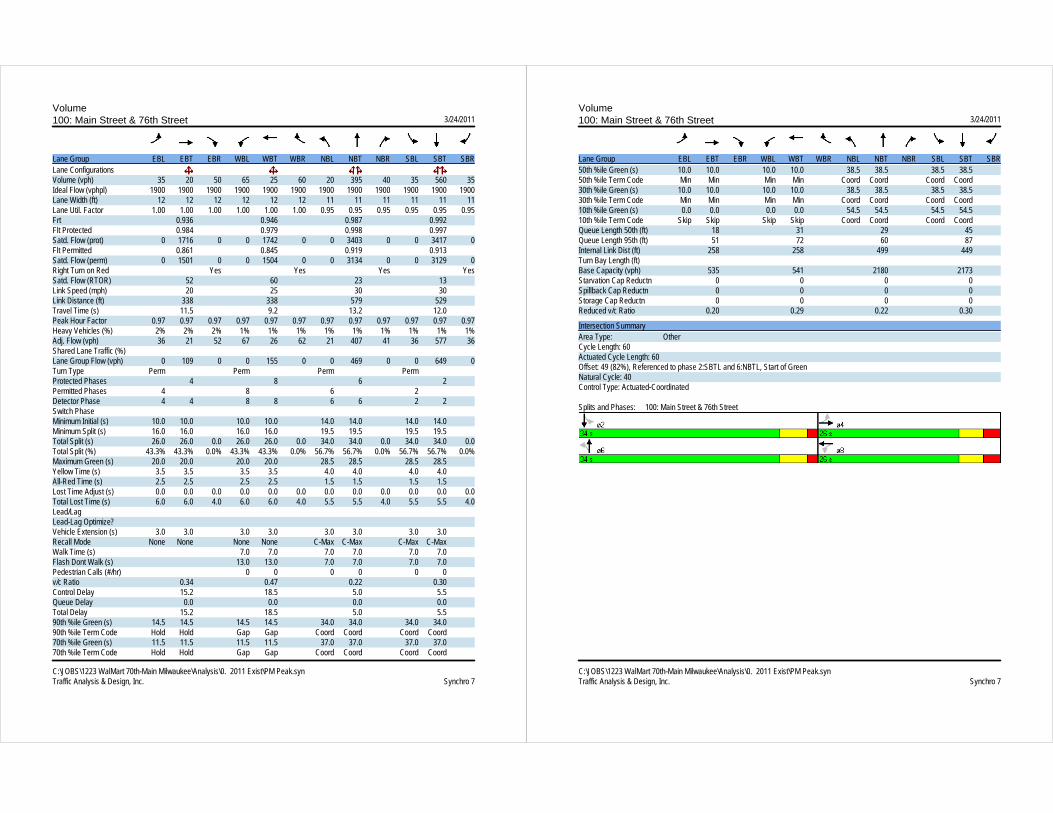
Volume100: Main Street & 76th Street 3/24/2011
C:\JOBS\1223 WalMart 70th-Main Milwaukee\Analysis\0. 2011 Exist\PM Peak.synTraffic Analysis & Design, Inc. Synchro 7
Lane Group EBL EBT EBR WBL WBT WBR NBL NBT NBR SBL SBT SBRLane ConfigurationsVolume (vph) 35 20 50 65 25 60 20 395 40 35 560 35Ideal Flow (vphpl) 1900 1900 1900 1900 1900 1900 1900 1900 1900 1900 1900 1900Lane Width (ft) 12 12 12 12 12 12 11 11 11 11 11 11Lane Util. Factor 1.00 1.00 1.00 1.00 1.00 1.00 0.95 0.95 0.95 0.95 0.95 0.95Frt 0.936 0.946 0.987 0.992Flt Protected 0.984 0.979 0.998 0.997Satd. Flow (prot) 0 1716 0 0 1742 0 0 3403 0 0 3417 0Flt Permitted 0.861 0.845 0.919 0.913Satd. Flow (perm) 0 1501 0 0 1504 0 0 3134 0 0 3129 0Right Turn on Red Yes Yes Yes YesSatd. Flow (RTOR) 52 60 23 13Link Speed (mph) 20 25 30 30Link Distance (ft) 338 338 579 529Travel Time (s) 11.5 9.2 13.2 12.0Peak Hour Factor 0.97 0.97 0.97 0.97 0.97 0.97 0.97 0.97 0.97 0.97 0.97 0.97Heavy Vehicles (%) 2% 2% 2% 1% 1% 1% 1% 1% 1% 1% 1% 1%Adj. Flow (vph) 36 21 52 67 26 62 21 407 41 36 577 36Shared Lane Traffic (%)Lane Group Flow (vph) 0 109 0 0 155 0 0 469 0 0 649 0Turn Type Perm Perm Perm PermProtected Phases 4 8 6 2Permitted Phases 4 8 6 2Detector Phase 4 4 8 8 6 6 2 2Switch PhaseMinimum Initial (s) 10.0 10.0 10.0 10.0 14.0 14.0 14.0 14.0Minimum Split (s) 16.0 16.0 16.0 16.0 19.5 19.5 19.5 19.5Total Split (s) 26.0 26.0 0.0 26.0 26.0 0.0 34.0 34.0 0.0 34.0 34.0 0.0Total Split (%) 43.3% 43.3% 0.0% 43.3% 43.3% 0.0% 56.7% 56.7% 0.0% 56.7% 56.7% 0.0%Maximum Green (s) 20.0 20.0 20.0 20.0 28.5 28.5 28.5 28.5Yellow Time (s) 3.5 3.5 3.5 3.5 4.0 4.0 4.0 4.0All-Red Time (s) 2.5 2.5 2.5 2.5 1.5 1.5 1.5 1.5Lost Time Adjust (s) 0.0 0.0 0.0 0.0 0.0 0.0 0.0 0.0 0.0 0.0 0.0 0.0Total Lost Time (s) 6.0 6.0 4.0 6.0 6.0 4.0 5.5 5.5 4.0 5.5 5.5 4.0Lead/LagLead-Lag Optimize?Vehicle Extension (s) 3.0 3.0 3.0 3.0 3.0 3.0 3.0 3.0Recall Mode None None None None C-Max C-Max C-Max C-MaxWalk Time (s) 7.0 7.0 7.0 7.0 7.0 7.0Flash Dont Walk (s) 13.0 13.0 7.0 7.0 7.0 7.0Pedestrian Calls (#/hr) 0 0 0 0 0 0v/c Ratio 0.34 0.47 0.22 0.30Control Delay 15.2 18.5 5.0 5.5Queue Delay 0.0 0.0 0.0 0.0Total Delay 15.2 18.5 5.0 5.590th %ile Green (s) 14.5 14.5 14.5 14.5 34.0 34.0 34.0 34.090th %ile Term Code Hold Hold Gap Gap Coord Coord Coord Coord70th %ile Green (s) 11.5 11.5 11.5 11.5 37.0 37.0 37.0 37.070th %ile Term Code Hold Hold Gap Gap Coord Coord Coord Coord
Volume100: Main Street & 76th Street 3/24/2011
C:\JOBS\1223 WalMart 70th-Main Milwaukee\Analysis\0. 2011 Exist\PM Peak.synTraffic Analysis & Design, Inc. Synchro 7
Lane Group EBL EBT EBR WBL WBT WBR NBL NBT NBR SBL SBT SBR50th %ile Green (s) 10.0 10.0 10.0 10.0 38.5 38.5 38.5 38.550th %ile Term Code Min Min Min Min Coord Coord Coord Coord30th %ile Green (s) 10.0 10.0 10.0 10.0 38.5 38.5 38.5 38.530th %ile Term Code Min Min Min Min Coord Coord Coord Coord10th %ile Green (s) 0.0 0.0 0.0 0.0 54.5 54.5 54.5 54.510th %ile Term Code Skip Skip Skip Skip Coord Coord Coord CoordQueue Length 50th (ft) 18 31 29 45Queue Length 95th (ft) 51 72 60 87Internal Link Dist (ft) 258 258 499 449Turn Bay Length (ft)Base Capacity (vph) 535 541 2180 2173Starvation Cap Reductn 0 0 0 0Spillback Cap Reductn 0 0 0 0Storage Cap Reductn 0 0 0 0Reduced v/c Ratio 0.20 0.29 0.22 0.30
Intersection SummaryArea Type: OtherCycle Length: 60Actuated Cycle Length: 60Offset: 49 (82%), Referenced to phase 2:SBTL and 6:NBTL, Start of GreenNatural Cycle: 40Control Type: Actuated-Coordinated
Splits and Phases: 100: Main Street & 76th Street

HCM Signalized Intersection Capacity Analysis100: Main Street & 76th Street 3/24/2011
C:\JOBS\1223 WalMart 70th-Main Milwaukee\Analysis\0. 2011 Exist\PM Peak.synTraffic Analysis & Design, Inc. Synchro 7
Movement EBL EBT EBR WBL WBT WBR NBL NBT NBR SBL SBT SBRLane ConfigurationsVolume (vph) 35 20 50 65 25 60 20 395 40 35 560 35Ideal Flow (vphpl) 1900 1900 1900 1900 1900 1900 1900 1900 1900 1900 1900 1900Lane Width 12 12 12 12 12 12 11 11 11 11 11 11Total Lost time (s) 6.0 6.0 5.5 5.5Lane Util. Factor 1.00 1.00 0.95 0.95Frt 0.94 0.95 0.99 0.99Flt Protected 0.98 0.98 1.00 1.00Satd. Flow (prot) 1714 1742 3402 3417Flt Permitted 0.86 0.85 0.92 0.91Satd. Flow (perm) 1500 1504 3134 3128Peak-hour factor, PHF 0.97 0.97 0.97 0.97 0.97 0.97 0.97 0.97 0.97 0.97 0.97 0.97Adj. Flow (vph) 36 21 52 67 26 62 21 407 41 36 577 36RTOR Reduction (vph) 0 44 0 0 51 0 0 8 0 0 4 0Lane Group Flow (vph) 0 65 0 0 104 0 0 461 0 0 645 0Heavy Vehicles (%) 2% 2% 2% 1% 1% 1% 1% 1% 1% 1% 1% 1%Turn Type Perm Perm Perm PermProtected Phases 4 8 6 2Permitted Phases 4 8 6 2Actuated Green, G (s) 9.2 9.2 39.3 39.3Effective Green, g (s) 9.2 9.2 39.3 39.3Actuated g/C Ratio 0.15 0.15 0.65 0.65Clearance Time (s) 6.0 6.0 5.5 5.5Vehicle Extension (s) 3.0 3.0 3.0 3.0Lane Grp Cap (vph) 230 231 2053 2049v/s Ratio Protv/s Ratio Perm 0.04 c0.07 0.15 c0.21v/c Ratio 0.28 0.45 0.22 0.31Uniform Delay, d1 22.5 23.1 4.2 4.5Progression Factor 1.00 1.00 1.00 1.00Incremental Delay, d2 0.7 1.4 0.3 0.4Delay (s) 23.2 24.5 4.4 4.9Level of Service C C A AApproach Delay (s) 23.2 24.5 4.4 4.9Approach LOS C C A A
Intersection SummaryHCM Average Control Delay 8.4 HCM Level of Service AHCM Volume to Capacity ratio 0.34Actuated Cycle Length (s) 60.0 Sum of lost time (s) 11.5Intersection Capacity Utilization 57.1% ICU Level of Service BAnalysis Period (min) 15c Critical Lane Group
Volume110: Main Street & 75th Street 3/24/2011
C:\JOBS\1223 WalMart 70th-Main Milwaukee\Analysis\0. 2011 Exist\PM Peak.synTraffic Analysis & Design, Inc. Synchro 7
Lane Group EBL EBT WBT WBR SBL SBRLane ConfigurationsVolume (vph) 10 85 145 5 1 5Ideal Flow (vphpl) 1900 1900 1900 1900 1900 1900Lane Util. Factor 1.00 1.00 1.00 1.00 1.00 1.00Frt 0.995 0.884Flt Protected 0.995 0.993Satd. Flow (prot) 0 1872 1872 0 1651 0Flt Permitted 0.995 0.993Satd. Flow (perm) 0 1872 1872 0 1651 0Link Speed (mph) 25 25 25Link Distance (ft) 338 319 300Travel Time (s) 9.2 8.7 8.2Peak Hour Factor 0.88 0.88 0.88 0.88 0.88 0.88Heavy Vehicles (%) 1% 1% 1% 1% 1% 1%Adj. Flow (vph) 11 97 165 6 1 6Shared Lane Traffic (%)Lane Group Flow (vph) 0 108 171 0 7 0Sign Control Free Free Stop
Intersection SummaryArea Type: OtherControl Type: Unsignalized

HCM Unsignalized Intersection Capacity Analysis110: Main Street & 75th Street 3/24/2011
C:\JOBS\1223 WalMart 70th-Main Milwaukee\Analysis\0. 2011 Exist\PM Peak.synTraffic Analysis & Design, Inc. Synchro 7
Movement EBL EBT WBT WBR SBL SBRLane ConfigurationsVolume (veh/h) 10 85 145 5 1 5Sign Control Free Free StopGrade 0% 0% 0%Peak Hour Factor 0.88 0.88 0.88 0.88 0.88 0.88Hourly flow rate (vph) 11 97 165 6 1 6PedestriansLane Width (ft)Walking Speed (ft/s)Percent BlockageRight turn flare (veh)Median type None NoneMedian storage veh)Upstream signal (ft) 338pX, platoon unblockedvC, conflicting volume 170 287 168vC1, stage 1 conf volvC2, stage 2 conf volvCu, unblocked vol 170 287 168tC, single (s) 4.1 6.4 6.2tC, 2 stage (s)tF (s) 2.2 3.5 3.3p0 queue free % 99 100 99cM capacity (veh/h) 1413 700 879
Direction, Lane # EB 1 WB 1 SB 1Volume Total 108 170 7Volume Left 11 0 1Volume Right 0 6 6cSH 1413 1700 843Volume to Capacity 0.01 0.10 0.01Queue Length 95th (ft) 1 0 1Control Delay (s) 0.9 0.0 9.3Lane LOS A AApproach Delay (s) 0.9 0.0 9.3Approach LOS A
Intersection SummaryAverage Delay 0.5Intersection Capacity Utilization 22.8% ICU Level of Service AAnalysis Period (min) 15
Volume120: Main Street & 74th Street 3/24/2011
C:\JOBS\1223 WalMart 70th-Main Milwaukee\Analysis\0. 2011 Exist\PM Peak.synTraffic Analysis & Design, Inc. Synchro 7
Lane Group EBL EBT EBR WBL WBT WBR NBL NBT NBR SBL SBT SBRLane ConfigurationsVolume (vph) 1 80 5 5 125 5 25 10 35 1 1 1Ideal Flow (vphpl) 1900 1900 1900 1900 1900 1900 1900 1900 1900 1900 1900 1900Lane Util. Factor 1.00 1.00 1.00 1.00 1.00 1.00 1.00 1.00 1.00 1.00 1.00 1.00Frt 0.993 0.995 0.932 0.955Flt Protected 0.999 0.998 0.983 0.984Satd. Flow (prot) 0 1795 0 0 1763 0 0 1723 0 0 1768 0Flt Permitted 0.999 0.998 0.983 0.984Satd. Flow (perm) 0 1795 0 0 1763 0 0 1723 0 0 1768 0Link Speed (mph) 25 25 25 25Link Distance (ft) 319 323 156 301Travel Time (s) 8.7 8.8 4.3 8.2Peak Hour Factor 0.91 0.91 0.91 0.91 0.91 0.91 0.91 0.91 0.91 0.91 0.91 0.91Heavy Vehicles (%) 5% 5% 5% 7% 7% 7% 1% 1% 1% 1% 1% 1%Adj. Flow (vph) 1 88 5 5 137 5 27 11 38 1 1 1Shared Lane Traffic (%)Lane Group Flow (vph) 0 94 0 0 147 0 0 76 0 0 3 0Sign Control Free Free Stop Stop
Intersection SummaryArea Type: OtherControl Type: Unsignalized

HCM Unsignalized Intersection Capacity Analysis120: Main Street & 74th Street 3/24/2011
C:\JOBS\1223 WalMart 70th-Main Milwaukee\Analysis\0. 2011 Exist\PM Peak.synTraffic Analysis & Design, Inc. Synchro 7
Movement EBL EBT EBR WBL WBT WBR NBL NBT NBR SBL SBT SBRLane ConfigurationsVolume (veh/h) 1 80 5 5 125 5 25 10 35 1 1 1Sign Control Free Free Stop StopGrade 0% 0% 0% 0%Peak Hour Factor 0.91 0.91 0.91 0.91 0.91 0.91 0.91 0.91 0.91 0.91 0.91 0.91Hourly flow rate (vph) 1 88 5 5 137 5 27 11 38 1 1 1PedestriansLane Width (ft)Walking Speed (ft/s)Percent BlockageRight turn flare (veh)Median type None NoneMedian storage veh)Upstream signal (ft) 657 1293pX, platoon unblockedvC, conflicting volume 143 93 246 247 91 288 247 140vC1, stage 1 conf volvC2, stage 2 conf volvCu, unblocked vol 143 93 246 247 91 288 247 140tC, single (s) 4.1 4.2 7.1 6.5 6.2 7.1 6.5 6.2tC, 2 stage (s)tF (s) 2.2 2.3 3.5 4.0 3.3 3.5 4.0 3.3p0 queue free % 100 100 96 98 96 100 100 100cM capacity (veh/h) 1422 1470 706 654 970 630 654 911
Direction, Lane # EB 1 WB 1 NB 1 SB 1Volume Total 95 148 77 3Volume Left 1 5 27 1Volume Right 5 5 38 1cSH 1422 1470 807 712Volume to Capacity 0.00 0.00 0.10 0.00Queue Length 95th (ft) 0 0 8 0Control Delay (s) 0.1 0.3 9.9 10.1Lane LOS A A A BApproach Delay (s) 0.1 0.3 9.9 10.1Approach LOS A B
Intersection SummaryAverage Delay 2.6Intersection Capacity Utilization 22.1% ICU Level of Service AAnalysis Period (min) 15
Volume130: Main Street & 73rd Street 3/24/2011
C:\JOBS\1223 WalMart 70th-Main Milwaukee\Analysis\0. 2011 Exist\PM Peak.synTraffic Analysis & Design, Inc. Synchro 7
Lane Group EBL EBT WBT WBR SBL SBRLane ConfigurationsVolume (vph) 5 110 130 5 5 5Ideal Flow (vphpl) 1900 1900 1900 1900 1900 1900Lane Util. Factor 1.00 1.00 1.00 1.00 1.00 1.00Frt 0.995 0.932Flt Protected 0.998 0.976Satd. Flow (prot) 0 1823 1800 0 1711 0Flt Permitted 0.998 0.976Satd. Flow (perm) 0 1823 1800 0 1711 0Link Speed (mph) 25 25 25Link Distance (ft) 323 318 300Travel Time (s) 8.8 8.7 8.2Peak Hour Factor 0.81 0.81 0.81 0.81 0.81 0.81Heavy Vehicles (%) 4% 4% 5% 5% 1% 1%Adj. Flow (vph) 6 136 160 6 6 6Shared Lane Traffic (%)Lane Group Flow (vph) 0 142 166 0 12 0Sign Control Free Free Stop
Intersection SummaryArea Type: OtherControl Type: Unsignalized

HCM Unsignalized Intersection Capacity Analysis130: Main Street & 73rd Street 3/24/2011
C:\JOBS\1223 WalMart 70th-Main Milwaukee\Analysis\0. 2011 Exist\PM Peak.synTraffic Analysis & Design, Inc. Synchro 7
Movement EBL EBT WBT WBR SBL SBRLane ConfigurationsVolume (veh/h) 5 110 130 5 5 5Sign Control Free Free StopGrade 0% 0% 0%Peak Hour Factor 0.81 0.81 0.81 0.81 0.81 0.81Hourly flow rate (vph) 6 136 160 6 6 6PedestriansLane Width (ft)Walking Speed (ft/s)Percent BlockageRight turn flare (veh)Median type None NoneMedian storage veh)Upstream signal (ft) 980 970pX, platoon unblockedvC, conflicting volume 167 312 164vC1, stage 1 conf volvC2, stage 2 conf volvCu, unblocked vol 167 312 164tC, single (s) 4.1 6.4 6.2tC, 2 stage (s)tF (s) 2.2 3.5 3.3p0 queue free % 100 99 99cM capacity (veh/h) 1399 680 884
Direction, Lane # EB 1 WB 1 SB 1Volume Total 142 167 12Volume Left 6 0 6Volume Right 0 6 6cSH 1399 1700 769Volume to Capacity 0.00 0.10 0.02Queue Length 95th (ft) 0 0 1Control Delay (s) 0.4 0.0 9.8Lane LOS A AApproach Delay (s) 0.4 0.0 9.8Approach LOS A
Intersection SummaryAverage Delay 0.5Intersection Capacity Utilization 19.9% ICU Level of Service AAnalysis Period (min) 15
Volume140: Main Street & 72nd Street 3/24/2011
C:\JOBS\1223 WalMart 70th-Main Milwaukee\Analysis\0. 2011 Exist\PM Peak.synTraffic Analysis & Design, Inc. Synchro 7
Lane Group EBL EBT EBR WBL WBT WBR NBL NBT NBR SBL SBT SBRLane ConfigurationsVolume (vph) 5 105 5 1 120 10 5 1 5 5 1 10Ideal Flow (vphpl) 1900 1900 1900 1900 1900 1900 1900 1900 1900 1900 1900 1900Lane Util. Factor 1.00 1.00 1.00 1.00 1.00 1.00 1.00 1.00 1.00 1.00 1.00 1.00Frt 0.994 0.989 0.938 0.912Flt Protected 0.998 0.977 0.985Satd. Flow (prot) 0 1866 0 0 1842 0 0 1724 0 0 1552 0Flt Permitted 0.998 0.977 0.985Satd. Flow (perm) 0 1866 0 0 1842 0 0 1724 0 0 1552 0Link Speed (mph) 25 25 25 25Link Distance (ft) 318 327 300 301Travel Time (s) 8.7 8.9 8.2 8.2Peak Hour Factor 0.79 0.79 0.79 0.79 0.79 0.79 0.79 0.79 0.79 0.79 0.79 0.79Heavy Vehicles (%) 1% 1% 1% 2% 2% 2% 1% 1% 1% 10% 10% 10%Adj. Flow (vph) 6 133 6 1 152 13 6 1 6 6 1 13Shared Lane Traffic (%)Lane Group Flow (vph) 0 145 0 0 166 0 0 13 0 0 20 0Sign Control Free Free Stop Stop
Intersection SummaryArea Type: OtherControl Type: Unsignalized

HCM Unsignalized Intersection Capacity Analysis140: Main Street & 72nd Street 3/24/2011
C:\JOBS\1223 WalMart 70th-Main Milwaukee\Analysis\0. 2011 Exist\PM Peak.synTraffic Analysis & Design, Inc. Synchro 7
Movement EBL EBT EBR WBL WBT WBR NBL NBT NBR SBL SBT SBRLane ConfigurationsVolume (veh/h) 5 105 5 1 120 10 5 1 5 5 1 10Sign Control Free Free Stop StopGrade 0% 0% 0% 0%Peak Hour Factor 0.79 0.79 0.79 0.79 0.79 0.79 0.79 0.79 0.79 0.79 0.79 0.79Hourly flow rate (vph) 6 133 6 1 152 13 6 1 6 6 1 13PedestriansLane Width (ft)Walking Speed (ft/s)Percent BlockageRight turn flare (veh)Median type None NoneMedian storage veh)Upstream signal (ft) 1298 652pX, platoon unblockedvC, conflicting volume 165 139 323 316 136 316 313 158vC1, stage 1 conf volvC2, stage 2 conf volvCu, unblocked vol 165 139 323 316 136 316 313 158tC, single (s) 4.1 4.1 7.1 6.5 6.2 7.2 6.6 6.3tC, 2 stage (s)tF (s) 2.2 2.2 3.5 4.0 3.3 3.6 4.1 3.4p0 queue free % 100 100 99 100 99 99 100 99cM capacity (veh/h) 1420 1444 619 598 915 613 586 867
Direction, Lane # EB 1 WB 1 NB 1 SB 1Volume Total 146 166 14 20Volume Left 6 1 6 6Volume Right 6 13 6 13cSH 1420 1444 723 748Volume to Capacity 0.00 0.00 0.02 0.03Queue Length 95th (ft) 0 0 1 2Control Delay (s) 0.4 0.1 10.1 9.9Lane LOS A A B AApproach Delay (s) 0.4 0.1 10.1 9.9Approach LOS B A
Intersection SummaryAverage Delay 1.2Intersection Capacity Utilization 19.2% ICU Level of Service AAnalysis Period (min) 15
Volume150: Main Street & 71st Street 3/24/2011
C:\JOBS\1223 WalMart 70th-Main Milwaukee\Analysis\0. 2011 Exist\PM Peak.synTraffic Analysis & Design, Inc. Synchro 7
Lane Group EBL EBT WBT WBR SBL SBRLane ConfigurationsVolume (vph) 0 115 125 0 15 5Ideal Flow (vphpl) 1900 1900 1900 1900 1900 1900Lane Util. Factor 1.00 1.00 1.00 1.00 1.00 1.00Frt 0.968Flt Protected 0.963Satd. Flow (prot) 0 1881 1827 0 1754 0Flt Permitted 0.963Satd. Flow (perm) 0 1881 1827 0 1754 0Link Speed (mph) 25 25 25Link Distance (ft) 327 155 300Travel Time (s) 8.9 4.2 8.2Peak Hour Factor 0.77 0.77 0.77 0.77 0.77 0.77Heavy Vehicles (%) 1% 1% 4% 4% 1% 1%Adj. Flow (vph) 0 149 162 0 19 6Shared Lane Traffic (%)Lane Group Flow (vph) 0 149 162 0 25 0Sign Control Free Free Stop
Intersection SummaryArea Type: OtherControl Type: Unsignalized
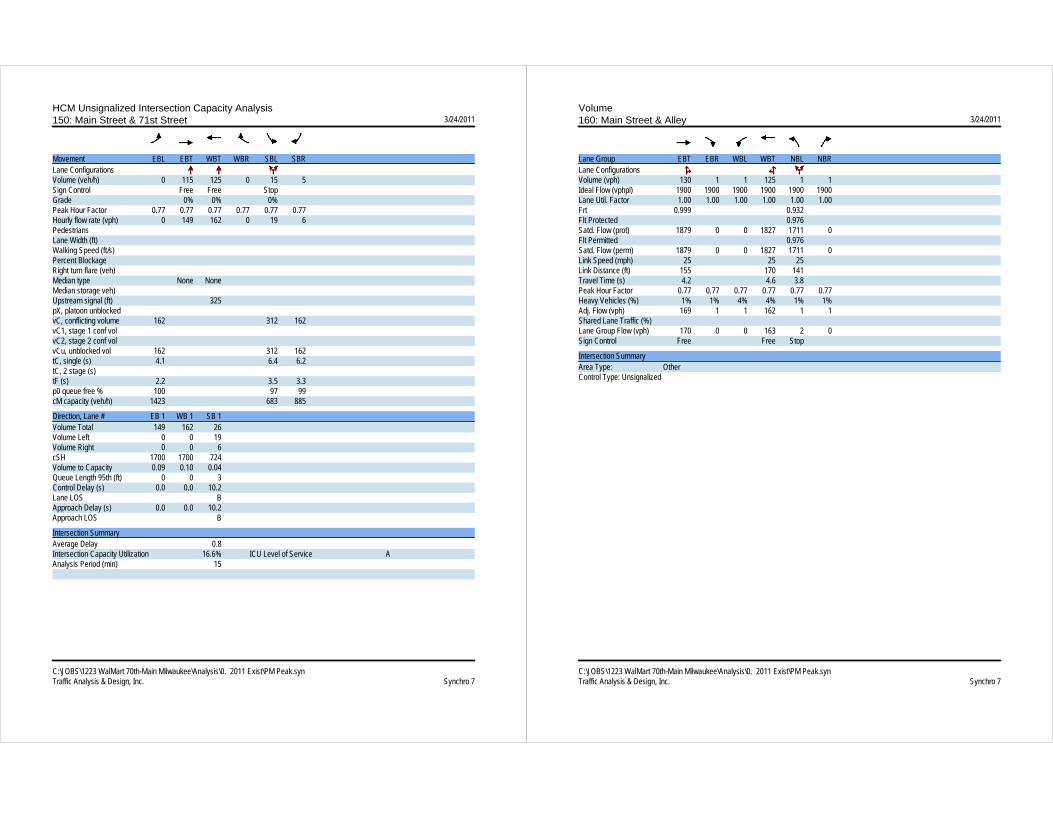
HCM Unsignalized Intersection Capacity Analysis150: Main Street & 71st Street 3/24/2011
C:\JOBS\1223 WalMart 70th-Main Milwaukee\Analysis\0. 2011 Exist\PM Peak.synTraffic Analysis & Design, Inc. Synchro 7
Movement EBL EBT WBT WBR SBL SBRLane ConfigurationsVolume (veh/h) 0 115 125 0 15 5Sign Control Free Free StopGrade 0% 0% 0%Peak Hour Factor 0.77 0.77 0.77 0.77 0.77 0.77Hourly flow rate (vph) 0 149 162 0 19 6PedestriansLane Width (ft)Walking Speed (ft/s)Percent BlockageRight turn flare (veh)Median type None NoneMedian storage veh)Upstream signal (ft) 325pX, platoon unblockedvC, conflicting volume 162 312 162vC1, stage 1 conf volvC2, stage 2 conf volvCu, unblocked vol 162 312 162tC, single (s) 4.1 6.4 6.2tC, 2 stage (s)tF (s) 2.2 3.5 3.3p0 queue free % 100 97 99cM capacity (veh/h) 1423 683 885
Direction, Lane # EB 1 WB 1 SB 1Volume Total 149 162 26Volume Left 0 0 19Volume Right 0 0 6cSH 1700 1700 724Volume to Capacity 0.09 0.10 0.04Queue Length 95th (ft) 0 0 3Control Delay (s) 0.0 0.0 10.2Lane LOS BApproach Delay (s) 0.0 0.0 10.2Approach LOS B
Intersection SummaryAverage Delay 0.8Intersection Capacity Utilization 16.6% ICU Level of Service AAnalysis Period (min) 15
Volume160: Main Street & Alley 3/24/2011
C:\JOBS\1223 WalMart 70th-Main Milwaukee\Analysis\0. 2011 Exist\PM Peak.synTraffic Analysis & Design, Inc. Synchro 7
Lane Group EBT EBR WBL WBT NBL NBRLane ConfigurationsVolume (vph) 130 1 1 125 1 1Ideal Flow (vphpl) 1900 1900 1900 1900 1900 1900Lane Util. Factor 1.00 1.00 1.00 1.00 1.00 1.00Frt 0.999 0.932Flt Protected 0.976Satd. Flow (prot) 1879 0 0 1827 1711 0Flt Permitted 0.976Satd. Flow (perm) 1879 0 0 1827 1711 0Link Speed (mph) 25 25 25Link Distance (ft) 155 170 141Travel Time (s) 4.2 4.6 3.8Peak Hour Factor 0.77 0.77 0.77 0.77 0.77 0.77Heavy Vehicles (%) 1% 1% 4% 4% 1% 1%Adj. Flow (vph) 169 1 1 162 1 1Shared Lane Traffic (%)Lane Group Flow (vph) 170 0 0 163 2 0Sign Control Free Free Stop
Intersection SummaryArea Type: OtherControl Type: Unsignalized

HCM Unsignalized Intersection Capacity Analysis160: Main Street & Alley 3/24/2011
C:\JOBS\1223 WalMart 70th-Main Milwaukee\Analysis\0. 2011 Exist\PM Peak.synTraffic Analysis & Design, Inc. Synchro 7
Movement EBT EBR WBL WBT NBL NBRLane ConfigurationsVolume (veh/h) 130 1 1 125 1 1Sign Control Free Free StopGrade 0% 0% 0%Peak Hour Factor 0.77 0.77 0.77 0.77 0.77 0.77Hourly flow rate (vph) 169 1 1 162 1 1PedestriansLane Width (ft)Walking Speed (ft/s)Percent BlockageRight turn flare (veh)Median type None NoneMedian storage veh)Upstream signal (ft) 170pX, platoon unblockedvC, conflicting volume 170 334 169vC1, stage 1 conf volvC2, stage 2 conf volvCu, unblocked vol 170 334 169tC, single (s) 4.1 6.4 6.2tC, 2 stage (s)tF (s) 2.2 3.5 3.3p0 queue free % 100 100 100cM capacity (veh/h) 1395 662 877
Direction, Lane # EB 1 WB 1 NB 1Volume Total 170 164 3Volume Left 0 1 1Volume Right 1 0 1cSH 1700 1395 755Volume to Capacity 0.10 0.00 0.00Queue Length 95th (ft) 0 0 0Control Delay (s) 0.0 0.1 9.8Lane LOS A AApproach Delay (s) 0.0 0.1 9.8Approach LOS A
Intersection SummaryAverage Delay 0.1Intersection Capacity Utilization 17.4% ICU Level of Service AAnalysis Period (min) 15
Volume200: Main Street & 70th Street 3/24/2011
C:\JOBS\1223 WalMart 70th-Main Milwaukee\Analysis\0. 2011 Exist\PM Peak.synTraffic Analysis & Design, Inc. Synchro 7
Lane Group EBL EBT EBR WBL WBT WBR NBL NBT NBR SBL SBT SBRLane ConfigurationsVolume (vph) 60 70 45 120 65 10 60 990 100 10 465 25Ideal Flow (vphpl) 1900 1900 1900 1900 1900 1900 1900 1900 1900 1900 1900 1900Lane Width (ft) 12 12 12 12 12 12 10 11 11 10 11 11Storage Length (ft) 0 0 0 0 95 0 100 0Storage Lanes 0 0 0 0 1 0 1 0Taper Length (ft) 50 50 50 50 50 50 50 50Lane Util. Factor 1.00 1.00 1.00 1.00 1.00 1.00 1.00 0.95 0.95 1.00 0.95 0.95Frt 0.965 0.993 0.986 0.992Flt Protected 0.983 0.970 0.950 0.950Satd. Flow (prot) 0 1784 0 0 1812 0 1668 3407 0 1668 3427 0Flt Permitted 0.845 0.733 0.459 0.171Satd. Flow (perm) 0 1534 0 0 1369 0 806 3407 0 300 3427 0Right Turn on Red Yes Yes Yes YesSatd. Flow (RTOR) 30 5 26 14Link Speed (mph) 25 25 30 30Link Distance (ft) 170 300 253 883Travel Time (s) 4.6 8.2 5.8 20.1Peak Hour Factor 0.94 0.94 0.94 0.94 0.94 0.94 0.94 0.94 0.94 0.94 0.94 0.94Heavy Vehicles (%) 1% 1% 1% 1% 1% 1% 1% 1% 1% 1% 1% 1%Adj. Flow (vph) 64 74 48 128 69 11 64 1053 106 11 495 27Shared Lane Traffic (%)Lane Group Flow (vph) 0 186 0 0 208 0 64 1159 0 11 522 0Turn Type Perm Perm Perm PermProtected Phases 4 8 6 2Permitted Phases 4 8 6 2Detector Phase 4 4 8 8 6 6 2 2Switch PhaseMinimum Initial (s) 18.0 18.0 18.0 18.0 31.0 31.0 31.0 31.0Minimum Split (s) 23.5 23.5 23.5 23.5 36.5 36.5 36.5 36.5Total Split (s) 23.5 23.5 0.0 23.5 23.5 0.0 36.5 36.5 0.0 36.5 36.5 0.0Total Split (%) 39.2% 39.2% 0.0% 39.2% 39.2% 0.0% 60.8% 60.8% 0.0% 60.8% 60.8% 0.0%Maximum Green (s) 18.0 18.0 18.0 18.0 31.0 31.0 31.0 31.0Yellow Time (s) 4.0 4.0 4.0 4.0 4.0 4.0 4.0 4.0All-Red Time (s) 1.5 1.5 1.5 1.5 1.5 1.5 1.5 1.5Lost Time Adjust (s) 0.0 0.0 0.0 0.0 0.0 0.0 0.0 0.0 0.0 0.0 0.0 0.0Total Lost Time (s) 5.5 5.5 4.0 5.5 5.5 4.0 5.5 5.5 4.0 5.5 5.5 4.0Lead/LagLead-Lag Optimize?Vehicle Extension (s) 3.0 3.0 3.0 3.0 3.0 3.0 3.0 3.0Recall Mode Max Max Max Max C-Max C-Max C-Max C-MaxWalk Time (s) 7.0 7.0 7.0 7.0 21.0 21.0 21.0 21.0Flash Dont Walk (s) 11.0 11.0 11.0 11.0 10.0 10.0 10.0 10.0Pedestrian Calls (#/hr) 0 0 0 0 0 0 0 0v/c Ratio 0.39 0.50 0.15 0.65 0.07 0.29Control Delay 16.6 22.0 8.8 12.5 8.8 8.6Queue Delay 0.0 0.0 0.0 0.0 0.0 0.0Total Delay 16.6 22.0 8.8 12.5 8.8 8.690th %ile Green (s) 18.0 18.0 18.0 18.0 31.0 31.0 31.0 31.0

Volume200: Main Street & 70th Street 3/24/2011
C:\JOBS\1223 WalMart 70th-Main Milwaukee\Analysis\0. 2011 Exist\PM Peak.synTraffic Analysis & Design, Inc. Synchro 7
Lane Group EBL EBT EBR WBL WBT WBR NBL NBT NBR SBL SBT SBR90th %ile Term Code MaxR MaxR MaxR MaxR Coord Coord Coord Coord70th %ile Green (s) 18.0 18.0 18.0 18.0 31.0 31.0 31.0 31.070th %ile Term Code MaxR MaxR MaxR MaxR Coord Coord Coord Coord50th %ile Green (s) 18.0 18.0 18.0 18.0 31.0 31.0 31.0 31.050th %ile Term Code MaxR MaxR MaxR MaxR Coord Coord Coord Coord30th %ile Green (s) 18.0 18.0 18.0 18.0 31.0 31.0 31.0 31.030th %ile Term Code MaxR MaxR MaxR MaxR Coord Coord Coord Coord10th %ile Green (s) 18.0 18.0 18.0 18.0 31.0 31.0 31.0 31.010th %ile Term Code MaxR MaxR MaxR MaxR Coord Coord Coord CoordQueue Length 50th (ft) 43 60 11 143 2 50Queue Length 95th (ft) 89 117 29 203 9 76Internal Link Dist (ft) 90 220 173 803Turn Bay Length (ft) 95 100Base Capacity (vph) 481 414 416 1773 155 1777Starvation Cap Reductn 0 0 0 0 0 0Spillback Cap Reductn 0 0 0 0 0 0Storage Cap Reductn 0 0 0 0 0 0Reduced v/c Ratio 0.39 0.50 0.15 0.65 0.07 0.29
Intersection SummaryArea Type: OtherCycle Length: 60Actuated Cycle Length: 60Offset: 39 (65%), Referenced to phase 2:SBTL and 6:NBTL, Start of GreenNatural Cycle: 60Control Type: Actuated-Coordinated
Splits and Phases: 200: Main Street & 70th Street
HCM Signalized Intersection Capacity Analysis200: Main Street & 70th Street 3/24/2011
C:\JOBS\1223 WalMart 70th-Main Milwaukee\Analysis\0. 2011 Exist\PM Peak.synTraffic Analysis & Design, Inc. Synchro 7
Movement EBL EBT EBR WBL WBT WBR NBL NBT NBR SBL SBT SBRLane ConfigurationsVolume (vph) 60 70 45 120 65 10 60 990 100 10 465 25Ideal Flow (vphpl) 1900 1900 1900 1900 1900 1900 1900 1900 1900 1900 1900 1900Lane Width 12 12 12 12 12 12 10 11 11 10 11 11Total Lost time (s) 5.5 5.5 5.5 5.5 5.5 5.5Lane Util. Factor 1.00 1.00 1.00 0.95 1.00 0.95Frt 0.97 0.99 1.00 0.99 1.00 0.99Flt Protected 0.98 0.97 0.95 1.00 0.95 1.00Satd. Flow (prot) 1785 1812 1668 3408 1668 3428Flt Permitted 0.84 0.73 0.46 1.00 0.17 1.00Satd. Flow (perm) 1534 1369 805 3408 300 3428Peak-hour factor, PHF 0.94 0.94 0.94 0.94 0.94 0.94 0.94 0.94 0.94 0.94 0.94 0.94Adj. Flow (vph) 64 74 48 128 69 11 64 1053 106 11 495 27RTOR Reduction (vph) 0 21 0 0 4 0 0 13 0 0 7 0Lane Group Flow (vph) 0 165 0 0 205 0 64 1146 0 11 515 0Heavy Vehicles (%) 1% 1% 1% 1% 1% 1% 1% 1% 1% 1% 1% 1%Turn Type Perm Perm Perm PermProtected Phases 4 8 6 2Permitted Phases 4 8 6 2Actuated Green, G (s) 18.0 18.0 31.0 31.0 31.0 31.0Effective Green, g (s) 18.0 18.0 31.0 31.0 31.0 31.0Actuated g/C Ratio 0.30 0.30 0.52 0.52 0.52 0.52Clearance Time (s) 5.5 5.5 5.5 5.5 5.5 5.5Vehicle Extension (s) 3.0 3.0 3.0 3.0 3.0 3.0Lane Grp Cap (vph) 460 411 416 1761 155 1771v/s Ratio Prot c0.34 0.15v/s Ratio Perm 0.11 c0.15 0.08 0.04v/c Ratio 0.36 0.50 0.15 0.65 0.07 0.29Uniform Delay, d1 16.5 17.3 7.6 10.6 7.3 8.2Progression Factor 1.00 1.00 1.00 1.00 1.00 1.00Incremental Delay, d2 2.2 4.3 0.8 1.9 0.9 0.4Delay (s) 18.6 21.5 8.4 12.4 8.2 8.7Level of Service B C A B A AApproach Delay (s) 18.6 21.5 12.2 8.7Approach LOS B C B A
Intersection SummaryHCM Average Control Delay 12.8 HCM Level of Service BHCM Volume to Capacity ratio 0.59Actuated Cycle Length (s) 60.0 Sum of lost time (s) 11.0Intersection Capacity Utilization 76.4% ICU Level of Service DAnalysis Period (min) 15c Critical Lane Group

Volume220: Proposed South Access & 70th Street 3/24/2011
C:\JOBS\1223 WalMart 70th-Main Milwaukee\Analysis\0. 2011 Exist\PM Peak.synTraffic Analysis & Design, Inc. Synchro 7
Lane Group EBL EBT EBR WBL WBT WBR NBL NBT NBR SBL SBT SBRLane ConfigurationsVolume (vph) 1 1 1 5 1 5 1 1180 60 5 620 1Ideal Flow (vphpl) 1900 1900 1900 1900 1900 1900 1900 1900 1900 1900 1900 1900Lane Width (ft) 12 12 12 12 12 12 11 11 11 11 11 11Lane Util. Factor 1.00 1.00 1.00 1.00 1.00 1.00 0.95 0.95 0.95 0.95 0.95 0.95Frt 0.955 0.939 0.993Flt Protected 0.984 0.978Satd. Flow (prot) 0 1768 0 0 1728 0 0 3431 0 0 3455 0Flt Permitted 0.984 0.978Satd. Flow (perm) 0 1768 0 0 1728 0 0 3431 0 0 3455 0Link Speed (mph) 25 25 30 30Link Distance (ft) 165 300 512 240Travel Time (s) 4.5 8.2 11.6 5.5Peak Hour Factor 0.92 0.92 0.92 0.92 0.92 0.92 0.92 0.92 0.92 0.92 0.92 0.92Heavy Vehicles (%) 1% 1% 1% 1% 1% 1% 1% 1% 1% 1% 1% 1%Adj. Flow (vph) 1 1 1 5 1 5 1 1283 65 5 674 1Shared Lane Traffic (%)Lane Group Flow (vph) 0 3 0 0 11 0 0 1349 0 0 680 0Sign Control Stop Stop Free Free
Intersection SummaryArea Type: OtherControl Type: Unsignalized
HCM Unsignalized Intersection Capacity Analysis220: Proposed South Access & 70th Street 3/24/2011
C:\JOBS\1223 WalMart 70th-Main Milwaukee\Analysis\0. 2011 Exist\PM Peak.synTraffic Analysis & Design, Inc. Synchro 7
Movement EBL EBT EBR WBL WBT WBR NBL NBT NBR SBL SBT SBRLane ConfigurationsVolume (veh/h) 1 1 1 5 1 5 1 1180 60 5 620 1Sign Control Stop Stop Free FreeGrade 0% 0% 0% 0%Peak Hour Factor 0.92 0.92 0.92 0.92 0.92 0.92 0.92 0.92 0.92 0.92 0.92 0.92Hourly flow rate (vph) 1 1 1 5 1 5 1 1283 65 5 674 1PedestriansLane Width (ft)Walking Speed (ft/s)Percent BlockageRight turn flare (veh)Median type None NoneMedian storage veh)Upstream signal (ft) 493pX, platoon unblocked 0.97 0.97 0.97 0.97 0.97 0.97vC, conflicting volume 1335 2035 338 1667 2003 674 675 1348vC1, stage 1 conf volvC2, stage 2 conf volvCu, unblocked vol 1285 2006 257 1627 1973 674 605 1348tC, single (s) 7.5 6.5 6.9 7.5 6.5 6.9 4.1 4.1tC, 2 stage (s)tF (s) 3.5 4.0 3.3 3.5 4.0 3.3 2.2 2.2p0 queue free % 99 98 100 92 98 99 100 99cM capacity (veh/h) 115 57 723 65 60 399 947 512
Direction, Lane # EB 1 WB 1 NB 1 NB 2 SB 1 SB 2Volume Total 3 12 642 707 342 338Volume Left 1 5 1 0 5 0Volume Right 1 5 0 65 0 1cSH 109 103 947 1700 512 1700Volume to Capacity 0.03 0.12 0.00 0.42 0.01 0.20Queue Length 95th (ft) 2 9 0 0 1 0Control Delay (s) 39.2 44.4 0.0 0.0 0.3 0.0Lane LOS E E A AApproach Delay (s) 39.2 44.4 0.0 0.2Approach LOS E E
Intersection SummaryAverage Delay 0.4Intersection Capacity Utilization 45.2% ICU Level of Service AAnalysis Period (min) 15

Volume100: Main Street & 76th Street 3/24/2011
C:\JOBS\1223 WalMart 70th-Main Milwaukee\Analysis\0. 2011 Exist\SAT Peak.synTraffic Analysis & Design, Inc. Synchro 7
Lane Group EBL EBT EBR WBL WBT WBR NBL NBT NBR SBL SBT SBRLane ConfigurationsVolume (vph) 20 20 40 40 20 25 15 255 25 10 235 25Ideal Flow (vphpl) 1900 1900 1900 1900 1900 1900 1900 1900 1900 1900 1900 1900Lane Width (ft) 12 12 12 12 12 12 11 11 11 11 11 11Lane Util. Factor 1.00 1.00 1.00 1.00 1.00 1.00 0.95 0.95 0.95 0.95 0.95 0.95Frt 0.932 0.960 0.987 0.986Flt Protected 0.988 0.977 0.997 0.998Satd. Flow (prot) 0 1732 0 0 1747 0 0 3400 0 0 3400 0Flt Permitted 0.887 0.807 0.936 0.942Satd. Flow (perm) 0 1555 0 0 1443 0 0 3192 0 0 3209 0Right Turn on Red Yes Yes Yes YesSatd. Flow (RTOR) 43 27 22 25Link Speed (mph) 20 25 30 30Link Distance (ft) 338 338 579 529Travel Time (s) 11.5 9.2 13.2 12.0Peak Hour Factor 0.94 0.94 0.94 0.94 0.94 0.94 0.94 0.94 0.94 0.94 0.94 0.94Heavy Vehicles (%) 1% 1% 1% 2% 2% 2% 1% 1% 1% 1% 1% 1%Adj. Flow (vph) 21 21 43 43 21 27 16 271 27 11 250 27Shared Lane Traffic (%)Lane Group Flow (vph) 0 85 0 0 91 0 0 314 0 0 288 0Turn Type Perm Perm Perm PermProtected Phases 4 8 6 2Permitted Phases 4 8 6 2Detector Phase 4 4 8 8 6 6 2 2Switch PhaseMinimum Initial (s) 10.0 10.0 10.0 10.0 14.0 14.0 14.0 14.0Minimum Split (s) 16.0 16.0 16.0 16.0 19.5 19.5 19.5 19.5Total Split (s) 26.0 26.0 0.0 26.0 26.0 0.0 34.0 34.0 0.0 34.0 34.0 0.0Total Split (%) 43.3% 43.3% 0.0% 43.3% 43.3% 0.0% 56.7% 56.7% 0.0% 56.7% 56.7% 0.0%Maximum Green (s) 20.0 20.0 20.0 20.0 28.5 28.5 28.5 28.5Yellow Time (s) 3.5 3.5 3.5 3.5 4.0 4.0 4.0 4.0All-Red Time (s) 2.5 2.5 2.5 2.5 1.5 1.5 1.5 1.5Lost Time Adjust (s) 0.0 0.0 0.0 0.0 0.0 0.0 0.0 0.0 0.0 0.0 0.0 0.0Total Lost Time (s) 6.0 6.0 4.0 6.0 6.0 4.0 5.5 5.5 4.0 5.5 5.5 4.0Lead/LagLead-Lag Optimize?Vehicle Extension (s) 3.0 3.0 3.0 3.0 3.0 3.0 3.0 3.0Recall Mode None None None None C-Max C-Max C-Max C-MaxWalk Time (s) 7.0 7.0 7.0 7.0 7.0 7.0Flash Dont Walk (s) 13.0 13.0 7.0 7.0 7.0 7.0Pedestrian Calls (#/hr) 0 0 0 0 0 0v/c Ratio 0.28 0.34 0.14 0.13Control Delay 15.2 20.1 4.1 4.0Queue Delay 0.0 0.0 0.0 0.0Total Delay 15.2 20.1 4.1 4.090th %ile Green (s) 11.7 11.7 11.7 11.7 36.8 36.8 36.8 36.890th %ile Term Code Hold Hold Gap Gap Coord Coord Coord Coord70th %ile Green (s) 10.0 10.0 10.0 10.0 38.5 38.5 38.5 38.570th %ile Term Code Min Min Min Min Coord Coord Coord Coord
Volume100: Main Street & 76th Street 3/24/2011
C:\JOBS\1223 WalMart 70th-Main Milwaukee\Analysis\0. 2011 Exist\SAT Peak.synTraffic Analysis & Design, Inc. Synchro 7
Lane Group EBL EBT EBR WBL WBT WBR NBL NBT NBR SBL SBT SBR50th %ile Green (s) 10.0 10.0 10.0 10.0 38.5 38.5 38.5 38.550th %ile Term Code Min Min Min Min Coord Coord Coord Coord30th %ile Green (s) 10.0 10.0 10.0 10.0 38.5 38.5 38.5 38.530th %ile Term Code Min Min Min Min Coord Coord Coord Coord10th %ile Green (s) 0.0 0.0 0.0 0.0 54.5 54.5 54.5 54.510th %ile Term Code Skip Skip Skip Skip Coord Coord Coord CoordQueue Length 50th (ft) 13 20 18 16Queue Length 95th (ft) 45 55 34 31Internal Link Dist (ft) 258 258 499 449Turn Bay Length (ft)Base Capacity (vph) 547 499 2265 2278Starvation Cap Reductn 0 0 0 0Spillback Cap Reductn 0 0 0 0Storage Cap Reductn 0 0 0 0Reduced v/c Ratio 0.16 0.18 0.14 0.13
Intersection SummaryArea Type: OtherCycle Length: 60Actuated Cycle Length: 60Offset: 49 (82%), Referenced to phase 2:SBTL and 6:NBTL, Start of GreenNatural Cycle: 40Control Type: Actuated-Coordinated
Splits and Phases: 100: Main Street & 76th Street
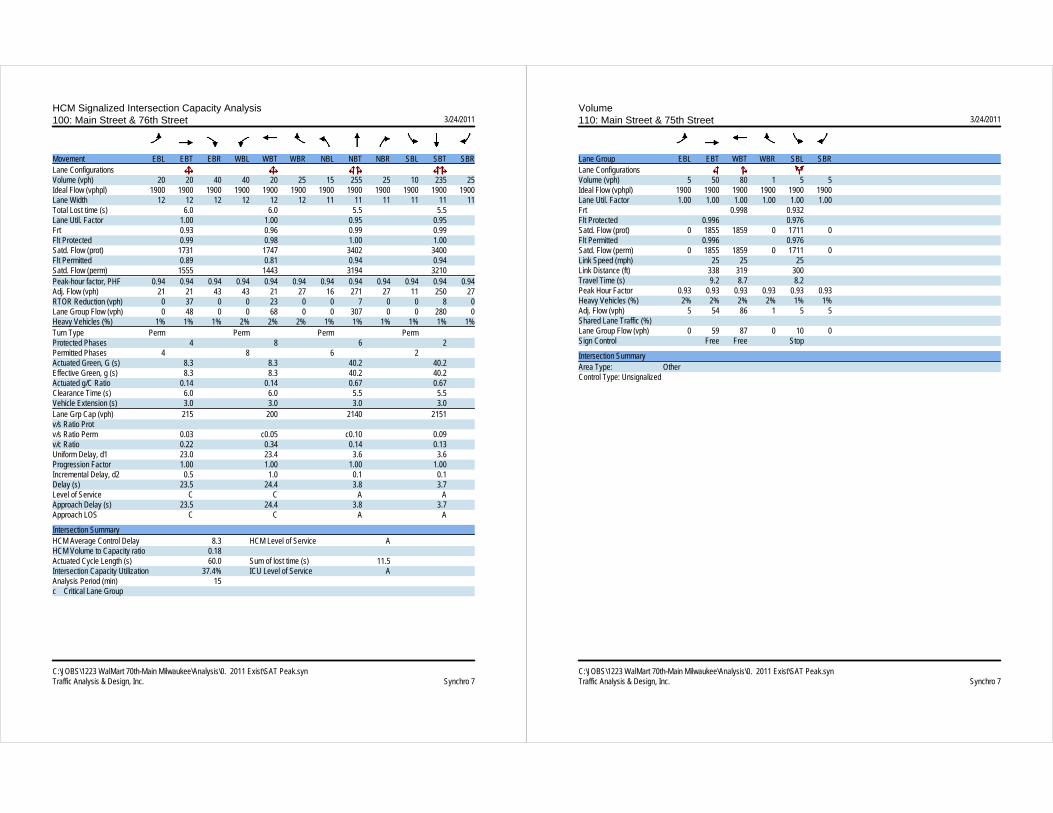
HCM Signalized Intersection Capacity Analysis100: Main Street & 76th Street 3/24/2011
C:\JOBS\1223 WalMart 70th-Main Milwaukee\Analysis\0. 2011 Exist\SAT Peak.synTraffic Analysis & Design, Inc. Synchro 7
Movement EBL EBT EBR WBL WBT WBR NBL NBT NBR SBL SBT SBRLane ConfigurationsVolume (vph) 20 20 40 40 20 25 15 255 25 10 235 25Ideal Flow (vphpl) 1900 1900 1900 1900 1900 1900 1900 1900 1900 1900 1900 1900Lane Width 12 12 12 12 12 12 11 11 11 11 11 11Total Lost time (s) 6.0 6.0 5.5 5.5Lane Util. Factor 1.00 1.00 0.95 0.95Frt 0.93 0.96 0.99 0.99Flt Protected 0.99 0.98 1.00 1.00Satd. Flow (prot) 1731 1747 3402 3400Flt Permitted 0.89 0.81 0.94 0.94Satd. Flow (perm) 1555 1443 3194 3210Peak-hour factor, PHF 0.94 0.94 0.94 0.94 0.94 0.94 0.94 0.94 0.94 0.94 0.94 0.94Adj. Flow (vph) 21 21 43 43 21 27 16 271 27 11 250 27RTOR Reduction (vph) 0 37 0 0 23 0 0 7 0 0 8 0Lane Group Flow (vph) 0 48 0 0 68 0 0 307 0 0 280 0Heavy Vehicles (%) 1% 1% 1% 2% 2% 2% 1% 1% 1% 1% 1% 1%Turn Type Perm Perm Perm PermProtected Phases 4 8 6 2Permitted Phases 4 8 6 2Actuated Green, G (s) 8.3 8.3 40.2 40.2Effective Green, g (s) 8.3 8.3 40.2 40.2Actuated g/C Ratio 0.14 0.14 0.67 0.67Clearance Time (s) 6.0 6.0 5.5 5.5Vehicle Extension (s) 3.0 3.0 3.0 3.0Lane Grp Cap (vph) 215 200 2140 2151v/s Ratio Protv/s Ratio Perm 0.03 c0.05 c0.10 0.09v/c Ratio 0.22 0.34 0.14 0.13Uniform Delay, d1 23.0 23.4 3.6 3.6Progression Factor 1.00 1.00 1.00 1.00Incremental Delay, d2 0.5 1.0 0.1 0.1Delay (s) 23.5 24.4 3.8 3.7Level of Service C C A AApproach Delay (s) 23.5 24.4 3.8 3.7Approach LOS C C A A
Intersection SummaryHCM Average Control Delay 8.3 HCM Level of Service AHCM Volume to Capacity ratio 0.18Actuated Cycle Length (s) 60.0 Sum of lost time (s) 11.5Intersection Capacity Utilization 37.4% ICU Level of Service AAnalysis Period (min) 15c Critical Lane Group
Volume110: Main Street & 75th Street 3/24/2011
C:\JOBS\1223 WalMart 70th-Main Milwaukee\Analysis\0. 2011 Exist\SAT Peak.synTraffic Analysis & Design, Inc. Synchro 7
Lane Group EBL EBT WBT WBR SBL SBRLane ConfigurationsVolume (vph) 5 50 80 1 5 5Ideal Flow (vphpl) 1900 1900 1900 1900 1900 1900Lane Util. Factor 1.00 1.00 1.00 1.00 1.00 1.00Frt 0.998 0.932Flt Protected 0.996 0.976Satd. Flow (prot) 0 1855 1859 0 1711 0Flt Permitted 0.996 0.976Satd. Flow (perm) 0 1855 1859 0 1711 0Link Speed (mph) 25 25 25Link Distance (ft) 338 319 300Travel Time (s) 9.2 8.7 8.2Peak Hour Factor 0.93 0.93 0.93 0.93 0.93 0.93Heavy Vehicles (%) 2% 2% 2% 2% 1% 1%Adj. Flow (vph) 5 54 86 1 5 5Shared Lane Traffic (%)Lane Group Flow (vph) 0 59 87 0 10 0Sign Control Free Free Stop
Intersection SummaryArea Type: OtherControl Type: Unsignalized

HCM Unsignalized Intersection Capacity Analysis110: Main Street & 75th Street 3/24/2011
C:\JOBS\1223 WalMart 70th-Main Milwaukee\Analysis\0. 2011 Exist\SAT Peak.synTraffic Analysis & Design, Inc. Synchro 7
Movement EBL EBT WBT WBR SBL SBRLane ConfigurationsVolume (veh/h) 5 50 80 1 5 5Sign Control Free Free StopGrade 0% 0% 0%Peak Hour Factor 0.93 0.93 0.93 0.93 0.93 0.93Hourly flow rate (vph) 5 54 86 1 5 5PedestriansLane Width (ft)Walking Speed (ft/s)Percent BlockageRight turn flare (veh)Median type None NoneMedian storage veh)Upstream signal (ft) 338pX, platoon unblockedvC, conflicting volume 87 151 87vC1, stage 1 conf volvC2, stage 2 conf volvCu, unblocked vol 87 151 87tC, single (s) 4.1 6.4 6.2tC, 2 stage (s)tF (s) 2.2 3.5 3.3p0 queue free % 100 99 99cM capacity (veh/h) 1509 840 975
Direction, Lane # EB 1 WB 1 SB 1Volume Total 59 87 11Volume Left 5 0 5Volume Right 0 1 5cSH 1509 1700 902Volume to Capacity 0.00 0.05 0.01Queue Length 95th (ft) 0 0 1Control Delay (s) 0.7 0.0 9.0Lane LOS A AApproach Delay (s) 0.7 0.0 9.0Approach LOS A
Intersection SummaryAverage Delay 0.9Intersection Capacity Utilization 16.8% ICU Level of Service AAnalysis Period (min) 15
Volume120: Main Street & 74th Street 3/24/2011
C:\JOBS\1223 WalMart 70th-Main Milwaukee\Analysis\0. 2011 Exist\SAT Peak.synTraffic Analysis & Design, Inc. Synchro 7
Lane Group EBL EBT EBR WBL WBT WBR NBL NBT NBR SBL SBT SBRLane ConfigurationsVolume (vph) 1 55 1 1 70 5 5 1 1 1 1 5Ideal Flow (vphpl) 1900 1900 1900 1900 1900 1900 1900 1900 1900 1900 1900 1900Lane Util. Factor 1.00 1.00 1.00 1.00 1.00 1.00 1.00 1.00 1.00 1.00 1.00 1.00Frt 0.998 0.991 0.983 0.899Flt Protected 0.999 0.999 0.964 0.994Satd. Flow (prot) 0 1876 0 0 1844 0 0 1783 0 0 1681 0Flt Permitted 0.999 0.999 0.964 0.994Satd. Flow (perm) 0 1876 0 0 1844 0 0 1783 0 0 1681 0Link Speed (mph) 25 25 25 25Link Distance (ft) 319 323 156 301Travel Time (s) 8.7 8.8 4.3 8.2Peak Hour Factor 0.89 0.89 0.89 0.89 0.89 0.89 0.89 0.89 0.89 0.89 0.89 0.89Heavy Vehicles (%) 1% 1% 1% 2% 2% 2% 1% 1% 1% 1% 1% 1%Adj. Flow (vph) 1 62 1 1 79 6 6 1 1 1 1 6Shared Lane Traffic (%)Lane Group Flow (vph) 0 64 0 0 86 0 0 8 0 0 8 0Sign Control Free Free Stop Stop
Intersection SummaryArea Type: OtherControl Type: Unsignalized

HCM Unsignalized Intersection Capacity Analysis120: Main Street & 74th Street 3/24/2011
C:\JOBS\1223 WalMart 70th-Main Milwaukee\Analysis\0. 2011 Exist\SAT Peak.synTraffic Analysis & Design, Inc. Synchro 7
Movement EBL EBT EBR WBL WBT WBR NBL NBT NBR SBL SBT SBRLane ConfigurationsVolume (veh/h) 1 55 1 1 70 5 5 1 1 1 1 5Sign Control Free Free Stop StopGrade 0% 0% 0% 0%Peak Hour Factor 0.89 0.89 0.89 0.89 0.89 0.89 0.89 0.89 0.89 0.89 0.89 0.89Hourly flow rate (vph) 1 62 1 1 79 6 6 1 1 1 1 6PedestriansLane Width (ft)Walking Speed (ft/s)Percent BlockageRight turn flare (veh)Median type None NoneMedian storage veh)Upstream signal (ft) 657 1293pX, platoon unblockedvC, conflicting volume 84 63 154 151 62 150 149 81vC1, stage 1 conf volvC2, stage 2 conf volvCu, unblocked vol 84 63 154 151 62 150 149 81tC, single (s) 4.1 4.1 7.1 6.5 6.2 7.1 6.5 6.2tC, 2 stage (s)tF (s) 2.2 2.2 3.5 4.0 3.3 3.5 4.0 3.3p0 queue free % 100 100 99 100 100 100 100 99cM capacity (veh/h) 1519 1540 808 741 1005 817 743 981
Direction, Lane # EB 1 WB 1 NB 1 SB 1Volume Total 64 85 8 8Volume Left 1 1 6 1Volume Right 1 6 1 6cSH 1519 1540 820 913Volume to Capacity 0.00 0.00 0.01 0.01Queue Length 95th (ft) 0 0 1 1Control Delay (s) 0.1 0.1 9.4 9.0Lane LOS A A A AApproach Delay (s) 0.1 0.1 9.4 9.0Approach LOS A A
Intersection SummaryAverage Delay 1.0Intersection Capacity Utilization 14.5% ICU Level of Service AAnalysis Period (min) 15
Volume130: Main Street & 73rd Street 3/24/2011
C:\JOBS\1223 WalMart 70th-Main Milwaukee\Analysis\0. 2011 Exist\SAT Peak.synTraffic Analysis & Design, Inc. Synchro 7
Lane Group EBL EBT WBT WBR SBL SBRLane ConfigurationsVolume (vph) 5 50 70 5 1 5Ideal Flow (vphpl) 1900 1900 1900 1900 1900 1900Lane Util. Factor 1.00 1.00 1.00 1.00 1.00 1.00Frt 0.991 0.884Flt Protected 0.995 0.993Satd. Flow (prot) 0 1872 1864 0 1651 0Flt Permitted 0.995 0.993Satd. Flow (perm) 0 1872 1864 0 1651 0Link Speed (mph) 25 25 25Link Distance (ft) 323 318 300Travel Time (s) 8.8 8.7 8.2Peak Hour Factor 0.86 0.86 0.86 0.86 0.86 0.86Heavy Vehicles (%) 1% 1% 1% 1% 1% 1%Adj. Flow (vph) 6 58 81 6 1 6Shared Lane Traffic (%)Lane Group Flow (vph) 0 64 87 0 7 0Sign Control Free Free Stop
Intersection SummaryArea Type: OtherControl Type: Unsignalized

HCM Unsignalized Intersection Capacity Analysis130: Main Street & 73rd Street 3/24/2011
C:\JOBS\1223 WalMart 70th-Main Milwaukee\Analysis\0. 2011 Exist\SAT Peak.synTraffic Analysis & Design, Inc. Synchro 7
Movement EBL EBT WBT WBR SBL SBRLane ConfigurationsVolume (veh/h) 5 50 70 5 1 5Sign Control Free Free StopGrade 0% 0% 0%Peak Hour Factor 0.86 0.86 0.86 0.86 0.86 0.86Hourly flow rate (vph) 6 58 81 6 1 6PedestriansLane Width (ft)Walking Speed (ft/s)Percent BlockageRight turn flare (veh)Median type None NoneMedian storage veh)Upstream signal (ft) 980 970pX, platoon unblockedvC, conflicting volume 87 154 84vC1, stage 1 conf volvC2, stage 2 conf volvCu, unblocked vol 87 154 84tC, single (s) 4.1 6.4 6.2tC, 2 stage (s)tF (s) 2.2 3.5 3.3p0 queue free % 100 100 99cM capacity (veh/h) 1515 837 978
Direction, Lane # EB 1 WB 1 SB 1Volume Total 64 87 7Volume Left 6 0 1Volume Right 0 6 6cSH 1515 1700 951Volume to Capacity 0.00 0.05 0.01Queue Length 95th (ft) 0 0 1Control Delay (s) 0.7 0.0 8.8Lane LOS A AApproach Delay (s) 0.7 0.0 8.8Approach LOS A
Intersection SummaryAverage Delay 0.7Intersection Capacity Utilization 16.8% ICU Level of Service AAnalysis Period (min) 15
Volume140: Main Street & 72nd Street 3/24/2011
C:\JOBS\1223 WalMart 70th-Main Milwaukee\Analysis\0. 2011 Exist\SAT Peak.synTraffic Analysis & Design, Inc. Synchro 7
Lane Group EBL EBT EBR WBL WBT WBR NBL NBT NBR SBL SBT SBRLane ConfigurationsVolume (vph) 5 45 1 5 65 5 5 1 5 5 1 5Ideal Flow (vphpl) 1900 1900 1900 1900 1900 1900 1900 1900 1900 1900 1900 1900Lane Util. Factor 1.00 1.00 1.00 1.00 1.00 1.00 1.00 1.00 1.00 1.00 1.00 1.00Frt 0.998 0.991 0.938 0.938Flt Protected 0.995 0.997 0.977 0.977Satd. Flow (prot) 0 1868 0 0 1823 0 0 1527 0 0 1724 0Flt Permitted 0.995 0.997 0.977 0.977Satd. Flow (perm) 0 1868 0 0 1823 0 0 1527 0 0 1724 0Link Speed (mph) 25 25 25 25Link Distance (ft) 318 327 300 301Travel Time (s) 8.7 8.9 8.2 8.2Peak Hour Factor 0.84 0.84 0.84 0.84 0.84 0.84 0.84 0.84 0.84 0.84 0.84 0.84Heavy Vehicles (%) 1% 1% 1% 3% 3% 3% 14% 14% 14% 1% 1% 1%Adj. Flow (vph) 6 54 1 6 77 6 6 1 6 6 1 6Shared Lane Traffic (%)Lane Group Flow (vph) 0 61 0 0 89 0 0 13 0 0 13 0Sign Control Free Free Stop Stop
Intersection SummaryArea Type: OtherControl Type: Unsignalized

HCM Unsignalized Intersection Capacity Analysis140: Main Street & 72nd Street 3/24/2011
C:\JOBS\1223 WalMart 70th-Main Milwaukee\Analysis\0. 2011 Exist\SAT Peak.synTraffic Analysis & Design, Inc. Synchro 7
Movement EBL EBT EBR WBL WBT WBR NBL NBT NBR SBL SBT SBRLane ConfigurationsVolume (veh/h) 5 45 1 5 65 5 5 1 5 5 1 5Sign Control Free Free Stop StopGrade 0% 0% 0% 0%Peak Hour Factor 0.84 0.84 0.84 0.84 0.84 0.84 0.84 0.84 0.84 0.84 0.84 0.84Hourly flow rate (vph) 6 54 1 6 77 6 6 1 6 6 1 6PedestriansLane Width (ft)Walking Speed (ft/s)Percent BlockageRight turn flare (veh)Median type None NoneMedian storage veh)Upstream signal (ft) 1298 652pX, platoon unblockedvC, conflicting volume 83 55 165 161 54 165 159 80vC1, stage 1 conf volvC2, stage 2 conf volvCu, unblocked vol 83 55 165 161 54 165 159 80tC, single (s) 4.1 4.1 7.2 6.6 6.3 7.1 6.5 6.2tC, 2 stage (s)tF (s) 2.2 2.2 3.6 4.1 3.4 3.5 4.0 3.3p0 queue free % 100 100 99 100 99 99 100 99cM capacity (veh/h) 1520 1544 763 704 980 791 729 983
Direction, Lane # EB 1 WB 1 NB 1 SB 1Volume Total 61 89 13 13Volume Left 6 6 6 6Volume Right 1 6 6 6cSH 1520 1544 841 861Volume to Capacity 0.00 0.00 0.02 0.02Queue Length 95th (ft) 0 0 1 1Control Delay (s) 0.8 0.5 9.3 9.2Lane LOS A A A AApproach Delay (s) 0.8 0.5 9.3 9.2Approach LOS A A
Intersection SummaryAverage Delay 1.9Intersection Capacity Utilization 14.8% ICU Level of Service AAnalysis Period (min) 15
Volume150: Main Street & 71st Street 3/24/2011
C:\JOBS\1223 WalMart 70th-Main Milwaukee\Analysis\0. 2011 Exist\SAT Peak.synTraffic Analysis & Design, Inc. Synchro 7
Lane Group EBL EBT WBT WBR SBL SBRLane ConfigurationsVolume (vph) 0 55 70 0 5 5Ideal Flow (vphpl) 1900 1900 1900 1900 1900 1900Lane Util. Factor 1.00 1.00 1.00 1.00 1.00 1.00Frt 0.932Flt Protected 0.976Satd. Flow (prot) 0 1881 1845 0 1711 0Flt Permitted 0.976Satd. Flow (perm) 0 1881 1845 0 1711 0Link Speed (mph) 25 25 25Link Distance (ft) 327 155 300Travel Time (s) 8.9 4.2 8.2Peak Hour Factor 0.82 0.82 0.82 0.82 0.82 0.82Heavy Vehicles (%) 1% 1% 3% 3% 1% 1%Adj. Flow (vph) 0 67 85 0 6 6Shared Lane Traffic (%)Lane Group Flow (vph) 0 67 85 0 12 0Sign Control Free Free Stop
Intersection SummaryArea Type: OtherControl Type: Unsignalized

HCM Unsignalized Intersection Capacity Analysis150: Main Street & 71st Street 3/24/2011
C:\JOBS\1223 WalMart 70th-Main Milwaukee\Analysis\0. 2011 Exist\SAT Peak.synTraffic Analysis & Design, Inc. Synchro 7
Movement EBL EBT WBT WBR SBL SBRLane ConfigurationsVolume (veh/h) 0 55 70 0 5 5Sign Control Free Free StopGrade 0% 0% 0%Peak Hour Factor 0.82 0.82 0.82 0.82 0.82 0.82Hourly flow rate (vph) 0 67 85 0 6 6PedestriansLane Width (ft)Walking Speed (ft/s)Percent BlockageRight turn flare (veh)Median type None NoneMedian storage veh)Upstream signal (ft) 325pX, platoon unblockedvC, conflicting volume 85 152 85vC1, stage 1 conf volvC2, stage 2 conf volvCu, unblocked vol 85 152 85tC, single (s) 4.1 6.4 6.2tC, 2 stage (s)tF (s) 2.2 3.5 3.3p0 queue free % 100 99 99cM capacity (veh/h) 1517 842 976
Direction, Lane # EB 1 WB 1 SB 1Volume Total 67 85 12Volume Left 0 0 6Volume Right 0 0 6cSH 1700 1700 904Volume to Capacity 0.04 0.05 0.01Queue Length 95th (ft) 0 0 1Control Delay (s) 0.0 0.0 9.0Lane LOS AApproach Delay (s) 0.0 0.0 9.0Approach LOS A
Intersection SummaryAverage Delay 0.7Intersection Capacity Utilization 13.7% ICU Level of Service AAnalysis Period (min) 15
Volume160: Main Street & Alley 3/24/2011
C:\JOBS\1223 WalMart 70th-Main Milwaukee\Analysis\0. 2011 Exist\SAT Peak.synTraffic Analysis & Design, Inc. Synchro 7
Lane Group EBT EBR WBL WBT NBL NBRLane ConfigurationsVolume (vph) 60 1 1 70 1 1Ideal Flow (vphpl) 1900 1900 1900 1900 1900 1900Lane Util. Factor 1.00 1.00 1.00 1.00 1.00 1.00Frt 0.998 0.932Flt Protected 0.999 0.976Satd. Flow (prot) 1877 0 0 1843 1711 0Flt Permitted 0.999 0.976Satd. Flow (perm) 1877 0 0 1843 1711 0Link Speed (mph) 25 25 25Link Distance (ft) 155 170 141Travel Time (s) 4.2 4.6 3.8Peak Hour Factor 0.82 0.82 0.82 0.82 0.82 0.82Heavy Vehicles (%) 1% 1% 3% 3% 1% 1%Adj. Flow (vph) 73 1 1 85 1 1Shared Lane Traffic (%)Lane Group Flow (vph) 74 0 0 86 2 0Sign Control Free Free Stop
Intersection SummaryArea Type: OtherControl Type: Unsignalized

HCM Unsignalized Intersection Capacity Analysis160: Main Street & Alley 3/24/2011
C:\JOBS\1223 WalMart 70th-Main Milwaukee\Analysis\0. 2011 Exist\SAT Peak.synTraffic Analysis & Design, Inc. Synchro 7
Movement EBT EBR WBL WBT NBL NBRLane ConfigurationsVolume (veh/h) 60 1 1 70 1 1Sign Control Free Free StopGrade 0% 0% 0%Peak Hour Factor 0.82 0.82 0.82 0.82 0.82 0.82Hourly flow rate (vph) 73 1 1 85 1 1PedestriansLane Width (ft)Walking Speed (ft/s)Percent BlockageRight turn flare (veh)Median type None NoneMedian storage veh)Upstream signal (ft) 170pX, platoon unblockedvC, conflicting volume 74 162 74vC1, stage 1 conf volvC2, stage 2 conf volvCu, unblocked vol 74 162 74tC, single (s) 4.1 6.4 6.2tC, 2 stage (s)tF (s) 2.2 3.5 3.3p0 queue free % 100 100 100cM capacity (veh/h) 1519 831 991
Direction, Lane # EB 1 WB 1 NB 1Volume Total 74 87 2Volume Left 0 1 1Volume Right 1 0 1cSH 1700 1519 904Volume to Capacity 0.04 0.00 0.00Queue Length 95th (ft) 0 0 0Control Delay (s) 0.0 0.1 9.0Lane LOS A AApproach Delay (s) 0.0 0.1 9.0Approach LOS A
Intersection SummaryAverage Delay 0.2Intersection Capacity Utilization 14.5% ICU Level of Service AAnalysis Period (min) 15
Volume200: Main Street & 70th Street 3/24/2011
C:\JOBS\1223 WalMart 70th-Main Milwaukee\Analysis\0. 2011 Exist\SAT Peak.synTraffic Analysis & Design, Inc. Synchro 7
Lane Group EBL EBT EBR WBL WBT WBR NBL NBT NBR SBL SBT SBRLane ConfigurationsVolume (vph) 25 35 40 70 25 15 35 335 60 5 365 40Ideal Flow (vphpl) 1900 1900 1900 1900 1900 1900 1900 1900 1900 1900 1900 1900Lane Width (ft) 12 12 12 12 12 12 10 11 11 10 11 11Storage Length (ft) 0 0 0 0 95 0 100 0Storage Lanes 0 0 0 0 1 0 1 0Taper Length (ft) 50 50 50 50 50 50 50 50Lane Util. Factor 1.00 1.00 1.00 1.00 1.00 1.00 1.00 0.95 0.95 1.00 0.95 0.95Frt 0.946 0.981 0.977 0.985Flt Protected 0.988 0.969 0.950 0.950Satd. Flow (prot) 0 1758 0 0 1788 0 1652 3343 0 1668 3403 0Flt Permitted 0.911 0.755 0.490 0.495Satd. Flow (perm) 0 1621 0 0 1393 0 852 3343 0 869 3403 0Right Turn on Red Yes Yes Yes YesSatd. Flow (RTOR) 45 14 50 29Link Speed (mph) 25 25 30 30Link Distance (ft) 170 300 253 883Travel Time (s) 4.6 8.2 5.8 20.1Peak Hour Factor 0.89 0.89 0.89 0.89 0.89 0.89 0.89 0.89 0.89 0.89 0.89 0.89Heavy Vehicles (%) 1% 1% 1% 1% 1% 1% 2% 2% 2% 1% 1% 1%Adj. Flow (vph) 28 39 45 79 28 17 39 376 67 6 410 45Shared Lane Traffic (%)Lane Group Flow (vph) 0 112 0 0 124 0 39 443 0 6 455 0Turn Type Perm Perm Perm PermProtected Phases 4 8 6 2Permitted Phases 4 8 6 2Detector Phase 4 4 8 8 6 6 2 2Switch PhaseMinimum Initial (s) 18.0 18.0 18.0 18.0 31.0 31.0 31.0 31.0Minimum Split (s) 23.5 23.5 23.5 23.5 36.5 36.5 36.5 36.5Total Split (s) 23.5 23.5 0.0 23.5 23.5 0.0 36.5 36.5 0.0 36.5 36.5 0.0Total Split (%) 39.2% 39.2% 0.0% 39.2% 39.2% 0.0% 60.8% 60.8% 0.0% 60.8% 60.8% 0.0%Maximum Green (s) 18.0 18.0 18.0 18.0 31.0 31.0 31.0 31.0Yellow Time (s) 4.0 4.0 4.0 4.0 4.0 4.0 4.0 4.0All-Red Time (s) 1.5 1.5 1.5 1.5 1.5 1.5 1.5 1.5Lost Time Adjust (s) 0.0 0.0 0.0 0.0 0.0 0.0 0.0 0.0 0.0 0.0 0.0 0.0Total Lost Time (s) 5.5 5.5 4.0 5.5 5.5 4.0 5.5 5.5 4.0 5.5 5.5 4.0Lead/LagLead-Lag Optimize?Vehicle Extension (s) 3.0 3.0 3.0 3.0 3.0 3.0 3.0 3.0Recall Mode Max Max Max Max C-Max C-Max C-Max C-MaxWalk Time (s) 7.0 7.0 7.0 7.0 21.0 21.0 21.0 21.0Flash Dont Walk (s) 11.0 11.0 11.0 11.0 10.0 10.0 10.0 10.0Pedestrian Calls (#/hr) 0 0 0 0 0 0 0 0v/c Ratio 0.22 0.29 0.09 0.25 0.01 0.26Control Delay 11.5 16.5 8.1 7.5 7.2 8.0Queue Delay 0.0 0.0 0.0 0.0 0.0 0.0Total Delay 11.5 16.5 8.1 7.5 7.2 8.090th %ile Green (s) 18.0 18.0 18.0 18.0 31.0 31.0 31.0 31.0

Volume200: Main Street & 70th Street 3/24/2011
C:\JOBS\1223 WalMart 70th-Main Milwaukee\Analysis\0. 2011 Exist\SAT Peak.synTraffic Analysis & Design, Inc. Synchro 7
Lane Group EBL EBT EBR WBL WBT WBR NBL NBT NBR SBL SBT SBR90th %ile Term Code MaxR MaxR MaxR MaxR Coord Coord Coord Coord70th %ile Green (s) 18.0 18.0 18.0 18.0 31.0 31.0 31.0 31.070th %ile Term Code MaxR MaxR MaxR MaxR Coord Coord Coord Coord50th %ile Green (s) 18.0 18.0 18.0 18.0 31.0 31.0 31.0 31.050th %ile Term Code MaxR MaxR MaxR MaxR Coord Coord Coord Coord30th %ile Green (s) 18.0 18.0 18.0 18.0 31.0 31.0 31.0 31.030th %ile Term Code MaxR MaxR MaxR MaxR Coord Coord Coord Coord10th %ile Green (s) 18.0 18.0 18.0 18.0 31.0 31.0 31.0 31.010th %ile Term Code MaxR MaxR MaxR MaxR Coord Coord Coord CoordQueue Length 50th (ft) 17 30 7 37 1 41Queue Length 95th (ft) 48 67 19 59 6 63Internal Link Dist (ft) 90 220 173 803Turn Bay Length (ft) 95 100Base Capacity (vph) 518 428 440 1751 449 1772Starvation Cap Reductn 0 0 0 0 0 0Spillback Cap Reductn 0 0 0 0 0 0Storage Cap Reductn 0 0 0 0 0 0Reduced v/c Ratio 0.22 0.29 0.09 0.25 0.01 0.26
Intersection SummaryArea Type: OtherCycle Length: 60Actuated Cycle Length: 60Offset: 24 (40%), Referenced to phase 2:SBTL and 6:NBTL, Start of GreenNatural Cycle: 60Control Type: Actuated-Coordinated
Splits and Phases: 200: Main Street & 70th Street
HCM Signalized Intersection Capacity Analysis200: Main Street & 70th Street 3/24/2011
C:\JOBS\1223 WalMart 70th-Main Milwaukee\Analysis\0. 2011 Exist\SAT Peak.synTraffic Analysis & Design, Inc. Synchro 7
Movement EBL EBT EBR WBL WBT WBR NBL NBT NBR SBL SBT SBRLane ConfigurationsVolume (vph) 25 35 40 70 25 15 35 335 60 5 365 40Ideal Flow (vphpl) 1900 1900 1900 1900 1900 1900 1900 1900 1900 1900 1900 1900Lane Width 12 12 12 12 12 12 10 11 11 10 11 11Total Lost time (s) 5.5 5.5 5.5 5.5 5.5 5.5Lane Util. Factor 1.00 1.00 1.00 0.95 1.00 0.95Frt 0.95 0.98 1.00 0.98 1.00 0.99Flt Protected 0.99 0.97 0.95 1.00 0.95 1.00Satd. Flow (prot) 1757 1789 1652 3344 1668 3404Flt Permitted 0.91 0.75 0.49 1.00 0.50 1.00Satd. Flow (perm) 1620 1394 851 3344 870 3404Peak-hour factor, PHF 0.89 0.89 0.89 0.89 0.89 0.89 0.89 0.89 0.89 0.89 0.89 0.89Adj. Flow (vph) 28 39 45 79 28 17 39 376 67 6 410 45RTOR Reduction (vph) 0 32 0 0 10 0 0 24 0 0 14 0Lane Group Flow (vph) 0 81 0 0 114 0 39 419 0 6 441 0Heavy Vehicles (%) 1% 1% 1% 1% 1% 1% 2% 2% 2% 1% 1% 1%Turn Type Perm Perm Perm PermProtected Phases 4 8 6 2Permitted Phases 4 8 6 2Actuated Green, G (s) 18.0 18.0 31.0 31.0 31.0 31.0Effective Green, g (s) 18.0 18.0 31.0 31.0 31.0 31.0Actuated g/C Ratio 0.30 0.30 0.52 0.52 0.52 0.52Clearance Time (s) 5.5 5.5 5.5 5.5 5.5 5.5Vehicle Extension (s) 3.0 3.0 3.0 3.0 3.0 3.0Lane Grp Cap (vph) 486 418 440 1728 450 1759v/s Ratio Prot 0.13 c0.13v/s Ratio Perm 0.05 c0.08 0.05 0.01v/c Ratio 0.17 0.27 0.09 0.24 0.01 0.25Uniform Delay, d1 15.5 16.0 7.3 8.0 7.1 8.1Progression Factor 0.99 1.00 1.00 1.00 1.00 1.00Incremental Delay, d2 0.7 1.6 0.4 0.3 0.1 0.3Delay (s) 16.1 17.6 7.7 8.3 7.1 8.4Level of Service B B A A A AApproach Delay (s) 16.1 17.6 8.3 8.4Approach LOS B B A A
Intersection SummaryHCM Average Control Delay 10.1 HCM Level of Service BHCM Volume to Capacity ratio 0.26Actuated Cycle Length (s) 60.0 Sum of lost time (s) 11.0Intersection Capacity Utilization 53.3% ICU Level of Service AAnalysis Period (min) 15c Critical Lane Group
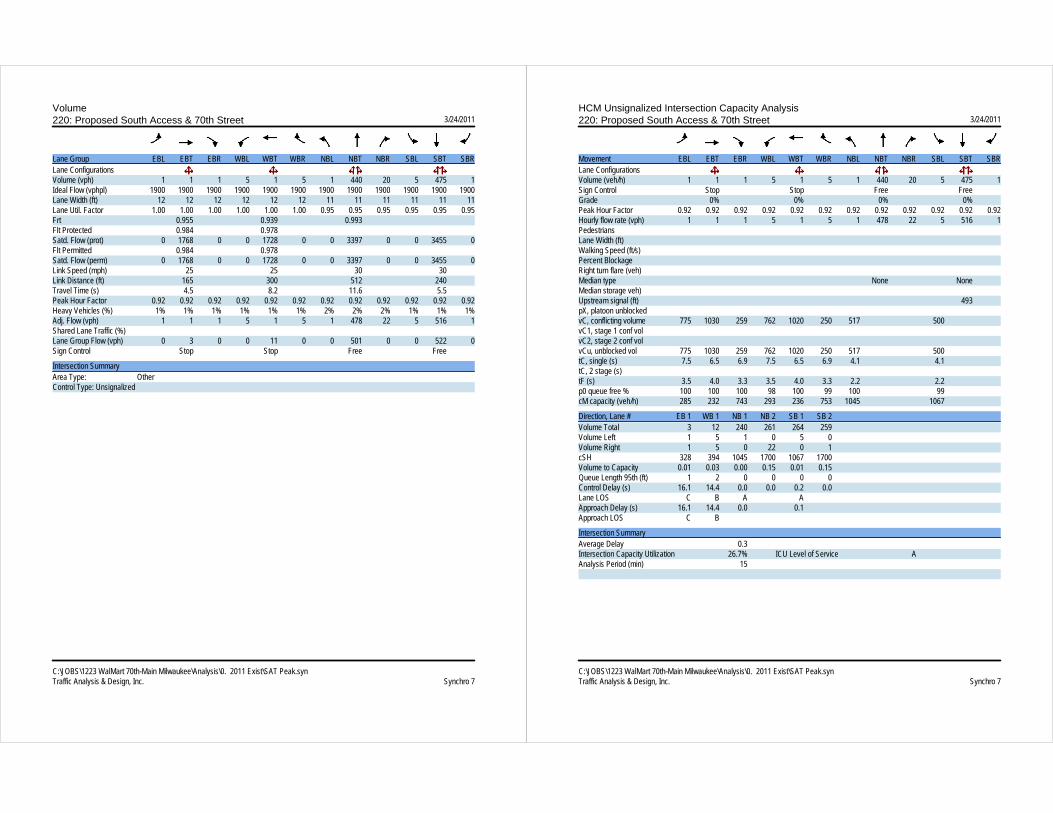
Volume220: Proposed South Access & 70th Street 3/24/2011
C:\JOBS\1223 WalMart 70th-Main Milwaukee\Analysis\0. 2011 Exist\SAT Peak.synTraffic Analysis & Design, Inc. Synchro 7
Lane Group EBL EBT EBR WBL WBT WBR NBL NBT NBR SBL SBT SBRLane ConfigurationsVolume (vph) 1 1 1 5 1 5 1 440 20 5 475 1Ideal Flow (vphpl) 1900 1900 1900 1900 1900 1900 1900 1900 1900 1900 1900 1900Lane Width (ft) 12 12 12 12 12 12 11 11 11 11 11 11Lane Util. Factor 1.00 1.00 1.00 1.00 1.00 1.00 0.95 0.95 0.95 0.95 0.95 0.95Frt 0.955 0.939 0.993Flt Protected 0.984 0.978Satd. Flow (prot) 0 1768 0 0 1728 0 0 3397 0 0 3455 0Flt Permitted 0.984 0.978Satd. Flow (perm) 0 1768 0 0 1728 0 0 3397 0 0 3455 0Link Speed (mph) 25 25 30 30Link Distance (ft) 165 300 512 240Travel Time (s) 4.5 8.2 11.6 5.5Peak Hour Factor 0.92 0.92 0.92 0.92 0.92 0.92 0.92 0.92 0.92 0.92 0.92 0.92Heavy Vehicles (%) 1% 1% 1% 1% 1% 1% 2% 2% 2% 1% 1% 1%Adj. Flow (vph) 1 1 1 5 1 5 1 478 22 5 516 1Shared Lane Traffic (%)Lane Group Flow (vph) 0 3 0 0 11 0 0 501 0 0 522 0Sign Control Stop Stop Free Free
Intersection SummaryArea Type: OtherControl Type: Unsignalized
HCM Unsignalized Intersection Capacity Analysis220: Proposed South Access & 70th Street 3/24/2011
C:\JOBS\1223 WalMart 70th-Main Milwaukee\Analysis\0. 2011 Exist\SAT Peak.synTraffic Analysis & Design, Inc. Synchro 7
Movement EBL EBT EBR WBL WBT WBR NBL NBT NBR SBL SBT SBRLane ConfigurationsVolume (veh/h) 1 1 1 5 1 5 1 440 20 5 475 1Sign Control Stop Stop Free FreeGrade 0% 0% 0% 0%Peak Hour Factor 0.92 0.92 0.92 0.92 0.92 0.92 0.92 0.92 0.92 0.92 0.92 0.92Hourly flow rate (vph) 1 1 1 5 1 5 1 478 22 5 516 1PedestriansLane Width (ft)Walking Speed (ft/s)Percent BlockageRight turn flare (veh)Median type None NoneMedian storage veh)Upstream signal (ft) 493pX, platoon unblockedvC, conflicting volume 775 1030 259 762 1020 250 517 500vC1, stage 1 conf volvC2, stage 2 conf volvCu, unblocked vol 775 1030 259 762 1020 250 517 500tC, single (s) 7.5 6.5 6.9 7.5 6.5 6.9 4.1 4.1tC, 2 stage (s)tF (s) 3.5 4.0 3.3 3.5 4.0 3.3 2.2 2.2p0 queue free % 100 100 100 98 100 99 100 99cM capacity (veh/h) 285 232 743 293 236 753 1045 1067
Direction, Lane # EB 1 WB 1 NB 1 NB 2 SB 1 SB 2Volume Total 3 12 240 261 264 259Volume Left 1 5 1 0 5 0Volume Right 1 5 0 22 0 1cSH 328 394 1045 1700 1067 1700Volume to Capacity 0.01 0.03 0.00 0.15 0.01 0.15Queue Length 95th (ft) 1 2 0 0 0 0Control Delay (s) 16.1 14.4 0.0 0.0 0.2 0.0Lane LOS C B A AApproach Delay (s) 16.1 14.4 0.0 0.1Approach LOS C B
Intersection SummaryAverage Delay 0.3Intersection Capacity Utilization 26.7% ICU Level of Service AAnalysis Period (min) 15
The Walmart Market - Milwaukee, Wisconsin March 31, 2011
Traffic Analysis & Design, Inc. C:\JOBS\1223 WalMart 70th-Main Milwaukee\Report - TIA\Appendix 110331.docx
APPENDIX C
YEAR 2011 TOTAL TRAFFIC
PEAK HOUR ANALYSIS OUTPUTS

Volume100: Main Street & 76th Street 3/24/2011
C:\JOBS\1223 WalMart 70th-Main Milwaukee\Analysis\1. 2011 Tot\PM Peak.synTraffic Analysis & Design, Inc. Synchro 7
Lane Group EBL EBT EBR WBL WBT WBR NBL NBT NBR SBL SBT SBRLane ConfigurationsVolume (vph) 35 25 50 100 30 95 20 395 75 70 560 35Ideal Flow (vphpl) 1900 1900 1900 1900 1900 1900 1900 1900 1900 1900 1900 1900Lane Width (ft) 12 12 12 12 12 12 11 11 11 11 11 11Lane Util. Factor 1.00 1.00 1.00 1.00 1.00 1.00 0.95 0.95 0.95 0.95 0.95 0.95Frt 0.938 0.943 0.977 0.992Flt Protected 0.984 0.978 0.998 0.995Satd. Flow (prot) 0 1719 0 0 1735 0 0 3369 0 0 3410 0Flt Permitted 0.842 0.815 0.918 0.850Satd. Flow (perm) 0 1471 0 0 1446 0 0 3099 0 0 2913 0Right Turn on Red Yes Yes Yes YesSatd. Flow (RTOR) 52 66 47 13Link Speed (mph) 20 25 30 30Link Distance (ft) 338 338 579 529Travel Time (s) 11.5 9.2 13.2 12.0Peak Hour Factor 0.97 0.97 0.97 0.97 0.97 0.97 0.97 0.97 0.97 0.97 0.97 0.97Heavy Vehicles (%) 2% 2% 2% 1% 1% 1% 1% 1% 1% 1% 1% 1%Adj. Flow (vph) 36 26 52 103 31 98 21 407 77 72 577 36Shared Lane Traffic (%)Lane Group Flow (vph) 0 114 0 0 232 0 0 505 0 0 685 0Turn Type Perm Perm Perm PermProtected Phases 4 8 6 2Permitted Phases 4 8 6 2Detector Phase 4 4 8 8 6 6 2 2Switch PhaseMinimum Initial (s) 10.0 10.0 10.0 10.0 14.0 14.0 14.0 14.0Minimum Split (s) 16.0 16.0 16.0 16.0 19.5 19.5 19.5 19.5Total Split (s) 26.0 26.0 0.0 26.0 26.0 0.0 34.0 34.0 0.0 34.0 34.0 0.0Total Split (%) 43.3% 43.3% 0.0% 43.3% 43.3% 0.0% 56.7% 56.7% 0.0% 56.7% 56.7% 0.0%Maximum Green (s) 20.0 20.0 20.0 20.0 28.5 28.5 28.5 28.5Yellow Time (s) 3.5 3.5 3.5 3.5 4.0 4.0 4.0 4.0All-Red Time (s) 2.5 2.5 2.5 2.5 1.5 1.5 1.5 1.5Lost Time Adjust (s) 0.0 0.0 0.0 0.0 0.0 0.0 0.0 0.0 0.0 0.0 0.0 0.0Total Lost Time (s) 6.0 6.0 4.0 6.0 6.0 4.0 5.5 5.5 4.0 5.5 5.5 4.0Lead/LagLead-Lag Optimize?Vehicle Extension (s) 3.0 3.0 3.0 3.0 3.0 3.0 3.0 3.0Recall Mode None None None None C-Max C-Max C-Max C-MaxWalk Time (s) 7.0 7.0 7.0 7.0 7.0 7.0Flash Dont Walk (s) 13.0 13.0 7.0 7.0 7.0 7.0Pedestrian Calls (#/hr) 0 0 0 0 0 0v/c Ratio 0.31 0.62 0.28 0.40Control Delay 13.0 21.9 6.7 8.2Queue Delay 0.0 0.0 0.0 0.0Total Delay 13.0 21.9 6.7 8.290th %ile Green (s) 18.9 18.9 18.9 18.9 29.6 29.6 29.6 29.690th %ile Term Code Hold Hold Gap Gap Coord Coord Coord Coord70th %ile Green (s) 15.2 15.2 15.2 15.2 33.3 33.3 33.3 33.370th %ile Term Code Hold Hold Gap Gap Coord Coord Coord Coord
Volume100: Main Street & 76th Street 3/24/2011
C:\JOBS\1223 WalMart 70th-Main Milwaukee\Analysis\1. 2011 Tot\PM Peak.synTraffic Analysis & Design, Inc. Synchro 7
Lane Group EBL EBT EBR WBL WBT WBR NBL NBT NBR SBL SBT SBR50th %ile Green (s) 12.6 12.6 12.6 12.6 35.9 35.9 35.9 35.950th %ile Term Code Hold Hold Gap Gap Coord Coord Coord Coord30th %ile Green (s) 10.0 10.0 10.0 10.0 38.5 38.5 38.5 38.530th %ile Term Code Min Min Min Min Coord Coord Coord Coord10th %ile Green (s) 10.0 10.0 10.0 10.0 38.5 38.5 38.5 38.510th %ile Term Code Hold Hold Min Min Coord Coord Coord CoordQueue Length 50th (ft) 19 54 35 57Queue Length 95th (ft) 48 102 75 117Internal Link Dist (ft) 258 258 499 449Turn Bay Length (ft)Base Capacity (vph) 525 526 1835 1713Starvation Cap Reductn 0 0 0 0Spillback Cap Reductn 0 0 0 0Storage Cap Reductn 0 0 0 0Reduced v/c Ratio 0.22 0.44 0.28 0.40
Intersection SummaryArea Type: OtherCycle Length: 60Actuated Cycle Length: 60Offset: 49 (82%), Referenced to phase 2:SBTL and 6:NBTL, Start of GreenNatural Cycle: 40Control Type: Actuated-Coordinated
Splits and Phases: 100: Main Street & 76th Street

HCM Signalized Intersection Capacity Analysis100: Main Street & 76th Street 3/24/2011
C:\JOBS\1223 WalMart 70th-Main Milwaukee\Analysis\1. 2011 Tot\PM Peak.synTraffic Analysis & Design, Inc. Synchro 7
Movement EBL EBT EBR WBL WBT WBR NBL NBT NBR SBL SBT SBRLane ConfigurationsVolume (vph) 35 25 50 100 30 95 20 395 75 70 560 35Ideal Flow (vphpl) 1900 1900 1900 1900 1900 1900 1900 1900 1900 1900 1900 1900Lane Width 12 12 12 12 12 12 11 11 11 11 11 11Total Lost time (s) 6.0 6.0 5.5 5.5Lane Util. Factor 1.00 1.00 0.95 0.95Frt 0.94 0.94 0.98 0.99Flt Protected 0.98 0.98 1.00 0.99Satd. Flow (prot) 1721 1735 3369 3410Flt Permitted 0.84 0.81 0.92 0.85Satd. Flow (perm) 1472 1445 3100 2914Peak-hour factor, PHF 0.97 0.97 0.97 0.97 0.97 0.97 0.97 0.97 0.97 0.97 0.97 0.97Adj. Flow (vph) 36 26 52 103 31 98 21 407 77 72 577 36RTOR Reduction (vph) 0 40 0 0 51 0 0 19 0 0 5 0Lane Group Flow (vph) 0 74 0 0 181 0 0 486 0 0 680 0Heavy Vehicles (%) 2% 2% 2% 1% 1% 1% 1% 1% 1% 1% 1% 1%Turn Type Perm Perm Perm PermProtected Phases 4 8 6 2Permitted Phases 4 8 6 2Actuated Green, G (s) 13.3 13.3 35.2 35.2Effective Green, g (s) 13.3 13.3 35.2 35.2Actuated g/C Ratio 0.22 0.22 0.59 0.59Clearance Time (s) 6.0 6.0 5.5 5.5Vehicle Extension (s) 3.0 3.0 3.0 3.0Lane Grp Cap (vph) 326 320 1819 1710v/s Ratio Protv/s Ratio Perm 0.05 c0.13 0.16 c0.23v/c Ratio 0.23 0.56 0.27 0.40Uniform Delay, d1 19.1 20.8 6.1 6.7Progression Factor 1.00 1.00 1.00 1.00Incremental Delay, d2 0.4 2.3 0.4 0.7Delay (s) 19.5 23.1 6.4 7.4Level of Service B C A AApproach Delay (s) 19.5 23.1 6.4 7.4Approach LOS B C A A
Intersection SummaryHCM Average Control Delay 10.3 HCM Level of Service BHCM Volume to Capacity ratio 0.44Actuated Cycle Length (s) 60.0 Sum of lost time (s) 11.5Intersection Capacity Utilization 66.3% ICU Level of Service CAnalysis Period (min) 15c Critical Lane Group
Volume110: Main Street & 75th Street 3/24/2011
C:\JOBS\1223 WalMart 70th-Main Milwaukee\Analysis\1. 2011 Tot\PM Peak.synTraffic Analysis & Design, Inc. Synchro 7
Lane Group EBL EBT WBT WBR SBL SBRLane ConfigurationsVolume (vph) 10 160 220 5 1 5Ideal Flow (vphpl) 1900 1900 1900 1900 1900 1900Lane Util. Factor 1.00 1.00 1.00 1.00 1.00 1.00Frt 0.997 0.884Flt Protected 0.997 0.993Satd. Flow (prot) 0 1876 1876 0 1651 0Flt Permitted 0.997 0.993Satd. Flow (perm) 0 1876 1876 0 1651 0Link Speed (mph) 25 25 25Link Distance (ft) 338 319 300Travel Time (s) 9.2 8.7 8.2Peak Hour Factor 0.88 0.88 0.88 0.88 0.88 0.88Heavy Vehicles (%) 1% 1% 1% 1% 1% 1%Adj. Flow (vph) 11 182 250 6 1 6Shared Lane Traffic (%)Lane Group Flow (vph) 0 193 256 0 7 0Sign Control Free Free Stop
Intersection SummaryArea Type: OtherControl Type: Unsignalized

HCM Unsignalized Intersection Capacity Analysis110: Main Street & 75th Street 3/24/2011
C:\JOBS\1223 WalMart 70th-Main Milwaukee\Analysis\1. 2011 Tot\PM Peak.synTraffic Analysis & Design, Inc. Synchro 7
Movement EBL EBT WBT WBR SBL SBRLane ConfigurationsVolume (veh/h) 10 160 220 5 1 5Sign Control Free Free StopGrade 0% 0% 0%Peak Hour Factor 0.88 0.88 0.88 0.88 0.88 0.88Hourly flow rate (vph) 11 182 250 6 1 6PedestriansLane Width (ft)Walking Speed (ft/s)Percent BlockageRight turn flare (veh)Median type None NoneMedian storage veh)Upstream signal (ft) 338pX, platoon unblockedvC, conflicting volume 256 457 253vC1, stage 1 conf volvC2, stage 2 conf volvCu, unblocked vol 256 457 253tC, single (s) 4.1 6.4 6.2tC, 2 stage (s)tF (s) 2.2 3.5 3.3p0 queue free % 99 100 99cM capacity (veh/h) 1315 558 788
Direction, Lane # EB 1 WB 1 SB 1Volume Total 193 256 7Volume Left 11 0 1Volume Right 0 6 6cSH 1315 1700 738Volume to Capacity 0.01 0.15 0.01Queue Length 95th (ft) 1 0 1Control Delay (s) 0.5 0.0 9.9Lane LOS A AApproach Delay (s) 0.5 0.0 9.9Approach LOS A
Intersection SummaryAverage Delay 0.4Intersection Capacity Utilization 26.6% ICU Level of Service AAnalysis Period (min) 15
Volume120: Main Street & 74th Street 3/24/2011
C:\JOBS\1223 WalMart 70th-Main Milwaukee\Analysis\1. 2011 Tot\PM Peak.synTraffic Analysis & Design, Inc. Synchro 7
Lane Group EBL EBT EBR WBL WBT WBR NBL NBT NBR SBL SBT SBRLane ConfigurationsVolume (vph) 1 155 5 5 200 5 25 10 35 1 1 1Ideal Flow (vphpl) 1900 1900 1900 1900 1900 1900 1900 1900 1900 1900 1900 1900Lane Util. Factor 1.00 1.00 1.00 1.00 1.00 1.00 1.00 1.00 1.00 1.00 1.00 1.00Frt 0.996 0.997 0.932 0.955Flt Protected 0.999 0.983 0.984Satd. Flow (prot) 0 1802 0 0 1769 0 0 1723 0 0 1768 0Flt Permitted 0.999 0.983 0.984Satd. Flow (perm) 0 1802 0 0 1769 0 0 1723 0 0 1768 0Link Speed (mph) 25 25 25 25Link Distance (ft) 319 323 156 301Travel Time (s) 8.7 8.8 4.3 8.2Peak Hour Factor 0.91 0.91 0.91 0.91 0.91 0.91 0.91 0.91 0.91 0.91 0.91 0.91Heavy Vehicles (%) 5% 5% 5% 7% 7% 7% 1% 1% 1% 1% 1% 1%Adj. Flow (vph) 1 170 5 5 220 5 27 11 38 1 1 1Shared Lane Traffic (%)Lane Group Flow (vph) 0 176 0 0 230 0 0 76 0 0 3 0Sign Control Free Free Stop Stop
Intersection SummaryArea Type: OtherControl Type: Unsignalized

HCM Unsignalized Intersection Capacity Analysis120: Main Street & 74th Street 3/24/2011
C:\JOBS\1223 WalMart 70th-Main Milwaukee\Analysis\1. 2011 Tot\PM Peak.synTraffic Analysis & Design, Inc. Synchro 7
Movement EBL EBT EBR WBL WBT WBR NBL NBT NBR SBL SBT SBRLane ConfigurationsVolume (veh/h) 1 155 5 5 200 5 25 10 35 1 1 1Sign Control Free Free Stop StopGrade 0% 0% 0% 0%Peak Hour Factor 0.91 0.91 0.91 0.91 0.91 0.91 0.91 0.91 0.91 0.91 0.91 0.91Hourly flow rate (vph) 1 170 5 5 220 5 27 11 38 1 1 1PedestriansLane Width (ft)Walking Speed (ft/s)Percent BlockageRight turn flare (veh)Median type None NoneMedian storage veh)Upstream signal (ft) 657 1293pX, platoon unblockedvC, conflicting volume 225 176 410 412 173 453 412 223vC1, stage 1 conf volvC2, stage 2 conf volvCu, unblocked vol 225 176 410 412 173 453 412 223tC, single (s) 4.1 4.2 7.1 6.5 6.2 7.1 6.5 6.2tC, 2 stage (s)tF (s) 2.2 2.3 3.5 4.0 3.3 3.5 4.0 3.3p0 queue free % 100 100 95 98 96 100 100 100cM capacity (veh/h) 1326 1371 550 529 873 486 529 820
Direction, Lane # EB 1 WB 1 NB 1 SB 1Volume Total 177 231 77 3Volume Left 1 5 27 1Volume Right 5 5 38 1cSH 1326 1371 670 581Volume to Capacity 0.00 0.00 0.11 0.01Queue Length 95th (ft) 0 0 10 0Control Delay (s) 0.1 0.2 11.1 11.2Lane LOS A A B BApproach Delay (s) 0.1 0.2 11.1 11.2Approach LOS B B
Intersection SummaryAverage Delay 1.9Intersection Capacity Utilization 26.4% ICU Level of Service AAnalysis Period (min) 15
Volume130: Main Street & 73rd Street 3/24/2011
C:\JOBS\1223 WalMart 70th-Main Milwaukee\Analysis\1. 2011 Tot\PM Peak.synTraffic Analysis & Design, Inc. Synchro 7
Lane Group EBL EBT WBT WBR SBL SBRLane ConfigurationsVolume (vph) 5 185 205 5 5 5Ideal Flow (vphpl) 1900 1900 1900 1900 1900 1900Lane Util. Factor 1.00 1.00 1.00 1.00 1.00 1.00Frt 0.997 0.932Flt Protected 0.999 0.976Satd. Flow (prot) 0 1825 1804 0 1711 0Flt Permitted 0.999 0.976Satd. Flow (perm) 0 1825 1804 0 1711 0Link Speed (mph) 25 25 25Link Distance (ft) 323 318 300Travel Time (s) 8.8 8.7 8.2Peak Hour Factor 0.81 0.81 0.81 0.81 0.81 0.81Heavy Vehicles (%) 4% 4% 5% 5% 1% 1%Adj. Flow (vph) 6 228 253 6 6 6Shared Lane Traffic (%)Lane Group Flow (vph) 0 234 259 0 12 0Sign Control Free Free Stop
Intersection SummaryArea Type: OtherControl Type: Unsignalized
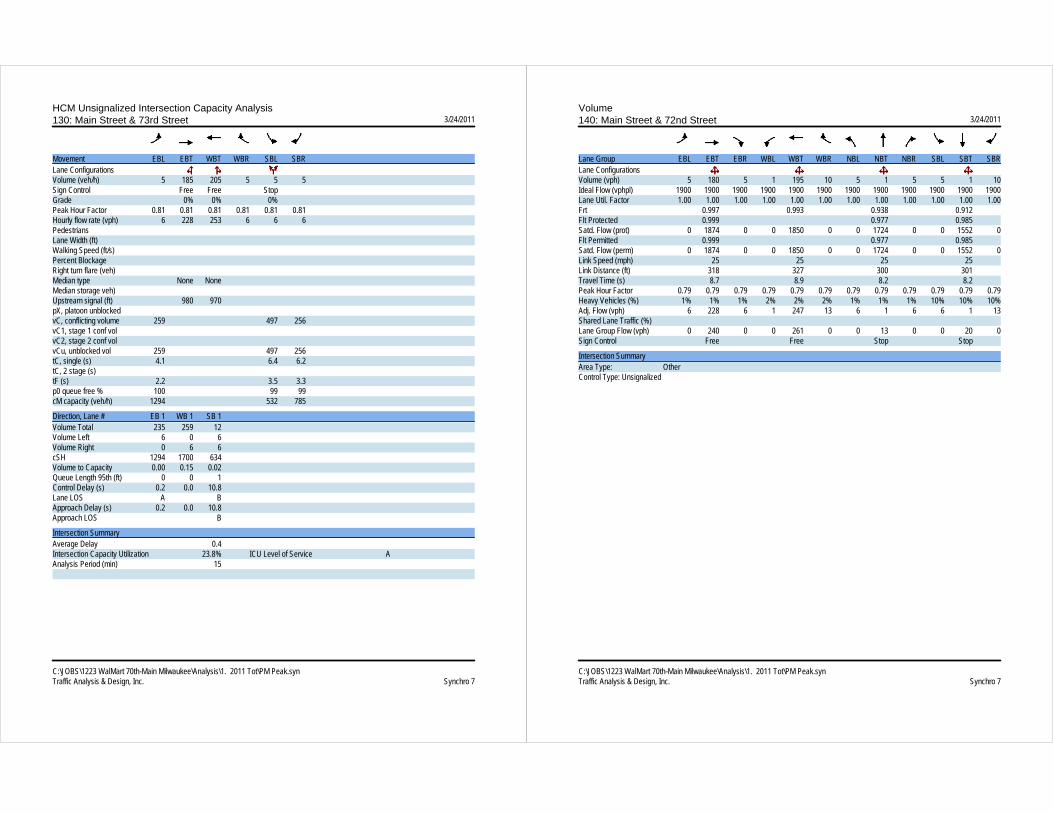
HCM Unsignalized Intersection Capacity Analysis130: Main Street & 73rd Street 3/24/2011
C:\JOBS\1223 WalMart 70th-Main Milwaukee\Analysis\1. 2011 Tot\PM Peak.synTraffic Analysis & Design, Inc. Synchro 7
Movement EBL EBT WBT WBR SBL SBRLane ConfigurationsVolume (veh/h) 5 185 205 5 5 5Sign Control Free Free StopGrade 0% 0% 0%Peak Hour Factor 0.81 0.81 0.81 0.81 0.81 0.81Hourly flow rate (vph) 6 228 253 6 6 6PedestriansLane Width (ft)Walking Speed (ft/s)Percent BlockageRight turn flare (veh)Median type None NoneMedian storage veh)Upstream signal (ft) 980 970pX, platoon unblockedvC, conflicting volume 259 497 256vC1, stage 1 conf volvC2, stage 2 conf volvCu, unblocked vol 259 497 256tC, single (s) 4.1 6.4 6.2tC, 2 stage (s)tF (s) 2.2 3.5 3.3p0 queue free % 100 99 99cM capacity (veh/h) 1294 532 785
Direction, Lane # EB 1 WB 1 SB 1Volume Total 235 259 12Volume Left 6 0 6Volume Right 0 6 6cSH 1294 1700 634Volume to Capacity 0.00 0.15 0.02Queue Length 95th (ft) 0 0 1Control Delay (s) 0.2 0.0 10.8Lane LOS A BApproach Delay (s) 0.2 0.0 10.8Approach LOS B
Intersection SummaryAverage Delay 0.4Intersection Capacity Utilization 23.8% ICU Level of Service AAnalysis Period (min) 15
Volume140: Main Street & 72nd Street 3/24/2011
C:\JOBS\1223 WalMart 70th-Main Milwaukee\Analysis\1. 2011 Tot\PM Peak.synTraffic Analysis & Design, Inc. Synchro 7
Lane Group EBL EBT EBR WBL WBT WBR NBL NBT NBR SBL SBT SBRLane ConfigurationsVolume (vph) 5 180 5 1 195 10 5 1 5 5 1 10Ideal Flow (vphpl) 1900 1900 1900 1900 1900 1900 1900 1900 1900 1900 1900 1900Lane Util. Factor 1.00 1.00 1.00 1.00 1.00 1.00 1.00 1.00 1.00 1.00 1.00 1.00Frt 0.997 0.993 0.938 0.912Flt Protected 0.999 0.977 0.985Satd. Flow (prot) 0 1874 0 0 1850 0 0 1724 0 0 1552 0Flt Permitted 0.999 0.977 0.985Satd. Flow (perm) 0 1874 0 0 1850 0 0 1724 0 0 1552 0Link Speed (mph) 25 25 25 25Link Distance (ft) 318 327 300 301Travel Time (s) 8.7 8.9 8.2 8.2Peak Hour Factor 0.79 0.79 0.79 0.79 0.79 0.79 0.79 0.79 0.79 0.79 0.79 0.79Heavy Vehicles (%) 1% 1% 1% 2% 2% 2% 1% 1% 1% 10% 10% 10%Adj. Flow (vph) 6 228 6 1 247 13 6 1 6 6 1 13Shared Lane Traffic (%)Lane Group Flow (vph) 0 240 0 0 261 0 0 13 0 0 20 0Sign Control Free Free Stop Stop
Intersection SummaryArea Type: OtherControl Type: Unsignalized

HCM Unsignalized Intersection Capacity Analysis140: Main Street & 72nd Street 3/24/2011
C:\JOBS\1223 WalMart 70th-Main Milwaukee\Analysis\1. 2011 Tot\PM Peak.synTraffic Analysis & Design, Inc. Synchro 7
Movement EBL EBT EBR WBL WBT WBR NBL NBT NBR SBL SBT SBRLane ConfigurationsVolume (veh/h) 5 180 5 1 195 10 5 1 5 5 1 10Sign Control Free Free Stop StopGrade 0% 0% 0% 0%Peak Hour Factor 0.79 0.79 0.79 0.79 0.79 0.79 0.79 0.79 0.79 0.79 0.79 0.79Hourly flow rate (vph) 6 228 6 1 247 13 6 1 6 6 1 13PedestriansLane Width (ft)Walking Speed (ft/s)Percent BlockageRight turn flare (veh)Median type None NoneMedian storage veh)Upstream signal (ft) 1298 652pX, platoon unblockedvC, conflicting volume 259 234 513 506 231 506 503 253vC1, stage 1 conf volvC2, stage 2 conf volvCu, unblocked vol 259 234 513 506 231 506 503 253tC, single (s) 4.1 4.1 7.1 6.5 6.2 7.2 6.6 6.3tC, 2 stage (s)tF (s) 2.2 2.2 3.5 4.0 3.3 3.6 4.1 3.4p0 queue free % 100 100 99 100 99 99 100 98cM capacity (veh/h) 1311 1333 463 468 811 457 457 766
Direction, Lane # EB 1 WB 1 NB 1 SB 1Volume Total 241 261 14 20Volume Left 6 1 6 6Volume Right 6 13 6 13cSH 1311 1333 576 611Volume to Capacity 0.00 0.00 0.02 0.03Queue Length 95th (ft) 0 0 2 3Control Delay (s) 0.2 0.0 11.4 11.1Lane LOS A A B BApproach Delay (s) 0.2 0.0 11.4 11.1Approach LOS B B
Intersection SummaryAverage Delay 0.8Intersection Capacity Utilization 23.3% ICU Level of Service AAnalysis Period (min) 15
Volume150: Main Street & 71st Street 3/24/2011
C:\JOBS\1223 WalMart 70th-Main Milwaukee\Analysis\1. 2011 Tot\PM Peak.synTraffic Analysis & Design, Inc. Synchro 7
Lane Group EBL EBT EBR WBL WBT WBR NBL NBT NBR SBL SBT SBRLane ConfigurationsVolume (vph) 0 120 70 25 130 0 70 0 20 15 1 5Ideal Flow (vphpl) 1900 1900 1900 1900 1900 1900 1900 1900 1900 1900 1900 1900Lane Util. Factor 1.00 1.00 1.00 1.00 1.00 1.00 1.00 1.00 1.00 1.00 1.00 1.00Frt 0.950 0.970 0.969Flt Protected 0.992 0.963 0.965Satd. Flow (prot) 0 1787 0 0 1812 0 0 1757 0 0 1759 0Flt Permitted 0.992 0.963 0.965Satd. Flow (perm) 0 1787 0 0 1812 0 0 1757 0 0 1759 0Link Speed (mph) 25 25 25 25Link Distance (ft) 327 155 100 300Travel Time (s) 8.9 4.2 2.7 8.2Peak Hour Factor 0.77 0.77 0.77 0.77 0.77 0.77 0.77 0.77 0.77 0.77 0.77 0.77Heavy Vehicles (%) 1% 1% 1% 4% 4% 4% 1% 1% 1% 1% 1% 1%Adj. Flow (vph) 0 156 91 32 169 0 91 0 26 19 1 6Shared Lane Traffic (%)Lane Group Flow (vph) 0 247 0 0 201 0 0 117 0 0 26 0Sign Control Free Free Stop Stop
Intersection SummaryArea Type: OtherControl Type: Unsignalized

HCM Unsignalized Intersection Capacity Analysis150: Main Street & 71st Street 3/24/2011
C:\JOBS\1223 WalMart 70th-Main Milwaukee\Analysis\1. 2011 Tot\PM Peak.synTraffic Analysis & Design, Inc. Synchro 7
Movement EBL EBT EBR WBL WBT WBR NBL NBT NBR SBL SBT SBRLane ConfigurationsVolume (veh/h) 0 120 70 25 130 0 70 0 20 15 1 5Sign Control Free Free Stop StopGrade 0% 0% 0% 0%Peak Hour Factor 0.77 0.77 0.77 0.77 0.77 0.77 0.77 0.77 0.77 0.77 0.77 0.77Hourly flow rate (vph) 0 156 91 32 169 0 91 0 26 19 1 6PedestriansLane Width (ft)Walking Speed (ft/s)Percent BlockageRight turn flare (veh)Median type None NoneMedian storage veh)Upstream signal (ft) 325pX, platoon unblockedvC, conflicting volume 169 247 442 435 201 461 481 169vC1, stage 1 conf volvC2, stage 2 conf volvCu, unblocked vol 169 247 442 435 201 461 481 169tC, single (s) 4.1 4.1 7.1 6.5 6.2 7.1 6.5 6.2tC, 2 stage (s)tF (s) 2.2 2.2 3.5 4.0 3.3 3.5 4.0 3.3p0 queue free % 100 98 82 100 97 96 100 99cM capacity (veh/h) 1415 1308 512 503 842 487 474 878
Direction, Lane # EB 1 WB 1 NB 1 SB 1Volume Total 247 201 117 27Volume Left 0 32 91 19Volume Right 91 0 26 6cSH 1700 1308 561 544Volume to Capacity 0.15 0.02 0.21 0.05Queue Length 95th (ft) 0 2 19 4Control Delay (s) 0.0 1.4 13.1 12.0Lane LOS A B BApproach Delay (s) 0.0 1.4 13.1 12.0Approach LOS B B
Intersection SummaryAverage Delay 3.6Intersection Capacity Utilization 34.8% ICU Level of Service AAnalysis Period (min) 15
Volume160: Main Street & Alley 3/24/2011
C:\JOBS\1223 WalMart 70th-Main Milwaukee\Analysis\1. 2011 Tot\PM Peak.synTraffic Analysis & Design, Inc. Synchro 7
Lane Group EBT EBR WBL WBT NBL NBRLane ConfigurationsVolume (vph) 150 5 5 150 5 10Ideal Flow (vphpl) 1900 1900 1900 1900 1900 1900Lane Util. Factor 1.00 1.00 1.00 1.00 1.00 1.00Frt 0.996 0.908Flt Protected 0.999 0.984Satd. Flow (prot) 1874 0 0 1825 1681 0Flt Permitted 0.999 0.984Satd. Flow (perm) 1874 0 0 1825 1681 0Link Speed (mph) 25 25 25Link Distance (ft) 155 170 141Travel Time (s) 4.2 4.6 3.8Peak Hour Factor 0.77 0.77 0.77 0.77 0.77 0.77Heavy Vehicles (%) 1% 1% 4% 4% 1% 1%Adj. Flow (vph) 195 6 6 195 6 13Shared Lane Traffic (%)Lane Group Flow (vph) 201 0 0 201 19 0Sign Control Free Free Stop
Intersection SummaryArea Type: OtherControl Type: Unsignalized
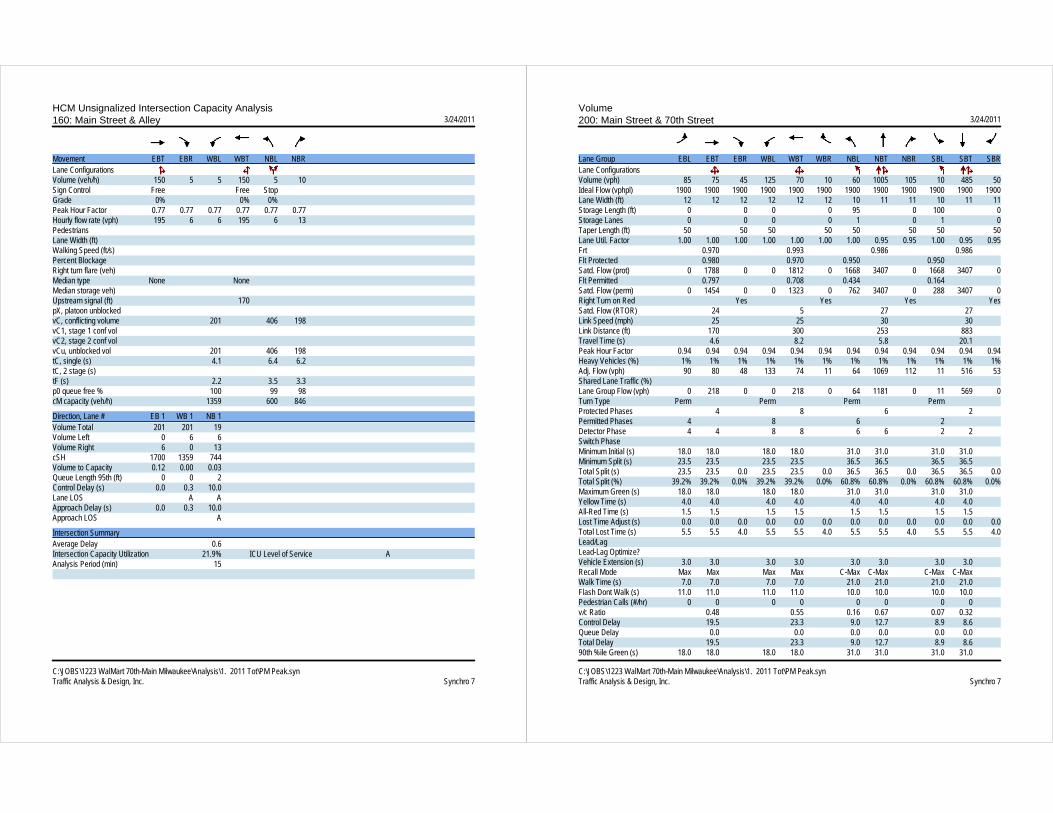
HCM Unsignalized Intersection Capacity Analysis160: Main Street & Alley 3/24/2011
C:\JOBS\1223 WalMart 70th-Main Milwaukee\Analysis\1. 2011 Tot\PM Peak.synTraffic Analysis & Design, Inc. Synchro 7
Movement EBT EBR WBL WBT NBL NBRLane ConfigurationsVolume (veh/h) 150 5 5 150 5 10Sign Control Free Free StopGrade 0% 0% 0%Peak Hour Factor 0.77 0.77 0.77 0.77 0.77 0.77Hourly flow rate (vph) 195 6 6 195 6 13PedestriansLane Width (ft)Walking Speed (ft/s)Percent BlockageRight turn flare (veh)Median type None NoneMedian storage veh)Upstream signal (ft) 170pX, platoon unblockedvC, conflicting volume 201 406 198vC1, stage 1 conf volvC2, stage 2 conf volvCu, unblocked vol 201 406 198tC, single (s) 4.1 6.4 6.2tC, 2 stage (s)tF (s) 2.2 3.5 3.3p0 queue free % 100 99 98cM capacity (veh/h) 1359 600 846
Direction, Lane # EB 1 WB 1 NB 1Volume Total 201 201 19Volume Left 0 6 6Volume Right 6 0 13cSH 1700 1359 744Volume to Capacity 0.12 0.00 0.03Queue Length 95th (ft) 0 0 2Control Delay (s) 0.0 0.3 10.0Lane LOS A AApproach Delay (s) 0.0 0.3 10.0Approach LOS A
Intersection SummaryAverage Delay 0.6Intersection Capacity Utilization 21.9% ICU Level of Service AAnalysis Period (min) 15
Volume200: Main Street & 70th Street 3/24/2011
C:\JOBS\1223 WalMart 70th-Main Milwaukee\Analysis\1. 2011 Tot\PM Peak.synTraffic Analysis & Design, Inc. Synchro 7
Lane Group EBL EBT EBR WBL WBT WBR NBL NBT NBR SBL SBT SBRLane ConfigurationsVolume (vph) 85 75 45 125 70 10 60 1005 105 10 485 50Ideal Flow (vphpl) 1900 1900 1900 1900 1900 1900 1900 1900 1900 1900 1900 1900Lane Width (ft) 12 12 12 12 12 12 10 11 11 10 11 11Storage Length (ft) 0 0 0 0 95 0 100 0Storage Lanes 0 0 0 0 1 0 1 0Taper Length (ft) 50 50 50 50 50 50 50 50Lane Util. Factor 1.00 1.00 1.00 1.00 1.00 1.00 1.00 0.95 0.95 1.00 0.95 0.95Frt 0.970 0.993 0.986 0.986Flt Protected 0.980 0.970 0.950 0.950Satd. Flow (prot) 0 1788 0 0 1812 0 1668 3407 0 1668 3407 0Flt Permitted 0.797 0.708 0.434 0.164Satd. Flow (perm) 0 1454 0 0 1323 0 762 3407 0 288 3407 0Right Turn on Red Yes Yes Yes YesSatd. Flow (RTOR) 24 5 27 27Link Speed (mph) 25 25 30 30Link Distance (ft) 170 300 253 883Travel Time (s) 4.6 8.2 5.8 20.1Peak Hour Factor 0.94 0.94 0.94 0.94 0.94 0.94 0.94 0.94 0.94 0.94 0.94 0.94Heavy Vehicles (%) 1% 1% 1% 1% 1% 1% 1% 1% 1% 1% 1% 1%Adj. Flow (vph) 90 80 48 133 74 11 64 1069 112 11 516 53Shared Lane Traffic (%)Lane Group Flow (vph) 0 218 0 0 218 0 64 1181 0 11 569 0Turn Type Perm Perm Perm PermProtected Phases 4 8 6 2Permitted Phases 4 8 6 2Detector Phase 4 4 8 8 6 6 2 2Switch PhaseMinimum Initial (s) 18.0 18.0 18.0 18.0 31.0 31.0 31.0 31.0Minimum Split (s) 23.5 23.5 23.5 23.5 36.5 36.5 36.5 36.5Total Split (s) 23.5 23.5 0.0 23.5 23.5 0.0 36.5 36.5 0.0 36.5 36.5 0.0Total Split (%) 39.2% 39.2% 0.0% 39.2% 39.2% 0.0% 60.8% 60.8% 0.0% 60.8% 60.8% 0.0%Maximum Green (s) 18.0 18.0 18.0 18.0 31.0 31.0 31.0 31.0Yellow Time (s) 4.0 4.0 4.0 4.0 4.0 4.0 4.0 4.0All-Red Time (s) 1.5 1.5 1.5 1.5 1.5 1.5 1.5 1.5Lost Time Adjust (s) 0.0 0.0 0.0 0.0 0.0 0.0 0.0 0.0 0.0 0.0 0.0 0.0Total Lost Time (s) 5.5 5.5 4.0 5.5 5.5 4.0 5.5 5.5 4.0 5.5 5.5 4.0Lead/LagLead-Lag Optimize?Vehicle Extension (s) 3.0 3.0 3.0 3.0 3.0 3.0 3.0 3.0Recall Mode Max Max Max Max C-Max C-Max C-Max C-MaxWalk Time (s) 7.0 7.0 7.0 7.0 21.0 21.0 21.0 21.0Flash Dont Walk (s) 11.0 11.0 11.0 11.0 10.0 10.0 10.0 10.0Pedestrian Calls (#/hr) 0 0 0 0 0 0 0 0v/c Ratio 0.48 0.55 0.16 0.67 0.07 0.32Control Delay 19.5 23.3 9.0 12.7 8.9 8.6Queue Delay 0.0 0.0 0.0 0.0 0.0 0.0Total Delay 19.5 23.3 9.0 12.7 8.9 8.690th %ile Green (s) 18.0 18.0 18.0 18.0 31.0 31.0 31.0 31.0
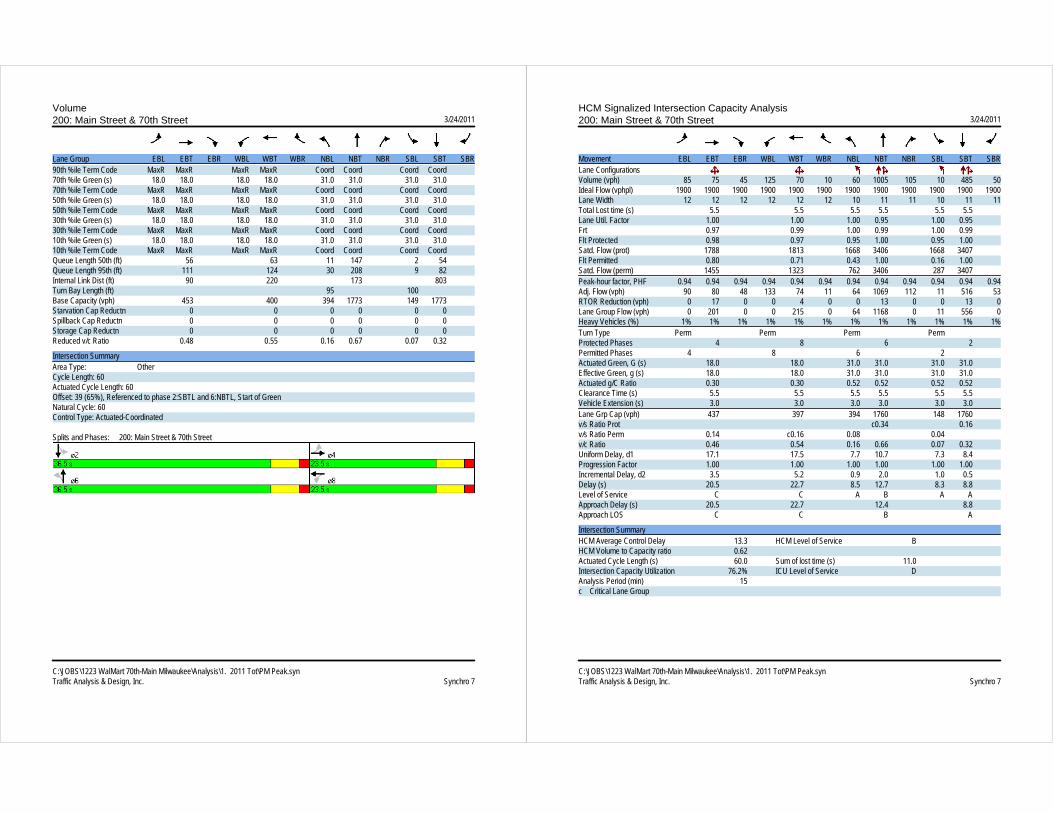
Volume200: Main Street & 70th Street 3/24/2011
C:\JOBS\1223 WalMart 70th-Main Milwaukee\Analysis\1. 2011 Tot\PM Peak.synTraffic Analysis & Design, Inc. Synchro 7
Lane Group EBL EBT EBR WBL WBT WBR NBL NBT NBR SBL SBT SBR90th %ile Term Code MaxR MaxR MaxR MaxR Coord Coord Coord Coord70th %ile Green (s) 18.0 18.0 18.0 18.0 31.0 31.0 31.0 31.070th %ile Term Code MaxR MaxR MaxR MaxR Coord Coord Coord Coord50th %ile Green (s) 18.0 18.0 18.0 18.0 31.0 31.0 31.0 31.050th %ile Term Code MaxR MaxR MaxR MaxR Coord Coord Coord Coord30th %ile Green (s) 18.0 18.0 18.0 18.0 31.0 31.0 31.0 31.030th %ile Term Code MaxR MaxR MaxR MaxR Coord Coord Coord Coord10th %ile Green (s) 18.0 18.0 18.0 18.0 31.0 31.0 31.0 31.010th %ile Term Code MaxR MaxR MaxR MaxR Coord Coord Coord CoordQueue Length 50th (ft) 56 63 11 147 2 54Queue Length 95th (ft) 111 124 30 208 9 82Internal Link Dist (ft) 90 220 173 803Turn Bay Length (ft) 95 100Base Capacity (vph) 453 400 394 1773 149 1773Starvation Cap Reductn 0 0 0 0 0 0Spillback Cap Reductn 0 0 0 0 0 0Storage Cap Reductn 0 0 0 0 0 0Reduced v/c Ratio 0.48 0.55 0.16 0.67 0.07 0.32
Intersection SummaryArea Type: OtherCycle Length: 60Actuated Cycle Length: 60Offset: 39 (65%), Referenced to phase 2:SBTL and 6:NBTL, Start of GreenNatural Cycle: 60Control Type: Actuated-Coordinated
Splits and Phases: 200: Main Street & 70th Street
HCM Signalized Intersection Capacity Analysis200: Main Street & 70th Street 3/24/2011
C:\JOBS\1223 WalMart 70th-Main Milwaukee\Analysis\1. 2011 Tot\PM Peak.synTraffic Analysis & Design, Inc. Synchro 7
Movement EBL EBT EBR WBL WBT WBR NBL NBT NBR SBL SBT SBRLane ConfigurationsVolume (vph) 85 75 45 125 70 10 60 1005 105 10 485 50Ideal Flow (vphpl) 1900 1900 1900 1900 1900 1900 1900 1900 1900 1900 1900 1900Lane Width 12 12 12 12 12 12 10 11 11 10 11 11Total Lost time (s) 5.5 5.5 5.5 5.5 5.5 5.5Lane Util. Factor 1.00 1.00 1.00 0.95 1.00 0.95Frt 0.97 0.99 1.00 0.99 1.00 0.99Flt Protected 0.98 0.97 0.95 1.00 0.95 1.00Satd. Flow (prot) 1788 1813 1668 3406 1668 3407Flt Permitted 0.80 0.71 0.43 1.00 0.16 1.00Satd. Flow (perm) 1455 1323 762 3406 287 3407Peak-hour factor, PHF 0.94 0.94 0.94 0.94 0.94 0.94 0.94 0.94 0.94 0.94 0.94 0.94Adj. Flow (vph) 90 80 48 133 74 11 64 1069 112 11 516 53RTOR Reduction (vph) 0 17 0 0 4 0 0 13 0 0 13 0Lane Group Flow (vph) 0 201 0 0 215 0 64 1168 0 11 556 0Heavy Vehicles (%) 1% 1% 1% 1% 1% 1% 1% 1% 1% 1% 1% 1%Turn Type Perm Perm Perm PermProtected Phases 4 8 6 2Permitted Phases 4 8 6 2Actuated Green, G (s) 18.0 18.0 31.0 31.0 31.0 31.0Effective Green, g (s) 18.0 18.0 31.0 31.0 31.0 31.0Actuated g/C Ratio 0.30 0.30 0.52 0.52 0.52 0.52Clearance Time (s) 5.5 5.5 5.5 5.5 5.5 5.5Vehicle Extension (s) 3.0 3.0 3.0 3.0 3.0 3.0Lane Grp Cap (vph) 437 397 394 1760 148 1760v/s Ratio Prot c0.34 0.16v/s Ratio Perm 0.14 c0.16 0.08 0.04v/c Ratio 0.46 0.54 0.16 0.66 0.07 0.32Uniform Delay, d1 17.1 17.5 7.7 10.7 7.3 8.4Progression Factor 1.00 1.00 1.00 1.00 1.00 1.00Incremental Delay, d2 3.5 5.2 0.9 2.0 1.0 0.5Delay (s) 20.5 22.7 8.5 12.7 8.3 8.8Level of Service C C A B A AApproach Delay (s) 20.5 22.7 12.4 8.8Approach LOS C C B A
Intersection SummaryHCM Average Control Delay 13.3 HCM Level of Service BHCM Volume to Capacity ratio 0.62Actuated Cycle Length (s) 60.0 Sum of lost time (s) 11.0Intersection Capacity Utilization 76.2% ICU Level of Service DAnalysis Period (min) 15c Critical Lane Group

Volume210: Proposed North Access & 70th Street 3/24/2011
C:\JOBS\1223 WalMart 70th-Main Milwaukee\Analysis\1. 2011 Tot\PM Peak.synTraffic Analysis & Design, Inc. Synchro 7
Lane Group EBL EBR NBL NBT SBT SBRLane ConfigurationsVolume (vph) 45 30 40 1160 615 35Ideal Flow (vphpl) 1900 1900 1900 1900 1900 1900Lane Width (ft) 12 12 11 11 11 11Lane Util. Factor 1.00 1.00 0.95 0.95 0.95 0.95Frt 0.946 0.992Flt Protected 0.971 0.998Satd. Flow (prot) 1728 0 0 3448 3427 0Flt Permitted 0.971 0.998Satd. Flow (perm) 1728 0 0 3448 3427 0Link Speed (mph) 25 30 30Link Distance (ft) 165 240 253Travel Time (s) 4.5 5.5 5.8Peak Hour Factor 0.94 0.94 0.94 0.94 0.94 0.94Heavy Vehicles (%) 1% 1% 1% 1% 1% 1%Adj. Flow (vph) 48 32 43 1234 654 37Shared Lane Traffic (%)Lane Group Flow (vph) 80 0 0 1277 691 0Sign Control Stop Free Free
Intersection SummaryArea Type: OtherControl Type: Unsignalized
HCM Unsignalized Intersection Capacity Analysis210: Proposed North Access & 70th Street 3/24/2011
C:\JOBS\1223 WalMart 70th-Main Milwaukee\Analysis\1. 2011 Tot\PM Peak.synTraffic Analysis & Design, Inc. Synchro 7
Movement EBL EBR NBL NBT SBT SBRLane ConfigurationsVolume (veh/h) 45 30 40 1160 615 35Sign Control Stop Free FreeGrade 0% 0% 0%Peak Hour Factor 0.94 0.94 0.94 0.94 0.94 0.94Hourly flow rate (vph) 48 32 43 1234 654 37PedestriansLane Width (ft)Walking Speed (ft/s)Percent BlockageRight turn flare (veh)Median type None NoneMedian storage veh)Upstream signal (ft) 253pX, platoon unblocked 0.93 0.93 0.93vC, conflicting volume 1375 346 691vC1, stage 1 conf volvC2, stage 2 conf volvCu, unblocked vol 1250 141 513tC, single (s) 6.8 6.9 4.1tC, 2 stage (s)tF (s) 3.5 3.3 2.2p0 queue free % 68 96 96cM capacity (veh/h) 148 821 980
Direction, Lane # EB 1 NB 1 NB 2 SB 1 SB 2Volume Total 80 454 823 436 255Volume Left 48 43 0 0 0Volume Right 32 0 0 0 37cSH 220 980 1700 1700 1700Volume to Capacity 0.36 0.04 0.48 0.26 0.15Queue Length 95th (ft) 39 3 0 0 0Control Delay (s) 30.4 1.3 0.0 0.0 0.0Lane LOS D AApproach Delay (s) 30.4 0.5 0.0Approach LOS D
Intersection SummaryAverage Delay 1.5Intersection Capacity Utilization 65.7% ICU Level of Service CAnalysis Period (min) 15

Volume220: Proposed South Access & 70th Street 3/24/2011
C:\JOBS\1223 WalMart 70th-Main Milwaukee\Analysis\1. 2011 Tot\PM Peak.synTraffic Analysis & Design, Inc. Synchro 7
Lane Group EBL EBT EBR WBL WBT WBR NBL NBT NBR SBL SBT SBRLane ConfigurationsVolume (vph) 1 1 25 5 1 5 30 1195 60 5 635 5Ideal Flow (vphpl) 1900 1900 1900 1900 1900 1900 1900 1900 1900 1900 1900 1900Lane Width (ft) 12 12 12 12 12 12 11 11 11 11 11 11Lane Util. Factor 1.00 1.00 1.00 1.00 1.00 1.00 0.95 0.95 0.95 0.95 0.95 0.95Frt 0.874 0.939 0.993 0.999Flt Protected 0.998 0.978 0.999Satd. Flow (prot) 0 1641 0 0 1728 0 0 3427 0 0 3452 0Flt Permitted 0.998 0.978 0.999Satd. Flow (perm) 0 1641 0 0 1728 0 0 3427 0 0 3452 0Link Speed (mph) 25 25 30 30Link Distance (ft) 165 300 512 240Travel Time (s) 4.5 8.2 11.6 5.5Peak Hour Factor 0.92 0.92 0.92 0.92 0.92 0.92 0.92 0.92 0.92 0.92 0.92 0.92Heavy Vehicles (%) 1% 1% 1% 1% 1% 1% 1% 1% 1% 1% 1% 1%Adj. Flow (vph) 1 1 27 5 1 5 33 1299 65 5 690 5Shared Lane Traffic (%)Lane Group Flow (vph) 0 29 0 0 11 0 0 1397 0 0 700 0Sign Control Stop Stop Free Free
Intersection SummaryArea Type: OtherControl Type: Unsignalized
HCM Unsignalized Intersection Capacity Analysis220: Proposed South Access & 70th Street 3/24/2011
C:\JOBS\1223 WalMart 70th-Main Milwaukee\Analysis\1. 2011 Tot\PM Peak.synTraffic Analysis & Design, Inc. Synchro 7
Movement EBL EBT EBR WBL WBT WBR NBL NBT NBR SBL SBT SBRLane ConfigurationsVolume (veh/h) 1 1 25 5 1 5 30 1195 60 5 635 5Sign Control Stop Stop Free FreeGrade 0% 0% 0% 0%Peak Hour Factor 0.92 0.92 0.92 0.92 0.92 0.92 0.92 0.92 0.92 0.92 0.92 0.92Hourly flow rate (vph) 1 1 27 5 1 5 33 1299 65 5 690 5PedestriansLane Width (ft)Walking Speed (ft/s)Percent BlockageRight turn flare (veh)Median type None NoneMedian storage veh)Upstream signal (ft) 493pX, platoon unblocked 0.98 0.98 0.98 0.98 0.98 0.98vC, conflicting volume 1424 2133 348 1780 2103 682 696 1364vC1, stage 1 conf volvC2, stage 2 conf volvCu, unblocked vol 1399 2119 304 1760 2089 682 658 1364tC, single (s) 7.5 6.5 6.9 7.5 6.5 6.9 4.1 4.1tC, 2 stage (s)tF (s) 3.5 4.0 3.3 3.5 4.0 3.3 2.2 2.2p0 queue free % 99 98 96 89 98 99 96 99cM capacity (veh/h) 93 47 683 49 49 395 917 505
Direction, Lane # EB 1 WB 1 NB 1 NB 2 SB 1 SB 2Volume Total 29 12 682 715 351 351Volume Left 1 5 33 0 5 0Volume Right 27 5 0 65 0 5cSH 394 81 917 1700 505 1700Volume to Capacity 0.07 0.15 0.04 0.42 0.01 0.21Queue Length 95th (ft) 6 12 3 0 1 0Control Delay (s) 14.9 57.0 0.9 0.0 0.4 0.0Lane LOS B F A AApproach Delay (s) 14.9 57.0 0.5 0.2Approach LOS B F
Intersection SummaryAverage Delay 0.9Intersection Capacity Utilization 66.6% ICU Level of Service CAnalysis Period (min) 15

Volume100: Main Street & 76th Street 3/24/2011
C:\JOBS\1223 WalMart 70th-Main Milwaukee\Analysis\1. 2011 Tot\SAT Peak.synTraffic Analysis & Design, Inc. Synchro 7
Lane Group EBL EBT EBR WBL WBT WBR NBL NBT NBR SBL SBT SBRLane ConfigurationsVolume (vph) 20 25 40 75 25 60 15 255 60 45 235 25Ideal Flow (vphpl) 1900 1900 1900 1900 1900 1900 1900 1900 1900 1900 1900 1900Lane Width (ft) 12 12 12 12 12 12 11 11 11 11 11 11Lane Util. Factor 1.00 1.00 1.00 1.00 1.00 1.00 0.95 0.95 0.95 0.95 0.95 0.95Frt 0.936 0.949 0.973 0.988Flt Protected 0.989 0.977 0.998 0.993Satd. Flow (prot) 0 1741 0 0 1727 0 0 3355 0 0 3390 0Flt Permitted 0.894 0.806 0.937 0.869Satd. Flow (perm) 0 1574 0 0 1425 0 0 3150 0 0 2966 0Right Turn on Red Yes Yes Yes YesSatd. Flow (RTOR) 43 54 60 21Link Speed (mph) 20 25 30 30Link Distance (ft) 338 338 579 529Travel Time (s) 11.5 9.2 13.2 12.0Peak Hour Factor 0.94 0.94 0.94 0.94 0.94 0.94 0.94 0.94 0.94 0.94 0.94 0.94Heavy Vehicles (%) 1% 1% 1% 2% 2% 2% 1% 1% 1% 1% 1% 1%Adj. Flow (vph) 21 27 43 80 27 64 16 271 64 48 250 27Shared Lane Traffic (%)Lane Group Flow (vph) 0 91 0 0 171 0 0 351 0 0 325 0Turn Type Perm Perm Perm PermProtected Phases 4 8 6 2Permitted Phases 4 8 6 2Detector Phase 4 4 8 8 6 6 2 2Switch PhaseMinimum Initial (s) 10.0 10.0 10.0 10.0 14.0 14.0 14.0 14.0Minimum Split (s) 16.0 16.0 16.0 16.0 19.5 19.5 19.5 19.5Total Split (s) 26.0 26.0 0.0 26.0 26.0 0.0 34.0 34.0 0.0 34.0 34.0 0.0Total Split (%) 43.3% 43.3% 0.0% 43.3% 43.3% 0.0% 56.7% 56.7% 0.0% 56.7% 56.7% 0.0%Maximum Green (s) 20.0 20.0 20.0 20.0 28.5 28.5 28.5 28.5Yellow Time (s) 3.5 3.5 3.5 3.5 4.0 4.0 4.0 4.0All-Red Time (s) 2.5 2.5 2.5 2.5 1.5 1.5 1.5 1.5Lost Time Adjust (s) 0.0 0.0 0.0 0.0 0.0 0.0 0.0 0.0 0.0 0.0 0.0 0.0Total Lost Time (s) 6.0 6.0 4.0 6.0 6.0 4.0 5.5 5.5 4.0 5.5 5.5 4.0Lead/LagLead-Lag Optimize?Vehicle Extension (s) 3.0 3.0 3.0 3.0 3.0 3.0 3.0 3.0Recall Mode None None None None C-Max C-Max C-Max C-MaxWalk Time (s) 7.0 7.0 7.0 7.0 7.0 7.0Flash Dont Walk (s) 13.0 13.0 7.0 7.0 7.0 7.0Pedestrian Calls (#/hr) 0 0 0 0 0 0v/c Ratio 0.27 0.53 0.16 0.16Control Delay 13.9 20.8 4.5 5.1Queue Delay 0.0 0.0 0.0 0.0Total Delay 13.9 20.8 4.5 5.190th %ile Green (s) 15.8 15.8 15.8 15.8 32.7 32.7 32.7 32.790th %ile Term Code Hold Hold Gap Gap Coord Coord Coord Coord70th %ile Green (s) 12.6 12.6 12.6 12.6 35.9 35.9 35.9 35.970th %ile Term Code Hold Hold Gap Gap Coord Coord Coord Coord
Volume100: Main Street & 76th Street 3/24/2011
C:\JOBS\1223 WalMart 70th-Main Milwaukee\Analysis\1. 2011 Tot\SAT Peak.synTraffic Analysis & Design, Inc. Synchro 7
Lane Group EBL EBT EBR WBL WBT WBR NBL NBT NBR SBL SBT SBR50th %ile Green (s) 10.3 10.3 10.3 10.3 38.2 38.2 38.2 38.250th %ile Term Code Hold Hold Gap Gap Coord Coord Coord Coord30th %ile Green (s) 10.0 10.0 10.0 10.0 38.5 38.5 38.5 38.530th %ile Term Code Min Min Min Min Coord Coord Coord Coord10th %ile Green (s) 0.0 0.0 0.0 0.0 54.5 54.5 54.5 54.510th %ile Term Code Skip Skip Skip Skip Coord Coord Coord CoordQueue Length 50th (ft) 15 39 18 19Queue Length 95th (ft) 44 82 43 44Internal Link Dist (ft) 258 258 499 449Turn Bay Length (ft)Base Capacity (vph) 553 511 2175 2036Starvation Cap Reductn 0 0 0 0Spillback Cap Reductn 0 0 0 0Storage Cap Reductn 0 0 0 0Reduced v/c Ratio 0.16 0.33 0.16 0.16
Intersection SummaryArea Type: OtherCycle Length: 60Actuated Cycle Length: 60Offset: 49 (82%), Referenced to phase 2:SBTL and 6:NBTL, Start of GreenNatural Cycle: 40Control Type: Actuated-Coordinated
Splits and Phases: 100: Main Street & 76th Street

HCM Signalized Intersection Capacity Analysis100: Main Street & 76th Street 3/24/2011
C:\JOBS\1223 WalMart 70th-Main Milwaukee\Analysis\1. 2011 Tot\SAT Peak.synTraffic Analysis & Design, Inc. Synchro 7
Movement EBL EBT EBR WBL WBT WBR NBL NBT NBR SBL SBT SBRLane ConfigurationsVolume (vph) 20 25 40 75 25 60 15 255 60 45 235 25Ideal Flow (vphpl) 1900 1900 1900 1900 1900 1900 1900 1900 1900 1900 1900 1900Lane Width 12 12 12 12 12 12 11 11 11 11 11 11Total Lost time (s) 6.0 6.0 5.5 5.5Lane Util. Factor 1.00 1.00 0.95 0.95Frt 0.94 0.95 0.97 0.99Flt Protected 0.99 0.98 1.00 0.99Satd. Flow (prot) 1741 1728 3353 3387Flt Permitted 0.89 0.81 0.94 0.87Satd. Flow (perm) 1574 1425 3148 2965Peak-hour factor, PHF 0.94 0.94 0.94 0.94 0.94 0.94 0.94 0.94 0.94 0.94 0.94 0.94Adj. Flow (vph) 21 27 43 80 27 64 16 271 64 48 250 27RTOR Reduction (vph) 0 36 0 0 45 0 0 21 0 0 7 0Lane Group Flow (vph) 0 55 0 0 126 0 0 330 0 0 318 0Heavy Vehicles (%) 1% 1% 1% 2% 2% 2% 1% 1% 1% 1% 1% 1%Turn Type Perm Perm Perm PermProtected Phases 4 8 6 2Permitted Phases 4 8 6 2Actuated Green, G (s) 9.7 9.7 38.8 38.8Effective Green, g (s) 9.7 9.7 38.8 38.8Actuated g/C Ratio 0.16 0.16 0.65 0.65Clearance Time (s) 6.0 6.0 5.5 5.5Vehicle Extension (s) 3.0 3.0 3.0 3.0Lane Grp Cap (vph) 254 230 2036 1917v/s Ratio Protv/s Ratio Perm 0.03 c0.09 0.10 c0.11v/c Ratio 0.22 0.55 0.16 0.17Uniform Delay, d1 21.8 23.1 4.2 4.2Progression Factor 1.00 1.00 1.00 1.00Incremental Delay, d2 0.4 2.6 0.2 0.2Delay (s) 22.3 25.8 4.4 4.4Level of Service C C A AApproach Delay (s) 22.3 25.8 4.4 4.4Approach LOS C C A A
Intersection SummaryHCM Average Control Delay 10.0 HCM Level of Service BHCM Volume to Capacity ratio 0.24Actuated Cycle Length (s) 60.0 Sum of lost time (s) 11.5Intersection Capacity Utilization 53.3% ICU Level of Service AAnalysis Period (min) 15c Critical Lane Group
Volume110: Main Street & 75th Street 3/24/2011
C:\JOBS\1223 WalMart 70th-Main Milwaukee\Analysis\1. 2011 Tot\SAT Peak.synTraffic Analysis & Design, Inc. Synchro 7
Lane Group EBL EBT WBT WBR SBL SBRLane ConfigurationsVolume (vph) 5 125 155 1 5 5Ideal Flow (vphpl) 1900 1900 1900 1900 1900 1900Lane Util. Factor 1.00 1.00 1.00 1.00 1.00 1.00Frt 0.999 0.932Flt Protected 0.998 0.976Satd. Flow (prot) 0 1859 1861 0 1711 0Flt Permitted 0.998 0.976Satd. Flow (perm) 0 1859 1861 0 1711 0Link Speed (mph) 25 25 25Link Distance (ft) 338 319 300Travel Time (s) 9.2 8.7 8.2Peak Hour Factor 0.93 0.93 0.93 0.93 0.93 0.93Heavy Vehicles (%) 2% 2% 2% 2% 1% 1%Adj. Flow (vph) 5 134 167 1 5 5Shared Lane Traffic (%)Lane Group Flow (vph) 0 139 168 0 10 0Sign Control Free Free Stop
Intersection SummaryArea Type: OtherControl Type: Unsignalized
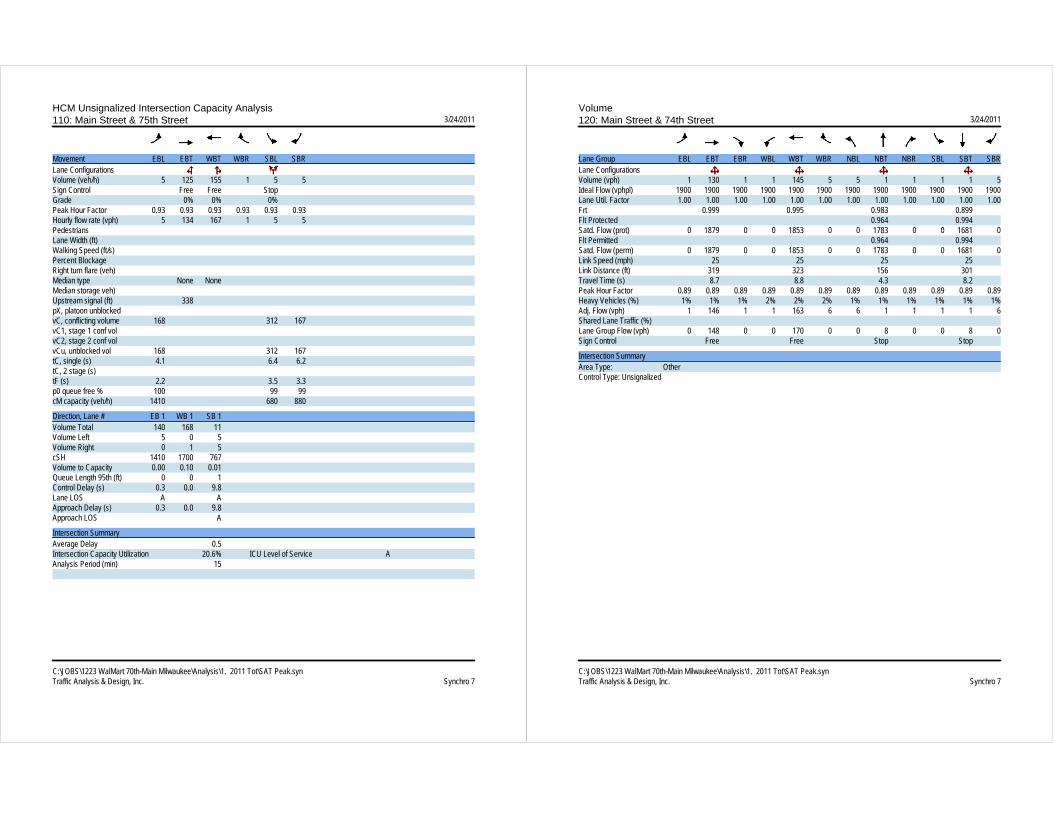
HCM Unsignalized Intersection Capacity Analysis110: Main Street & 75th Street 3/24/2011
C:\JOBS\1223 WalMart 70th-Main Milwaukee\Analysis\1. 2011 Tot\SAT Peak.synTraffic Analysis & Design, Inc. Synchro 7
Movement EBL EBT WBT WBR SBL SBRLane ConfigurationsVolume (veh/h) 5 125 155 1 5 5Sign Control Free Free StopGrade 0% 0% 0%Peak Hour Factor 0.93 0.93 0.93 0.93 0.93 0.93Hourly flow rate (vph) 5 134 167 1 5 5PedestriansLane Width (ft)Walking Speed (ft/s)Percent BlockageRight turn flare (veh)Median type None NoneMedian storage veh)Upstream signal (ft) 338pX, platoon unblockedvC, conflicting volume 168 312 167vC1, stage 1 conf volvC2, stage 2 conf volvCu, unblocked vol 168 312 167tC, single (s) 4.1 6.4 6.2tC, 2 stage (s)tF (s) 2.2 3.5 3.3p0 queue free % 100 99 99cM capacity (veh/h) 1410 680 880
Direction, Lane # EB 1 WB 1 SB 1Volume Total 140 168 11Volume Left 5 0 5Volume Right 0 1 5cSH 1410 1700 767Volume to Capacity 0.00 0.10 0.01Queue Length 95th (ft) 0 0 1Control Delay (s) 0.3 0.0 9.8Lane LOS A AApproach Delay (s) 0.3 0.0 9.8Approach LOS A
Intersection SummaryAverage Delay 0.5Intersection Capacity Utilization 20.6% ICU Level of Service AAnalysis Period (min) 15
Volume120: Main Street & 74th Street 3/24/2011
C:\JOBS\1223 WalMart 70th-Main Milwaukee\Analysis\1. 2011 Tot\SAT Peak.synTraffic Analysis & Design, Inc. Synchro 7
Lane Group EBL EBT EBR WBL WBT WBR NBL NBT NBR SBL SBT SBRLane ConfigurationsVolume (vph) 1 130 1 1 145 5 5 1 1 1 1 5Ideal Flow (vphpl) 1900 1900 1900 1900 1900 1900 1900 1900 1900 1900 1900 1900Lane Util. Factor 1.00 1.00 1.00 1.00 1.00 1.00 1.00 1.00 1.00 1.00 1.00 1.00Frt 0.999 0.995 0.983 0.899Flt Protected 0.964 0.994Satd. Flow (prot) 0 1879 0 0 1853 0 0 1783 0 0 1681 0Flt Permitted 0.964 0.994Satd. Flow (perm) 0 1879 0 0 1853 0 0 1783 0 0 1681 0Link Speed (mph) 25 25 25 25Link Distance (ft) 319 323 156 301Travel Time (s) 8.7 8.8 4.3 8.2Peak Hour Factor 0.89 0.89 0.89 0.89 0.89 0.89 0.89 0.89 0.89 0.89 0.89 0.89Heavy Vehicles (%) 1% 1% 1% 2% 2% 2% 1% 1% 1% 1% 1% 1%Adj. Flow (vph) 1 146 1 1 163 6 6 1 1 1 1 6Shared Lane Traffic (%)Lane Group Flow (vph) 0 148 0 0 170 0 0 8 0 0 8 0Sign Control Free Free Stop Stop
Intersection SummaryArea Type: OtherControl Type: Unsignalized
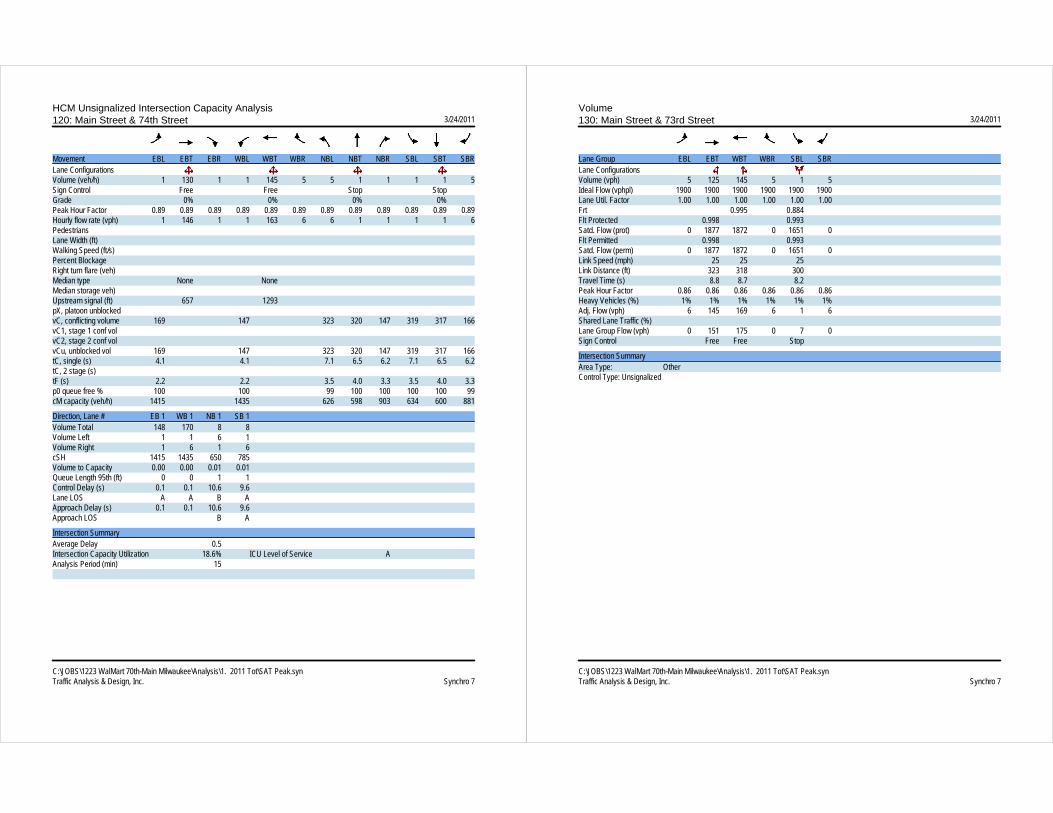
HCM Unsignalized Intersection Capacity Analysis120: Main Street & 74th Street 3/24/2011
C:\JOBS\1223 WalMart 70th-Main Milwaukee\Analysis\1. 2011 Tot\SAT Peak.synTraffic Analysis & Design, Inc. Synchro 7
Movement EBL EBT EBR WBL WBT WBR NBL NBT NBR SBL SBT SBRLane ConfigurationsVolume (veh/h) 1 130 1 1 145 5 5 1 1 1 1 5Sign Control Free Free Stop StopGrade 0% 0% 0% 0%Peak Hour Factor 0.89 0.89 0.89 0.89 0.89 0.89 0.89 0.89 0.89 0.89 0.89 0.89Hourly flow rate (vph) 1 146 1 1 163 6 6 1 1 1 1 6PedestriansLane Width (ft)Walking Speed (ft/s)Percent BlockageRight turn flare (veh)Median type None NoneMedian storage veh)Upstream signal (ft) 657 1293pX, platoon unblockedvC, conflicting volume 169 147 323 320 147 319 317 166vC1, stage 1 conf volvC2, stage 2 conf volvCu, unblocked vol 169 147 323 320 147 319 317 166tC, single (s) 4.1 4.1 7.1 6.5 6.2 7.1 6.5 6.2tC, 2 stage (s)tF (s) 2.2 2.2 3.5 4.0 3.3 3.5 4.0 3.3p0 queue free % 100 100 99 100 100 100 100 99cM capacity (veh/h) 1415 1435 626 598 903 634 600 881
Direction, Lane # EB 1 WB 1 NB 1 SB 1Volume Total 148 170 8 8Volume Left 1 1 6 1Volume Right 1 6 1 6cSH 1415 1435 650 785Volume to Capacity 0.00 0.00 0.01 0.01Queue Length 95th (ft) 0 0 1 1Control Delay (s) 0.1 0.1 10.6 9.6Lane LOS A A B AApproach Delay (s) 0.1 0.1 10.6 9.6Approach LOS B A
Intersection SummaryAverage Delay 0.5Intersection Capacity Utilization 18.6% ICU Level of Service AAnalysis Period (min) 15
Volume130: Main Street & 73rd Street 3/24/2011
C:\JOBS\1223 WalMart 70th-Main Milwaukee\Analysis\1. 2011 Tot\SAT Peak.synTraffic Analysis & Design, Inc. Synchro 7
Lane Group EBL EBT WBT WBR SBL SBRLane ConfigurationsVolume (vph) 5 125 145 5 1 5Ideal Flow (vphpl) 1900 1900 1900 1900 1900 1900Lane Util. Factor 1.00 1.00 1.00 1.00 1.00 1.00Frt 0.995 0.884Flt Protected 0.998 0.993Satd. Flow (prot) 0 1877 1872 0 1651 0Flt Permitted 0.998 0.993Satd. Flow (perm) 0 1877 1872 0 1651 0Link Speed (mph) 25 25 25Link Distance (ft) 323 318 300Travel Time (s) 8.8 8.7 8.2Peak Hour Factor 0.86 0.86 0.86 0.86 0.86 0.86Heavy Vehicles (%) 1% 1% 1% 1% 1% 1%Adj. Flow (vph) 6 145 169 6 1 6Shared Lane Traffic (%)Lane Group Flow (vph) 0 151 175 0 7 0Sign Control Free Free Stop
Intersection SummaryArea Type: OtherControl Type: Unsignalized

HCM Unsignalized Intersection Capacity Analysis130: Main Street & 73rd Street 3/24/2011
C:\JOBS\1223 WalMart 70th-Main Milwaukee\Analysis\1. 2011 Tot\SAT Peak.synTraffic Analysis & Design, Inc. Synchro 7
Movement EBL EBT WBT WBR SBL SBRLane ConfigurationsVolume (veh/h) 5 125 145 5 1 5Sign Control Free Free StopGrade 0% 0% 0%Peak Hour Factor 0.86 0.86 0.86 0.86 0.86 0.86Hourly flow rate (vph) 6 145 169 6 1 6PedestriansLane Width (ft)Walking Speed (ft/s)Percent BlockageRight turn flare (veh)Median type None NoneMedian storage veh)Upstream signal (ft) 980 970pX, platoon unblockedvC, conflicting volume 174 328 172vC1, stage 1 conf volvC2, stage 2 conf volvCu, unblocked vol 174 328 172tC, single (s) 4.1 6.4 6.2tC, 2 stage (s)tF (s) 2.2 3.5 3.3p0 queue free % 100 100 99cM capacity (veh/h) 1408 665 875
Direction, Lane # EB 1 WB 1 SB 1Volume Total 151 174 7Volume Left 6 0 1Volume Right 0 6 6cSH 1408 1700 831Volume to Capacity 0.00 0.10 0.01Queue Length 95th (ft) 0 0 1Control Delay (s) 0.3 0.0 9.4Lane LOS A AApproach Delay (s) 0.3 0.0 9.4Approach LOS A
Intersection SummaryAverage Delay 0.3Intersection Capacity Utilization 20.6% ICU Level of Service AAnalysis Period (min) 15
Volume140: Main Street & 72nd Street 3/24/2011
C:\JOBS\1223 WalMart 70th-Main Milwaukee\Analysis\1. 2011 Tot\SAT Peak.synTraffic Analysis & Design, Inc. Synchro 7
Lane Group EBL EBT EBR WBL WBT WBR NBL NBT NBR SBL SBT SBRLane ConfigurationsVolume (vph) 5 120 1 5 140 5 5 1 5 5 1 5Ideal Flow (vphpl) 1900 1900 1900 1900 1900 1900 1900 1900 1900 1900 1900 1900Lane Util. Factor 1.00 1.00 1.00 1.00 1.00 1.00 1.00 1.00 1.00 1.00 1.00 1.00Frt 0.999 0.995 0.938 0.938Flt Protected 0.998 0.998 0.977 0.977Satd. Flow (prot) 0 1876 0 0 1832 0 0 1527 0 0 1724 0Flt Permitted 0.998 0.998 0.977 0.977Satd. Flow (perm) 0 1876 0 0 1832 0 0 1527 0 0 1724 0Link Speed (mph) 25 25 25 25Link Distance (ft) 318 327 300 301Travel Time (s) 8.7 8.9 8.2 8.2Peak Hour Factor 0.84 0.84 0.84 0.84 0.84 0.84 0.84 0.84 0.84 0.84 0.84 0.84Heavy Vehicles (%) 1% 1% 1% 3% 3% 3% 14% 14% 14% 1% 1% 1%Adj. Flow (vph) 6 143 1 6 167 6 6 1 6 6 1 6Shared Lane Traffic (%)Lane Group Flow (vph) 0 150 0 0 179 0 0 13 0 0 13 0Sign Control Free Free Stop Stop
Intersection SummaryArea Type: OtherControl Type: Unsignalized
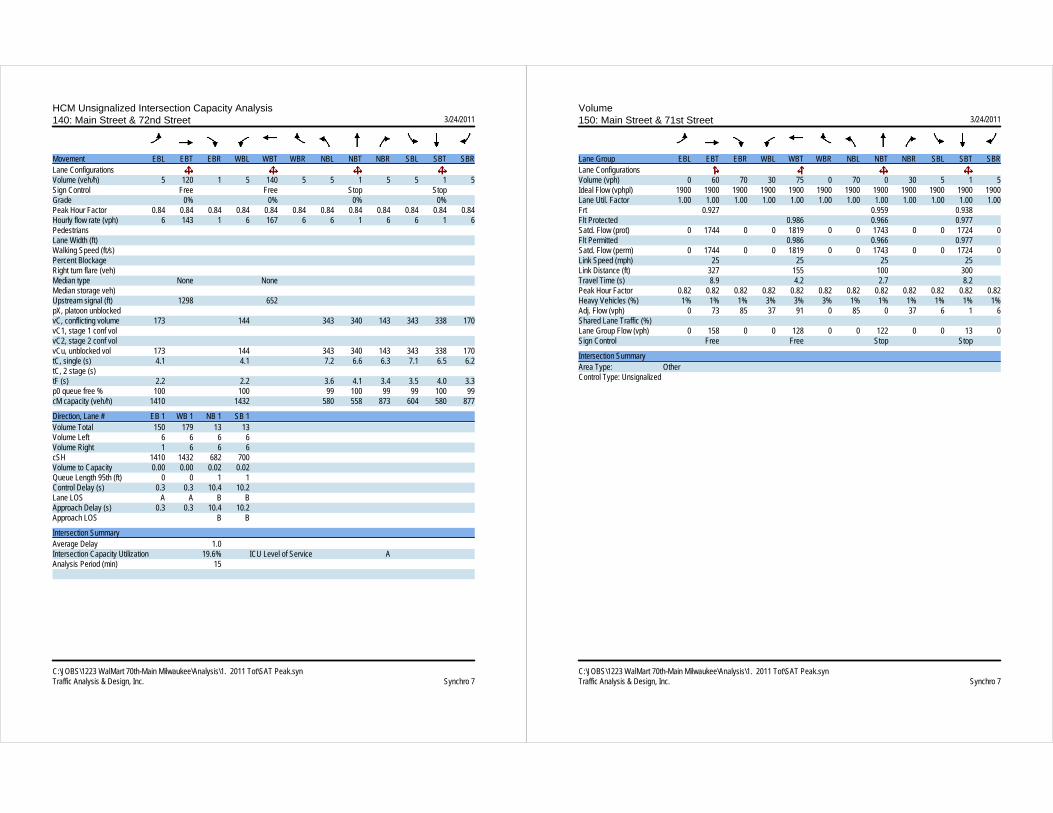
HCM Unsignalized Intersection Capacity Analysis140: Main Street & 72nd Street 3/24/2011
C:\JOBS\1223 WalMart 70th-Main Milwaukee\Analysis\1. 2011 Tot\SAT Peak.synTraffic Analysis & Design, Inc. Synchro 7
Movement EBL EBT EBR WBL WBT WBR NBL NBT NBR SBL SBT SBRLane ConfigurationsVolume (veh/h) 5 120 1 5 140 5 5 1 5 5 1 5Sign Control Free Free Stop StopGrade 0% 0% 0% 0%Peak Hour Factor 0.84 0.84 0.84 0.84 0.84 0.84 0.84 0.84 0.84 0.84 0.84 0.84Hourly flow rate (vph) 6 143 1 6 167 6 6 1 6 6 1 6PedestriansLane Width (ft)Walking Speed (ft/s)Percent BlockageRight turn flare (veh)Median type None NoneMedian storage veh)Upstream signal (ft) 1298 652pX, platoon unblockedvC, conflicting volume 173 144 343 340 143 343 338 170vC1, stage 1 conf volvC2, stage 2 conf volvCu, unblocked vol 173 144 343 340 143 343 338 170tC, single (s) 4.1 4.1 7.2 6.6 6.3 7.1 6.5 6.2tC, 2 stage (s)tF (s) 2.2 2.2 3.6 4.1 3.4 3.5 4.0 3.3p0 queue free % 100 100 99 100 99 99 100 99cM capacity (veh/h) 1410 1432 580 558 873 604 580 877
Direction, Lane # EB 1 WB 1 NB 1 SB 1Volume Total 150 179 13 13Volume Left 6 6 6 6Volume Right 1 6 6 6cSH 1410 1432 682 700Volume to Capacity 0.00 0.00 0.02 0.02Queue Length 95th (ft) 0 0 1 1Control Delay (s) 0.3 0.3 10.4 10.2Lane LOS A A B BApproach Delay (s) 0.3 0.3 10.4 10.2Approach LOS B B
Intersection SummaryAverage Delay 1.0Intersection Capacity Utilization 19.6% ICU Level of Service AAnalysis Period (min) 15
Volume150: Main Street & 71st Street 3/24/2011
C:\JOBS\1223 WalMart 70th-Main Milwaukee\Analysis\1. 2011 Tot\SAT Peak.synTraffic Analysis & Design, Inc. Synchro 7
Lane Group EBL EBT EBR WBL WBT WBR NBL NBT NBR SBL SBT SBRLane ConfigurationsVolume (vph) 0 60 70 30 75 0 70 0 30 5 1 5Ideal Flow (vphpl) 1900 1900 1900 1900 1900 1900 1900 1900 1900 1900 1900 1900Lane Util. Factor 1.00 1.00 1.00 1.00 1.00 1.00 1.00 1.00 1.00 1.00 1.00 1.00Frt 0.927 0.959 0.938Flt Protected 0.986 0.966 0.977Satd. Flow (prot) 0 1744 0 0 1819 0 0 1743 0 0 1724 0Flt Permitted 0.986 0.966 0.977Satd. Flow (perm) 0 1744 0 0 1819 0 0 1743 0 0 1724 0Link Speed (mph) 25 25 25 25Link Distance (ft) 327 155 100 300Travel Time (s) 8.9 4.2 2.7 8.2Peak Hour Factor 0.82 0.82 0.82 0.82 0.82 0.82 0.82 0.82 0.82 0.82 0.82 0.82Heavy Vehicles (%) 1% 1% 1% 3% 3% 3% 1% 1% 1% 1% 1% 1%Adj. Flow (vph) 0 73 85 37 91 0 85 0 37 6 1 6Shared Lane Traffic (%)Lane Group Flow (vph) 0 158 0 0 128 0 0 122 0 0 13 0Sign Control Free Free Stop Stop
Intersection SummaryArea Type: OtherControl Type: Unsignalized

HCM Unsignalized Intersection Capacity Analysis150: Main Street & 71st Street 3/24/2011
C:\JOBS\1223 WalMart 70th-Main Milwaukee\Analysis\1. 2011 Tot\SAT Peak.synTraffic Analysis & Design, Inc. Synchro 7
Movement EBL EBT EBR WBL WBT WBR NBL NBT NBR SBL SBT SBRLane ConfigurationsVolume (veh/h) 0 60 70 30 75 0 70 0 30 5 1 5Sign Control Free Free Stop StopGrade 0% 0% 0% 0%Peak Hour Factor 0.82 0.82 0.82 0.82 0.82 0.82 0.82 0.82 0.82 0.82 0.82 0.82Hourly flow rate (vph) 0 73 85 37 91 0 85 0 37 6 1 6PedestriansLane Width (ft)Walking Speed (ft/s)Percent BlockageRight turn flare (veh)Median type None NoneMedian storage veh)Upstream signal (ft) 325pX, platoon unblockedvC, conflicting volume 91 159 287 280 116 317 323 91vC1, stage 1 conf volvC2, stage 2 conf volvCu, unblocked vol 91 159 287 280 116 317 323 91tC, single (s) 4.1 4.1 7.1 6.5 6.2 7.1 6.5 6.2tC, 2 stage (s)tF (s) 2.2 2.2 3.5 4.0 3.3 3.5 4.0 3.3p0 queue free % 100 97 87 100 96 99 100 99cM capacity (veh/h) 1510 1415 649 613 939 601 581 969
Direction, Lane # EB 1 WB 1 NB 1 SB 1Volume Total 159 128 122 13Volume Left 0 37 85 6Volume Right 85 0 37 6cSH 1700 1415 715 723Volume to Capacity 0.09 0.03 0.17 0.02Queue Length 95th (ft) 0 2 15 1Control Delay (s) 0.0 2.3 11.1 10.1Lane LOS A B BApproach Delay (s) 0.0 2.3 11.1 10.1Approach LOS B B
Intersection SummaryAverage Delay 4.2Intersection Capacity Utilization 31.9% ICU Level of Service AAnalysis Period (min) 15
Volume160: Main Street & Alley 3/24/2011
C:\JOBS\1223 WalMart 70th-Main Milwaukee\Analysis\1. 2011 Tot\SAT Peak.synTraffic Analysis & Design, Inc. Synchro 7
Lane Group EBT EBR WBL WBT NBL NBRLane ConfigurationsVolume (vph) 90 5 5 100 5 10Ideal Flow (vphpl) 1900 1900 1900 1900 1900 1900Lane Util. Factor 1.00 1.00 1.00 1.00 1.00 1.00Frt 0.993 0.910Flt Protected 0.998 0.984Satd. Flow (prot) 1868 0 0 1841 1684 0Flt Permitted 0.998 0.984Satd. Flow (perm) 1868 0 0 1841 1684 0Link Speed (mph) 25 25 25Link Distance (ft) 155 170 141Travel Time (s) 4.2 4.6 3.8Peak Hour Factor 0.82 0.82 0.82 0.82 0.82 0.82Heavy Vehicles (%) 1% 1% 3% 3% 1% 1%Adj. Flow (vph) 110 6 6 122 6 12Shared Lane Traffic (%)Lane Group Flow (vph) 116 0 0 128 18 0Sign Control Free Free Stop
Intersection SummaryArea Type: OtherControl Type: Unsignalized

HCM Unsignalized Intersection Capacity Analysis160: Main Street & Alley 3/24/2011
C:\JOBS\1223 WalMart 70th-Main Milwaukee\Analysis\1. 2011 Tot\SAT Peak.synTraffic Analysis & Design, Inc. Synchro 7
Movement EBT EBR WBL WBT NBL NBRLane ConfigurationsVolume (veh/h) 90 5 5 100 5 10Sign Control Free Free StopGrade 0% 0% 0%Peak Hour Factor 0.82 0.82 0.82 0.82 0.82 0.82Hourly flow rate (vph) 110 6 6 122 6 12PedestriansLane Width (ft)Walking Speed (ft/s)Percent BlockageRight turn flare (veh)Median type None NoneMedian storage veh)Upstream signal (ft) 170pX, platoon unblockedvC, conflicting volume 116 247 113vC1, stage 1 conf volvC2, stage 2 conf volvCu, unblocked vol 116 247 113tC, single (s) 4.1 6.4 6.2tC, 2 stage (s)tF (s) 2.2 3.5 3.3p0 queue free % 100 99 99cM capacity (veh/h) 1467 741 943
Direction, Lane # EB 1 WB 1 NB 1Volume Total 116 128 18Volume Left 0 6 6Volume Right 6 0 12cSH 1700 1467 864Volume to Capacity 0.07 0.00 0.02Queue Length 95th (ft) 0 0 2Control Delay (s) 0.0 0.4 9.3Lane LOS A AApproach Delay (s) 0.0 0.4 9.3Approach LOS A
Intersection SummaryAverage Delay 0.8Intersection Capacity Utilization 19.3% ICU Level of Service AAnalysis Period (min) 15
Volume200: Main Street & 70th Street 3/24/2011
C:\JOBS\1223 WalMart 70th-Main Milwaukee\Analysis\1. 2011 Tot\SAT Peak.synTraffic Analysis & Design, Inc. Synchro 7
Lane Group EBL EBT EBR WBL WBT WBR NBL NBT NBR SBL SBT SBRLane ConfigurationsVolume (vph) 55 45 40 75 30 15 35 350 65 5 380 70Ideal Flow (vphpl) 1900 1900 1900 1900 1900 1900 1900 1900 1900 1900 1900 1900Lane Width (ft) 12 12 12 12 12 12 10 11 11 10 11 11Storage Length (ft) 0 0 0 0 95 0 100 0Storage Lanes 0 0 0 0 1 0 1 0Taper Length (ft) 50 50 50 50 50 50 50 50Lane Util. Factor 1.00 1.00 1.00 1.00 1.00 1.00 1.00 0.95 0.95 1.00 0.95 0.95Frt 0.962 0.983 0.977 0.977Flt Protected 0.981 0.970 0.950 0.950Satd. Flow (prot) 0 1775 0 0 1794 0 1652 3343 0 1668 3376 0Flt Permitted 0.833 0.766 0.466 0.484Satd. Flow (perm) 0 1507 0 0 1416 0 810 3343 0 850 3376 0Right Turn on Red Yes Yes Yes YesSatd. Flow (RTOR) 34 12 53 52Link Speed (mph) 25 25 30 30Link Distance (ft) 170 300 253 883Travel Time (s) 4.6 8.2 5.8 20.1Peak Hour Factor 0.89 0.89 0.89 0.89 0.89 0.89 0.89 0.89 0.89 0.89 0.89 0.89Heavy Vehicles (%) 1% 1% 1% 1% 1% 1% 2% 2% 2% 1% 1% 1%Adj. Flow (vph) 62 51 45 84 34 17 39 393 73 6 427 79Shared Lane Traffic (%)Lane Group Flow (vph) 0 158 0 0 135 0 39 466 0 6 506 0Turn Type Perm Perm Perm PermProtected Phases 4 8 6 2Permitted Phases 4 8 6 2Detector Phase 4 4 8 8 6 6 2 2Switch PhaseMinimum Initial (s) 18.0 18.0 18.0 18.0 31.0 31.0 31.0 31.0Minimum Split (s) 23.5 23.5 23.5 23.5 36.5 36.5 36.5 36.5Total Split (s) 23.5 23.5 0.0 23.5 23.5 0.0 36.5 36.5 0.0 36.5 36.5 0.0Total Split (%) 39.2% 39.2% 0.0% 39.2% 39.2% 0.0% 60.8% 60.8% 0.0% 60.8% 60.8% 0.0%Maximum Green (s) 18.0 18.0 18.0 18.0 31.0 31.0 31.0 31.0Yellow Time (s) 4.0 4.0 4.0 4.0 4.0 4.0 4.0 4.0All-Red Time (s) 1.5 1.5 1.5 1.5 1.5 1.5 1.5 1.5Lost Time Adjust (s) 0.0 0.0 0.0 0.0 0.0 0.0 0.0 0.0 0.0 0.0 0.0 0.0Total Lost Time (s) 5.5 5.5 4.0 5.5 5.5 4.0 5.5 5.5 4.0 5.5 5.5 4.0Lead/LagLead-Lag Optimize?Vehicle Extension (s) 3.0 3.0 3.0 3.0 3.0 3.0 3.0 3.0Recall Mode Max Max Max Max C-Max C-Max C-Max C-MaxWalk Time (s) 7.0 7.0 7.0 7.0 21.0 21.0 21.0 21.0Flash Dont Walk (s) 11.0 11.0 11.0 11.0 10.0 10.0 10.0 10.0Pedestrian Calls (#/hr) 0 0 0 0 0 0 0 0v/c Ratio 0.33 0.31 0.09 0.27 0.01 0.29Control Delay 15.1 17.2 8.1 7.5 7.2 7.8Queue Delay 0.0 0.0 0.0 0.0 0.0 0.0Total Delay 15.1 17.2 8.1 7.5 7.2 7.890th %ile Green (s) 18.0 18.0 18.0 18.0 31.0 31.0 31.0 31.0

Volume200: Main Street & 70th Street 3/24/2011
C:\JOBS\1223 WalMart 70th-Main Milwaukee\Analysis\1. 2011 Tot\SAT Peak.synTraffic Analysis & Design, Inc. Synchro 7
Lane Group EBL EBT EBR WBL WBT WBR NBL NBT NBR SBL SBT SBR90th %ile Term Code MaxR MaxR MaxR MaxR Coord Coord Coord Coord70th %ile Green (s) 18.0 18.0 18.0 18.0 31.0 31.0 31.0 31.070th %ile Term Code MaxR MaxR MaxR MaxR Coord Coord Coord Coord50th %ile Green (s) 18.0 18.0 18.0 18.0 31.0 31.0 31.0 31.050th %ile Term Code MaxR MaxR MaxR MaxR Coord Coord Coord Coord30th %ile Green (s) 18.0 18.0 18.0 18.0 31.0 31.0 31.0 31.030th %ile Term Code MaxR MaxR MaxR MaxR Coord Coord Coord Coord10th %ile Green (s) 18.0 18.0 18.0 18.0 31.0 31.0 31.0 31.010th %ile Term Code MaxR MaxR MaxR MaxR Coord Coord Coord CoordQueue Length 50th (ft) 34 34 6 38 1 44Queue Length 95th (ft) 75 72 18 58 6 68Internal Link Dist (ft) 90 220 173 803Turn Bay Length (ft) 95 100Base Capacity (vph) 476 433 419 1753 439 1769Starvation Cap Reductn 0 0 0 0 0 0Spillback Cap Reductn 0 0 0 0 0 0Storage Cap Reductn 0 0 0 0 0 0Reduced v/c Ratio 0.33 0.31 0.09 0.27 0.01 0.29
Intersection SummaryArea Type: OtherCycle Length: 60Actuated Cycle Length: 60Offset: 24 (40%), Referenced to phase 2:SBTL and 6:NBTL, Start of GreenNatural Cycle: 60Control Type: Actuated-Coordinated
Splits and Phases: 200: Main Street & 70th Street
HCM Signalized Intersection Capacity Analysis200: Main Street & 70th Street 3/24/2011
C:\JOBS\1223 WalMart 70th-Main Milwaukee\Analysis\1. 2011 Tot\SAT Peak.synTraffic Analysis & Design, Inc. Synchro 7
Movement EBL EBT EBR WBL WBT WBR NBL NBT NBR SBL SBT SBRLane ConfigurationsVolume (vph) 55 45 40 75 30 15 35 350 65 5 380 70Ideal Flow (vphpl) 1900 1900 1900 1900 1900 1900 1900 1900 1900 1900 1900 1900Lane Width 12 12 12 12 12 12 10 11 11 10 11 11Total Lost time (s) 5.5 5.5 5.5 5.5 5.5 5.5Lane Util. Factor 1.00 1.00 1.00 0.95 1.00 0.95Frt 0.96 0.98 1.00 0.98 1.00 0.98Flt Protected 0.98 0.97 0.95 1.00 0.95 1.00Satd. Flow (prot) 1774 1793 1652 3341 1668 3374Flt Permitted 0.83 0.77 0.47 1.00 0.48 1.00Satd. Flow (perm) 1507 1417 810 3341 850 3374Peak-hour factor, PHF 0.89 0.89 0.89 0.89 0.89 0.89 0.89 0.89 0.89 0.89 0.89 0.89Adj. Flow (vph) 62 51 45 84 34 17 39 393 73 6 427 79RTOR Reduction (vph) 0 24 0 0 8 0 0 26 0 0 25 0Lane Group Flow (vph) 0 134 0 0 127 0 39 440 0 6 481 0Heavy Vehicles (%) 1% 1% 1% 1% 1% 1% 2% 2% 2% 1% 1% 1%Turn Type Perm Perm Perm PermProtected Phases 4 8 6 2Permitted Phases 4 8 6 2Actuated Green, G (s) 18.0 18.0 31.0 31.0 31.0 31.0Effective Green, g (s) 18.0 18.0 31.0 31.0 31.0 31.0Actuated g/C Ratio 0.30 0.30 0.52 0.52 0.52 0.52Clearance Time (s) 5.5 5.5 5.5 5.5 5.5 5.5Vehicle Extension (s) 3.0 3.0 3.0 3.0 3.0 3.0Lane Grp Cap (vph) 452 425 419 1726 439 1743v/s Ratio Prot 0.13 c0.14v/s Ratio Perm 0.09 c0.09 0.05 0.01v/c Ratio 0.30 0.30 0.09 0.26 0.01 0.28Uniform Delay, d1 16.1 16.1 7.4 8.1 7.1 8.2Progression Factor 1.00 1.00 1.00 0.99 1.00 1.00Incremental Delay, d2 1.7 1.8 0.4 0.4 0.1 0.4Delay (s) 17.8 17.9 7.8 8.4 7.1 8.6Level of Service B B A A A AApproach Delay (s) 17.8 17.9 8.3 8.5Approach LOS B B A A
Intersection SummaryHCM Average Control Delay 10.5 HCM Level of Service BHCM Volume to Capacity ratio 0.28Actuated Cycle Length (s) 60.0 Sum of lost time (s) 11.0Intersection Capacity Utilization 53.3% ICU Level of Service AAnalysis Period (min) 15c Critical Lane Group
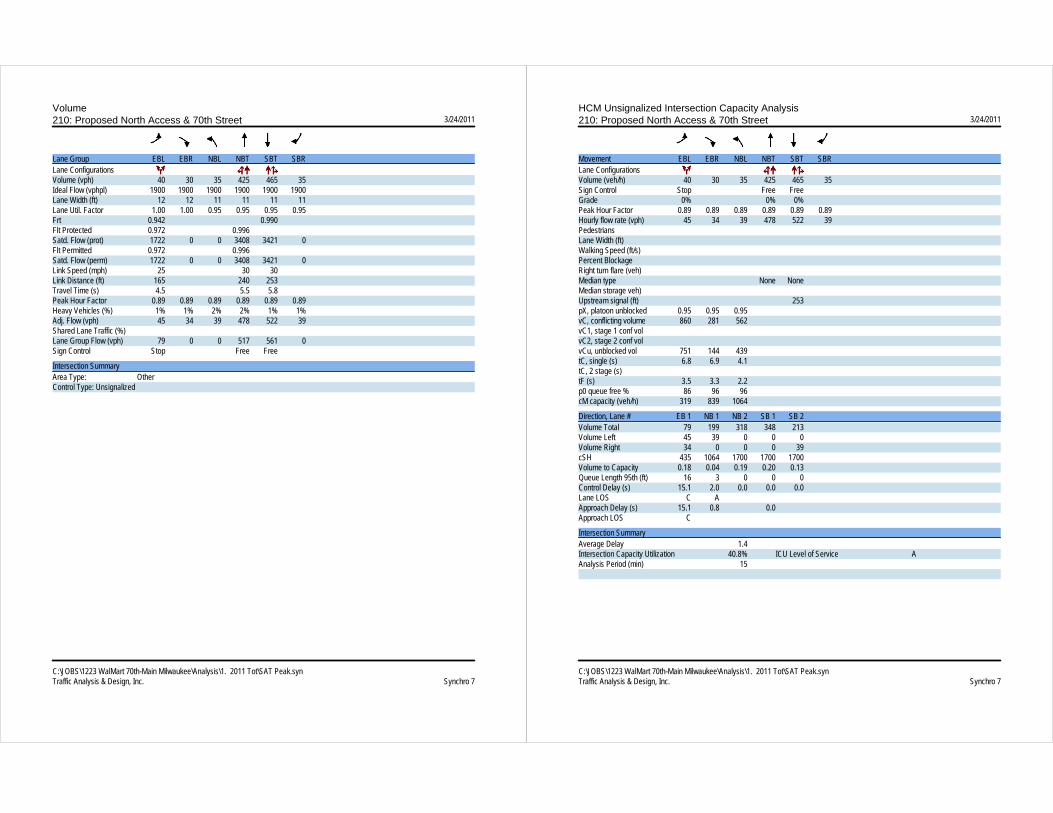
Volume210: Proposed North Access & 70th Street 3/24/2011
C:\JOBS\1223 WalMart 70th-Main Milwaukee\Analysis\1. 2011 Tot\SAT Peak.synTraffic Analysis & Design, Inc. Synchro 7
Lane Group EBL EBR NBL NBT SBT SBRLane ConfigurationsVolume (vph) 40 30 35 425 465 35Ideal Flow (vphpl) 1900 1900 1900 1900 1900 1900Lane Width (ft) 12 12 11 11 11 11Lane Util. Factor 1.00 1.00 0.95 0.95 0.95 0.95Frt 0.942 0.990Flt Protected 0.972 0.996Satd. Flow (prot) 1722 0 0 3408 3421 0Flt Permitted 0.972 0.996Satd. Flow (perm) 1722 0 0 3408 3421 0Link Speed (mph) 25 30 30Link Distance (ft) 165 240 253Travel Time (s) 4.5 5.5 5.8Peak Hour Factor 0.89 0.89 0.89 0.89 0.89 0.89Heavy Vehicles (%) 1% 1% 2% 2% 1% 1%Adj. Flow (vph) 45 34 39 478 522 39Shared Lane Traffic (%)Lane Group Flow (vph) 79 0 0 517 561 0Sign Control Stop Free Free
Intersection SummaryArea Type: OtherControl Type: Unsignalized
HCM Unsignalized Intersection Capacity Analysis210: Proposed North Access & 70th Street 3/24/2011
C:\JOBS\1223 WalMart 70th-Main Milwaukee\Analysis\1. 2011 Tot\SAT Peak.synTraffic Analysis & Design, Inc. Synchro 7
Movement EBL EBR NBL NBT SBT SBRLane ConfigurationsVolume (veh/h) 40 30 35 425 465 35Sign Control Stop Free FreeGrade 0% 0% 0%Peak Hour Factor 0.89 0.89 0.89 0.89 0.89 0.89Hourly flow rate (vph) 45 34 39 478 522 39PedestriansLane Width (ft)Walking Speed (ft/s)Percent BlockageRight turn flare (veh)Median type None NoneMedian storage veh)Upstream signal (ft) 253pX, platoon unblocked 0.95 0.95 0.95vC, conflicting volume 860 281 562vC1, stage 1 conf volvC2, stage 2 conf volvCu, unblocked vol 751 144 439tC, single (s) 6.8 6.9 4.1tC, 2 stage (s)tF (s) 3.5 3.3 2.2p0 queue free % 86 96 96cM capacity (veh/h) 319 839 1064
Direction, Lane # EB 1 NB 1 NB 2 SB 1 SB 2Volume Total 79 199 318 348 213Volume Left 45 39 0 0 0Volume Right 34 0 0 0 39cSH 435 1064 1700 1700 1700Volume to Capacity 0.18 0.04 0.19 0.20 0.13Queue Length 95th (ft) 16 3 0 0 0Control Delay (s) 15.1 2.0 0.0 0.0 0.0Lane LOS C AApproach Delay (s) 15.1 0.8 0.0Approach LOS C
Intersection SummaryAverage Delay 1.4Intersection Capacity Utilization 40.8% ICU Level of Service AAnalysis Period (min) 15
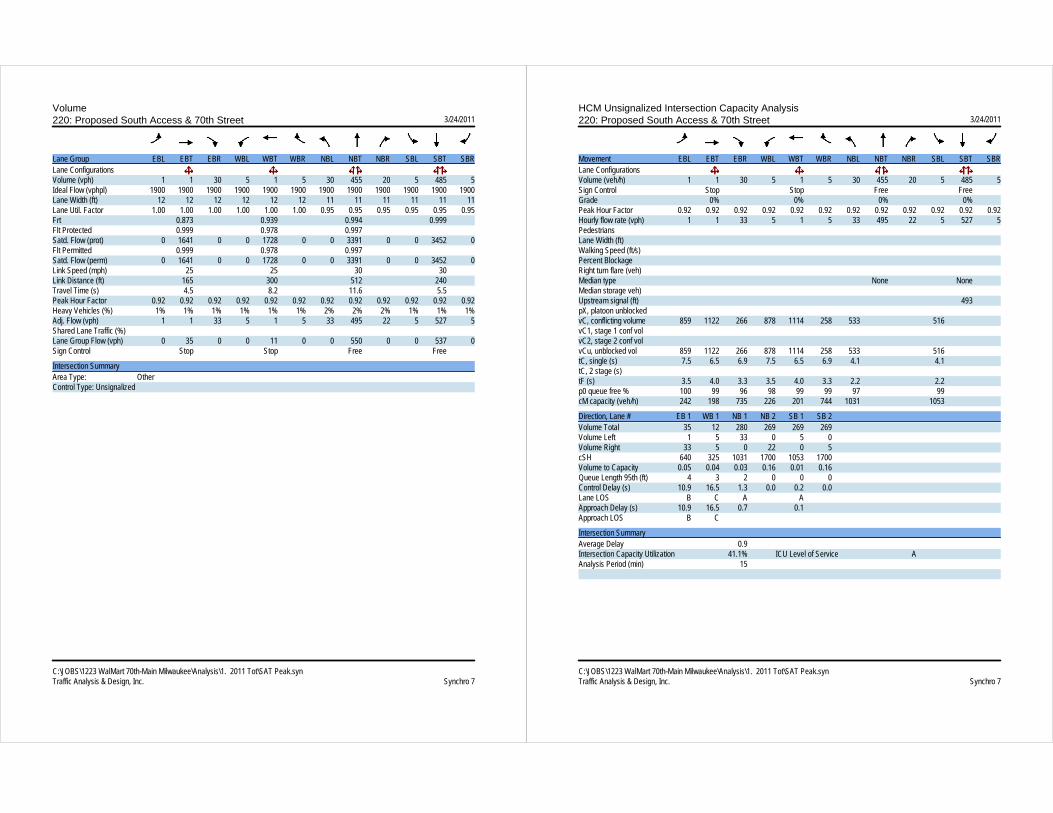
Volume220: Proposed South Access & 70th Street 3/24/2011
C:\JOBS\1223 WalMart 70th-Main Milwaukee\Analysis\1. 2011 Tot\SAT Peak.synTraffic Analysis & Design, Inc. Synchro 7
Lane Group EBL EBT EBR WBL WBT WBR NBL NBT NBR SBL SBT SBRLane ConfigurationsVolume (vph) 1 1 30 5 1 5 30 455 20 5 485 5Ideal Flow (vphpl) 1900 1900 1900 1900 1900 1900 1900 1900 1900 1900 1900 1900Lane Width (ft) 12 12 12 12 12 12 11 11 11 11 11 11Lane Util. Factor 1.00 1.00 1.00 1.00 1.00 1.00 0.95 0.95 0.95 0.95 0.95 0.95Frt 0.873 0.939 0.994 0.999Flt Protected 0.999 0.978 0.997Satd. Flow (prot) 0 1641 0 0 1728 0 0 3391 0 0 3452 0Flt Permitted 0.999 0.978 0.997Satd. Flow (perm) 0 1641 0 0 1728 0 0 3391 0 0 3452 0Link Speed (mph) 25 25 30 30Link Distance (ft) 165 300 512 240Travel Time (s) 4.5 8.2 11.6 5.5Peak Hour Factor 0.92 0.92 0.92 0.92 0.92 0.92 0.92 0.92 0.92 0.92 0.92 0.92Heavy Vehicles (%) 1% 1% 1% 1% 1% 1% 2% 2% 2% 1% 1% 1%Adj. Flow (vph) 1 1 33 5 1 5 33 495 22 5 527 5Shared Lane Traffic (%)Lane Group Flow (vph) 0 35 0 0 11 0 0 550 0 0 537 0Sign Control Stop Stop Free Free
Intersection SummaryArea Type: OtherControl Type: Unsignalized
HCM Unsignalized Intersection Capacity Analysis220: Proposed South Access & 70th Street 3/24/2011
C:\JOBS\1223 WalMart 70th-Main Milwaukee\Analysis\1. 2011 Tot\SAT Peak.synTraffic Analysis & Design, Inc. Synchro 7
Movement EBL EBT EBR WBL WBT WBR NBL NBT NBR SBL SBT SBRLane ConfigurationsVolume (veh/h) 1 1 30 5 1 5 30 455 20 5 485 5Sign Control Stop Stop Free FreeGrade 0% 0% 0% 0%Peak Hour Factor 0.92 0.92 0.92 0.92 0.92 0.92 0.92 0.92 0.92 0.92 0.92 0.92Hourly flow rate (vph) 1 1 33 5 1 5 33 495 22 5 527 5PedestriansLane Width (ft)Walking Speed (ft/s)Percent BlockageRight turn flare (veh)Median type None NoneMedian storage veh)Upstream signal (ft) 493pX, platoon unblockedvC, conflicting volume 859 1122 266 878 1114 258 533 516vC1, stage 1 conf volvC2, stage 2 conf volvCu, unblocked vol 859 1122 266 878 1114 258 533 516tC, single (s) 7.5 6.5 6.9 7.5 6.5 6.9 4.1 4.1tC, 2 stage (s)tF (s) 3.5 4.0 3.3 3.5 4.0 3.3 2.2 2.2p0 queue free % 100 99 96 98 99 99 97 99cM capacity (veh/h) 242 198 735 226 201 744 1031 1053
Direction, Lane # EB 1 WB 1 NB 1 NB 2 SB 1 SB 2Volume Total 35 12 280 269 269 269Volume Left 1 5 33 0 5 0Volume Right 33 5 0 22 0 5cSH 640 325 1031 1700 1053 1700Volume to Capacity 0.05 0.04 0.03 0.16 0.01 0.16Queue Length 95th (ft) 4 3 2 0 0 0Control Delay (s) 10.9 16.5 1.3 0.0 0.2 0.0Lane LOS B C A AApproach Delay (s) 10.9 16.5 0.7 0.1Approach LOS B C
Intersection SummaryAverage Delay 0.9Intersection Capacity Utilization 41.1% ICU Level of Service AAnalysis Period (min) 15