Embed Size (px)
Citation preview
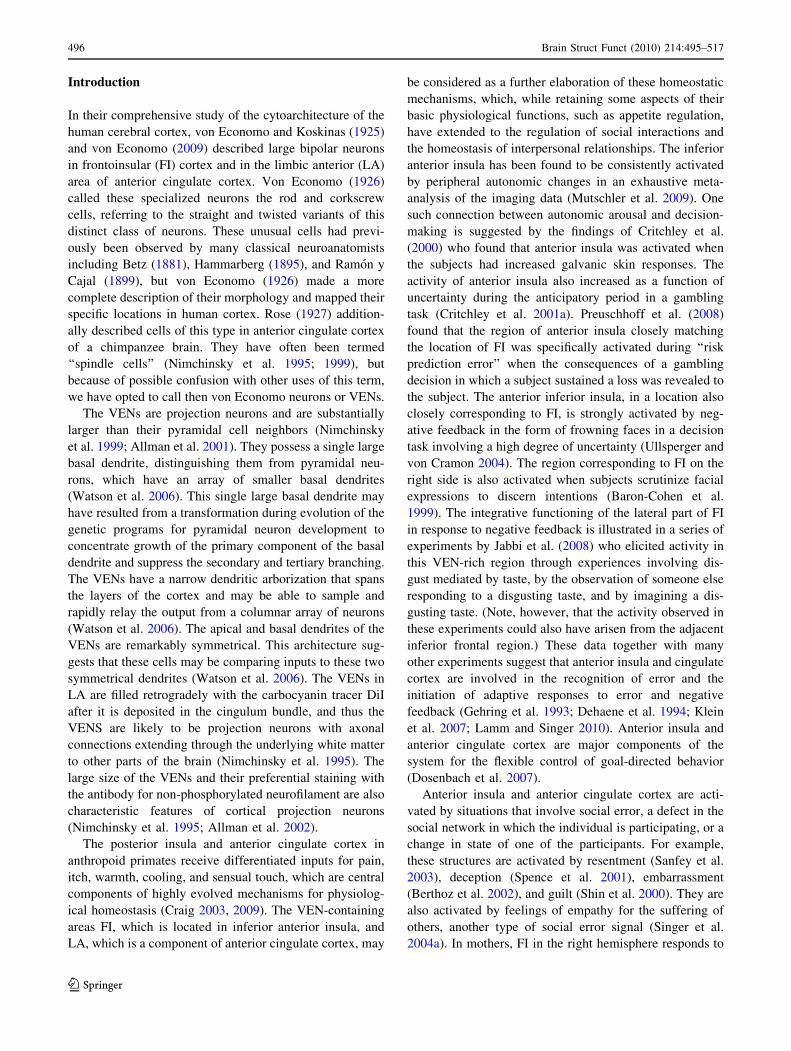
ORIGINAL ARTICLE
The von Economo neurons in frontoinsular and anterior cingulatecortex in great apes and humans
John M. Allman • Nicole A. Tetreault • Atiya Y. Hakeem • Kebreten F. Manaye •
Katerina Semendeferi • Joseph M. Erwin • Soyoung Park • Virginie Goubert • Patrick R. Hof
Received: 1 December 2009 / Accepted: 21 April 2010 / Published online: 29 May 2010
� The Author(s) 2010. This article is published with open access at Springerlink.com
Abstract The von Economo neurons (VENs) are large
bipolar neurons located in frontoinsular (FI) and anterior
cingulate cortex in great apes and humans, but not other
primates. We performed stereological counts of the VENs
in FI and LA (limbic anterior, a component of anterior
cingulate cortex) in great apes and in humans. The VENs
are more numerous in humans than in apes, although one
gorilla approached the lower end of the human range. We
also examined the ontological development of the VENs in
FI and LA in humans. The VENs first appear in small
numbers in the 36th week post-conception, are rare at birth,
and increase in number during the first 8 months after birth.
There are significantly more VENs in the right hemisphere
than in the left in FI and LA in postnatal brains of apes and
humans. This asymmetry in VEN numbers may be related
to asymmetries in the autonomic nervous system. The
activity of the inferior anterior insula, which contains FI, is
related to physiological changes in the body, decision-
making, error recognition, and awareness. The VENs
appear to be projection neurons, although their targets are
unknown. We made a preliminary study of the connections
of FI cortex based on diffusion tensor imaging in the brain
of a gorilla. The VEN-containing regions connect to the
frontal pole as well as to other parts of frontal and insular
cortex, the septum, and the amygdala. It is likely that the
VENs in FI are projecting to some or all of these structures
and relaying information related to autonomic control,
decision-making, or awareness. The VENs selectively
express the bombesin peptides neuromedin B (NMB) and
gastrin releasing peptide (GRP) which are also expressed in
another population of closely related neurons, the fork
cells. NMB and GRP signal satiety. The genes for NMB
and GRP are expressed selectively in small populations of
neurons in the insular cortex in mice. These populations
may be related to the VEN and fork cells and may be
involved in the regulation of appetite. The loss of these
cells may be related to the loss of satiety signaling in
patients with frontotemporal dementia who have damage to
FI. The VENs and fork cells may be morphological spe-
cializations of an ancient population of neurons involved in
the control of appetite present in the insular cortex in all
mammals. We found that the protein encoded by the gene
DISC1 (disrupted in schizophrenia) is preferentially
expressed by the VENs. DISC1 has undergone rapid evo-
lutionary change in the line leading to humans, and since it
suppresses dendritic branching it may be involved in the
distinctive VEN morphology.
Keywords von Economo neurons � Fork cells �Anterior cingulate cortex � Frontoinsular cortex �Hominoid brain � Disc1 � Neuromedin B
J. M. Allman (&) � N. A. Tetreault � A. Y. Hakeem �S. Park � V. Goubert
Division of Biology, 216-76, California Institute of Technology,
Pasadena, CA 91125, USA
e-mail: [email protected]
K. F. Manaye
Department of Physiology and Biophysics, College of Medicine,
Howard University, Washington, DC 20059, USA
K. Semendeferi
Department of Anthropology, University of California,
San Diego, La Jolla, CA 92093, USA
J. M. Erwin
Biomedical Sciences and Pathobiology, Virginia Polytechnic
Institute, Blackburg, VA 24036, USA
P. R. Hof
Department of Neuroscience, Mount Sinai School of Medicine,
New York, NY 10029, USA
123
Brain Struct Funct (2010) 214:495–517
DOI 10.1007/s00429-010-0254-0
Introduction
In their comprehensive study of the cytoarchitecture of the
human cerebral cortex, von Economo and Koskinas (1925)
and von Economo (2009) described large bipolar neurons
in frontoinsular (FI) cortex and in the limbic anterior (LA)
area of anterior cingulate cortex. Von Economo (1926)
called these specialized neurons the rod and corkscrew
cells, referring to the straight and twisted variants of this
distinct class of neurons. These unusual cells had previ-
ously been observed by many classical neuroanatomists
including Betz (1881), Hammarberg (1895), and Ramon y
Cajal (1899), but von Economo (1926) made a more
complete description of their morphology and mapped their
specific locations in human cortex. Rose (1927) addition-
ally described cells of this type in anterior cingulate cortex
of a chimpanzee brain. They have often been termed
‘‘spindle cells’’ (Nimchinsky et al. 1995; 1999), but
because of possible confusion with other uses of this term,
we have opted to call then von Economo neurons or VENs.
The VENs are projection neurons and are substantially
larger than their pyramidal cell neighbors (Nimchinsky
et al. 1999; Allman et al. 2001). They possess a single large
basal dendrite, distinguishing them from pyramidal neu-
rons, which have an array of smaller basal dendrites
(Watson et al. 2006). This single large basal dendrite may
have resulted from a transformation during evolution of the
genetic programs for pyramidal neuron development to
concentrate growth of the primary component of the basal
dendrite and suppress the secondary and tertiary branching.
The VENs have a narrow dendritic arborization that spans
the layers of the cortex and may be able to sample and
rapidly relay the output from a columnar array of neurons
(Watson et al. 2006). The apical and basal dendrites of the
VENs are remarkably symmetrical. This architecture sug-
gests that these cells may be comparing inputs to these two
symmetrical dendrites (Watson et al. 2006). The VENs in
LA are filled retrogradely with the carbocyanin tracer DiI
after it is deposited in the cingulum bundle, and thus the
VENS are likely to be projection neurons with axonal
connections extending through the underlying white matter
to other parts of the brain (Nimchinsky et al. 1995). The
large size of the VENs and their preferential staining with
the antibody for non-phosphorylated neurofilament are also
characteristic features of cortical projection neurons
(Nimchinsky et al. 1995; Allman et al. 2002).
The posterior insula and anterior cingulate cortex in
anthropoid primates receive differentiated inputs for pain,
itch, warmth, cooling, and sensual touch, which are central
components of highly evolved mechanisms for physiolog-
ical homeostasis (Craig 2003, 2009). The VEN-containing
areas FI, which is located in inferior anterior insula, and
LA, which is a component of anterior cingulate cortex, may
be considered as a further elaboration of these homeostatic
mechanisms, which, while retaining some aspects of their
basic physiological functions, such as appetite regulation,
have extended to the regulation of social interactions and
the homeostasis of interpersonal relationships. The inferior
anterior insula has been found to be consistently activated
by peripheral autonomic changes in an exhaustive meta-
analysis of the imaging data (Mutschler et al. 2009). One
such connection between autonomic arousal and decision-
making is suggested by the findings of Critchley et al.
(2000) who found that anterior insula was activated when
the subjects had increased galvanic skin responses. The
activity of anterior insula also increased as a function of
uncertainty during the anticipatory period in a gambling
task (Critchley et al. 2001a). Preuschhoff et al. (2008)
found that the region of anterior insula closely matching
the location of FI was specifically activated during ‘‘risk
prediction error’’ when the consequences of a gambling
decision in which a subject sustained a loss was revealed to
the subject. The anterior inferior insula, in a location also
closely corresponding to FI, is strongly activated by neg-
ative feedback in the form of frowning faces in a decision
task involving a high degree of uncertainty (Ullsperger and
von Cramon 2004). The region corresponding to FI on the
right side is also activated when subjects scrutinize facial
expressions to discern intentions (Baron-Cohen et al.
1999). The integrative functioning of the lateral part of FI
in response to negative feedback is illustrated in a series of
experiments by Jabbi et al. (2008) who elicited activity in
this VEN-rich region through experiences involving dis-
gust mediated by taste, by the observation of someone else
responding to a disgusting taste, and by imagining a dis-
gusting taste. (Note, however, that the activity observed in
these experiments could also have arisen from the adjacent
inferior frontal region.) These data together with many
other experiments suggest that anterior insula and cingulate
cortex are involved in the recognition of error and the
initiation of adaptive responses to error and negative
feedback (Gehring et al. 1993; Dehaene et al. 1994; Klein
et al. 2007; Lamm and Singer 2010). Anterior insula and
anterior cingulate cortex are major components of the
system for the flexible control of goal-directed behavior
(Dosenbach et al. 2007).
Anterior insula and anterior cingulate cortex are acti-
vated by situations that involve social error, a defect in the
social network in which the individual is participating, or a
change in state of one of the participants. For example,
these structures are activated by resentment (Sanfey et al.
2003), deception (Spence et al. 2001), embarrassment
(Berthoz et al. 2002), and guilt (Shin et al. 2000). They are
also activated by feelings of empathy for the suffering of
others, another type of social error signal (Singer et al.
2004a). In mothers, FI in the right hemisphere responds to
496 Brain Struct Funct (2010) 214:495–517
123
the crying of distressed infants (Lorberbaum et al. 2002),
which is a powerful social error signal. The anterior insula
(including both superior and inferior components) was
activated when partners in the prisoner’s dilemma game
failed to reciprocate co-operative moves made by the
subject, which is a type of social error signal (Rilling et al.
2008). Anterior insula and anterior cingulate cortex are also
activated by pro-social signals, such as love and trust
(Bartels and Zeki 2004; Singer et al. 2004b), which sug-
gests that these structures register both negative and posi-
tive aspects of the states of social networks. The responses
of FI and LA are parametrically related to how humorous
subjects judge cartoons to be; the humorous content of the
cartoons typically involved social errors (Watson et al.
2007).
Recent work suggests that the anterior insula is involved
in awareness (Ploran et al. 2007; Nelson et al. 2010; Craig
2010). This connection with awareness was initially sug-
gested in an fMRI experiment by Kikyo and Ohki (2002) in
which they observed activity in anterior insula when sub-
jects reported the subjective sense of knowing a word
before recalling it in a memory task, which these authors
called the ‘‘feeling of knowing’’. More recently Ploran
et al. (2007) found in an experiment employing a behav-
ioral paradigm in which objects gradually emerge from
noise that the activity of anterior insula was strongly linked
to the moment when the subjects became aware of the
identity of the object (allowing for the delays inherent in
the fMRI signal). More recent work from the same group
has identified several components of this activity, including
one in inferior anterior insula particularly on the right side
(Nelson et al. 2010). Allman et al. (2005) proposed that the
VENs and related circuitry are involved in rapid intuition,
which like perceptual recognition involves immediate
effortless awareness rather than the engagement of delib-
erative processes. Recently, Aziz-Zadeh et al. (2009) found
that when subjects solving anagrams arrived at rapid
insightful solutions (‘‘aha’’ moments) both anterior insula
and anterior cingulate cortex were activated. These aspects
of awareness are not limited to body states, but involve
visual and linguistic experiences as well, suggesting the
hypothesis that the role of anterior insula in awareness may
include most or all aspects of perception and cognition. An
extension of this hypothesis is that the VENs in FI serve as
a fast relay of this information to other parts of the brain.
While these social processes are often conscious, they
can also proceed covertly without the subject’s direct
awareness. For example, when subjects gaze into the eyes
of others, if the size of the pupils of the eyes of the
observed subject change in a way that is discordant with
the changes in pupil size in the subject, both anterior cin-
gulate and anterior insula are activated (Harrison et al.
2009). This discordance in pupil size change is reflective of
differences in autonomic arousal and emotional experience
between the observed individual and the subject. This is a
covert signal that there is a discordance in their feelings
about the social transaction that they are conducting, which
is another type of social error signal. The use of Granger
causality analysis of temporally resolved functional imag-
ing data suggests that activity in FI precedes that in cin-
gulate and other cortical areas, and Sridharan et al. (2008)
proposed that the VENs may have a role in initiating this
activity in other cortical areas. This initiation of activity
may be related to the awareness of negative or positive
feedback with respect to a broad range of internal and
external states.
The VENs are implicated in several neuropsychiatric
illnesses. Seeley et al. (2006, 2007; Seeley 2008) found in a
stereological study that the VENs are specifically and
selectively attacked in the early stages of the behavioral
variant of fronto-temporal dementia (FTD), in which
empathy, social awareness, and self-control are severely
diminished. The VEN population of ACC is reduced by an
average of 74% in these patients, and many of the sur-
viving VENs are severely dysmorphic. The destruction of
the VENs in FTD results, in different patients, from one of
two distinct molecular mechanisms related to abnormal
isoforms of the tau protein or to abnormal expression in the
cytoplasm of VENs of the DNA-binding protein TDP-43
(Seeley et al. 2006; Seeley 2008). The VENs are also
reduced in FI (Seeley et al. 2007). In contrast, Seeley et al.
(2006, 2007) found that the VENs were not significantly
reduced in Alzheimer’s dementia (AD) although a reduc-
tion had been reported in an earlier study which did not use
stereological methods (Nimchinsky et al. 1995). Rankin
et al. (2006) systematically investigated the capacity for
empathic concern in a large population of neurological
patients and found that this capacity was greatly reduced in
FTD patients; while this capacity was variably expressed in
Alzheimer’s patients it was not significantly reduced rela-
tive to neurologically normal controls.
Agenesis of the corpus callosum is another condition in
which abnormal social behavior may be linked to reduced
VEN populations. Patients with agenesis of the corpus
callosum often have impoverished and superficial rela-
tionships, suffer from social isolation, and have interper-
sonal conflicts both at home and at work due to
misinterpretation of social cues (Paul et al. 2007). Kaufman
et al. (2008) found that the VENs were reduced by 50% in
a subject with partial agenesis of the corpus callosum and
90% in a subject with complete agenesis, compared to
adult controls. The VEN loss could not be attributed to the
reduction or absence of the corpus callosum itself because
the number of VENs in FI was found to be normal in
another subject whose corpus callosum was destroyed as
the result of a stroke 15 years before her death. Because the
Brain Struct Funct (2010) 214:495–517 497
123

surgical sectioning of the corpus callosum does not disrupt
social behavior (Shorvon 2005), the social deficit in
agenesis of the corpus callosum may be related to VEN
loss. We will present evidence that FI sends fibers into the
corpus callosum, but apparently the severing of this con-
nection does not result in a significant loss of VENs in FI.
There are many features of autism that suggest that the
VENs may be involved in this disorder (Allman et al. 2005;
van Kooten 2008). An initial stereological study of the
numbers of VENs in area FI of four autistic subjects plus
controls did not confirm this conjecture (Kennedy et al.
2007). However, a second stereological study of VENs in
dorsal ACC involving nine autistic subjects plus controls
found that the autistic subjects fell into two groups, one
with significantly higher numbers of VENs than controls,
and one with very few VENs (Simms et al. 2009). In this
study the controls occupied a middle zone with respect to
VEN counts with little overlap with the high or low VEN
autistic groups. The results of Simms et al. (2009) suggest
that two different mechanisms influence the number of
VENs in autism, possibly through different effects on
migration and survival. As in frontotemporal dementia, in
autism the VENs may be vulnerable to more than one
pathological process that may contribute to the disorder as
it manifests in different individuals. A strong linkage
between reduced activity in the right anterior insula in
autistic subjects versus controls in social tasks contrasted
with non-social tasks was revealed in a meta-analysis of 39
functional imaging studies (Di Martino et al. 2009). These
studies suggest a possible role for the VENs in autism.
In a comparative study of the distribution of the VENs in
LA in primates, Nimchinsky et al. (1999) found them to be
present in all the great apes (chimpanzees, bonobos,
gorillas, and orangutans), but not in any other non-human
primates. In this study, the VENs declined in abundance
with increasing phylogenetic distance from humans, with
bonobos and chimpanzees having more than gorillas,
which in turn had more than orangutans, which had only a
few isolated VENs. However, this was based on qualitative
observations, and no stereological determinations of VEN
numbers or concentrations were performed. In the present
study, we confirmed that among primates significant
numbers of VENs are found in the FI region only in great
apes and humans, and we performed stereological counts of
the VENs both in FI and in LA in these species. (By sig-
nificant numbers we mean more than 2 such cells per
section through the FI region.) We also examined the
ontological development of the VENs both in FI and in LA
and found that they mainly emerge during the first
8 months after birth. In postnatal FI and LA, the VENS are
nearly always more numerous in the right hemisphere than
in the left both in apes and in humans. We found that a
subset of the VENs and a related population of neurons, the
fork cells, are strongly labeled by antibodies to the proteins
neuromedin B (NMB) and gastrin releasing peptide (GRP)
which are involved in appetite regulation, suggesting a
phylogenetically conserved function of these cells. The
VENs are also strongly labeled by an antibody to the
protein encoded by the gene DISC1 (disrupted in schizo-
phrenia). This gene has undergone rapid evolutionary
change in the line leading to humans (Crespi et al. 2007)
and may be related to the distinctive VEN morphology. We
did a preliminary study in a gorilla brain of the connections
of frontoinsular cortex based on diffusion tensor imaging.
This revealed connections with the frontal pole as well as
with other parts of frontal and insular cortex, the septum,
and the amygdala.
Methods
Materials and tissue processing
Many of the brains used in the stereological study were
specially prepared for this purpose at the California Insti-
tute of Technology. We obtained two bonobo, one chim-
panzee, three gorilla, and four orangutan brains from apes
which had died of natural causes in zoos. The ape brains
were scanned in a 9.4 Tesla Bruker magnet at the Cali-
fornia Institute of Technology Brain Imaging Center. The
structural MRIs were performed using a high-resolution 3D
FLASH sequence which lasted 16 h. The voxels in the
structural MRIs were 250 lm isotropic. Diffusion tensor
imaging of the brain of a 27-year-old male gorilla was done
with a high angular-resolution (PGHE) scan weighted
isotropically along 72 diffusion directions. The DTIs were
done in a series of 6 scans, lasting 36 h, averaged together
to achieve high signal-to-noise ratio. The DTI voxels were
1 mm isotropic. We used FSL to make probabilistic trac-
tography maps of connections proceeding from seed voxels
with locations based on co-registered histological sections
through FI and in the adjacent superior anterior insula in
the gorilla (http://www.fmrib.ox.ac.uk/fsl/fdt/index.html)
(Croxson et al. 2005). We obtained human area FI tissue
from the NICHD Brain and Tissue Bank for Develop-
mental Disorders. These brains were cryoprotected with
sucrose, frozen on a specially designed microtome stage,
and cut into serial 100-lm thick coronal sections which
were mounted on gelatinized slides. The cut face of the
tissue block was photographed with each new section and
used to assist in the accurate mounting of the sections. In
general every 5th section was stained with a cresyl violet
Nissl stain, although in some instances we prepared every
2nd section through area FI. The ape brains were sectioned
whole (except in the case of one bonobo and one orangu-
tan, for which only one hemisphere was available) and a
498 Brain Struct Funct (2010) 214:495–517
123
series through the entire brain was Nissl stained and
mounted. The human tissue was provided in the form of
single-hemisphere slabs spanning the regions of interest;
for each brain a series through all provided tissue was Nissl
stained and mounted.
We also used material in three brain collections for
stereological and comparative study. Brains in the Yakovlev
and Welker Collections at the National Museum of Health
and Medicine were celloidin embedded, cut into 30–35 lm
thick sections, and Nissl stained with thionine. The third
collection was Katerina Semendeferi’s at the University
of California at San Diego. These brains were paraffin
embedded, sectioned at 20 lm, and Nissl stained using a
modification of the Gallyas silver stain for neuronal perikarya
(Gallyas 1971; Merker 1983).
The stereology was performed with the optical frac-
tionator probe using StereoInvestigator (MBF Bioscience,
Williston, VT). For each sample we made a stereological
estimate of the number of VENs in layers 3 and 5 (layer 4
is absent in FI and ACC). The VENs also extend into layers
2 and 6 in regions adjacent to where they are abundant in
layers 3 and 5 in FI. We determined the regions of interest
on the basis of the presence of VENs; these regions cor-
responded to FI and limbic cortex subdivision A (LA) in
the cytoarchitectonic maps of von Economo and Koskinas
(1925). The most robust criterion used by von Economo for
the cytoarchitectonic identification of FI and LA was the
presence of these specialized neurons, which he found
nowhere else in the entire cerebral cortex (von Economo
2009). Von Economo did not illustrate the localization of
FI in frontal sections, however Rose (1928) did make such
plots for 14 planes in his very thorough study of insular
cortex, and his agranular insular areas (ai1 through ai8) in
human frontal sections are similar to the location of FI that
we have found in humans. Moreover, Rose (1928) also
cited the presence of lancet- and spindle-shaped cells in
layer 5 as important criteria for identifying these areas. The
VENs are not uniformly distributed in these areas and tend
to be concentrated in the regions of greatest cortical cur-
vature, as was observed by von Economo (1926). In most
cases we also made a stereological estimate of the total
neuron population within the same region of interest
established for the VEN counts in each sample. In addition
to our stereological estimates of VEN and neuron numbers,
we used the StereoInvestigator software to assist us in
plotting the locations of every VEN within representative
sections through FI in a 39-year-old male chimpanzee, a
27-year-old male gorilla and a 1.6-year-old human, which
we used as guides for making photomicrographs illustrat-
ing the cytoarchitecture of FI. We also made three-
dimensional reconstructions of FI and LA superimposed on
MR images of the 39-year-old male chimpanzee and a
young adult female human brain. In the chimpanzee, we
first aligned the frontal plane of our MR image sets with the
frontal plane of our histological sections using the program
IMAGE-J. We then co-registered the histological sections
containing FI and LA with the matching MR images,
plotted the location of these areas, and made three-
dimensional reconstructions using the program AMIRA
(Visage Imaging). We did not have both MR images and
histological sections for any human brain, so we estimated
the location of these areas in an MR image set for a young
adult human female brain provided by Kirsten Tillisch and
Emeran Mayer at UCLA. These MR images were acquired
with a Siemens Trio Tim 3 Tesla machine. The location of
FI and LA were then reconstructed with AMIRA.
Immunohistochemistry and quantification
Fixed human frontoinsular cortex (FI) was obtained from
the NICHD Brain and Tissue Bank and the Mount Sinai
School of Medicine Brain Bank. Samples from a 39 and a
51-year-old male were sectioned at 50 lm on a vibratome.
Both individuals died suddenly of myocardial infarctions.
The immunohistochemical method was adapted from
Sherwood et al. (2004). The primary antibody concentra-
tion was optimized using rabbit anti-DISC1 (human)
(1:100 Zymed cat. No. 40-6800; Zymed Laboratories, Inc.,
San Francisco, CA), NMB (1:100, Protein Tech), or GRP
(1:1,000, Protein Tech). Control sections were incubated
with no primary antibody and with the corresponding goat
IgG at the same concentration as the primary antibody. For
the DISC1 study, three sections from each individual were
Nissl-counterstained with cresyl violet. For each section,
layer 5 of FI was traced and the neurons therein were
counted using StereoInvestigator. Neurons were classified
as to whether they were VENs or non-VENs and whether
or not they were immuno-reactive, and the percentages of
positive profiles were calculated. As the entire region of FI
was not available for each individual, stereological counts
through the whole structure were not possible; the three
sections from each specimen were sampled individually
and the results averaged.
Results
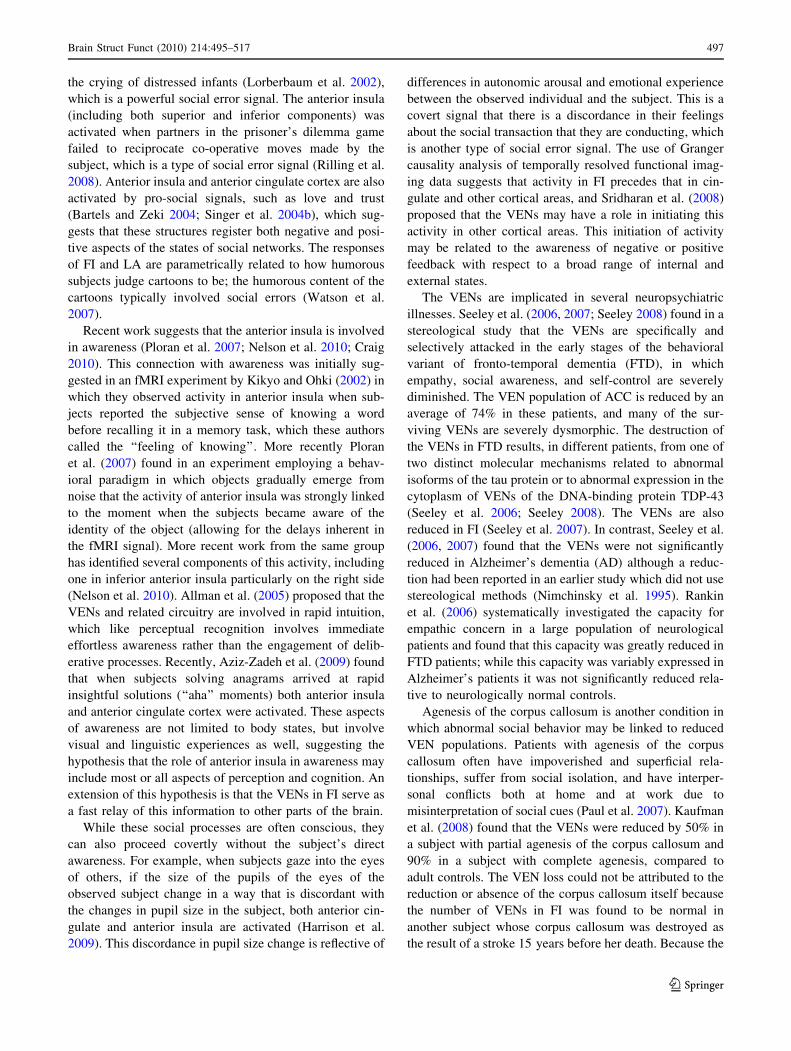
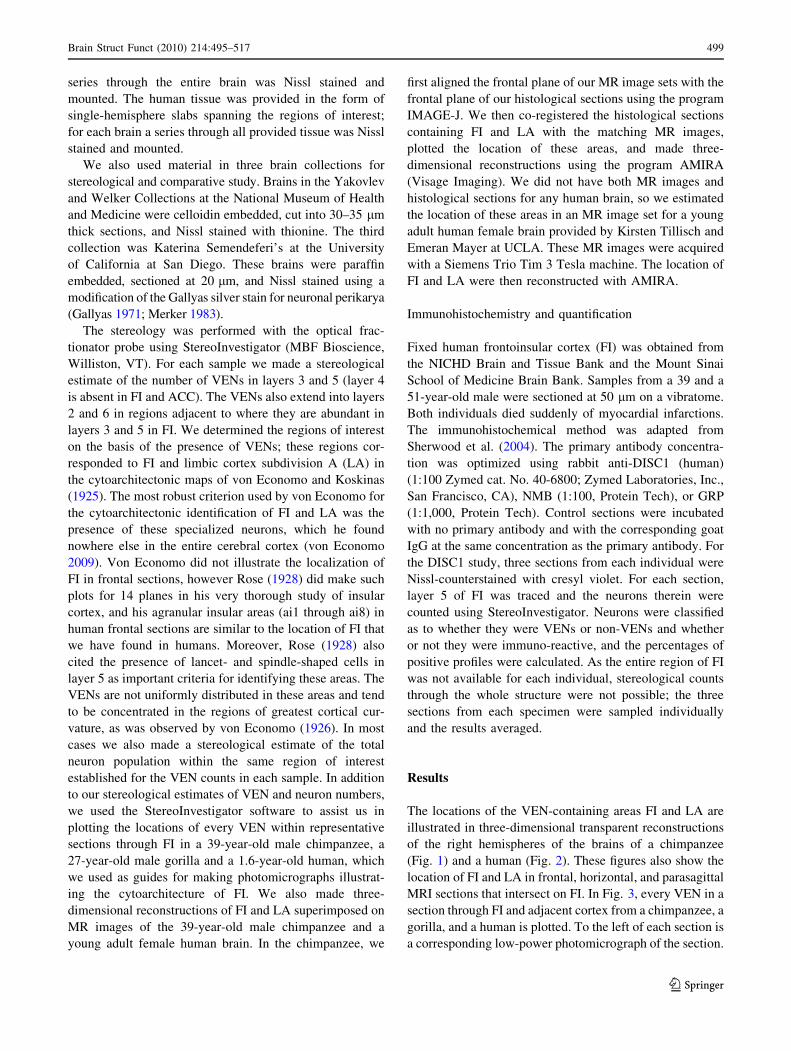
The locations of the VEN-containing areas FI and LA are
illustrated in three-dimensional transparent reconstructions
of the right hemispheres of the brains of a chimpanzee
(Fig. 1) and a human (Fig. 2). These figures also show the
location of FI and LA in frontal, horizontal, and parasagittal
MRI sections that intersect on FI. In Fig. 3, every VEN in a
section through FI and adjacent cortex from a chimpanzee, a
gorilla, and a human is plotted. To the left of each section is
a corresponding low-power photomicrograph of the section.
Brain Struct Funct (2010) 214:495–517 499
123
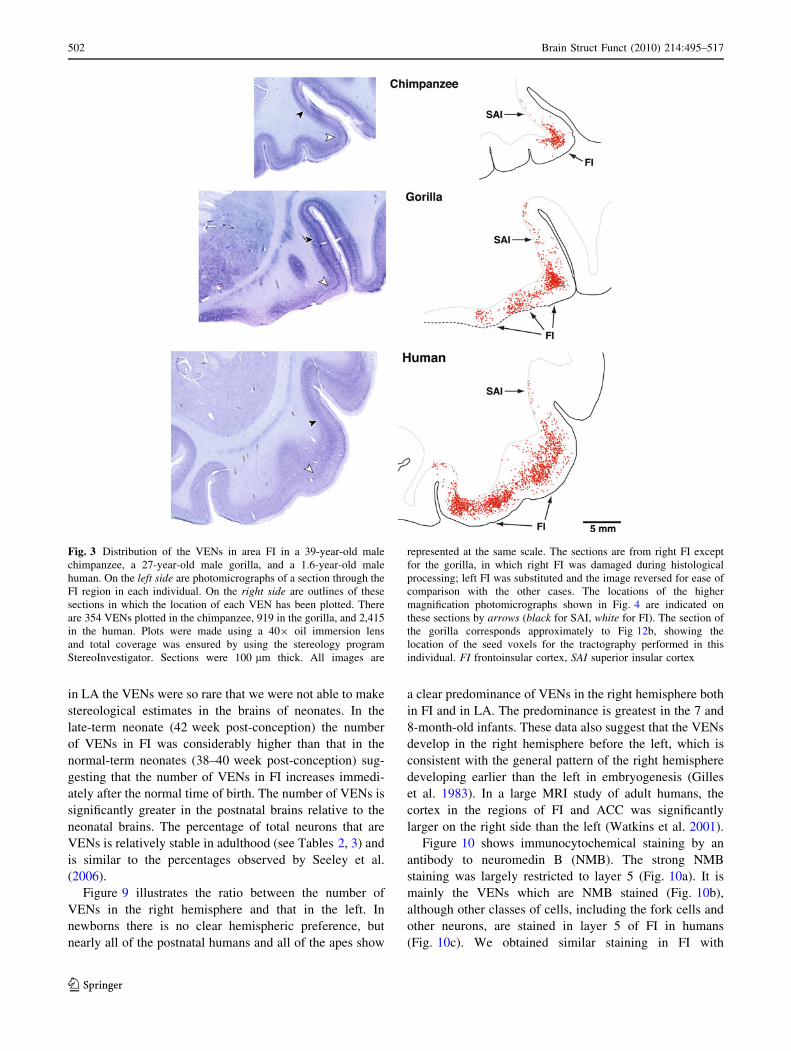
The section illustrated from the chimpanzee brain in Fig. 3
corresponds approximately to the frontal MRI section for
this same individual illustrated in Fig. 1a. The VEN-con-
taining area is largely confined to the region of high flexure
in the chimpanzee, but extends medially in the gorilla and
even further in the medial direction in the human. The
transition between FI and superior anterior insula (SAI)
corresponds to a gradient in VEN density rather than a sharp
border. There are a small number of VENs in layer 6 in the
adjacent superior anterior insula in all three species; these
layer 6 neurons have the distinctive VEN morphology, but
are oriented parallel to the white–gray matter interface and
are orthogonal to the typical radial VEN orientation. These
horizontally oriented cells may thus have a different func-
tional role than the VENs in FI. In Fig. 4, medium-power
photomicrographs from layer 5 of the same chimpanzee,
gorilla, and human illustrate the strong radial (columnar)
patterning of layer 5 in FI with the presence of many VENs,
and the relative absence of these features in the anterior
superior insula (SAI). The locations of the medium-power
images are indicated by the arrowheads superimposed on
the low-power photomicrographs in Fig. 3. SAI appears to
correspond to Rose’s (1928) granular insular areas (i7, i8,
and i9). The cytoarchitecture of area LA and the location of
the VENs in this area of anterior cingulate cortex are
illustrated in von Economo (2009) and Nimchinsky et al.
(1995, 1999).
The VENs are illustrated at higher magnification in
Fig. 5 which shows their very similar morphology in the
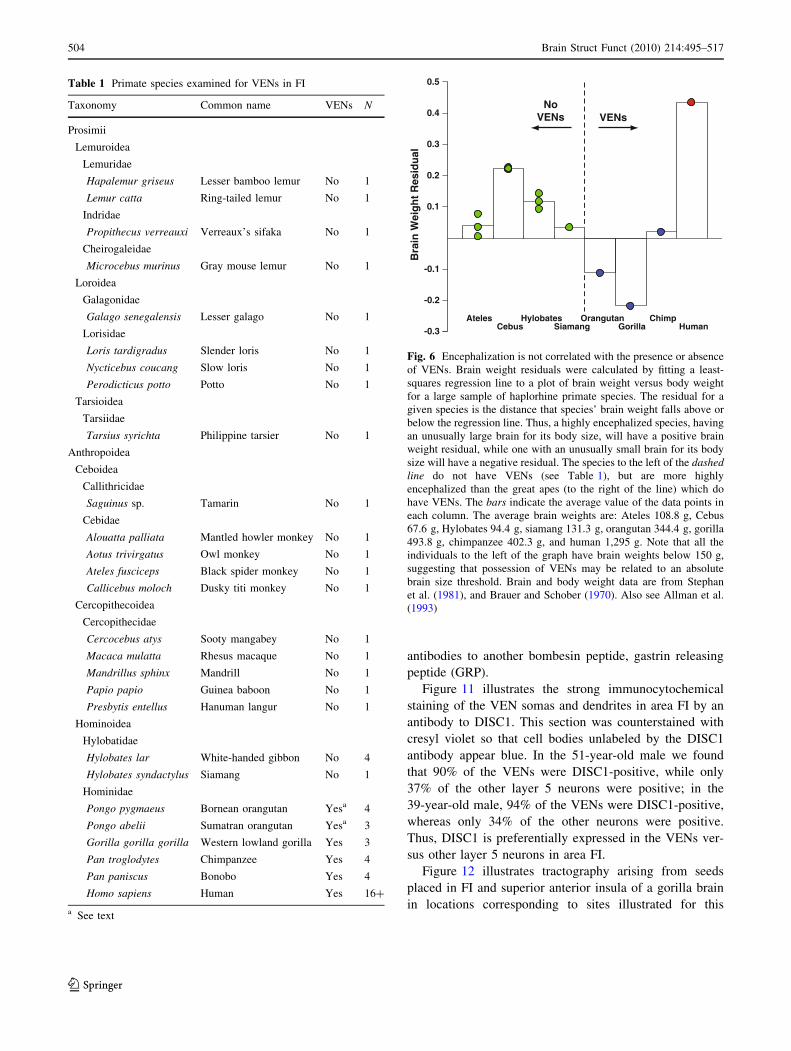
great apes and humans. In primates, the VENs are present
in FI only in great apes and humans (see Table 1). This is
the same taxonomic distribution as was found for the VENs
in LA (Nimchinsky et al. 1999), which suggests that the
VENs emerged as a specialized neuron type in the common
ancestor of great apes and humans, a primitive ape living in
the Miocene period (Kunimatsu et al. 2007). However, in
orangutans we found only one out of seven individuals
examined to have a substantial VEN population in FI and
LA. The VEN distribution in this individual, a 25-year-old
Sumatran female (Pongo abelii), closely resembled the
pattern seen in the African apes. In two of the others (adult
male Bornean orangutans, Pongo pygmaeus), the VENs
were not present in the FI region, but were abnormally
located in the gyrus rectus, which is in the medial orbito-
frontal cortex, where VENs are usually not present. In the
other four orangutans examined (an adult male Sumatran,
1 cm
A
PA
P
R
RL
A B
C
lateral view medial view
FI
LA
FI
LA
Fig. 1 The location of the
VEN-containing regions FI and
LA in MR scans of the right
hemisphere of a 39-year-old
male chimpanzee. Locations
were based on examination of
Nissl-stained histological
sections of this brain. LA and FI
are labeled in red. a and b are
lateral and medial views of a
three-dimensional
reconstruction of the right
hemisphere. c Frontal,
horizontal, and parasagittal MRI
sections that intersect in FI. The
frontal section corresponds to
approximately the same level as
the partial section from this
individual illustrated in Fig. 3
500 Brain Struct Funct (2010) 214:495–517
123
an adult male and a female Bornean, and an infant Bornean)
VENs were rare both in FI and in LA.
The occurrence of VENs is not related to relative brain
size or encephalization (Fig. 6). Some of the New World
monkeys and lesser apes (gibbons) are much more
encephalized than the great apes, but lack VENs. The
presence of VENs may be related to absolute brain size,
since the brain weights for the group on the left in Fig. 6
are much smaller than for the primates that have VENs
(see Fig. 6 legend).
Tables 2 and 3 present the stereological data that we
have collected for FI and LA in apes and humans. The key
findings are also represented in the form of graphs (Figs. 7,
8, 9). Figure 7 shows that the VENs are more numerous in
humans than in apes, but that the VENs constitute a higher
percentage of the total neurons in the regions of interest in
the apes than in humans. In LA, one of the individual apes
(a gorilla) stands out as having considerably more VENs
than the others, approaching the lower end of the human
range. The VEN count was similarly elevated relative to
the other apes in this same gorilla in FI on the left side and
also approached the lower end of the human range for this
structure (see Table 2); unfortunately postmortem damage
to the right FI in this individual made it impossible to make
a stereological count for this structure in the right hemi-
sphere. The relative abundance of VENs for this gorilla is
also illustrated in comparison to a chimpanzee in Fig. 3.
This individual gorilla had an exceptionally enriched
environment (Patterson and Gordon 2002). Although we
can conclude nothing definitive from this isolated obser-
vation, it does raise the possibility that VEN abundance
may be related to environmental influences.
We examined FI and LA in fetal brains at post-
conception ages of 32 weeks (n = 1), 33 weeks (n = 1),
34 weeks (n = 3), and 35 weeks (n = 2) and found no
VENs. In one 36 week post-conception brain, small num-
bers of VENs were present in FI and LA. Figure 8 shows
that the VENs exist in relatively low numbers in FI at birth;
A
PA
P
R
R
L
L
C
FI
LA
1 cm
A B
lateral view medial view
FI
LA
Fig. 2 The location of the
VEN-containing regions FI and
LA in MR scans of the right
hemisphere of a young adult
human female. LA and FI are
labeled in red. a and b are
lateral and medial views of a
three-dimensional
reconstruction of the right
hemisphere. c Frontal,
horizontal, and parasagittal MRI
sections that intersect in FI
Brain Struct Funct (2010) 214:495–517 501
123
in LA the VENs were so rare that we were not able to make
stereological estimates in the brains of neonates. In the
late-term neonate (42 week post-conception) the number
of VENs in FI was considerably higher than that in the
normal-term neonates (38–40 week post-conception) sug-
gesting that the number of VENs in FI increases immedi-
ately after the normal time of birth. The number of VENs is
significantly greater in the postnatal brains relative to the
neonatal brains. The percentage of total neurons that are
VENs is relatively stable in adulthood (see Tables 2, 3) and
is similar to the percentages observed by Seeley et al.
(2006).
Figure 9 illustrates the ratio between the number of
VENs in the right hemisphere and that in the left. In
newborns there is no clear hemispheric preference, but
nearly all of the postnatal humans and all of the apes show
a clear predominance of VENs in the right hemisphere both
in FI and in LA. The predominance is greatest in the 7 and
8-month-old infants. These data also suggest that the VENs
develop in the right hemisphere before the left, which is
consistent with the general pattern of the right hemisphere
developing earlier than the left in embryogenesis (Gilles
et al. 1983). In a large MRI study of adult humans, the
cortex in the regions of FI and ACC was significantly
larger on the right side than the left (Watkins et al. 2001).
Figure 10 shows immunocytochemical staining by an
antibody to neuromedin B (NMB). The strong NMB
staining was largely restricted to layer 5 (Fig. 10a). It is
mainly the VENs which are NMB stained (Fig. 10b),
although other classes of cells, including the fork cells and
other neurons, are stained in layer 5 of FI in humans
(Fig. 10c). We obtained similar staining in FI with
Fig. 3 Distribution of the VENs in area FI in a 39-year-old male
chimpanzee, a 27-year-old male gorilla, and a 1.6-year-old male
human. On the left side are photomicrographs of a section through the
FI region in each individual. On the right side are outlines of these
sections in which the location of each VEN has been plotted. There
are 354 VENs plotted in the chimpanzee, 919 in the gorilla, and 2,415
in the human. Plots were made using a 409 oil immersion lens
and total coverage was ensured by using the stereology program
StereoInvestigator. Sections were 100 lm thick. All images are
represented at the same scale. The sections are from right FI except
for the gorilla, in which right FI was damaged during histological
processing; left FI was substituted and the image reversed for ease of
comparison with the other cases. The locations of the higher
magnification photomicrographs shown in Fig. 4 are indicated on
these sections by arrows (black for SAI, white for FI). The section of
the gorilla corresponds approximately to Fig 12b, showing the
location of the seed voxels for the tractography performed in this
individual. FI frontoinsular cortex, SAI superior insular cortex
502 Brain Struct Funct (2010) 214:495–517
123
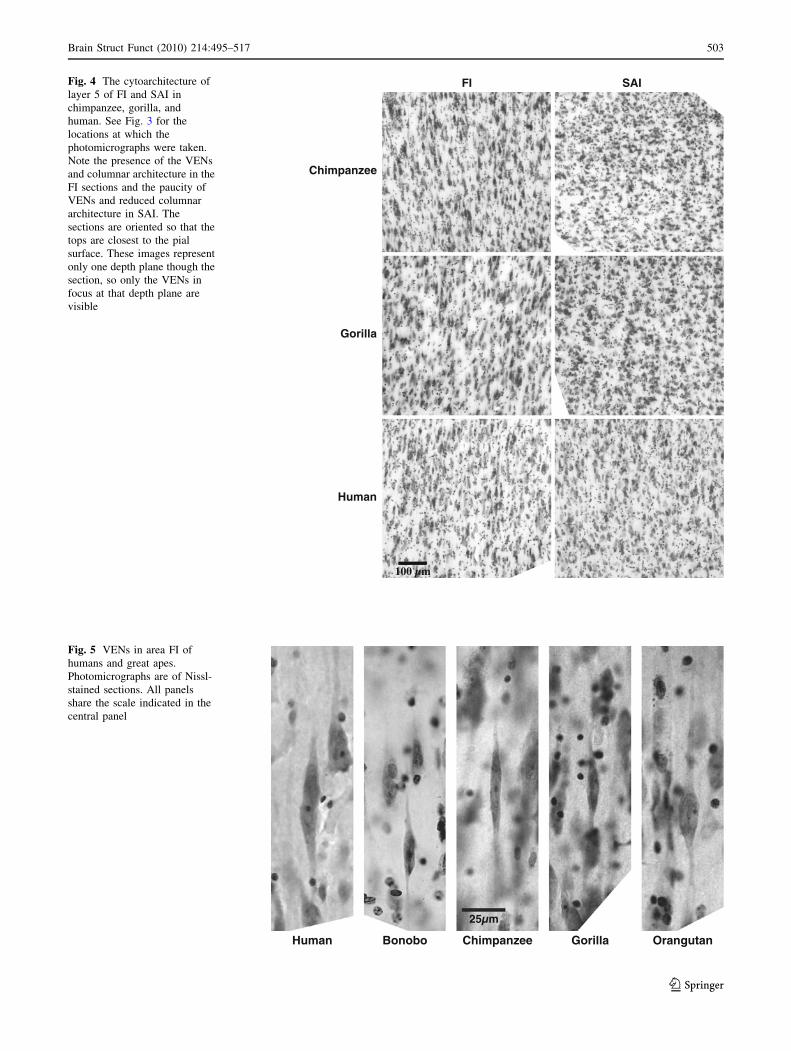
Chimpanzee
Human
FI SAI
Gorilla
Fig. 4 The cytoarchitecture of
layer 5 of FI and SAI in
chimpanzee, gorilla, and
human. See Fig. 3 for the
locations at which the
photomicrographs were taken.
Note the presence of the VENs
and columnar architecture in the
FI sections and the paucity of
VENs and reduced columnar
architecture in SAI. The
sections are oriented so that the
tops are closest to the pial
surface. These images represent
only one depth plane though the
section, so only the VENs in
focus at that depth plane are
visible
Human Bonobo Chimpanzee Gorilla Orangutan
25 mµ
Fig. 5 VENs in area FI of
humans and great apes.
Photomicrographs are of Nissl-
stained sections. All panels
share the scale indicated in the
central panel
Brain Struct Funct (2010) 214:495–517 503
123
antibodies to another bombesin peptide, gastrin releasing
peptide (GRP).
Figure 11 illustrates the strong immunocytochemical
staining of the VEN somas and dendrites in area FI by an
antibody to DISC1. This section was counterstained with
cresyl violet so that cell bodies unlabeled by the DISC1
antibody appear blue. In the 51-year-old male we found
that 90% of the VENs were DISC1-positive, while only
37% of the other layer 5 neurons were positive; in the
39-year-old male, 94% of the VENs were DISC1-positive,
whereas only 34% of the other neurons were positive.
Thus, DISC1 is preferentially expressed in the VENs ver-
sus other layer 5 neurons in area FI.
Figure 12 illustrates tractography arising from seeds
placed in FI and superior anterior insula of a gorilla brain
in locations corresponding to sites illustrated for this
Table 1 Primate species examined for VENs in FI
Taxonomy Common name VENs N
Prosimii
Lemuroidea
Lemuridae
Hapalemur griseus Lesser bamboo lemur No 1
Lemur catta Ring-tailed lemur No 1
Indridae
Propithecus verreauxi Verreaux’s sifaka No 1
Cheirogaleidae
Microcebus murinus Gray mouse lemur No 1
Loroidea
Galagonidae
Galago senegalensis Lesser galago No 1
Lorisidae
Loris tardigradus Slender loris No 1
Nycticebus coucang Slow loris No 1
Perodicticus potto Potto No 1
Tarsioidea
Tarsiidae
Tarsius syrichta Philippine tarsier No 1
Anthropoidea
Ceboidea
Callithricidae
Saguinus sp. Tamarin No 1
Cebidae
Alouatta palliata Mantled howler monkey No 1
Aotus trivirgatus Owl monkey No 1
Ateles fusciceps Black spider monkey No 1
Callicebus moloch Dusky titi monkey No 1
Cercopithecoidea
Cercopithecidae
Cercocebus atys Sooty mangabey No 1
Macaca mulatta Rhesus macaque No 1
Mandrillus sphinx Mandrill No 1
Papio papio Guinea baboon No 1
Presbytis entellus Hanuman langur No 1
Hominoidea
Hylobatidae
Hylobates lar White-handed gibbon No 4
Hylobates syndactylus Siamang No 1
Hominidae
Pongo pygmaeus Bornean orangutan Yesa 4
Pongo abelii Sumatran orangutan Yesa 3
Gorilla gorilla gorilla Western lowland gorilla Yes 3
Pan troglodytes Chimpanzee Yes 4
Pan paniscus Bonobo Yes 4
Homo sapiens Human Yes 16?
a See text
GorillaChimpOrangutan
CebusAteles Hylobates
Siamang
0.5
0.4
0.3
0.2
0.1
-0.1
-0.2
-0.3
Bra
in W
eig
ht
Res
idu
al
Human
NoVENs VENs
Fig. 6 Encephalization is not correlated with the presence or absence
of VENs. Brain weight residuals were calculated by fitting a least-
squares regression line to a plot of brain weight versus body weight
for a large sample of haplorhine primate species. The residual for a
given species is the distance that species’ brain weight falls above or
below the regression line. Thus, a highly encephalized species, having
an unusually large brain for its body size, will have a positive brain
weight residual, while one with an unusually small brain for its body
size will have a negative residual. The species to the left of the dashedline do not have VENs (see Table 1), but are more highly
encephalized than the great apes (to the right of the line) which do
have VENs. The bars indicate the average value of the data points in
each column. The average brain weights are: Ateles 108.8 g, Cebus
67.6 g, Hylobates 94.4 g, siamang 131.3 g, orangutan 344.4 g, gorilla
493.8 g, chimpanzee 402.3 g, and human 1,295 g. Note that all the
individuals to the left of the graph have brain weights below 150 g,
suggesting that possession of VENs may be related to an absolute
brain size threshold. Brain and body weight data are from Stephan
et al. (1981), and Brauer and Schober (1970). Also see Allman et al.
(1993)
504 Brain Struct Funct (2010) 214:495–517
123
Ta
ble
2S
tere
olo
gic
alco
un
tso
fV
EN
sin
fro
nto
-in
sula
rco
rtex
(FI)
Sp
ecie
sA
ge
Sex
FI
VE
Ns
L
Gu
nd
.
CE
FI
neu
ron
s
L
Gu
nd
.
CE
FI
VE
Ns
R
Gu
nd
.
CE
FI
neu
ron
s
R
Gu
nd
.
CE
VE
Nra
tio
R/L
VE
N%
Co
mm
ents
H.
sap
ien
s8
6y
ears
M6
5,5
00
0.0
5a
7,1
12
,50
00
.04
a9
7,9
20
91
,58
0b
0.0
4a
6,1
78
,50
00
.04
a1
.45
1.2
1M
U-7
5-6
4d
H.
sap
ien
s7
1y
ears
M3
5,1
80
0.0
75
c4
7,6
70
0.0
58
c1
.35
e
H.
sap
ien
s5
8y
ears
M9
0,0
00
0.0
4a
8,9
87
,50
00
.04
a1
28
,37
50
.03
a1
0,7
00
,00
00
.04
a1
.43
1.5
7M
U-1
69
-87
d
H.
sap
ien
s5
0y
ears
F4
9,5
00
47
,50
0b
4,9
76
,00
06
0,1
20
60
,32
0b
4,9
12
,00
01
.24
1.1
0v
42
d
H.
sap
ien
s5
0y
ears
M7
5,4
20
0.0
5a
8,0
10
,00
00
.05
a8
6,5
80
0.0
5a
9,6
30
,00
00
.04
a1
.15
0.9
18
MU
-88
-65
d
H.
sap
ien
s8
yea
rsF
75
,21
02
,97
8,5
70
#1
86
0f
H.
sap
ien
s4
yea
rsF
79
,34
01
24
,83
02
,37
5,2
10
1.5
7M
U-9
2-6
5d
H.
sap
ien
s1
yea
r7
mo
nth
sM
10
0,1
90
0.0
4a
1,8
15
,92
00
.03
a#
42
47
f
H.
sap
ien
s8
mo
nth
sM
74
,00
03
22
,91
0
30
8,8
90
b
0.0
5,
0.0
45
,86
6,0
70
0.0
4,
0.0
24
.27
MU
-93
-65
d
H.
sap
ien
s7
mo
nth
sM
27
,72
05
4,8
40
1.9
8R
PS
L-B
-12
3-6
1d
H.
sap
ien
s4
mo
nth
sM
22
,10
00
.16
,0
.16
30
,89
00
.1,
0.0
61
,03
2,6
40
0.0
7,
0.0
31
.40
MU
-95
-65
d
H.
sap
ien
s4
2w
eek
sp
cF
25
,62
03
7,7
00
1.4
7R
PS
L-B
-19
7-6
1d
H.
sap
ien
s4
0w
eek
sp
cM
11
,60
00
.09
,0
.09
12
,40
00
.16
,0
.09
1.0
7R
PS
L-B
-10
1-6
1d
H.
sap
ien
s3
9w
eek
sp
cM
5,7
50
0.1
4,
0.1
35
,16
00
.13
,0
.14
0.9
0R
PS
L-B
-25
0-6
2d
H.
sap
ien
s3
8w
eek
sp
cF
11
,01
00
.11
,0
.10
10
,71
00
.16
,0
.18
36
,75
00
.1,
0.0
50
.97
RP
SL
-B-2
36
-61
d
H.
sap
ien
s3
6w
eek
sp
cF
Rar
eR
are
RP
SL
-W-5
-59
d
H.
sap
ien
s3
5w
eek
sp
cM
00
RP
SL
-B-2
84
-62
d
H.
sap
ien
s3
5w
eek
sp
cM
00
RP
SL
-W-1
23
-63
d
H.
sap
ien
s3
4w
eek
sp
cF
00
RP
SL
-W-2
32
-66
d
H.
sap
ien
s3
4w
eek
sp
cF
00
RP
SL
-W-2
42
-67
d
H.
sap
ien
s3
4w
eek
sp
cF
00
RP
SL
-WX
-20
7-6
5d
H.
sap
ien
s3
3w
eek
sp
cF
00
RP
SL
-W-1
84
-64
d
H.
sap
ien
s3
2w
eek
sp
cF
00
RP
SL
-W-4
6-6
2d
G.
go
rill
a2
7M
28
,50
00
.07
a1
,10
0,0
00
0.0
5g
G.
go
rill
a2
0F
7,2
60
0.0
87
c9
,45
00
.06
9c
1.3
0e
G.
go
rill
a3
9F
2,8
40
0.1
,0
.07
23
0,4
80
0.0
7,
0.0
43
,77
01
86
,67
01
.33
1.5
8g
P.
pa
nis
cus
11
F9
40
0.1
1c
1,2
14
0.0
97
c1
.29
e
P.
pa
nis
cus
2F
64
00
.15
c8
10
0.1
4c
1.2
7e
P.
pa
nis
cus
16
M6
,48
00
.1,
0.0
61
15
,28
00
.11
,0
.08
g
P.
pa
nis
cus
M7
,56
00
.12
,0
.07
36
6,4
10
0.1
,0
.06
10
,56
00
.15
,0
.06
38
2,0
30
0.1
5,
0.0
61
.40
2.4
2g
P.
tro
glo
dyt
es5
,40
07
,18
01
.33
d
P.
tro
glo
dyt
esF
79
00
.11
c1
,06
00
.12
c1
.34
e
Brain Struct Funct (2010) 214:495–517 505
123
Ta
ble
2co
nti
nu
ed
Sp
ecie
sA
ge
Sex
FI
VE
NsL
Gu
nd
.CE
FI
neu
ron
sL
Gu
nd
.CE
FI
VE
NsR
Gu
nd
.CE
FI
neu
ron
sR
Gu
nd
.CE
VE
N
rati
oR
/L
VE
N%
Co
mm
ents
P.
tro
glo
dyt
es3
9M
8,4
10
41
9,8
00
10
,76
04
84
,92
01
.28
2.1
2g
P.
tro
glo
dyt
esF
00
h
P.
ab
elii
25
F2
,51
08
8,1
25
3,5
80
0.0
9,
0.0
41
59
,84
01
.43
2.4
6g
P.
ab
elii
16
MR
are
Rar
ee
P.
pyg
ma
eus
36
M0
0e
P.
pyg
ma
eus
34
M0
0e
P.
pyg
ma
eus
38
FR
are
Rar
eg
P.
pyg
ma
eus
8m
on
ths
Rar
eR
are
g
P.
ab
elii
17
FR
are
Rar
eg
aG
un
der
son
m=
1C
Eo
nly
bC
ou
nt
was
rep
eate
d,
wit
hth
eav
erag
eo
fb
oth
val
ues
use
dfo
rca
lcu
lati
on
sc
Gu
nd
erso
nC
Eca
lcu
late
dm
anu
ally
dY
ako
vle
vco
llec
tio
nat
the
Nat
ion
alM
use
um
of
Hea
lth
and
Med
icin
ee
Sem
end
efer
ico
llec
tio
nf
NIC
HD
Bra
inan
dT
issu
eB
ank
for
Dev
elo
pm
enta
lD
iso
rder
s,U
niv
ersi
tyo
fM
ary
lan
dg
Mo
un
tS
inai
/Ho
fL
ab/A
llm
anL
abh
Wel
ker
coll
ecti
on
atth
eN
atio
nal
Mu
seu
mo
fH
ealt
han
dM
edic
ine
506 Brain Struct Funct (2010) 214:495–517
123
Ta
ble
3S
tere
olo
gic
alco
un
tso
fV
EN
sin
the
lim
bic
ante
rio
r(L
A)
area
of
ante
rio
rci
ng
ula
teco
rtex
Sp
ecie
sA
ge
Sex
LA
VE
Ns
L
Gu
nd
.C
EL
An
euro
ns
L
Gu
nd
.C
EL
AV
EN
sR
Gu
nd
.C
EL
An
euro
ns
R
Gu
nd
.C
EV
enra
tio
R/L
VE
N%
Co
mm
ents
H.
sap
ien
s8
6y
ears
M1
78
,50
00
.04
a2
0,1
75
,00
00
.04
a1
90
,50
00
.04
a2
0,4
50
,00
00
.04
a1
.07
0.9
08
MU
-75
-64
c
H.
sap
ien
s5
8y
ears
M1
69
,92
00
.05
a2
2,2
08
,00
00
.04
a2
08
,00
00
.04
a1
8,5
92
,00
00
.04
a1
.22
0.9
26
MU
-16
9-8
7c
H.
sap
ien
s5
0y
ears
F1
32
,00
02
4,5
76
,00
02
13
,50
02
2,5
28
,00
01
.62
0.7
33
V-4
2-5
7c
H.
sap
ien
s5
0y
ears
M6
6,9
60
14
,29
2,0
00
12
7,0
00
19
,76
4,0
00
1.9
00
.56
9M
U-8
8-6
5c
H.
sap
ien
s4
yea
rsF
18
4,3
17
0.0
9,
0.0
51
90
,90
00
.09
,0
.06
1.0
4M
U-9
2-6
5c
H.
sap
ien
s8
mo
nth
sM
18
3,1
10
16
,01
7,1
60
22
3,2
20
13
,37
0,2
80
1.2
21
.38
MU
-93
-65
c
H.
sap
ien
s7
mo
nth
sM
23
6,2
90
0.1
7,
0.0
62
5,2
91
,15
03
83
,65
00
.16
,0
.05
26
,11
8,7
50
1.6
21
.21
RP
SL
-B-1
23
-61
c
H.
sap
ien
s4
mo
nth
sM
10
3,4
10
0.1
6,
0.1
61
1,1
16
,00
01
02
,29
00
.1,
0.0
61
2,8
05
,33
00
.07
,0
.03
0.9
90
.86
0M
U-9
5-6
5c
H.
sap
ien
s2
.5m
on
ths
MR
are
Rar
eR
PS
L-9
7-6
5c
H.
sap
ien
s4
8d
ays
FR
are
Rar
eR
PS
L-W
-16
0-6
4c
H.
sap
ien
s3
2w
eek
sp
cF
Rar
eR
are
RP
SL
-B-1
97
-61
c
H.
sap
ien
s4
0w
eek
sp
cM
Rar
eR
are
RP
SL
-B-1
01
-61
c
H.
sap
ien
s3
9w
eek
sp
cM
Rar
eR
are
RP
SL
-B-2
50
-62
c
H.
sap
ien
s3
8w
eek
sp
cF
Rar
eR
are
RP
SL
-B-2
36
-61
c
H.
sap
ien
s3
6w
eek
sp
cF
Rar
eR
are
RP
SL
-W-5
-59
c
H.
sap
ien
s3
5w
eek
sp
cM
Rar
eR
are
RP
SL
-B-2
84
-62
c
H.
sap
ien
s3
4w
eek
sp
cF
00
RP
SL
-W-2
42
-67
c
H.
sap
ien
s3
4w
eek
sp
cF
00
RP
SL
-W-2
32
-66
c
H.
sap
ien
s3
3w
eek
sp
cF
00
RP
SL
-W-1
84
-64
c
G.
go
rill
a2
7M
83
,23
04
,18
2,3
00
97
,92
04
,28
1,2
50
1.1
82
.14
e
G.
go
rill
a3
9F
7,6
70
0.2
4,
0.1
35
36
,11
00
.16
,0
.08
17
,55
50
.16
,0
.09
65
5,5
50
2.2
92
.12
e
P.
pa
nis
cus
16
M4
7,3
33
0.1
8,
0.0
61
,04
2,6
70
0.1
7,
0.0
6e
P.
pa
nis
cus
M1
8,7
40
0.2
3,
0.0
91
,19
9,7
90
0.1
7,
0.0
62
9,3
58
0.1
4,
0.0
71
,27
8,3
30
0.1
2,
0.0
51
.57
1.9
4e
P.
tro
glo
dyt
es3
9M
49
,83
00
.13
b1
,44
1,6
70
0.1
3b
62
,50
00
.11
b1
,59
1,6
70
0.1
3b
1.2
53
.70
e
P.
ab
elii
25
F2
9,7
60
0.1
3,
0.0
72
,65
2,1
90
0.0
9,
0.0
74
5,7
50
0.0
7,
0.0
52
,15
0,0
00
0.0
7,
0.0
41
.54
1.5
7e
P.
ab
elii
16
MR
are
Rar
ed
P.
pyg
ma
eus
36
MR
are
Rar
ed
P.
pyg
ma
eus
34
MR
are
Rar
ed
P.
pyg
ma
eus
38
FR
are
Rar
ee
P.
pyg
ma
eus
8m
on
ths
Rar
eR
are
e
P.
ab
elii
17
FR
are
Rar
ee
aG
un
der
son
m=
1C
Eo
nly
bG
un
der
son
CE
calc
ula
ted
man
ual
lyc
Yak
ov
lev
coll
ecti
on
atth
eN
atio
nal
Mu
seu
mo
fH
ealt
han
dM
edic
ine
dS
emen
def
eri
coll
ecti
on
eM
ou
nt
Sin
ai/H
of
Lab
/All
man
Lab
Brain Struct Funct (2010) 214:495–517 507
123
individual in Fig. 3. Figure 12a is a lateral view of the
brain showing the levels depicted in 12b through l. Each
seed depicted in 12b corresponds to a single voxel. The
connections for the medial seed in FI are illustrated in
green; the connections for the lateral FI seed are in red; the
connections for the superior anterior insula seed are in
blue. Where these connections overlap the connections are
depicted as mixtures of these colors. Figure 12c through l
shows the MR sections proceeding from anterior to pos-
terior containing the color-coded tracts. Figure 12c and d
show connectivity between the FI seeds and the frontal
polar cortex present in both hemispheres, but stronger on
the ipsilateral side. Figure 12e shows that the medial FI
seed connection (green) has shifted laterally at this level
and the lateral FI and superior AI seeds have more dorsal
connections depicted in red and purple (for the overlap
between red and blue) at this level. Figure 12g and h show
that the lateral FI and superior AI seeds are connected to
the inferior frontal gyrus at these levels. Medial FI is
connected with the septum, and lateral FI has connections
in the corpus callosum at this level. Figure 12j shows
connections between medial FI and the amygdala.
Figure 12k shows lateral FI and superior AI connections
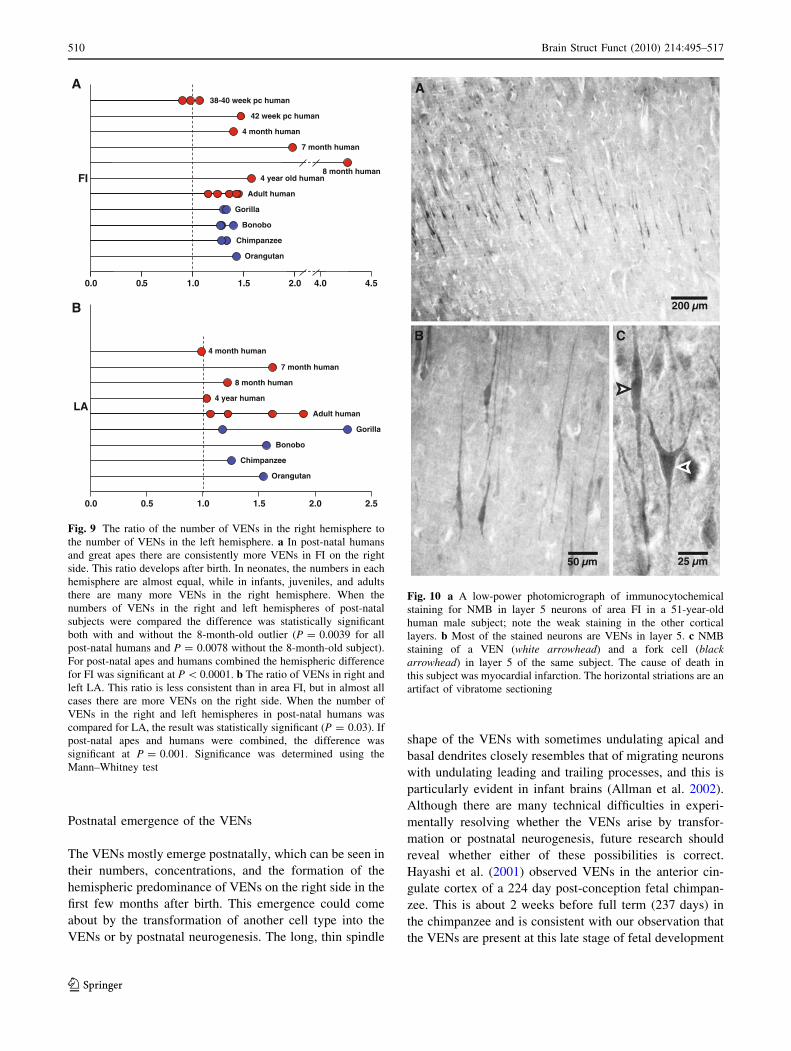
with the posterior insula and medial FI with connections
near inferotemporal cortex. Figure 12l shows lateral FI and
superior FI connections just lateral to the hippocampus.
Discussion
The VENs are a phylogenetically recent specialization in
hominoid evolution. The VENs in FI and in LA tend to be
more numerous on the crowns of gyri, suggesting that the
VEN-containing areas have undergone differential expan-
sion reminiscent of other cortical specializations, such as
the representations of the highly sensitive pads of the
forepaw in the raccoon somatosensory cortex (Welker and
Seidenstein 1959; Allman 2000). Especially in the human
0
50,000
100,000
150,000
200,000
Nu
mb
er o
f V
EN
s, a
rea
FI
Apes Humans Apes Humans0
0.5
1.0
1.5
2.0
2.5%
% o
f n
euro
ns
that
are
VE
Ns,
are
a F
I
Apes Humans0
100,000
200,000
300,000
400,000
Nu
mb
er o
f V
EN
s, L
A
Apes Humans0
1.0
2.0
3.0
4.0%
% o
f n
euro
ns
that
are
VE
Ns,
LA
A
DC
BFig. 7 A comparison of the
number and proportion of VENs
in areas FI and LA of adult
humans and great apes. (See
Tables 2, 3 for data.) Barsindicate the average of all data
points in a given column. a The
number of VENs in area FI
(both hemispheres combined).
FI contains significantly more
VENs in humans than in great
apes (P = 0.001). b The
percentage of neurons in area FI
that are VENs. Although the
great apes have a smaller total
number of VENs in FI, they
have a significantly higher
proportion of VENs to total
neurons in FI (P = 0.029).
c The number of VENs in LA
(both hemispheres combined).
As in area FI, humans have
more VENs than do the great
apes (P = 0.016), although this
difference is smaller in LA.
d The percentage of neurons in
LA that are VENs. Again, as in
FI, the great apes have a higher
percentage of neurons that are
VENs (P = 0.016). All
comparisons are Mann–Whitney
tests
508 Brain Struct Funct (2010) 214:495–517
123
brain, there is considerable variability in the presence and
number of small sulci and gyri within FI, and these influ-
ence the VEN distributions. The concentration of VENs in
the crowns of small gyri is also a notable feature of FI in
the elephant (Hakeem et al. 2009).
The possession of VENs in primates is not related to
relative brain size or encephalization (see Fig. 6). Instead it
appears to be related to absolute brain size. The VENs are
present in primates with adult brain sizes greater than about
300 g. They are also present in the apparent homologs of FI
and LA in other mammals with very large brains, such as
cetaceans and elephants (Hof and Van der Gucht 2007;
Butti et al. 2009; Hakeem et al. 2009). Nearly all of these
mammals are also highly social. We think that both large
brain size and complex social behavior favor specialized
neural systems for rapid communication within brain cir-
cuits. Large brains may be inherently slower because of the
greater distances over which messages must be sent. Large
brains also suffer from the limitations associated with
packing large myelinated axons into a restricted space.
However, fiber pathways in large brains have small sets of
very large axons, which may serve as a compromise
between the needs for rapid communication and the
packing constraint (Wang et al. 2008). Thus, the evolution
of the VENs may be an adaptation related to large brain
size. Complex social behavior is often fast-paced, and this
puts a premium on the capacity to respond quickly to
changing conditions. A basic function of FI may be to
register feedback crucial for initiating fast adaptive
responses to changes. This would be consistent with the
activity of FI preceding linked activity in ACC and other
cortical areas (Sridharan et al. 2008).
We found two interesting differences between the dis-
tribution of VENs in humans and apes. The first difference
between humans and apes is the relationship between area
FI and agranular insular cortex, i.e. insular cortex lacking a
layer 4. In humans, area FI, which is defined by the presence
of VENs, appears to correspond to most of agranular insular
cortex as delineated by Rose (1928). However, in apes area
FI appears to correspond to a smaller part of the total
agranular insular cortex. This difference may explain why
there are typically considerably more VENs in humans than
in apes. The second difference between humans and apes is
that the density of VENs relative to other neurons in FI and
LA is significantly higher in apes than in humans. One
possible explanation for this surprising finding is that there
may be other specialized neuronal populations that are
differentially expanded in humans relative to apes. The
presence and distribution of VENs are variable in orangu-
tans, as are reports of their social behavior (Galdikas 1985;
Mitani et al. 1991; Singleton and Van Schaik 2002), which
range from solitary to relatively social, although typically
orangutans are found to participate in smaller social groups
than the other great apes. It is of interest that other parts of
the neural systems underlying social behavior, such as the
amygdala and the orbitofrontal cortex, are smaller or sim-
pler in orangutans than in other great apes (Barger et al.
2007; Schenker et al. 2005; Semendeferi et al. 1998).
pre-natal post-natal300,000
250,000
200,000
150,000
100,000
50,000
0
Nu
mb
er o
f V
EN
s
34 wkpc
38-40wk pc
42 wkpc
4 mo 7 mo 8 mo 19 mo 4 yr Adult8 yr
Fig. 8 The number of VENs increases after birth. The number of
VENs in right FI in humans of different ages. VEN numbers are low
in neonates and increase after birth. The 8-month-old individual
examined had markedly more VENs in the right hemisphere than any
other subject in this study; this might possibly be due to individual
variation. The right hemisphere VEN measurement in this individual
was repeated with similar results (see Table 2). The difference
between the number of VENs in right FI for pre- and post-natal
subjects was statistically significant (P = 0.0029), and this signifi-
cance remained when the 8-month-old individual was removed from
the comparison (P = 0.0040). The number of VENS in left FI and in
both hemispheres together was also significantly different for pre- and
post-natal individuals (P = 0.0056 for both). Significance was
determined using the Mann–Whitney test
Brain Struct Funct (2010) 214:495–517 509
123
Postnatal emergence of the VENs
The VENs mostly emerge postnatally, which can be seen in
their numbers, concentrations, and the formation of the
hemispheric predominance of VENs on the right side in the
first few months after birth. This emergence could come
about by the transformation of another cell type into the
VENs or by postnatal neurogenesis. The long, thin spindle
shape of the VENs with sometimes undulating apical and
basal dendrites closely resembles that of migrating neurons
with undulating leading and trailing processes, and this is
particularly evident in infant brains (Allman et al. 2002).
Although there are many technical difficulties in experi-
mentally resolving whether the VENs arise by transfor-
mation or postnatal neurogenesis, future research should
reveal whether either of these possibilities is correct.
Hayashi et al. (2001) observed VENs in the anterior cin-
gulate cortex of a 224 day post-conception fetal chimpan-
zee. This is about 2 weeks before full term (237 days) in
the chimpanzee and is consistent with our observation that
the VENs are present at this late stage of fetal development
1.50.0
2.051.1.00.50.0 4.54.0
LA
FI
2.52.01.00.5
Orangutan
Chimpanzee
Bonobo
Gorilla
Adult human
4 year old human8 month human
7 month human
4 month human
42 week pc human
38-40 week pc human
Adult human
Orangutan
Chimpanzee
Bonobo
Gorilla
8 month human
7 month human
4 month human
4 year human
A
B
Fig. 9 The ratio of the number of VENs in the right hemisphere to
the number of VENs in the left hemisphere. a In post-natal humans
and great apes there are consistently more VENs in FI on the right
side. This ratio develops after birth. In neonates, the numbers in each
hemisphere are almost equal, while in infants, juveniles, and adults
there are many more VENs in the right hemisphere. When the
numbers of VENs in the right and left hemispheres of post-natal
subjects were compared the difference was statistically significant
both with and without the 8-month-old outlier (P = 0.0039 for all
post-natal humans and P = 0.0078 without the 8-month-old subject).
For post-natal apes and humans combined the hemispheric difference
for FI was significant at P \ 0.0001. b The ratio of VENs in right and
left LA. This ratio is less consistent than in area FI, but in almost all
cases there are more VENs on the right side. When the number of
VENs in the right and left hemispheres in post-natal humans was
compared for LA, the result was statistically significant (P = 0.03). If
post-natal apes and humans were combined, the difference was
significant at P = 0.001. Significance was determined using the
Mann–Whitney test
A
B C
50 mµ 25 mµ
200 mµ
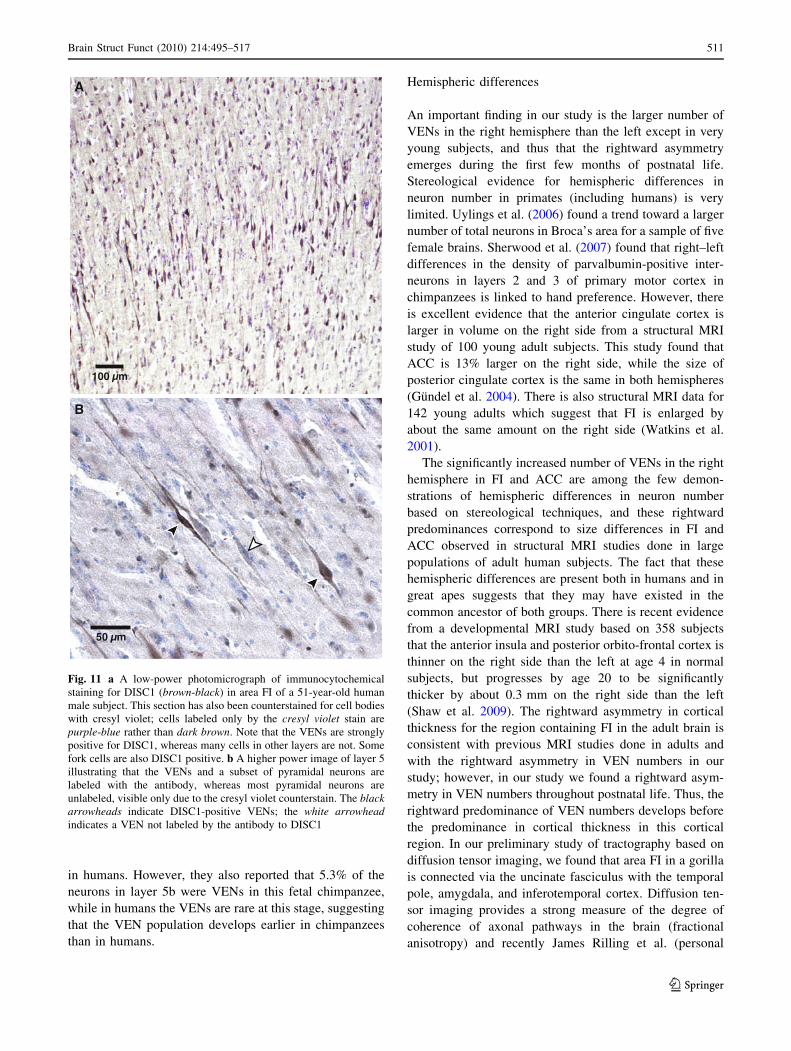
Fig. 10 a A low-power photomicrograph of immunocytochemical
staining for NMB in layer 5 neurons of area FI in a 51-year-old
human male subject; note the weak staining in the other cortical
layers. b Most of the stained neurons are VENs in layer 5. c NMB
staining of a VEN (white arrowhead) and a fork cell (blackarrowhead) in layer 5 of the same subject. The cause of death in
this subject was myocardial infarction. The horizontal striations are an
artifact of vibratome sectioning
510 Brain Struct Funct (2010) 214:495–517
123
in humans. However, they also reported that 5.3% of the
neurons in layer 5b were VENs in this fetal chimpanzee,
while in humans the VENs are rare at this stage, suggesting
that the VEN population develops earlier in chimpanzees
than in humans.
Hemispheric differences
An important finding in our study is the larger number of
VENs in the right hemisphere than the left except in very
young subjects, and thus that the rightward asymmetry
emerges during the first few months of postnatal life.
Stereological evidence for hemispheric differences in
neuron number in primates (including humans) is very
limited. Uylings et al. (2006) found a trend toward a larger
number of total neurons in Broca’s area for a sample of five
female brains. Sherwood et al. (2007) found that right–left
differences in the density of parvalbumin-positive inter-
neurons in layers 2 and 3 of primary motor cortex in
chimpanzees is linked to hand preference. However, there
is excellent evidence that the anterior cingulate cortex is
larger in volume on the right side from a structural MRI
study of 100 young adult subjects. This study found that
ACC is 13% larger on the right side, while the size of
posterior cingulate cortex is the same in both hemispheres
(Gundel et al. 2004). There is also structural MRI data for
142 young adults which suggest that FI is enlarged by
about the same amount on the right side (Watkins et al.
2001).
The significantly increased number of VENs in the right
hemisphere in FI and ACC are among the few demon-
strations of hemispheric differences in neuron number
based on stereological techniques, and these rightward
predominances correspond to size differences in FI and
ACC observed in structural MRI studies done in large
populations of adult human subjects. The fact that these
hemispheric differences are present both in humans and in
great apes suggests that they may have existed in the
common ancestor of both groups. There is recent evidence
from a developmental MRI study based on 358 subjects
that the anterior insula and posterior orbito-frontal cortex is
thinner on the right side than the left at age 4 in normal
subjects, but progresses by age 20 to be significantly
thicker by about 0.3 mm on the right side than the left
(Shaw et al. 2009). The rightward asymmetry in cortical
thickness for the region containing FI in the adult brain is
consistent with previous MRI studies done in adults and
with the rightward asymmetry in VEN numbers in our
study; however, in our study we found a rightward asym-
metry in VEN numbers throughout postnatal life. Thus, the
rightward predominance of VEN numbers develops before
the predominance in cortical thickness in this cortical
region. In our preliminary study of tractography based on
diffusion tensor imaging, we found that area FI in a gorilla
is connected via the uncinate fasciculus with the temporal
pole, amygdala, and inferotemporal cortex. Diffusion ten-
sor imaging provides a strong measure of the degree of
coherence of axonal pathways in the brain (fractional
anisotropy) and recently James Rilling et al. (personal
50 mµ
A
B
100 mµ
Fig. 11 a A low-power photomicrograph of immunocytochemical
staining for DISC1 (brown-black) in area FI of a 51-year-old human
male subject. This section has also been counterstained for cell bodies
with cresyl violet; cells labeled only by the cresyl violet stain are
purple-blue rather than dark brown. Note that the VENs are strongly
positive for DISC1, whereas many cells in other layers are not. Some
fork cells are also DISC1 positive. b A higher power image of layer 5
illustrating that the VENs and a subset of pyramidal neurons are
labeled with the antibody, whereas most pyramidal neurons are
unlabeled, visible only due to the cresyl violet counterstain. The blackarrowheads indicate DISC1-positive VENs; the white arrowheadindicates a VEN not labeled by the antibody to DISC1
Brain Struct Funct (2010) 214:495–517 511
123
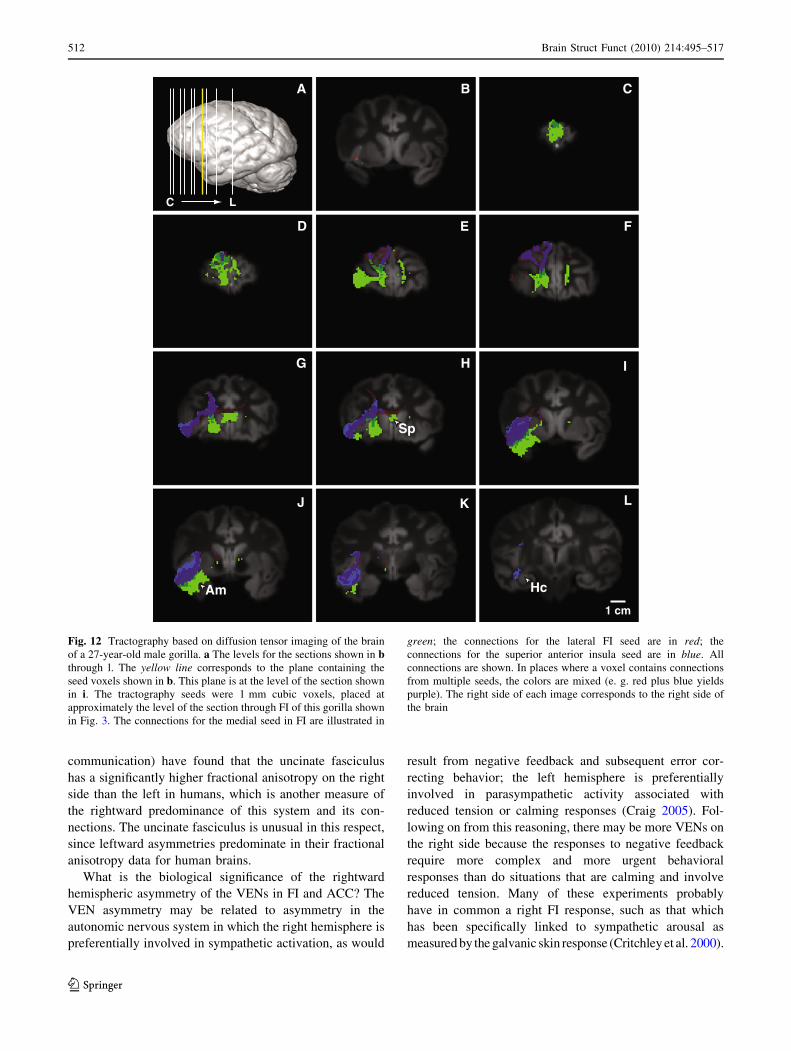
communication) have found that the uncinate fasciculus
has a significantly higher fractional anisotropy on the right
side than the left in humans, which is another measure of
the rightward predominance of this system and its con-
nections. The uncinate fasciculus is unusual in this respect,
since leftward asymmetries predominate in their fractional
anisotropy data for human brains.
What is the biological significance of the rightward
hemispheric asymmetry of the VENs in FI and ACC? The
VEN asymmetry may be related to asymmetry in the
autonomic nervous system in which the right hemisphere is
preferentially involved in sympathetic activation, as would
result from negative feedback and subsequent error cor-
recting behavior; the left hemisphere is preferentially
involved in parasympathetic activity associated with
reduced tension or calming responses (Craig 2005). Fol-
lowing on from this reasoning, there may be more VENs on
the right side because the responses to negative feedback
require more complex and more urgent behavioral
responses than do situations that are calming and involve
reduced tension. Many of these experiments probably
have in common a right FI response, such as that which
has been specifically linked to sympathetic arousal as
measured by the galvanic skin response (Critchley et al. 2000).
E
H
Sp
B
K
D
G
A
J
Am
F
I
C
L
1 cm
Hc
C L
Fig. 12 Tractography based on diffusion tensor imaging of the brain
of a 27-year-old male gorilla. a The levels for the sections shown in bthrough l. The yellow line corresponds to the plane containing the
seed voxels shown in b. This plane is at the level of the section shown
in i. The tractography seeds were 1 mm cubic voxels, placed at
approximately the level of the section through FI of this gorilla shown
in Fig. 3. The connections for the medial seed in FI are illustrated in
green; the connections for the lateral FI seed are in red; the
connections for the superior anterior insula seed are in blue. All
connections are shown. In places where a voxel contains connections
from multiple seeds, the colors are mixed (e. g. red plus blue yields
purple). The right side of each image corresponds to the right side of
the brain
512 Brain Struct Funct (2010) 214:495–517
123
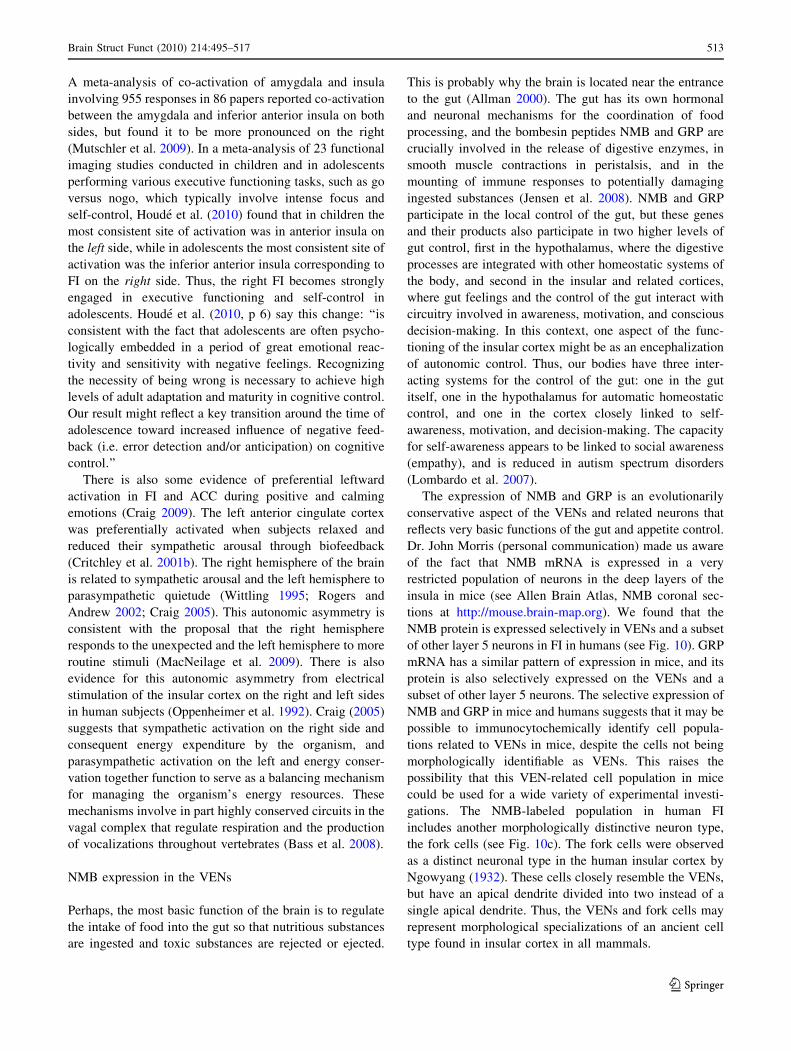
A meta-analysis of co-activation of amygdala and insula
involving 955 responses in 86 papers reported co-activation
between the amygdala and inferior anterior insula on both
sides, but found it to be more pronounced on the right
(Mutschler et al. 2009). In a meta-analysis of 23 functional
imaging studies conducted in children and in adolescents
performing various executive functioning tasks, such as go
versus nogo, which typically involve intense focus and
self-control, Houde et al. (2010) found that in children the
most consistent site of activation was in anterior insula on
the left side, while in adolescents the most consistent site of
activation was the inferior anterior insula corresponding to
FI on the right side. Thus, the right FI becomes strongly
engaged in executive functioning and self-control in
adolescents. Houde et al. (2010, p 6) say this change: ‘‘is
consistent with the fact that adolescents are often psycho-
logically embedded in a period of great emotional reac-
tivity and sensitivity with negative feelings. Recognizing
the necessity of being wrong is necessary to achieve high
levels of adult adaptation and maturity in cognitive control.
Our result might reflect a key transition around the time of
adolescence toward increased influence of negative feed-
back (i.e. error detection and/or anticipation) on cognitive
control.’’
There is also some evidence of preferential leftward
activation in FI and ACC during positive and calming
emotions (Craig 2009). The left anterior cingulate cortex
was preferentially activated when subjects relaxed and
reduced their sympathetic arousal through biofeedback
(Critchley et al. 2001b). The right hemisphere of the brain
is related to sympathetic arousal and the left hemisphere to
parasympathetic quietude (Wittling 1995; Rogers and
Andrew 2002; Craig 2005). This autonomic asymmetry is
consistent with the proposal that the right hemisphere
responds to the unexpected and the left hemisphere to more
routine stimuli (MacNeilage et al. 2009). There is also
evidence for this autonomic asymmetry from electrical
stimulation of the insular cortex on the right and left sides
in human subjects (Oppenheimer et al. 1992). Craig (2005)
suggests that sympathetic activation on the right side and
consequent energy expenditure by the organism, and
parasympathetic activation on the left and energy conser-
vation together function to serve as a balancing mechanism
for managing the organism’s energy resources. These
mechanisms involve in part highly conserved circuits in the
vagal complex that regulate respiration and the production
of vocalizations throughout vertebrates (Bass et al. 2008).
NMB expression in the VENs
Perhaps, the most basic function of the brain is to regulate
the intake of food into the gut so that nutritious substances
are ingested and toxic substances are rejected or ejected.
This is probably why the brain is located near the entrance
to the gut (Allman 2000). The gut has its own hormonal
and neuronal mechanisms for the coordination of food
processing, and the bombesin peptides NMB and GRP are
crucially involved in the release of digestive enzymes, in
smooth muscle contractions in peristalsis, and in the
mounting of immune responses to potentially damaging
ingested substances (Jensen et al. 2008). NMB and GRP
participate in the local control of the gut, but these genes
and their products also participate in two higher levels of
gut control, first in the hypothalamus, where the digestive
processes are integrated with other homeostatic systems of
the body, and second in the insular and related cortices,
where gut feelings and the control of the gut interact with
circuitry involved in awareness, motivation, and conscious
decision-making. In this context, one aspect of the func-
tioning of the insular cortex might be as an encephalization
of autonomic control. Thus, our bodies have three inter-
acting systems for the control of the gut: one in the gut
itself, one in the hypothalamus for automatic homeostatic
control, and one in the cortex closely linked to self-
awareness, motivation, and decision-making. The capacity
for self-awareness appears to be linked to social awareness
(empathy), and is reduced in autism spectrum disorders
(Lombardo et al. 2007).
The expression of NMB and GRP is an evolutionarily
conservative aspect of the VENs and related neurons that
reflects very basic functions of the gut and appetite control.
Dr. John Morris (personal communication) made us aware
of the fact that NMB mRNA is expressed in a very
restricted population of neurons in the deep layers of the
insula in mice (see Allen Brain Atlas, NMB coronal sec-
tions at http://mouse.brain-map.org). We found that the
NMB protein is expressed selectively in VENs and a subset
of other layer 5 neurons in FI in humans (see Fig. 10). GRP
mRNA has a similar pattern of expression in mice, and its
protein is also selectively expressed on the VENs and a
subset of other layer 5 neurons. The selective expression of
NMB and GRP in mice and humans suggests that it may be
possible to immunocytochemically identify cell popula-
tions related to VENs in mice, despite the cells not being
morphologically identifiable as VENs. This raises the
possibility that this VEN-related cell population in mice
could be used for a wide variety of experimental investi-
gations. The NMB-labeled population in human FI
includes another morphologically distinctive neuron type,
the fork cells (see Fig. 10c). The fork cells were observed
as a distinct neuronal type in the human insular cortex by
Ngowyang (1932). These cells closely resemble the VENs,
but have an apical dendrite divided into two instead of a
single apical dendrite. Thus, the VENs and fork cells may
represent morphological specializations of an ancient cell
type found in insular cortex in all mammals.
Brain Struct Funct (2010) 214:495–517 513
123
The VENs are prime targets for pathology in FTD during
the early stage of the illness, which is characterized by the
loss of social awareness and empathy (Seeley et al. 2006,
2007; Seeley 2008). However, FTD is also frequently
associated with compulsive eating (Woolley et al. 2007),
and FI is significantly reduced on the right side in the FTD
patients who are compulsive overeaters (Seeley 2008).
These FTD findings may reflect a basic role for the VENs,
fork cells, and related circuitry in the control of appetite.
The anterior insula/FI is activated when subjects view facial
expressions of disgust (Phillips et al. 1997; Jabbi et al.
2008). Disgust (literally, bad taste) links appetite control
and social feedback, which we believe are two key func-
tions of these circuits. The experience and expression of
disgust are intense forms of negative feedback in both the
consumption of food and in social interactions. Components
of circuitry for the regulation of the social emotions may
be a direct evolutionary outgrowth from insular cir-
cuity involved in appetite regulation and other aspects of
physiological homeostasis (Woodward and Allman 2007;
Williamson and Allman in press). The circuitry for the
regulation of appetite through the experiences of lust and
disgust may have been the evolutionary template for
dichotomous social emotions, such as love and hate, grati-
tude and resentment, empathy and disdain, and atonement
and guilt. The experiencing of these dichotomous social
emotions which range from the poles of prosocial to anti-
social feelings and thus regulate social distance is analogous
to the regulation of food consumption through the experi-
ence of lust versus disgust. As reviewed earlier, the expe-
rience of many of these social emotions activates anterior
insula. Thus, the VENs and related insular circuitry may be
involved in monitoring changes in the physiological net-
work of an individual’s own body and that individual’s
social network. In each case, the VENs may initiate
homeostatic corrections to changes in network states.
In his ‘‘somatic marker hypothesis’’, Damasio (1994)
proposed that the monitoring of sensations arising from the
gut is crucial to adaptive decision-making. The presence of
NMB, GRP, and the serotonin 2b receptor, which are rare in
the cortex, but very common in the viscera, suggests an
extension of the concept that FI and ACC are monitoring the
activity in the gut (Allman et al. 2005). Possibly the expres-
sion of NMB, GRP, and the serotonin 2b receptors in the
VENs represents a transposition of this activity from the gut
to the cortex, as components of a neural model of how the gut
would react under given circumstances. Such a model would
enable the organism to react more quickly to changing con-
ditions than if it depended solely on monitoring sensations
arising from the gut itself (Allman et al. 2005). Disruption of
this feedback could also underlie the recently recognized role
of the insula in the feelings of craving associated with
addiction to food or drugs (Naqvi and Bechara 2009).
DISC1 expression in the VENs
The selective expression of the protein made by the gene
DISC1 (disrupted in schizophrenia) on the VEN soma and
dendrites has several interesting implications. Duan et al.
(2007) blocked the expression of the DISC1 gene in
postnatally generated neurons in the dentate gyrus of the
mouse hippocampus through the use of selective interfer-
ence with DISC1 RNA. When DISC1 expression is
blocked in these neurons, there is considerably more
branching of the secondary and tertiary dendrites than
when DISC1 expression is normal. Thus, DISC1 reduces
secondary and tertiary dendritic branching in postnatally
generated neurons, and DISC1 could be part of the genetic
circuitry responsible for the relative absence of higher
order branching in the VENs. Crespi et al. (2007) showed
that several parts of the DISC1 gene have undergone
substantial positive selective changes since hominoids
diverged from other anthropoids and since humans
diverged from other hominoids. The site of the largest
evolutionary divergence maps to exons 1 and 2 in the part
of the DISC1 gene which binds to MAP1a (microtubule
associated protein 1a), which is involved in the control of
activity-dependent dendritic branching (Szebenyi et al.
2005). A single nucleotide polymorphism in another part of
the DISC1 gene is linked to increased risks of major
depression and schizophrenia, and this polymorphism is
also linked to reduced volume of ACC in a large MRI study
(Hashimoto et al. 2006). Variations in the DISC1 gene
have been frequently associated with changes in cognitive
functioning, particularly with respect to tasks that involve
maintaining and shifting attention (see Chubb et al. 2008
for a review). Thus, DISC1 is a gene that has undergone
considerable recent evolution and may be related to
enhanced cognition in humans. DISC1 is expressed selec-
tively on the soma and dendrites of the VENs and may be
related to their distinctive dendritic architecture. The recent
evolutionary changes associated with the VENs and DISC1
may carry increased vulnerabilities to dysfunction which
may manifest in several neuropsychiatric disorders (Allman
et al. 2005; Crespi et al. 2007; Seeley et al. 2006; 2007; Seeley
2008; Kaufman et al. 2008; van Kooten 2008; Simms et al.
2009; Williamson and Allman in press). Further investigation
of gene expression in the VENs could provide insights into the
dysfunctions in neuropsychiatric illnesses and also into the
recent VEN evolution.
DTI connections of FI and superior AI
In our preliminary study of the connections of FI and
superior AI in the brain of a gorilla, we found that the FI
seeds had connections with the frontal polar cortex, while
such connections were sparse from the superior AI seed. In
514 Brain Struct Funct (2010) 214:495–517
123

humans, frontal polar cortex is involved in retrieval from
episodic memory, multi-tasking, and mentalizing behaviors
(Gilbert et al. 2006). Both FI and superior AI seeds were
extensively connected with more posterior parts of the
frontal lobe as well as much of insular cortex, and both
delineated tracts just medial to the hippocampus suggesting
connection with that structure. The medial FI seed is also
connected with the amygdala and the septum. Septal
activity is associated with the building of trust in human
subjects (Krueger et al. 2007). The activity of FI is also
directly associated with trust (Singer et al. 2004b). More
broadly, the septum is linked to social memory and to the
control of anterior hypothalamic functions mediated by
vasopressin and oxytocin involved in parental care and
social attachment (Numan 2000; Lim and Young 2006).
The VENs in FI are likely to project to some or all of the
structures revealed by the tractography.
Acknowledgments The authors would like to thank Dr. Barbara
Wold, Dr. Chet Sherwood, Dr. Bill Seeley, Dr. James Rilling, and
Dr. A. D. Craig for their invaluable comments and discussion. We thank
Dr. Micheal Tyszka and Dr. Jason Kaufman for the MRI imaging of
the ape brains. We thank Dr. Kristen Tillisch and Dr. Emeran Mayer
for the MR images of the young adult human subject. We are grateful
to Dr. John Morris for his suggestion that the expression of neu-
romedin B and gastrin releasing peptide in the mouse insular cortex
might be related to the VENs. We thank Dr. Heidi Griffith for her help
in collecting some of the human stereological data. We thank
Archibald Fobbs, curator of the Yakovlev and Welker Brain Collec-
tions and Dr. Adrianne Noe, Director, National Museum of Health
and Medicine for their crucial role in preserving these collections and
making them available to us and to the broader scientific community.
In the Hof lab, technical help was provided by B. Wicinski and
S. Harry. Several of the great ape brains involved in this study were
on loan to the ‘‘Great Ape Aging Project’’ from zoological gardens
that are accredited by the Association of Zoos and Aquariums (AZA)
and that participate in the Ape Taxon Advisory Group (Ape-TAG).
We especially appreciate the contribution of zoo veterinarians and
staff in collecting and providing specimens. Additional human tissue
was obtained from the NICHD Brain and Tissue Bank for Develop-
mental Disorders. Some comparative specimens were collected under
the ‘‘Comparative Neurobiology of Aging Resource,’’ NIH/NIA grant
AG14308, J. Erwin, PI. This research was supported by the James
S. McDonnell Foundation, the David and Lucille Packard Foundation,
and the Simons Foundation.
Open Access This article is distributed under the terms of the
Creative Commons Attribution Noncommercial License which per-
mits any noncommercial use, distribution, and reproduction in any
medium, provided the original author(s) and source are credited.
References
Allman JM (2000) Evolving brains. Scientific American Library-
W.H.Freeman, New York
Allman J, McLaughlin T, Hakeem A (1993) Brain weight and life-
span in primate species. Proc Natl Acad Sci USA 90:118–122
Allman JM, Hakeem A, Erwin JM, Nimchinsky E, Hof P (2001)
Anterior cingulate cortex: the evolution of an interface between
emotion and cognition. Ann NY Acad Sci 935:107–117
Allman J, Hakeem A, Watson K (2002) Two phylogenetic special-
izations in the human brain. Neuroscientist 8:335–346
Allman J, Watson K, Tetreault N, Hakeem A (2005) Intuition and
autism: a possible role for von Economo neurons. Trends Cogn
Sci 9:367–373
Aziz-Zadeh L, Kaplan J, Iocoboni M (2009) ‘‘Aha’’: the neural
correlates of verbal insight solutions. Hum Brain Mapp 30:908–
916
Barger N, Stefanacci L, Semendeferi K (2007) A comparative
volumetric analysis of the amygdaloid complex and basolateral
division in the human and ape brain. Am J Phys Anthropol
134:392–403
Baron-Cohen S, Ring HA, Wheelwright S, Bullmore ET, Brammer
MJ, Simmons A, Williams SC (1999) Social intelligence in the
normal and autistic brain: an fMRI study. Eur J Neurosci
11:1891–1898
Bartels A, Zeki S (2004) The neural correlates of maternal and
romantic love. Neuroimage 21:1155–1166
Bass AH, Gilland EH, Baker R (2008) Evolutionary origins for social
vocalization in a vertebrate hindbrain-spinal compartment.
Science 321:417–421
Berthoz S, Armony JL, Blair RJR, Dolan RJ (2002) An fMRI study of
intentional and unintentional (embarrassing) violations of social
norms. Brain 125:1696–1708
Betz W (1881) Ueber die feinere Structur der Gehirnrinde des
Menschen. Zentralbl Med Wiss 19:193–195, 209–213, 231–234
Brauer K, Schober W (1970) Catalogue of mammalian brains. VEB
Gustav Fischer Verlag, Jena
Butti C, Sherwood CC, Hakeem AY, Allman JM, Hof PR (2009)
Total number and volume of Von Economo neurons in the
cerebral cortex of cetaceans. J Comp Neurol 515:243–259
Chubb JE, Bradshaw NJ, Soares DC, Porteous DJ, Millar JK (2008)
The DISC locus in psychiatric illness. Mol Psychiatry 13:36–64
Craig AD (2003) A new view of pain as a homeostasis emotion.
Trends Neurosci 26:303–307
Craig AD (2005) Forebrain emotional asymmetry: a neuroanatomical
basis? Trends Cogn Sci 912:566–571
Craig AD (2009) How do you feel—now? The anterior insula and
human awareness. Nat Rev Neurosci 10:59–70
Craig AD (2010) The sentient self. Brain Struct Funct. doi:
10.1007/s00429-010-0248-y
Crespi B, Summers K, Dorus S (2007) Adaptive evolution of genes
underlying schizophrenia. Proc Roy Soc B 274:2801–2810
Critchley HD, Elliott R, Mathias CJ, Dolan RJ (2000) Neural activity
relating to generation and representation of galvanic skin
conductance responses. J Neurosci 20:3033–3040
Critchley HD, Mathias C, Dolan R (2001a) Neural activity in the
human brain relating to uncertainty and arousal during antici-
pation. Neuron 29:537–545
Critchley HD, Melmed RN, Featherstone E, Mathias CJ, Dolan RJ
(2001b) Brain activity during biofeedback relaxation: a func-
tional neuroimaging investigation. Brain 124:1003–1012
Croxson PL, Johansen-Berg H, Behrens TE, Robson MD, Pinsk MA,
Gross CG, Richter W, Richter MC, Kastner S, Rushworth MF
(2005) Quantitative investigation of connections of the prefrontal
cortex in the human and macaque using probabilistic diffusion
tractography. J Neurosci 28:8854–8866
Damasio A (1994) Descartes error. Putnam, New York
Dehaene S, Posner MI, Tucker DM (1994) Localization of a
neural system for error detection and compensation. Psychol
Sci 5:303–305
Di Martino A, Ross K, Uddin L, Sklar A, Castellanos F, Milham M
(2009) Processes in autism spectrum disorders: an activation
likelihood estimation meta-analysis. Biol Psychiatry 65:63–74
Dosenbach NU, Fair DA, Miezin FM, Cohen AL, Wenger KK,
Dosenbach RA, Fox MD, Snyder AZ, Vincent JL, Raichle ME,
Brain Struct Funct (2010) 214:495–517 515
123
Schlaggar BL, Petersen SE (2007) Distinct brain networks for
adaptive and stable task control in humans. Proc Natl Acad Sci
USA 104:11073–11078
Duan X, Chang JH, Ge S, Faulkner RL, Kim JY, Kitabatake Y, Liu
XB, Yang CH, Jordan JD, Ma DK, Liu CY, Ganesan S, Cheng
HJ, Ming GL, Lu B, Song H (2007) Disrupted-in-schizophrenia
1 regulates integration of newly generated neurons in the adult
brain. Cell 130:1146–1158
Galdikas BMF (1985) Orangutan sociality at Tanjung Puting. Am J
Primatol 9:101–119
Gallyas F (1971) A principle for silver staining of tissue elements by
physical development. Acta Morphol Acad Sci 19:57–71
Gehring WJ, Goss B, Coles MGH, Meyer DE, Donchin E (1993) A
neural system of error detection and compensation. Psychol Sci
4:385–390
Gilbert S, Spengler S, Simons J, Steele J, Lawrie S, Frith C, Burgess P
(2006) Functional specialization within rostral prefrontal cortex
(Area 10): a meta-analysis. J Cogn Neurosci 18:932–948
Gilles FH, Leviton A, Dooling EC (1983) Developing human brain,
growth and epidemiologic neuropathology. John Wright - PSG
Inc, Boston
Gundel H, Lopez-Sala A, Ceballos-Baumann AO, Deus J, Cardoner
N, Marten-Mittag B, Soriano-Mas C, Pujol J (2004) Alexithymia
correlates with the size of right anterior cingulate. Psychosom
Med 66:132–140
Hakeem AY, Sherwood CC, Bonar CJ, Butti C, Hof PR, Allman JM
(2009) Von Economo neurons in the elephant brain. Anat Rec
(Hoboken) 292:242–248
Hammarberg C (1895) Studien uber Klinik und Pathologie der Idiotie
nebst Untersuchungen uber die normale Anatomie des Hirnrinde.
Berling, Uppsala
Harrison NA, Gray MA, Critchley HD (2009) Dynamic pupillary
exchange engages brain regions encoding social salience. Soc
Neurosci 4:233–243
Hashimoto R, Numakawa T, Ohnishi T, Kumamaru E, Yagasaki Y,
Ishimoto T, Mori T, Nemoto K, Adachi N, Izumi A, Chiba S,
Noguchi H, Suzuki T, Iwata N, Ozaki N, Taguchi T, Kamiya A,
Kosuga A, Tatsumi M, Kamijima K, Weinberger DR, Sawa A,
Kunugi H (2006) Impact of the DISC1 Ser704Cys polymor-
phism on risk for major depression, brain morphology and ERK
signaling. Hum Mol Genet 15:3024–3033
Hayashi M, Ito M, Shimizu K (2001) The spindle neurons are present
in the cingulate cortex of chimpanzee fetus. Neurosci Lett
309:97–100
Hof PR, Van der Gucht E (2007) Structure of the cerebral cortex of
the humpback whale, Megaptera novaeangliae (Cetacea, Mys-
ticeti, Balaenopteridae). Anat Rec 290:1–31
Houde O, Rossi S, Lubin A, Joliot M (2010) Mapping numerical
processing, reading, and executive functions in the developing
brain: an fMRI meta-analysis of 52 studies including 842
children. Dev Sci 1:1–10
Jabbi M, Bastiaansen J, Keysers C (2008) A common anterior insula
representation of disgust observation, experience and imagina-
tion shows divergent functional connectivity pathways. PLos
One 8:e2939
Jensen RT, Battey JF, Spindel ER, BEnya RV (2008) International
Union of Pharmacology, LXVIII. Mammalian bombesin recep-
tors: nomenclature, distribution, pharmacology, signaling, and
functions in normal and disease states. Pharmacol Rev 60:1–42
Kaufman JA, Paul LK, Manaye KF, Granstedt AE, Hof PR, Hakeem
AY, Allman JM (2008) Selective reduction of Von Economo
neuron number in agenesis of the corpus callosum. Acta
Neuropathol 116:479–489
Kennedy DP, Semendeferi K, Courchesne E (2007) No reduction of
spindle neuron number in frontoinsular cortex in autism. Brain
Cogn 64:124–129
Kikyo H, Ohki K (2002) Neural correlates for feeling-of-knowing: an
fMRI parametric analysis. Neuron 36:177–186
Klein TA, Endrass T, Kathmann N, Neumann J, von Cramon DY,
Ullsperger M (2007) Neural correlates of error awareness.
NeuroImage 34:1774–1781
Krueger F, McCabe K, Moll J, Kriegeskorte N, Zahn R, Strenziok M,
Heinecke A, Grafman J (2007) Neural correlates of trust. Proc
Natl Acad Sci USA 104:20084–20089
Kunimatsu Y, Nakatsukasa M, Sawada Y, Sakai T, Hyodo M, Hyodo
H, Itaya T, Nakaya H, Saegusa H, Mazurier A, Saneyoshi M,
Tsujikawa H, Yamamoto A, Mbua E (2007) A new Late
Miocene great ape from Kenya and its implications for the
origins of African great apes and humans. Proc Natl Acad Sci
USA 104:19220–19225
Lamm C, Singer T (2010) Role of anterior insular cortex in social
emotions. Brain Struct Funct. doi:10.1007/s00429-010-0251-3
Lim M, Young L (2006) Neuropeptidergic regulation of affiliative
behavior and social bonding in animals. Horm Behav 50:506–
517
Lombardo MV, Barnes JL, Wheelwright SJ, Baron-Cohen S (2007)
Self-referential cognition and empathy in autism. PLoS One
2:e883
Lorberbaum JP, Newman JD, Horwitz AR, Dubno JR, Lydiard RB,
Hamner MB, Bohning DE, George MS (2002) A potential role
for thalamocingulate circuitry in human maternal behavior. Biol
Psychiatry 51:431–445
MacNeilage PF, Rogers LJ, Vallortigara G (2009) Origins of the left
& right brain. Sci Am 301:60–67
Merker B (1983) Silver staining of cell bodies by means of physical
development. J Neurosci Methods 9:235–241
Mitani JC, Grether GF, Rodman PS, Priatna D (1991) Associations
among wild orangutans: sociality, passive aggregations or
chance? Anim Behav 42:33–46
Mutschler I, Wieckhorst B, Kowalevski S, Derix J, Wentlandt J,
Schulze-Bonhage A, Ball T (2009) Functional organization
of the human interior insular cortex. Neurosci Lett 457:66–70
Naqvi NH, Bechara A (2009) The hidden island of addiction: the
insula. Trends Neurosci 32:56–67Nelson S, Dosenbach, N, Cohen, A, Schlaggar B, Petersen S
(2010) Role of the anterior insula in task-level control and
focal attention. Brain Struct Funct. doi:10.1007/s00429-010-
0260-2
Ngowyang G (1932) Beschreibung einer Art von Spezialzellen in der
Inselrinde - zugleich Bemerkungen uber die v. Economoschen
Spezialzellen. J Psychol Neurol 44:671–674
Nimchinsky EA, Vogt BA, Morrison JH, Hof PR (1995) Spindle
neurons of the human anterior cingulate cortex. J Comp Neurol
355:27–37
Nimchinsky E, Gilissen E, Allman J, Perl D, Erwin J, Hof P (1999) A
neuronal morphologic type unique to humans and great apes.
Proc Nat Acad Sci USA 96:5268–5273
Numan R (2000) The behavioral neuroscience of the septal region.
Springer, New York
Oppenheimer SM, Gelb A, Girvin JP, Hachinski VC (1992)
Cardiovascular effects of human insular cortex stimulation.
Neurology 42:1727–1732
Patterson F, Gordon W (2002) Twenty-seven years of Project Koko
and Michael. In: Galdikas B, Briggs N, Sheeran L, Shapiro G,
Goodall J (eds) All apes great and small, vol I. Kluwer Press,
New York, pp 165–176
Paul LK, Brown WS, Adolphs R, Tyszka JM, Richards LJ, Mukherjee
P, Sherr EH (2007) Agenesis of the corpus callosum: genetic,
developmental and functional aspects of connectivity. Nat Rev
Neurosci 8:287–299
Phillips ML, Young AW, Senior C, Brammer M, Andrew C, Calder
AJ, Bullmore ET, Perrett DI, Rowland D, Williams SC, Gray JA,
516 Brain Struct Funct (2010) 214:495–517
123
David AS (1997) A specific neural substrate for perceiving facial
expressions of disgust. Nature 389:495–498
Ploran E, Nelson S, Velanova K, Petersem S, Wheeler M (2007)
Evidence accumulation and moment of recognition: dissociating
perceptual recognition processes using fMRI. J Neurosci
27:11012–11924
Preuschhoff K, Quartz S, Bossaerts P (2008) Human insula activation
reflects risk prediction errors as well as risk. J Neurosci 28:2745–
2752
Ramon y Cajal S (1899) Textura del Sistema Nervioso del Hombre y
de los Vertebrados, Tomo II. Nicolas Moya, Madrid
Rankin KP, Gorno-Tempini ML, Allison SC, Stanley CM, Glenn S,
Weiner MW, Miller BL (2006) Structural anatomy of empathy in
neurodegenerative disease. Brain 129:2945–2956
Rilling J, Goldsmith D, Glenn A, Jairam M, Elfenbein H, Dagenais J,
Murdock C, Pagnoni (2008) Neural correlates of the affective
response to unreciprocated cooperation. Neuropsychologia
46:1265–1266
Rogers L, Andrew R (2002) Comparative vertebrate lateralization.
Cambridge University Press, Cambridge
Rose M (1927) Gyrus limbicus anterior und Regio retrosplenialis
(Cortex holoprotoptychos quinquestratificatus) - Vergleichende
Architektonik bei Tier und Menschen. J Psychol Neurol 35:5–217
Rose M (1928) Die Inselrinde des Menschen und der Tiere. J Psychol
Neurol 37:467–624
Sanfey AG, Rilling RJ, Aronson JA, Nystrom LE, Cohen JD (2003)
The neural basis of economic decision-making in the ultimatum
game. Science 300:1755–1758
Schenker NM, Desgouttes A, Semendeferi K (2005) Neural connec-
tivity and cortical substrates of cognition in hominoids. J Hum
Evol 49:547–569
Seeley WW (2008) Selective functional, regional, and neuronal
vulnerability in frontotemporal dementia. Curr Opin Neurol
21:701–707
Seeley WW, Carlin DA, Allman JM, Macedo MN, Bush C, Miller
BL, Dearmond SJ (2006) Early frontotemporal dementia targets
neurons unique to apes and humans. Ann Neurol 60:660–667
Seeley WW, Allman JM, Carlin DA, Crawford RK, Macedo MN,
Greicius MD, Dearmond SJ, Miller BL (2007) Divergent social
functioning in behavioral variant frontotemporal dementia and
Alzheimer disease: reciprocal networks and neuronal evolution.
Alzheimer Dis Assoc Disord 21:S50–S57
Semendeferi K, Armstrong E, Schleicher A, Zilles K, Van Hoesen
GW (1998) Limbic frontal cortex in hominoids: a comparative
study of area 13. Am J Phys Anthropol 106:129–155
Shaw P, Lalonde F, Lepage C, Rabin C, Eckstrand K, Sharp W,
Greenstein D, Evans A, Giedd JM, Rapoport J (2009) Devel-
opment of cortical asymmetry in typically developing children
and its disruption in attention-deficit/hyperactivity disorder.
Arch Gen Psychiatry 66:888–896
Sherwood CC, Holloway RL, Erwin JM, Hof PR (2004) Cortical
orofacial motor representation in Old World monkeys, great
apes, and humans. II: stereologic analysis of chemoarchitecture.
Brain Behav Evol 63:82–106
Sherwood CC, Wahl E, Erwin JM, Hof PR, Hopkins WD (2007)
Histological asymmetries of primary motor cortex predict
handedness in chimpanzees. J Comp Neurol 503:525–537
Shin LM, Dougherty DD, Orr SP, Pitman RK, Lasko M, Macklin ML,
Alpert NM, Fischman AJ, Rauch SL (2000) Activation of
anterior paralimbic structures during guilt-related script-driven
imagery. Biol Psychiatry 48:43–50
Shorvon S (2005) Handbook of epilepsy treatment. Wiley, New York
Simms ML, Kemper TL, Timbie CM, Bauman ML, Blatt GJ (2009)
The anterior cingulate cortex in autism: heterogeneity of
qualitative and quantitative cytoarchitectonic features suggests
possible subgroups. Acta Neuropathol 118:673–684
Singer T, Seymour B, O’Doherty J, Kaube H, Dolan RJ, Frith CD
(2004a) Empathy for pain involves the affective but not sensory
components of pain. Science 303:1157–1162
Singer T, Kiebel SJ, Winston JS, Dolan RJ, Frith CD (2004b) Brain
responses to the acquired moral status of faces. Neuron 41:653–
662
Singleton I, van Schaik CP (2002) The social organisation of a
population of Sumatran orangutans. Folia Primatol 73:1–20
Spence SA, Farrow TF, Herford AE, Wilkinson ID, Zheng Y,
Woodruff PW (2001) Behavioural and functional anatomical
correlates of deception in humans. NeuroReport 12:2849–2853
Sridharan D, Levitin DJ, Menon V (2008) A critical role for the right
fronto-insular cortex in switching between central-executive and
default-mode networks. Proc Natl Acad Sci USA 105:12569–
12574
Stephan H, Frahm HD, Baron G (1981) New and revised data on
volumes of brain structures in insectivores and primates. Folia
Primatol 35:1–29
Szebenyi G, Bollati F, Bisbal M, Sheridan S, Faas L, Wray R,
Haferkamp S, Nguyen S, Caceres A, Brady S (2005) Activity-
driven dendritic remodeling requires microtubule-associated
Protein 1a. Curr Biol 15:1820–1826
Ullsperger M, von Cramon DY (2004) Neuroimaging of performance
monitoring: error detection and beyond. Cortex 40:593–604
Uylings H, Jacosen A, Zilles K, Amunts K (2006) Left-right
asymmetry in volume and number of neurons in adult Broca’s
area. Cortex 42:652–658
van Kooten (2008) Autism counts. Dissertation, Maastricht
University
von Economo C (1926) Eine neue Art Spezialzellen des Lobus cinguli
und Lobus insulae. Zschr ges Neurol Psychiat 100:706–712
Von Economo C (2009) Cellular structure of the human cerebral
cortex. Translated by L.C. Triarhou, Karger, Basel
Von Economo C, Koskinas G (1925) Die Cytoarchitectonik der
Hirnrinde des erwachsenen Menschen. Springer, Berlin
Wang SS, Shultz JR, Burish MJ, Harrison KH, Hof PR, Towns LC,
Wagers MW, Wyatt KD (2008) Functional trade-offs in white
matter axonal scaling. J Neurosci 28:4047–4056
Watkins KE, Paus T, Lerch JP, Zijdenbos A, Collins DL, Neelin P,
Taylor J, Worsley KJ, Evans AC (2001) Structural asymmetries
in human brain: a voxel-based statistical analysis of 142 brains.
Cereb Cortex 11:868–877
Watson KK, Jones TK, Allman JM (2006) Dendritic architecture of
the von Economo neurons. Neuroscience 141:1107–1112
Watson KK, Matthews BJ, Allman JM (2007) Brain activation during
sight gags and language-dependent humor. Cereb Cortex
17:314–324
Welker WI, Seidenstein S (1959) Somatic sensory representation in
the cerebral cortex of the raccoon (Procyon lotor). J Comp
Neurol 111:469–501
Williamson P, Allman JM (2010) The human illnesses: neuropsychi-
atric disorders and the nature of the human brain. Oxford
University Press (in press)
Wittling W (1995) Brain Asymmetry in the control of autonomic-
physiological activity. In: Davidson RJ, Hugdahl K (eds) Brain
asymmetry. MIT Press, Cambridge, pp 305–356
Woodward J, Allman J (2007) Moral intuition: its neural substrates
and normative significance. J Physiol Paris 101(4–6):179–202
Woolley JD, Gorno-Tempini ML, Seeley WW, Rankin K, Lee SS,
Matthews BR, Miller BL (2007) Binge eating is associated with
right orbitofrontal-insular-striatal atrophy in frontotemporal
dementia. Neurology 69:1424–1433
Brain Struct Funct (2010) 214:495–517 517
123