Embed Size (px)
Citation preview
Operational Oceanography
Scientific Lectures at JCOMM-I(Akureyri, Iceland, June 2001)
WMO/TD-No. 1086
2001
JCOMM Technical Report No. 14

WORLD METEOROLOGICAL ORGANIZATION
_____________
INTERGOVERNMENTAL OCEANOGRAPHICCOMMISSION (OF UNESCO)
___________
Operational Oceanography
Scientific Lectures at JCOMM-I(Akureyri, Iceland, June 2001)
WMO/TD-No. 1086
2001
JCOMM Technical Report No. 14

N O T E
The designations employed and the presentation of material in this publication do not imply theexpression of any opinion whatsoever on the part of the Secretariats of the IntergovernmentalOceanographic Commission (of UNESCO), and the World Meteorological Organization concerning thelegal status of any country, territory, city or area, or of its authorities, or concerning the delimitation of itsfrontiers or boundaries.

FOREWORD
The Joint WMO/IOC Technical Commission for Oceanography and Marine Meteorology (JCOMM)was formally established in 1999, by WMO Congress and the IOC Assembly, through a merger ofthe former WMO Commission for Marine Meteorology (CMM) and the Joint IOC/WMO Committeefor the Integrated Global Ocean Services System (IGOSS). One of the primary initial priorities forJCOMM is the development and implementation of operational oceanography, on the basis ofdesigns and requirements expressed by the Global Ocean Observing System (GOOS) and theGlobal Climate Observing System (GCOS), including, in particular, an operational ocean observingsystem for climate.
Traditionally, CMM had arranged for the presentation of scientific lectures, on specific themes, asan integral part of its formal sessions, with the full texts of these lectures subsequently publishedby WMO and distributed to all Commission members. This has proven to be a very effective meansof informing these members of the latest developments and status in scientific and technical fieldswithin the terms of reference of the Commission. The interim Management Committee for JCOMM,therefore, agreed that this tradition should be continued under the new Commission, and that thetheme for the scientific lectures to be given at JCOMM-I (Akureyri, Iceland, June 2001) should be“Operational Oceanography”.
The scientific lectures were subsequently presented to JCOMM-I during a single half-day session,and the Commission later agreed that the full texts should be published as a formal JCOMMTechnical Report, so that they might also be of benefit to those unable to attend the session. Thispresent publication is the result. It should prove of interest and benefit to all those with an interestin the implementation of operational oceanography and in the rapid development of JCOMM as theappropriate technical instrument of WMO and IOC to coordinate operational oceanography at theintergovernmental level. The considerable thanks of WMO and IOC are due to all the expertlecturers for their time and effort in preparing and presenting these lectures.
(P. Bernal)Assistant Director-General of UNESCO
(M. Jarraud)Deputy Secretary-General of WMO

C O N T E N T S
FOREWORD
Contents......................................................................................................................................... i
Operational Ocean Modelling, Forecasting and ApplicationsMasaro Saiki, Japan Meteorological Agency .................................................................................1
Launching the Argo ArmadaStan Wilson, National Oceanic and Atmospheric Administration .................................................19
The Path to JCOMMNeville Smith, Bureau of Meteorology Research Centre..............................................................24
Operational Ocean Modelling Forecasting and ApplicationsStephan Dick, Federal Maritime and Hydrographic Agency.........................................................32
- 1 -
Operational Ocean Modelling, Forecasting and Applications
Masaro SAIKI
Japan Meteorological Agency
1. Introduction
It has been a dream for many years for oceanographers to monitor the global oceanconditions including water temperature, salinity and ocean currents on a real time basis.Meteorologists already came to produce not only surface synoptic charts but also upper-air chartson a global basis 50 years ago, owing to routine upper-air observations with radiosonde balloonsevery 12 hours made at about 900 aerological stations covering the world. Surface synoptic andupper-air data were made available for providing initial and boundary conditions for numericalweather prediction models.
With regard to the ocean, the Argo programme, now implemented under the internationalcooperation, will deploy a global array of 3,000 profiling floats to observe the temperature andsalinity of the ocean’s upper layer in real time (e.g. Argo Science Team, 1998). The Argo array willinitiate the oceanic equivalent of today’s operational observing system for the global atmosphere.
In recent years, products of ocean data assimilation and forecasting by ocean models arebecoming important bases for climate monitoring and seasonal prediction as well as indispensableinformation for fisheries, shipping and other marine activities. Operational meteorological andoceanographic agencies are making efforts to upgrade their ocean data assimilation andforecasting skills to meet increasing needs for oceanographic products. The author will present anoverview of the ocean data assimilation systems and El Niño forecast model operated by theJapan Meteorological Agency (JMA) as examples of operational ocean modelling.
2. Ocean data assimilation system in the mid-/high-latitudes of the North Pacific
It is well known that the Kuroshio Current, the western boundary current in the NorthPacific Ocean, significantly affects the climate of the East Asia and socio-economic activities suchas fisheries and shipping. The monitoring and forecast of oceanic conditions including the Kuroshioin the North Pacific have been required in this context.
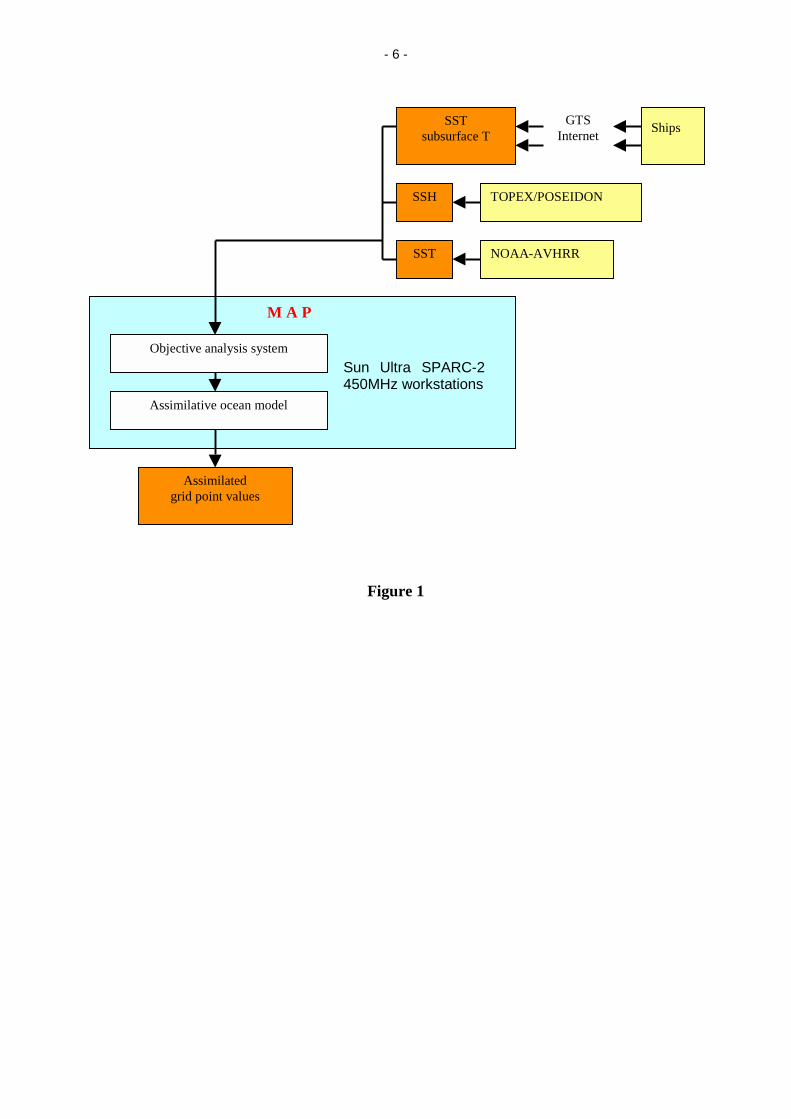
JMA developed and operates a high resolution ocean data assimilation system, which isnamed the Marine Analysis system of North Pacific Ocean (MAP), for physically consistentanalyses of the ocean structure such as the Kuroshio in the mid-/high-latitudes of the North Pacific.The MAP consists of an objective analysis system and an assimilative ocean model.TOPEX/POSEIDON altimeter data, and in situ observations by ships and buoys are assimilated inthe system.
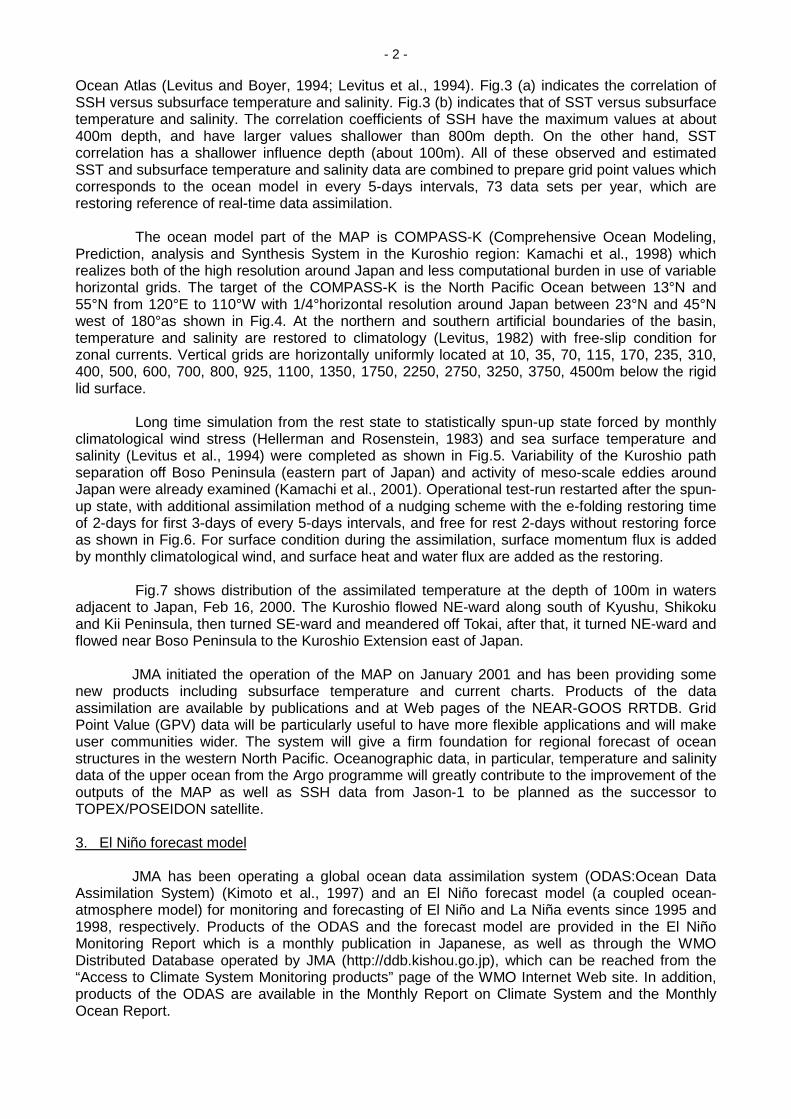
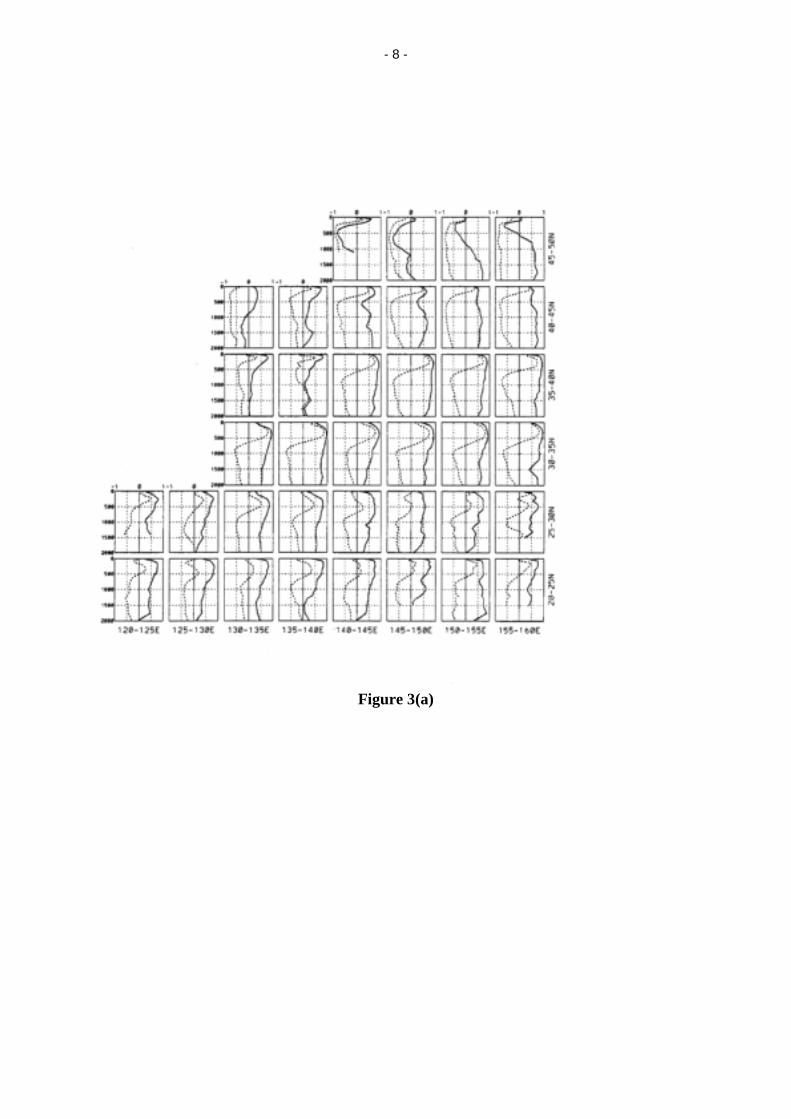
The objective analysis system of the MAP deals with sea surface temperature (SST), in-situ subsurface ocean data, and sea surface height (SSH) remotely observed by satellites (Fig.1).Major data sources of the in-situ data are the BATHY, TESAC, BUOY messages through theGlobal Telecommunication System (GTS), and other reports gathered through facsimile, postalmail and the Internet which are stored in the NEAR-GOOS (North-East Asian Regional GOOS)Regional Real Time Database (RRTDB) (http://goos.kishou.go.jp). JMA operationally analyzesthese in-situ subsurface temperatures, in addition to daily SST data with 1/4 degrees horizontalresolution by NOAA-AVHRR. Fig.2 shows the system for objective analysis of SSH measured byTOPEX/POSEIDON. The SSH data are compiled with an optimum interpolation (OI) method in ahorizontal space and time domain each 5 days. Subsurface temperature and salinity fieldsshallower than 1000m are estimated with correlation scheme of a statistical vertical projectionmethod (Mellor and Ezer, 1991) from objectively analyzed SSH anomalies. Fig.3 shows ageographical distribution of the vertical correlation coefficients by calculating the correlation andregression coefficient (Kuragano and Kamachi, 1997) based on ship observations by the World
- 2 -
Ocean Atlas (Levitus and Boyer, 1994; Levitus et al., 1994). Fig.3 (a) indicates the correlation ofSSH versus subsurface temperature and salinity. Fig.3 (b) indicates that of SST versus subsurfacetemperature and salinity. The correlation coefficients of SSH have the maximum values at about400m depth, and have larger values shallower than 800m depth. On the other hand, SSTcorrelation has a shallower influence depth (about 100m). All of these observed and estimatedSST and subsurface temperature and salinity data are combined to prepare grid point values whichcorresponds to the ocean model in every 5-days intervals, 73 data sets per year, which arerestoring reference of real-time data assimilation.
The ocean model part of the MAP is COMPASS-K (Comprehensive Ocean Modeling,Prediction, analysis and Synthesis System in the Kuroshio region: Kamachi et al., 1998) whichrealizes both of the high resolution around Japan and less computational burden in use of variablehorizontal grids. The target of the COMPASS-K is the North Pacific Ocean between 13°N and55°N from 120°E to 110°W with 1/4°horizontal resolution around Japan between 23°N and 45°Nwest of 180°as shown in Fig.4. At the northern and southern artificial boundaries of the basin,temperature and salinity are restored to climatology (Levitus, 1982) with free-slip condition forzonal currents. Vertical grids are horizontally uniformly located at 10, 35, 70, 115, 170, 235, 310,400, 500, 600, 700, 800, 925, 1100, 1350, 1750, 2250, 2750, 3250, 3750, 4500m below the rigidlid surface.
Long time simulation from the rest state to statistically spun-up state forced by monthlyclimatological wind stress (Hellerman and Rosenstein, 1983) and sea surface temperature andsalinity (Levitus et al., 1994) were completed as shown in Fig.5. Variability of the Kuroshio pathseparation off Boso Peninsula (eastern part of Japan) and activity of meso-scale eddies aroundJapan were already examined (Kamachi et al., 2001). Operational test-run restarted after the spun-up state, with additional assimilation method of a nudging scheme with the e-folding restoring timeof 2-days for first 3-days of every 5-days intervals, and free for rest 2-days without restoring forceas shown in Fig.6. For surface condition during the assimilation, surface momentum flux is addedby monthly climatological wind, and surface heat and water flux are added as the restoring.
Fig.7 shows distribution of the assimilated temperature at the depth of 100m in watersadjacent to Japan, Feb 16, 2000. The Kuroshio flowed NE-ward along south of Kyushu, Shikokuand Kii Peninsula, then turned SE-ward and meandered off Tokai, after that, it turned NE-ward andflowed near Boso Peninsula to the Kuroshio Extension east of Japan.
JMA initiated the operation of the MAP on January 2001 and has been providing somenew products including subsurface temperature and current charts. Products of the dataassimilation are available by publications and at Web pages of the NEAR-GOOS RRTDB. GridPoint Value (GPV) data will be particularly useful to have more flexible applications and will makeuser communities wider. The system will give a firm foundation for regional forecast of oceanstructures in the western North Pacific. Oceanographic data, in particular, temperature and salinitydata of the upper ocean from the Argo programme will greatly contribute to the improvement of theoutputs of the MAP as well as SSH data from Jason-1 to be planned as the successor toTOPEX/POSEIDON satellite.
3. El Niño forecast model
JMA has been operating a global ocean data assimilation system (ODAS:Ocean DataAssimilation System) (Kimoto et al., 1997) and an El Niño forecast model (a coupled ocean-atmosphere model) for monitoring and forecasting of El Niño and La Niña events since 1995 and1998, respectively. Products of the ODAS and the forecast model are provided in the El NiñoMonitoring Report which is a monthly publication in Japanese, as well as through the WMODistributed Database operated by JMA (http://ddb.kishou.go.jp), which can be reached from the“Access to Climate System Monitoring products” page of the WMO Internet Web site. In addition,products of the ODAS are available in the Monthly Report on Climate System and the MonthlyOcean Report.

- 3 -
The ocean general circulation model (OGCM) of the ODAS has the basic horizontalresolution of 2.0°latitude and 2.5°longitude. Near the equator, the meridional grid spacing isreduced to a minimum, 0.5°, as shown in Fig.8. The OGCM has 20 levels in the vertical, and mostof them are placed in the upper 500 meters in order to resolve the surface mixed layer andthermocline properly. The model includes Mellor-Yamada’s turbulent closure scheme of level 2.5for vertical diffusion, a nonlinear horizontal diffusion scheme, and a convective adjustment schemeas Rosati and Miyakoda (1988). No sea ice is explicitly treated in the model.
The upper ocean temperatures are analyzed every 5 days based on ship-based andbuoy-based ocean data mainly available on the GTS. A two-dimension optimal interpolationscheme is used for the analysis. The analyzed temperatures are introduced in the OGCM using anudging technique. Fig.9 shows longitude-depth cross sections of temperature and anomaliesalong the equator obtained by the ODAS. They indicate typical thermal structure during El Niñoand La Niña events.
JMA is going to introduce a three dimensional variational scheme into the analysis systemwithin a few months in order to improve the quality of obtained oceanic field. In addition, JMA isdeveloping a system to assimilate salinity observations as well as TOPEX/POSEIDON altimeterdata.
The ODAS and the JMA operational four dimensional atmospheric analysis systemprovide the El Niño forecast model with initial conditions. The El Niño forecast model is named“Kookai” which means sky and sea in Japanese. The model consists of an atmospheric generalcirculation model (AGCM) and an ocean model which is identical to that used in the ODAS. TheAGCM is a lower resolution version of the previous JMA global atmospheric model for operationalnumerical weather prediction. Its horizontal resolution is T42, and it has 21 levels in the vertical.The following physical parameterization schemes are adopted in the AGCM; Kuo’s cumulusconvection scheme, Mellor-Yamada’s level 2.0 turbulence closure scheme, Lacis-Hansenshortwave radiation, 4-band longwave radiation, relative-humidity-based interactive clouds (Saitoand Baba, 1988).
In the coupled model, heat and momentum fluxes from the atmosphere to the ocean areupdated once a day, and drive the OGCM. On the other hand, the OGCM provides the AGCM withthe sea surface temperature. Flux correction is applied to both the heat and momentum fluxes inorder to suppress climate drift.
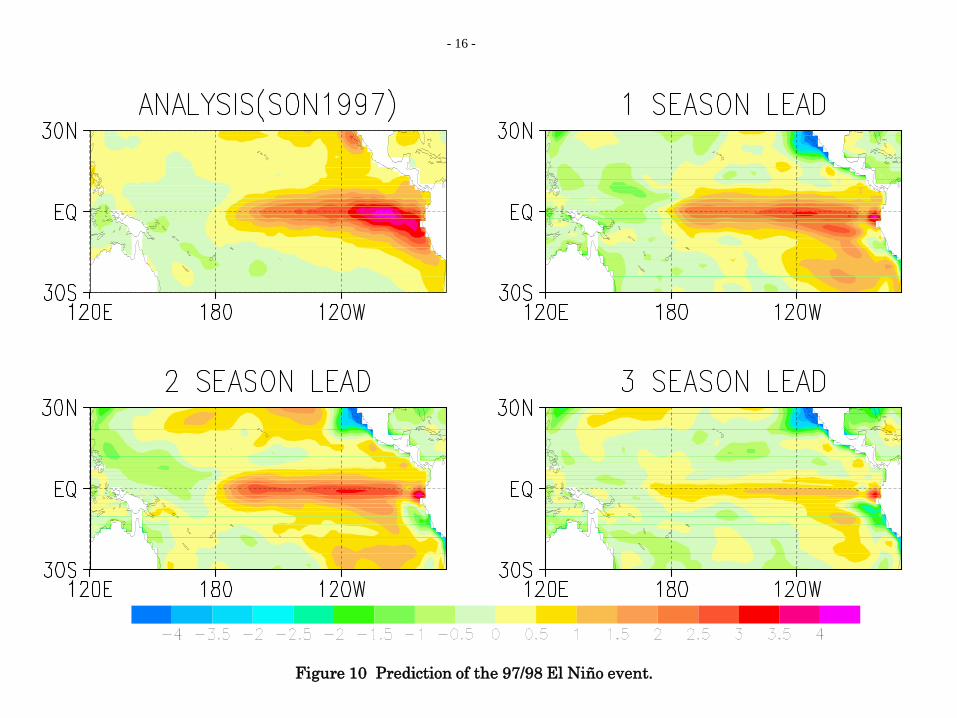
The model predicted the onset and evolution of 97/98 El Niño event reasonably well withone and two season lead time. The upper left panel of Fig.10 shows the observed three monthmean SST anomalies for autumn (September - November) 1997, when the 97/98 El Niño eventwas in its mature phase. The other panels show predicted SST anomalies.
The forecast skill was evaluated with root mean square errors (RMSE) and root meansquare skill scores (RMSSS) for the NINO.3 (4°N-4°S, 150°W-90°W) SST anomaly. Fig.11indicates the RMSE and RMSSS which are calculated using 169 runs from 1986 to 1999.RMSE(M), RMSE(C) and RMSE(P) are the RMSEs of the model predictions, climatology forecastsand persistence forecasts, respectively. With regard to RMSSS, RMSSS(C) is defined as 100×(1-RMSE(M)/ RMSE(C)), and RMSSS(P) defined as 100×(1-RMSE(M)/ RMSE(P)). If RMSSS has apositive value, the forecast skill of prediction by the model is better than that by the climatologyforecast or persistence forecast. It is judged from Fig.11 that the model prediction is better than theother two forecast methods.
Fig.12 shows outlook of NINO.3 SST deviation from the 1961-1990 mean. The thick lineswith closed circles are observed SST deviations and the boxes are predictions for the following sixmonths. Each box denotes the range where the SST deviation will be included with probability of70%. The predictions were obtained by applying a statistical method (Model Output Statistics) tothe six-member output of the El Niño forecast model which is run twice a month.

- 4 -
The ENSO outlook is consulted when making seasonal forecasts for the Japan area,because Japanese climate is closely connected with ENSO. JMA is planning to run an atmosphericgeneral circulation model for seasonal prediction using SST anomalies predicted by the El Niñoforecast model as lower boundary conditions. The other plans for the near future are to update theAGCM to a low resolution version of the latest JMA operational model with an Arakawa - Schubertscheme, and to make the resolution of both the AGCM and OGCM higher than that of the presentcoupled model.
4. Future view
The ocean monitoring and forecasting have been essentially based on global marinemeteorological and oceanographic observing systems and data telecommunications systems. Theformer CMM and IGOSS had significantly contributed to oceanic services in this regard. Recentlydynamical ocean models have been becoming widespread use in ocean monitoring andforecasting. Further development in physical oceanography and computer science as well asimprovement of computer resources will make it possible to introduce higher resolution numericalmodels and more advanced data assimilation schemes into operational systems in the near future.Like weather analyses and forecasts, however, ocean analyses and forecasts crucially depend onglobal marine meteorological and oceanographic observational data which are exchangedworldwide on a real time basis. In this context, JCOMM is expected to play a key role in furtherdevelopment of global observing networks and reliable supporting communications facilities.Experiences and knowledges which will be gained from the GODAE will make it sure that theoceanic services will enter a new era where ocean models are indispensable tools for preparingoceanic products beneficial to a wide variety of users.
References
Argo Science Team (1998): On the design and implementation of Argo: An initial plan for aglobal array of profiling floats. International CLIVAR Project Office Report 21, GODAE Report 5.GODAE International Project Office, Melbourne Australia, 32pp.
Hellerman, S. and M. Rosenstein (1983): Normal monthly wind stress over the world oceanwith error estimates. J. Phys. Oceanogr., 13, 1093-1104.
Kamachi, M., T. Kuragano, T. Yoshida, F. Uboldi and N. Yoshioka (1998): Development of mid-to high- latitude Ocean Data assimilation System. Weather Service Bulletin, JMA, 65, S1-S19 (inJapanese).
Kamachi, M., T. Kuragano, N. Yoshioka, Z. Jiang and F. Uboldi (2001): Assimilation of SatelliteAltimetry into a Western North Pacific Operation Model. Submitted to Advances in AtmosphericPhysics.
Kimoto, M., I. Yoshikawa and M. Ishii (1997): An ocean data assimilation system for climatemonitoring. J. Meteor. Soc. Japan, 75, 471-487.
Kuragano, T. and M. Kamachi (1997): Investigation of temperature and salinity fieldsstatistically derived from TOPEX/POSEIDON altimeter data. Proceedings of the SymposiumMonitoring the Oceans in the 2000s: An integrated approach., Biarritz, France, 4-29.
Kuragano, T., N. Yoshioka, M. Kamachi and A. Shibata (2000): Ocean Monitoring withTOPEX/POSEIDON. Weather Service Bulletin, JMA, 67, S27-S49 (in Japanese).
Levitus, S. (1982) : Climatological atlas of the world ocean. NOAA Prof. Paper 13, 174pp.Levitus, S. and T.P. Boyer (1994) : World Ocean Atlas 1994, vol.4: Temperature, NOAA Atlas
NESDIS 4, 117pp.Levitus, S., R. Gurgett and T.P. Boyer (1994) : World Ocean Atlas 1994, vol.3: Salinity, NOAA
Atlas NESDIS 3, 99pp.Rosati, R.K. and K. Miyakoda (1988): A general circulation model for upper ocean simulation.
J. Phys. Oceanogr., 18, 1601-1626.Saito, K. and A. Baba (1988): A statistical relation between relative humidity and the GMS
observed cloud amount. J. Meteor. Soc. Japan, 66, 187-192.

- 5 -
Captions of Figures
Fig.1 Composition and data flow in the objective analysis system.
Fig.2 Objective analysis system of SSH measured by TOPEX/POSEIDON.
Fig.3 Geographical distribution of the vertical correlation. (a): Altimetry versus temperature (solidline) and salinity (broken line). (b): SST versus temperature (solid line) and salinity (broken line).
Fig.4 Integration region and horizontal grid spacing for the ocean model of the MAP.
Fig.5 Model basin and boundary conditions for spin-up of the ocean model.
Fig.6 Nudging scheme of the assimilation.
Fig.7 Assimilated temperature at the depth of 100m in waters adjacent to Japan, 16 February2000.
Fig.8 Topography and grid points (a), vertical levels (b) of the Ocean General Circulation Model.
Fig.9 Vertical cross sections of temperature and anomalies along the equator obtained by theODAS.
Fig.10 Prediction of the 97/98 El Niño event. Observed three month mean SST anomalies forSeptember to November 1997. The other panels indicate predicted SST anomalies by the leadtimes of one, two and three seasons, respectively.
Fig.11 RMSE and RMSSS for NINO.3 SST anomaly prediction. RMSE(M), RMSE(C) andRMSE(P) are the RMSEs of the model predictions, climatology forecasts and persistenceforecasts, respectively. RMSSS(C) is defined as 100×(1-RMSE(M)/ RMSE(C)), and RMSSS(P)defined as 100×(1-RMSE(M)/ RMSE(P)).
Fig.12 The outlook of SST deviation from the 1961-1990 mean for NINO.3 during half a year fromJune 2001. The thick lines with closed circles are observed SST deviation from the 1961-1990mean. The boxes are predictions for the following six months. Each box denotes the range wherethe SST deviation will be included with probability of 70%.
- 6 -
Objective analysis system
Assimilative ocean model
Figure 1
M A P
Assimilatedgrid point values
SSTsubsurface T
TOPEX/POSEIDON
NOAA-AVHRR
SSH
SST
GTSInternet Ships
Objective analysis system
Assimilative ocean model
Sun Ultra SPARC-2450MHz workstations

- 7 -
SubsurfaceT and S
Initial guess
Subsurface T Ships and buoys
NOAA/AVHRRSST
Subsurface T
Correlation between SST and subsurface T
Adjacent to Japan only
Uppermost 100m only
3D-OI
Merge
For TFor S
Objectiveanalysis
Estimatedsubsurface T and S
All over the modelbasin
OI of TOPEX/POSEIDON
5-days interval
restoring reference Figure 2
- 8 -
Figure 3(a)

- 9 -
Figure 3(b)

- 10 -
Figure 4
- 10 -

- 11 -
55N
13N
45N
Adja
120
Artificial boun T&S : Levitus Zonal Current
0m
4750
cent to Japan1/4×1/4 degrees
Figure 5
110
23N
Wind stress : Hellerman and Rosenstein
180
dary climatology : free slip
m

- 12 -
5days
3days 2days
Center of 3D-OI
Model-obs.
1/e
Nudging Free
2days
Time
Figure 6

- 13 -
Figure 7
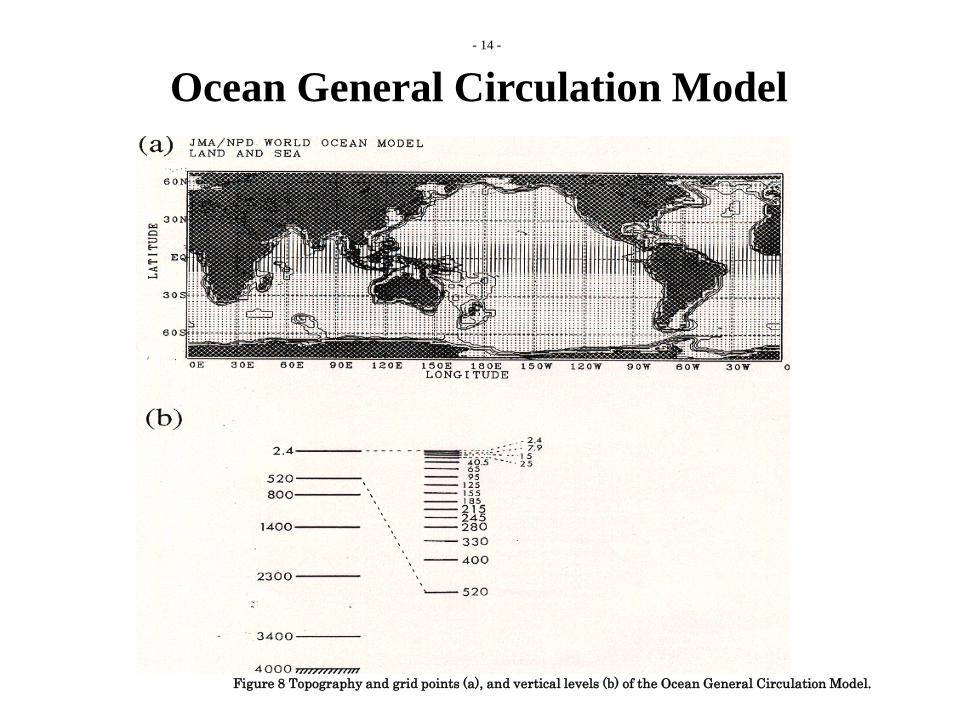
Ocean General Circulation Model
Figure 8 Topography and grid points (a), and vertical levels (b) of the Ocean General Circulation Model.
- 14 -

Temperature along the Equatorial Pacific by ODAS
- 15 -
Figure 9 Vertical cross sections of temperature and anomalies along the Equator obtained by ODAS.
- 16 -
Figure 10 Prediction of the 97/98 El Niño event.

RMSE and RMSSS for Nino.3
0
20
40
60
80
100
1 2 3 4 5 6 7 8 9 10 11 12
(MONTH)
RMSS
S
RMSSS(P)
RMSSS(C)
0
0.2
0.4
0.6
0.8
1
1.2
1.4
1 2 3 4 5 6 7 8 9 10 11 12
RMSE(℃
)RMSE(M)
RMSE(P)
RMSE(C)
- 17 -
Figure 11 RMSE and RMSS for NINO.3 SST anomaly prediction.

El Niño Outlook by the Prediction ModelThe outlook of SST deviation from the 1961-1990 mean for Region B (Niño.3)
- 18 -
Figure 12 The outlook of SST deviation from the 1961-1990 mean for NINO.3 during half a year from June 2001.

- 19 -
Launching the Argo Armada:an array of profiling floats
to observe the global oceans...in real time1
Dr. Stan Wilson2
We have made great progress in our capability to observe the global oceans. The Century ofUndersampling in oceanography extended from the Challenger Expedition in the 1870s to ~1970,during which time it was not possible to distinguish between temporal and spatial variability inobservations taken across ocean basins.
Then the last three decades has seen a Transition to Large Programs. Investigators from multipleinstitutions using multiple platforms organized large programs—like the World Ocean CirculationExperiment (WOCE) and the Tropical Ocean Global Atmosphere (TOGA) programs—beganaddressing how to separate spatial and temporal variability, especially as they moved to coverbroad areas.
During this period satellites emerged as an observational tool which could provide synopticcoverage of the sea surface globally. And modeling was accepted as a complement to observingsystems, to provide a means to fill in between observations both in space and time. Finally, ElNiño has been recognized as a global issue, spanning the Equatorial Pacific, but having a globalimpact.
We are now entering a new era in ocean observations—an era of global and operational programs.We have the World Climate Research Program’s Climate Variability and Predictability Program(CLIVAR)—a global research program, the Global Ocean Data Assimilation Experiment(GODAE)—a global operational demonstration, and Argo—the subject of this talk. We have theGlobal Climate Observing System (GCOS) and Global Ocean Observing System (GOOS), withtheir operational sea level, data buoy, and ship of opportunity observational programs.
There is recognition of the need to provide an institutional focus for operational observations, bothat the intergovernmental level with JCOMM, and at the national level, where in our country theOcean.US Office is being established under our National Oceanographic Partnership Program.
We have a satellite capability to observe the sea surface—both globally and synoptically; but wedo not have a corresponding capability to observe beneath the surface of the ocean. WOCEcollected ~20,000 hydrographic stations globally—but over a nine-year period.
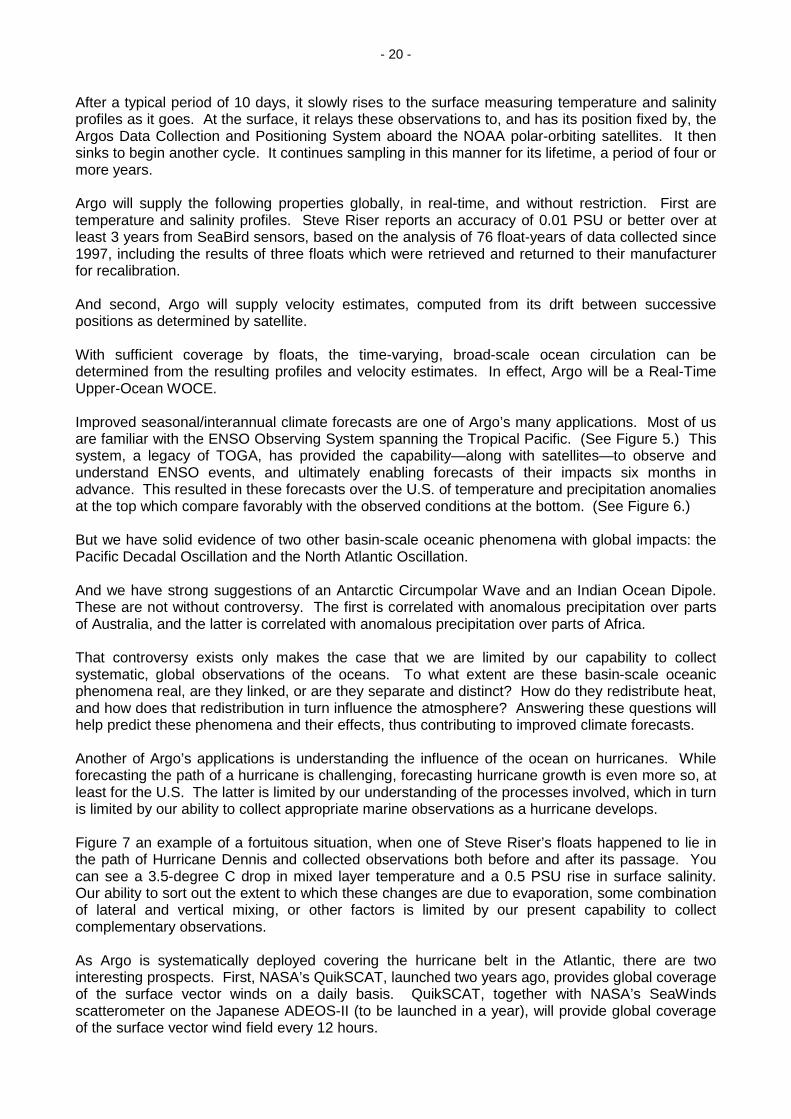
The closest we have to a global, synoptic network to collect subsurface observations is shown inFigure 1. Here we see 6,316 temperature and temperature/salinity profiles collected in real timeduring December, 2000 by the Marine Environmental Data Service of Canada; vast areas of theglobe are unsampled.
Argo will cover the global oceans with 3,000 profiling floats—with a ~300-km horizontal spacing.(See Figure 2.) For a meteorologist, an Argo float can be thought of as an oceanographicradiosonde. For an oceanographer, it is a robotic CTD. (See Figure 3.) An Argo float can bedeployed off a vessel of opportunity where it will freely drift with the currents. It dives bydecreasing its volume, pumping fluid from an external rubber bladder to the inside of the pressurehousing. It descends to as deep as 2,000 meters where it drifts with the currents. (See Figure 4.) 1 A presentation to the Joint Technical Commission on Oceanography and MarineMeteorology, June 25, 2001.2 Director, International Ocean Programs, NOAA/OAR, HCHB Room 5224,Washington, DC 20230, U.S.A. <[email protected]>
- 20 -
After a typical period of 10 days, it slowly rises to the surface measuring temperature and salinityprofiles as it goes. At the surface, it relays these observations to, and has its position fixed by, theArgos Data Collection and Positioning System aboard the NOAA polar-orbiting satellites. It thensinks to begin another cycle. It continues sampling in this manner for its lifetime, a period of four ormore years.
Argo will supply the following properties globally, in real-time, and without restriction. First aretemperature and salinity profiles. Steve Riser reports an accuracy of 0.01 PSU or better over atleast 3 years from SeaBird sensors, based on the analysis of 76 float-years of data collected since1997, including the results of three floats which were retrieved and returned to their manufacturerfor recalibration.
And second, Argo will supply velocity estimates, computed from its drift between successivepositions as determined by satellite.
With sufficient coverage by floats, the time-varying, broad-scale ocean circulation can bedetermined from the resulting profiles and velocity estimates. In effect, Argo will be a Real-TimeUpper-Ocean WOCE.
Improved seasonal/interannual climate forecasts are one of Argo’s many applications. Most of usare familiar with the ENSO Observing System spanning the Tropical Pacific. (See Figure 5.) Thissystem, a legacy of TOGA, has provided the capability—along with satellites—to observe andunderstand ENSO events, and ultimately enabling forecasts of their impacts six months inadvance. This resulted in these forecasts over the U.S. of temperature and precipitation anomaliesat the top which compare favorably with the observed conditions at the bottom. (See Figure 6.)
But we have solid evidence of two other basin-scale oceanic phenomena with global impacts: thePacific Decadal Oscillation and the North Atlantic Oscillation.
And we have strong suggestions of an Antarctic Circumpolar Wave and an Indian Ocean Dipole.These are not without controversy. The first is correlated with anomalous precipitation over partsof Australia, and the latter is correlated with anomalous precipitation over parts of Africa.
That controversy exists only makes the case that we are limited by our capability to collectsystematic, global observations of the oceans. To what extent are these basin-scale oceanicphenomena real, are they linked, or are they separate and distinct? How do they redistribute heat,and how does that redistribution in turn influence the atmosphere? Answering these questions willhelp predict these phenomena and their effects, thus contributing to improved climate forecasts.
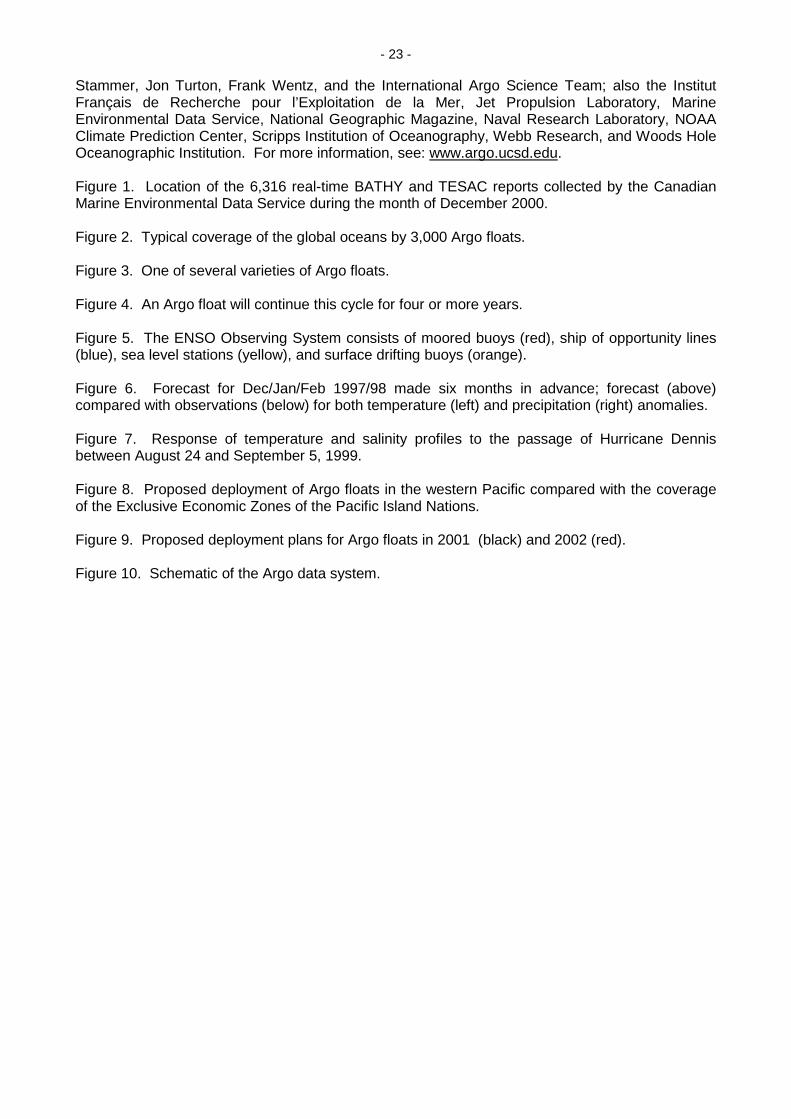
Another of Argo’s applications is understanding the influence of the ocean on hurricanes. Whileforecasting the path of a hurricane is challenging, forecasting hurricane growth is even more so, atleast for the U.S. The latter is limited by our understanding of the processes involved, which in turnis limited by our ability to collect appropriate marine observations as a hurricane develops.
Figure 7 an example of a fortuitous situation, when one of Steve Riser’s floats happened to lie inthe path of Hurricane Dennis and collected observations both before and after its passage. Youcan see a 3.5-degree C drop in mixed layer temperature and a 0.5 PSU rise in surface salinity.Our ability to sort out the extent to which these changes are due to evaporation, some combinationof lateral and vertical mixing, or other factors is limited by our present capability to collectcomplementary observations.
As Argo is systematically deployed covering the hurricane belt in the Atlantic, there are twointeresting prospects. First, NASA’s QuikSCAT, launched two years ago, provides global coverageof the surface vector winds on a daily basis. QuikSCAT, together with NASA’s SeaWindsscatterometer on the Japanese ADEOS-II (to be launched in a year), will provide global coverageof the surface vector wind field every 12 hours.

- 21 -
Second, the Japanese/U.S. TRMM mission carries a Microwave Imager (TMI) that is able toprovide sea surface temperatures (SST), albeit at a much coarser spatial resolution that theAVHRR, the infrared imager on the NOAA polar-orbiting satellites. Unlike AVHRR, the TMI is ableto observe SST through clouds. Argo, together with satellite-derived surface temperature andsurface vector winds, will contribute to advancing our ability to forecast hurricanes.
The final application of Argo data is understanding climate change in the oceans. Syd Levitusestimates that the upper 300 meters of the oceans have warmed by approximately 0.2 degrees Cover the past 50 years, but the data on which these results are based are concentrated in theNorthern Hemisphere, especially along shipping lanes.
When can we achieve the 3,000-float array? Argo was initiated in 1999 and, expressed innumbers of floats, has grown from 55 that first year, to 255 in 2000 and 535 in the current year.703 are proposed for funding in 2002.
Assuming 90% of the floats live four years (assume the other 10% fail early), it will be necessary toprovide floats at a sustained rate of 825 per year, in order to achieve a 3,000-float array. We couldachieve that goal by then end of 2005—if the proposed funding were realized at a level of 825 peryear.
13 countries (Australia, Canada, China, Denmark, France, Germany, India, Japan, New Zealand,Republic of Korea, Spain, United Kingdom and the U.S.A.) plus the European Commission arecontributing floats.
What does Argo cost? Each float costs approximately U.S. $25,000 over its 4-yr life—includinghardware, deployment & data management costs. The cost per profile is ~$25K / (36 profiles/yr x4 yrs) ~ $170. This is similar to the XBT cost per profile ~ $100. The estimated cost of the 3,000-float array is approximately $20,000,000, an amount to be shared by the international partners.
The WMO & IOC have endorsed/accepted Argo as an important component of the operationalobserving system of GOOS and GCOS, as a major contribution to CLIVAR and other researchprograms—assuming that the data and derived products from Argo floats are…“freely available inreal-time and delayed mode”. There will be no period of exclusive use.
The Resolution passed by the IOC Assembly states that “as with existing surface drifting buoyssome…[floats] ...may drift into waters under national jurisdiction” [ie, an EEZ]. Further,“…concerned coastal states must be informed in advance... of all deployments of...floats whichmight drift into [their] waters…” The IOC Resolution was silent concerning the issue of deploymentof floats within EEZs.
How will we coordinate deployments? The Argo Information Centre has been established underJCOMM, with Mathieu Belbéoch hired as full-time Technical Coordinator to provide services forArgo, just as they are for DBCP & SOOP. In addition, the AIC is to provide notification for, andassist with, float deployments.
We have had three Implementation Planning Meetings for Argo:
• Pacific Ocean -- Tokyo, April 13-14, 2000• Atlantic Ocean -- Paris, July 10-11, 2000• Indian Ocean -- Hyderabad, July 26-27, 2001
In these meetings we discuss which countries are interested in providing how many floats forcoverage of the basin in question and according to what schedule, what opportunities are availablefor assistance in deployment, what EEZs issues may be specific to the region, and how mightcountries in the region benefit from possible improvements in forecasts which Argo data mightenable.

- 22 -
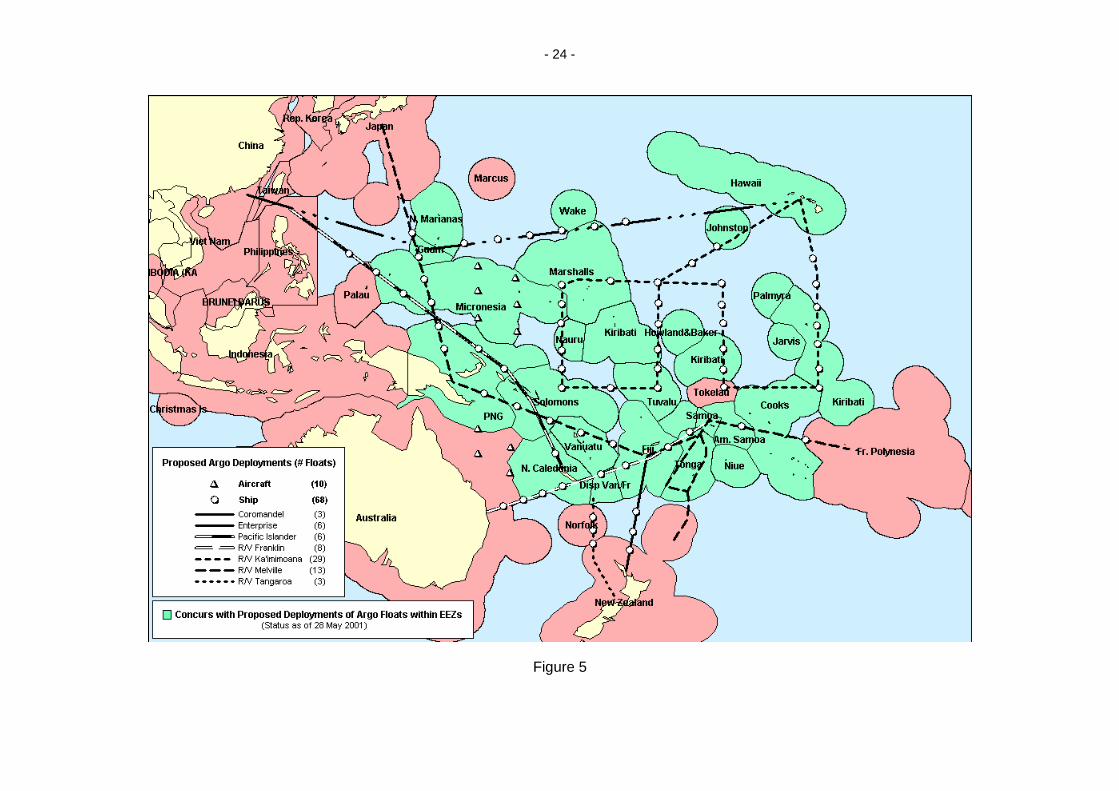
In the Pacific meeting, we realized that adequate coverage of the western tropical Pacific—apriority area—will of necessity involve float deployment within the EEZs of Pacific Island Nations, ifthere is to be adequate coverage of the region. For example, Figure 8 shows the deploymentplans for 2001 compared with EEZ coverage in the western Pacific.
Consequently, we have approached these Nations via South Pacific Applied GeoscienceCommission (SOPAC) and, working through its Council, have developed the following consensusapproach:
The Float-Providing Countries will:
• Provide advance notice of plans for ships & aircraft coming into the collective EEZ of thePacific Island Region for float deployment.
• Provide assistance identifying and linking with operational forecast centers which willgenerate forecasts using Argo data.
The Pacific Island Nations will:
• Concur with plans for ships & aircraft coming into the collective EEZ of the Pacific IslandRegion for float deployment.
When you see the next monthly status of Argo float deployments, you will start to see floatsdeployed within this region according to this consensus plan. Overall, as of the first of June, 2001,there were 135 Argo-funded floats in the water reporting on real-time data on the GTS. Figure 9shows the plans for deployments in 2001 and 2001.
Floats can be deployed over the side of ships of opportunity, even when underway at 20 knots;they can also be deployed from C-130 aircraft.
Finally, how we get the data back. Figure 10 is a schematic from the Canadian MarineEnvironmental Data Service (MEDS) showing how Service Argos’ Data Collection and PositioningSystem aboard the NOAA polar-orbiting satellites is used to relay the profile data, as well as fix theposition of the floats when they surface. The goals for access to Argo data are: real-time data ontothe GTS within 24 hours, and scientifically quality-controlled data via Internet within 3 months.Exactly how the data system will organized is the focus of an Argo data management workshopwhich MEDS is hosting this fall.
In closing, Argo, together with Jason, its satellite companion to be launched this September, areboth elements of the broader concept—GODAE, the Global Ocean Data Assimilation Experiment.
In addition to existing systems like surface drifting buoys, ships of opportunity, and sea levelstations, we will need complementary in-situ observations from fixed Time-Series Observatories.Some of these exist—like the moored arrays (TAO and PIRATA) in the Pacific and Atlantic, andthe air-sea flux site off northern Chile. But many do not. This activity—being organized by BobWeller at Woods Hole and Uwe Send at Kiel—will accompany Argo and Jason in contributing toGODAE.
Where are we headed? With GODAE, we look forward to the time when real-time observationscan be collected and assimilated into models to deliver better forecasts in order to demonstrate theoperational utility of the observing systems. To the extent that we can achieve this, we will bemake progress toward achieving our long-term goal, namely, implementing a comprehensiveoperational system for observing the global oceans.
Acknowledgments: Many people and institutions have contributed to this presentation. Theyinclude: Howard Freeland, Dean Roemmich, Muriel Cole, Russ Davis, Mike Johnson, Kuh Kim,Syd Levitus, Tim Liu, Breck Owens, Steve Piotrowicz, Steve Riser, Alf Simpson, Uwe Send, Detlef
- 23 -
Stammer, Jon Turton, Frank Wentz, and the International Argo Science Team; also the InstitutFrançais de Recherche pour l’Exploitation de la Mer, Jet Propulsion Laboratory, MarineEnvironmental Data Service, National Geographic Magazine, Naval Research Laboratory, NOAAClimate Prediction Center, Scripps Institution of Oceanography, Webb Research, and Woods HoleOceanographic Institution. For more information, see: www.argo.ucsd.edu.
Figure 1. Location of the 6,316 real-time BATHY and TESAC reports collected by the CanadianMarine Environmental Data Service during the month of December 2000.
Figure 2. Typical coverage of the global oceans by 3,000 Argo floats.
Figure 3. One of several varieties of Argo floats.
Figure 4. An Argo float will continue this cycle for four or more years.
Figure 5. The ENSO Observing System consists of moored buoys (red), ship of opportunity lines(blue), sea level stations (yellow), and surface drifting buoys (orange).
Figure 6. Forecast for Dec/Jan/Feb 1997/98 made six months in advance; forecast (above)compared with observations (below) for both temperature (left) and precipitation (right) anomalies.
Figure 7. Response of temperature and salinity profiles to the passage of Hurricane Dennisbetween August 24 and September 5, 1999.
Figure 8. Proposed deployment of Argo floats in the western Pacific compared with the coverageof the Exclusive Economic Zones of the Pacific Island Nations.
Figure 9. Proposed deployment plans for Argo floats in 2001 (black) and 2002 (red).
Figure 10. Schematic of the Argo data system.

- 24 -
Figure 1
- 25 -
Figure 2

- 24 -
Figure 3
- 25 -
Figure 4
- 24 -
Figure 5

- 25 -
Figure 6

- 26 -
Figure 7

- 27 -
Figure 8

- 28 -
Figure 9

- 29 -
Figure 10
- 34 -
The Path to JCOMM
Neville Smith
Bureau of Meteorology Research Centre
Abstract: The path to the First Session of JCOMM has required much planningand more than a little vision. In this Lecture, we will focus on one element of thisprocess, scientific planning and design, and examine some of the significantcomponents of the design, as it exists today. Advances in scientific knowledge andin technology have provided the keys for rapid advances in operationaloceanography over recent years but there have also been significant, evolutionarychanges in marine forecasting and weather prediction that have impacted theapproach to observation. Perhaps more importantly, there has been a big changein the perceived societal relevance of operational oceanography, from monitoringand prediction of El Niño to advanced applications for ocean prediction. Concernfor the consequences of climate change has also heightened interest. Remotesensing has, in part, provided the ability to be global, an ability that has beencentral to all planning. Planning and design have also placed a high premium onintegration and broad effectiveness. This paper presents a picture of a well-planned, integrated design, with an appropriate balance between short-term andlong-term needs. An effective JCOMM is central to the design. For the future, themajor challenge will be to work with JCOMM to ensure that the benefits of thisobserving system are available to all who wish to use it, using methods that areboth efficient and effective. A few of the major issues will be discussed.
1 - INTRODUCTION AND HISTORICAL BACKGROUND
The Joint Technical Commission for Oceanography and Marine Meteorology owes its existence tothe hard work of many and to the current perception that the time of “operational oceanography”has finally arrived. The focus of this paper is the path we have taken to reach this point, with mostattention being given to physical oceanography and the development of an observing system.Though the theme is operational oceanography, we do not forget that the interests of theCommission include marine meteorology and that there is a rich and important contribution to thepartnership that is also coming from that community.
M.F. Maury, superintendent of the Depot of Charts and Instruments at Washington, D.C. in themiddle part of the nineteenth century, realised that scientific study and systematic observations ofthe sea could improve safety and decrease voyage times. Maury began to collect and collateinformation on surface currents and weather conditions leading to the publication of The PhysicalGeography of the Sea (Maury 1859), making it one of the first practical applications of oceanscience and observations. This international system of voluntary observation remains in placetoday, nearly 150 years later, and provides the ultimate foundation for the work of JCOMM.
It is probably not an exaggeration to say that operational oceanography evolved little for nearly acentury after Maury, despite some of the pioneering work being done in the name ofoceanography. World War II marked the start of an era that was characterised by significanttechnological advances, such as the bathythermograph for continuously recording temperature asa function of depth, and by highly organised, intensive oceanographic surveys which sought quasi-synoptic sampling of large regions. This era also marked the introduction of non-ship basedinstrumentation such as drifting and moored buoys. One of the more imaginative innovations ofthis period was the neutrally buoyant float (Swallow 1955). The principles of this technologyprovide the basis for modern autonomous float instrumentation.

- 35 -
Through the fifties and sixties rudimentary systems for wave forecasting and some other oceanservices were put in place but it was not until the late 1970’s and early 1980’s that the first realsteps toward operational systems were made. The development of the ExpendableBathythermograph (XBT) in the 1970’s and the development of the drifting buoy for the First GARPGlobal Experiment (FGGE) buoy were two key advances. At this time people began to ponderwhether oceanography could develop an equivalent of the World Weather Watch – Dr Jim Bakercoined the term World Ocean Watch. Though this name was not taken further, it is probably onlynow that we appreciate a key weakness of such a term. The word “Weather” in World WeatherWatch brings focus onto the service, onto the impact, whereas “ocean” focuses on the medium.This is perhaps also a failing of the term Global Ocean Observing System (GOOS) since it too failsto identify with the associated services and impacts of the system. Oceanography has not come upwith a collective term for those direct effects of the ocean that impact our operations at sea, themarine environment, and society in general. The term “ocean weather and climate” seemsinadequate and we should perhaps explore the languages and dialects of the members of theCommission for such a word!
This period also introduced planning for two significant research efforts, the Tropical Oceans-Global Atmosphere Experiment, TOGA, and the World Ocean Circulation Experiment, WOCE(Smith, 2001). These experiments were vital for the development of several elements of JCOMMincluding the ship-of-opportunity program (SOOP), the global sea level network (GLOSS), thePacific tropical moored buoy array (TAO and TRITON), the surface drifter program and, morerecently, Argo. These research programs were also influential in the development of prototypeocean products and services and in the development of data management practices andstandards. Both Experiments, but perhaps more so TOGA, were influential in embracing theinterests of developing countries and bringing them in as both providers of information (e.g., withinthe GLOSS network) and developers and users of services.
It is useful to cast our attention back a mere ten years. In 1990, there was no TOPEX/PSEIDONsatellite; there were only around 6 tropical moorings; IGOSS was young; and we had had the firstsigns of a “successful” El Nino forecast. WOCE was just embarking on its observational program.The computers being used for ocean and climate applications were about as powerful as a laptopPC today. The Internet was available but the World Wide Web was yet to make its big impact.Oceanographic services were few. Yet, at this time, people were already convinced of the value ofsystematic observations.
Through this period, several people also started to ponder the design of an ocean observingsystem, a task that was explicitly recognized in the goals of WOCE. The Ocean Observing SystemDevelopment Panel was established in 1989 to provide a conceptual plan for a permanent oceanobserving system, an effort that ultimately resulted in a scientific design for an ocean observingsystem for climate (OOSDP, 1995).
Today, we have in place many elements of what we desire for an operational ocean observingsystem, and through the remainder of this paper we will discuss these elements in turn. For El Niñoprediction, the accompanying paper by scientists from the Japan Meteorological Agency providesample evidence of the progress in recent years. For operational ocean forecasting, the paper byStephan Dick also discusses many related areas of progress. The paper by Stan Wilson providesdetail on Argo, perhaps one of the most exciting developments of recent years. With theseseparate contributions this paper is left with an altogether more manageable task and it willemphasise, yet again, the strength we believe comes from integration, cooperation and a multi-faceted user base.
2 - KNOWLEDGE AND A SYSTEMATIC APPROACH
Through the First Session of the Commission we focused on the technical elements, those aspectsthat in the end constitute an operating, working, robust system. Yet there is a fundamental aspectthat is more important than all these components. It was referred to in the opening remarks by theSecretary General for the WMO, by the Executive Secretary of IOC, and by the Iceland Minister for

- 36 -
the Environment. Knowledge of the oceans is fundamental to all we do and aspire to do. Itdetermines why we measure, how we measure, and how effective our measurements are. Itunderpins both the way we exploit information, be it a climate forecast or a wind wave forecast –the building blocks of every model comprise knowledge of processes and knowledge of the ocean,among other things. Such considerations lie at the heart of our vision for JCOMM: the developmentof knowledge and capacity for future generations, from all societies. With knowledge we can turnuncertainty into certainty, the impossible into the possible, the needed into the available.
Advances in scientific knowledge and in technology have provided the keys for rapid advances inoperational oceanography over recent years but there have also been significant, evolutionarychanges in marine forecasting and weather prediction that have impacted the approach toobservation. Perhaps more importantly, there has been a big change in the perceived societalrelevance of operational oceanography, from monitoring and prediction of El Niño to advancedapplications for ocean prediction. Concern for the consequences of climate change has alsoheightened interest.
For many, operational oceanography does not have a defined place in the knowledge/skill domain.Whereas society and science is generally familiar with, and appreciative of, our skills in weatherprediction, they are mostly ignorant of our potential contributions in operational oceanography. Atleast in part, drawing on our advanced knowledge base, we should see one of our tasks as puttingoceanography on “the map” and acknowledge the importance of a strong and constructiverelationship with science.
Having built the knowledge base, or at least established to our own satisfaction that we haveaccess to the requisite knowledge and understanding, we should immediately turn our attention tothe other end, the user end, and ensure we have the correct approach to taking account of userrequirements.
The first point is that we must build our system with the whole user community in mind, not just onenarrow sector. We may choose to sell (promote) some particular element against a particular use,but we should design and operate with the broad community in mind. We should make the contentof the observing system (see Fig. 1) a principle focus, making sure the different parts (readJCOMM Programme Areas) are scientifically and technically best-practice, that they take fullaccount of the user push and pull, and that they are structured in such a way that new technologycan be incorporated as appropriate.
The Ocean Observations Panel for Climate (OOPC) has attempted to implement this approach inpractice. The scientific guidance of the Panel attempts to address the full range of objectives,ranging from climate change down to marine and numerical weather prediction. It attempts torepresent these different drivers collectively in the priority it attaches to different observationalelements, both existing and emerging, of the system. There is no simple formula for doing this, andit cannot be done with tables and databases. It requires scientific knowledge of the objectives; itrequires technical knowledge of the potential solutions; it demands both a scientific and socio-economic representation of the utility (the purpose to which we put the system) and technical andlogistical knowledge of the availability (what can we accomplish within the bounds of our presentcapability, taking due account of the logistical and resource limitations).
True effectiveness, for a given investment, is achieved through integration at both the user end(multi-use outputs) and provider source (combining several different approaches and elements tomeet the requirement). The attached schematic attempts to illustrate this point (Fig. 1). JCOMM,together with GOOS, works to develop the content of the system including observational networks,data distribution procedures, models (production) and products. There is then an interface to thebroad user community with various groups providing value-added services for these particulargroups.

- 37 -
distribution product
observations production
R&D
Content
! farmer’s gate
! The cellar door
! The ship-master’s chart
! Safety & Rescue
! The fisherman’s
basket
! The scientist’s kit … …
Figure 1. Schematic of the relationship between JCOMM and its ultimate user communities.
Nowlin et al (2001) note the importance of a systematic approach to the evolution of an operational(sustained) ocean observing system. Many of the issues discussed in that paper are relevant to theevolution of JCOMM. In particular, they note the importance of a phased approach to theintroduction of new technology and the importance of building community and user acceptance todifferent approaches.
3 - THE OBSERVATIONAL NETWORKS
Smith and Koblinsky (2001) provide a synopsis of the current plans for the ocean observingsystem. We will not repeat that detail here but instead concentrate on giving a synopsis of the keyfeatures.
3.1 - Commitments to long-term satellites
Remote sensing is a key component of the observing system. As was pointed out several times atthe First meeting of the Commission, one of our most important challenges has been, andcontinues to be, advocacy for sustained (continuing) satellite missions. The Ocean Theme of theIntegrated Global Observing Strategy (IGOS; Ocean Theme Team, 2000), supported byconsensus from the OceanObs Conference (Smith and Koblinsky, 2001), has set down therationale and provided priorities. The work now is to see these plans implemented or, failing that, tosee that the most important contributions are put in place. The key elements include:
• Polar orbiting and geostationary satellites for sea surface temperature;• Accurate and high-resolution altimetry (at least one mission of the class of
TOPEX/Poseidon and one similar to ERS/ENVISAT);• High-resolution surface winds from scatterometers (preferably two) or equivalent devices;
and• Accurate images of sea-ice extent and coverage.
The path to the point we are at today has required significant levels of investment and greattechnical innovation. The in situ and remote sensing communities have not always worked closelytogether but today there is considerable consensus on the need for an integrated approach. All ofthe required remote sensing capabilities are within reach now though we have yet to secure long-term commitments in several important areas (e.g., altimetry). Commitment and continuity are twoof the main challenges identified by the Ocean Theme Team (2000) though the very fact that thatreport was published is an indication of the intent and determination of the ocean remote sensingcommunity to deliver the needed capability.

- 38 -
It is important to note that we do not see any one element of the observing system as standingalone. The power of the integrated system derives from all its parts, not just from one element orfrom one application. The SST system requires both in situ and satellite. The same for sea surfacetopography and sea level.
We have the technology to observe what we want, with the possible exception of salinity. We knowthe sampling that is demanded from an integrated multi-purpose system. We have assigned ourpriorities. We have communicated requirements to the agencies and have set in place a continuingprocess of constructive dialogue, recognizing the limits of the agencies and the value we canreturn. All are agreed on the importance.
3.2 - The in situ elements
The OceanObs Conference (Smith and Koblinsky, 2001) established a consensus on the primaryelements of the ocean observing system and on needed enhancements. The Conferenceemphasized the need for effective integration and for considering the system as a multi-faceted,multi-purpose system with a staged approach. Smith and Koblinsky (2001) provide the schedulefor full implementation of the system. For the in situ component, the key networks include
• The tropical moored buoy networks (TAO, TRITON and PIRATA);• The ship-of-opportunity and Voluntary Observing Ship Programs;• The Argo global array of profiling floats;• The surface drifter network;• Time-series stations and surface reference sites; and• Hydrography and carbon measurements in support of carbon cycle studies and climate
change monitoring.
Direct measurements of the ocean are critical and will continue to be important, no matter howskilful satellites become at directly or indirectly inferring ocean properties. Two aspects thatreceived less attention at the First meeting of the Commission are fixed-point (time-series) stationsand deep sections. Fixed-point measurements have an illustrious place in our historical record,principally due to the contributions from ocean weather ships. Advances in technology are re-enabling this approach, as is the heightened interest in multi-disciplinary sampling. We are onlynow starting to consider how best to exploit the legacy of WOCE with respect to deepmeasurements. By JCOMM II, we might anticipate a robust plan of deep measurements, mostlydriven by interest in climate change and the carbon cycle.
4 - APPLICATIONS
Climate change continues to occupy the attention of many nations and is a key factor in allconsiderations of the observing system. There is nothing that the JCOMM will do that we canassume is not important for climate change. We mostly think in terms of observations, and that iscertainly important, but we should give equal attention to, if not greater, the way we processinformation (data management) and the way we allow less capable nations to access importantinformation.
El Niño prediction is perhaps the most topical application at present but, as this is covered inanother paper, we will not discuss it here. Similarly, the general area of marine and regionalprediction is covered elsewhere.
In general terms, the “game” we are playing in is one of exploitation of data for broader socio-economic benefit (Fig 2). As indicated previously, the ocean observing system is in fact a multi-faceted, interconnected system of networks, each focused on different aspects of the ocean and/orclimate. However, to the user, these facets are of secondary importance. The output of the systemand its ability to meet specific needs are the primary focus. The principle behind the Global OceanData Assimilation Experiment (GODAE; IGST, 2000) is that models and data assimilation can beused to provide a general framework for exploiting and delivering the value from the observing

- 39 -
system. The data is turned into initial conditions or constraints for a model that in turn usesknowledge of physics and dynamics to produce products that may take the form of a forecast (e.g.,a forecast for the location of the Kuroshio current at a lead time of three weeks) or the form of ananalysis for fields that are not directly observed. Climate predictions and boundary currents forregional predictions are two other applications that might be “fed” by such a system (Fig. 3).
From where we know ... To where we do not ...
Today …Here …Ours ...
Tomorrow …
There …
Yours ...Empirical
Figure 2. Schematic of the processes used to exploit data. In some cases we use linear, perhapsempirical relationships to relate the current state to, say, a likely future state. In other casesforecasts are produced based on current data (“today”), perhaps at a specific location (“here”), andperhaps for a subset of the total variable space (“ours”), in order to forecast the state in the future(“tomorrow”), at some remote location (“there”) or for some variables that are not part of theobservables (“yours”). The process involves extrapolation (e.g., a forecast), interpolation (e.g.,discrete points to a grid) and interpretation (e.g., inferring winds from sea surface topography).
Figure 3. Illustration of the process for taking in situ and remotely sensed data (left) through a model-based assimilation system to produce a self-consistent analysis, which is then used to produceproducts such as a climate or regional/coastal forecast.
The concept we have described is of course well known to meteorologists but only graduallyemerging in oceanography. We assemble the various sets of information, whether it is fromsatellites or in situ platforms, and ingest (assimilate) the information into computer models of theocean. The models allow us to do in practice (Fig. 3) what we illustrated in concept (Fig. 2). Theequations of motion, and the knowledge encoded in the parameterisations, allow us to exploit the

- 40 -
observations in a unique way. The “knowledge” introduces certainty and reproducibility, though weare far from finding a way to measure that skill.
The model “scientific” product only gets us halfway. The critical step is taking this informationforward into value adding applications, perhaps a climate forecast and associated interpretation forSouth America, or perhaps an ocean prediction for the eastern Indian Ocean. This is the interfaceintroduced with Fig. 1. The sources of uncertainty and error are numerous - Nature has awonderful way of confounding theory.
GODAE is ambitious but was initiated in the belief that the objectives are doable and worth doing.The anticipated outcomes include (IGST, 2000):
• Improved predictability of coastal and regional subsystems through the provision of suitableoceanic boundary conditions,
• Better initial conditions for climate predictions,• Improved open ocean nowcasts and forecasts,• Integrated analyses or reanalyses for research programs• Description of the ocean circulation and physics upon which more specialized systems can
be developed and tested,• A foundation for hypothesis testing, process studies, etc.• Improved availability and utility of ocean data,• A methodology for systematic handling, quality control and consistent scientific
interpretation (analysis) of special data sets,• Assessments of the observing system and of the utility of new ocean data sets,• Model testing and improvement through data assimilation,• A viable, long-term observing system for GOOS; and• Development of an enhanced user base and suite of applications.
5 - THE FUTURE
While we can look back and be proud of the achievements, there is clearly much to be done. Forthe Indian Ocean, we have some very good ideas on what is required but, at present, lack theconsensus and resources to implement those ideas. In the ice-covered regions, we need to makefurther progress on sustaining those observations that are known to be effective while at the sametime developing support for innovative new systems (e.g., tomography). In the South Atlantic wehave only the broadest notions of what is required and why, so the community needs to forgesome consensus on the best approach. In the Southern Ocean, remoteness and logisticalconstraints make the challenge difficult but, again, there is a clear willingness to work together tofind a sustainable approach.
Kyoto and recent discussions on the importance of the carbon cycle suggest we need to giveparticular attention to carbon measurements. However, just how we go about this in a JCOMMworld and with the recognition that such measurements are, and probably will forever remain, veryspecialised is not yet clear.
One aspect that the community does seem to be agreeing on is data management. WithinJCOMM, data management is being accorded a prominence that has been lacking in the scientificcommunity. Several groups have concluded that we need fundamental changes in attitude and intechnology if we are to bring the riches of the ocean observing system to the benefit of all whowould choose to use it. If there is a grand challenge for the future, then perhaps this is it: To createan efficient and effective data and information management system for the ocean and marineenvironment, based on leading-edge [ocean] information technology, and serving theoceanographic community and beyond.
6 - CONCLUSION

- 41 -
The path to JCOMM has been long but a rich capability has been revealed and is now beingexploited through JCOMM and other mechanisms. We recognize that we are only part the waythere and that there is a long way yet to go. There are significant challenges in terms of continuityand sustained support for observing networks, in terms of the development of appropriateprocessing (model and assimilation) systems, and in the area of data and informationmanagement.
For JCOMM, all parts are vital, all elements of all Program Areas (observations, data management,services and capacity building). As a community, we must be prepared to debate and resolve keyissues and to set priorities. If we do not, the decisions will be made for us. Barriers to integrationand cooperation must be taken down if we are to realize an integrated, multi-purpose, coordinatedand multi-national system. JCOMM is vital for this process.
The outlook appears to be bright and we seem to have the technology and methods to do much ofwhat we wish to. Strong work now will have big dividends and clear and precise planning will makeJCOMM efficient and effective.
References
International GODAE Steering Team, 2000: GODAE Strategic Plan, N. Smith (ed.), publ. GODAEProject Office, 2000.
Maury, M.F., 1859: The Physical Geography of the Sea. Harper and Bros, New York.Nowlin, W. D. Jr., M. Briscoe, N. Smith, M. J. McPhaden, Dean Roemmich, P. Chapman, and J. F.
Grassle, 2001: Evolution of a Sustained Ocean Observing System. Bull. Amer. Meteor.Soc., 82(7), 1369–1376.
Ocean Observing System Development Panel,1995: The Scientific Design for the CommonModule of the Global Ocean Observing System and the Global Climate Observing System:An Ocean Observing System for Climate. Report of the OOSDP, publ U.S. WOCE Office,Texas A&M University, College Station Texas, 285 pp.
Ocean Theme Team, 2000: An ocean theme for the IGOS partnership. Final Report of the oceanTheme Team, 38 pp. [Available online at http://ioc.unesco.org/igospartners/IGOS-Oceans-Final-0101.pdf.]
Smith, N.R., 2001: Ocean and Climate Prediction – the WOCE Legacy, Chapter 7.4 of “OceanCirculation and Climate” (Eds. G Siedler, J A Church and J. Gould) , Academic Press, pp585-602.
Smith, N. and C. Koblinsky, 2001: The Ocean Observing System for the 21st Century. In OceanObservations for the 21st Century, published by the GODAE Office/BoM, accepted.
Swallow, J.C., 1955: A neutral-buoyancy float for measuring deep currents. Deep-Sea Res., 3, 74-81.

- 42 -
First Session of JCOMM, Akureyri, Iceland, 19 – 29 June 2001
Operational Ocean ModellingForecasting and Applications
Stephan DickFederal Maritime and Hydrographic Agency, Germany
1. Introduction
In many countries, operational ocean models are used to predict water levels, currents, sea state,water temperatures, salinity or the dispersion of substances. This presentation will focus on short-term forecasts and on forecasting systems for shallow sea areas like the north European shelfseas.
In the north European shelf area, nearly every country has an operational system for thegeneration of numerical ocean forecasts. An overview of operational systems used for real-timeprediction of tides, surges, currents and waves in north and west European countries is given byFlather (2000). Almost all of the operational models are run at national institutions, often by thenational weather forecasting agencies. Funding for their development and implementation hasbeen primarily national, and their focus is on national applications.
One important application is the support of the water level prediction and storm surge warningservices. Also maritime shipping is supplied with water levels and information about currents.Computed currents and waves are used in different ship guidance and information systems and forship routing. In future, it shall be possible to integrate current information in electronic chartdisplays (ECDIS). Model forecasts are also needed in combating marine pollution and to supportsearch and rescue operations. Other important customers are the oil and gas industry, military,coastal engineering and fisheries as well as the leisure industry.
To fulfil the various tasks, an operational model system has been established at the FederalMaritime and Hygrographic Agency (Bundesamt für Seeschifffahrt und Hydrographie, BSH) whichconsists of different circulation and dispersion models. Results of the BSH's Model System for theGerman parts of the North Sea and Baltic Sea will be presented as examples of different marineapplications.
2. The Operational Model System of the BSH
The operational model system of the BSH has been in use for more than 15 years now (Dick,1997). In daily routine runs, predictions for up to 72 hours are computed on the basis ofmeteorological and wave forecasts supplied by the German Weather Service (DeutscherWetterdienst, DWD) and based on tide predictions.

- 43 -
Fig. 1: The Operational Model System of the BSH
The main constituents of the model system are a hydrodynamical model to compute currents,water levels and temperatures, salinities and ice cover in the North Sea and Baltic (circulationmodel), programmes to compute the drift and dispersion of substances (dispersion models), asurge model for the North Sea and Regional models for German estuaries (Fig. 1).
2.1 The Circulation Model
The Circulation Model (Dick et al., in prep.) predicts currents, water levels, water temperatures,salinity, and ice cover in the North Sea and Baltic Sea in nightly routine runs on two nested andinteractively coupled grids. Grid spacing in the German Bight and western Baltic Sea is 1 nauticalmile and 6 n.m. in the other North and Baltic Sea areas (Fig. 2). The model also simulates thefalling dry and flooding of tidal flats, allowing complex processes in the highly structured coastalwaters (tidal flats, sandbanks, tidal channels, barrier islands) and water exchange with the opensea to be simulated realistically (Dick and Schönfeld, 1996).
Operational Models of BSH (and DWD)
DWD:
wind, air pressure, air temperature, wave height, direction, frequencycloud coverage, specific humidity of waves and swell
_____________________________________________________________________________________________________
currentswater levelseddy coefficients surges
BSH:
Meteorological models (GME and LM)(forecasts up to 78 h)
of German Weather Service (DWD)
Operational Wave Models(forecasts up to 78 h)
of German Weather Service (DWD)
Operational Drift and Dispersion Models (BSHdmod)(Lagrange or Eulerian)
for conservative substances, oil and drifting objects
Regional Models
for river Elbe
Operational Surge Model(BSHsmod)
for North Sea
Operational Circulation Model (BSHcmod)
for North Sea and Baltic Sea
model data archive:currents, water levels,salinity, temperature,ice data, eddy coefficients

- 44 -
Fig. 2 Grid nets of the BSH's circulation model
The model is three-dimensional and takes into account meteorological conditions in the North Seaand Baltic Sea area, tides and external surges entering the North Sea from the Atlantic as well asriver runoff from the major rivers. The meteorological data are computed by the German WeatherService (DWD) using an atmospheric model and are transmitted daily to the BSH. To compute theheat fluxes between air and water, the BSH model uses air temperature, cloud cover and specifichumidity data above the sea. The tidal predictions at the model’s open boundaries are calculatedusing the harmonic constants of 14 tidal constituents. External surges entering the North Sea arecomputed by a model of the Northeast Atlantic. This two-dimensional model has a grid spacing ofabout 24 n.m. and is also forced by meteorological data provided by the DWD (Fig.2).
The circulation model simulates density driven (baroclinic) currents which depend on the prevailingtemperature and salinity distributions. Especially in the Baltic Sea, baroclinic currents play animportant role. As hydrodynamics is also influenced by ice conditions in the North Sea and Baltic,there is an ice model integrated to simulate formation, melting and drift of sea ice (Kleine andSklyar, 1995).
- 45 -
2.2 The Surge Model
The BSH's Surge Model (Jansen, 1996) was developed especially for the water level predictionand storm surge warning service. The model covers the North Sea with 6 n.m. grid spacing and istwo-dimensional. The model is run twice a day with tidal and wind forcing. An additional run iscarried out with pure tidal forcing. For the main German stations surge values are evaluated bysubtracting 'tide' from 'tide+surge' results. The main advantage of the surge model in comparisonto the complex three-dimensional circulation model is its short running time. In spite of the longerforecast interval (84 hours) new surge model predictions are available soon after meteorologicalpredictions have been transferred.
3. Validation
The operational model results are used by different BSH services. Models are validated on aregular basis but also within the framework of projects (Müller-Navarra and Ladwig, 1997, Kleinand Dick, 1999). This paper will focus on validation of the parameters water levels, temperatureand sea ice.
3.1 Water levels
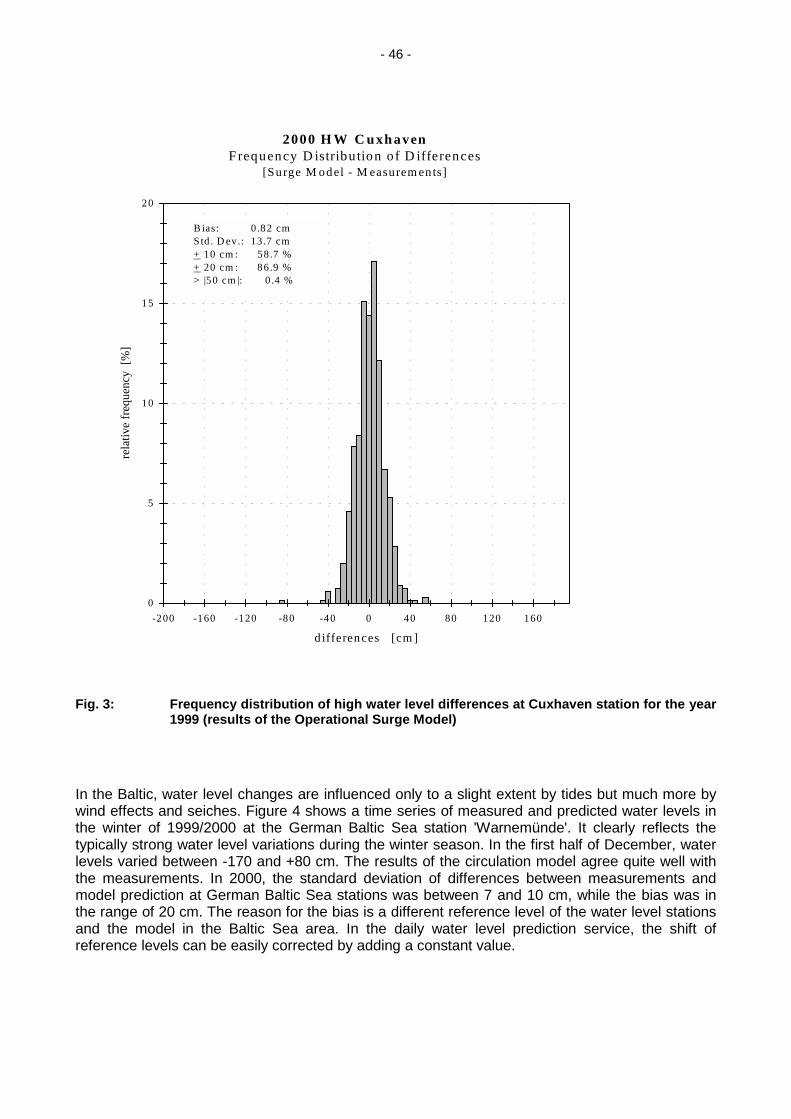
Model forecasts are important tools in the BSH’s water level prediction service and, therefore, theiraccuracy is checked daily by comparing measured and computed water levels. Furthermore,predicted high and low water levels for German Baltic and North Sea stations are evaluated yearlyon a routine basis. Figure 3 shows the frequency distribution of differences between measured andmodelled high water surges at the station Cuxhaven in 2000. Cuxhaven is located in the innerGerman Bight at the mouth at the river Elbe and is the basic station for German water level forecastsin the North Sea. Similar values for bias and standard deviation of differences have been computedfor other German North Sea stations.
- 46 -
Fig. 3: Frequency distribution of high water level differences at Cuxhaven station for the year1999 (results of the Operational Surge Model)
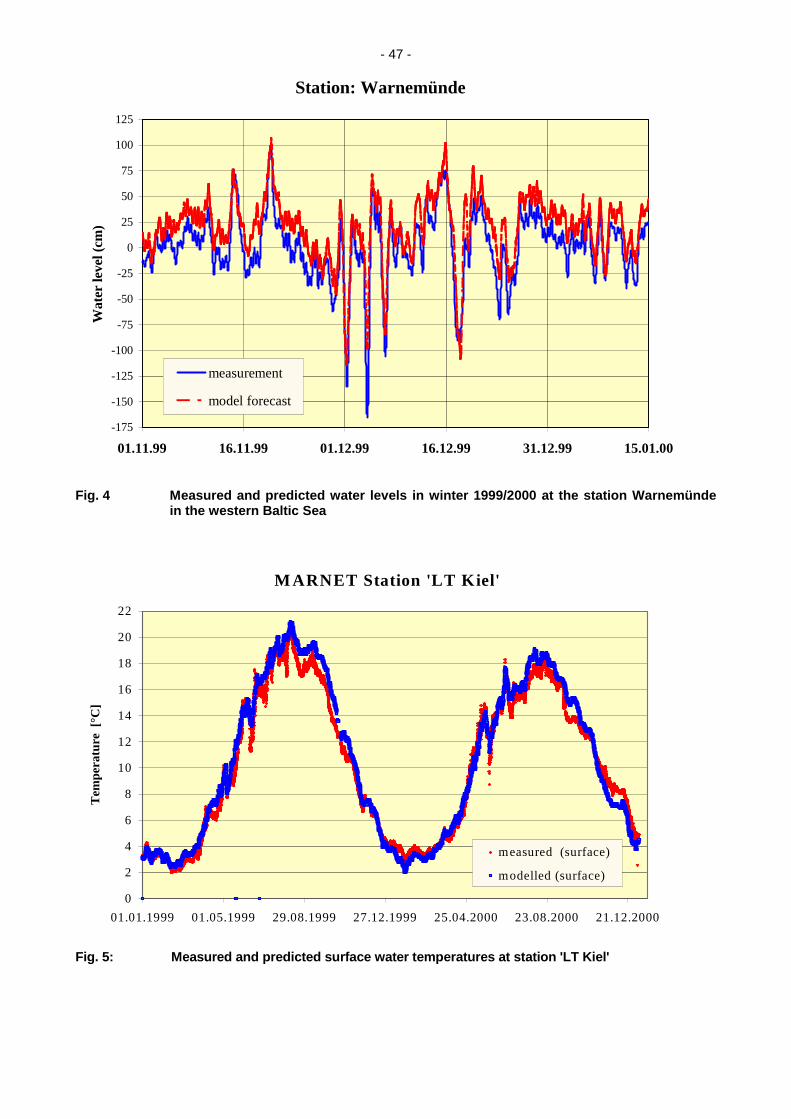
In the Baltic, water level changes are influenced only to a slight extent by tides but much more bywind effects and seiches. Figure 4 shows a time series of measured and predicted water levels inthe winter of 1999/2000 at the German Baltic Sea station 'Warnemünde'. It clearly reflects thetypically strong water level variations during the winter season. In the first half of December, waterlevels varied between -170 and +80 cm. The results of the circulation model agree quite well withthe measurements. In 2000, the standard deviation of differences between measurements andmodel prediction at German Baltic Sea stations was between 7 and 10 cm, while the bias was inthe range of 20 cm. The reason for the bias is a different reference level of the water level stationsand the model in the Baltic Sea area. In the daily water level prediction service, the shift ofreference levels can be easily corrected by adding a constant value.
2000 H W C u xh avenF requency D istribu tion of D ifferences
[Surge M odel - M easurem en ts]
0
5
10
15
20
-200 -160 -120 -80 -40 0 40 80 120 160
d ifferences [cm ]
rela
tive
freq
uenc
y [%
]
B ias: 0 .82 cmStd . D ev.: 13 .7 cm+ 10 cm : 58.7 %+ 20 cm : 86.9 %> |50 cm |: 0 .4 %
- 47 -
Fig. 4 Measured and predicted water levels in winter 1999/2000 at the station Warnemündein the western Baltic Sea
Fig. 5: Measured and predicted surface water temperatures at station 'LT Kiel'
Station: Warnemünde
-175
-150
-125
-100
-75
-50
-25
0
25
50
75
100
125
01.11.99 16.11.99 01.12.99 16.12.99 31.12.99 15.01.00
Wat
er le
vel (
cm)
measurement
model forecast
M ARNET Station 'LT Kiel'
0
2
4
6
8
10
12
14
16
18
20
22
01.01.1999 01.05.1999 29.08.1999 27.12.1999 25.04.2000 23.08.2000 21.12.2000
Tem
pera
ture
[°C
]
measured (surface)
modelled (surface)

- 48 -
3.2 Water temperature
Another possibility of validating the operational circulation model on a routine basis is provided by thedata of the German Operational Coastal Monitoring Network (MARNET) which is also operated bythe BSH (Knauth et al., 1996). It presently consists of 4 stations in the German Bight and 4 stationsin the western Baltic Sea. All automated stations carry sensors for different physical or chemicalparameters. Figure 5 shows a comparison of measured and predicted water temperatures at theBaltic Sea station 'LT Kiel'. The bias of predicted surface temperatures during a two year period(1999/2000) was -0.31°C with a standard deviation of differences of 0.79°C. Similar or even betteragreements between modelled and measured surface water temperatures were found at otherGerman stations.
3.3 Sea ice
Ice modelling is very closely linked to the simulation of water temperatures. The support of theBSHs ice service with model predictions is getting more important with increasing forecast length.Of special interest for the service is the temporal development of the computed ice distribution andthickness. Comparisons of ice charts with model results allow the model predictions to be checkedon a routine basis. Fig. 6 shows a comparison of measured (Strübing, pers. comm.) and computedice distribution and thickness in the Baltic Sea on 26.03.2001. In general, the ice extension anddistribution in nature and in the model are quite similar. Both model and ice chart show the thickestice (30 – 50 cm) in the northern Gulf of Bothnia and eastern Gulf of Finland while the location ofthe thickest ice differs in detail. As a rule, large-scale performance is acceptable while small scalefeatures are not yet sufficiently reproduced.
4. Special Applications
4.1 Storm Surge Warnings
Shelf sea coastal areas are very much exposed to danger by storm surges. In the past somesevere storm surges in the southern North Sea caused death of many people and substantialdamage.
Therefore, in many countries storm surge models have been developed for the prediction of suchevents. At the BSH, the circulation and storm surge models are important tools – among othermethods - of the storm surge warning service. As an example, the results for the most recent veryhigh storm surge will be presented.
In the evening of 3 December 1999, a north-westerly storm caused a very high storm surge in theGerman Bight, especially in Danish waters. At Cuxhaven, surge values of 3.3 metres weremeasured during high tide. Model forecasts like the predicted surge distribution for 3 Dec. 1999,17:00 h (Fig. 7), made it possible to issue proper warnings in time.
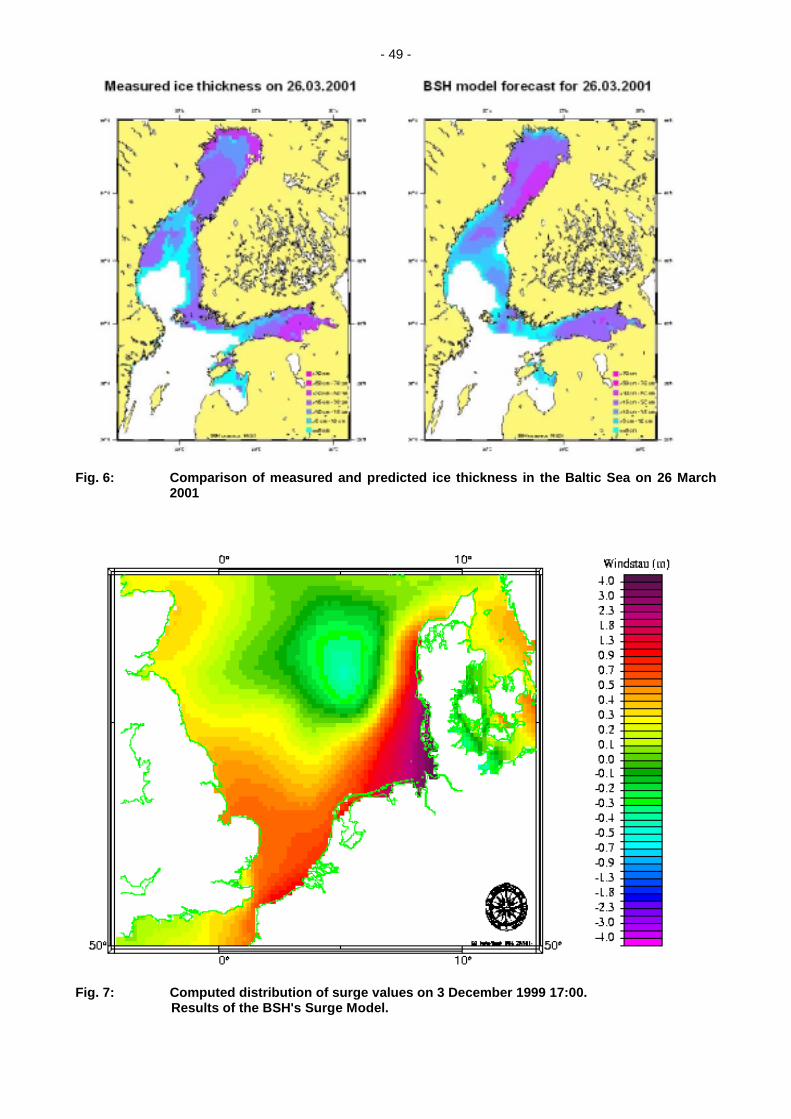
- 49 -
Fig. 6: Comparison of measured and predicted ice thickness in the Baltic Sea on 26 March2001
Fig. 7: Computed distribution of surge values on 3 December 1999 17:00.Results of the BSH's Surge Model.

- 50 -
4.2 Ship Guidance and Information Systems
Forecasts of water levels, waves, currents and ice are of special interest to maritime shipping. Inship traffic management, a wrong operational decision concerning, for example, port admittancewould involve high financial loss and safety risks. In this important application, there is a need forthe continuous provision of forecast data.
Another important application is ship routing where meteorological and oceanographic informationis needed to operate a vessel in a certain sea area. The information is transmitted directly to theship and supports the ship’s master in his decision-making. One example is the Baltic FerryInformation System (BAFIS), where ferries in the Baltic Sea are provided with forecasts of winds,waves, currents and sea ice on a regular basis. Fig. 9 shows, as an example, the representation ofcurrents in the system 'FERRY' which has been developed by the German Weather Service.
In future, it is planned to include time varying marine information also in electronic charts (ECDIS).In a tidal sea like the North Sea there is a special need for water level and current information notonly for commercial shipping but also for sports and leisure activities. On the internet pages of theBSH (www.bsh.de) detailed maps of surface currents are presented showing forecasts for selectedareas of the North Sea and Baltic.
Fig. 8 Example for representation of currents in the Baltic Ferry Information System (BAFIS,Cooperation of DWD and BSH)
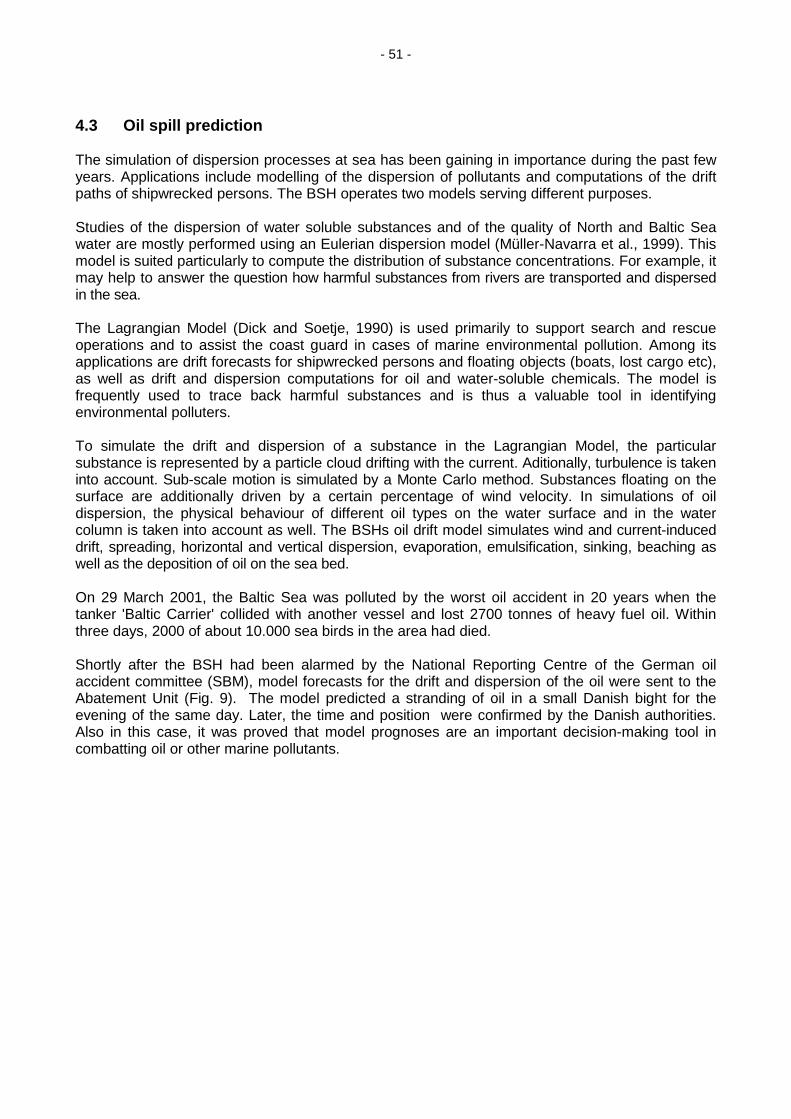
- 51 -
4.3 Oil spill prediction
The simulation of dispersion processes at sea has been gaining in importance during the past fewyears. Applications include modelling of the dispersion of pollutants and computations of the driftpaths of shipwrecked persons. The BSH operates two models serving different purposes.
Studies of the dispersion of water soluble substances and of the quality of North and Baltic Seawater are mostly performed using an Eulerian dispersion model (Müller-Navarra et al., 1999). Thismodel is suited particularly to compute the distribution of substance concentrations. For example, itmay help to answer the question how harmful substances from rivers are transported and dispersedin the sea.
The Lagrangian Model (Dick and Soetje, 1990) is used primarily to support search and rescueoperations and to assist the coast guard in cases of marine environmental pollution. Among itsapplications are drift forecasts for shipwrecked persons and floating objects (boats, lost cargo etc),as well as drift and dispersion computations for oil and water-soluble chemicals. The model isfrequently used to trace back harmful substances and is thus a valuable tool in identifyingenvironmental polluters.
To simulate the drift and dispersion of a substance in the Lagrangian Model, the particularsubstance is represented by a particle cloud drifting with the current. Aditionally, turbulence is takeninto account. Sub-scale motion is simulated by a Monte Carlo method. Substances floating on thesurface are additionally driven by a certain percentage of wind velocity. In simulations of oildispersion, the physical behaviour of different oil types on the water surface and in the watercolumn is taken into account as well. The BSHs oil drift model simulates wind and current-induceddrift, spreading, horizontal and vertical dispersion, evaporation, emulsification, sinking, beaching aswell as the deposition of oil on the sea bed.
On 29 March 2001, the Baltic Sea was polluted by the worst oil accident in 20 years when thetanker 'Baltic Carrier' collided with another vessel and lost 2700 tonnes of heavy fuel oil. Withinthree days, 2000 of about 10.000 sea birds in the area had died.
Shortly after the BSH had been alarmed by the National Reporting Centre of the German oilaccident committee (SBM), model forecasts for the drift and dispersion of the oil were sent to theAbatement Unit (Fig. 9). The model predicted a stranding of oil in a small Danish bight for theevening of the same day. Later, the time and position were confirmed by the Danish authorities.Also in this case, it was proved that model prognoses are an important decision-making tool incombatting oil or other marine pollutants.

- 52 -
Fig. 9 Predicted distributions of oil released after the accident of the 'Baltic Carrier' in thewestern Baltic Sea.
5. International cooperation
As all operational ocean models need meteorological, oceanographic and hydrological informationthere is a close link to JCOMM. JCOMM will play an important role in the development of a systemfor the distribution of marine information. The information is needed for forcing, assimilation andvalidation of the models. Close interactions also exist in the field of wave, storm surge or sea iceforecasting as JCOMM assists the members in their forecasting work.
Operational ocean forecasting systems are important elements of the Global Ocean ObservingSystem (GOOS). In the frame of the Coastal Component of GOOS (C-GOOS) co-operationbetween different ocean forecasting centres in the North Sea and Baltic Sea area has beenestablished. Examples are the HIROMB (High Resolution Operational Model for the Baltic Sea)project between Baltic Sea countries and the ESODAE project for the North West European Shelfarea.

- 53 -
5.1 HIROMB
The HIROMB project is an activity under the umbrella of BOOS (Baltic Operational OceanographicSystem). HIROMB's main objective is to develop a High Resolution Operational Model for theBaltic Sea, based on the latest scientific knowledge. Agencies in Sweden (SMHI), Germany (BSH),Poland (IMGW), Denmark (RDANH) and Finland (FEI) have signed an agreement of co-operationto foster international co-operation and jointly develop a model system for daily prediction of allhydro-dynamical parameters. In the Baltic, baroclinic features are of special importance, such asthermo-haline stratification, stagnation and sea ice.
For about a year now, a circulation model with 1 nautical mile grid spacing in the whole Baltic Seahas been run operationally at the Swedish Meteorological and Hydrological Institute (SMHI). Themodel code has grown out of BSH's circulation model but had to be customised for a massivelyparallel computing machine (T3E). Complementary elements of the model system were providedby other HIROMB partners. All HIROMB partners may use the model output for their own purposessuch as drift and dispersion modelling in local areas. HIROMB is a good example of howinternational co-operation can also stimulate scientific discussion. In the project model results andsource code are exchanged free of charge.
5.2 ESODAE
ESODAE-1 is a EU Concerted Action for planning an European Shelf seas Ocean DataAssimilation and forecast Experiment. The main phase of ESODAE will be linked to the GlobalOcean Data Assimilation Experiment (GODAE). Like GODAE, the plan for ESODAE concentrateson physical oceanography, in this case that of the North West European Shelf. It is aimed at theday to day analysis and prediction of water levels, temperature, salinity and currents. Surfacewaves are considered only to the extent that they have to be included for mixing processes orforcing.
The overall goals of ESODAE are to:
• carry out an experiment to provide a practical demonstration of the overall capabilities ofocean analysis and forecasting models for the NW European Shelf Seas
• implement the techniques for, and assess the usefulness of, data assimilation in shelfmodels
• exchange model products between the various participants and, with a range of users, tojointly assess performance and utility
• encourage the practical use of the output from such modelling systems by a range of usersto their benefit
As a result of co-operation in ESODAE phase 1, an exchange of water level predictions betweenNorth Sea Agencies running storm surge models has been established. The UK MeteorologicalOffice, MUMM (Belgium), DMI (Denmark), BSH (Germany), DNMI (Norway) and KNMI(Netherlands) are routinely exchanging sea level forecasts. A typical time series of HW/LW surgeforecasts together with measurements is presented in Fig. 10.

- 54 -
Fig. 10 Comparison of measured HW/LW skew surges at Cuxhaven with forecasts of differentsurge models in Norway (DNMI), Netherlands (KNMI), Belgium (MUMM), Denmark(DMI) and Germany (BSH)
6. Future development
Further international co-operation is a crucial requirement for future development. Prandle (2000)and Flather (2000) also state that improved communication and (international) collaboration is akey to future developments. Efforts will have to be made in several fields of model development. Incirculation models, for example, turbulence schemes will have to be improved in order to obtain abetter representation of fronts, eddies and stratification. Modelling of sea ice will also be a subjectof further research.
In the future, progress is to be expected in the field of coupling atmospheric, wave and circulationmodels. Also data assimilation will play a more important role in operational shelf modelling.However, for some parameters (like salinity) there is a need for more real-time measurements.Also drift and dispersion models have to be further elaborated. Research is necessary to includeadditional chemicals and to improve suspended matter and ecosystem models. At the moment,operational ecosystem modelling is still a future challenge.
Last but not least, another important future requirement will be to improve and further establishproducts and services to meet the needs of different environmental and maritime user groups. Inthis context, the Internet is a very useful instrument which will be growing in importance.
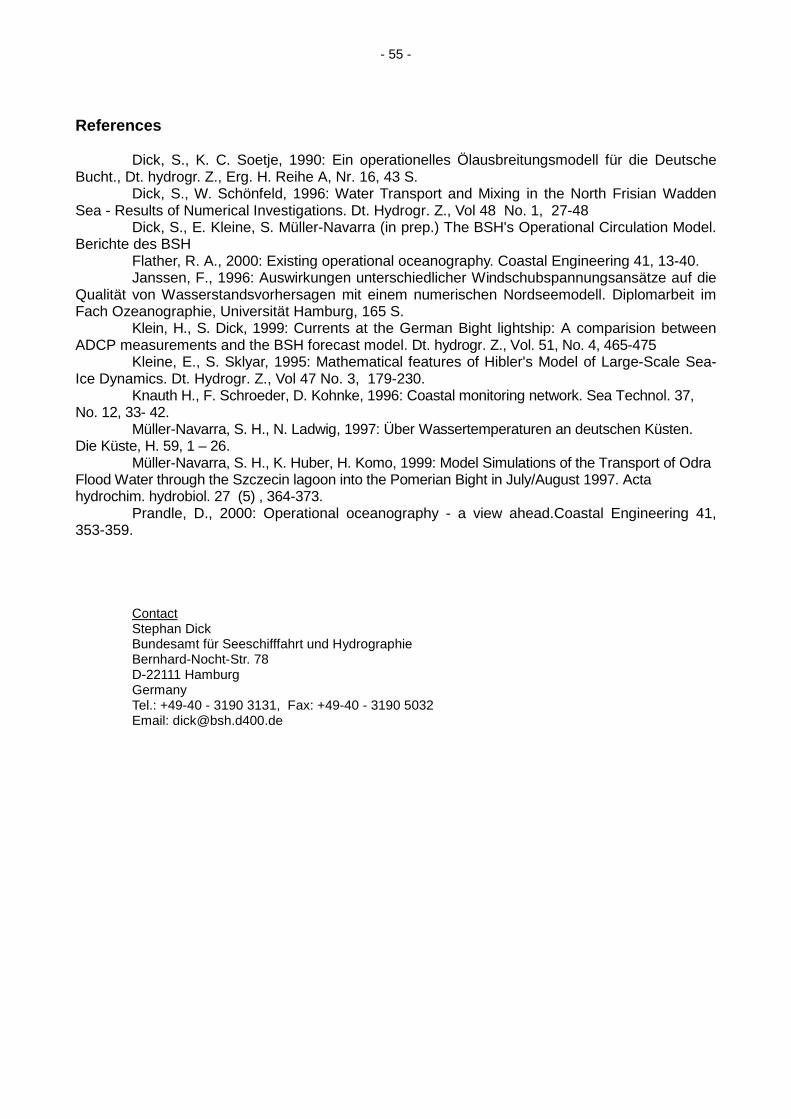
- 55 -
References
Dick, S., K. C. Soetje, 1990: Ein operationelles Ölausbreitungsmodell für die DeutscheBucht., Dt. hydrogr. Z., Erg. H. Reihe A, Nr. 16, 43 S.
Dick, S., W. Schönfeld, 1996: Water Transport and Mixing in the North Frisian WaddenSea - Results of Numerical Investigations. Dt. Hydrogr. Z., Vol 48 No. 1, 27-48
Dick, S., E. Kleine, S. Müller-Navarra (in prep.) The BSH's Operational Circulation Model.Berichte des BSH
Flather, R. A., 2000: Existing operational oceanography. Coastal Engineering 41, 13-40.Janssen, F., 1996: Auswirkungen unterschiedlicher Windschubspannungsansätze auf die
Qualität von Wasserstandsvorhersagen mit einem numerischen Nordseemodell. Diplomarbeit imFach Ozeanographie, Universität Hamburg, 165 S.
Klein, H., S. Dick, 1999: Currents at the German Bight lightship: A comparision betweenADCP measurements and the BSH forecast model. Dt. hydrogr. Z., Vol. 51, No. 4, 465-475
Kleine, E., S. Sklyar, 1995: Mathematical features of Hibler's Model of Large-Scale Sea-Ice Dynamics. Dt. Hydrogr. Z., Vol 47 No. 3, 179-230.
Knauth H., F. Schroeder, D. Kohnke, 1996: Coastal monitoring network. Sea Technol. 37,No. 12, 33- 42.
Müller-Navarra, S. H., N. Ladwig, 1997: Über Wassertemperaturen an deutschen Küsten.Die Küste, H. 59, 1 – 26.
Müller-Navarra, S. H., K. Huber, H. Komo, 1999: Model Simulations of the Transport of OdraFlood Water through the Szczecin lagoon into the Pomerian Bight in July/August 1997. Actahydrochim. hydrobiol. 27 (5) , 364-373.
Prandle, D., 2000: Operational oceanography - a view ahead.Coastal Engineering 41,353-359.
ContactStephan DickBundesamt für Seeschifffahrt und HydrographieBernhard-Nocht-Str. 78D-22111 HamburgGermanyTel.: +49-40 - 3190 3131, Fax: +49-40 - 3190 5032Email: [email protected]


![1350 ritter[1]](https://img.pdfslide.us/doc/110x75/558a55ded8b42a88468b458c/1350-ritter1.jpg)