Embed Size (px)
Citation preview
Astronomy & Astrophysics manuscript no. final c©ESO 2018January 18, 2018
The VLT/MUSE view of the central galaxy in Abell 2052
Ionized gas swept by the expanding radio source
Barbara Balmaverde1, 2, Alessandro Capetti2, Alessandro Marconi3, 4, and Giacomo Venturi3, 4
1 Scuola Normale Superiore, Piazza dei Cavalieri 7, I-56126 Pisa, Italy2 INAF - Osservatorio Astrofisico di Torino, Via Osservatorio 20, I-10025 Pino Torinese, Italy3 Dipartimento di Fisica e Astronomia, Università di Firenze, via G. Sansone 1, 50019 Sesto Fiorentino (Firenze), Italy4 INAF - Osservatorio Astrofisico di Arcetri, Largo Enrico Fermi 5, I-50125 Firenze, Italy
ABSTRACT
We report observations of the radio galaxy 3C317 (at z=0.0345) located at the center of the Abell cluster A2052, obtained with theVLT/MUSE integral field spectrograph. The Chandra images of this cluster show cavities in the X-ray emitting gas, which wereproduced by the expansion of the radio lobes inflated by the active galactic nucleus (AGN). Our exquisite MUSE data show withunprecedented detail the complex network of line emitting filaments enshrouding the northern X-ray cavity. We do not detect anyemission lines from the southern cavity, with a luminosity asymmetry between the two regions higher than ∼ 75. The emission linesproduced by the warm phase of the interstellar medium (WIM) enable us to obtain unique information on the properties of the emittinggas. We find dense gas (up to 270 cm−3) that makes up part of a global quasi spherical outflow that is driven by the radio source, andobtain a direct estimate of the expansion velocity of the cavities (265 km s−1). The emission lines diagnostic rules out ionization fromthe AGN or from star-forming regions, suggesting instead ionization from slow shocks or from cosmic rays. The striking asymmetricline emission observed between the two cavities contrasts with the less pronounced differences between the north and south sidesin the hot gas; this represents a significant new ingredient for our understanding of the process of the exchange of energy betweenthe relativistic plasma and the external medium. We conclude that the expanding radio lobes displace the hot tenuous phase of theinterstellar medium (ISM), but also impact the colder and denser ISM phases. These results show the effects of the AGN on its hostand the importance of radio mode feedback.
Key words. galaxies: active – galaxies: nuclei – galaxies: clusters: general – galaxies: clusters: individual (A2052) – galaxies: starformation –ISM: jets and outflows
1. Introduction
The exchange of matter and energy between active galactic nu-clei (AGN), their host galaxies, and clusters of galaxies–knownas the AGN feedback process–is a fundamental ingredient inthe formation and evolution of astrophysical structures. Galaxyformation models consider two modes of AGN feedback: thequasar mode, which operates during a luminous nuclear phaseand produces winds powered by radiation pressure, and the ra-dio mode, in which kinetic energy is released through relativis-tic jets (Fabian 2012). Powerful outflows have been extensivelyobserved at both low and high redshift (Swinbank et al. 2015;Carniani et al. 2016; Maiolino et al. 2012), but the observationalevidence that they have a relevant impact on the star formationof their host galaxies remains elusive.
So far, the clearest evidence of AGN feedback has beenfound in the local Universe, where X-ray images of galaxy clus-ters revealed cavities in the hot ionized medium (HIM) (106−107
K), often filled by the radio emitting plasma. The radio sourceshosted in the brightest cluster galaxies (BCGs) were able to dis-place the low-density gas forming the hot phase of the ISM whileexpanding (McNamara et al. 2000; Bîrzan et al. 2004, 2012).
The X-ray image of the galaxy cluster A2052 from the Chan-dra satellite provides one of the clearest examples of such cavi-ties: a pair of symmetric depressions in the X-ray surface bright-
Send offprint requests to: [email protected]
ness is closely correlated with the presence of radio emission(Blanton et al. 2001). In A2052 the estimate of the total energyrequired to inflate the cavity is a few 1057 erg (Bîrzan et al. 2004).Since gas speed cannot be measured from X-ray observations, itis assumed that the bubble moves outward at the sound speed(∼ 500 km s−1 for an external gas temperature of 107 K, Blantonet al. 2011) or, alternatively, that its motion is driven by buoy-ancy forces (Panagoulia et al. 2014), resulting in a cavity age of∼ 1 − 2 × 10⁷ years.
The presence of warm ionized medium (WIM) producingoptical emission lines in the central region of A2052 (Baum et al.1988; Heckman et al. 1989; McDonald et al. 2010) offers theunique possibility of studying the dynamics of the expandingcavity and the energy exchange between the active nucleus andthe surrounding medium, an essential ingredient for a better un-derstanding of the feedback process.
We observed the central brightest cluster galaxy, UGC 9799,in the optical band with the VLT/MUSE integral field spec-trograph. UGC 9799 is an elliptical galaxy (z=0.0345 where1” corresponds to 0.69 kpc) associated with the radio source3C 317. The mass of its central supermassive black hole, esti-mated from the central stellar velocity dispersion (σstar = 190km s−1, Smith et al. 2004), and the relation of σstar with MBH(Kormendy & Ho 2013) is MBH =108M�. Source 3C 317 showsan amorphous radio halo, elongated in the NS direction and ex-tended over ∼60 kpc (Morganti et al. 1993), with a radio lumi-
Article number, page 1 of 7
arX
iv:1
801.
0543
5v1
[as
tro-
ph.G
A]
16
Jan
2018
A&A proofs: manuscript no. final
nosity of P=1.3 1033erg s−1 Hz−1 at 178 MHz (Spinrad et al.1985); the radio core is coincident with the optical center ofthe galaxy. The optical nucleus has emission line ratios typicalof low-ionization nuclear emission line regions (LINERs, Heck-man 1980; Buttiglione et al. 2010).
2. Observation and data reduction
We pointed the telescope at A2052 and we took advantage ofthe large field of view (∼ 1′ × 1′) of the instrument to observeboth the northern and southern X-ray cavities. The observationswere obtained with the VLT/MUSE spectrograph on 13 April,13 May, and 28 May 2016 for about two hours split between fiveexposures of ∼25 minutes each, taken with different seeing con-ditions (between 0.6′′ to 2.0′′). Four datasets were affected bybad sky conditions, resulting in strong reddening and uncertain-ties in the flux calibration or poor seeing conditions. We thus de-cided to limit our analysis to the exposure with the highest spatialresolution (0.6′′) and best sky conditions, namely MUSE.2016-05-13T05:19:36.833. We used the ESO MUSE pipeline (version1.6.2) to obtain a fully reduced and calibrated data cube. No cor-rection for the small Galactic reddening, E(B-V)=0.03, is ap-plied.
To subtract the stellar continuum, we need to optimally binthe data to detect the stellar absorption features in the spectra,preserving the highest possible spatial resolution. Therefore, weperformed a Voronoi adaptive spatial binning of the cube data,requiring an average signal-to-noise ratio per wavelength chan-nel of at least 50 in the range 4500-7000 Å. We used the Penal-ized Pixel-Fitting code (pPXF, Cappellari & Copin 2003) to fitthe absorption stellar features with a linearly independent sub-set of stellar templates from Vazdekis et al. 2010 that combinetheoretical isochrones with the full MILES empirical stellar li-brary (Falcón-Barroso et al. 2011). We adopt a 10th order addi-tive polynomial correction for the continuum and included theemission lines in the fit instead of masking them. From thisanalysis we also estimated the recession velocity for UGC 9799of 10330±10 km s−1, in good agreement with previous opticalmeasurements (Katgert et al. 1998; Wegner et al. 1999; Smithet al. 2000).
We fit simultaneously all emission lines in the red portionof the spectrum (from 6000 to 7000 Å) with a single Gaussianprofile, one for each line. The line wavelength separation is fixedto the theoretical value, while the intensities are free to vary (ex-cept for the [N II] λλ6584,6548 ratio, which is fixed to 3). We re-peated the reduction procedure for the blue spectrum to measurethe Hβ and [O III]λλ4959,5007 lines. In a few regions, the emis-sion lines show two well-separated peaks and, in these cases, weincluded a second Gaussian component.
3. Results
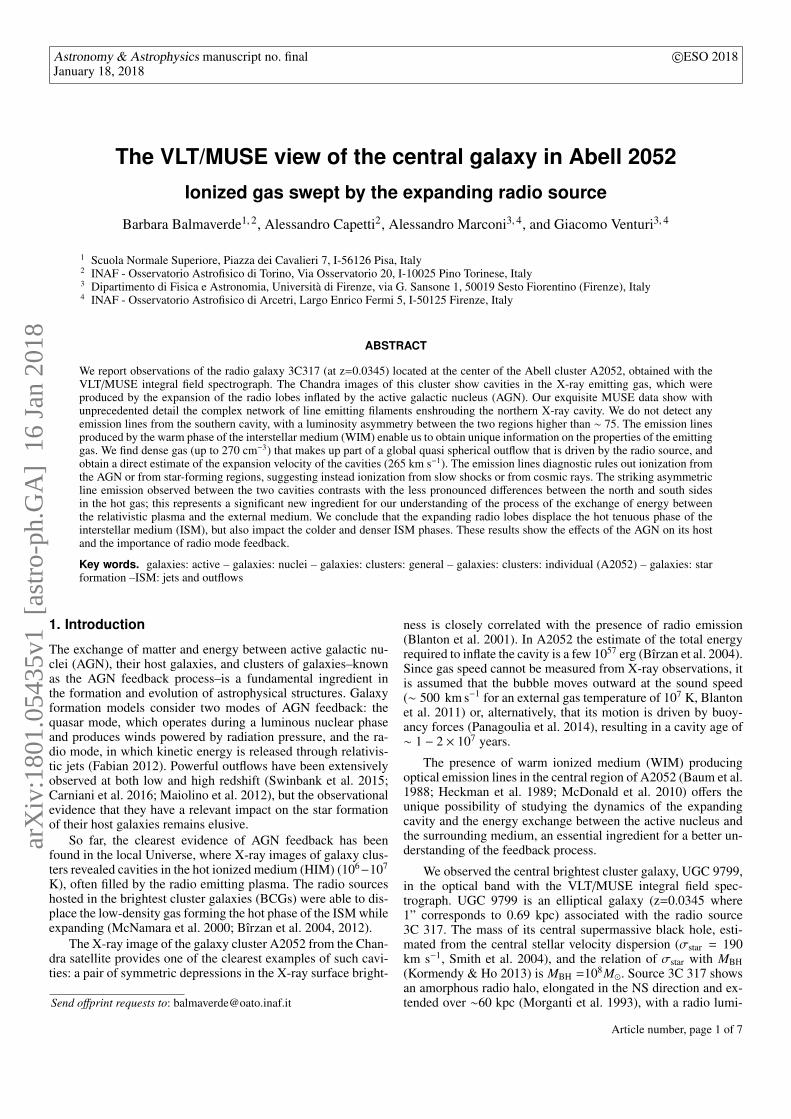
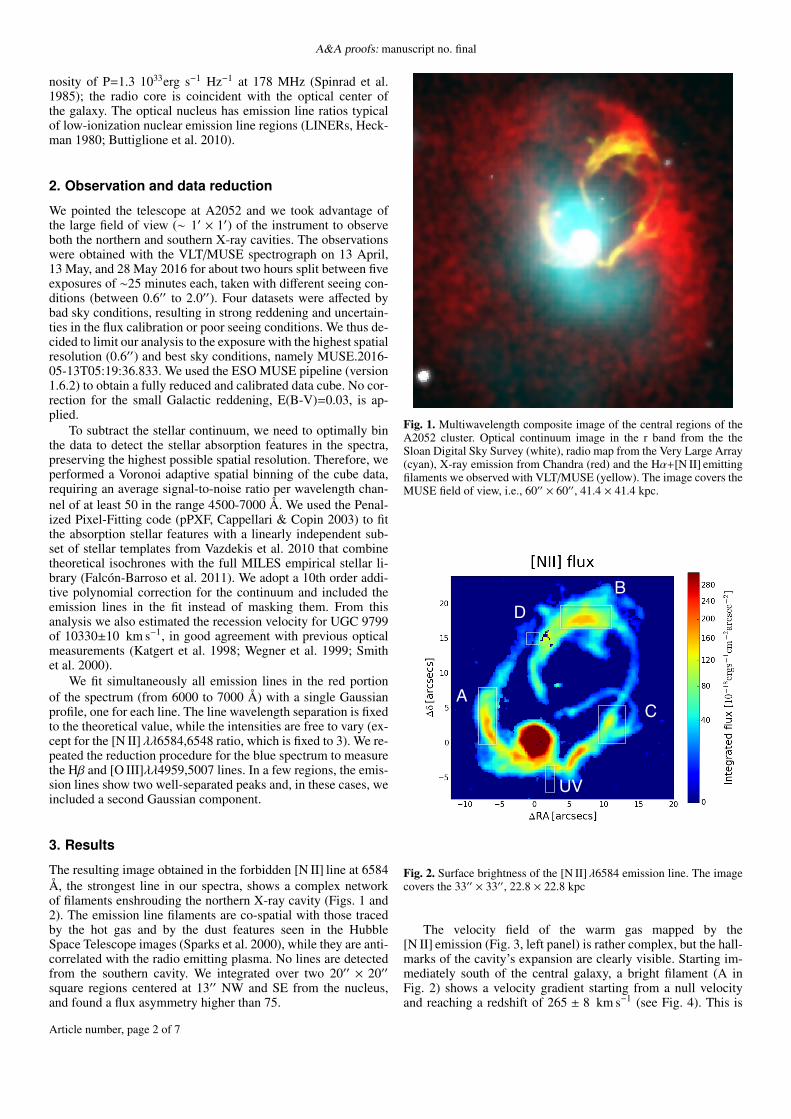
The resulting image obtained in the forbidden [N II] line at 6584Å, the strongest line in our spectra, shows a complex networkof filaments enshrouding the northern X-ray cavity (Figs. 1 and2). The emission line filaments are co-spatial with those tracedby the hot gas and by the dust features seen in the HubbleSpace Telescope images (Sparks et al. 2000), while they are anti-correlated with the radio emitting plasma. No lines are detectedfrom the southern cavity. We integrated over two 20′′ × 20′′square regions centered at 13′′ NW and SE from the nucleus,and found a flux asymmetry higher than 75.
Fig. 1. Multiwavelength composite image of the central regions of theA2052 cluster. Optical continuum image in the r band from the theSloan Digital Sky Survey (white), radio map from the Very Large Array(cyan), X-ray emission from Chandra (red) and the Hα+[N II] emittingfilaments we observed with VLT/MUSE (yellow). The image covers theMUSE field of view, i.e., 60′′ × 60′′, 41.4 × 41.4 kpc.
A
B
C
D
UV
Fig. 2. Surface brightness of the [N II] λ6584 emission line. The imagecovers the 33′′ × 33′′, 22.8 × 22.8 kpc
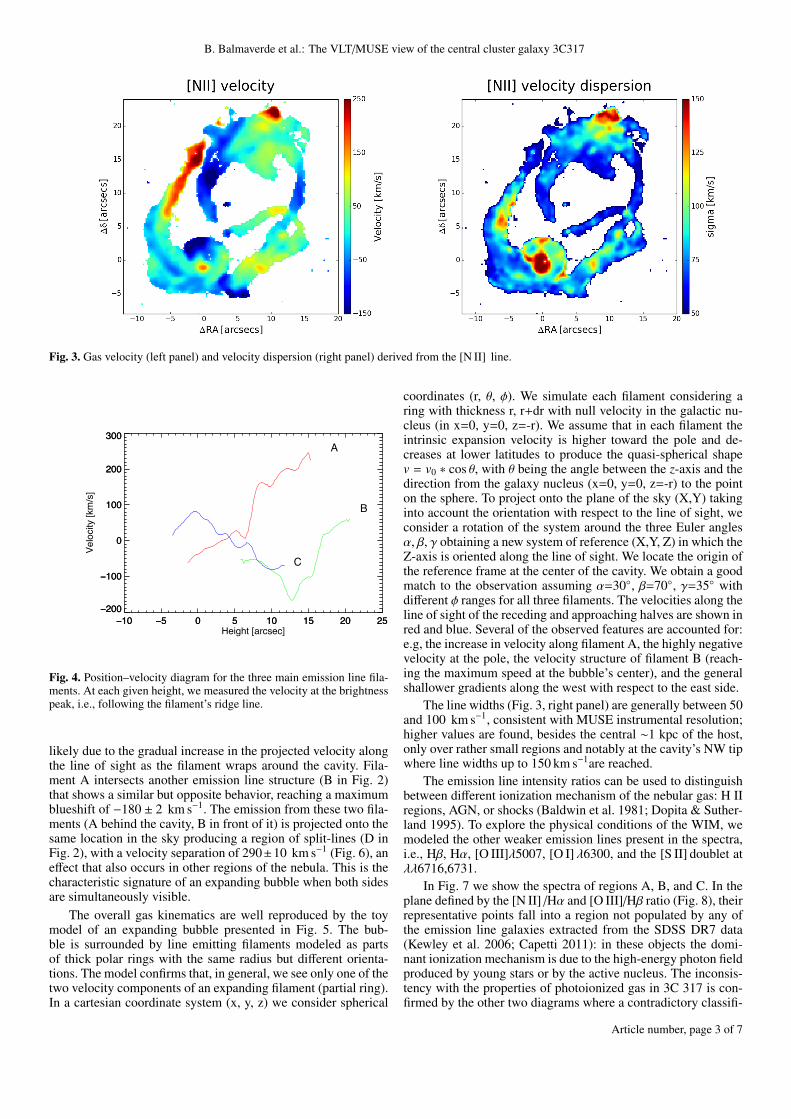
The velocity field of the warm gas mapped by the[N II] emission (Fig. 3, left panel) is rather complex, but the hall-marks of the cavity’s expansion are clearly visible. Starting im-mediately south of the central galaxy, a bright filament (A inFig. 2) shows a velocity gradient starting from a null velocityand reaching a redshift of 265 ± 8 km s−1 (see Fig. 4). This is
Article number, page 2 of 7
B. Balmaverde et al.: The VLT/MUSE view of the central cluster galaxy 3C317
Fig. 3. Gas velocity (left panel) and velocity dispersion (right panel) derived from the [N II] line.
−10 −5 0 5 10 15 20 25−200
−100
0
100
200
300
−10 −5 0 5 10 15 20 25Height [arcsec]
−200
−100
0
100
200
300
Velo
city
[km
/s]
A
B
C
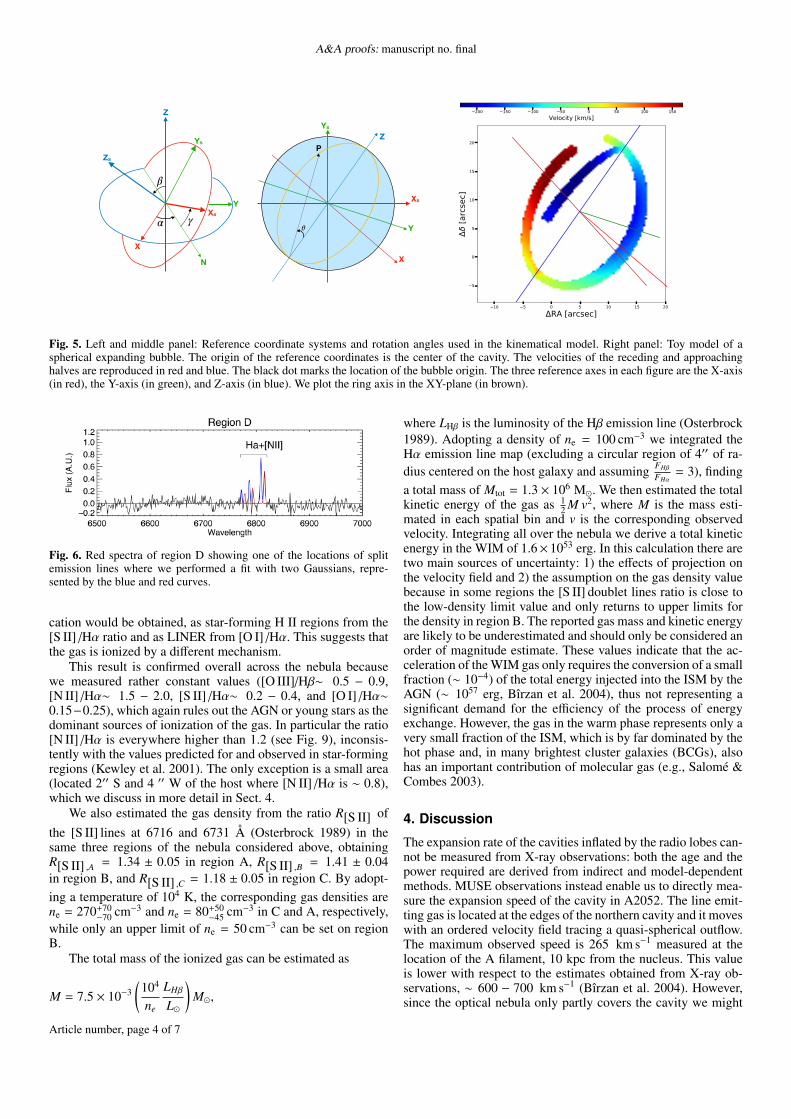
Fig. 4. Position–velocity diagram for the three main emission line fila-ments. At each given height, we measured the velocity at the brightnesspeak, i.e., following the filament’s ridge line.
likely due to the gradual increase in the projected velocity alongthe line of sight as the filament wraps around the cavity. Fila-ment A intersects another emission line structure (B in Fig. 2)that shows a similar but opposite behavior, reaching a maximumblueshift of −180 ± 2 km s−1. The emission from these two fila-ments (A behind the cavity, B in front of it) is projected onto thesame location in the sky producing a region of split-lines (D inFig. 2), with a velocity separation of 290±10 km s−1 (Fig. 6), aneffect that also occurs in other regions of the nebula. This is thecharacteristic signature of an expanding bubble when both sidesare simultaneously visible.
The overall gas kinematics are well reproduced by the toymodel of an expanding bubble presented in Fig. 5. The bub-ble is surrounded by line emitting filaments modeled as partsof thick polar rings with the same radius but different orienta-tions. The model confirms that, in general, we see only one of thetwo velocity components of an expanding filament (partial ring).In a cartesian coordinate system (x, y, z) we consider spherical
coordinates (r, θ, φ). We simulate each filament considering aring with thickness r, r+dr with null velocity in the galactic nu-cleus (in x=0, y=0, z=-r). We assume that in each filament theintrinsic expansion velocity is higher toward the pole and de-creases at lower latitudes to produce the quasi-spherical shapev = v0 ∗ cos θ, with θ being the angle between the z-axis and thedirection from the galaxy nucleus (x=0, y=0, z=-r) to the pointon the sphere. To project onto the plane of the sky (X,Y) takinginto account the orientation with respect to the line of sight, weconsider a rotation of the system around the three Euler anglesα, β, γ obtaining a new system of reference (X,Y, Z) in which theZ-axis is oriented along the line of sight. We locate the origin ofthe reference frame at the center of the cavity. We obtain a goodmatch to the observation assuming α=30◦, β=70◦, γ=35◦ withdifferent φ ranges for all three filaments. The velocities along theline of sight of the receding and approaching halves are shown inred and blue. Several of the observed features are accounted for:e.g, the increase in velocity along filament A, the highly negativevelocity at the pole, the velocity structure of filament B (reach-ing the maximum speed at the bubble’s center), and the generalshallower gradients along the west with respect to the east side.
The line widths (Fig. 3, right panel) are generally between 50and 100 km s−1, consistent with MUSE instrumental resolution;higher values are found, besides the central ∼1 kpc of the host,only over rather small regions and notably at the cavity’s NW tipwhere line widths up to 150 km s−1are reached.
The emission line intensity ratios can be used to distinguishbetween different ionization mechanism of the nebular gas: H IIregions, AGN, or shocks (Baldwin et al. 1981; Dopita & Suther-land 1995). To explore the physical conditions of the WIM, wemodeled the other weaker emission lines present in the spectra,i.e., Hβ, Hα, [O III]λ5007, [O I] λ6300, and the [S II] doublet atλλ6716,6731.
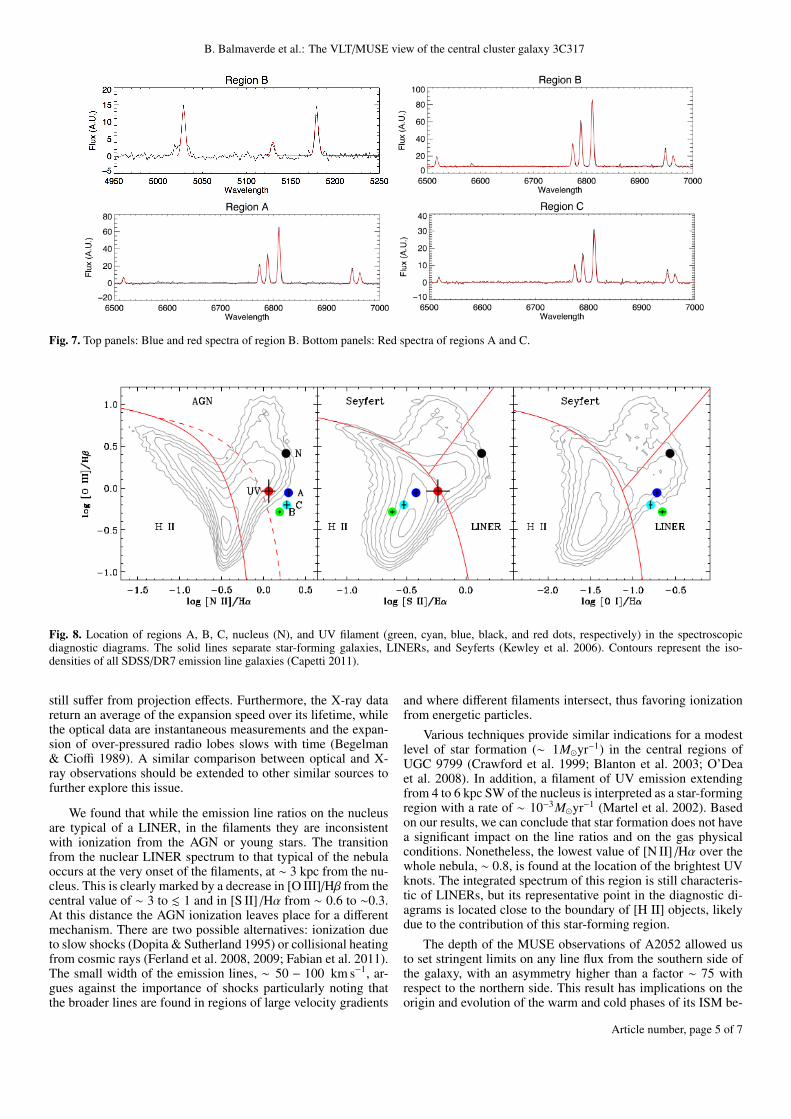
In Fig. 7 we show the spectra of regions A, B, and C. In theplane defined by the [N II] /Hα and [O III]/Hβ ratio (Fig. 8), theirrepresentative points fall into a region not populated by any ofthe emission line galaxies extracted from the SDSS DR7 data(Kewley et al. 2006; Capetti 2011): in these objects the domi-nant ionization mechanism is due to the high-energy photon fieldproduced by young stars or by the active nucleus. The inconsis-tency with the properties of photoionized gas in 3C 317 is con-firmed by the other two diagrams where a contradictory classifi-
Article number, page 3 of 7
A&A proofs: manuscript no. final
Z
X
Y
Xs
Ys
P
𝜃
Y
Z
Ys
X
Xs
Zs
N
𝛽
𝛼 𝛾
10 5 0 5 10 15 20RA [arcsec]
5
0
5
10
15
20
[arc
sec]
200 150 100 50 0 50 100 150Velocity [km/s]
Fig. 5. Left and middle panel: Reference coordinate systems and rotation angles used in the kinematical model. Right panel: Toy model of aspherical expanding bubble. The origin of the reference coordinates is the center of the cavity. The velocities of the receding and approachinghalves are reproduced in red and blue. The black dot marks the location of the bubble origin. The three reference axes in each figure are the X-axis(in red), the Y-axis (in green), and Z-axis (in blue). We plot the ring axis in the XY-plane (in brown).
Fig. 6. Red spectra of region D showing one of the locations of splitemission lines where we performed a fit with two Gaussians, repre-sented by the blue and red curves.
cation would be obtained, as star-forming H II regions from the[S II] /Hα ratio and as LINER from [O I] /Hα. This suggests thatthe gas is ionized by a different mechanism.
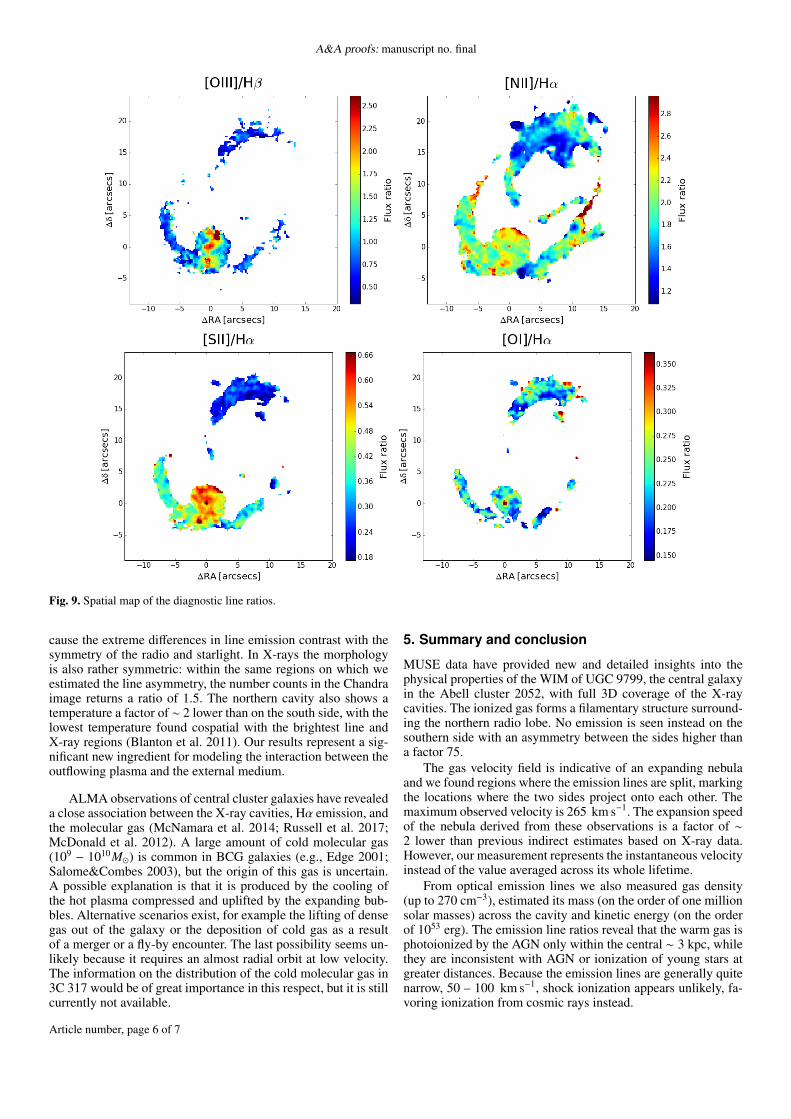
This result is confirmed overall across the nebula becausewe measured rather constant values ([O III]/Hβ∼ 0.5 − 0.9,[N II] /Hα∼ 1.5 − 2.0, [S II] /Hα∼ 0.2 − 0.4, and [O I] /Hα∼0.15−0.25), which again rules out the AGN or young stars as thedominant sources of ionization of the gas. In particular the ratio[N II] /Hα is everywhere higher than 1.2 (see Fig. 9), inconsis-tently with the values predicted for and observed in star-formingregions (Kewley et al. 2001). The only exception is a small area(located 2′′ S and 4 ′′ W of the host where [N II] /Hα is ∼ 0.8),which we discuss in more detail in Sect. 4.
We also estimated the gas density from the ratio R[S II] ofthe [S II] lines at 6716 and 6731 Å (Osterbrock 1989) in thesame three regions of the nebula considered above, obtainingR[S II] ,A = 1.34 ± 0.05 in region A, R[S II] ,B = 1.41 ± 0.04in region B, and R[S II] ,C = 1.18 ± 0.05 in region C. By adopt-ing a temperature of 104 K, the corresponding gas densities arene = 270+70
−70 cm−3 and ne = 80+50−45 cm−3 in C and A, respectively,
while only an upper limit of ne = 50 cm−3 can be set on regionB.
The total mass of the ionized gas can be estimated as
M = 7.5 × 10⁻³(
104
ne
LHβ
L�
)M�,
where LHβ is the luminosity of the Hβ emission line (Osterbrock1989). Adopting a density of ne = 100 cm−3 we integrated theHα emission line map (excluding a circular region of 4′′ of ra-dius centered on the host galaxy and assuming FHβ
FHα= 3), finding
a total mass of Mtot = 1.3 × 10⁶ M�. We then estimated the totalkinetic energy of the gas as 1
2 M v2, where M is the mass esti-mated in each spatial bin and v is the corresponding observedvelocity. Integrating all over the nebula we derive a total kineticenergy in the WIM of 1.6× 1053 erg. In this calculation there aretwo main sources of uncertainty: 1) the effects of projection onthe velocity field and 2) the assumption on the gas density valuebecause in some regions the [S II] doublet lines ratio is close tothe low-density limit value and only returns to upper limits forthe density in region B. The reported gas mass and kinetic energyare likely to be underestimated and should only be considered anorder of magnitude estimate. These values indicate that the ac-celeration of the WIM gas only requires the conversion of a smallfraction (∼ 10−4) of the total energy injected into the ISM by theAGN (∼ 1057 erg, Bîrzan et al. 2004), thus not representing asignificant demand for the efficiency of the process of energyexchange. However, the gas in the warm phase represents only avery small fraction of the ISM, which is by far dominated by thehot phase and, in many brightest cluster galaxies (BCGs), alsohas an important contribution of molecular gas (e.g., Salomé &Combes 2003).
4. Discussion
The expansion rate of the cavities inflated by the radio lobes can-not be measured from X-ray observations: both the age and thepower required are derived from indirect and model-dependentmethods. MUSE observations instead enable us to directly mea-sure the expansion speed of the cavity in A2052. The line emit-ting gas is located at the edges of the northern cavity and it moveswith an ordered velocity field tracing a quasi-spherical outflow.The maximum observed speed is 265 km s−1 measured at thelocation of the A filament, 10 kpc from the nucleus. This valueis lower with respect to the estimates obtained from X-ray ob-servations, ∼ 600 − 700 km s−1 (Bîrzan et al. 2004). However,since the optical nebula only partly covers the cavity we might
Article number, page 4 of 7
B. Balmaverde et al.: The VLT/MUSE view of the central cluster galaxy 3C317
Fig. 7. Top panels: Blue and red spectra of region B. Bottom panels: Red spectra of regions A and C.
Fig. 8. Location of regions A, B, C, nucleus (N), and UV filament (green, cyan, blue, black, and red dots, respectively) in the spectroscopicdiagnostic diagrams. The solid lines separate star-forming galaxies, LINERs, and Seyferts (Kewley et al. 2006). Contours represent the iso-densities of all SDSS/DR7 emission line galaxies (Capetti 2011).
still suffer from projection effects. Furthermore, the X-ray datareturn an average of the expansion speed over its lifetime, whilethe optical data are instantaneous measurements and the expan-sion of over-pressured radio lobes slows with time (Begelman& Cioffi 1989). A similar comparison between optical and X-ray observations should be extended to other similar sources tofurther explore this issue.
We found that while the emission line ratios on the nucleusare typical of a LINER, in the filaments they are inconsistentwith ionization from the AGN or young stars. The transitionfrom the nuclear LINER spectrum to that typical of the nebulaoccurs at the very onset of the filaments, at ∼ 3 kpc from the nu-cleus. This is clearly marked by a decrease in [O III]/Hβ from thecentral value of ∼ 3 to . 1 and in [S II] /Hα from ∼ 0.6 to ∼0.3.At this distance the AGN ionization leaves place for a differentmechanism. There are two possible alternatives: ionization dueto slow shocks (Dopita & Sutherland 1995) or collisional heatingfrom cosmic rays (Ferland et al. 2008, 2009; Fabian et al. 2011).The small width of the emission lines, ∼ 50 − 100 km s−1, ar-gues against the importance of shocks particularly noting thatthe broader lines are found in regions of large velocity gradients
and where different filaments intersect, thus favoring ionizationfrom energetic particles.
Various techniques provide similar indications for a modestlevel of star formation (∼ 1M�yr−1) in the central regions ofUGC 9799 (Crawford et al. 1999; Blanton et al. 2003; O’Deaet al. 2008). In addition, a filament of UV emission extendingfrom 4 to 6 kpc SW of the nucleus is interpreted as a star-formingregion with a rate of ∼ 10−3M�yr−1 (Martel et al. 2002). Basedon our results, we can conclude that star formation does not havea significant impact on the line ratios and on the gas physicalconditions. Nonetheless, the lowest value of [N II] /Hα over thewhole nebula, ∼ 0.8, is found at the location of the brightest UVknots. The integrated spectrum of this region is still characteris-tic of LINERs, but its representative point in the diagnostic di-agrams is located close to the boundary of [H II] objects, likelydue to the contribution of this star-forming region.
The depth of the MUSE observations of A2052 allowed usto set stringent limits on any line flux from the southern side ofthe galaxy, with an asymmetry higher than a factor ∼ 75 withrespect to the northern side. This result has implications on theorigin and evolution of the warm and cold phases of its ISM be-
Article number, page 5 of 7
A&A proofs: manuscript no. final
Fig. 9. Spatial map of the diagnostic line ratios.
cause the extreme differences in line emission contrast with thesymmetry of the radio and starlight. In X-rays the morphologyis also rather symmetric: within the same regions on which weestimated the line asymmetry, the number counts in the Chandraimage returns a ratio of 1.5. The northern cavity also shows atemperature a factor of ∼ 2 lower than on the south side, with thelowest temperature found cospatial with the brightest line andX-ray regions (Blanton et al. 2011). Our results represent a sig-nificant new ingredient for modeling the interaction between theoutflowing plasma and the external medium.
ALMA observations of central cluster galaxies have revealeda close association between the X-ray cavities, Hα emission, andthe molecular gas (McNamara et al. 2014; Russell et al. 2017;McDonald et al. 2012). A large amount of cold molecular gas(109 − 1010M�) is common in BCG galaxies (e.g., Edge 2001;Salome&Combes 2003), but the origin of this gas is uncertain.A possible explanation is that it is produced by the cooling ofthe hot plasma compressed and uplifted by the expanding bub-bles. Alternative scenarios exist, for example the lifting of densegas out of the galaxy or the deposition of cold gas as a resultof a merger or a fly-by encounter. The last possibility seems un-likely because it requires an almost radial orbit at low velocity.The information on the distribution of the cold molecular gas in3C 317 would be of great importance in this respect, but it is stillcurrently not available.
5. Summary and conclusion
MUSE data have provided new and detailed insights into thephysical properties of the WIM of UGC 9799, the central galaxyin the Abell cluster 2052, with full 3D coverage of the X-raycavities. The ionized gas forms a filamentary structure surround-ing the northern radio lobe. No emission is seen instead on thesouthern side with an asymmetry between the sides higher thana factor 75.
The gas velocity field is indicative of an expanding nebulaand we found regions where the emission lines are split, markingthe locations where the two sides project onto each other. Themaximum observed velocity is 265 km s−1. The expansion speedof the nebula derived from these observations is a factor of ∼2 lower than previous indirect estimates based on X-ray data.However, our measurement represents the instantaneous velocityinstead of the value averaged across its whole lifetime.
From optical emission lines we also measured gas density(up to 270 cm−3), estimated its mass (on the order of one millionsolar masses) across the cavity and kinetic energy (on the orderof 1053 erg). The emission line ratios reveal that the warm gas isphotoionized by the AGN only within the central ∼ 3 kpc, whilethey are inconsistent with AGN or ionization of young stars atgreater distances. Because the emission lines are generally quitenarrow, 50 – 100 km s−1, shock ionization appears unlikely, fa-voring ionization from cosmic rays instead.
Article number, page 6 of 7
B. Balmaverde et al.: The VLT/MUSE view of the central cluster galaxy 3C317
The kinematics of the WIM described above clearly indi-cates that the radio source has a profound impact on the externalmedium, confirming that radio mode feedback is operating inA2052. However, the WIM is just the tip of the iceberg of thevarious ISM phases. The X-ray data indicate that ∼ 1010M� ofthe tenuous hot gas have been displaced. Furthermore, it is likelythat UGC 9799 harbors a large amount of cold and molecular gas(108−109M�), as commonly observed in the galaxies at the cen-ter of cluster. The interplay between all phases of the ISM andthe relativistic radio plasma is a very complex phenomenon. TheMUSE data provide us with detailed information on the ionizedgas. When coupled with those that can be derived in the other ob-serving bands these observations can be used to proceed towarda comprehensive description of the energy exchange between theAGN and the surrounding gas, tackling the issues of the origin,acceleration, and ultimate fate of the cold and warm gas clouds.Acknowledgements. We thank the referee for his/her constructive report. Basedon observations made with ESO Telescopes at the La Silla Paranal Observatoryunder program ID 097.B-0766(A). This research has made use of data obtainedfrom the Chandra Data Archive. The National Radio Astronomy Observatory isa facility of the National Science Foundation operated under cooperative agree-ment by Associated Universities, Inc. Funding for SDSS has been provided bythe Alfred P. Sloan Foundation, the Participating Institutions, the National Sci-ence Foundation, and the U.S. Department of Energy Office of Science. B.B.acknowledge financial contribution from the agreement ASI-INAF I/037/12/0.
ReferencesBaldwin, J. A., Phillips, M. M., & Terlevich, R. 1981, PASP, 93, 5Baum, S. A., Heckman, T. M., Bridle, A., van Breugel, W. J. M., & Miley, G. K.
1988, ApJS, 68, 643Begelman, M. C. & Cioffi, D. F. 1989, ApJ, 345, L21Bîrzan, L., Rafferty, D. A., McNamara, B. R., Wise, M. W., & Nulsen, P. E. J.
2004, ApJ, 607, 800Bîrzan, L., Rafferty, D. A., Nulsen, P. E. J., et al. 2012, MNRAS, 427, 3468Blanton, E. L., Randall, S. W., Clarke, T. E., et al. 2011, ApJ, 737, 99Blanton, E. L., Sarazin, C. L., & McNamara, B. R. 2003, ApJ, 585, 227Blanton, E. L., Sarazin, C. L., McNamara, B. R., & Wise, M. W. 2001, ApJ, 558,
L15Buttiglione, S., Capetti, A., Celotti, A., et al. 2010, A&A, 509, A6Capetti, A. 2011, A&A, 535, A28Cappellari, M. & Copin, Y. 2003, MNRAS, 342, 345Carniani, S., Marconi, A., Maiolino, R., et al. 2016, A&A, 591, A28Crawford, C. S., Allen, S. W., Ebeling, H., Edge, A. C., & Fabian, A. C. 1999,
MNRAS, 306, 857Dopita, M. A. & Sutherland, R. S. 1995, ApJ, 455, 468Fabian, A. C. 2012, ARA&A, 50, 455Fabian, A. C., Sanders, J. S., Williams, R. J. R., et al. 2011, MNRAS, 417, 172Falcón-Barroso, J., Sánchez-Blázquez, P., Vazdekis, A., et al. 2011, A&A, 532,
A95Ferland, G. J., Fabian, A. C., Hatch, N. A., et al. 2008, MNRAS, 386, L72Ferland, G. J., Fabian, A. C., Hatch, N. A., et al. 2009, MNRAS, 392, 1475Heckman, T. M. 1980, A&A, 87, 152Heckman, T. M., Baum, S. A., van Breugel, W. J. M., & McCarthy, P. 1989, ApJ,
338, 48Katgert, P., Mazure, A., den Hartog, R., et al. 1998, A&AS, 129, 399Kewley, L. J., Dopita, M. A., Sutherland, R. S., Heisler, C. A., & Trevena, J.
2001, ApJ, 556, 121Kewley, L. J., Groves, B., Kauffmann, G., & Heckman, T. 2006, MNRAS, 372,
961Kormendy, J. & Ho, L. C. 2013, ARA&A, 51, 511Maiolino, R., Gallerani, S., Neri, R., et al. 2012, MNRAS, 425, L66Martel, A. R., Sparks, W. B., Allen, M. G., Koekemoer, A. M., & Baum, S. A.
2002, AJ, 123, 1357McDonald, M., Veilleux, S., & Rupke, D. S. N. 2012, ApJ, 746, 153McDonald, M., Veilleux, S., Rupke, D. S. N., & Mushotzky, R. 2010, ApJ, 721,
1262McNamara, B. R., Russell, H. R., Nulsen, P. E. J., et al. 2014, ApJ, 785, 44McNamara, B. R., Wise, M., Nulsen, P. E. J., et al. 2000, ApJ, 534, L135Morganti, R., Killeen, N. E. B., & Tadhunter, C. N. 1993, MNRAS, 263, 1023O’Dea, C. P., Baum, S. A., Privon, G., et al. 2008, ApJ, 681, 1035Osterbrock, D. E. 1989, Astrophysics of gaseous nebulae and active galactic nu-
clei
Panagoulia, E. K., Fabian, A. C., Sanders, J. S., & Hlavacek-Larrondo, J. 2014,MNRAS, 444, 1236
Russell, H. R., McDonald, M., McNamara, B. R., et al. 2017, ApJ, 836, 130Salomé, P. & Combes, F. 2003, A&A, 412, 657Smith, R. J., Hudson, M. J., Nelan, J. E., et al. 2004, AJ, 128, 1558Smith, R. J., Lucey, J. R., Hudson, M. J., Schlegel, D. J., & Davies, R. L. 2000,
MNRAS, 313, 469Sparks, W. B., Baum, S. A., Biretta, J., Macchetto, F. D., & Martel, A. R. 2000,
ApJ, 542, 667Spinrad, H., Marr, J., Aguilar, L., & Djorgovski, S. 1985, PASP, 97, 932Swinbank, A. M., Vernet, J. D. R., Smail, I., et al. 2015, MNRAS, 449, 1298Vazdekis, A., Sánchez-Blázquez, P., Falcón-Barroso, J., et al. 2010, MNRAS,
404, 1639Wegner, G., Colless, M., Saglia, R. P., et al. 1999, MNRAS, 305, 259
Article number, page 7 of 7