Embed Size (px)
Citation preview

TheVentureCapitalandPrivateEquity
CountryAttractivenessIndex
2016Annual
AlexanderGroh,HeinrichLiechtenstein,KarstenLieserandMarkusBiesinger

1
ForewordfromtheResearchTeamWe are pleased to present the seventh edition of our Venture Capital and Private Equity CountryAttractivenessIndex.Theindexmeasurestheattractivenessofcountriesforinvestorsintheventurecapital(VC) andprivate equity (PE) asset classes. It provides themost up-to-date aggregated informationon thequality of the investment environment and an assessment of the ease of transaction-making in 125countries.
Althoughweareawarethatthestageofdevelopmentinmanyofthecoveredemergingmarketsisnotyetsufficiently mature to support VC or PE transactions, we expect improvements in the future. We havetherefore started tracking these emerging economies and our index illustrates the progress of theirinvestmentconditions.
Aswedidinrecentyears,weprovethatourindexcorrespondswiththeactualVCandPEinvestmentactivityin our sample of countries. This demonstrates the quality of our composite measure and its value toinvestors.Thehighexplanatorypowerofour index for therealVCandPEactivity results fromexclusivelyfocusing on those factors which really shape the attractiveness of particular VC and PE markets, andweightingthemreasonably.
In futureeditions,selecteddataseriesmaybesubstitutedbynewerormoreappropriateones.Additionaldata could be added, while other series with poor explanatory power can be deleted. As a result ourcompositemeasureremainsadynamicresearchproductthatalwaystakes intoaccountthemostrelevantandrecentdata.Webelievethis indexisuniqueinprovidingsuchabroadscopeof informationontheVCandPEcapitalmarketsegment.Wehopethat investorsappreciate the informationgeneratedtoaid theirdecision-making; while politicians may utilise the index to benchmark their countries and to makeimprovementstoattractinternationalriskcapital.
We are very grateful for the support by our Research Assistants Arnau Gil andMaximilian Rieder. Theyprovidedsubstantialefforttoupdatethedataandtocompilethenewindex.
TheResearchTeam

2
WebsitePleasevisitourwebsitehttp://blog.iese.edu/vcpeindex/whereyoucandownloadthepdfofthisannual,andfind additional information, links to literature,multimedia presentations, and analytical tools for countrybenchmarkingpurposes.

3
ContentsAbouttheEditors...................................................................................................................................4ResearchTeam.......................................................................................................................................6HowtoMeasureaCountry’sAttractivenessforInvestorsinVCandPEAssets........................................7Buildingthe2016Index........................................................................................................................13The2016VC/PECountryAttractivenessRanking..................................................................................23TheRegionalVCandPEAttractivenessLandscape................................................................................25Historiccomparisonandallocationrecommendations..........................................................................26TheBRICS,Turkey,Mexico,Indonesia,thePhilippines,andNigeria......................................................28TrackingPowerofourIndex.................................................................................................................31OurIndexandHistoricVCandPEReturns.............................................................................................33SummaryandOutlook..........................................................................................................................35Appendix1:ComputationoftheIndex.................................................................................................36Appendix2:StatisticalValidationoftheIndex......................................................................................39References............................................................................................................................................40

4
AbouttheEditorsProf.Dr.AlexanderGroh AlexanderGroh isProfessorofFinanceandDirectorof theEntrepreneurial
Finance Research Centre at EMLYON Business School, France. He has heldvisiting positions at TheUniversity ofNew SouthWales, Sydney, Australia,IESEBusinessSchool,Barcelona,Spain,and INSEAD,Fontainebleau,France.HisresearchfocusesonVCandPE,andincludesperformancemeasurementandsocio-economicdeterminantsforthedevelopmentofvibrantVCandPEmarkets. His papers have been published in the Journal of Banking andFinance, the Journal of Corporate Finance, the Journal of InternationalMoney and Finance, the European Financial Management Journal, theJournal of Alternative Investments, the Journal of Real Estate Finance andEconomics, the Emerging Markets Review, and in Venture Capital, amongothers.Hewas involved inmanagement training courses for the EuropeanVentureCapital andPrivate EquityAssociation (EVCA), andhasworked forQuadrigaCapital,aFrankfurtbasedPrivateEquityfund,since1996.
Dr.AlexanderGrohwasborninFrankfurt,Germany.HereceivedajointMaster’sDegree of Mechanical Engineering and Business Administration fromDarmstadt University of Technology, where he also gained his DoctoralDegreeinFinance.
Prof.Dr.HeinrichLiechtenstein HeinrichLiechtensteinisProfessorofFinancialManagementatIESEBusinessSchool, Barcelona – University of Navarra, Spain. His areas of interest areentrepreneurial finance, Venture Capital and Private Equity, wealthmanagement and families’ strategies. He is active in the supervisory andadvisory boards of several family holdings and foundations, as well as aprivateequityfirm.
Dr. Liechtenstein has experience in wealth management and owners’strategiesatLGTandasaconsultantatTheBostonConsultingGroup.Hehaspreviouslyfoundedandsoldtwocompanies.
Dr. Liechtenstein received an MA in Business Administration from theUniversityofGraz,anMBAfromIESEBusinessSchool,andaDoctoralDegreeofBusinessandEconomicSciencesfromtheUniversityofVienna.

5
Dr.KarstenLieser KarstenLieser is InvestmentDirector inthepan-EuropeantransactionteamofAllianzRealEstate,theglobalrealestateinvestmentarmofAllianzGroup.Prior to this position he was a doctoral research fellow at IESE BusinessSchool’sResearchCenterofFinance.Hisresearchinterestsfocussedonthedeterminantsofinternationalprivateequityandrealestateinvestmentsandthe development of global asset allocation strategies for institutionalinvestors.AlongsidehisPhDstudies,Dr. Lieserconductedstrategyprojectswith the Boston Consulting Group, Ernst & Young, and other investmentadvisoryfirms.HepresentedhisresearchatmajorinternationalconferencesandpublishedintheJournalofCorporateFinance,theJournalofRealEstateFinance and Economics, and the Journal of Real Estate PortfolioManagement. Prior, he worked at international private equity and realestateinvestmentfirms.
Dr. Lieser received a joint Master’s Degree in Engineering and BusinessAdministration from Darmstadt University of Technology, where he alsogained his Doctoral Degree in Finance. He is fluent in German, English,FrenchandSpanish.
MarkusBiesinger Markus Biesinger is Associate Banker in the EquityGroup of the EuropeanBankforReconstructionandDevelopment(EBRD),thesinglelargestinvestorin Central and Eastern Europe, CentralAsia andNorthAfrica.At EBRD,MrBiesingerworkswithlargeinstitutional investorsandhelpsraisingaprivateequity fund. Prior to this position, he was research fellow at IESE. MrBiesinger gained further professional experience at BHF-Bank, where hehelpedstructuringandexecutingtheIPOofaGermanmid-sizecompany.
Mr Biesinger holds a jointMaster’s Degree in Business Administration andComputer Science from Darmstadt University of Technology, where he isalsopursuinghisDoctoralDegreeinFinance.Hisresearchfocusesondirectinvestments,co-investmentsandfundinvestmentsinfrontierandemergingmarkets.
6
ResearchTeam
AlexanderGrohProfessor,EMLYONBusinessSchool,[email protected],IESEBusinessSchoolBarcelona,[email protected],IESEBusinessSchoolBarcelona,[email protected],IESEBusinessSchoolBarcelona,[email protected],IESEBusinessSchoolBarcelonaMaximilianRiederResearchAssistant,IESEBusinessSchoolBarcelona

7
How toMeasure a Country’sAttractiveness for Investors inVCandPEAssetsWithoutbeing familiarwiththesocio-economicenvironment invarioushostcountries,an investorcannotmakerationalinternationalVCandPEallocationdecisions.Investorsovercomepotentialknowledgedeficitsandgatherdatatoanalysethedeterminantstheydeemimportantbeforeallocatingtoaparticularcountry.However, this country due diligence is time-consuming and costly. Additionally, the pace of economicdevelopmentofmanyemergingcountriesmakestheselectionofthosethatmeanwhilesupportVCandPEactivitymoreandmorecumbersome.Ourindexguidesinstitutionalinvestorstosolvetheproblemofwhereto allocate their capital.We aggregate and provide the requisite information for international VC and PEallocationdecisions.Ofcourse,thisinformationcannotactasasubstituteforinvestors’owneffortstobuildupcountryknowledgeandexperience.Itcanonlyfacilitatethisprocessandsupporttheinitialduediligencestage.
We propose a composite measure that benchmarks the attractiveness of 125 countries to receiveinstitutional VC and PE allocations. Our intention is to serve the investment community, preparing andanalysingalargequantityofsocio-economicdata.However,itisnotonlythefinancialcommunitythatcanbenefit from our research, politicians may also conclude that vibrant risk capital markets increaseinnovation,entrepreneurialactivity,economicgrowth,employment,competitivenessandwealthandhencetheymaybeinterestedinincreasingthesupplyofriskcapitalintheircountries.
Thereisamajorshiftoffocusfrom“traditional”andmatureVCandPEmarketstowardsemergingregions.Emerging countries attract investors by high economic growth opportunities. Nevertheless, as wesubsequentlydiscuss,growthopportunitiesarenottheonlyfactorthatrenderscountriesattractiveforVCandPEinvestments,anditisthesebroaderconditionsthatmotivateourindex.TheexistenceofaprosperingVC and PE market infrastructure and investment environment requires many socio-economic andinstitutionalprerequisites.Wepresume that several emerging countries arenotyet sufficientlymature intermsoftheirsocio-economicdevelopmenttosupporttheVCandPEbusinessmodel.Tooearlyentranceinthosecountriesdoesnotappeartobeabeneficialstrategy.However,ourindextracksthecountries’socio-economicandinstitutionaldevelopmentandrevealsimprovements.Thisallowsinvestorstobetterobserveforeignmarketsandtorecognisegoodtimingforallocations.
WhatareInstitutionalInvestors’InternationalVCandPEAllocationCriteria?
Our index addresses the first level of investors’ concerns from a top-down perspective and evaluatescountrieswithrespecttosocio-economiccriteriaforinternationalVCandPEallocation.Thesecriteriaassess,in the first instance, thedeterminationof local demand forVCandPEand second, theexpectationof anefficient deal-making environmentwhich allowsmatchingwith the supplied capital. Further levels of theallocation process include the selection of particular fund management teams. Thereby, the investorsevaluate the general partners’ competencies, their track records and other parameters in their fund due

8
diligencebeforecommittingtoageneralpartner.1However,thesecriteriacannotbeconsideredinourindexbecausetheydependonindividualcases,personaljudgmentandmostlyundiscloseddata.
Institutional investors communicated to us that levels of valuation are also important for their decisions.Unfortunately,wecannotcomparevaluationlevelsacrosscountriesfortwomajorreasons.First,thereistoolittleinformationprovidedontransactionmultiples.Second,multiplesreflecttherelationshipbetweentheexpectedgrowthincertainindustries(andcountries)andtheopportunitycostofcapital.Itisimpossibletoestimate theseparametersand to finda commonbenchmark forallofour sample countries. Instead,weneed to take a practical approach and assess the expected deal opportunities arising from the socio-economic environment in a countrywithout addressing valuation levels. Investorswill need to enrichourassessmentwiththeirownknowledgeandexpectationsaboutdealvalues.
Our index summarises factors that shapenationalVCandPEmarkets intoonesingle compositemeasure.Thedeterminantsof vibrantVCandPEmarketshavebeenextensively studied inacademic literature.Wereviewed this literature and collect data for our index spanning several years to verify these studies andactuallycontributetoabetterunderstandingofthedriversof internationalVCandPEactivity.Witheverysubsequentindexedition,webecomemoreconfidentinourabilitytoassesstherightcriteriaforVCandPEinvestors. These criteria are derived from the research on the topic thatwe group into six sub-headings.Thesesub-headingsillustratethestructureofourindexaseachpresentsoneofsix“keydrivers”ofcountryattractivenessforinvestorsinVCandPEassets:
1. EconomicActivity,
2. DepthofCapitalMarket,
3. Taxation,
4. InvestorProtection&CorporateGovernance,
5. Human&SocialEnvironment,and
6. EntrepreneurialCulture&DealOpportunities.
Thesekeydriversdefineasubsetofcriteriaweneedtoassessforoursamplecountriesinordertoaggregateourindex.2
ImportanceofEconomicActivity
Evidently, the state of a country’s economy affects its VC/PE attractiveness. An economy’s size andemployment levels are proxies for prosperity, the number and diversity of corporations and generalentrepreneurialactivity,andthereforealsoforexpectedVCandPEdealflow.Economicgrowthexpectationsrequire investments and provide the rationale to enter many emerging countries. Gompers and Lerner(1998)arguethatmoreattractiveVCandPEinvestmentopportunitiesexistifaneconomyisgrowingquickly.Romain and van Pottelsberghe de la Potterie (2004) find that VC/PE activity is cyclical and significantly
1 For more details please refer to Groh, Alexander and Liechtenstein, Heinrich (2011): The First Step of the Capital Flow fromInstitutions toEntrepreneurs:TheCriteria forSortingVentureCapital Funds,European Journalof FinancialManagement,Vol.17,Issue3,2011,pp.532-559.Relatedworkingpapersareavailableonhttp://blog.iese.edu/vcpeindex/.2 For a comprehensive review please refer to Groh, Alexander, Liechtenstein, Heinrich and Lieser, Karsten (2010): The EuropeanVentureCapitalandPrivateEquityCountryAttractivenessIndices,JournalofCorporateFinance,Volume16,Issue2,April2010,pp.205–224.

9
related to GDP growth. Wilken (1979) highlights the fact that economic prosperity and developmentfacilitate entrepreneurship, as they provide a greater accumulation of capital for risky investments. Thenumber of new ventures that qualify for VC backing is related to societal wealth, not solely because ofgenerallybetteraccess to financing,butalsobecauseofhigher incomeamongpotential customers in thedomesticmarket. Economic size and growth are certainly very important criteria to assess expected dealopportunitiesandVC/PE countryattractiveness.However, economicgrowth itself is alsoa resultofmanyothercriteriawhichwediscusswithinthesubsequentkeydrivers.
ImportanceofDepthofCapitalMarket
BlackandGilson (1998)discussmajordifferencesbetweenbank-centredandstockmarket-centredcapitalmarkets.Theyarguethatwell-developedstockmarkets,whichallowgeneralpartners toexitvia IPOs,arecrucialfortheestablishmentofvibrantVC/PEmarkets.Ingeneral,bank-centredcapitalmarketsarelessabletoproduceanefficient infrastructureof institutions thatsupportVC/PEdeal-making.Theyaffirmthat it isnot only the strong stockmarket that ismissing in bank-centred capitalmarkets; it is also the secondaryinstitutions inplace, includingbankers’conservativeapproachto lendingand investing,andthesocialandfinancial incentives that reward entrepreneurs less richly (and penalise failure more severely), thatcompromiseentrepreneurialactivity.JengandWells(2000)stressthatIPOactivityisthemainforcebehindcyclical VC and PE swings because it directly reflects the returns to investors. Kaplan and Schoar (2005)confirm this. Similar to Black and Gilson (1998), Gompers and Lerner (2000) point out that risk capitalflourishesincountrieswithdeepandliquidstockmarkets.Similarly,Schertler(2003)usesthecapitalisationof stockmarketsor thenumberof listedcompaniesasmeasures for stockmarket liquidityand finds thattheysignificantlyimpactVCandPEinvestments.
Aswellasthedisadvantagesofbank-centredcapitalmarkets,Greene(1998)emphasizesthatlowavailabilityofdebtfinancingisanobstacleforeconomicdevelopment,especiallyforstart-upactivityinmanycountries.Corporationsandentrepreneursneedtofindbackers—whetherbanksorVC/PEfunds—whoarewillingtobearrisk.CetorelliandGambera(2001)provideevidencethatbankconcentrationpromotesthegrowthofthose industrial sectors that have a higher need for external finance by facilitating credit access tocompanies.
Tosummarise,thestateofacountry’scapitalmarketevidentlyaffectsitsVCandPEactivity.Thereisadirectlinkbetweenthequotedcapitalmarket,bankingactivityandtheunquotedsegment.Banksarerequiredfortransactionfinancingandcreditfacilities.ThesizeoftheIPOmarketindicatesthepotentialforthepreferredexitchannelandIPOslikewisespurentrepreneurialspiritbecausetheyrewardentrepreneurs.Thismaybeconsideredasanalogoustothesizeof theM&Amarket,whichalso incentivisesentrepreneurialmanagersand presents the second preferred VC/PE divestment channel, as well as deal sourcing opportunities.Therefore,the liquiditiesoftheM&A,banking,andpubliccapitalmarketsprovidegoodproxiesfortheVCandPEsegmentbecausetheyassess thequalityof theVCandPEdeal-making infrastructure. Incountrieswith a strongpublic capitalmarket,M&A, andbanking activity,we also find theprofessional institutions,such as investment banks, accountants, lawyers, M&A boutiques or consultants, which are essential forsuccessfulVCandPEdeal-making.
10
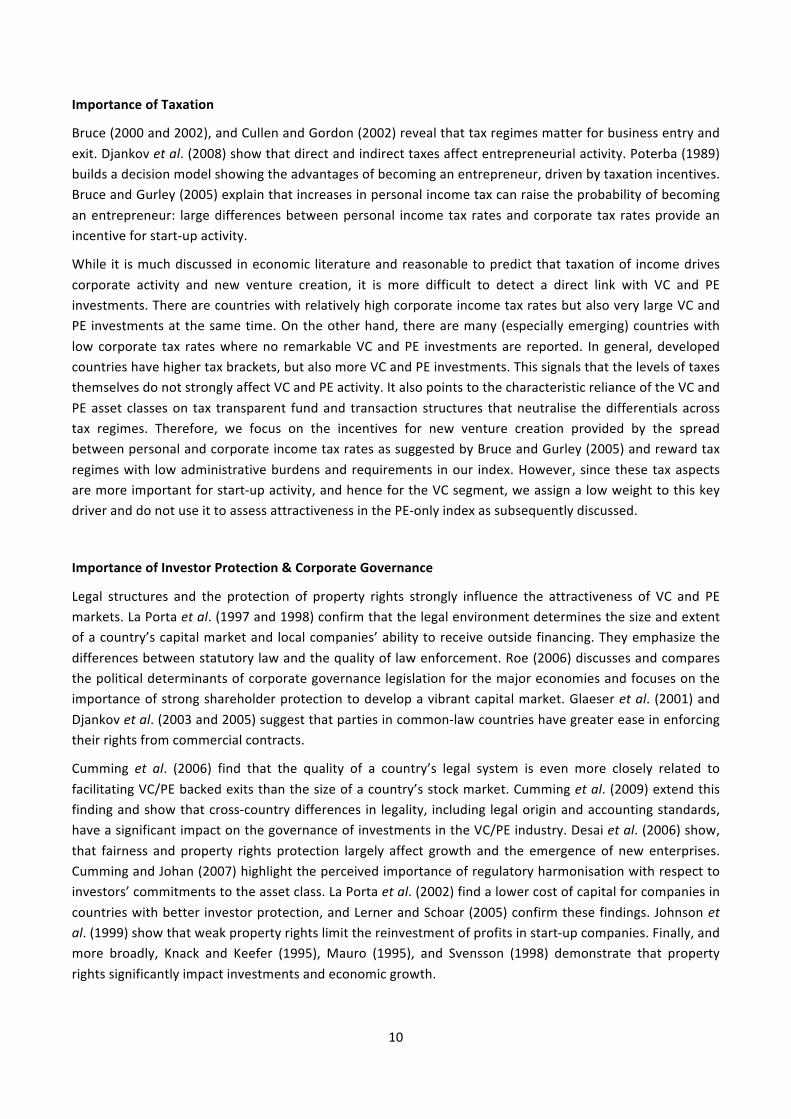
ImportanceofTaxation
Bruce(2000and2002),andCullenandGordon(2002)revealthattaxregimesmatterforbusinessentryandexit.Djankovetal.(2008)showthatdirectandindirecttaxesaffectentrepreneurialactivity.Poterba(1989)buildsadecisionmodelshowingtheadvantagesofbecominganentrepreneur,drivenbytaxationincentives.BruceandGurley(2005)explainthatincreasesinpersonalincometaxcanraisetheprobabilityofbecominganentrepreneur: largedifferencesbetweenpersonal income tax ratesandcorporate tax ratesprovideanincentiveforstart-upactivity.
While it ismuchdiscussed ineconomic literatureandreasonabletopredictthattaxationof incomedrivescorporate activity and new venture creation, it is more difficult to detect a direct link with VC and PEinvestments.TherearecountrieswithrelativelyhighcorporateincometaxratesbutalsoverylargeVCandPE investmentsatthesametime.Ontheotherhand,therearemany(especiallyemerging)countrieswithlowcorporate tax rateswhereno remarkableVCandPE investmentsare reported. In general, developedcountrieshavehighertaxbrackets,butalsomoreVCandPEinvestments.ThissignalsthatthelevelsoftaxesthemselvesdonotstronglyaffectVCandPEactivity.ItalsopointstothecharacteristicrelianceoftheVCandPEasset classeson tax transparent fundand transaction structures thatneutralise thedifferentialsacrosstax regimes. Therefore, we focus on the incentives for new venture creation provided by the spreadbetweenpersonalandcorporateincometaxratesassuggestedbyBruceandGurley(2005)andrewardtaxregimeswith lowadministrativeburdensandrequirements inour index.However,sincethesetaxaspectsaremoreimportantforstart-upactivity,andhencefortheVCsegment,weassignalowweighttothiskeydriveranddonotuseittoassessattractivenessinthePE-onlyindexassubsequentlydiscussed.
ImportanceofInvestorProtection&CorporateGovernance
Legal structures and the protection of property rights strongly influence the attractiveness of VC and PEmarkets.LaPortaetal.(1997and1998)confirmthatthelegalenvironmentdeterminesthesizeandextentofacountry’scapitalmarketandlocalcompanies’abilitytoreceiveoutsidefinancing.Theyemphasizethedifferencesbetweenstatutorylawandthequalityoflawenforcement.Roe(2006)discussesandcomparesthepoliticaldeterminantsofcorporategovernancelegislationforthemajoreconomiesandfocusesontheimportanceofstrongshareholderprotectiontodevelopavibrantcapitalmarket.Glaeseretal. (2001)andDjankovetal.(2003and2005)suggestthatpartiesincommon-lawcountrieshavegreatereaseinenforcingtheirrightsfromcommercialcontracts.
Cumming et al. (2006) find that the quality of a country’s legal system is even more closely related tofacilitatingVC/PEbackedexitsthanthesizeofacountry’sstockmarket.Cummingetal.(2009)extendthisfindingandshowthatcross-countrydifferences in legality, includinglegaloriginandaccountingstandards,haveasignificantimpactonthegovernanceofinvestmentsintheVC/PEindustry.Desaietal.(2006)show,that fairness and property rights protection largely affect growth and the emergence of newenterprises.CummingandJohan(2007)highlighttheperceivedimportanceofregulatoryharmonisationwithrespecttoinvestors’commitmentstotheassetclass.LaPortaetal.(2002)findalowercostofcapitalforcompaniesincountrieswithbetter investorprotection,andLernerandSchoar(2005)confirmthesefindings.Johnsonetal.(1999)showthatweakpropertyrightslimitthereinvestmentofprofitsinstart-upcompanies.Finally,andmore broadly, Knack and Keefer (1995), Mauro (1995), and Svensson (1998) demonstrate that propertyrightssignificantlyimpactinvestmentsandeconomicgrowth.

11
Thenumerousstudiescitedaboveillustratetheimportanceofthequalityofacountry’slegalsystemforitscapital market, be it in terms of the quoted or unquoted segment. Nevertheless, what is important forfinancialclaimsisequallyvalidforanyclaiminthecorporateworld.Doingbusinessbecomescostlywithoutproperlegalprotectionandenforcementpossibilities.VCandPEarestronglyexposedtothiscircumstancebecausetheyarebasedonlong-termrelationshipswithinstitutionalinvestors,wheretheinvestmentsourceand host countries can be distant and different. Investors rely on their agents, and the general partnersthemselvesrelyonthemanagementteamstheyback.Ifinvestorsarenotconfidentthattheirclaimsarewellprotectedinaparticularcountry,theyrefusetoallocatecapital.
ImportanceofHuman&SocialEnvironment
BlackandGilson(1998),LeeandPeterson(2000),andBaughnandNeupert(2003)arguethatculturesshapeboth individual orientation and environmental conditions, which may lead to different levels ofentrepreneurial activity.Megginson (2004) argues that, in order to foster a growing risk capital industry,educationwithrespecttoschools,universitiesandresearchinstitutionsplaysanimportantrole.
RigidlabourmarketpoliciesnegativelyaffecttheevolutionofaVC/PEmarket.Lazear(1990)andBlanchard(1997)discusshowprotectionofworkerscanreduceemploymentandgrowth.Itisespeciallyimportantforstart-upandmedium-sizecorporationstorespondquicklytochangingmarketconditions.BlackandGilson(1998)arguethatlabourmarketrestrictionsinfluenceVC/PEactivity,thoughnottothesameextentasthestockmarket.
Djankovetal. (2002) investigate the roleof several societalburdens for start-ups.Theyconclude that thehighest barriers and costs are associated with corruption, crime, a larger unofficial economy andbureaucratic delay. This argument is of particular importance in some emerging countries with highperceivedlevelsofcorruption.
ImportanceofEntrepreneurialCulture&DealOpportunities
The expectation regarding access to viable investments is probably the most important factor forinternationalriskcapitalallocationdecisions.Particularlyfortheearlystagesegment,weexpectthenumberand volumeof investments to be related to the innovation capacity and research output in an economy.Gompers and Lerner (1998) show that both industrial and academic research and development (R&D)expendituresignificantlycorrelateswithVCactivity.KortumandLerner(2000)highlightthatthegrowthinVC fundraising in themid-1990smay have been due to a surge of patents in the late 1980s and 1990s.Schertler(2003)emphasizesthatthenumberofbothR&Demployeesandpatents,asanapproximationofthehumancapitalendowment,hasapositiveandhighlysignificant influenceonVCactivity.Furthermore,RomainandvonPottelsberghedelaPotterie(2004)findthatstart-upactivityinteractswiththeR&Dcapitalstock,technologicalopportunitiesandthenumberofpatents.However, innovationsandR&Darenotonlyimportant forearlystageVC investments.WithoutmodernisationandsufficientR&D, itwillbe impossibleforestablishedbusinessestomaintainbrandnamesandstrongmarketpositions,factorswhichattractlaterstagePEinvestors.
Despitetheinnovativeoutputofasociety,Djankovetal.(2002),andBaughnandNeupert(2003)arguethatbureaucracy in the formof excessive rules andprocedural requirements,multiple institutions fromwhichapprovals are needed and cumbersome documentation requirements, may severely constrain

12
entrepreneurial activity. Lee and Peterson (2000) stress that the time andmoney required tomeet suchadministrativeburdensmaydiscouragenewventurecreations.
SummaryontheDeterminantsofVibrantVCandPEMarkets
Theresearchpapersemphasisethedifficultyofidentifyingthemostappropriateparametersforourindex.There is no consensus about a rankingof the criteria.While someparameters aremore comprehensivelydiscussed,andcertainlyofhighrelevance,itremainsunclearhowtheyinteractwithothers.Forexample,itisarguablewhethertheVC/PEactivityinacountrywithahighqualityofinvestorprotectionisaffectedmorebytheliquidityofitsstockmarketorbyitslabourregulations.
WhileanIPOexitis,inprinciple,possibleatanystockexchangeintheworld,thelabourmarketfrictionsinaparticularcountrycanhardlybeevaded.Ontheotherhand,manyofthecriteriaarehighlycorrelatedwitheach other. Black and Gilson (1998) call it a “chicken and egg” problem: it is impossible to detectwhichfactor causes the other. One line of argument is that modern, open and educated societies develop alegislationthatprotectsinvestors’claims,whichfavourstheoutputofinnovationandthedevelopmentofacapitalmarket.ThisleadstoeconomicgrowthandtodemandforVCandPE.However,thecausalitymightbe the reverse: economic growth spurs innovation and the development of modern educated societies.There is a third suggestion: only competitive legal environments allow the development of the societalrequirementsthatsupportinnovations,economicgrowth,thecapitalmarket,andVCandPEactivity.Finally,thereisafourthalternative,whichmayalsoberelevant:lowtaxesattractinvestorswhoprovidefinancingforgrowthwhichinturnleadstomodernandeducatedsocieties.
All linesofargumentare reasonableandvalidatedby theeconomicdevelopmentof selectedcountries indifferenthistoricperiods.Nevertheless,itseemstobethecombinationofallthesefactorswhichneedtobeimprovedinparalleltoincreaseVCandPEattractivenessofcountriesandregions.Forthisreason,wedonotrelyonaselectionofonlyasmallnumberofparameters.Foracountrytoreceiveahighindexrank,itneedstoachieveahighscoreonalloftheindividualcriteria.Therefore,weproposeastructureofthediscusseddeterminantstoachieveacomprehensiveresultandtofacilitateinterpretation.Firstly,wedifferentiatethesixkeydrivers:economicactivity,depthof thecapitalmarket, taxation, investorprotectionandcorporategovernance,humanandsocialenvironment,andentrepreneurial cultureanddealopportunities.We thenconfirm their choice via a surveyof institutional investors, reported inGrohand Liechtenstein (2009)and(2011), and base our index structure upon them. Unfortunately, none of these six key drivers is directlymeasurable, so we seek data series that adequately express their character. Hence, we try to find bestproxiesfortheaforementioneddriversofVC/PEattractiveness.Oneconstraintisthattheseproxiesmustbeavailableforalargenumberofcountries.

13
Buildingthe2016IndexAssessingSixLatentKeyDrivers
ThemostimportantprincipleofourindexistoassessthesixlatentdriversofVC/PEattractiveness:
1. EconomicActivity,
2. DepthofCapitalMarket,
3. Taxation,
4. InvestorProtection&CorporateGovernance,
5. Human&SocialEnvironment,and
6. EntrepreneurialCulture&DealOpportunities.
Latentdriversarecriteriathatarenotdirectlyobservable,butdrivenbyotherswhichcanbemeasured.Forexample, we assume in a first step that the VC/PE attractiveness of a country is determined by six keydrivers. Nevertheless, as pointed out, the key drivers themselves are not measurable but need to beestimated.Forexample,ideallythequalityofthedeal-makingenvironmentinacountrywouldbeexpressedbythenumberofinvestmentbanks,M&Aboutiques,lawfirms,accountantsandconsultants.Unfortunately,whileitmightbepossibletoobtainthesedataforaselectednumberofdevelopedcountries,suchdatadoesnotexistonaglobalscale.Ouronlyalternative istogathermoregeneral information, forexampleonthelevelofdebtprovidedbythebankingsector,orestimatesabouttheperceivedsophisticationofthefinancialsystem.Wesubmit thatthesecriteriaaffect the latentkeydriver, thedepthof thecapitalmarket.Even iftheyarenotperfectproxies,wemaintain that incountrieswherethesecriteriaarebetterdeveloped, thecapitalmarketwillbedeeperandmoredeal-supportinginstitutionswillexisttofacilitateVCandPEactivity.Hence,we assess the latent key driverwith observable data. This principle ismaintained at all individuallevels for the index construction.Anunobservable criterion is assessedwith several proxy parameters. Inprinciple,wemeasuretheattractivenessofacountrybythesixkeydriversbutusemanymoreproxiesfortheirassessment.Wealwaysuseseveralproxiessoasnottobereliantonsingleindividualdataserieswhichmightbebiasedbydifferentgatheringproceduresacrossthecountriesorbyinsufficientreporting.

14
Exhibit1:VC/PECountryAttractivenessIndex–constructionscheme
VentureCapital andPrivateEquityCountry Attractiveness Index
Economic Activity DepthofCapitalMarket Taxation InvestorProtection
&CorporateGovern.Human&SocialEnvironment
Entrepren.Culture&DealOpportunities
TotalEconomic
Size(GDP)
Expected Real
GPDGrowth
Unemployment
Sizeofthe
StockMarket
SMLiquidity
(TradingVolume)
IPOs& Public
IssuingActivity
M&AMarket
Activity
DebtandCredit
Market
BankNon-
Perf.Loans
FinancialMarket
Sophistication
MarketCap
of ListedComp.
No.Listed
Dom.Comp.
Number of
Issues
MarketVolume
Number of
Deals
MarketVolume
EaseofAccess
toLoans
Credit
Information
Index
Lending Rate
Entrepren.TaxInc.
&Adm.Burdens
Entrepren.
Incentive
No.Tax
Payments
Timespenton
TaxIssues
QualityofCorp.
Governance
DisclosureIndex
Director
LiabilityIndex
Shareholder
SuitsIndex
LegalRights
Index
Efficacy of
Corp.Boards
Securityof
PropertyRights
LegalEnforce.
of Contracts
PropertyRights
Intellectual
PropertyProt.
QualityofLegal
Enforcement
Judicial
Independence
ImpartialCourts
Integrityofthe
LegalSystem
Ruleof Law
Regulatory
Quality
Innovation
Innovativeness
Index
Capacityfor
Innovation
Scientific&Tech.
JournalArticles
EaseofStarting&
Running aBusiness
Simplicityof
ClosingaBusiness
CorporateR&D
No.Procedures
tostartaBusiness
Timeneededto
startaBusiness
Costsof Bus.
Start-Up
TimeforClosing
aBusiness
CostsforClosing
aBusiness
RecoveryRate
R&D Spending
UtilityPatents
Educationand
Human Capital
LabourMarket
Rigidities
Bribingand
Corruption
Qualityof
EducationalSys.
QualityofSci.
Research Inst.
Difficultyof
HiringIndex
Rigidityof
HoursIndex
Difficultyof
FiringIndex
FiringCosts
Bribingand
CorruptionIndex
Controlof
Corruption
Extra
Payments/Bribes

15
HowWeDisaggregatetheSixKeyDrivers
Inaccordancewiththeprincipleofassessinglatentkeydriverswithobservabledata,wedisaggregateeachkeydriverintosub-categories.Thesesub-categoriesareeitherindividualdataseriesor,again,latentdriversdependentondeterminantsthatwename“level-2constructs.”Forexample,asdocumentedinExhibit1,wesplitthekeydriver“2.Depthofthecapitalmarket”intosevensub-categories:
2. DepthofCapitalMarket:
2.1.SizeoftheStockMarket,
2.2.StockMarketLiquidity(TradingVolume),
2.3. IPOs&PublicIssuingActivity,
2.4.M&AMarketActivity,
2.5.Debt&CreditMarket,
2.6.BankNon-PerformingLoanstoTotalGrossLoans,and
2.7.FinancialMarketSophistication.
Dataseries2.2and2.6areprovidedbytheWorldBankanddataseries2.7resultsfromasurveyinitiatedbytheWorldEconomicForum(WEF).However, theother indicatorsareconstructs themselves.For instance,weassess “2.3 IPOs&Public IssuingActivity”byvolumeandbynumberof issues.Thisapproachhas twomajoradvantages.First,individualdataseriesdonotgaintoomuchweightwhentheyaregrouped,andthislimits the impact of outliers. Second, the overall results can be traced to more granulated levels whichprovidecompletetransparencyandbetterinterpretation.
TheWeightingScheme
Wespentagreatdealofeffortrefiningthestatisticalanalysesandoptimisingthestructureforourfirsttwoindex editions.3 We keep this optimised structure and apply equal weights for all data series when weaggregatethemtothelevel-2constructsandequalweightsforthelevel-2constructstoaggregatethemonthenexthigherlevelofthesixkeydrivers.Finally,theindividualweightsforthesixkeydriversdependonthe number of their level-2 constructs. For example, “1. Economic Activity” consists of three level-2constructs,“2.DepthofCapitalMarket”ofseven,while“3.Taxation”consistsofonlyone.Overall,weuse22 level-2 constructs for our index, andhence, “1. EconomicActivity” receives aweightof 3/22,which is0.136,while theweightof “2.DepthofCapitalMarket” is7/22,which is0.318,and for“3.Taxation” it is1/22=0.046,respectively.
Theadvantageofthisweightingschemeisthatthekeydriverswhich includemore level-2constructs,andhence data series, gain more weight. First, this represents their actual importance for VC and PEattractivenessas revealedbyourownanalysesandsecond,wediminish theeffectofpotentialoutliers inour data. This final index structure results from substantial prior optimisation effort. We find that anystatistically “more sophisticated” technique does not improve the index quality. The weighting scheme
3DetailsabouttheappliedstatisticalprocedurestodetermineweightsforthedataseriesareprovidedinourpaperGroh,Alexander,Liechtenstein,HeinrichandLieser,Karsten(2010):TheEuropeanVentureCapitalandPrivateEquityCountryAttractivenessIndices,Journal of Corporate Finance, Volume 16, Issue 2, April 2010, pp. 205 – 224. Related working papers are available athttp://ssrn.com/author=330804.

16
assigns appropriate emphasis according to the explanatory power of the individual key drivers. We willreturntothistopicinalatersectionofthisannual.
SeparateVCandPEIndices
Toaccount fordifferenceswith respect to the twomarketsegments,VCvs.PE,wepropose threerelatedindices.Thefirstonecombinesbothsegments(VC/PE).ThesecondfocusesonearlystageVConlyandthethird index on later stage PE. The combined index includes all data series proposed in Table 1,whilewediscardthedataseriesthatarelessimportantforeitherofthetwomarketsegmentswhencalculatingtheindividualVCandPEindices.
FortheVCindex,weconsiderthelevel-2construct“2.5Debt&CreditMarket”tobeofminorimportanceand hence, discard it. We also delete “2.6 Bank Non-Performing Loans to Total Gross Loans” and “2.7FinancialMarketSophistication”fromtheVCindex.
ForthePEindex,wediscardkeydriver“3.Taxation,”becausethecriteriaconsideredarebarelyrelevantforlater-stagePE.Similarly,wedrop“5.1Education&HumanCapital”fromthehumanandsocialenvironmentkey driver and keep only “6.5 Corporate R&D” to assess the deal opportunities related to proprietaryresearchoutputofcorporations.
Theweights for the individual index items in the separateVCandPE indices aredetermined in the sameway, and this leads to changes of some of the key driver weights. The results are highlighted on theindividualcountrypagessubsequentinthisannual.
Table 1 shows the data series, the level-2 constructs and the weights for the combined VC/PE, and theseparateVC-onlyandPE-onlyindices.Theweightsarepresentedwithrespecttothenextaggregationlevel.Hence,“1.1SizeoftheEconomy”,“1.2ExpectedRealGDPGrowth”and“1.3Unemployment”receiveeachaweightof33.3%whendeterminingtheEconomicActivitykeydriver.Thekeydriveritselfhasanimportanceof13.6%fortheaggregationoftheoverallVC/PEindex.Weprovidemoreinformationabouttheaggregationtechniqueintheappendix.

17
ID Construct Dimension VC/PEIndexWeight
VC-onlyIndexWeight
PE-onlyIndexWeight
0 VCPEIndex2016 100.0% 100.0% 100.0%
1 EconomicActivity 13.6% 15.8% 18.8%
1.1 SizeoftheEconomy(GDP)Source:EuromonitorInternational,Nationalstatistics/Eurostat/OECD/UN/InternationalMonetaryFund(IMF),InternationalFinancialStatistics(IFS)
LNUS$mn 33.3% 33.3% 33.3%
1.2 ExpectedRealGDPGrowthSource:EuromonitorInternational,Nationalstatistics/Eurostat/OECD/UN/InternationalMonetaryFund(IMF),WorldEconomicOutlook(WEO)
% 33.3% 33.3% 33.3%
1.3 UnemploymentSource:EuromonitorInternational,InternationalLabourOrganisation(ILO)/Eurostat/nationalstatistics/OECD
% 33.3% 33.3% 33.3%
2 DepthofCapitalMarket 31.8% 21.1% 43.8%
2.1 SizeoftheStockMarket 14.3% 25.0% 14.3%
2.1.1 MarketCapitalizationofListedCompaniesSource:WorldBank,WorldDevelopmentIndicators;WorldFederationofExchangesdatabase
%ofGDP 50.0% 50.0% 50.0%
2.1.2 NumberofListedDomesticCompaniesSource:WorldBank,WorldDevelopmentIndicators;WorldFederationofExchangesdatabase
LNnumber 50.0% 50.0% 50.0%
2.2 StockMarketLiquidity(TradingVolume)Source:WorldBank,WorldDevelopmentIndicators;WorldFederationofExchangesdatabase
%ofGDP 14.3% 25.0% 14.3%
2.3 IPOs&PublicIssuingActivity 14.3% 25.0% 14.3%
2.3.1 MarketVolumeSource:ThomsonOneBanker,SDCPlatinumGlobalNewIssues
LNUS$mn 50.0% 50.0% 50.0%
2.3.2 NumberofIssuesSource:ThomsonOneBanker,SDCPlatinumGlobalNewIssues
LNnumber 50.0% 50.0% 50.0%
2.4 M&AMarketActivity 14.3% 25.0% 14.3%
2.4.1 MarketVolumeSource:ThomsonOneBanker,SDCPlatinumMergers&Acquisitions
LNUS$mn 50.0% 50.0% 50.0%

18
ID Construct Dimension VC/PEIndexWeight
VC-onlyIndexWeight
PE-onlyIndexWeight
2.4.2 NumberofDealsSource:ThomsonOneBanker,SDCPlatinumMergers&Acquisitions
LNnumber 50.0% 50.0% 50.0%
2.5 Debt&CreditMarket 14.3% 14.3%
2.5.1 EaseofAccesstoLoansSource:WorldEconomicForum,GlobalCompetitivenessReport;WorldEconomicForum,ExecutiveOpinionSurvey
%ofGDP 33.3% 33.3%
2.5.2 CreditInformationIndexSource:WorldBank,DoingBusiness
33.3% 33.3%
2.5.3 LendingRateSource:EuromonitorInternationalfromInternationalMonetaryFund(IMF),InternationalFinancialStatisticsandnationalstatistics/OECD
% 33.3% 33.3%
2.6 BankNon-PerformingLoanstoTotalGrossLoansSource:WorldBank,WorldDevelopmentIndicators;InternationalMonetaryFund,GlobalFinancialStabilityReport
% 14.3% 14.3%
2.7 FinancialMarketSophisticationSource:WorldEconomicForum,GlobalCompetitivenessReport;WorldEconomicForum,ExecutiveOpinionSurvey
14.3% 14.3%
3 Taxation 4.5% 5.3%
3.1 EntrepreneurialTaxIncentives&AdministrativeBurdens 100.0% 100.0%
3.1.1 EntrepreneurshipIncentiveSource:KPMG,CorporateTaxandPersonalIncomeTaxTables
% 33.3% 33.3%
3.1.2 NumberofTaxPaymentsSource:WorldBank,DoingBusiness
33.3% 33.3%
3.1.3 TimespentonTaxIssuesSource:WorldBank,DoingBusiness
Hoursperyear
33.3% 33.3%
4 InvestorProtection&CorporateGovernance 13.6% 15.8% 18.8%
4.1 QualityofCorporateGovernance 33.3% 33.3% 33.3%
4.1.1 DisclosureIndexSource:WorldBank,DoingBusiness
20.0% 20.0% 20.0%
4.1.2 DirectorLiabilityIndexSource:WorldBank,DoingBusiness
20.0% 20.0% 20.0%

19
ID Construct Dimension VC/PEIndexWeight
VC-onlyIndexWeight
PE-onlyIndexWeight
4.1.3 ShareholderSuitsIndexSource:WorldBank,DoingBusiness
20.0% 20.0% 20.0%
4.1.4 LegalRightsIndexSource:WorldBank,DoingBusiness
20.0% 20.0% 20.0%
4.1.5 EfficacyofCorporateBoardsSource:WorldEconomicForum,GlobalCompetitivenessReport;WorldEconomicForum,ExecutiveOpinionSurvey
20.0% 20.0% 20.0%
4.2 SecurityofPropertyRights 33.3% 33.3% 33.3%
4.2.1 LegalEnforcementofContractsSource:FraserInstitute,EconomicFreedomoftheWorld;WorldBank,DoingBusiness
33.3% 33.3% 33.3%
4.2.2 PropertyRightsSource:WorldEconomicForum,GlobalCompetitivenessReport;WorldEconomicForum,ExecutiveOpinionSurvey
33.3% 33.3% 33.3%
4.2.3 IntellectualPropertyProtectionSource:WorldEconomicForum,GlobalCompetitivenessReport;WorldEconomicForum,ExecutiveOpinionSurvey
33.3% 33.3% 33.3%
4.3 QualityofLegalEnforcement 33.3% 33.3% 33.3%
4.3.1 JudicialIndependenceSource:WorldEconomicForum,GlobalCompetitivenessReport;WorldEconomicForum,ExecutiveOpinionSurvey
20.0% 20.0% 20.0%
4.3.2 ImpartialCourtsSource:WorldEconomicForum,GlobalCompetitivenessReport;WorldEconomicForum,ExecutiveOpinionSurvey
20.0% 20.0% 20.0%
4.3.3 IntegrityoftheLegalSystemSource:FraserInstitute,EconomicFreedomoftheWorld;PRSGroup,InternationalCountryRiskGuide
20.0% 20.0% 20.0%
4.3.4 RuleofLawSource:WorldBank,WorldwideGovernanceIndicator
20.0% 20.0% 20.0%
4.3.5 RegulatoryQualitySource:WorldBank,WorldwideGovernanceIndicator
20.0% 20.0% 20.0%
5 Human&SocialEnvironment 13.6% 15.8% 12.5%
5.1 Education&HumanCapital 33.3% 33.3% 0.0%
5.1.1 QualityoftheEducationalSystemSource:WorldEconomicForum,GlobalCompetitivenessReport;WorldEconomicForum,ExecutiveOpinionSurvey
50.0% 50.0% 0.0%

20
ID Construct Dimension VC/PEIndexWeight
VC-onlyIndexWeight
PE-onlyIndexWeight
5.1.2 QualityofScientificResearchInstitutionsSource:WorldEconomicForum,GlobalCompetitivenessReport;WorldEconomicForum,ExecutiveOpinionSurvey
50.0% 50.0% 0.0%
5.2 LabourMarketRigidities 33.3% 33.3% 50.0%
5.2.1 DifficultyofHiringIndexSource:WorldBank,DoingBusiness,LaborMarketRegulation
25.0% 25.0% 25.0%
5.2.2 RigidityofHoursIndexSource:WorldBank,DoingBusiness,LaborMarketRegulation
25.0% 25.0% 25.0%
5.2.3 DifficultyofFiringIndexSource:WorldBank,DoingBusiness,LaborMarketRegulation
25.0% 25.0% 25.0%
5.2.4 FiringCostsSource:WorldBank,DoingBusiness,LaborMarketRegulation
Weeksofwages
25.0% 25.0% 25.0%
5.3 BribingandCorruption 33.3% 33.3% 50.0%
5.3.1 CorruptionPerceptionIndexSource:TransparencyInternational
33.3% 33.3% 33.3%
5.3.2 ControlofCorruptionSource:WorldBank,WorldwideGovernanceIndicator
33.3% 33.3% 33.3%
5.3.3 ExtraPayments/BribesSource:WorldEconomicForum,GlobalCompetitivenessReport;WorldEconomicForum,ExecutiveOpinionSurvey
33.3% 33.3% 33.3%
6 EntrepreneurialCulture&DealOpportunities 22.7% 26.3% 6.3%
6.1 Innovation 20.0% 20.0%
6.1.1 GlobalInnovationIndexSource:INSEAD,WIPO,JohnsonCornellUniversity
50.0% 50.0%
6.1.2 CapacityforInnovationSource:WorldEconomicForum,GlobalCompetitivenessReport;WorldEconomicForum,ExecutiveOpinionSurvey
50.0% 50.0%
6.2 ScientificandTechnicalJournalArticlesSource:Elsevier,Scopus
LNnumber 20.0% 20.0%
6.3 EaseofStarting&RunningaBusiness 20.0% 20.0%
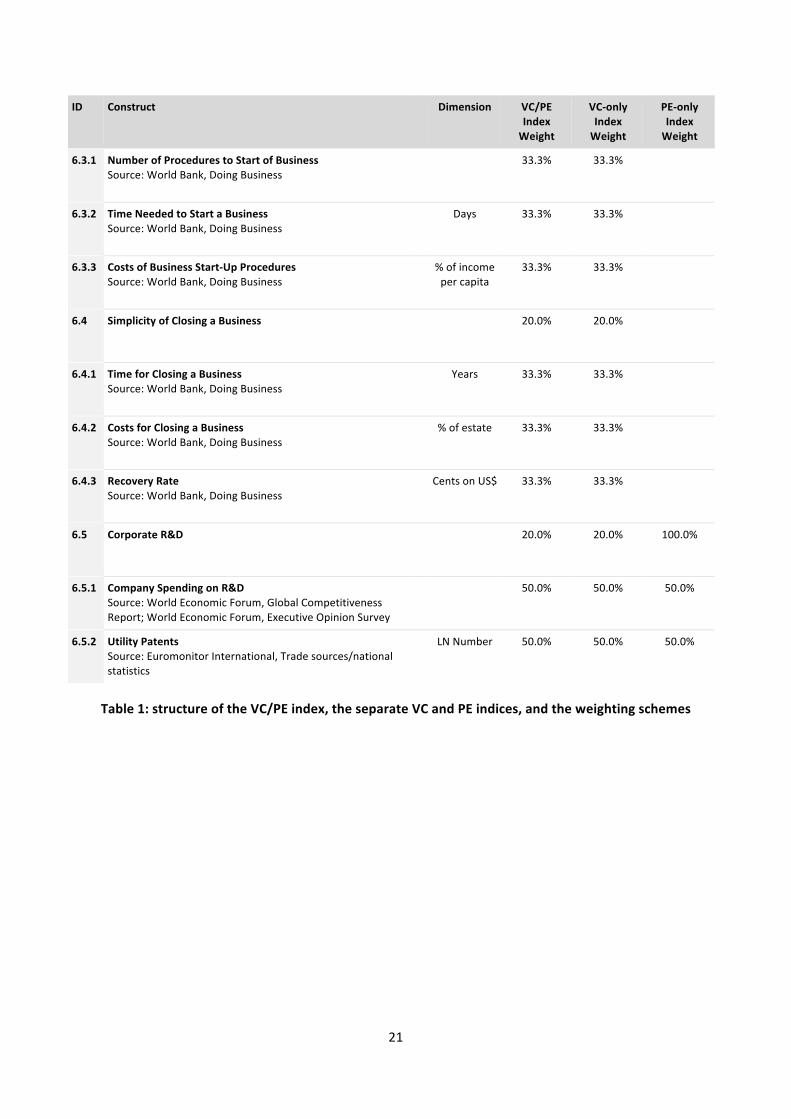
21
ID Construct Dimension VC/PEIndexWeight
VC-onlyIndexWeight
PE-onlyIndexWeight
6.3.1 NumberofProcedurestoStartofBusinessSource:WorldBank,DoingBusiness
33.3% 33.3%
6.3.2 TimeNeededtoStartaBusinessSource:WorldBank,DoingBusiness
Days 33.3% 33.3%
6.3.3 CostsofBusinessStart-UpProceduresSource:WorldBank,DoingBusiness
%ofincomepercapita
33.3% 33.3%
6.4 SimplicityofClosingaBusiness 20.0% 20.0%
6.4.1 TimeforClosingaBusinessSource:WorldBank,DoingBusiness
Years 33.3% 33.3%
6.4.2 CostsforClosingaBusinessSource:WorldBank,DoingBusiness
%ofestate 33.3% 33.3%
6.4.3 RecoveryRateSource:WorldBank,DoingBusiness
CentsonUS$ 33.3% 33.3%
6.5 CorporateR&D 20.0% 20.0% 100.0%
6.5.1 CompanySpendingonR&DSource:WorldEconomicForum,GlobalCompetitivenessReport;WorldEconomicForum,ExecutiveOpinionSurvey
50.0% 50.0% 50.0%
6.5.2 UtilityPatentsSource:EuromonitorInternational,Tradesources/nationalstatistics
LNNumber 50.0% 50.0% 50.0%
Table1:structureoftheVC/PEindex,theseparateVCandPEindices,andtheweightingschemes

22
ChangesWithRespecttothePriorIndexVersion
The index structure remained unchanged compared to the previous editions. However, we needed toaggregatetheDoingBusinessIndicesreferringtothelabourmarketrigiditiesbyourselves.TheWorldBankhas changed their policy and now publishes the sub-indicators instead of providing the aggregated indexvalues.Wereplacedtherawdataseriesforourstockmarketindicators2.1and2.2bydatafromtheWorldFederationofExchangesdatabaseasStandard&Poor'sdiscontinuedtopublishtheirGlobalStockMarketsFactbook.Wefurtherreplacedourinterestratespreadindicator2.5.3bylendingrates.OurVC/PECountryAttractivenessIndexnowconsistsof65individualdataseries.4
CountryCoverage
Weaimtocoverasmanycountriesaspossible,andtheinclusionofaparticularcountryisdependentonlyon data availability. Since our first index edition, the availability and quality of data has continuouslyimproved so that we can now include 125 countries, compared to 120 of last year’s edition.We addedAzerbaijan, Bolivia, Lebanon, Qatar and Sri Lanka.We assign the countries to eight different geographicregionsasdefinedbytheInternationalMonetaryFund.
Region(NumberofCountriesCovered)
Countries
Africa(31) Algeria,Angola,Benin,Botswana,BurkinaFaso,Burundi,Cameroon,Chad,Côted'Ivoire,Egypt,Ethiopia,Ghana,Kenya,Lesotho,Madagascar,Malawi,Mali,Mauritania,Mauritius,Morocco,Mozambique,Namibia,Nigeria,Rwanda,Senegal,SouthAfrica,Tanzania,Tunisia,Uganda,Zambia,Zimbabwe
Asia(22) Armenia,Azerbaijan,Bangladesh,Cambodia,China,HongKong,India,Indonesia,Japan,Kazakhstan,KoreaSouth,Kyrgyzstan,Malaysia,Mongolia,Pakistan,Philippines,Russia,Singapore,SriLanka,Taiwan,Thailand,Vietnam
Australasia(2) Australia,NewZealand
EasternEurope(21) Albania,Belarus,Bosnia-Herzegovina,Bulgaria,Croatia,CzechRepublic,Estonia,Georgia,Hungary,Latvia,Lithuania,Macedonia,Moldova,Montenegro,Poland,Romania,Slovakia,Slovenia,Turkey,Ukraine,Serbia
LatinAmerica(17) Argentina,Bolivia,Brazil,Chile,Colombia,DominicanRepublic,Ecuador,ElSalvadorGuatemala,Jamaica,Mexico,Nicaragua,Panama,Paraguay,Peru,Uruguay,Venezuela
MiddleEast(10) Bahrain,Israel,Jordan,Kuwait,Lebanon,Oman,Qatar,SaudiArabia,Syria,UnitedArabEmirates
NorthAmerica(2) UnitedStates,Canada
WesternEurope(20) Austria,Belgium,Cyprus,Denmark,Finland,France,Germany,Greece,Iceland,Ireland,Italy,Luxembourg,Malta,Netherlands,Norway,Portugal,Spain,Sweden,Switzerland,UnitedKingdom
4 Without counting the numerous data series to assess sub-indicator 5.2 Labour Market Rigidities.

23
The2016VC/PECountryAttractivenessRankingWegatheredthe individualdataseries inTable1foralloursamplecountriesfrom2000onwardstomostrecentdata retrieved.Wecalculatedthe2016outlookand foundthat theUSremains themostattractivecountryforVCandPEallocations,retainingitsrankingfromallpreviousindexeditions.WerescaledtheUSscore to 100.5 Its two followers, theUnited KingdomandCanada, achieved rescaled scores of 95.5%and94.3%respectively.Wenotethatthegapsbetweentheseandothercountrieshavenarrowedcomparedtoprior index editions. This ismainly due to the inclusion of additional economies in our samplewhichhaswidened the spread between the leading and trailing countries. It is also due to the principle that thecharacteristicsofagrowingnumberofcountriesneedtoberankedonthesamescalefrom1to100.
Table 2 presents the ranking of The VC and PE Country Attractiveness Index 2016. The table is open todebate.Somereadersmightarguethatparticularcountriesarerankedtoohigh,otherstoolow.However,wenotethattheindexrankingistheresultofcommonlyavailable,transparent,aggregatedsocio-economicdata,whichdescribesrelevantcharacteristicsforinvestorsinVCandPEassets.Theresultscanbetracedtothe levelof the individualdata series,andhence, canbe reconciled.Weareaware that thereare severalcountries,e.g.amongtheBRICSorotheremergingmarketswhichcurrentlyreceivestronginvestorattentionandrecordlevelsofVCandPEactivity.Onecouldcriticizeourindexrankingwhichhardlyreflectsthistrend.Itiscertainthatthecapitalabsorptioncapacityinmanyemergingmarketsallowsquicktransactionmakingandlargevolumes.WecouldbeattemptedtoincreasetheweightofGDPgrowthoroftheeconomicactivitykey driver to reflect investors’ appreciation of these fast growing markets. However, we note that ourweights are an optimized result of comprehensive cross sectional and longitudinal analyses (as we showsubsequently).IncreasingtheweightofGDPgrowth,forexample,canproduceawkwardrankingswhichdonotcorrespondwiththefactthatmanyofthe“traditional”marketsstillprovidethebestdealmaking,valueadding,andexitopportunities forVCandPE investors. It isnotevident fromtoday’sperspective that theshift of investors’ attention towards emerging countries will result in increased levels of successfultransactionsonthe longrun,andhence,satisfyingreturnsto investors inthefuture.Our indexassessesa“probability for success” from the institutional and socio-economic perspective. This probability increaseswithbetterdevelopedkeydrivingforcesaswedefinedthemabove,andviceversa.
Pleasenotethattheunderlyingdataisthemostrecentinformationavailable.Hence,weshowthecurrentattractivenessranking includingtheeconomicoutlook for2016and invite investorsandadvisers toenrichtheinformationwiththeirownknowledge,experienceandexpectationswhendrawingtheirconclusionsonallocation.
5 We explain the rescaling procedure in more detail in the appendix.

24
Country Rank/Trend Score Country Rank/Trend Score Country Rank/Trend Score
UnitedStates 1 - 100.0 Iceland 43 ↓ 63.2 Uganda 85 ↑ 42.8
UnitedKingdom 2 ↑ 95.5 Estonia 44 ↑ 62.6 Pakistan 86 ↓ 42.6
Canada 3 ↓ 94.3 Mauritius 45 ↑ 62.4 Nigeria 87 ↓ 41.8
Singapore 4 - 93.3 Romania 46 ↑ 61.0 Tanzania 88 ↓ 41.2
HongKong 5 ↑ 92.7 Hungary 47 ↓ 60.1 Ghana 89 ↑ 40.2
Australia 6 ↓ 91.9 Vietnam 48 - 59.5 Kyrgyzstan 90 ↑ 40.1
Japan 7 - 91.8 Kazakhstan 49 ↑ 59.4 ElSalvador 91 - 38.4
NewZealand 8 ↑ 88.7 Slovenia 50 ↑ 59.1 Kenya 92 ↑ 38.2
Germany 9 ↓ 88.6 Bahrain 51 ↓ 58.8 Namibia 93 ↓ 36.7
Switzerland 10 ↑ 85.7 Latvia 52 ↑ 58.7 Bangladesh 94 ↓ 36.0
Malaysia 11 ↑ 85.6 Peru 53 ↓ 58.7 Belarus 95 - 33.7
Denmark 12 ↓ 85.4 Brazil 54 ↓ 58.3 Malawi 96 ↓ 33.4
Norway 13 ↑ 85.2 Bulgaria 55 ↑ 58.0 IvoryCoast 97 ↑ 33.1
Finland 14 - 85.2 CzechRepublic 56 ↑ 57.6 Bosnia-Herzegovina 98 ↓ 32.9
Sweden 15 ↓ 84.6 SriLanka 57 ↓ 56.4 DominicanRepublic 99 ↑ 32.3
Netherlands 16 - 84.4 Morocco 58 ↓ 55.8 Rwanda 100 ↑ 32.0
Ireland 17 ↑ 82.2 Jordan 59 ↑ 54.8 Bolivia 101 ↓ 31.8
Belgium 18 ↓ 81.6 Oman 60 ↓ 54.3 Moldova 102 ↓ 31.7
Israel 19 ↓ 81.3 Slovakia 61 ↑ 54.2 Guatemala 103 ↓ 31.5
Korea,South 20 ↑ 80.8 Argentina 62 ↓ 54.0 Azerbaijan 104 ↑ 29.1
France 21 ↓ 80.3 Georgia 63 ↑ 53.8 Cambodia 105 ↑ 29.0
Taiwan 22 ↓ 79.4 Zambia 64 ↑ 53.3 Paraguay 106 ↓ 28.3
Austria 23 ↓ 78.5 Tunisia 65 ↓ 53.2 Albania 107 ↓ 26.4
China 24 ↓ 77.1 Greece 66 ↑ 53.2 Algeria 108 ↑ 26.0
Poland 25 ↑ 73.7 Cyprus 67 ↓ 52.7 Cameroon 109 ↑ 25.0
Spain 26 - 73.7 Qatar 68 ↓ 50.1 Ethiopia 110 ↑ 24.7
Chile 27 ↓ 73.0 Malta 69 ↓ 50.0 Nicaragua 111 ↓ 24.6
Thailand 28 ↑ 71.5 Egypt 70 ↓ 50.0 Senegal 112 ↓ 24.1
India 29 - 69.9 Ukraine 71 ↑ 50.0 Madagascar 113 ↑ 24.0
Luxembourg 30 ↑ 68.9 Mongolia 72 ↑ 49.1 Mali 114 ↓ 23.7
Portugal 31 ↑ 68.6 Macedonia 73 ↑ 47.5 Mozambique 115 ↓ 23.4
SouthAfrica 32 ↓ 67.5 Ecuador 74 ↑ 47.3 Lesotho 116 ↑ 22.4
Turkey 33 ↑ 67.2 Armenia 75 ↑ 47.2 Zimbabwe 117 ↓ 22.3
Italy 34 ↓ 67.0 Uruguay 76 ↓ 46.9 BurkinaFaso 118 ↓ 20.7
SaudiArabia 35 ↓ 66.8 Serbia 77 ↑ 46.1 Benin 119 ↓ 20.5
Colombia 36 ↓ 66.3 Panama 78 ↑ 46.1 Venezuela 120 ↓ 19.2
UnitedArabEmirates 37 ↑ 65.2 Lebanon 79 ↓ 46.0 Syria 121 ↓ 17.3
Indonesia 38 ↑ 64.9 Croatia 80 ↓ 46.0 Mauritania 122 - 15.3
Mexico 39 ↑ 64.6 Jamaica 81 ↑ 45.3 Burundi 123 - 15.0
Lithuania 40 ↑ 64.0 Montenegro 82 ↓ 44.8 Chad 124 ↑ 13.4
RussianFederation 41 ↑ 63.5 Botswana 83 ↓ 44.8 Angola 125 ↓ 11.5
Philippines 42 ↑ 63.4 Kuwait 84 ↓ 44.1
Note:↑indicatesarankincreaseoverafive-yearperiod.↓indicatesarankdecreaseoverafive-yearperiod.
Table2:The2016VC/PECountryAttractivenessIndexRanking

25
TheRegionalVCandPEAttractivenessLandscapeOur methodology allows calculating regional key driver scores as presented in Table 3. Note that theseregionalscoresarenotcomputedas“simpleaverages”.Theyresultfromweightingtheindividualdataseriesof the countries corresponding to a particular region either by GDP or population, whatever is moreappropriate.Werealizethatthehigherrankedcoremarketshaveconsistentlybetterdevelopedkeydriverswith the exception of economic activity. The table also reveals particular weaknesses of emerging andfrontiermarketswith respect to their capitalmarket depth, investors’ protection, their human and socialenvironment,andrelatedtothat,innovationdrivenentrepreneurialanddealopportunities.Westressagainthat“Taxation”doesnotmeasurethelevelsofmarginalcorporateorcapitalgainstaxrates.Thekeydriverratherassessesincentivesforentrepreneurshipresultingfromthedifferentialofthepersonalandcorporateincometaxratesandtheadministrativeburdenswhendeterminingandpayingtaxes.
Region IndexRank IndexScore1Economicactivity
2Depthofcapitalmarket 3Taxation
4Investorprotectionandcorporategovernance
5Humanandsocialenvironment
6Entrepreneurialcultureanddealopportunities
NorthAmerica 1 98.0 96.8 97.1 101.9 102.2 100.4 95.2
Australasia 2 90.8 90.2 82.4 107.2 107.7 101.2 85.5
WesternEurope 3 80.5 84.1 70.6 111.7 87.7 86.2 80.6
Asia 4 70.0 93.2 65.0 93.6 69.5 61.6 66.8
MiddleEast 5 63.8 84.8 57.6 92.9 66.5 68.2 54.1
EasternEurope 6 58.8 80.7 44.8 99.6 64.9 60.3 59.6
LatinAmerica 7 54.5 81.7 48.4 87.2 55.0 46.8 50.1
Africa 8 44.3 76.0 29.2 86.0 56.2 47.2 42.1
Table3:TheRegionalVCandPEAttractivenessLandscape

26
HistoriccomparisonandallocationrecommendationsInordertodemonstrateshiftsintheVCandPEcountryattractiveness,weperformcomparisonofthe2012and 2016 rankings. Exhibit 2 shows the current country ranks (ordinate) and the historic rank changes(abscissa - positive to the right and negative to the left) between the two indices. It provides interestinginsights and reveals strong increases of VC and PE attractiveness for certain countries, and the impact offinancialandeconomiccrisesonothers.However,insteadofdiscussingindividualcountrieshereinlength,wewould like to refer the interested reader to ourwebsitewhere this exhibit is directly linkedwith thedetailedcountryprofilesandadditionalanalytictools.
It shouldbe stressed thataccording to themethodologyof the index calculation, every country’s score iscalculated relative to all other sample countries. This means that those countries which gained or lostrankingpositionsdidnotnecessarilyimproveorworsentheirinvestmentconditionsinabsoluteterms.Theymaysimplyhaveoutperformedorbeenoutperformedbyothersintheinternationalcompetitiontoattractcapitalresources.
Exhibit2:CurrentRanksandRankChangesBetweenIndexVersion2012and2016
Exhibit2allowsvaluableinsightsinterpretingthefourquadrantsofthegraph.Obviously,allcountriesonthelefthandsideoftheexhibitshouldbecarefullyobservedbyinvestors, inparticularthelowertheircurrentrank.Itseemsreasonabletorecommendtoinvestorsavoidanceofthecountriesinthelowerleftquadrant.Contrarily,weseethepromisingdevelopmentof thecountries totherighthandsideof theordinate.Thecountriesintherightupperquadrantcanbeconsideredhighlyattractiveinvestmenthosts.Thelowerrightcornergroupsthecountrieswithincreasingbutyetmoderatelevelsofattractiveness.Thefurtherdownwe
Mauritius
ZambiaTunisia
Egypt
BotswanaTanzania Ghana
IvoryCoastRwanda
AlgeriaCameroonEthiopia
MadagascarLesotho
Malaysia
Korea,SouthTaiwan
Thailand
RussianFederation Philippines
Kazakhstan
SriLanka
Armenia
KyrgyzstanBangladesh
NewZealand
Poland
LithuaniaEstonia
RomaniaHungarySlovenia
Latvia
Slovakia
Macedonia
Montenegro
Albania
Colombia Mexico
PeruBrazil
Argentina
EcuadorUruguay
Jamaica
Nicaragua
Venezuela
SaudiArabiaUnitedArabEmirates
Bahrain
Oman
Lebanon
Kuwait
Syria
NorwaySweden
IrelandBelgium
Portugal
Iceland
GreeceCyprusMalta
1
125-30 -20 -10 0 10 20 30
Africa Asia Australasia EasternEurope LatinAmerica MiddleEast NorthAmerica WesternEurope
Decreasingattractiveness,observe
Unattractive,avoid
Increasingattractiveness,stayalert
Highlyattractive,increase exposure
Rank
2016
Change inrank2012-2016

27
get in the graph the lower thematurity of these countries to support VC and PE transactions. However,investorsshouldstayalertnottomisstherighttimetoenter.
For more information and comparisons, we refer to the individual country profiles on our websitehttp://blog.iese.edu/vcpeindex/whereadditionalgraphs,analyses,andbenchmarkingtoolsareavailable.
28
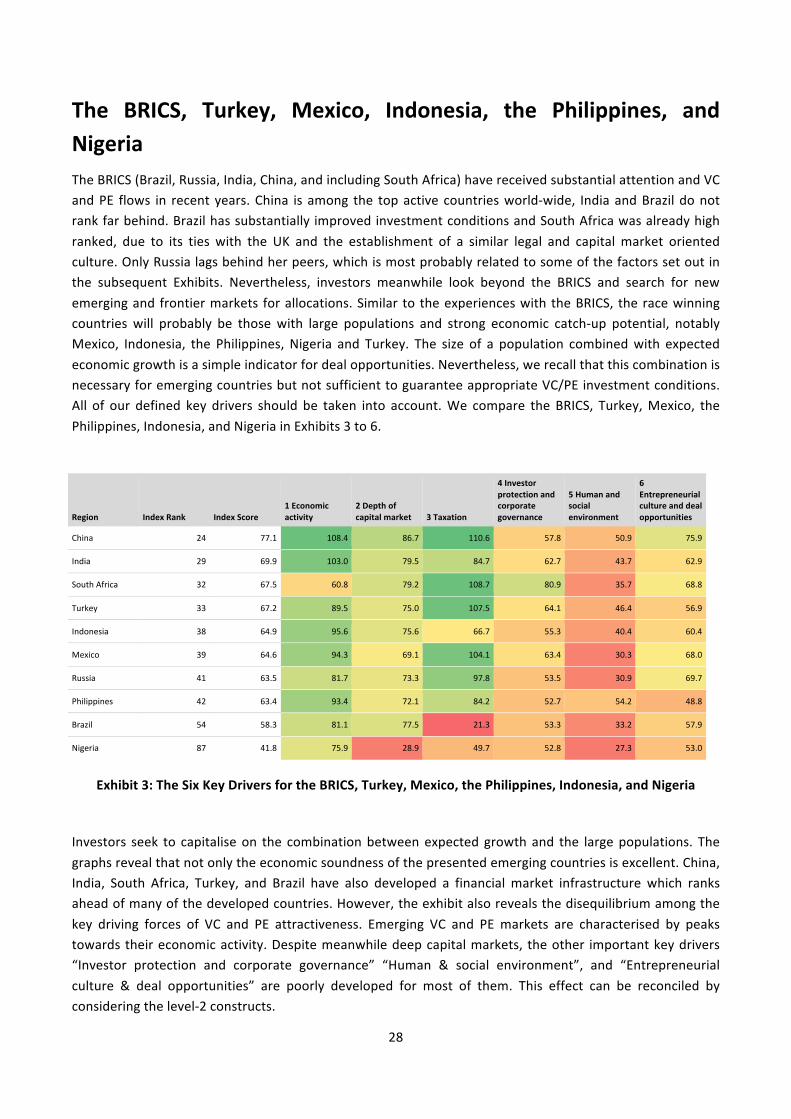
The BRICS, Turkey, Mexico, Indonesia, the Philippines, andNigeriaTheBRICS(Brazil,Russia,India,China,andincludingSouthAfrica)havereceivedsubstantialattentionandVCandPE flows in recentyears.China is among the topactive countriesworld-wide, IndiaandBrazildonotrankfarbehind.Brazilhassubstantially improvedinvestmentconditionsandSouthAfricawasalreadyhighranked, due to its ties with the UK and the establishment of a similar legal and capital market orientedculture.OnlyRussialagsbehindherpeers,whichismostprobablyrelatedtosomeofthefactorssetoutinthe subsequent Exhibits. Nevertheless, investors meanwhile look beyond the BRICS and search for newemergingandfrontiermarkets forallocations.Similar totheexperienceswiththeBRICS, theracewinningcountries will probably be thosewith large populations and strong economic catch-up potential, notablyMexico, Indonesia, the Philippines, Nigeria and Turkey. The size of a population combinedwith expectedeconomicgrowthisasimpleindicatorfordealopportunities.Nevertheless,werecallthatthiscombinationisnecessaryforemergingcountriesbutnotsufficienttoguaranteeappropriateVC/PEinvestmentconditions.All of our defined key drivers should be taken into account.We compare the BRICS, Turkey,Mexico, thePhilippines,Indonesia,andNigeriainExhibits3to6.
Region IndexRank IndexScore1Economicactivity
2Depthofcapitalmarket 3Taxation
4Investorprotectionandcorporategovernance
5Humanandsocialenvironment
6Entrepreneurialcultureanddealopportunities
China 24 77.1 108.4 86.7 110.6 57.8 50.9 75.9
India 29 69.9 103.0 79.5 84.7 62.7 43.7 62.9
SouthAfrica 32 67.5 60.8 79.2 108.7 80.9 35.7 68.8
Turkey 33 67.2 89.5 75.0 107.5 64.1 46.4 56.9
Indonesia 38 64.9 95.6 75.6 66.7 55.3 40.4 60.4
Mexico 39 64.6 94.3 69.1 104.1 63.4 30.3 68.0
Russia 41 63.5 81.7 73.3 97.8 53.5 30.9 69.7
Philippines 42 63.4 93.4 72.1 84.2 52.7 54.2 48.8
Brazil 54 58.3 81.1 77.5 21.3 53.3 33.2 57.9
Nigeria 87 41.8 75.9 28.9 49.7 52.8 27.3 53.0
Exhibit3:TheSixKeyDriversfortheBRICS,Turkey,Mexico,thePhilippines,Indonesia,andNigeria
Investors seek to capitaliseon the combinationbetweenexpectedgrowthand the largepopulations. Thegraphsrevealthatnotonlytheeconomicsoundnessofthepresentedemergingcountriesisexcellent.China,India, South Africa, Turkey, and Brazil have also developed a financial market infrastructure which ranksaheadofmanyofthedevelopedcountries.However,theexhibitalsorevealsthedisequilibriumamongthekey driving forces of VC and PE attractiveness. Emerging VC and PE markets are characterised by peakstowardstheireconomicactivity.Despitemeanwhiledeepcapitalmarkets, theother importantkeydrivers“Investor protection and corporate governance” “Human & social environment”, and “Entrepreneurialculture & deal opportunities” are poorly developed for most of them. This effect can be reconciled byconsideringthelevel-2constructs.

29
Exhibit4:Level-2ConstructsfortheBRICS
Exhibits4and5presentthescoresofthelevel-2constructsfortheBRICS,Turkey,Mexico,thePhilippines,Indonesia,andNigeria.Theyrevealtheexpectationsofgrowthandthedeepcapitalmarkets.However,theyalso point to general concerns about emerging market VC and PE in general. Corporate governanceindicators (with the exception of South Africa) and investor protection still remain obstacles. Further,perceivedbriberyandcorruptionlevelsarehigh,whileinnovationsandcorporateR&Dremainrelativelylow.We know from the BRICS and other emerging countries that growth and development are mainlyconcentratedinparticularhubsorcertainregions,butarenotwidespread.Wealsoknowthatthebenefitofwealth creation is often allocated among small elite groups and not larger parts of the population. Thispresentsnotonlysocio-economicandpoliticalchallengesinthosecountries,butalsoaffectstheirVCandPEattractiveness. If the countries cannot transfer the wealth effects of growth to a broader part of theirpopulation,this isunlikelyto improvetheotherkeydrivingforcesforVCandPEattractiveness,and if thepaceofeconomicgrowthslowsdown,thecountrieswillbelessattractiveforVC/PEinvestors.
0 20 40 60 80 100 120 140
6.5CorporateR&D
6.4SimplicityofClosingaBusiness
6.3BurdensofStartingandRunningaBusiness
6.2ScientificandTechnicalJournalArticles
6.1Innovation
5.3BribingandCorruption
5.2LaborRegulations
5.1EducationandHumanCapital
4.3QualityofLegalEnforcement
4.2SecurityofPropertyRights
4.1QualityofCorporateGovernance
3.1EntrepreneurialTaxIncentivesandAdmin.Burden
2.7FinancialMarketSophistication
2.6BankNonPerformingLoanstoToalGrossLoans
2.5DebtandCreditMarket
2.4M&AMarket
2.3IPOsandPublicIssuingActivity
2.2TotalTradingVolume
2.1SizeandLiquidityoftheStockMarket
1.3Unemployment
1.2ExpectedRealGDPGrowth
1.1SizeoftheEconomy(GDP)
China(24) India(29) SouthAfrica(32) RussianFederation(41) Brazil(54)

30
Exhibit5:Level-2ConstructsforTurkey,Mexico,thePhilippines,Indonesia,andNigeria
In summary, theBRICSand theotheremergingmarketsprovidemany investmentopportunitiesandhavestrong financing requirements for their expected economic growth. However, it is more challenging inseveral emerging countries to get access to high-quality deals because of the relative immaturity of theinstitutionaldeal-supportingenvironment.Wherecorruptionispresent, itmightbethecasethatthemostpromising transactions are negotiated among small groups of local elites while lemons are broadlyauctioned.Hence,dealflowcouldbecumbersomeandcostly.Furthermore,iftheprotectionofinvestorsisinsufficient, and if bribery and corruption are high, then the net returns to investors can suffer. Limitedpartnersshouldcarefullyconsidertheadvantagesanddisadvantagesof theemergingopportunitiesastheexceptionalgrowthcomesatacertaincost.
0 20 40 60 80 100 120 140
6.5CorporateR&D
6.4SimplicityofClosingaBusiness
6.3BurdensofStartingandRunningaBusiness
6.2ScientificandTechnicalJournalArticles
6.1Innovation
5.3BribingandCorruption
5.2LaborRegulations
5.1EducationandHumanCapital
4.3QualityofLegalEnforcement
4.2SecurityofPropertyRights
4.1QualityofCorporateGovernance
3.1EntrepreneurialTaxIncentivesandAdmin.Burden
2.7FinancialMarketSophistication
2.6BankNonPerformingLoanstoToalGrossLoans
2.5DebtandCreditMarket
2.4M&AMarket
2.3IPOsandPublicIssuingActivity
2.2TotalTradingVolume
2.1SizeandLiquidityoftheStockMarket
1.3Unemployment
1.2ExpectedRealGDPGrowth
1.1SizeoftheEconomy(GDP)
Turkey(33) Mexico(39) Indonesia(38) Philippines(42) Nigeria(87)

31
TrackingPowerofourIndexOur index ranks the attractiveness of countries to receive VC/PE allocations from institutional investorsbasedonmanysocio-economicdataseries.Thecompositemeasurecandeviatefromtheactualriskcapitalmarket activity and these deviationsmight point to an inaccuracy of ourmeasure.With respect to theirallocations, investorsareofteninfluencedbyherdingbehaviourandfollowtrendstocertaincountriesandregions, especially driven by growth expectations. However, the countries might not have sufficientlydeveloped “VC/PE infrastructure” to absorb the committed capital, leading to over-funding. The VC/PEinfrastructure is exactly what we aim to assess with our index: can we expect sufficient VC and PE dealopportunitiesresultingfromtheentrepreneurialcultureinacountry,fromitseconomicsoundness,orfrominnovations? Are potential transactions efficiently supported by the financial community? Are the publicequityandM&Amarketsliquidenoughtofacilitatedivestments?Areinvestors’concernslegallytakencareof?Wedonotclaimthatourindexprovidesthecorrectanswertothesequestions,howeverwesubmitthatit is comparatively helpful in this respect. Therefore, we expect deviations between our attractivenessmeasureandactualVCandPEactivityintheparticularcountriestobeataminimumlevel.
Toanalysethetrackingpowerofourindex,wecomparetheindexscoreswiththeactualVCandPEactivityin the various countries using the data from Thomson One. Our activity measure is the logarithm of anaverageofallVCandPEinvestmentsmadebythegeneralpartnersinacertaincountryoverthelastthreeyears.Weuse the logarithmtoaccount for the largeactivitydivergence (e.g.activity in theUSvs. severalemerging countries), andweuseanaverageover threeyears to smooth fluctuations. For someemergingcountriesinparticular,annualactivitystronglyfluctuatesfrompeaklevelstozeroinsubsequentyears.Wechose the criterion “location of the general partners”— and not of the investments— for the followingreason:somefinancialcentresserveashubsandchannelVCandPEabroad.Investorsallocatetheircapitaltothesehubsbecausetheycanrelyontheefficiencyofthefinancialcommunitythere.Thisisexactlywhatwetrytomeasurewithourindex.Infact,wefocusonthedemandforVCandPEinaparticulareconomy,andsimilarlyonthestateoftheprofessionalfinancialcommunitythatsupportsthesupplysideanddirectsthefundstotheinvesteecorporations.Inaddition,weuseinvestments—andnotraisedfunds—becauseourindexmeasuresthe“absorptioncapacity”(eithercausedbydirectlocaldemandorbychannellingfundsabroad)of theparticulareconomies.Raised fundsmightdeviate from thisabsorption capacitydue to theherdingbehaviourofinvestors,causedbyover-optimismornegligence.
ThestatisticalmeasureforsuchacomparisonisthePearsoncorrelationcoefficient.Itliesbetween0and1,where 0 signals “no” and 1 “perfect correlation.” The coefficient for our index is 0.63, signalling that theindexexcellentlytracksworld-wideactivity.WeillustratethishighcorrelationinExhibit6.

32
Exhibit6:TrackingPowerofourIndex
Exhibit6showsthetrackingpowerofour index.Weplot thecountries’ investmentactivityontheir indexscoresand identifya strong link.Theexhibit further illustrates thatweonlyobserveVCandPEactivityatindexlevelsaboveapproximately45points.Forcountrieswithscoresbelowthislevel,noactivityis(publicly)reported.Hence,45pointscanbeconsideredathresholdfortheemergenceofVCandPEactivity.

33
OurIndexandHistoricVCandPEReturnsConcurrenttothefindingthatour indexperformswellwhentrackingVCandPEactivity, it isofparticularinterest to analysewhether it also correspondswith the average performance achieved in the particularcountries.Unfortunately,performancefiguresarestilloneofthebestkeptsecretsintheVCandPEindustry.The principle of non-disclosure of information on returns is equally valid in developed and in emergingmarkets. Inaddition,theemergingVCandPEmarketsareyoungwithgenerally lowactivity(despitesomeexceptions), and hence there are very few transactions from which achieved returns can be calculated.Therefore,anassessmentofVCandPEperformanceisevenmorechallengingforthedevelopingcountriesthanforthedeveloped.Commercialdatasuppliersprovideonlyverylimitedperformancefigures.Theonlywaytoobtainreliableperformancedataonasufficientnumberoftransactionsforempiricalanalysesisviaanextensiveefforttocollectprivateplacementmemoranda(PPMs).Aprivateplacementmemorandumisadocument edited by a general partner that raises a VC/PE fund and solicits capital commitments frominstitutional investors. It isamarketingdocumentusedforfundraisingpurposes.Generalpartnersprovideinformationabout their track recordsand theperformanceof individual transactions inPPMs.The figuresareauditedandinvestorstrustthem.However,onlysuccessfulgeneralpartnersraiseasubsequentfundandeditaPPM.Therefore,theiruseiscriticisedbyacademicresearchers,asaverageperformancefiguresfromPPMs are upward biased. Nevertheless, there is no reason to believe that this upward bias is differentamongparticularcountries.Thismeansthatbenchmarkingcountries is feasible:becausethecountriesarecomparedonaconsistentrelativebasis,absolutetermsarenotimportant.
Using PPMs, Lopez-de-Silanes, Phalippou and Gottschalg (2010) put together the most comprehensivedatabaseonVCandPE returnsat the investment level, containing theperformanceandcharacteristicsof7,453investments,ofwhich1,694wereinemergingcountries.Thefirsttransactionconsideredwasclosedin1971 and the last prior to 2006.We are grateful to Ludovic Phalippou for providing us with aggregatedcountryreturnsfromthisdatabase.Thesereturnsarecompiledasthemeanaverageofgrossinternalratesofreturnofalltransactionsinaparticularcountry.Weareawarethatthisisaroughestimate,disregardingdifferent fund vintage years, industries, deal structures and development cycles of the particular VC/PEmarkets.Unfortunately,controllingfortheseeffectsisimpossiblewiththedataavailable.Inaddition,anIRRis a capital- and time-weighted return measure that requires a reinvestment assumption and that hasaggregation issues as described in Phalippou (2008). However, the IRR pitfalls are the same for alltransactions and for all of our countries. Therefore, they do not affect our cross-sectional countrybenchmarkingapproach.
Withtheseaggregateperformancemeasures,wecannotonlyanalysetheextenttowhichourindextracksVC and PE market activity, but also the average country returns. We note that the Lopez-de-Silanes,PhalippouandGottschalg(2010)dataincludetransactionsinfouremergingmarketswithindexscoresbelowthepreviouslydiscussedcut-offrateof45points.However,thesetransactionstookplaceseveralyearsagoand are not reported in the ThomsonOne database.We canmatch the index scores of 48 countries (ofwhich 24 are emerging countries)with their aggregate performancedata. There are at least 10 observedIRRsforeachcountry.Wefindthatthecorrelationbetweentheindexscoresandacountry’saveragegrossinternalrateofreturnis0.62.ThishighcorrelationispresentedinExhibit7,whichplotstheaverageofthecountryreturnsontheirindexscores.

34
Exhibit7:HistoricPerformanceandourIndex
Exhibit7showsthatourindexisnotonlyavalidproxyforVCandPEactivity;itisalsoagoodindicatorforaggregatehistoric country returns. It is evident that theaveragesofhistoricgross internal ratesof returnwerelargerincountriesthatrankhigherinourindexthaninlow-rankedcountries.Theregressionlinehasaslopeof0.55%,signallingthataonepoint increaseintheindexscorecomeswitha0.55%riseofaveragehistoric IRRs.Nevertheless, thereare “outliers,”meaning low ranked countrieswithhigh returnsandviceversa. Additionally, there is a strong dispersion of returns within each particular country, driven by verysuccessfultransactionsandcompletewrite-offsinanyofthem.Wehighlightthattheinternalratesofreturncollected by Lopez-de-Silanes, Phalippou and Gottschalg (2010) are calculated gross of any fees.We canassume that fees are higher for investors in immature markets with less competition among generalpartners.Therefore,weexpectthelesscompetitiveemergingcountriestobemorecostlyforinvestors.Thiseffectsupportsourresultandwouldbeexpectedtoincreasethecorrelationifweconsiderednetreturnstoinvestors.
Nevertheless, analyses with return data have to be treated with caution as historic returns are notnecessarilygoodproxiesforfuturereturns.Additionally,for11emergingcountriesthenumberofrecordeddeals is between 10 and 20 only. Therefore, their IRR averages can be affected to a greater extent byoutliers.
-30%
-20%
-10%
0%
10%
20%
30%
40%
50%
0 10 20 30 40 50 60 70 80 90 100
VCPEscorepercountry
AverageIRRpercountry

35
SummaryandOutlookWe provide a composite measure that determines the attractiveness of 125 countries to receive capitalallocationsfrominvestorsintheVCandPEassetclass.Thecompositemeasureisbasedonsixmaincriteria:economicactivity,depthofthecapitalmarkets,taxation,investorprotectionandcorporategovernance,thehumanandsocialenvironment,andentrepreneurialcultureanddealopportunities.Thedefinitionofthesecriteria is based on an extensive review of academic literature, on a survey of institutional investors weconducted prior to our study, and on our own econometric analyses. The six criteria are not directlyobservable. Therefore, we use proxy variables to assess them for each country. As a result, we obtain acountryrankingandprovidedetailedanalysesonthestrengthsandweaknessesoftheparticularnationsandinformationonthehistoricdevelopmentofthecriteria.OurindexperformswellintermsofexplainingthedifferencesofobservedVCandPEactivity,andexcellentlytrackshistoriccountryperformance.However,itdoesnotqualifyasacrystalballforinvestmentadvisers.WehighlightourintentiontoenrichthediscussionregardingnationalVCandPEmarketsandtoproposeavaluableinformationaltool,ratherthananarbitrageinstrument.
We find a general pattern if we compare country characteristics. There is considerable dispersion withrespect to the six key drivers. Some countries attract investorswith tax incentives.Many countries showstrong entrepreneurial culture and deal opportunities. There is great dispersion in economic activity,especiallywith respect toemergingmarketsand in thehumanandsocialenvironment.However, the twokey criteria, depth of capital markets, and investor protection and corporate governance make thedifferenceacrossthelargesample.Commonlawcountriesdominatetheothersregardingthesecriteria.Weobserve that strong investor protection and corporate governance rules favour deep and liquid capitalmarkets.TheseelicittherequiredprofessionalcommunitytosecuredealflowandexitopportunitiesforVCandPE fundswhichaffects a country’s attractiveness for institutional investments in theVCandPEassetclass.
However, this discussion reflects the capital supply side only.We should also take into account that, asrevealed by our analyses, many countries lack several important characteristics. Without a sufficiententrepreneurial culture, and with rigid labour markets, bribery and corruption, there will be firstly lessdemandforVCandPE,andsecondlyreturnstoinvestorswilldiminish.
Emerging VC and PE provide interesting opportunities to investors. However, it is the discussed lack ofbalanceofthekeydrivingforcesthatrendersemergingVC/PEallocationdecisionschallenging.Exceptionalgrowthopportunitiescomeatthecostofdisadvantageousconditionswithrespecttoinvestors’protection,usuallylessliquidexitmarkets,lowerinnovationcapacityandhigherperceivedbriberyandcorruption.
We invite you to examine and thoroughly analyse our results. If you are an investor, please enrich theinformation provided with your own expertise and knowledge about the key driving forces and marketconditionsintheindividualcountriestomakeyourallocationdecisions.Ifyouareapolitician,pleaseuseouranalyses as a demonstration of how investors can evaluate and benchmark countries. If you are aresearcher, and this is equally valid for the whole constituency, please do not hesitate to criticise ourapproachandfindings.Wewillcontinuetoupdateourindexannuallyandverymuchappreciateanycritiqueandcomment.

36
Appendix1:ComputationoftheIndexThe VC/PE attractiveness of each country is computed by calculating a weighted average of countryperformance scores in the six key drivers. The scoreswithin each key driver are derived from the level-2constructs,respectivelyderivedfromseveralrawdataseries.
Normalisation
In order to make the cross-sectional data series comparable, the raw data has to be converted into acommon range. The rescaling method is used to normalise indicators to such a range by lineartransformation.Thereby,100representsthebestscore,while1representstheworst.
For every individual variable, we define whether high values influence the attractiveness for investorspositivelyornegatively,andhence,assign100pointseithertothehighestscore(e.g.inthecaseofGDP)ortothelowest(e.g.inthecaseofhighhiringcosts).
Thepointsarecalculatedaccordingtothefollowingformula:
𝑦",$ = 99× 𝑥",$– min 𝑥"
max 𝑥" − min 𝑥" + 1
𝑦",$ =normalisedvalueofcategoryqandcountryi
𝑥",$ =rawdatavalueofcategoryqandcountryi
min 𝑥" =Minimumrawdatavalueofcategoryqwithinthesample
max(𝑥") =Maximumrawdatavalueofcategoryqwithinthesample
Example:
Rawdatavalue[anyunit] 1(lowestvalueinsample) 12(randomvalueinsample) 20(highestvalueinsample)
Normalisedvalue[1-100] 99x[(1-1)/(20-1)]+1=1 99x[(12-1)/(20-1)]+1=58 99x[(20-1)/(20-1)]+1=100

37
Aggregation
For the index score calculation,we use geometric aggregation because it is better suited than arithmeticaggregation. Geometric aggregation rewards those countries or those sub-indicators with higher scores.Overall,ashortcominginthevalueofonevariableorsub-indexcanbecompensatedbyasurplusinanother.Compensability is constant in linear aggregation,while it is smaller in geometric aggregation for the sub-indicators with low values. Therefore, countries with low scores in some sub-indices would benefit fromlinearaggregation.
Forthisreason,weusegeometricaggregationasfollows:
𝐼𝑛𝑑𝑒𝑥𝑉𝑎𝑙𝑢𝑒$ = 𝑦",$=>
?
"@A
𝐼𝑛𝑑𝑒𝑥𝑉𝑎𝑙𝑢𝑒$ =indexvalueofcountryi
𝑦",$ =normalisedvalueofcategoryqandcountryi
𝑤" =weightofcategoryq
Example:
Category EconomicActivity DepthofCapitalMarket InvestorProtection&CorporateGovernance
Weight 0.50 0.25 0.25
Normalisedvalueofcountryi(𝑦",$) 30.0 40.0 50.0
Indexvalueforthecountry (300.5)x(400.25)x(500.25)=36.6

38
Weighting
Aftercalculatingtheperformancescoresforeachdataseriesonthelowestlevel,thescoresareaggregatedusing the aforementioned aggregation method. On the lowest level, items are aggregated with equalweights, i.e. theweights arederived from thenumberof components that are aggregated. The followingexhibit shows the aggregation path from the normalised (raw) data series to the final VC/PE CountryAttractivenessIndexscore.
(Raw)DataSeries Sub-constructs/DataSeries KeyDriver Index
Equalweights
EconomicActivity
DepthofCapitalMarket
VCPEIndex
7/22
Equalweights Output
Indexlevel
WEF
IMF
FraserInstitute
ThomsonOne
Banker
WorldBank
…
Input Dataextraction Normalization
Score100
1
best
worst
Databases Normalizationtocommonrange:1to100Individualdataseries
Weightsaccordingtothe#ofitems
RescalingUS =100
Rank1 best
118
worst
3/22

39
Appendix2:StatisticalValidationoftheIndexCorrelationisameasureforthestrengthanddirectionalityofa linearrelationbetweentwovariables.ThePearson-Correlation-Coefficient𝜌D,E lies between 0 to ±1. Zero indicates a non-linear ormissing relationbetween two data sets and ±1 indicates perfect linearity. A positive (negative) correlation indicates apositive(negative)relation.
𝜌D,E =𝑐𝑜𝑣(𝑋, 𝑌)𝜎D𝜎E
=𝐸((𝑋 − 𝜇D)(𝑌 − 𝜇E)
𝜎D𝜎E
To test the quality of our index, we calculate the correlation between the index scores with the controlvariable.Theresultsoftheseanalysesaredisplayed inthefollowingtable.Thecorrelationcoefficientsareveryhighforallcasesconsidered.Thesehighvaluesprovetheaccuracyoftheindexscoresanditsabilitytomeasureacountries’attractivenessforinvestorsinVCandPEfunds.Itshouldbenoted,however,thattheaccuracyandthevolumesofreportedVC investments is lowerthanforPE.Therefore,thecorrelationsforthecombinedVC/PEandforthePEIndexaresomewhathigherthanforVC.
VC/PEinvestmentsLN(average2013–2015)
VCinvestmentsLN(average2013–2015)
PEinvestmentsLN(average2013–2015)
VC/PEIndex2016 0.63 - -
VCIndex2016 - 0.62 -
PEIndex2016 - - 0.61
40
ReferencesBaughn CC, Neupert KE. Culture and national conditions facilitating entrepreneurial start-ups. Journal ofInternationalEntrepreneurship2003;1;313-330.
BlackB,GilsonR.VentureCapitalandthestructureofcapitalmarkets:Banksversusstockmarkets.JournalofFinancialEconomics1998;47;3;243-277.
BlanchardOJ.Themediumrun.BrookingsPapersonEconomicActivity1997;2;89-158.
BruceD.EffectsoftheUnitedStates’taxsystemontransitionintoself-employment.LaborEconomics2000;7;5;545–574.
BruceD.Taxesandentrepreneurialendurance:Evidencefromtheself-employed.NationalTaxJournal2002;55;1;5-24.
BruceD,GurleyT.Taxesandentrepreneurialactivity:Anempiricalinvestigationusinglongitudinaltaxreturndata.SmallBusinessResearchSummary2005;252.
CetorelliN,GamberaM.Bankingmarketstructure,financialdependenceandgrowth:Internationalevidencefromindustrydata.TheJournalofFinance2001;56;2;617-648.
CorneliusP,BroesL,vanRossumM.,Bigisbetter:Growthandmarketstructureinglobalbuyouts.JournalofAppliedCorporateFinance2007;19;109–116.
CullenJB,GordonRH.Taxesandentrepreneurialactivity:TheoryandevidencefortheU.S.NBERWorkingPaper9015;2002.
CummingD,DaiN.Fundsize,limitedattentionandthevaluationofventurecapitalbackedfirms.JournalofEmpiricalFinance2011;18;1;2-15.
CummingD, FlemingG, SchwienbacherA. Legality andventure capital exits. JournalofCorporateFinance2006;12;214–245.
CummingD,JohanS.Regulatoryharmonizationandthedevelopmentofprivateequitymarkets.JournalofBankingandFinance2007;31;3218–3250.
Cumming D, Schmidt D, Walz U. Legality and venture capital governance around the world. Journal ofBusinessVenturing(forthcoming)2009.
DesaiM,GompersP,LernerJ.Institutionsandentrepreneurialfirmdynamics:EvidencefromEurope.HavardNOMResearchPaper03-59;2006.
Djankov S, Ganser T,McLiesh C, Ramalho R, Shleifer A. The effect of corporate taxes on investment andentrepreneurship.NBERWorkingPaper13756;2008.
DjankovS,LaPortaR,Lopez-de-SilanesF,ShleiferA.Theregulationofentry.QuarterlyJournalofEconomics2002;117;1;1-37.
DjankovS,LaPortaR,Lopez-de-SilanesF,ShleiferA.Courts.Quarterly JournalofEconomics2003;118;2;453-517.
DjankovS,LaPortaR,Lopez-de-SilanesF,ShleiferA.Thelawandeconomicsofself-dealing.NBERWorkingPaper11883;2005.

41
GaricanoL.Hierarchiesandtheorganizationofknowledgeinproduction.JournalofPoliticalEconomy2000;108;874-904.
GlaeserEL,JohnsonS,ShleiferA.Coasevs.theCoasians.QuarterlyJournalofEconomics2001;116;853-899.
Gompers P, Lerner J. What drives venture fundraising? Brooking Papers on Economic Activity,Microeconomics1998;149-192.
GompersP,LernerJ.Moneychasingdeals?The impactof funds inflowsonthevaluationofprivateequityinvestments.JournalofFinancialEconomics2000;55;2;281-325.
Green PG 1998. Dimensions of perceived entrepreneurial obstacles. In: Reynolds P (Ed), Frontiers ofEntrepreneurshipResearch.CenterforEntrepreneurialStudies,BabsonCollege:BabsonPark;1998.p.48-49.
Groh AP, Liechtenstein H. How attractive is Central Eastern Europe for risk capital investors? Journal ofInternationalMoneyandFinance2009;28;625–647.
GrohAP,LiechtensteinH,LieserK.TheEuropeanVentureCapitalandPrivateEquityCountryAttractivenessIndices.JournalofCorporateFinance2010;16;2;205-224.
Groh AP, Liechtenstein H. International allocation determinants of institutional investments in venturecapital and private equity limited partnerships. International Journal of Banking, Accounting and Finance2011;3;2–3;176-206.
Groh,AP,Liechtenstein,H.Thefirststepofthecapitalflowfrominstitutionstoentrepreneurs:Thecriteriaforsortingventurecapitalfunds,EuropeanJournalofFinancialManagement2011;17;3;532-559.
Jeng LA, Wells PhC. The determinants of venture capital funding: evidence across countries. Journal ofCorporateFinance2000;6;3;241-289.
JensenMC.Eclipseofthepubliccorporation.HarvardBusinessReview1989;67;61–74.
JohnsonSH,McMillanJ,WoodruffCM.Propertyrights,financeandentrepreneurship.SSRNWorkingPaper198409;1999.
KaplanSN,SchoarA.Privateequityperformance:Returns,persistence,andcapitalflows.JournalofFinance2005;60;4;1791-1823.
KnackS,KeeferP.Institutionsandeconomicperformance:Cross-countrytestsusingalternativeinstitutionalmeasures.EconomicsandPolitics1995;7;3;207-228.
Kortum S, Lerner J. Assessing the contribution of venture capital to innovation. Rand Journal Economics2000;31;4;674-692.
La Porta R, Lopez-de-Silanes F, Shleifer A, Vishny R. Legal determinants of external finance. Journal ofFinance1997;52;3;1131-1150.
LaPortaR,Lopez-de-SilanesF,ShleiferA,VishnyR.Lawandfinance.JournalofPoliticalEconomy1998;106;6;1113-1155.
LaPortaR,Lopez-de-SilanesF,ShleiferA,VishnyR.InvestorProtectionandCorporateValuation.JournalofFinance2002;57;3;1147-1170.
LazearEP.Jobsecurityprovisionsandemployment.QuarterlyJournalofEconomics1990;105;699-726.

42
Lee SM, Peterson SJ. Culture, entrepreneurial orientation and global competitiveness. Journal of WorldBusiness2000;35;4;401-416.
LernerJ,HardymonF,LeamonA.Venturecapitalandprivateequity:Acasebook.Wiley;2005.
LernerJ,SchoarA.Doeslegalenforcementaffectfinancialtransactions?Thecontractualchannelinprivateequity.QuarterlyJournalofEconomics2005;120;1;223-246.
LopezdeSilanesF,PhalippouL,GottschalgO.Giantsatthegate:Diseconomiesofscales inprivateequity;JournalofFinancialandQuantitativeAnalysis,forthcoming,2015.
MauroP.Corruptionandgrowth.QuarterlyJournalofEconomics1995;110;681–712.
MegginsonW.Towardaglobalmodelofventurecapital?JournalofAppliedCorporateFinance2004;16;1;89-107.
Phalippou L. The hazards of using IRR to measure performance: The case of private equity. Journal ofPerformanceMeasurement2008.Fallissue.
Poterba J. Venture Capital and capital gains taxation. In: Summers L (Ed), Tax policy and the economy.Cambridge;1989.p.47-67.
RoeM.Politicaldeterminantsofcorporategovernance.Oxford;2006.
RomainA,vanPottelsberghede laPotterieB.Thedeterminantsofventurecapital:Apanelanalysisof16OECDcountries.UniversitéLibredeBruxellesWorkingPaperWP-CEB04/015;2004.
Schertler A. Driving forces of venture capital investments in Europe: A dynamic panel data analysis.EuropeanIntegration,FinancialSystemsandCorporatePerformance(EIFC)WorkingPaperNo.03-27,UnitedNationsUniversity;2003.
Svensson J. Investment, property rights andpolitical instability: Theory andevidence. EuropeanEconomicReview;1998;42;7;1317-1341.
Swensen,Takahashi,Sullivan,Forman,Alexander.PrivateEquity–PortfolioReview;1999;7October,p.5.
WilkenPH.Entrepreneurship:Acomparativeandhistoricalstudy.Norwood;1979.

43
Thisreportpresentstheresultsofacomprehensiveresearchprojectonhowtomeasuretheattractivenessofacountryforequitycapitalinvestors.Designedtobeanindexproducedannually, it isadynamicproduct–an online version that uses the most recent data and allows for country comparisons can be found athttp://blog.iese.edu/vcpeindex/.