Embed Size (px)
Citation preview
RICHARD THOMAS BROOKE
that the prism may be replaced closely enough to itsformer position to apply a constant correction to screwturn readings.
Accuracy of the calibration has been determined fora large number of calibration bands. If these calcula-tions were restricted to sharp bands, the accuracy mightvery well be improved. The Plyler and Peters gratingwork on calibration wavelengths" was not available at
17 E. K. Plyler and C. W. Peters, J. Research Natl. Bur. Stand-ards 45, 462 (1950).
the time these calculations were made. Using this newdata might therefore improve the accuracy, but Plylerand Peters do not list enough calibration points toenable checking the NaCl region; hence the resultshave not been recalculated.
The KBr region has not been included in the presentwork, but the same techniques are applicable to it.
The authors wish to express their thanks to Dr.A. M. Crooker, who supervised and gave invaluableassistance to the project.
JOURNAL OF THE OPTICAL SOCIETY OF AMERICA VOLUME 41, NUMBER 12 DECEMBER, 1951
The Variation of Critical Fusion Frequency with Brightness at Various Retinal Locations*
RIcHARD THOMAS BROOKEtPsychological Laboratory, Colunbia University, New York
(Received August 8, 1951)
The purpose of this experiment is to investigate the variationin critical fusion frequency with brightness for various positionsin the test field.
Critical frequency curves for brightnesses between -3 and +3log millilamberts were determined for a 20 test field of green lightat the fovea and at 100, 200, 30°, and 40° in the periphery. The pro-cedure used allowed an image of a 2-mm circular aperture to befocused in the plane of the pupil. Tests showed that astigmatismdid not influence the data obtained for the peripheral stimuli.
The curve of log critical frequency against log brightness forfoveal observation does not show an inflection in its rise to amaximum. The curves for peripheral observations rise to a plateauat low brightnesses, dip at medium to low brightnesses, and riseagain to a maximum, thus giving the conventional "cone" curveat high brightnesses. The maximum is lower and lower for loca-tions increasingly distant from the fovea.
HE Duplicity Theory states that the human retina1contains two kinds of photoreceptors, rods, and
cones,' and that the respective classes of receptor ex-hibit different functional relations to the same con-trolling variables.2
In most modern studies of visual functions whichcomprehensively cover the operating range of brightnessesfor the retina, the data can be plotted so that two curvesmay describe the function.' The curves fitting lowbrightness data are usually referred to as "rod curves,"and those fitting high brightness data as "cone curves."Such designations may lead one to infer that the shapeand position of each curve is determined by the activity
* This account was prepared under Project NR 142-404; Con-tract N6 onr-271, Task Order IX, between Columbia Universityand the ONR, U. S. Navy. Reproduction in whole or in partpermitted for any purpose of the United States Government.
t Now with Richardson, Bellows, Henry and Company, NewYork.
1 S. L. Polyak, The Retina (University of Chicago Press, Chi-cago, 1941).
2 J. v. Kries, Z. Psychol. Physiol. Sinnes. 9, 81 (1896); Hand-buch norm. pathol. Physiol. 12, 678 (1929).
3 S. Hecht, Physiol. Revs. 17, 239 (1937).
Data on color thresholds indicate that rods probably maketheir contributions to the initial part of the "cone" branch.
Comparison of data for green and white central fields showsthat these colors give data that superimpose for equivalent fovealstimulation. For peripheral stimulation a slight shift of the curvefor green (with respect to the curve for white) seems to occur inthe direction of lower brightnesses. The latter effect is interpretedto be a Purkinje shift.
The Purkinje shift is greatly emphasized when orange and greenperipheral fields are used. Green light, matched foveally withorange light, is more effective than orange in providing peripheralflicker.
The data are interpreted to mean that rods function and in-teract with cones at levels of brightness that are often consideredto be photopic.
of only one kind of receptor. The activity of the otherkind of receptor in this range of data is usually notspeculated upon. (In this connection, however, seeCrozier and Wolf,4 Walters and Wright,' and Rigg,Berry, and Wayner.6 )
It is the purpose of this report to study the char-acteristics of the "cone" and "rod" branches of thecurves that ensue when critical fusion frequency offlicker is examined as a function of brightness. (Refer-ences to early work in the area as well as new data areprovided in several articles by Hecht and his co-workers.7 ) In particular, critical fusion frequency isexamined as a function of brightness for five retinalpositions: a circular area, 2 degrees in diameter, cen-
4 W. J. Crozier and E. Wolf, J. Gen. Physiol. 25, 369 (1942).5 H. V. Walters and W. D. Wright, Proc. Roy. Soc. (London)
(B) 131, 340 (1943).6 Riggs, Berry, and Wayner, J. Opt. Soc. Am. 39, 427 (1949).7 S. Hecht and C. D. Verrijp, J. Gen. Physiol. 17, 251 (1933).
S. Hecht and C. D. Verrijp, Proc. Natl. Acad. Sci. 19, 522 (1933).Hecht, Shlaer, and Smith, Cold Spring Harbor Symposia onQuant. Biol. 3, 237 (1935). S. Hecht and S. Shlaer, J. Gen. Physiol,19, 965 (1936),
1010 Vol. 41
VARIATION IN CRITICAL FUSION FREQUENCY
tered at visual angles of, respectively, 0, 10, 20, 30, and40 degrees from the center of the retina, provides theintermittent stimulation. In another experiment, criticalfusion frequency is examined as a function of brightnessfor orange and green light at 0 and 20 degrees from thefovea. Aalysis of the data indicates that the rodsprobably contribute to fusion frequency at high bright-ness levels.
APPARATUS
Stimulus
The subject was presented with a circular field 2°in diameter to be viewed monocularly. In addition tocentral fixation of the stimulus, circular fixation points0.50 in diameter were provided for observation atangles centering at 10°, 20°, 30°, and 400 in theperiphery.
Light Source
The light source is a 100-watt concentrated-filamentMazda projection lamp, operated on 110 volts dc. Thelamp is housed in an asbestos cylinder with a circularaperture through which the illumination enters theoptical system, which is enclosed in brass tubingblackened on the inside. The apparatus is diagrammedin Fig. 1A.
Optical System
Through an opening at the end of the tubing thelight passes first through a color filter, a disk of opalglass, and a field stop 0.492 cm in diameter, placedtogether in that order. A brass disk with a 2-mm aper-ture is situated in the light path 12.5 cm from the fieldstop. The aperture serves as an artificial pupil, as willbe explained below. The light next passes through alens (lens 1) of 12.5 cm focal length, placed at focaldistance from the artificial-pupil aperture. The fieldlens (lens 2), of 16.2 cm focal length, is 25 cm from lens
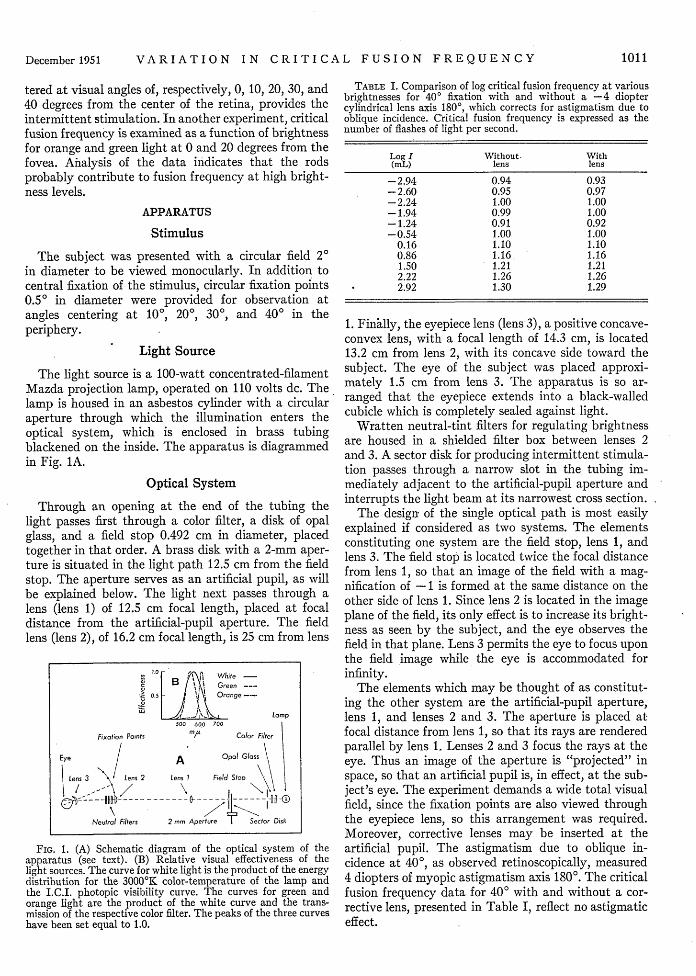
FIG. 1. (A) Schematic diagram of the optical system of theapparatus (see text). (B) Relative visual effectiveness of thelight sources. The curve for white light is the product of the energydistribution for the 3000'K color-temperature of the lamp andthe I.C.I. photopic visibility curve. The curves for green andorange light are the product of the white curve and the trans-mission of the respective color filter. The peaks of the three curveshave been set equal to 1.0.
TABLE I. Comparison of log critical fusion frequency at variousbrightnesses for 40' fixation with and without a -4 dioptercylindrical lens axis 1800, which corrects for astigmatism due tooblique incidence. Critical fusion frequency is expressed as thenumber of flashes of light per second.
Log I Without. With(mL) lens lens
-2.94 0.94 0.93-2.60 0.95 0.97-2.24 1.00 1.00-1.94 0.99 1.00-1.24 0.91 0.92-0.54 1.00 1.00
0.16 1.10 1.100.86 1.16 1.161.50 1.21 1.212.22 1.26 1.262.92 1.30 1.29
1. Finally, the eyepiece lens (lens 3), a positive concave-convex lens, with a focal length of 14.3 cm, is located13.2 cm from lens 2, with its concave side toward thesubject. The eye of the subject was placed approxi-mately 1.5 cm from lens 3. The apparatus is so ar-ranged that the eyepiece extends into a black-walledcubicle which is completely sealed against light.
Wratten neutral-tint filters for regulating brightnessare housed in a shielded filter box between lenses 2and 3. A sector disk for producing intermittent stimula-tion passes through a narrow slot in the tubing im-mediately adjacent to the artificial-pupil aperture andinterrupts the light beam at its narrowest cross section.
The design of the single optical path is most easilyexplained if considered as two systems. The elementsconstituting one system are the field stop, lens 1, andlens 3. The field stop is located twice the focal distancefrom lens 1, so that an image of the field with a mag-nification of -1 is formed at the same distance on theother side of lens 1. Since lens 2 is located in the imageplane of the field, its only effect is to increase its bright-ness as seen by the subject, and the eye observes thefield in that plane. Lens 3 permits the eye to focus uponthe field image while the eye is accommodated forinfinity.
The elements which may be thought of as constitut-ing the other system are the artificial-pupil aperture,lens 1, and lenses 2 and 3. The aperture is placed atfocal distance from lens 1, so that its rays are renderedparallel by lens 1. Lenses 2 and 3 focus the rays at theeye. Thus an image of the aperture is "projected" inspace, so that an artificial pupil is, in effect, at the sub-ject's eye. The experiment demands a wide total visualfield, since the fixation points are also viewed throughthe eyepiece lens, so this arrangement was required.Moreover, corrective lenses may be inserted at theartificial pupil. The astigmatism due to oblique in-cidence at 40°, as observed retinoscopically, measured4 diopters of myopic astigmatism axis 1800. The criticalfusion frequency data for 40° with and without a cor-rective lens, presented in Table I, reflect no astigmaticeffect.
B White -B~~~~~
0.5 On
J\..\ ~Lamp500 600 700
Fixation Pints nyu Color Filter
Eye A Opal Gloss\
Lens 3 Lens 2 Len I Field Stop
-D -- - -- - - l- - -- - --
Neutral Filters 2 mm Aperture Sector Disk
1011December 1951
RICHARD THOMAS BROOKE
TABLE II. Critical fusion frequency data for each subject atfive retinal locations with a green test field 2 in diameter. Thedata are in log critical fusion frequency units. EGG and DEPrefer to individual subjects.
Log I 00 100 200(mL) EHG DEP EHG DEP EHG DEP
-2.94 0.96 1.04 1.04 0.99-2.60 1.00 1.09 1.08 1.04-2.24 1.02 1.12 1.12 1.14-1.94 1.05 1.16 1.14 1.18-1.60 1.08 1.13 1.15 1.18-1.24 0.91 1.00 1.05 1.13 1.06 1.12-0.88 1.01 1.08 1.05 1.11 1.05 1.10-0.54 1.09 1.16 1.12 1.15 1.10 1.13-0.18 1.19 1.27 1.15 1.15 1.13 1.17
0.16 1.26 1.34 1.21 1.19 1.20 1.200.50 1.35 1.40 1.22 1.27 1.24 1.220.86 1.42 1.45 1.30 1.31 1.26 1.261.16 1.49 1.50 1.34 1.36 1.30 1.301.50 1.54 1.56 1.39 1.43 1.32 1.371.86 1.59 1.60 1.47 1.48 1.36 1.402.22 1.63 1.62 1.52 1.54 1.42 1.462.56 1.66 1.65 1.56 1.58 1.45 1.512.92 1.69 1.68 1.58 1.61 1.49 1.55
Log I 300 400(mL) EHG DEP EHG DEP
-2.94 1.06 0.99 1.06 0.98-2.60 1.07 1.01 1.07 1.02-2.24 1.07 1.05 1.09 1.06-1.94 1.08 1.10 1.09 1.07-1.60 1.05 1.09 1.09 1.08-1.24 1.03 1.03 1.06 1.07
0.88 1.06 1.04 1.10 1.11-0.54 1.09 1.11 1.12 1.11-0.18 1.12 1.15 1.14 1.13
0.16 1.15 1.18 1.19 1.190.50 1.18 1.23 1.21 1.220.86 1.20 1.26 1.22 1.241.16 1.21 1.29 1.24 1.241.50 1.23 1.30 1.26 1.261.86 1.30 1.30 1.26 1.292.22 1.35 1.34 1.29 1.302.56 1.39 1.39 1.32 1.322.92 1.41 1.43 1.33 1.35
When corrective lenses are not used, the field stopmay be placed at lens 2 without changing the size ofthe stimulus area or effectively altering the opticalsystem. It was so placed during the main experiment.
Fixation Points
The eyepiece lens (lens 3) is oriented on its verticalaxis in such a way that a line at the center of the lensperpendicular to its frontal plane would form an angleof 250 with a line drawn to the center of the stimuluspatch. This orientation and the meniscus form of lens 3help minimize astigmatism for the wide range offixations.
Fixation is to the subject's left. The fixation pointsare horizontally spaced 2.4 cm apart on an arc of acircle that has lens 3 as its center and passes throughlens 2, the field lens. The fixation points are apertures,0.118 cm in diameter, in the curved wall of the brasshousing extending out from the tubing of the principallight path. The apertures are illuminated from outsideby a detachable source which is plugged onto a sleeve
surrounding the opening. The sleeves of the fixationapertures not being used are plugged with rubberstoppers. The detachable light unit consists of a 6-voltradio-dial lamp behind a piece of translucent whiteplastic and a green filter of the same kind as that usedwith the stimulus light. The subject maintained thefixation point brightness at a minimum visible level bya radio volume-control potentiometer. The experi-menter plugged the unit onto the sleeve of the fixationpoint to be used throughout each experimental session.
- Frequency Control
The sector disk is a black aluminum wheel from whichtwo 90° segments have been removed. Its axis of rota-tion is parallel to the stimulus light path. The sectordisk is actuated by a Singer sewing-machine motor, theaxle of which is also connected by a universal joint to aWeston tachometer. The voltage generated by thetachometer is read from a Weston dc voltmeter. Theexperimenter controls the frequency of flicker by meansof a General Radio Company variac connected in serieswith the motor.
Calibration
The color temperature of the source together withthe opal glass was measured with an Eastman color-temperature meter and found to be 3000'K. The rela-tive source energy, wavelength by wavelength, wasthen read from tables.8 The spectral transmissions of ofthe two color filters used in the experiment were meas-ured on a Beckman spectrophotometer. The data forthe relative visible energy for the filters, when usedwith this light source, are given in Fig. B. Theyrepresent the product of source energy, filter trans-mission, and the I.C.I. photopic visibility curve.' Thedata are adjusted to make the peak for each filterequal to 1.000.
The brightness of the uninterrupted source was de-termined by comparison with a binocular standard,the brightness of which was measured by a Macbethilluminometer. The brightness was found to be 6900millilamberts without a color filter, and 830 milli-lamberts with the green filter in place.
The relation of the voltage output of the tachometerto the rate of interruption of stimulation by the sectordisk was empirically determined with a strobotac tobe 5.6 flash cycles per volt.
PROCEDURE
Two experienced observers participated in the ex-periment, making judgments with the left eye. Beforeeach experimental session the subject set the chin- andhead-rests which were used to locate and stabilize the
8 R. Davis and K. S. Gibson, Misc. Publications, Bur. Stand-ards No. 114 (U. S. Gov. Printing Office, Washington, 1931), P. 22.
9 Handbook of Chemistry and Physics (Chemical Rubber Pub-lishing Company, Cleveland, 1941), 25th edition, p. 2155.
1012 Vol. 41
VARIATION IN CRITICAL FUSION FREQUENCY
position of the subject's eye. The subject was thengiven 30 minutes of dark adaptation, after which heincreased the brightness of the fixation point (whichhad been set at a minimum) until it was just per-ceptible.
The experimenter set the sector disk to produce afrequency of flicker above fusion, and then illuminatedthe test field at the lowest visible level of brightness.He slowly decreased the frequency of interruption untilthe subject reported that the test field was flickering.The frequency was then decreased well below thatpoint and was slowly increased until the subject re-ported fusion. The subject responded by pressing abuzzer for either change in the test field. Eight judg-ments were made, alternately decreasing and increasingthe frequency. The first two readings in each set ofeight were regarded as practice settings and were notincluded in the average critical fusion frequency for thatbrightness.
Before proceeding to the- next brightness level, thetest field was extinguished and the frequency increased.For peripheral fixation 18 brightness levels were usedcovering the range from -3 to +3 log millilamberts insteps of approximately 3 log millilamberts. In the caseof foveal stimulation only 13 points were obtained, theremaining five brightnesses being below cone threshold.All the points of a critical fusion frequency curve forone retinal location were determined in a single ex-perimental session.
Experimental sessions were between 45 and 60 min-utes long (in addition to the 30 minutes of dark adapta-tion) depending upon the number of brightness levelsinvestigated and the difficulty of observation. For themore peripheral stimulus locations the, subject wasunder greater strain and required more frequent restperiods.
A complete set of data for all retinal locations wasobtained using green light. The subject made judgmentsof the color of fused light at each brightness beforetaking critical fusion frequency readings. Data for the13 highest levels of brightness were obtained, using nocolor filter, at the fovea and at 200 in the periphery.Finally, data comparing foveal and peripheral observa-tions for green and orange light were taken, the experi-menter alternating fixations and color filters to coverall selected points in a single session.
Light adaptation was provided by the stepwise in-crease in brightness from dim to bright, the time re-quired for color observation, and the time for the twopractice judgments. The agreement between the datacollected during repetition of parts of sessions with 2-and 3-minute periods of light adaptation indicatedthat light adaptation was adequately controlled. Asa final check, the subject was given 30 minutes of darkadaptation and exposed to the maximum brightness.Continuous readings showed no change in critical fusionfrequency for the period between 1 minute and 15minutes of light adaptation.
RESULTS
Critical Frequency for Green Lights at VariousRetinal Positions
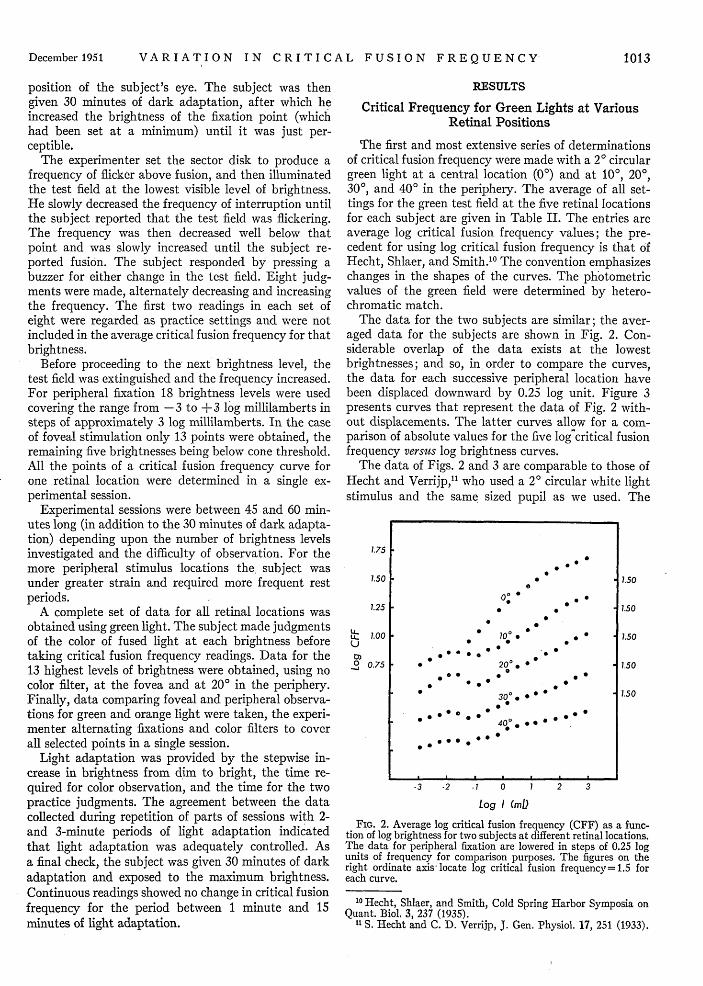
The first and most extensive series of determinationsof critical fusion frequency were made with a 2° circulargreen light at a central location (00) and at 10°, 200,30°, and 40° in the periphery. The average of all set-tings for the green test field at the five retinal locationsfor each subject are given in Table II. The entries areaverage log critical fusion frequency values; the pre-cedent for using log critical fusion frequency is that ofHecht, Shlaer, and Smith."0 The convention emphasizeschanges in the shapes of the curves. The photometricvalues of the green field were determined by hetero-chromatic match.
The data for the two subjects are similar; the aver-aged data for the subjects are shown in Fig. 2. Con-siderable overlap of the data exists at the lowestbrightnesses; and so, in order to compare the curves,the data for each successive peripheral location havebeen displaced downward by 0.25 log unit. Figure 3presents curves that represent the data of Fig. 2 with-out displacements. The latter curves allow for a com-parison of absolute values for the five log critical fusionfrequency versus log brightness curves.
The data of Figs. 2 and 3 are comparable to those ofHecht and Verrijp,11 who used a 2 circular white lightstimulus and the same sized pupil as we used. The
1.75
1.50
7.25 I
t-U-
0
1.00 I
0.75
-3 -2 -1 0 7 2 3
1.50
1.50
1.50
1.50
1.50
Log I (mL)
FIG. 2. Average log critical fusion frequency (CFF) as a func-tion of log brightness for two subjects at different retinal locations.The data for peripheral fixation are lowered in steps of 0.25 logunits of frequency for comparison purposes. The figures on theright ordinate axis' locate log critical fusion frequency= 1.5 foreach curve.
lo Hecht, Shlaer, and Smith, Cold Spring Harbor Symposia onQuant. Biol. 3, 237 (1935).
"1 S. Hecht and C. D. Verrijp, J. Gen. Physiol. 17, 251 (1933).
..- 2* .20QO **
* * 2~0° 00
30
.* * e * *; *'O.. O- *@
December 1951 1013
RICHARD THOMAS BROOKE
1.75 3.
1.50 -
I.U,
0
1.25
1.00
0.75
-3 -2 -1 0
Log I (mDl
7 2 3
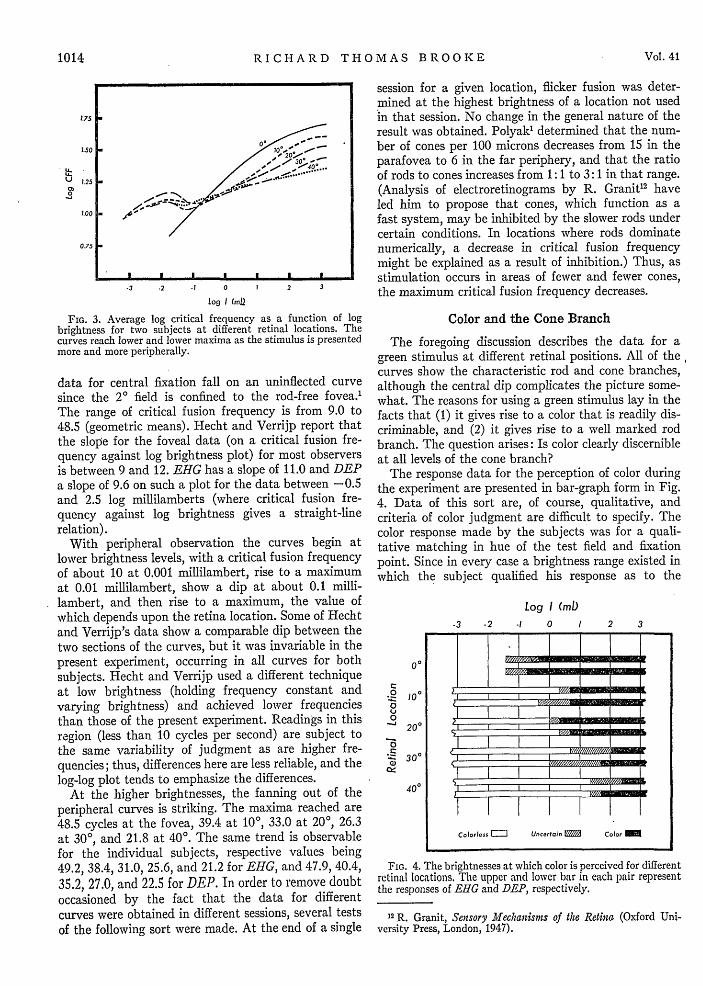
FIG. 3. Average log critical frequency as a function of logbrightness for two subjects at different retinal locations. Thecurves reach lower and lower maxima as the stimulus is presentedmore and more peripherally.
data for central fixation fall on an uninflected curvesince the 20 field is confined to the rod-free fovea.'The range of critical fusion frequency is from 9.0 to48.5 (geometric means). Hecht and Verrijp report thatthe slope for the foveal data (on a critical fusion fre-quency against log brightness plot) for most observersis between 9 and 12. EHG has a slope of 11.0 and DEPa slope of 9.6 on such a plot for the data between -0.5and 2.5 log millilamberts (where critical fusion fre-quency against log brightness gives a straight-linerelation).
With peripheral observation the curves begin atlower brightness levels, with a critical fusion frequencyof about 10 at 0.001 millilambert, rise to a maximumat 0.01 millilambert, show a dip at about 0.1 milli-lambert, and then rise to a maximum, the value ofwhich depends upon the retina location. Some of Hechtand Verrijp's data show a comparable dip between thetwo sections of the curves, but it was invariable in thepresent experiment, occurring in all curves for bothsubjects. Hecht and Verrijp used a different techniqueat low brightness (holding frequency constant andvarying brightness) and achieved lower frequenciesthan those of the present experiment. Readings in thisregion (less than 10 cycles per second) are subject tothe same variability of judgment as are higher fre-quencies; thus, differences here are less reliable, and thelog-log plot tends to emphasize the differences.
At the higher brightnesses, the fanning out of theperipheral curves is striking. The maxima reached are48.5 cycles at the fovea, 39.4 at 100, 33.0 at 20°, 26.3at 30°, and 21.8 at 40°. The same trend is observablefbr the individual subjects, respective values being49.2, 38.4, 31.0, 25.6, and 21.2 for EHG, and 47.9, 40.4,35.2, 27.0, and 22.5 for DEP. In order to remove doubtoccasioned by the fact that the data for differentcurves were obtained in different sessions, several testsof the following sort were made. At the end of a single
session for a given location, flicker fusion was deter-mined at the highest brightness of a location not usedin that session. No change in the general nature of theresult was obtained. Polyak' determined that the num-ber of cones per 100 microns decreases from 15 in theparafovea to 6 in the far periphery, and that the ratioof rods to cones increases from 1: 1 to 3: 1 in that range.(Analysis of electroretinograms by R. Granit' 2 haveled him to propose that cones, which function as afast system, may be inhibited by the slower rods undercertain conditions. In locations where rods dominatenumerically, a decrease in critical fusion frequencymight be explained as a result of inhibition.) Thus, asstimulation occurs in areas of fewer and fewer cones,the maximum critical fusion frequency decreases.
Color and the Cone Branch
The foregoing discussion describes the data for agreen stimulus at different retinal positions. All of thecurves show the characteristic rod and cone branches,although the central dip complicates the picture some-what. The reasons for using a green stimulus lay in thefacts that (1) it gives rise to a color that is readily dis-criminable, and (2) it gives rise to a well marked rodbranch. The question arises: Is color clearly discernibleat all levels of the cone branch?
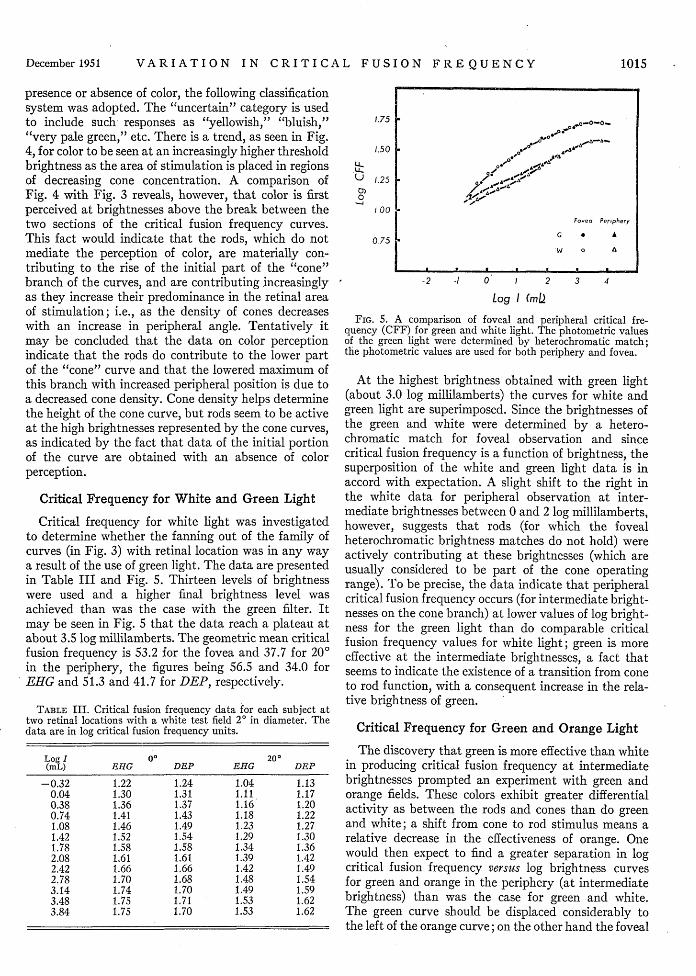
The response data for the perception of color duringthe experiment are presented in bar-graph form in Fig.4. Data of this sort are, of course, qualitative, andcriteria of color judgment are difficult to specify. Thecolor response made by the subjects was for a quali-tative matching in hue of the test field and fixationpoint. Since in every case a brightness range existed inwhich the subject qualified his response as to the
Log I (mD
C20
0
a)
20°
3Q0
400
-3 -2 -I 0 1 2 3
FIG. 4. The brightnesses at which color is perceived for differentretinal locations. The upper and lower bar in each pair representthe responses of EIG and DEP, respectively.
12 R. Granit, Sensory Meclianisins of the Retina (Oxford Uni-versity Press, London, 1947).
I I I I I I I
~~I I I~i3 IE I
E~~ I
a: I I Iu
I I |t\_
Ij I I I 1 " -
ClresI I Un tIn Fu Clo
, , .. _
_
1014 Vol. 41
VARIATION IN CRITICAL FUSION FREQUENCY
presence or absence of color, the following classificationsystem was adopted. The "uncertain" category is usedto include such responses as "yellowish," "bluish,""very pale green," etc. There is a trend, as seen in Fig.4, for color to be seen at an increasingly higher thresholdbrightness as the area of stimulation is placed in regionsof decreasing cone concentration. A comparison ofFig. 4 with Fig. 3 reveals, however, that color is firstperceived at brightnesses above the break between thetwo sections of the critical fusion frequency curves.This fact would indicate that the rods, which do notmediate the perception of color, are materially con-tributing to the rise of the initial part of the "cone"branch of the curves, and are contributing increasinglyas they increase their predominance in the retinal areaof stimulation; i.e., as the density of cones decreaseswith an increase in peripheral angle. Tentatively itmay be concluded that the data on color perceptionindicate that the rods do contribute to the lower partof the "cone" curve and that the lowered maximum ofthis branch with increased peripheral position is due toa decreased cone density. Cone density helps determinethe height of the cone curve, but rods seem to be activeat the high brightnesses represented by the cone curves,as indicated by the fact that data of the initial portionof the curve are obtained with an absence of colorperception.
Critical Frequency for White and Green Light
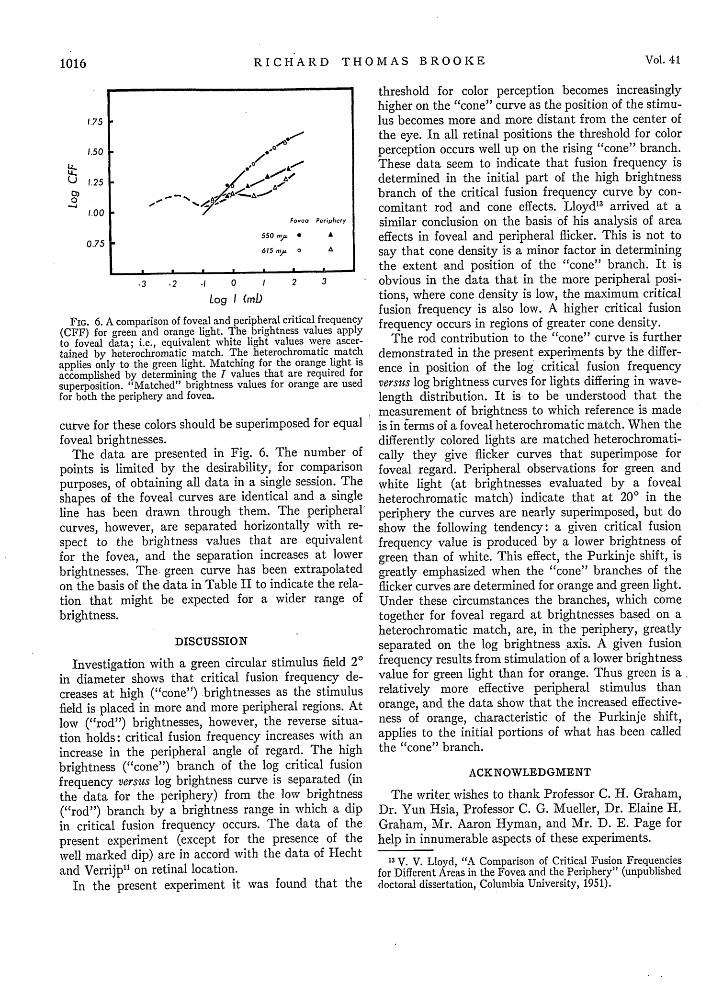
Critical frequency for white light was investigatedto determine whether the fanning out of the family ofcurves (in Fig. 3) with retinal location was in any waya result of the use of green light. The data are presentedin Table III and Fig. 5. Thirteen levels of brightnesswere used and a higher final brightness level wasachieved than was the case with the green filter. Itmay be seen in Fig. 5 that the data reach a plateau atabout 3.5 log millilamberts. The geometric mean criticalfusion frequency is 53.2 for the fovea and 37.7 for 200in the periphery, the figures being 56.5 and 34.0 forEIHG and 51.3 and 41.7 for DEP, respectively.
TABLE III. Critical fusion frequency data for each subject attwo retinal locations with a white test field 2 in diameter. Thedata are in log critical fusion frequency units.
Log I 00 200(mL) EHG DEP EHG DEP
-0.32 1.22 1.24 1.04 1.130.04 1.30 1.31 1.11 1.170.38 1.36 1.37 1.16 1.200.74 1.41 1.43 1.18 1.221.08 1.46 1.49 1.23 1.271.42 1.52 1.54 1.29 1.301.78 1.58 1.58 1.34 1.362.08 1.61 1.61 1.39 1.422.42 1.66 1.66 1.42 1.492.78 1.70 1.68 1.48 1.543.14 1.74 1.70 1.49 1.593.48 1.75 1.71 1.53 1.623.84 1.75 1.70 1.53 1.62
f.75
1.50
LL_.LLU
0)0S
1.25
I 00
0.75
-2 -I 0 / 2
Log I (ma3 4
FIG. 5. A comparison of foveal and peripheral critical fre-quency (CFF) for green and white light. The photometric valuesof the green light were determined by heterochromatic match;the photometric values are used for both periphery and fovea.
At the highest brightness obtained with green light(about 3.0 log millilamberts) the curves for white andgreen light are superimposed. Since the brightnesses ofthe green and white were determined by a hetero-chromatic match for foveal observation and sincecritical fusion frequency is a function of brightness, thesuperposition of the white and green light data is inaccord with expectation. A slight shift to the right inthe white data for peripheral observation at inter-mediate brightnesses between 0 and 2 log millilamberts,however, suggests that rods (for which the fovealheterochromatic brightness matches do not hold) wereactively contributing at these brightnesses (which areusually considered to be part of the cone operatingrange). To be precise, the data indicate that peripheralcritical fusion frequency occurs (for intermediate bright-nesses on the cone branch) at lower values of log bright-ness for the green light than do comparable criticalfusion frequency values for white light; green is moreeffective at the intermediate brightnesses, a fact thatseems to indicate the existence of a transition from coneto rod function, with a consequent increase in the rela-tive brightness of green.
Critical Frequency for Green and Orange Light
The discovery that green is more effective than whitein producing critical fusion frequency at intermediatebrightnesses prompted an experiment with green andorange fields. These colors exhibit greater differentialactivity as between the rods and cones than do greenand white; a shift from cone to rod stimulus means arelative decrease in the effectiveness of orange. Onewould then expect to find a greater separation in logcritical fusion frequency versus log brightness curvesfor green and orange in the periphery (at intermediatebrightness) than was the case for green and white.The green curve should be displaced considerably tothe left of the orange curve; on the other hand the foveal
o A
/-o
Fovea Polphery
G 0 A
w 0 a
1015December 1951
RICHARD THOMAS BROOKE
1.75
1.50
U-
U-0)
0
1.25
I.00
0.75
*3 -2 -I 0
Log I (mL
FIG. 6. A comparison of foveal and peripl(CFF) for green and orange light. The brto foveal data; i.e., equivalent white lig]tained by heterochromatic match. The hiapplies only to the green light. Matching Iaccomplished by determining the I valuessuperposition. "Matched" brightness valuefor both the periphery and fovea.
curve for these colors should be supefoveal brightnesses.
The data are presented in Fig.points is limited by the desirabilitpurposes, of obtaining all data in ashapes of the foveal curves are ideiline has been drawn through thercurves, however, are separated hospect to the brightness values thfor the fovea, and the separationbrightnesses. The green curve hason the basis of the data in Table II ttion that might be expected forbrightness.
DISCUSSION
Investigation with a green circulain diameter shows that critical fuscreases at high ("cone") brightnessfield is placed in more and more perlow ("rod") brightnesses, however,tion holds: critical fusion frequencyincrease in the peripheral angle ofbrightness ("cone") branch of thefrequency versus log brightness curvthe data for the periphery) from("rod") branch by a brightness ranin critical fusion frequency occurs.present experiment (except for thiwell marked dip) are in accord withand Verrijp' 1 on retinal location.
In the present experiment it wr
threshold for color perception becomes increasinglyhigher on the "cone" curve as the position of the stimu-lus becomes more and more distant from the center ofthe eye. In all retinal positions the threshold for colorperception occurs well up on the rising "cone" branch.These data seem to indicate that fusion frequency is
a... determined in the initial part of the high brightnessbranch of the critical fusion frequency curve by con-comitant rod and cone effects. Lloyd3 arrived at a
Foea Periphery similar conclusion on the basis of his analysis of area550m,^ * A effects in foveal and peripheral flicker. This is not to615 m, o0 say that cone density is a minor factor in determining
the extent and position of the "cone" branch. It is1 2 3 obvious in the data that in the more peripheral posi-
tions, where cone density is low, the maximum critical.. criticlfreuenc fusion frequency is also low. A higher critical fusion
lightness values apply frequency occurs in regions of greater cone density.,it values were ascer- The rod contribution to the "cone" curve is furthereterochromatic match demonstrated in the present experiments by the differ-for the orange light is that are required for ence i position of the log critical fusion frequencys for orange are used versus log brightness curves for lights differing in wave-
length distribution. It is to be understood that themeasurement of brightness to which reference is made
rimposed for equal is in terms of a foveal heterochromatic match. When thedifferently colored lights are matched heterochromati-
5. The number of cally they give flicker curves that superimpose fory, for comparison foveal regard. Peripheral observations for green andsingle session. The white light (at brightnesses evaluated by a fovealitical and a single heterochromatic match) indicate that at 200 in then. The peripheral' periphery the curves are nearly superimposed, but dorizontally with re- show the following tendency: a given critical fusionat are equivalent frequency value is produced by a lower brightness ofincreases at lower green than of white. This effect, the Purkinje shift, isbeen extrapolated greatly emphasized when the "cone" branches of theo indicate the rela- flicker curves are determined for orange and green light.a wider range of Under these circumstances the branches, which come
together for foveal regard at brightnesses based on aheterochromatic match, are, in the periphery, greatlyseparated on the log brightness axis. A given fusion
r stimulus field 20 frequency results from stimulation of a lower brightness
iion frequency de- value for green light than for orange. Thus green is a
es as the stimulus relatively more effective peripheral stimulus than
ipheral regions. At orange, and the data show that the increased effective-the reverse situa- ness of orange, characteristic of the Purkinje shift,
increases with an applies to the initial portions of what has been calledregard. The high the "cone" branch.
log critical fusion'e is separated (in ACKNOWLEDGMENT
the low brightness The writer wishes to thank Professor C. H. Graham,.ge in which a dip Dr. Yun Hsia, Professor C. G. Mueller, Dr. Elaine H.The data of the Graham, Mr. Aaron Hyman, and Mr. D. E. Page for
a presence of the help in innumerable aspects of these experiments.Ethe data of Hecht
13 V. V. Lloyd, "A Comparison of Critical Fusion Frequencies
for Different Areas in the Fovea and the Periphery" (unpublishedis found that the doctoral dissertation, Columbia University, 1951).
-- - N~I "I
Vol. 411016