Embed Size (px)
Citation preview
The Variation in the Silicate Content of the Water in Monterey Bay, California, during 1932,1933, and 1934Author(s): Austin PhelpsSource: Transactions of the American Philosophical Society, New Series, Vol. 29, No. 2 (Mar.,1938), pp. 153-188Published by: American Philosophical SocietyStable URL: http://www.jstor.org/stable/1005528 .
Accessed: 25/06/2014 05:17
Your use of the JSTOR archive indicates your acceptance of the Terms & Conditions of Use, available at .http://www.jstor.org/page/info/about/policies/terms.jsp
.JSTOR is a not-for-profit service that helps scholars, researchers, and students discover, use, and build upon a wide range ofcontent in a trusted digital archive. We use information technology and tools to increase productivity and facilitate new formsof scholarship. For more information about JSTOR, please contact [email protected].
.
American Philosophical Society is collaborating with JSTOR to digitize, preserve and extend access toTransactions of the American Philosophical Society.
http://www.jstor.org
This content downloaded from 194.29.185.145 on Wed, 25 Jun 2014 05:17:17 AMAll use subject to JSTOR Terms and Conditions
THE VARIATION IN THE SILICATE CONTENT OF THE WATER IN MONTEREY BAY, CALIFORNIA, DURING 1932, 1933, AND 1934
BY AUSTIN PHELPS
HOPKINS MARINE STATION, PACIFIC GROVE, CALIF.
INTRODUCTION
The present paper deals with a portion of the results of the chemical investigations of the waters of Monterey Bay, California, obtained by the Hydrobiological Survey during the years 1932, 1933, and 1934. The Hydrobiological Survey is a joint project of the California Department of Natural Resources, Division of Fish and Game, and of Stanford University. It was originated at the initiative of Professor Tage Skogsberg of the Hopkins Marine Station of Stanford University, and has been operated under his direction since 1928. A full account of the history and aims of the Survey is to be found elsewhere (Skogs- berg, '36).
The chemical investigations of the Survey commenced in 1929, when Miss Lucina
Stanford, after spending some time at the Scripps Institution of Oceanography, began an
analysis of sea water collected at a number of stations in Monterey Bay, at which tempera- ture readings were also taken. In 1931 the direction of the chemical investigations was taken over by Dr. Danella Cope, who studied the methods employed and made a few alterations in them. From 1932 to 1935 the analysis of sea water has been entirely in the hands of one of the laboratory's technicians, Miss Pearl Murray. The present writer became associated with the Hydrobiological Survey at the end of 1934, and accordingly has
played no part in the collection of any of the original data which are reported in this paper. His sole role has been to tabulate, interpret, and report on the data previously obtained.
Acknowledgment should be made to the following persons who have been responsible for the collection of the data: Professor Tage Skogsberg, who not only conceived of and directed the work, but also took a major part in the actual collection of water samples; Dr. Rolf Bolin, also of the Hopkins Marine Station, who assisted in the handling of the water
bottles, often under the most trying conditions; to the crew of the California Fish and Game Patrol Launch, "Albacore," and especially to Captain Lars Weseth for his unfailingly cheerful and efficient cooperation; and to Miss Pearl Murray, who, for the three years comprising this report, conducted the chemical analyses with unvarying conscienciousness. We are also indebted to the Scripps Institution of Oceanography for providing the outline of methods of water analysis which have been largely followed in this work. The author wishes to thank Professor Tage Skogsberg for many helpful suggestions in regard to the arrangement of the material, and for a critical study of the manuscript; he also wishes to thank Professor Frank W. Weymouth for suggestions concerning the statistical treatment of the data, and to Mr. Herbert W. Graham for reading and correcting the manuscript.
153
This content downloaded from 194.29.185.145 on Wed, 25 Jun 2014 05:17:17 AMAll use subject to JSTOR Terms and Conditions
154 TRANSACTIONS OF THE AMERICAN PHILOSOPHICAL SOCIETY
MATERIALS AND METHODS
All data to be reported were obtained from Station "C," which is located in Long. 122? 01' W., and Lat. 36? 44' N., seven miles NNW. of Point Pinos Lighthouse. The reason for the choice of this particular station from which to collect chemical data lay in the fact that Station "C" lies on the intersection of a line going straight across the mouth of the bay and a ine following the deep submarine valley which bisects the bay. It was felt that this station combined the advantages of possessing water which was as represen- tative of the bay as a whole as could be found at any one station; also of permitting obser- vations to be made as deep as 900 meters; and finally of constituting the best position from which to observe the upwelling of deep water which so fundamentally influences the hydrography of Monterey Bay.
Water samples during 1932 were collected once a week from the launch "Albacore" at 10 meter intervals from the surface to 100 meters, at 50 meter intervals from 100 meters to 500 meters, and at 100 meter intervals from 500 meters to 900 meters.1 During 1933 and 1934 the collections below 500 meters were made every two weeks. The water samples were brought up in Nansen reversing water bottles. As soon as the water arrived on deck about 100 cc. were used to rinse thoroughly a numbered storage bottle, after which the latter was filled, tightly stoppered, and placed in a covered box. The samples of sea water were taken at about 11 A.M., and were analysed for silicate 24 hours later. The assump- tion was made that the silicate content of the samples did not change appreciably during this period of storage. Citrate of magnesia bottles were used for this purpose. Following their purchase they were leached in the dark for over three months with sea water which was changed every few days during this time. The bottles had been in constant use for over two years before the present work was started, so that it was felt that they had been as thoroughly conditioned as possible. In order to determine whether or not the silicate content changed during the 24 hour storage period, the following experiment was per- formed: Ten pairs of the regular storage bottles were filled with sea water containing varying amounts of silicate from 0.47 to 5.35 mg./liter in such a way that each pair con- tained sea water of an identical concentration of silicate. The water in one of each of the pairs of bottles was tested immediately, and that in the second was tested after 48 hours of storage in the dark. The average increase of silicate due to the storage in the dark was found to be 1.2%. From this experiment it was assumed that the silicate content changed less than 1% during 24 hours of storage.
The colorimetric method of Dienert and Waldenbulke ('23) was employed for the determination of the concentrations of silicate in the sea water samples. Thirty to 50 cc. of the water sample were placed in a 100 cc. volumetric flask, and 2.4 cc. of a mixture con- taining 25% of 7N H2S04 and 75% of 10% ammonium molybdate were added. More of the sample was added to make the total just 100 cc. After 10 minutes the sample was compared with picric acid standards. These latter were made as follows: Commercial
1 All depths mentioned in this paper refer solely to the amount of cable which was let out into the water, as registered by a meter wheel. Owing to the fact that the cable never falls perfectly vertically from the boat, the true depth is slightly less than the depth registered. Whenever the boat drifted considerably owing to wind or heavy weather it was backed into the cable to counteract the drift and keep the cable as nearly vertical as possible. Recent comparisons of protected thermometers with unprotected ones indicate that at 900 meters in the majority of cases the true depth is 0-10 meters less than the observed depth.
This content downloaded from 194.29.185.145 on Wed, 25 Jun 2014 05:17:17 AMAll use subject to JSTOR Terms and Conditions
PHELPS: SILICATE CONTENT OF MONTEREY BAY, CALIFORNIA 155
picric acid was twice recrystallized from distilled water, and then dried in vacuo over fresh concentrated H2SO4 for some time. To 1000 cc. of distilled water was added 0.256 gm. of the dried picric acid, and the resulting solution was held to contain a color equivalent to that produced by 500 mg./liter of Si02. Appropriate dilutions were made in order to obtain a set of 16 permanent color standards, representing 0.2 to 10.0 mg./liter of Si02. The colorimeter employed consisted of two 100 cc. Hehner tubes which stood on a glass plate, and were illuminated by daylight (north exposure) reflected up through them by a frosted glass plate which stood underneath at an angle of 45?. After one tube had been filled with the sample to be tested, the other was filled with the standard which appeared most nearly to match the sample. Liquid was withdrawn by means of the stopcocks from either one tube or the other, until the strength of color appeared to be exactly equal in each case. The amount of Si02 in the sample was then found by a table which was pre- pared in accordance with the proportion:
A 100 X = Y._ B 97.5
where X is the amount of Si02 in the sample, Y the amount of Si02 represented by the standard, and A and B represent the depths of the standard and sample respectively.
In order to determine the relative degree of accuracy of the method of testing, paired samples of sea water were taken as follows: In the course of the regular collection of samples two reversing bottles were placed about one meter apart on the cable, and these were sent down to a given depth, usually 500 meters. The contents of each bottle were then trans- ferred to a storage bottle in the usual way, and brought in with the regular samples; it was assumed that the silicate content was the same in both samples, and hence that a comparison of the observed content of one sample with that of the other would give an index of the accuracy of determination. In order to avoid the personal element, the tech- nician was kept unaware of the purpose of the experiment or of which bottles were pairs. In all, 30 such pairs were sampled over a period of about 6 months. A statistical study of the results showed a standard deviation of 3.4% and a probable error of 2.1% in the determinations.
RESULTS
The results of the present study will be presented under the following headings: General Observations on the Silicate Content; Month by Month Descriptions of the Silicate Content; The Annual Cycle; The Gradient of Silicate; A Correlation Between the Tem- perature Variation and the Silicate Variation in the Annual Cycle.
GENERAL OBSERVATIONS ON THE SILICATE CONTENT
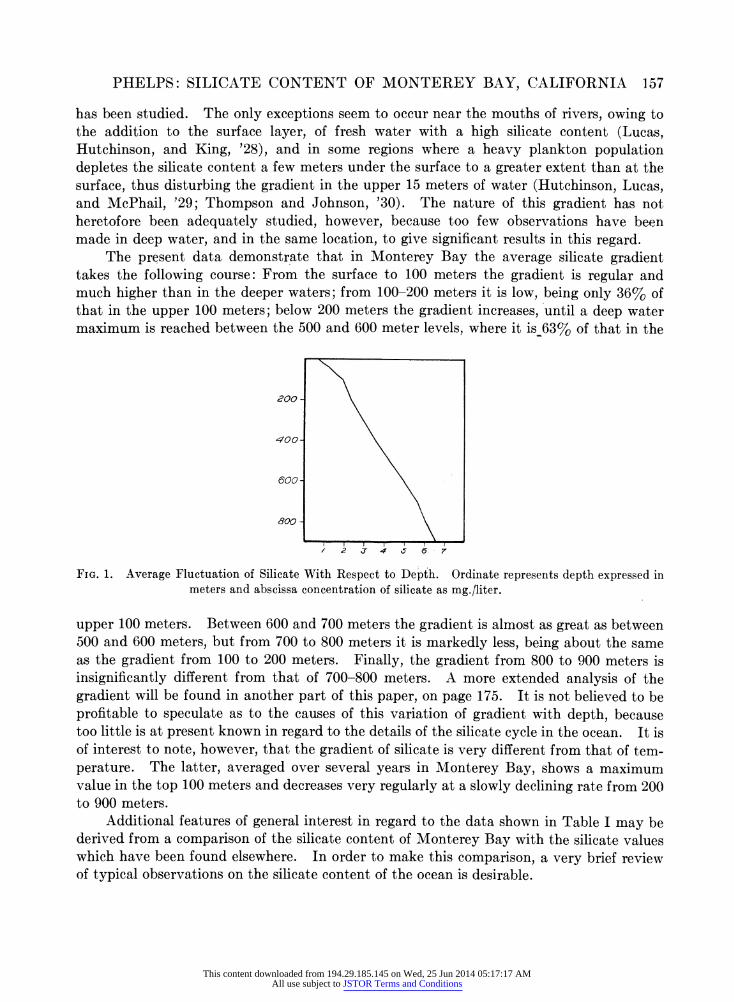
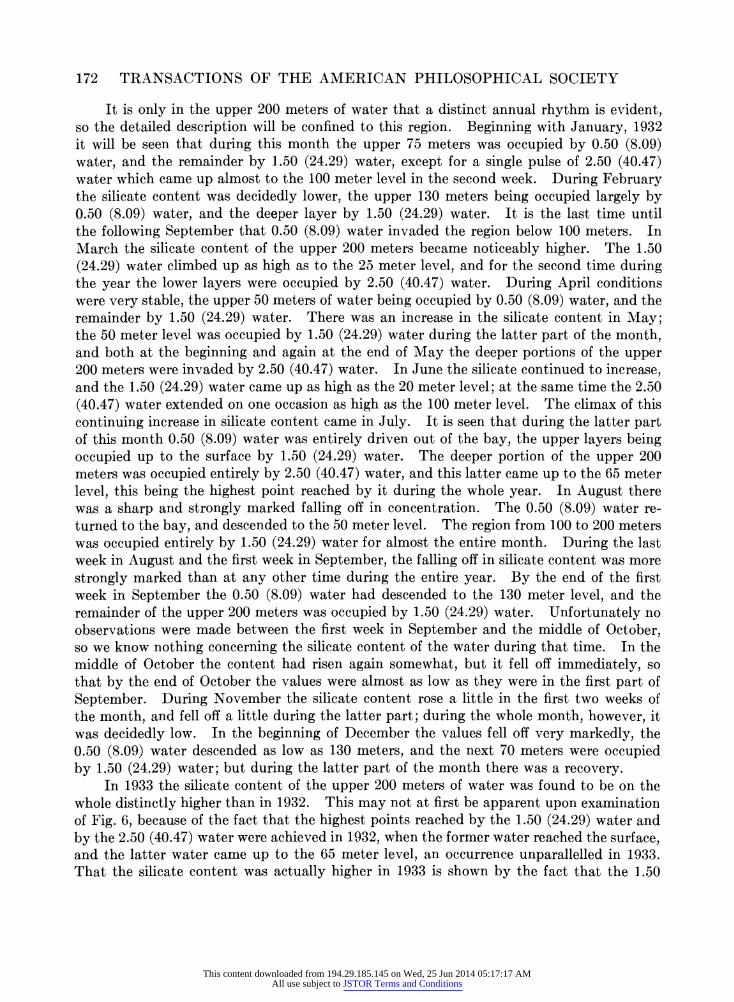
In Table I will be found the tabulation of the silicate content at various depths for each month, averaged over the 3 year period under consideration, and also the total average for the various depths. The average variation of silicate with respect to depth for the 3 year period is shown in Fig. 1. The ordinate in this graph represents depth, and the abscissa represents concentration of silicate expressed as mg./liter of Si02. It will be seen first, that the silicate content increases consistently with depth, down to 900 meters. This increase with depth has been almost universally observed wherever silicate in the ocean
This content downloaded from 194.29.185.145 on Wed, 25 Jun 2014 05:17:17 AMAll use subject to JSTOR Terms and Conditions
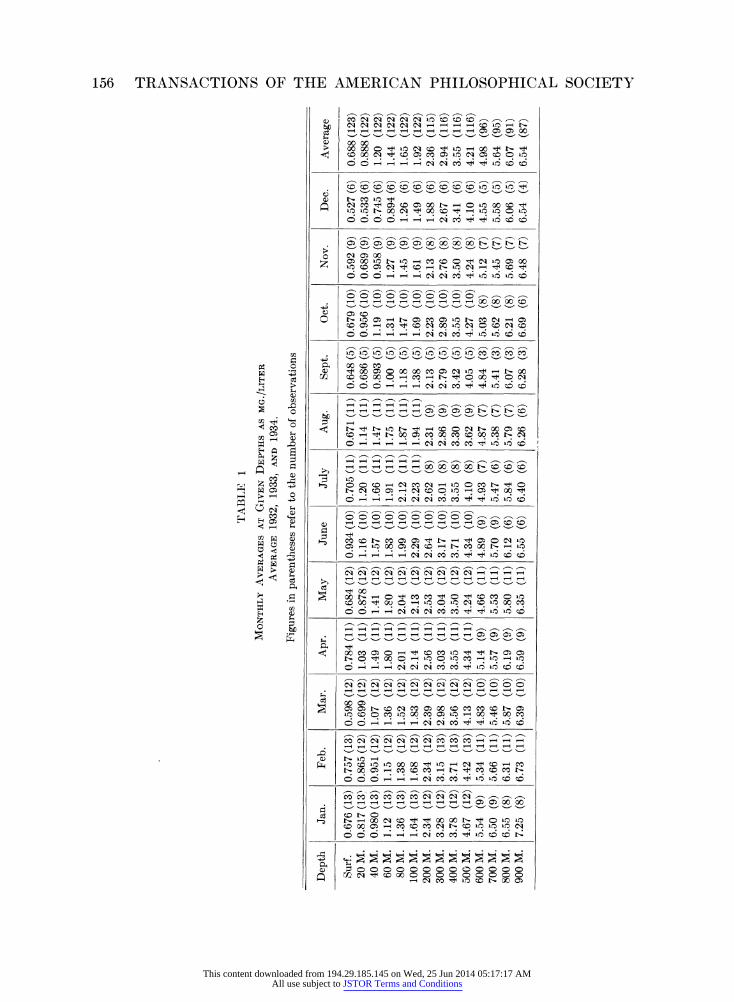
TABLE 1
MONTHLY AVERAGES AT GIVEN DEPTHS AS MG./LITER AVERAGE 1932, 1933, AND 1934.
Figures in parentheses refer to the number of observations
Apr.
0.784 (11) 1.03 (11) 1.49 (11) 1.80 (11) 2.01 (11) 2.14 (11) 2.56 (11) 3.03 (11) 3.55 (11) 4.34 (11) 5.14 (9) 5.57 (9) 6.19 (9) 6.59 (9)
May
0.684 (12) 0.878 (12) 1.41 (12) 1.80 (12) 2.04 (12) 2.13 (12) 2.53 (12) 3.04 (12) 3.50 (12) 4.24 (12) 4.66 (11) 5.53 (11) 5.80 (11) 6.35 (11)
June
0.934 (10) 1.16 (10) 1.57 (10) 1.83 (10) 1.99 (10) 2.29 (10) 2.64 (10) 3.17 (10) 3.71 (10) 4.34 (10) 4.89 (9) 5.70 (9) 6.12 (6) 6.55 (6)
July
0.705 (11) 1.20 (11) 1.66 (11) 1.91 (11) 2.12 (11) 2.23 (11) 2.62 (8) 3.01 (8) 3.55 (8) 4.10 (8) 4.93 (7) 5.47 (6) 5.84 (6) 6.40 (6)
Aug.
0.671 (11) 1.14 (11) 1.47 (11) 1.75 (11) 1.87 (11) 1.94 (11) 2.31 (9) 2.86 (9) 3.30 (9) 3.62 (9) 4.87 (7) 5.38 (7) 5.79 (7) 6.26 (6)
Sept.
0.648 (5) 0.686 (5) 0.893 (5) 1.00 (5) 1.18 (5) 1.38 (5) 2.13 (5) 2.79 (5) 3.42 (5) 4.05 (5) 4.84 (3) 5.41 (3) 6.07 (3) 6.28 (3)
Oct.
0.679 (10) 0.956 (10) 1.19 (10) 1.31 (10) 1.47 (10) 1.69 (10) 2.23 (10) 2.89 (10) 3.55 (10) 4.27 (10) 5.03 (8) 5.62 (8) 6.21 (8) 6.69 (6)
Nov.
0.592 (9) 0.689 (9) 0.958 (9) 1.27 (9) 1.45 (9) 1.61 (9) 2.13 (8) 2.76 (8) 3.50 (8) 4.24 (8) 5.12 (7) 5.45 (7) 5.69 (7) 6.48 (7)
Dec.
0.527 (6) 0.533 (6) 0.745 (6) 0.894 (6) 1.26 (6) 1.49 (6) 1.88 (6) 2.67 (6) 3.41 (6) 4.10 (6) 4.55 (5) 5.58 (5) 6.06 (5) 6.54 (4)
c3
03 2
H Average
-
0.688 (123) 0.888 (122) 1.20 (122) 1.44 (122) 1.65 (122) 1.92 (122) 2 2.36 (115) t 2.94 (116) 3.55 (116) ,',
4.21 (116) O
0
4.98 (96) co 5.64 (95) O 6.07 (91) X 6.54 (87) c t-q
o q
4.1 11 H
Depth
Surf. 20 M. 40 M. 60 M. 80 M.
100 M. 200 M. 300 M. 400 M. 500 M. 600 M. 700 M. 800 M. 900 M.
Jan.
0.676 (13) 0.817 (137 0.980 (13) 1.12 (13) 1.36 (13) 1.64 (13) 2.34 (12) 3.28 (12) 3.78 (12) 4.67 (12) 5.54 (9) 6.50 (9) 6.55 (8) 7.25 (8)
Feb.
0.757 (13) 0.865 (12) 0.951 (12) 1.15 (12) 1.38 (12) 1.68 (12) 2.34 (12) 3.15 (13) 3.71 (13) 4.42 (13) 5.34 (11) 5.66 (11) 6.31 (11) 6.73 (11)
Mar.
0.598 (12) 0.699 (12) 1.07 (12) 1.36 (12) 1.52 (12) 1.83 (12) 2.39 (12) 2.98 (12) 3.56 (12) 4.13 (12) 4.83 (10) 5.46 (10) 5.87 (10) 6.39 (10)
This content downloaded from 194.29.185.145 on Wed, 25 Jun 2014 05:17:17 AMAll use subject to JSTOR Terms and Conditions
PHELPS: SILICATE CONTENT OF MONTEREY BAY, CALIFORNIA 157
has been studied. The only exceptions seem to occur near the mouths of rivers, owing to the addition to the surface layer, of fresh water with a high silicate content (Lucas, Hutchinson, and King, '28), and in some regions where a heavy plankton population depletes the silicate content a few meters under the surface to a greater extent than at the surface, thus disturbing the gradient in the upper 15 meters of water (Hutchinson, Lucas, and McPhail, '29; Thompson and Johnson, '30). The nature of this gradient has not heretofore been adequately studied, however, because too few observations have been made in deep water, and in the same location, to give significant results in this regard.
The present data demonstrate that in Monterey Bay the average silicate gradient takes the following course: From the surface to 100 meters the gradient is regular and much higher than in the deeper waters; from 100-200 meters it is low, being only 36% of that in the upper 100 meters; below 200 meters the gradient increases, until a deep water maximum is reached between the 500 and 600 meter levels, where it is_63% of that in the
200 -
400-
600-
800-
/ 2 3 4 56 7
FIG. 1. Average Fluctuation of Silicate With Respect to Depth. Ordinate represents depth expressed in meters and abscissa concentration of silicate as mg./liter.
upper 100 meters. Between 600 and 700 meters the gradient is almost as great as between 500 and 600 meters, but from 700 to 800 meters it is markedly less, being about the same as the gradient from 100 to 200 meters. Finally, the gradient from 800 to 900 meters is insignificantly different from that of 700-800 meters. A more extended analysis of the gradient will be found in another part of this paper, on page 175. It is not believed to be profitable to speculate as to the causes of this variation of gradient with depth, because too little is at present known in regard to the details of the silicate cycle in the ocean. It is of interest to note, however, that the gradient of silicate is very different from that of tem- perature. The latter, averaged over several years in Monterey Bay, shows a maximum value in the top 100 meters and decreases very regularly at a slowly declining rate from 200 to 900 meters.
Additional features of general interest in regard to the data shown in Table I may be derived from a comparison of the silicate content of Monterey Bay with the silicate values which have been found elsewhere. In order to make this comparison, a very brief review of typical observations on the silicate content of the ocean is desirable.
This content downloaded from 194.29.185.145 on Wed, 25 Jun 2014 05:17:17 AMAll use subject to JSTOR Terms and Conditions
158 TRANSACTIONS OF THE AMERICAN PHILOSOPHICAL SOCIETY
The question of the silicate content of sea water has proven of particular interest to oceanographers because of the role which this constituent plays in the biological economy of the sea. Since the major part of the photosynthetic microplankton consists of diatoms, and since these forms utilize silicate as the predominating element in the formation of their tests, it has long been realized that silicon must be one of the important ecological factors in the ocean. It has for many years been maintained that lack of silicon was one of the limiting factors which eventually brought the growth of diatom populations to a halt. Recently there has been evidence presented which indicates that reduction in the concen- tration of other nutrient salts, particularly nitrates and phosphates, is the real limiting factor to the indefinite increase of the diatom population, inasmuch as these elements at times approach complete disappearance from the surface waters of the ocean far more closely than does silicate. However, in view of the experiments of Harvey ('33) which show that even in the presence of an excess of phosphate and nitrate a population of Nitschia will grow better in a high concentration of silicate than when a concentration as low as is frequently found in the ocean is present, the question of the relative amount of silicate as a limiting factor in diatom growth must be considered to be still open.
The earliest reliable estimates of the amount of silicate in sea water were made by Raben ('05) on water from the Baltic and the North Seas. He found distinct evidences of a seasonal cycle, the silicate content being high in the late autumn and winter and low in the late spring and summer; the values from the surface ranged from 0.40 to 1.10 mg./liter. In two further publications ('10 and '13) he reported further data from the Baltic Sea and the North Sea. These observations for the most part confirmed the seasonal cycle reported in the earlier paper, and the values found were of the same order of mag- nitude. In the majority of cases, the silicon content in the upper layers of the North Sea was somewhat lower than that in the Baltic. In the course of his observations from 1902 to 1912 Raben made a number of observations on the silicate content of subsurface water, the majority of samples coming from the upper 100 meters. It is interesting to note that in many cases, the deeper waters showed a lower silicate value than did the surface water.
Brandt ('19) found much the same situation in the Baltic where observations taken in 1911 showed silicate values which ran from 0.9 mg./liter in February to 0.6 mg./liter in April and May with an increase to 0.9 mg./liter in June at the surface. During this same period values found at a depth of 19 meters lay between 0.6 mg./liter and 1.15 mg./liter. Wells ('22) reported some silicate values found a short distance off shore from Gloucester, Massachusetts. The samples were obtained from the surface, and the silicate content was found to vary from 0.3 mg./liter to 2.9 mg./liter.
An extended series of observations of silicate was made by Atkins ('23; '26; '28; '30), largely at stations in the North Sea, but also in other parts of the Atlantic. This author found a decided seasonal cycle which followed very closely the plankton cycle. There was a maximum of silicate in the winter, followed by a strong depletion in the spring associated with the outburst of plankton at that time. In the summer, when the growth of plankton was less marked, there was a regeneration of silicate. In the late autumn the silicate again was depleted, this depletion being accompanied by the second seasonal peak in the plankton population. These findings of Atkins confirmed forcefully the earlier theories of Raben, Johnstone ('08), and Brandt that the cycle of silicate in several regions of the ocean is intimately bound up with the annual cycle of populations of silicious plankton. Typical
This content downloaded from 194.29.185.145 on Wed, 25 Jun 2014 05:17:17 AMAll use subject to JSTOR Terms and Conditions
PHELPS: SILICATE CONTENT OF MONTEREY BAY, CALIFORNIA 159
values found by Atkins in the North Sea range from 0.05 to 0.35 mg./liter* 2 at the surface, and about the same range at the bottom, at 70 meters.
The first report in regard to the silicate content of water in the stratosphere was provided by Atkins and Harvey ('25). At two stations between Lisbon and the Canary Islands
they found an increase of silicate with depth, the values being 0.22 mg./liter* at the surface, 0.28* at 500 meters, 0.45* at 1000 meters, 0.48* at 2000 meters, and 1.20* at 3000 meters. From samples taken from seven stations in the Faroe-Iceland and Faroe-Shetland Channels, off the south coast of Ireland, in the Bay of Biscay, and off Portugal, Atkins ('26) found silicate values ranging from 0.136-0.216 mg./liter* at the surface, 0.26-0.36* at 100 meters, 0.40-0.45* at 500 meters, 0.52-0.65* at 1000 meters, 0.70* at 2000 meters, and 1.60* at 3000 meters.
The first work on the silicate content of the Pacific Ocean is that of Moberg ('26), who obtained samples at two stations, five miles and ten miles off shore from LaJolla, California. The values at both stations were essentially the same. At the 5 mile station 0.20 mg./liter* were found at the surface, 0.65* at 50 meters, 1.12* at 100 meters, and 1.19* at 150 meters. At the 10 mile station 0.23 mg./liter* were found at the surface, 0.68* at 50 meters, and 1.24* at 100 meters. Two years later the same author ('28) reported data from the 10 mile station taken in the summer. These showed values of 0.46 mg./liter* at the surface, 0.91* at 50 meters, 1.32* at 100 meters, and 1.68* at 150 meters. In the same year Hutchin- son ('28) reported finding approximately 4.0 mg./liter* at the surface, 1.0* at a depth of 4 yards, and 2.0* at both 10 and 20 yards depths in the Straits of Georgia near Vancouver Island. Thompson and Johnson ('30), making weekly observations from September 1928
to September 1929 in Puget Sound, found an average of 2.8 mg./liter at the surface, with a maximum of 3.3 and a minimum of 2.1. At 12.8 meters the average was 2.7 mg./liter with a maximum of 3.3 and a minimum of 2.1.
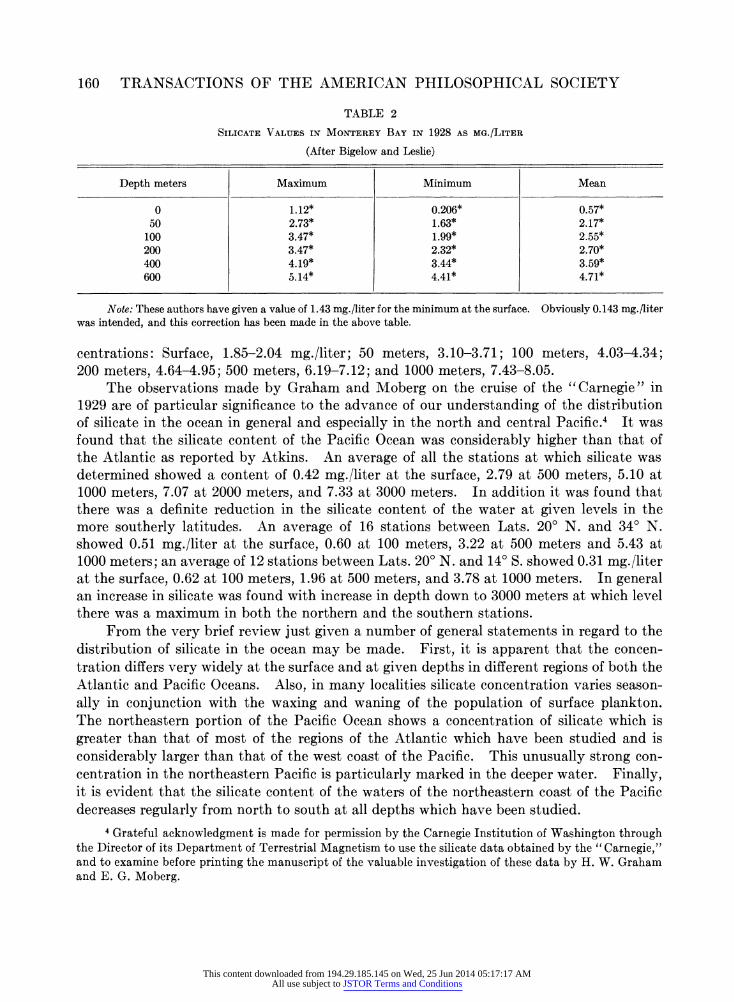
Bigelow and Leslie ('30) reported observations of the water at 31 stations all located in Monterey Bay, during July of 1928. These authors tested the silicate content at 18
stations, going down to a maximum of 600 meters at 3 stations. A summary of their
maximum, minimum, and average values at various depths is given in Table 2. Thompson,
Thomas, and Barnes ('34) reported on the silicate content of the water at stations about
100 miles off the coast of Vancouver Island in July 1933.3 They found an average of 0.805
mg./liter at the surface, 2.29 at 100 meters, 5.67 at 500 meters, and 9.59 at 1000 meters.
Uda ('34), making investigations in the Sea of Japan, found typical values of 0.40-1.5
mg./liter at the surface, 0.73-2.2 at 100 meters, 2.2-3.0 at 500 meters, 2.8-3.7 at 1000
meters, and 3.6-4.0 at 2000 meters. In samples collected in Bering Strait in July 1934,
Barnes, Thompson, and Zeusler ('35) found surface values of 0.124-1.24 mg./liter and
at 25 meters 0.31-1.73. The same authors found, at two stations located in the region of
the tip of the Aleutian Islands, and visited in August of the same year, the following con-
2 It has been pointed out by King and Lucas ('28) that in performing colorimetric analysis of silicate, the picric acid employed should first be purified several times and then thoroughly dehydrated. Since this
precaution has been commonly neglected in work prior to 1928, it has been found necessary to multiply the results of such work by the factor 1.44. Data which have been so corrected in this paper are marked with an asterisk.
3 In this paper and in the paper of Barnes, Thompson, and Zeusler ('35) the values are given in terms of mg. atoms per kilo. For the sake of uniformity this notation has been changed to mg./liter.
This content downloaded from 194.29.185.145 on Wed, 25 Jun 2014 05:17:17 AMAll use subject to JSTOR Terms and Conditions
160 TRANSACTIONS OF THE AMERICAN PHILOSOPHICAL SOCIETY
TABLE 2
SILICATE VALUES IN MONTEREY BAY IN 1928 AS MG./LITER
(After Bigelow and Leslie)
Depth meters Maximum Minimum Mean
0 1.12* 0.206* 0.57* 50 2.73* 1.63* 2.17*
100 3.47* 1.99* 2.55* 200 3.47* 2.32* 2.70* 400 4.19* 3.44* 3.59* 600 5.14* 4.41* 4.71*
Note: These authors have given a value of 1.43 mg./liter for the minimum at the surface. Obviously 0.143 mg./liter was intended, and this correction has been made in the above table.
centrations: Surface, 1.85-2.04 mg./liter; 50 meters, 3.10-3.71; 100 meters, 4.03-4.34; 200 meters, 4.64-4.95; 500 meters, 6.19-7.12; and 1000 meters, 7.43-8.05.
The observations made by Graham and Moberg on the cruise of the "Carnegie" in 1929 are of particular significance to the advance of our understanding of the distribution of silicate in the ocean in general and especially in the north and central Pacific.4 It was found that the silicate content of the Pacific Ocean was considerably higher than that of the Atlantic as reported by Atkins. An average of all the stations at which silicate was determined showed a content of 0.42 mg./liter at the surface, 2.79 at 500 meters, 5.10 at 1000 meters, 7.07 at 2000 meters, and 7.33 at 3000 meters. In addition it was found that there was a definite reduction in the silicate content of the water at given levels in the more southerly latitudes. An average of 16 stations between Lats. 20? N. and 34? N. showed 0.51 mg./liter at the surface, 0.60 at 100 meters, 3.22 at 500 meters and 5.43 at 1000 meters; an average of 12 stations between Lats. 20? N. and 14? S. showed 0.31 mg./liter at the surface, 0.62 at 100 meters, 1.96 at 500 meters, and 3.78 at 1000 meters. In general an increase in silicate was found with increase in depth down to 3000 meters at which level there was a maximum in both the northern and the southern stations.
From the very brief review just given a number of general statements in regard to the distribution of silicate in the ocean may be made. First, it is apparent that the concen- tration differs very widely at the surface and at given depths in different regions of both the Atlantic and Pacific Oceans. Also, in many localities silicate concentration varies season- ally in conjunction with the waxing and waning of the population of surface plankton. The northeastern portion of the Pacific Ocean shows a concentration of silicate which is greater than that of most of the regions of the Atlantic which have been studied and is considerably larger than that of the west coast of the Pacific. This unusually strong con- centration in the northeastern Pacific is particularly marked in the deeper water. Finally, it is evident that the silicate content of the waters of the northeastern coast of the Pacific decreases regularly from north to south at all depths which have been studied.
4 Grateful acknowledgment is made for permission by the Carnegie Institution of Washington through the Director of its Department of Terrestrial Magnetism to use the silicate data obtained by the "Carnegie," and to examine before printing the manuscript of the valuable investigation of these data by H. W. Graham and E. G. Moberg.
This content downloaded from 194.29.185.145 on Wed, 25 Jun 2014 05:17:17 AMAll use subject to JSTOR Terms and Conditions
PHELPS: SILICATE CONTENT OF MONTEREY BAY, CALIFORNIA 161
In comparing the average silicate values shown in Table I with the values found else- where by other observers, two features should be noted. First, the surface water of the Atlantic Ocean appears in most cases to contain only about 30%O as much silicate as is found in Monterey Bay. Notable exceptions to this generalization are the findings of Raben and of Brandt in the Baltic and North Seas and of Wells off the coast of Massa- chusetts; in both these regions the silicate content was of the same order of magnitude as that reported in the present work. It should be noted, however, that the results of the three authors just mentioned were obtained by means of gravimetric analysis and a com- parison of them with results obtained by colorimetric analysis may not be entirely safe. This is indicated by the fact that Raben, using the former method, found surface values of silicate in the North Sea which were significantly higher than those found by Atkins who applied the latter method of analysis to samples taken in the same region. A second point to be noted is that the values found below the surface are lower than those found by Thompson, Thomas, and Barnes ('34) in the open ocean off the coast of Vancouver, and higher than those found by Moberg ('26, '28) off the California coast in the region of La Jolla. This furnishes further evidence in support of the statement by Thompson and Robinson ('32) that the silicate content along the eastern coast of the Pacific Ocean increases as the latitude increases.
THE MONTHLY CONDITION OF THE WATER
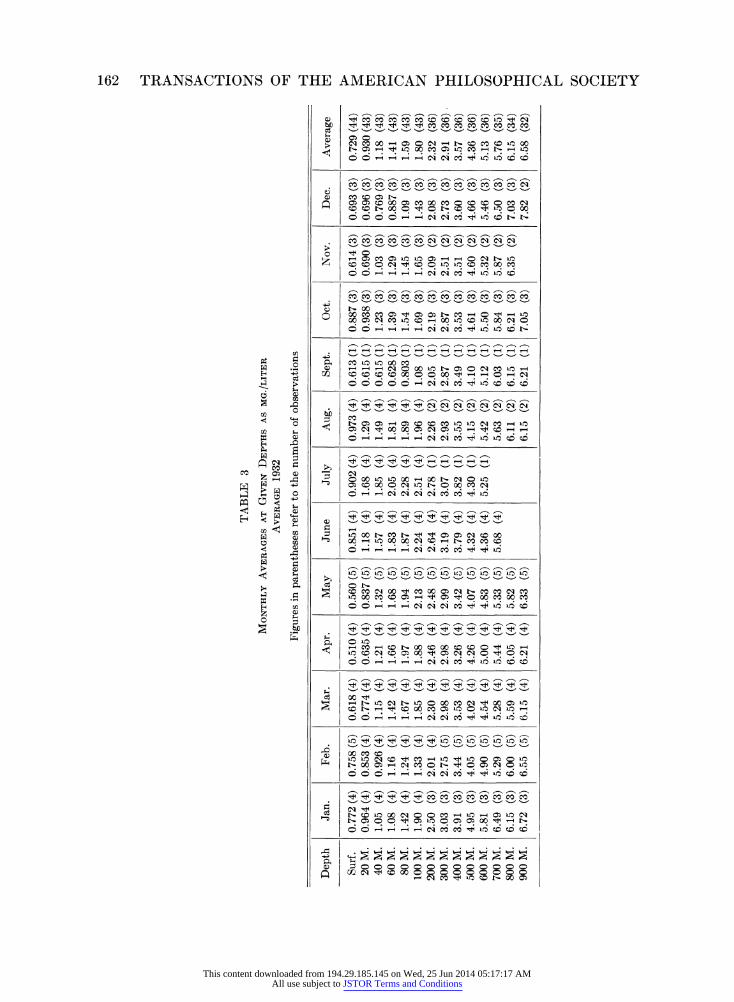
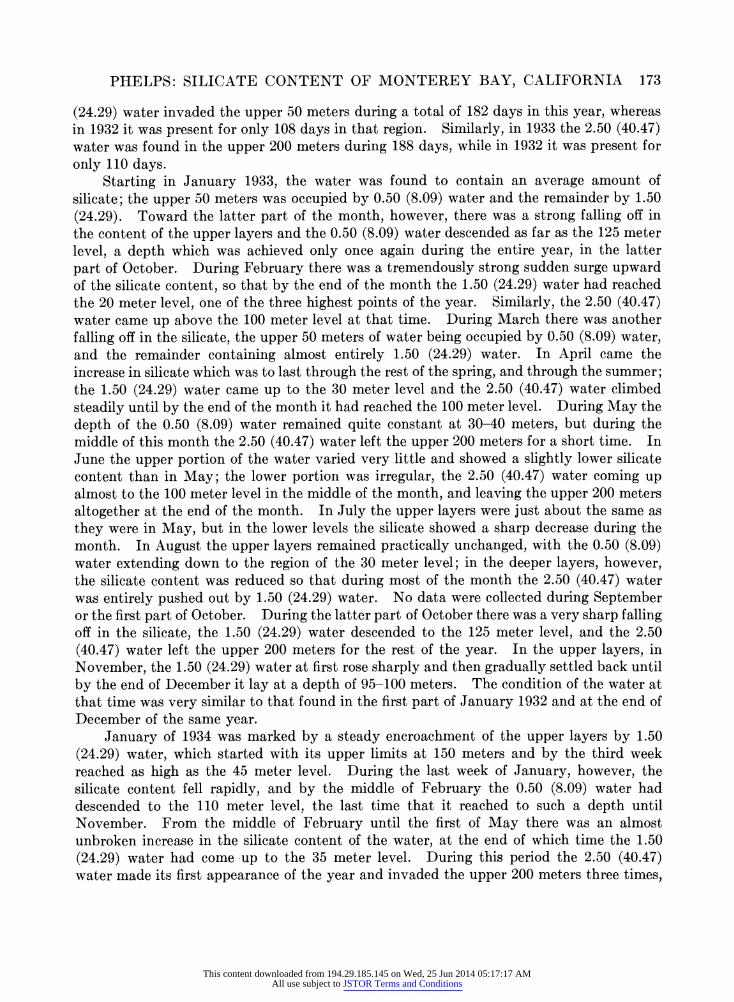
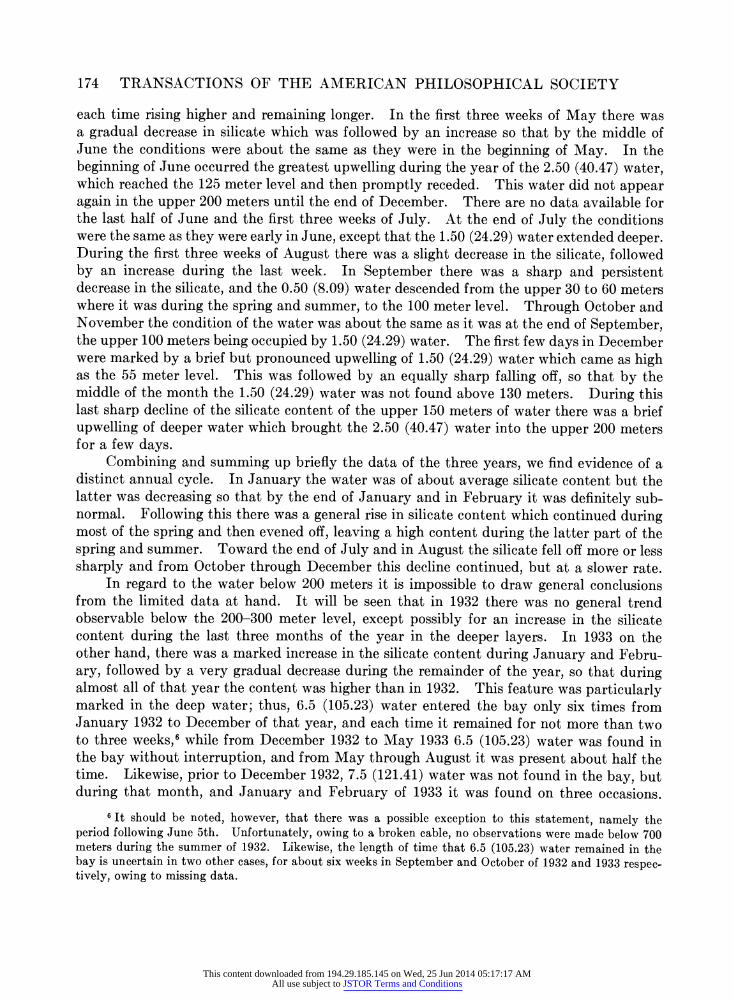
The monthly condition of the water is shown in Tables 3, 4, and 5 in which are given the monthly averages of the silicate content at various depths. In Figures 2, 3, 4, and 5 these monthly averages are depicted graphically, the ordinates representing depth, and the abscissae concentration of silicate. It will be seen that these tables and figures show data from only about half of the depths at which samples were taken. This condensation was decided upon for reasons of economy and because the omitted data did not contribute
essentially to the clarity of the presentation of the hydrographic picture. The omitted data were employed, however, to this extent: In every case where the value at a certain depth was suspected of being faulty, either through error of collecting or of testing, the values which were found just below and above the level in question were employed to estimate the true silicate content.
Although the data for only 3 years are at present under consideration, and it is thus dangerous to generalize to too great an extent, it seems profitable to give a month by month description of the conditions obtaining in the bay in order that this information may be quickly available for reference.
January: During this month in 1932, the silicate content was above average in the upper 20 meters of water, below average from 40 to 80 meters, and above average from 100 to 900 meters. The highest values of the year occurred during this month from 400 to 600 meters. In 1933, the content was above average at the surface, below average from 20 to 200 meters, and above average from 300 to 900 meters. The highest annual values were found from 700 to 900 meters. In 1934, the silicate was subnormal from the surface to 200 meters, and above average from 300 to 900 meters. The three year average shows the content to be below average from the surface to 200 meters and above average from 300 to 900 meters.
This content downloaded from 194.29.185.145 on Wed, 25 Jun 2014 05:17:17 AMAll use subject to JSTOR Terms and Conditions
3-
TABLE 3 0 MONTHLY AVERAGES AT GIVEN DEPTHS AS MG./LITER
AVERAGE 1932 O
Figures in parentheses refer to the number of observations
Depth Jan. Feb. Mar. Apr. May June July Aug. Sept. Oct. Nov. Dec. Average r
Surf. 0.772 (4) 0.758 (5) 0.618 (4) 0.510 (4) 0.560 (5) 0.851 (4) 0.902 (4) 0.973 (4) 0.613 (1) 0.887 (3) 0.614 (3) 0.693 (3) 0.729 (44) 20 M. 0.964 (4) 0.853 (4) 0.774 (4) 0.635 (4) 0.837 (5) 1.18 (4) 1.68 (4) 1.29 (4) 0.615 (1) 0.938 (3) 0.690 (3) 0.696 (3) 0.930 (43) j 40 M. 1.05 (4) 0.926(4) 1.15 (4) 1.21 (4) 1.32 (5) 1.57 (4) 1.85 (4) 1.49 (4) 0.615(1) 1.23 (3) 1.03 (3) 0.769(3) 1.18 (43) : 60M. 1.08 (4) 1.16 (4) 1.42 (4) 1.66 (4) 1.68 (5) 1.83 (4) 2.05 (4) 1.81 (4) 0.628(1) 1.39 (3) 1.29 (3) 0.887(3) 1.41 (43) 80 M. 1.42 (4) 1.24 (4) 1.67 (4) 1.97 (4) 1.94 (5) 1.87 (4) 2.28 (4) 1.89 (4) 0.803(1) 1.54 (3) 1.45 (3) 1.09 (3) 1.59 (43)
100 M. 1.90 (4) 1.33 (4) 1.85 (4) 1.88 (4) 2.13 (5) 2.24 (4) 2.51 (4) 1.96 (4) 1.08 (1) 1.69 (3) 1.65 (3) 1.43 (3) 1.80 (43) Z 200 M. 2.50 (3) 2.01 (4) 2.30 (4) 2.46 (4) 2.48 (5) 2.64 (4) 2.78 (1) 2.26 (2) 2.05 (1) 2.19 (3) 2.09 (2) 2.08 (3) 2.32 (36) 300 M. 3.03 (3) 2.75 (5) 2.98 (4) 2.98 (4) 2.99 (5) 3.19 (4) 3.07 (1) 2.93 (2) 2.87 (1) 2.87 (3) 2.51 (2) 2.73 (3) 2.91 (36) I 400 M. 3.91 (3) 3.44 (5) 3.53 (4) 3.26 (4) 3.42 (5) 3.79 (4) 3.82 (1) 3.55 (2) 3.49 (1) 3.53 (3) 3.51 (2) 3.60 (3) 3.57 (36) S 500 M. 4.95 (3) 4.05 (5) 4.02 (4) 4.26 (4) 4.07 (5) 4.32 (4) 4.30 (1) 4.15 (2) 4.10 (1) 4.61 (3) 4.60 (2) 4.66 (3) 4.36 (36) r 600 M. 5.81 (3) 4.90 (5) 4.54 (4) 5.00 (4) 4.83 (5) 4.36 (4) 5.25 (1) 5.42 (2) 5.12 (1) 5.50 (3) 5.32 (2) 5.46 (3) 5.13 (36) 2 700 M. 6.49 (3) 5.29 (5) 5.28 (4) 5.44 (4) 5.33 (5) 5.68 (4) 5.63 (2) 6.03 (1) 5.84 (3) 5.87 (2) 6.50 (3) 5.76 (35) C 800 M. 6.15 (3) 6.00 (5) 5.59 (4) 6.05 (4) 5.82 (5) 6.11 (2) 6.15 (1) 6.21 (3) 6.35 (2) 7.03 (3) 6.15 (34)
'
900 M. 6.72 (3) 6.55 (5) 6.15 (4) 6.21 (4) 6.33 (5) 6.15 (2) 6.21 (1) 7.05 (3) 7.82 (2) 6.58 (32) Q
O
H cr
This content downloaded from 194.29.185.145 on Wed, 25 Jun 2014 05:17:17 AMAll use subject to JSTOR Terms and Conditions
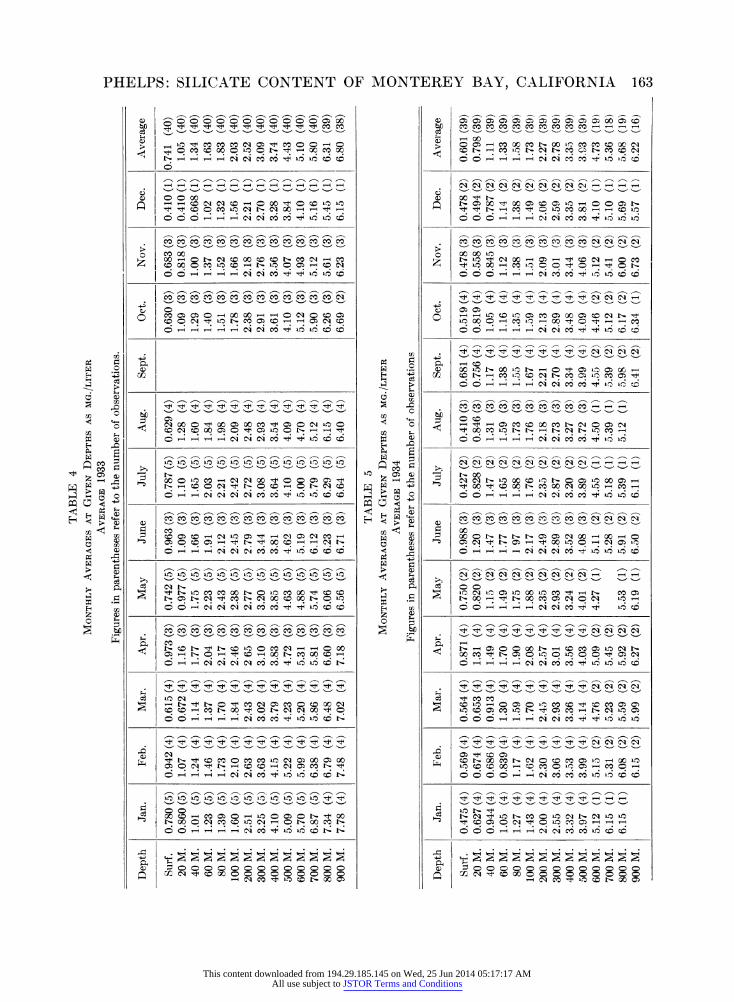
TABLE 4 MONTHLY AVERAGES AT GIVEN DEPTHS AS MG./LITER
AVERAGE 1933
Figures in parentheses refer to the number of observations.
May
0.742 (5) 0.977 (5) 1.75 (5) 2.23 (5) 2.43 (5) 2.38 (5) 2.77 (5) 3.20 (5) 3.85 (5) 4.63 (5) 4.88 (5) 5.74 (5) 6.06 (5) 6.56 (5)
June
0.963 (3) 1.09 (3) 1.66 (3) 1.91 (3) 2.12 (3) 2.45 (3) 2.79 (3) 3.44 (3) 3.81 (3) 4.62 (3) 5.19 (3) 6.12 (3) 6.23 (3) 6.71 (3)
July
0.787 (5) 1.10 (5) 1.65 (5) 2.03 (5) 2.21 (5) 2.42 (5) 2.72 (5) 3.08 (5) 3.64 (5) 4.10 (5) 5.00 (5) 5.79 (5) 6.29 (5) 6.64 (5)
Aug.
0.629 (4) 1.28 (4) 1.60 (4) 1.84 (4) 1.98 (4) 2.09 (4) 2.48 (4) 2.93 (4) 3.54 (4) 4.09 (4) 4.70 (4) 5.12 (4) 6.15 (4) 6.40 (4)
Sept. Oct.
0.630 (3) 1.09 (3) 1.29 (3) 1.40 (3) 1.51 (3) 1.78 (3) 2.38 (3) 2.91 (3) 3.61 (3) 4.10 (3) 5.12 (3) 5.90 (3) 6.26 (3) 6.69 (2)
Nov.
0.683 (3) 0.818 (3) 1.00 (3) 1.37 (3) 1.52 (3) 1.66 (3) 2.18 (3) 2.76 (3) 3.56 (3) 4.07 (3) 4.93 (3) 5.12 (3) 5.61 (3) 6.23 (3)
Dec.
0.410 (1) 0.410 (1) 0.668 (1) 1.02 (1) 1.32 (1) 1.56 (1) 2.21 (1) 2.70 (1) 3.28 (1) 3.84 (1) 4.10 (1) 5.16 (1) 5.45 (1) 6.15 (1)
Average t~
0.741 (40) 1.05 (40) ZQ 1.34 (40) t 1.63 (40) n
1.83 (40) > 2.03 (40) H 2.52 (40) L 3.09 (40) Q 3.74 (40) 0 4.43 (40) Z 5.10 (40) H 5.80 (40) 6.31 (39) 6.80 (38)
0 TABLE 5
MONTHLY AVERAGES AT GIVEN DEPTHS AS MG./LITER
AVERAGE 1934
Figures in parentheses refer to the number of observations
Depth Jan. Feb. Mar. Apr. May June July Aug. Sept. Oct. Nov. Dec. Average
Surf. 0.475 (4) 0.569 (4) 0.564 (4) 0.871 (4) 0.750 (2) 0.988 (3) 0.427 (2) 0.410 (3) 0.681 (4) 0.519 (4) 0.478 (3) 0.478 (2) 0.601 (39) 20 M. 0.627 (4) 0.674 (4) 0.653 (4) 1.31 (4) 0.820 (2) 1.20 (3) 0.828 (2) 0.846 (3) 0.756 (4) 0.819 (4) 0.558 (3) 0.494 (2) 0.798 (39) 40 M. 0.944 (4) 0.686 (4) 0.913 (4) 1.49 (4) 1.15 (2) 1.47 (3) 1.47 (2) 1.31 (3) 1.17 (4) 1.05 (4) 0.845 (3) 0.787 (2) 1.11 (39) 60 M. 1.05 (4) 0.839 (4) 1.30 (4) 1.70 (4) 1.49 (2) 1.77 (3) 1.65 (2) 1.59 (3) 1.38 (4) 1.16 (4) 1.12 (3) 1.14 (2) 1.33 (39) 80 M. 1.27 (4) 1.17 (4) 1.59 (4) 1.90 (4) 1.75 (2) 1 97 (3) 1.88 (2) 1.73 (3) 1.55 (4) 1.35 (4) 1.38 (3) 1.38 (2) 1.58 (39)
100 M. 1.43 (4) 1.62 (4) 1.70 (4) 2.08 (4) 1.88 (2) 2.17 (3) 1.76 (2) 1.76 (3) 1.67 (4) 1.59 (4) 1.51 (3) 1.49 (2) 1.73 (39) 200 M. 2.00 (4) 2.30 (4) 2.45 (4) 2.57 (4) 2.35 (2) 2.49 (3) 2.35 (2) 2.18 (3) 2.21 (4) 2.13 (4) 2.09 (3) 2.06 (2) 2.27 (39) 300 M. 2.55 (4) 3.06 (4) 2.93 (4) 3.01 (4) 2.93 (2) 2.89 (3) 2.87 (2) 2.73 (3) 2.70 (4) 2.89 (4) 3.01 (3) 2.59 (2) 2.78 (39) 400 M. 3.32 (4) 3.53 (4) 3.36 (4) 3.56 (4) 3.24 (2) 3.52 (3) 3.20 (2) 3.27 (3) 3.34 (4) 3.48 (4) 3.44 (3) 3.35 (2) 3.35 (39) 500 M. 3.97 (4) 3.99 (4) 4.14 (4) 4.03 (4) 4.01 (2) 4.08 (3) 3.89 (2) 3.72 (3) 3.99 (4) 4.09 (4) 4.06 (3) 3.81 (2) 3.93 (39) 600 M. 5.12 (1) 5.15 (2) 4.76 (2) 5.09 (2) 4.27 (1) 5.11 (2) 4.55 (1) 4.50 (1) 4.55 (2) 4.46 (2) 5.12 (2) 4.10 (1) 4.73 (19) 700 M. 6.15 (1) 5.31 (2) 5.23 (2) 5.45 (2) 5.28 (2) 5.18 (1) 5.39 (1) 5.39 (2) 5.12 (2) 5.41 (2) 5.10 (1) 5.36 (18) 800 M. 6.15 (1) 6.08 (2) 5.59 (2) 5.92 (2) 5.53 (1) 5.91 (2) 5.39 (1) 5.12 (1) 5.98 (2) 6.17 (2) 6.00 (2) 5.69 (1) 5.68 (19) 900 M. 6.15 (2) 5.99 (2) 6.27 (2) 6.19 (1) 6.50 (2) 6.11 (1) 6.41 (2) 6.34 (1) 6.73 (2) 5.57 (1) 6.22 (16)
0
W >-
0
zt 12c
Depth
Surf. 20 M. 40 M. 60 M. 80 M.
100 M. 200 M. 300 M. 400 M. 500 M. 600 M. 700 M. 800 M. 900 M.
Jan.
0.780 (5) 0.860 (5) 1.01 (5) 1.23 (5) 1.39 (5) 1.60 (5) 2.51 (5) 3.25 (5) 4.10 (5) 5.09 (5) 5.70 (5) 6.87 (5) 7.34 (4) 7.78 (4)
Feb.
0.942 (4) 1.07 (4) 1.24 (4) 1.46 (4) 1.73 (4) 2.10 (4) 2.63 (4) 3.63 (4) 4.15 (4) 5.22 (4) 5.99 (4) 6.38 (4) 6.79 (4) 7.48 (4)
Mar.
0.615 (4) 0.672 (4) 1.14 (4) 1.37 (4) 1.70 (4) 1.84 (4) 2.43 (4) 3.02 (4) 3.79 (4) 4.23 (4) 5.20 (4) 5.86 (4) 6.48 (4) 7.02 (4)
Apr.
0.973 (3) 1.16 (3) 1.77 (3) 2.04 (3) 2.17 (3) 2.46 (3) 265 (3) 3.10 (3) 3.83 (3) 4.72 (3) 5.31 (3) 5.81 (3) 6.60 (3) 7.18 (3)
This content downloaded from 194.29.185.145 on Wed, 25 Jun 2014 05:17:17 AMAll use subject to JSTOR Terms and Conditions
164 TRANSACTIONS OF THE AMERICAN PHILOSOPHICAL SOCIETY
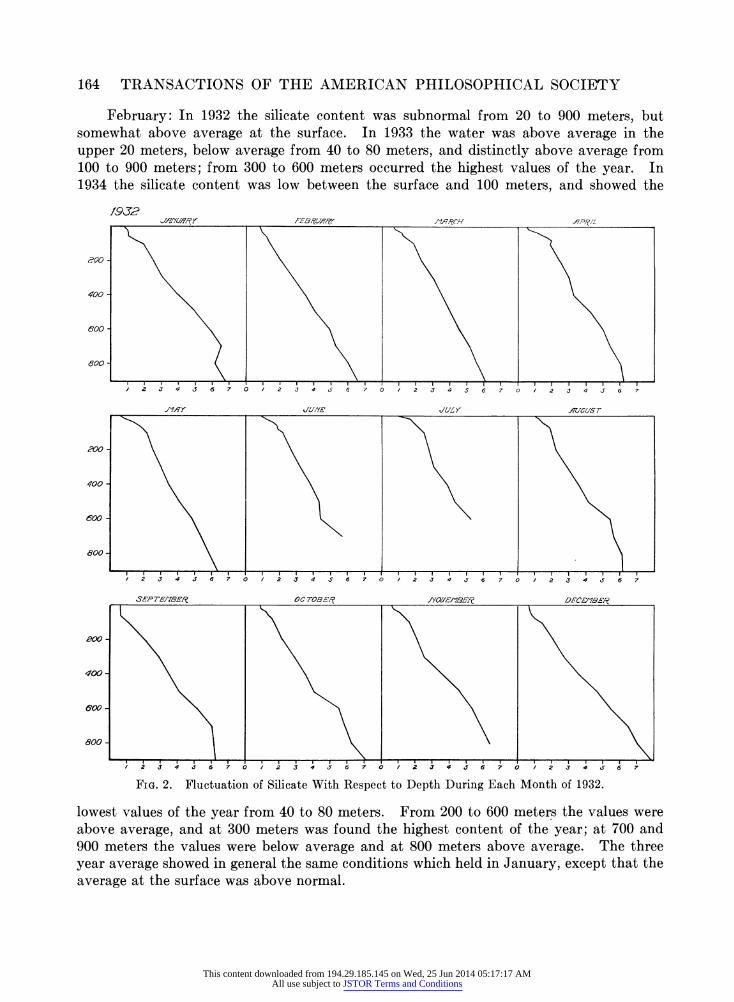
February: In 1932 the silicate content was subnormal from 20 to 900 meters, but somewhat above average at the surface. In 1933 the water was above average in the upper 20 meters, below average from 40 to 80 meters, and distinctly above average from 100 to 900 meters; from 300 to 600 meters occurred the highest values of the year. In 1934 the silicate content was low between the surface and 100 meters, and showed the
/9J2
SEP TEMJBER 0OC TOBER PYOvEIIFEEP DEDC7RIE
400 -
600 -
800 -
/ 2 3 4 2 6 7 0 2 3 6 7 2 4 6 7 0 / 2 3 4 r 6 7
FIG. 2. Fluctuation of Silicate With Respect to Depth During Each Month of 1932.
lowest values of the year from 40 to 80 meters. From 200 to 600 meters the values were above average, and at 300 meters was found the highest content of the year; at 700 and 900 meters the values were below average and at 800 meters above average. The three year average showed in general the same conditions which held in January, except that the average at the surface was above normal.
This content downloaded from 194.29.185.145 on Wed, 25 Jun 2014 05:17:17 AMAll use subject to JSTOR Terms and Conditions
PBELPS: SILICATE CONTENT OF MONTEREY BAY, CALIFORNIA 165
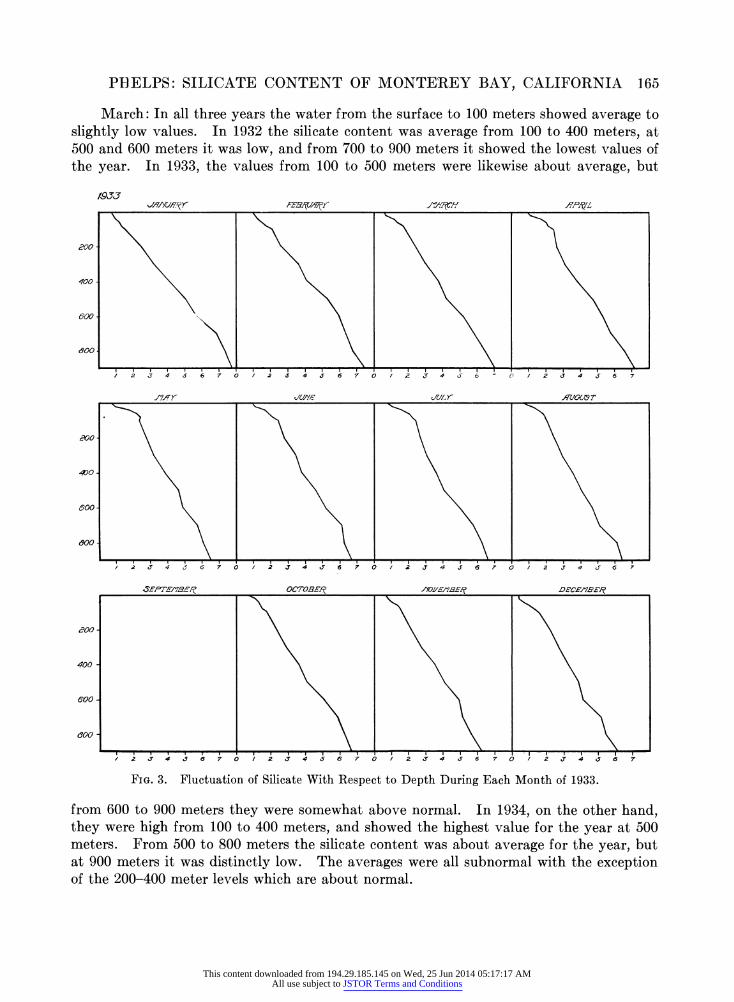
March: In all three years the water from the surface to 100 meters showed average to slightly low values. In 1932 the silicate content was average from 100 to 400 meters, at 500 and 600 meters it was low, and from 700 to 900 meters it showed the lowest values of the year. In 1933, the values from 100 to 500 meters were likewise about average, but
/9Jj
200 ?
400 .
600.
600
o00
400.
600
600
eoo 0
400.
600 ?
600
PR/7L
3 4 6 7 0 / 2 2 4 3 6 7 0 2 6 4 6 2 J 4 6 6 7
iq/r,r qrc. JWE dU/. ' RcUST
/ 2 ; 7 4( 3 6 7 0 I 2 3 4 6 7 0 2 J 4 3 6 77
-SS'TETMBE^ OCTOBE0R AYV/EIBE' DIECEPBlEF
/2 3 4 e 7 7 0 1 2 3I 4 65 6 7 0 2 3 4 I 6 7 0 f 2 3 4 6 7
FIG. 3. Fluctuation of Silicate With Respect to Depth During Each Month of 1933.
from 600 to 900 meters they were somewhat above normal. In 1934, on the other hand, they were high from 100 to 400 meters, and showed the highest value for the year at 500 meters. From 500 to 800 meters the silicate content was about average for the year, but at 900 meters it was distinctly low. The averages were all subnormal with the exception of the 200-400 meter levels which are about normal.
.F ,BRT/(11
This content downloaded from 194.29.185.145 on Wed, 25 Jun 2014 05:17:17 AMAll use subject to JSTOR Terms and Conditions
166 TRANSACTIONS OF THE AMERICAN PHILOSOPHICAL SOCIETY
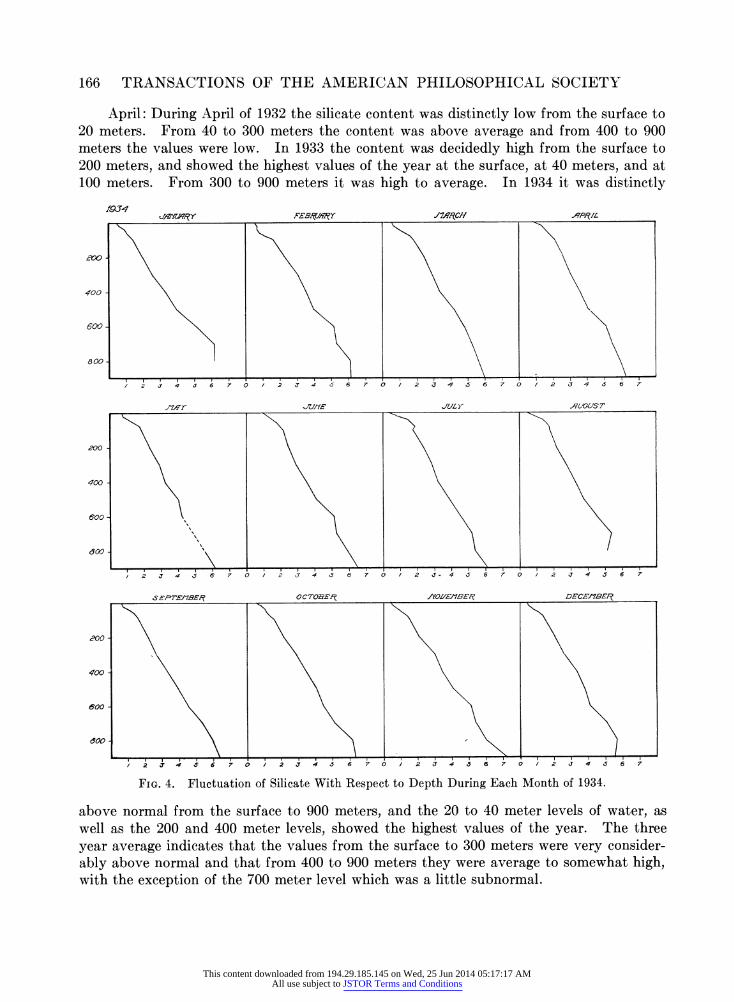
April: During April of 1932 the silicate content was distinctly low from the surface to 20 meters. From 40 to 300 meters the content was above average and from 400 to 900 meters the values were low. In 1933 the content was decidedly high from the surface to 200 meters, and showed the highest values of the year at the surface, at 40 meters, and at 100 meters. From 300 to 900 meters it was high to average. In 1934 it was distinctly
A^54 i. .
z9T'r
00 -
400-
600 -
o00
200
400
600
600
JULL > A,qU/US T
/ 2 4 6 7 0 2 4 6 7 0 / 2 - 4 6 7 0 2 4 6 7
. 4. Fluctuation of S ilicate 7 0 ith Respect 6 7 0 Each Month of 1934.
FIG. 4. Fluctuation of Silicate With Respect to Depth During Each Month of 1934.
above normal from the surface to 900 meters, and the 20 to 40 meter levels of water, as well as the 200 and 400 meter levels, showed the highest values of the year. The three year average indicates that the values from the surface to 300 meters were very consider- ably above normal and that from 400 to 900 meters they were average to somewhat high, with the exception of the 700 meter level which was a little subnormal.
This content downloaded from 194.29.185.145 on Wed, 25 Jun 2014 05:17:17 AMAll use subject to JSTOR Terms and Conditions
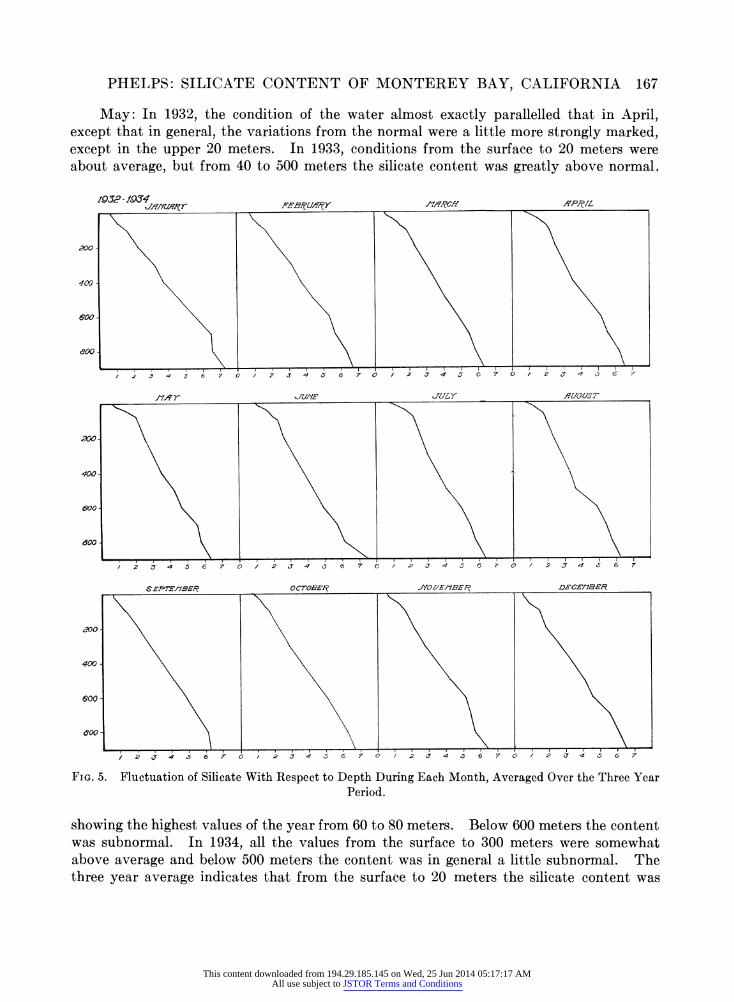
PHELPS: SILICATE CONTENT OF MONTEREY BAY, CALIFORNIA 167
May: In 1932, the condition of the water almost exactly parallelled that in April, except that in general, the variations from the normal were a little more strongly marked, except in the upper 20 meters. In 1933, conditions from the surface to 20 meters were about average, but from 40 to 500 meters the silicate content was greatly above normal,
1932 ?-.94
./'7LY qUO/UST
600.
600.
2 4 5 6 7 0 / 2 6 7 0 / 4 5 7 0 2 4 6 7
FIG. 5. Fluctuation of Silicate With Respect to Depth During Each Month, Averaged Over the Three Year Period.
showing the highest values of the year from 60 to 80 meters. Below 600 meters the content was subnormal. In 1934, all the values from the surface to 300 meters were somewhat above average and below 500 meters the content was in general a little subnormal. The three year average indicates that from the surface to 20 meters the silicate content was
- /7II/
This content downloaded from 194.29.185.145 on Wed, 25 Jun 2014 05:17:17 AMAll use subject to JSTOR Terms and Conditions
168 TRANSACTIONS OF THE AMERICAN PHILOSOPHICAL SOCIETY
subnormal; from 40 to 300 meters it was above average; at 400 and 500 meters it was normal; and from 600 to 800 meters it was subnormal.
June: From the surface to 400 meters the content was above average, and from 500 to 700 meters it was below average; at 300 meters it showed the highest values of the year. In 1933 the values were above average at all depths, except at 800 and 900 meters, this effect being most marked in the upper 300 meters; at 200 meters occurred the highest value of the year. In 1934 the values at all depths except at 700 meters were distinctly above average; with the exception of the 20 and 40 meter levels, the content from the surface to 200 meters was the highest of the year. The three years average showed the values at all depths except 600 meters to be above average.
July: During this month, in 1932, the silicate content was very greatly above average down to 400 meters, and showed the highest values for the year from 20 to 300 meters; at 500 and 600 meters, however, the values were about average. In 1933 the values were considerably above normal from the surface to 200 meters; at 300 meters the content was about average and from 400 to 900 meters it was subnormal. In 1934 the upper 20 meters were subnormal, the interval from 40 to 300 meters was above normal, and from 400 to 900 meters the silicate content was below average. The three years average showed values above normal from the surface to 300 meters, average conditions at 400 meters, and a content below average from 500 to 900 meters.
August: In 1932 the values during August were above normal from the surface to 100
meters, and about average from 200 meters on down, except that they were above normal at 600 meters, and subnormal at 900 meters; the content at the surface was the highest of the year. In 1933 the values at the surface were below average, those from 20 to 100 meters were above average, and those from 200 to 900 were increasingly below average; at 20 meters the content was the highest of the year. In 1934 the content was below normal in the upper 10 meters of water, above normal from 20 to 100 meters, and below normal from 200 to 800 meters, with the exception of the 700 meter level, which was about normal; at the surface and at 500 meters occurred the lowest values of the year. The three year aver- age showed values which are subnormal at the surface, above normal from 20 to 100 meters, and below normal from 200 to 900 meters.
September: In 1932 the silicate content was below average from the surface to 900
meters, with the exception of 700 meters, which was above average, and 800 meters which was average; the values were low for the year from 20 to 200 meters. In 1933 there are no records for September. In 1934, the values were consistently subnormal from the surface to 900 meters. The average for the two years showed all values to be below the general average, except for the 900 meter level which was normal.
October: In October of 1932 the silicate values were above average in the upper 40 meters of water, average at 60 meters, below average from 80 to 400 meters, and above average from 500 to 900 meters. In 1933 the content was subnormal from the surface to 500 meters, except for the 20 meter level, which was above average; it was above average at 600 and 700 meters, and below average at 800 and 900 meters. In 1934 the values were below normal from the surface to 200 meters, with the exception of the 20 meter level; from 300 to 500 meters they were above average, from 600 to 700 meters they were below average, and at 800 and 900 meters they were again above average. The three years average showed subnormal values from the surface to 300 meters, with the exception of the 20
This content downloaded from 194.29.185.145 on Wed, 25 Jun 2014 05:17:17 AMAll use subject to JSTOR Terms and Conditions
PHELPS: SILICATE CONTENT OF MONTEREY BAY, CALIFORNIA 169
meter level; at 400 meters they were average and from 500 to 900 meters they were above normal, except for the 700 meter level, which was below average.
November: In 1932 the content was below average from the surface to 400 meters, and above average from 500 to 800 meters; the lowest values of the year occurred at 300 meters. In 1933 all values were below average from the surface to 900 meters. In 1934 they were below normal from the surface to 200 meters, and above normal from 300 to 900 meters; the highest content of the year occurred at 900 meters. The three years average showed subnormal values from the surface to 400 meters; at 500 and 600 meters they were about
average, and from 700 to 900 meters they were again subnormal. December: In December of 1932 the values were below average from the surface to
300 meters, and above average from 400 to 900 meters; from 700 to 900 meters occurred the highest values of the year. In 1933 the silicate content was very subnormal, showing the lowest values of the year from the surface to 900 meters; too much significance cannot be placed in these data, since only one set of observations was made during this month in 1933. In 1934 the content was subnormal from the surface to 900 meters, except for the 400 and 800 meter levels, which were about average. The lowest values of the year occurred at 20, 600, 700 and 900 meters. The three year average showed subnormal values from the surface to 700 meters, and average values at 800 and 900 meters.
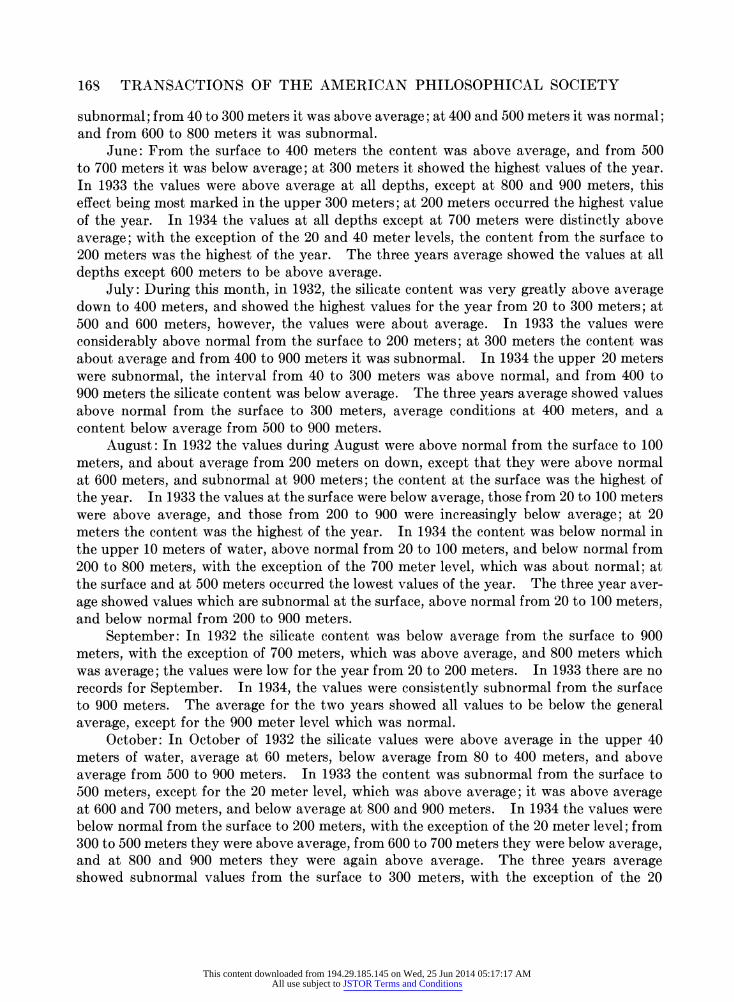
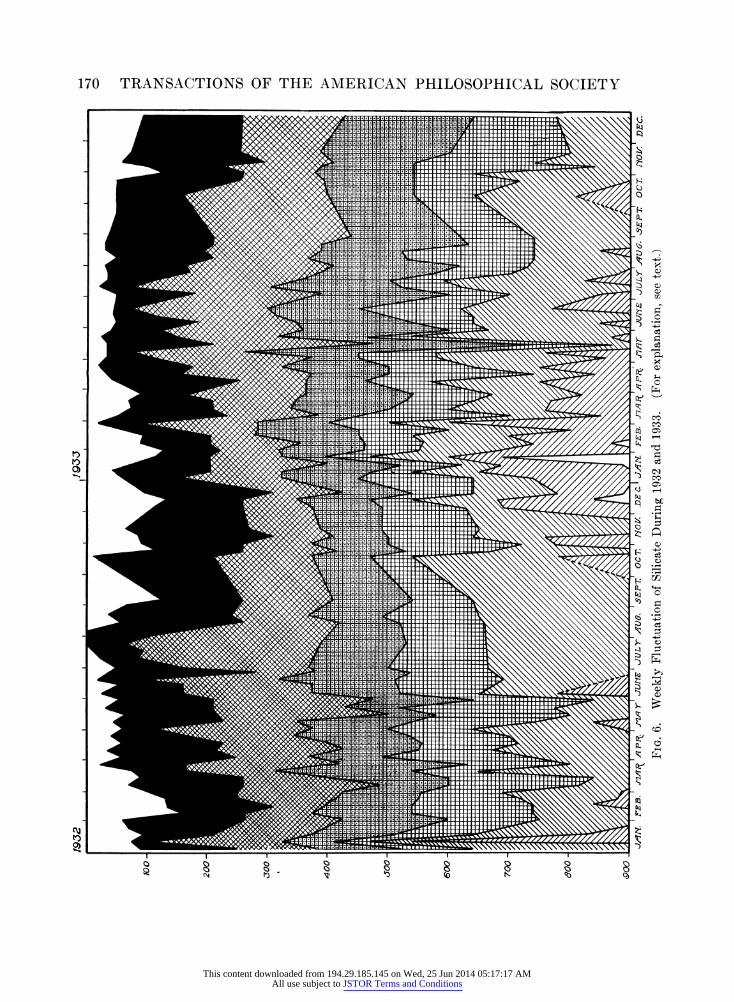
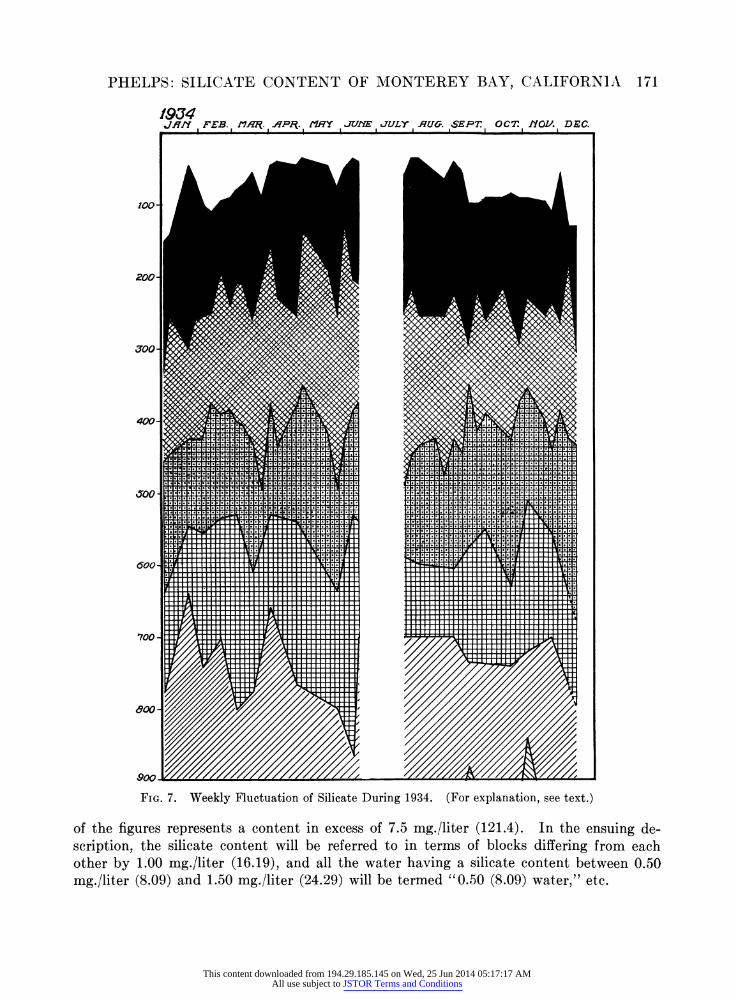
THE ANNUAL CYCLE The annual cycle of the silicate content of the water of Monterey Bay is shown in
Figs. 6 and 7. These graphs are constructed on the same principle as that employed by Skogsberg ('36) in depicting the seasonal cycle of the temperature of the bay, and they are designed to show the weekly fluctuations in the concentration of silicon, with respect to depth. The ordinates represent depths expressed in meters, and the abscissae represent time. The silicate content of the water is indicated in each graph by means of different areas, the limits of which represent units of concentration. When certain units of concen- tration were found to occur between two of the levels which were actually sampled, the
depth at which these units occurred was found by interpolation, assuming that the silicate content increased at a uniform rate with depth. This assumption was not always perfectly justified, but nevertheless it is felt that the errors so introduced were unimportant. The limits of the various areas are 1.00 mg./liter (16.19X10⁻³ mg. atom/kilo)5 apart beginning with 1.50 mg./liter (24.29), and each area may be distinguished by a characteristic design. The blank area at the top of the figures represents a silicate content of less than 1.5 (24.29), the black area, a content of 1.5-2.5 mg./liter (24.29-40.48), the diagonally crosshatched area, a content of 2.5-3.5 mg./liter (40.48-56.67), the area marked by vertical crosshatching with dots, 3.5-4.5 mg./liter (56.67-72.86), the area marked by vertical crosshatching without dots, 4.5-5.5 mg./liter (72.86-89.05), the area marked by diagonal lining sloping upward to the right, 5.5-6.5 mg./liter (89.05-105.2), the area marked by diagonal lining sloping upward to the left, 6.5-7.5 mg./liter (105.2-121.4), and finally the blank area at the bottom
5 All the data reported in the present work have been collected and tabulated in units of mg./liter of Si02. Inasmuch as there is at present a strong tendency among oceanographers toward expressing most of their chemical data in terms of mg. atoms/kilo, and since many investigators have come to think in these terms, both units are given in this paper, the units in parentheses referring in every case to mg. atoms/kilo X 10-3 of Si. In all future papers on the chemistry of Monterey Bay, the data will be reported in accordance with the suggestions of Carter, Moberg, Skogsberg, and Thompson ('34).
This content downloaded from 194.29.185.145 on Wed, 25 Jun 2014 05:17:17 AMAll use subject to JSTOR Terms and Conditions
170 TRANSACTIONS OF THE AMERICAN PHILOSOPHICAL SOCIETY
Ci P4 Q
t0 t') 0)
I'
0)
0
C)
Cl CC
b-D
Cr C
Q
ce
cl
bL
4
.4
rq 1s
O Q
0 0 0 0 CM1
0 0 "
0 (08
0 0i
I
4
This content downloaded from 194.29.185.145 on Wed, 25 Jun 2014 05:17:17 AMAll use subject to JSTOR Terms and Conditions
PHELPS: SILICATE CONTENT OF MONTEREY BAY, CALIFORNIA 171
FIG. 7. Weekly Fluctuation of Silicate During 1934. (For explanation, see text.)
of the figures represents a content in excess of 7.5 mg./liter (121.4). In the ensuing de- scription, the silicate content will be referred to in terms of blocks differing from each other by 1.00 mg./liter (16.19), and all the water having a silicate content between 0.50 mg./liter (8.09) and 1.50 mg./liter (24.29) will be termed "0.50 (8.09) water," etc.
This content downloaded from 194.29.185.145 on Wed, 25 Jun 2014 05:17:17 AMAll use subject to JSTOR Terms and Conditions
172 TRANSACTIONS OF THE AMERICAN PHILOSOPHICAL SOCIETY
It is only in the upper 200 meters of water that a distinct annual rhythm is evident, so the detailed description will be confined to this region. Beginning with January, 1932 it will be seen that during this month the upper 75 meters was occupied by 0.50 (8.09) water, and the remainder by 1.50 (24.29) water, except for a single pulse of 2.50 (40.47) water which came up almost to the 100 meter level in the second week. During February the silicate content was decidedly lower, the upper 130 meters being occupied largely by 0.50 (8.09) water, and the deeper layer by 1.50 (24.29) water. It is the last time until the following September that 0.50 (8.09) water invaded the region below 100 meters. In March the silicate content of the upper 200 meters became noticeably higher. The 1.50 (24.29) water climbed up as high as to the 25 meter level, and for the second time during the year the lower layers were occupied by 2.50 (40.47) water. During April conditions were very stable, the upper 50 meters of water being occupied by 0.50 (8.09) water, and the remainder by 1.50 (24.29) water. There was an increase in the silicate content in May; the 50 meter level was occupied by 1.50 (24.29) water during the latter part of the month, and both at the beginning and again at the end of May the deeper portions of the upper 200 meters were invaded by 2.50 (40.47) water. In June the silicate continued to increase, and the 1.50 (24.29) water came up as high as the 20 meter level; at the same time the 2.50
(40.47) water extended on one occasion as high as the 100 meter level. The climax of this continuing increase in silicate content came in July. It is seen that during the latter part of this month 0.50 (8.09) water was entirely driven out of the bay, the upper layers being occupied up to the surface by 1.50 (24.29) water. The deeper portion of the upper 200 meters was occupied entirely by 2.50 (40.47) water, and this latter came up to the 65 meter level, this being the highest point reached by it during the whole year. In August there was a sharp and strongly marked falling off in concentration. The 0.50 (8.09) water re- turned to the bay, and descended to the 50 meter level. The region from 100 to 200 meters was occupied entirely by 1.50 (24.29) water for almost the entire month. During the last week in August and the first week in September, the falling off in silicate content was more strongly marked than at any other time during the entire year. By the end of the first week in September the 0.50 (8.09) water had descended to the 130 meter level, and the remainder of the upper 200 meters was occupied by 1.50 (24.29) water. Unfortunately no observations were made between the first week in September and the middle of October, so we know nothing concerning the silicate content of the water during that time. In the middle of October the content had risen again somewhat, but it fell off immediately, so that by the end of October the values were almost as low as they were in the first part of September. During November the silicate content rose a little in the first two weeks of the month, and fell off a little during the latter part; during the whole month, however, it was decidedly low. In the beginning of December the values fell off very markedly, the 0.50 (8.09) water descended as low as 130 meters, and the next 70 meters were occupied by 1.50 (24.29) water; but during the latter part of the month there was a recovery.
In 1933 the silicate content of the upper 200 meters of water was found to be on the whole distinctly higher than in 1932. This may not at first be apparent upon examination of Fig. 6, because of the fact that the highest points reached by the 1.50 (24.29) water and by the 2.50 (40.47) water were achieved in 1932, when the former water reached the surface, and the latter water came up to the 65 meter level, an occurrence unparallelled in 1933. That the silicate content was actually higher in 1933 is shown by the fact that the 1.50
This content downloaded from 194.29.185.145 on Wed, 25 Jun 2014 05:17:17 AMAll use subject to JSTOR Terms and Conditions
PHELPS: SILICATE CONTENT OF MONTEREY BAY, CALIFORNIA 173
(24.29) water invaded the upper 50 meters during a total of 182 days in this year, whereas in 1932 it was present for only 108 days in that region. Similarly, in 1933 the 2.50 (40.47) water was found in the upper 200 meters during 188 days, while in 1932 it was present for
only 110 days. Starting in January 1933, the water was found to contain an average amount of
silicate; the upper 50 meters was occupied by 0.50 (8.09) water and the remainder by 1.50
(24.29). Toward the latter part of the month, however, there was a strong falling off in the content of the upper layers and the 0.50 (8.09) water descended as far as the 125 meter level, a depth which was achieved only once again during the entire year, in the latter
part of October. During February there was a tremendously strong sudden surge upward of the silicate content, so that by the end of the month the 1.50 (24.29) water had reached the 20 meter level, one of the three highest points of the year. Similarly, the 2.50 (40.47) water came up above the 100 meter level at that time. During March there was another falling off in the silicate, the upper 50 meters of water being occupied by 0.50 (8.09) water, and the remainder containing almost entirely 1.50 (24.29) water. In April came the increase in silicate which was to last through the rest of the spring, and through the summer; the 1.50 (24.29) water came up to the 30 meter level and the 2.50 (40.47) water climbed
steadily until by the end of the month it had reached the 100 meter level. During May the depth of the 0.50 (8.09) water remained quite constant at 30-40 meters, but during the middle of this month the 2.50 (40.47) water left the upper 200 meters for a short time. In June the upper portion of the water varied very little and showed a slightly lower silicate content than in May; the lower portion was irregular, the 2.50 (40.47) water coming up almost to the 100 meter level in the middle of the month, and leaving the upper 200 meters altogether at the end of the month. In July the upper layers were just about the same as they were in May, but in the lower levels the silicate showed a sharp decrease during the month. In August the upper layers remained practically unchanged, with the 0.50 (8.09) water extending down to the region of the 30 meter level; in the deeper layers, however, the silicate content was reduced so that during most of the month the 2.50 (40.47) water was entirely pushed out by 1.50 (24.29) water. No data were collected during September or the first part of October. During the latter part of October there was a very sharp falling off in the silicate, the 1.50 (24.29) water descended to the 125 meter level, and the 2.50
(40.47) water left the upper 200 meters for the rest of the year. In the upper layers, in November, the 1.50 (24.29) water at first rose sharply and then gradually settled back until
by the end of December it lay at a depth of 95-100 meters. The condition of the water at that time was very similar to that found in the first part of January 1932 and at the end of December of the same year.
January of 1934 was marked by a steady encroachment of the upper layers by 1.50 (24.29) water, which started with its upper limits at 150 meters and by the third week reached as high as the 45 meter level. During the last week of January, however, the silicate content fell rapidly, and by the middle of February the 0.50 (8.09) water had descended to the 110 meter level, the last time that it reached to such a depth until November. From the middle of February until the first of May there was an almost unbroken increase in the silicate content of the water, at the end of which time the 1.50 (24.29) water had come up to the 35 meter level. During this period the 2.50 (40.47) water made its first appearance of the year and invaded the upper 200 meters three times,
This content downloaded from 194.29.185.145 on Wed, 25 Jun 2014 05:17:17 AMAll use subject to JSTOR Terms and Conditions
174 TRANSACTIONS OF THE AMERICAN PHILOSOPHICAL SOCIETY
each time rising higher and remaining longer. In the first three weeks of May there was a gradual decrease in silicate which was followed by an increase so that by the middle of June the conditions were about the same as they were in the beginning of May. In the beginning of June occurred the greatest upwelling during the year of the 2.50 (40.47) water, which reached the 125 meter level and then promptly receded. This water did not appear again in the upper 200 meters until the end of December. There are no data available for the last half of June and the first three weeks of July. At the end of July the conditions were the same as they were early in June, except that the 1.50 (24.29) water extended deeper. During the first three weeks of August there was a slight decrease in the silicate, followed by an increase during the last week. In September there was a sharp and persistent decrease in the silicate, and the 0.50 (8.09) water descended from the upper 30 to 60 meters where it was during the spring and summer, to the 100 meter level. Through October and November the condition of the water was about the same as it was at the end of September, the upper 100 meters being occupied by 1.50 (24.29) water. The first few days in December were marked by a brief but pronounced upwelling of 1.50 (24.29) water which came as high as the 55 meter level. This was followed by an equally sharp falling off, so that by the middle of the month the 1.50 (24.29) water was not found above 130 meters. During this last sharp decline of the silicate content of the upper 150 meters of water there was a brief upwelling of deeper water which brought the 2.50 (40.47) water into the upper 200 meters for a few days.
Combining and summing up briefly the data of the three years, we find evidence of a distinct annual cycle. In January the water was of about average silicate content but the latter was decreasing so that by the end of January and in February it was definitely sub- normal. Following this there was a general rise in silicate content which continued during most of the spring and then evened off, leaving a high content during the latter part of the spring and summer. Toward the end of July and in August the silicate fell off more or less sharply and from October through December this decline continued, but at a slower rate.
In regard to the water below 200 meters it is impossible to draw general conclusions from the limited data at hand. It will be seen that in 1932 there was no general trend observable below the 200-300 meter level, except possibly for an increase in the silicate content during the last three months of the year in the deeper layers. In 1933 on the other hand, there was a marked increase in the silicate content during January and Febru- ary, followed by a very gradual decrease during the remainder of the year, so that during almost all of that year the content was higher than in 1932. This feature was particularly marked in the deep water; thus, 6.5 (105.23) water entered the bay only six times from January 1932 to December of that year, and each time it remained for not more than two to three weeks,6 while from December 1932 to May 1933 6.5 (105.23) water was found in the bay without interruption, and from May through August it was present about half the time. Likewise, prior to December 1932, 7.5 (121.41) water was not found in the bay, but during that month, and January and February of 1933 it was found on three occasions.
6 It should be noted, however, that there was a possible exception to this statement, namely the period following June 5th. Unfortunately, owing to a broken cable, no observations were made below 700 meters during the summer of 1932. Likewise, the length of time that 6.5 (105.23) water remained in the bay is uncertain in two other cases, for about six weeks in September and October of 1932 and 1933 respec- tively, owing to missing data.
This content downloaded from 194.29.185.145 on Wed, 25 Jun 2014 05:17:17 AMAll use subject to JSTOR Terms and Conditions
PHELPS: SILICATE CONTENT OF MONTEREY BAY, CALIFORNIA 175
Despite the fact that only half as many observations were made in the deeper water in 1934 as during the two preceding years, there is sufficient data to indicate that there was no definite seasonal trend or cycle during that year. Throughout 1934 the conditions were just about the same as they were during the first nine months of 1932, except that from 800 to 900 meters the water showed a slightly lower concentration.
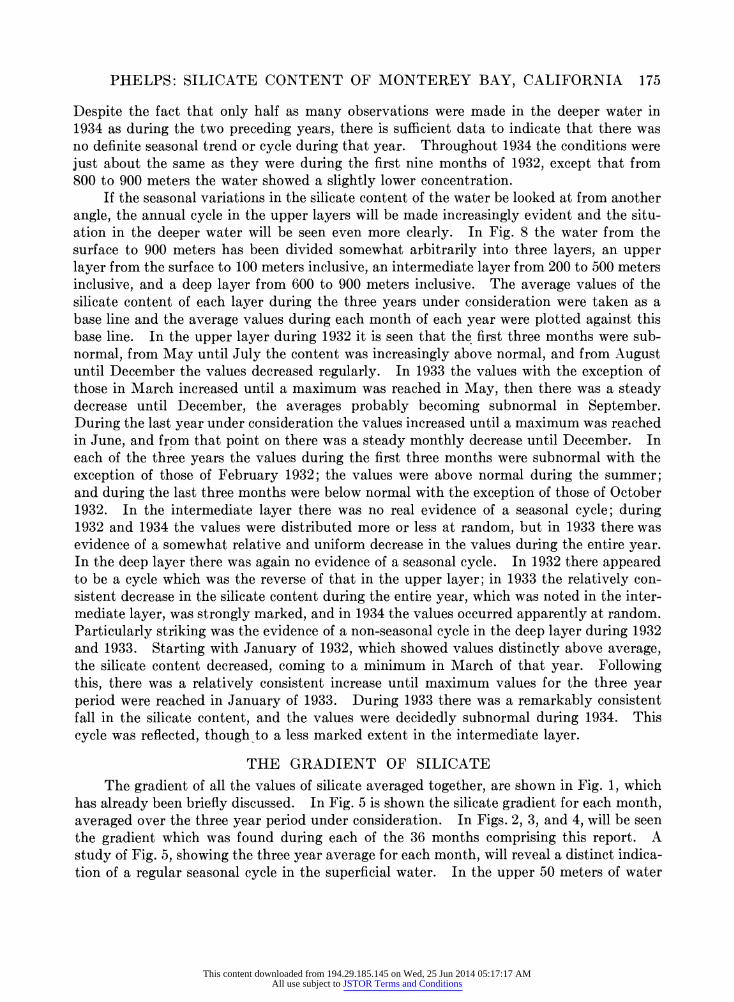
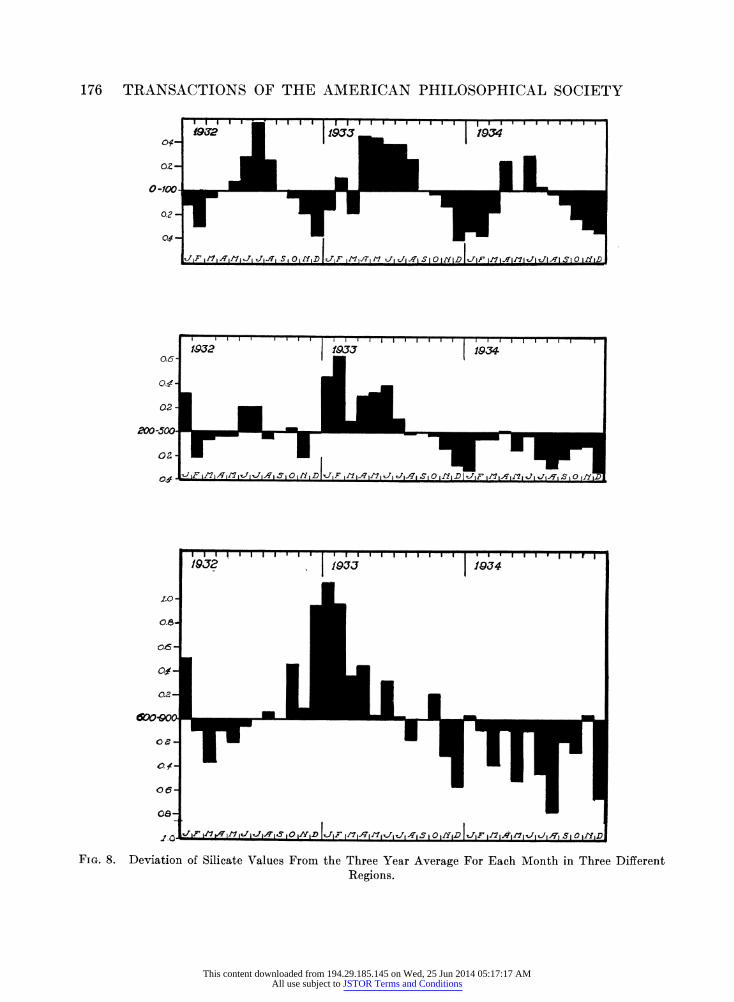
If the seasonal variations in the silicate content of the water be looked at from another angle, the annual cycle in the upper layers will be made increasingly evident and the situ- ation in the deeper water will be seen even more clearly. In Fig. 8 the water from the surface to 900 meters has been divided somewhat arbitrarily into three layers, an upper layer from the surface to 100 meters inclusive, an intermediate layer from 200 to 500 meters inclusive, and a deep layer from 600 to 900 meters inclusive. The average values of the silicate content of each layer during the three years under consideration were taken as a base line and the average values during each month of each year were plotted against this base line. In the upper layer during 1932 it is seen that the first three months were sub- normal, from May until July the content was increasingly above normal, and from August until December the values decreased regularly. In 1933 the values with the exception of those in March increased until a maximum was reached in May, then there was a steady decrease until December, the averages probably becoming subnormal in September. During the last year under consideration the values increased until a maximum was reached in June, and from that point on there was a steady monthly decrease until December. In each of the three years the values during the first three months were subnormal with the exception of those of February 1932; the values were above normal during the summer; and during the last three months were below normal with the exception of those of October 1932. In the intermediate layer there was no real evidence of a seasonal cycle; during 1932 and 1934 the values were distributed more or less at random, but in 1933 there was evidence of a somewhat relative and uniform decrease in the values during the entire year. In the deep layer there was again no evidence of a seasonal cycle. In 1932 there appeared to be a cycle which was the reverse of that in the upper layer; in 1933 the relatively con- sistent decrease in the silicate content during the entire year, which was noted in the inter- mediate layer, was strongly marked, and in 1934 the values occurred apparently at random. Particularly striking was the evidence of a non-seasonal cycle in the deep layer during 1932 and 1933. Starting with January of 1932, which showed values distinctly above average, the silicate content decreased, coming to a minimum in March of that year. Following this, there was a relatively consistent increase until maximum values for the three year period were reached in January of 1933. During 1933 there was a remarkably consistent fall in the silicate content, and the values were decidedly subnormal during 1934. This cycle was reflected, though to a less marked extent in the intermediate layer.
THE GRADIENT OF SILICATE
The gradient of all the values of silicate averaged together, are shown in Fig. 1, which has already been briefly discussed. In Fig. 5 is shown the silicate gradient for each month, averaged over the three year period under consideration. In Figs. 2, 3, and 4, will be seen the gradient which was found during each of the 36 months comprising this report. A study of Fig. 5, showing the three year average for each month, will reveal a distinct indica- tion of a regular seasonal cycle in the superficial water. In the upper 50 meters of water
This content downloaded from 194.29.185.145 on Wed, 25 Jun 2014 05:17:17 AMAll use subject to JSTOR Terms and Conditions
176 TRANSACTIONS OF THE AMERICAN PHILOSOPHICAL SOCIETY
O0-
0.2 -
04-
i932
V d1FJ i,g,iAi1j, Jil, .S1 OZDyiDi O0 r7F IIt ISIOIi 0 I
FIG. 8. Deviation of Silicate Values From the Three Year Average For Each Month in Three Different Regions.
. . . . - . - . - -- .-- .- 1- - - .- --.- .--brvmo
This content downloaded from 194.29.185.145 on Wed, 25 Jun 2014 05:17:17 AMAll use subject to JSTOR Terms and Conditions
PHELPS: SILICATE CONTENT OF MONTEREY BAY, CALIFORNIA 177
the gradient was low in the winter, rose through the spring, reached a maximum in the summer, and fell off during the autumn. The gradient from 80 to 200 meters was much lower during the 4 months from May to August than it was during the remainder of the year. Below 200 meters there was no evident seasonal cycle; however, there was one phe- nomenon in the deeper water which was so definitely marked that it is deserving of special mention. This was the striking consistency of the deep water maximum gradient which occurred during 8 months between the 500 meter and the 600 meter levels and during the other four months (January, May, June and December) just below this, in the region between 600 meters and 700 meters. A comparison of the silicate gradient found in Monterey Bay with that found by Graham during the cruise of the "Carnegie" is of par- ticular interest. At 16 stations lying between Lats. 20? N. and 34? N. in the Pacific Ocean this investigator found that the silicate gradient formed a smooth sigmoid curve; the gradient was very low in the upper 100 meters of water and increased until it reached a maximum between 400 and 500 meters, following which it decreased steadily with increasing depth. In the southern group, comprising 12 stations between Lats. 20? N. and 14? S., the silicate gradient was much more constant from the surface to a very considerable depth; in- deed, the increase in silicate with depth was practically linear from the surface to 300 meters and from 700 meters to 1500 meters. There was, however, a clearly marked maximum in the silicate gradient between the 500 meter and the 600 meter levels. The northern group of "Carnegie" stations showed a much lower silicate gradient in the upper 100 meters than occurs in Monterey Bay; from 100 meters to 300 meters the silicate gradient was about the same as that found in the bay; and from 300 to 900 meters the gradient was very con- siderably greater. Curiously enough the gradient found in the " Carnegie's" tropical group of stations resembled that found in Monterey Bay more closely than did the gradient found in the Temperate Zone. The silicate increased with depth far less in the upper 100 meters at the southern stations than in Monterey Bay, but from 100 to 900 meters the gradient followed very much the same course as that in the bay, except that it was slightly less steep. It is of particular interest to note that the deep water maximum of gradient occurring in Monterey Bay between 500 and 700 meters was clearly reflected in the "Car- negie" data. In the more northerly group of stations this maximum occurred between 400 and 500 meters, whereas in the tropical group of stations it lay between the 500 and 600 meter levels. The great difference in gradient in the upper 100 meters between Monterey Bay and the open waters of the Pacific Ocean is undoubtedly due to the strong upwelling of deep water which occurs in the former region. This upwelling furnishes the surface layers with a high concentration of nutrient salts, including silicate, and thus permits the flourishing of a much heavier plankton population than is found in the open ocean. The heavier plankton population tends to create a higher gradient in the upper 100 meters of water by using up the nutrient salts in the photosynthetic zone and by increasing the con- centration of these salts below the photosynthetic zone as a result of the dissolution of their sinking dead bodies.
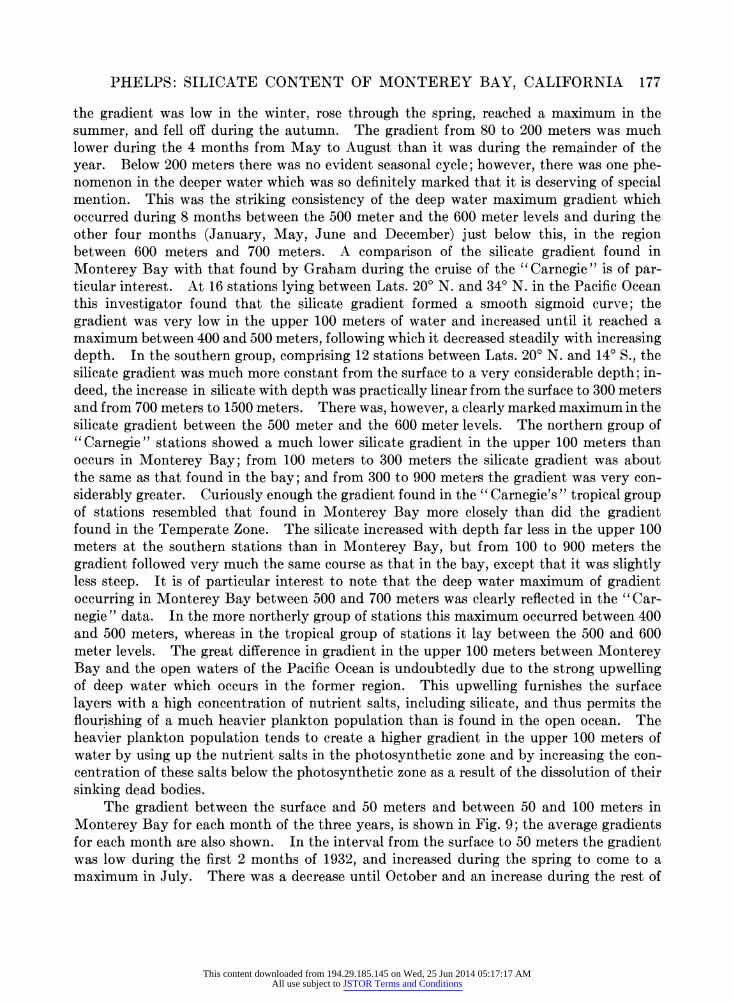
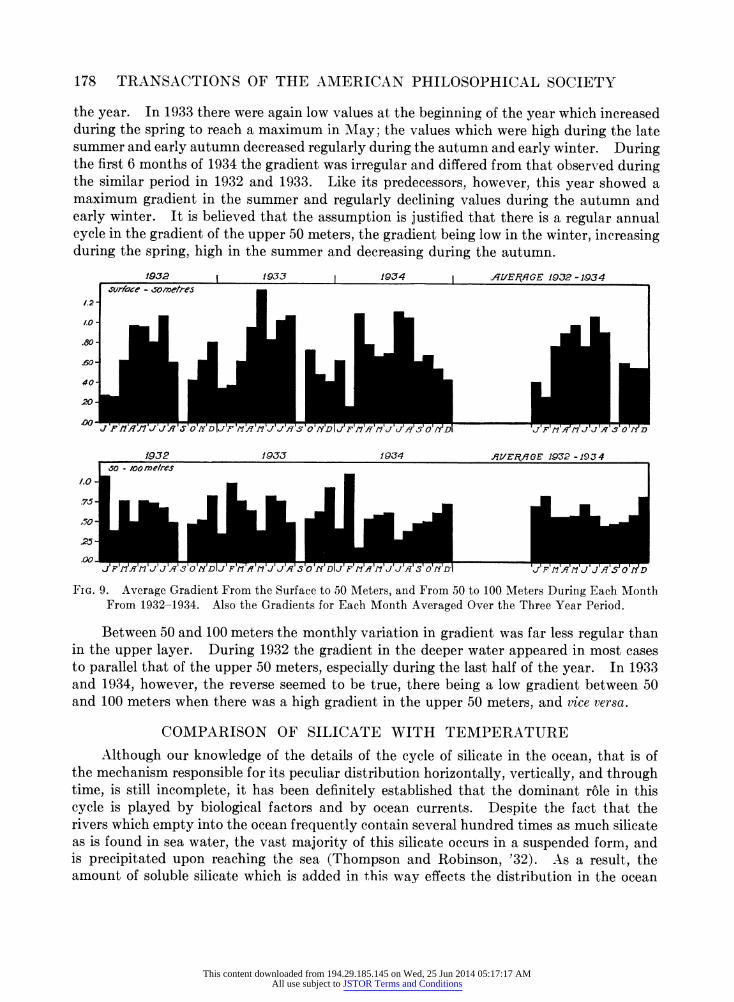
The gradient between the surface and 50 meters and between 50 and 100 meters in Monterey Bay for each month of the three years, is shown in Fig. 9; the average gradients for each month are also shown. In the interval from the surface to 50 meters the gradient was low during the first 2 months of 1932, and increased during the spring to come to a maximum in July. There was a decrease until October and an increase during the rest of
This content downloaded from 194.29.185.145 on Wed, 25 Jun 2014 05:17:17 AMAll use subject to JSTOR Terms and Conditions
178 TRANSACTIONS OF THE AMERICAN PHILOSOPHICAL SOCIETY
the year. In 1933 there were again low values at the beginning of the year which increased during the spring to reach a maximum in May; the values which were high during the late summer and early autumn decreased regularly during the autumn and early winter. During the first 6 months of 1934 the gradient was irregular and differed from that observed during the similar period in 1932 and 1933. Like its predecessors, however, this year showed a maximum gradient in the summer and regularly declining values during the autumn and early winter. It is believed that the assumption is justified that there is a regular annual cycle in the gradient of the upper 50 meters, the gradient being low in the winter, increasing during the spring, high in the summer and decreasing during the autumn.
/.2
.0o
.80
.60
40
20
.00
1932 1 1933 1 1934 I AL/ERflGE 1932 -1934
I 9u1rface - sometres
J FI 1RIJ2JRJO DJt' I r IJ JfPI SOND J F'IffIJJ SO'Di l 'Af IEI 2' - I
1932 1933 1934 fI/ER7fGE 1932 -19334 s.-_ IO - /oo me/res /.O
.75
.50
.23
.00
JF nI X Jn J J S5O'N DJF 1 lJJASO DIJ F JAJNJDJ J AF J S OP t Di- fJF n f J F AJIflSO vD
FIG. 9. Average Gradient From the Surface to 50 Meters, and From 50 to 100 Meters During Each Month From 1932-1934. Also the Gradients for Each Month Averaged Over the Three Year Period.
Between 50 and 100 meters the monthly variation in gradient was far less regular than in the upper layer. During 1932 the gradient in the deeper water appeared in most cases to parallel that of the upper 50 meters, especially during the last half of the year. In 1933 and 1934, however, the reverse seemed to be true, there being a low gradient between 50 and 100 meters when there was a high gradient in the upper 50 meters, and vice versa.
COMPARISON OF SILICATE WITH TEMPERATURE
Although our knowledge of the details of the cycle of silicate in the ocean, that is of the mechanism responsible for its peculiar distribution horizontally, vertically, and through time, is still incomplete, it has been definitely established that the dominant role in this cycle is played by biological factors and by ocean currents. Despite the fact that the rivers which empty into the ocean frequently contain several hundred times as much silicate as is found in sea water, the vast majority of this silicate occurs in a suspended form, and is precipitated upon reaching the sea (Thompson and Robinson, '32). As a result, the amount of soluble silicate which is added in this way effects the distribution in the ocean
This content downloaded from 194.29.185.145 on Wed, 25 Jun 2014 05:17:17 AMAll use subject to JSTOR Terms and Conditions
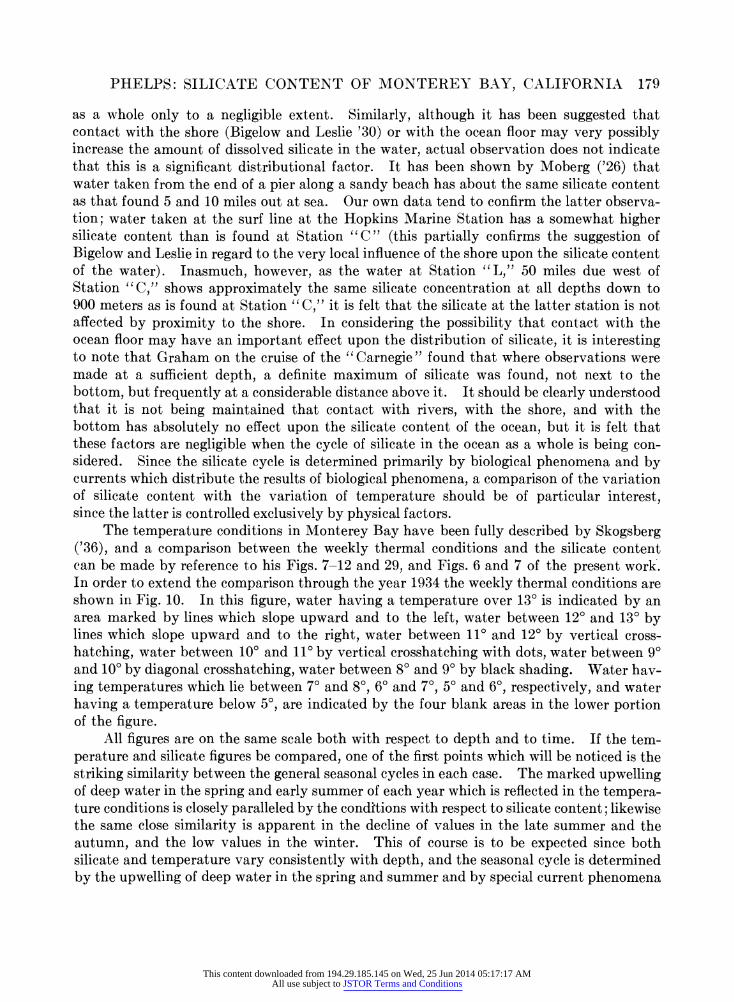
PHELPS: SILICATE CONTENT OF MONTEREY BAY, CALIFORNIA 179
as a whole only to a negligible extent. Similarly, although it has been suggested that contact with the shore (Bigelow and Leslie '30) or with the ocean floor may very possibly increase the amount of dissolved silicate in the water, actual observation does not indicate that this is a significant distributional factor. It has been shown by Moberg ('26) that water taken from the end of a pier along a sandy beach has about the same silicate content as that found 5 and 10 miles out at sea. Our own data tend to confirm the latter observa- tion; water taken at the surf line at the Hopkins Marine Station has a somewhat higher silicate content than is found at Station "C" (this partially confirms the suggestion of Bigelow and Leslie in regard to the very local influence of the shore upon the silicate content of the water). Inasmuch, however, as the water at Station "L," 50 miles due west of Station "C," shows approximately the same silicate concentration at all depths down to 900 meters as is found at Station "C," it is felt that the silicate at the latter station is not affected by proximity to the shore. In considering the possibility that contact with the ocean floor may have an important effect upon the distribution of silicate, it is interesting to note that Graham on the cruise of the "Carnegie" found that where observations were made at a sufficient depth, a definite maximum of silicate was found, not next to the bottom, but frequently at a considerable distance above it. It should be clearly understood that it is not being maintained that contact with rivers, with the shore, and with the bottom has absolutely no effect upon the silicate content of the ocean, but it is felt that these factors are negligible when the cycle of silicate in the ocean as a whole is being con- sidered. Since the silicate cycle is determined primarily by biological phenomena and by currents which distribute the results of biological phenomena, a comparison of the variation of silicate content with the variation of temperature should be of particular interest, since the latter is controlled exclusively by physical factors.
The temperature conditions in Monterey Bay have been fully described by Skogsberg ('36), and a comparison between the weekly thermal conditions and the silicate content can be made by reference to his Figs. 7-12 and 29, and Figs. 6 and 7 of the present work. In order to extend the comparison through the year 1934 the weekly thermal conditions are shown in Fig. 10. In this figure, water having a temperature over 13? is indicated by an area marked by lines which slope upward and to the left, water between 12? and 13? by lines which slope upward and to the right, water between 11? and 12? by vertical cross- hatching, water between 10? and 11? by vertical crosshatching with dots, water between 9? and 10? by diagonal crosshatching, water between 8? and 9? by black shading. Water hav- ing temperatures which lie between 7? and 8?, 6? and 7?, 5? and 6?, respectively, and water having a temperature below 5?, are indicated by the four blank areas in the lower portion of the figure.
All figures are on the same scale both with respect to depth and to time. If the tem- perature and silicate figures be compared, one of the first points which will be noticed is the striking similarity between the general seasonal cycles in each case. The marked upwelling of deep water in the spring and early summer of each year which is reflected in the tempera- ture conditions is closely paralleled by the conditions with respect to silicate content; likewise the same close similarity is apparent in the decline of values in the late summer and the autumn, and the low values in the winter. This of course is to be expected since both silicate and temperature vary consistently with depth, and the seasonal cycle is determined by the upwelling of deep water in the spring and summer and by special current phenomena
This content downloaded from 194.29.185.145 on Wed, 25 Jun 2014 05:17:17 AMAll use subject to JSTOR Terms and Conditions
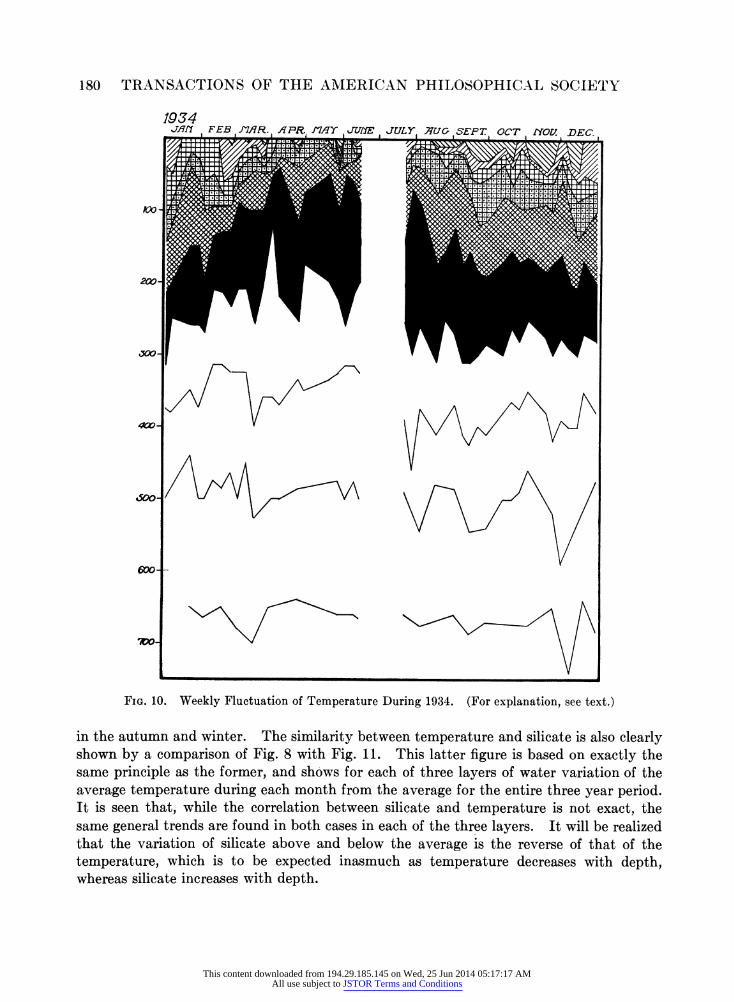
180 TRANSACTIONS OF THE AMERICAN PHILOSOPHICAL SOCIETY
1934 J,SY FEB J'IAfR. F,qP rl,q .irY .Arrr vJe JULY c- -SFP'r r'7-' rmr, Tn-
FIG. 10. Weekly Fluctuation of Temperature During 1934. (For explanation, see text.)
in the autumn and winter. The similarity between temperature and silicate is also clearly shown by a comparison of Fig. 8 with Fig. 11. This latter figure is based on exactly the same principle as the former, and shows for each of three layers of water variation of the average temperature during each month from the average for the entire three year period. It is seen that, while the correlation between silicate and temperature is not exact, the same general trends are found in both cases in each of the three layers. It will be realized that the variation of silicate above and below the average is the reverse of that of the temperature, which is to be expected inasmuch as temperature decreases with depth, whereas silicate increases with depth.
A- -11111 i 7 ., . 1-)T
L 1.A (VAl I I I VV LA/. C
o"I MI
~~~QRM: ~~~~~~~~I:1
: : I
This content downloaded from 194.29.185.145 on Wed, 25 Jun 2014 05:17:17 AMAll use subject to JSTOR Terms and Conditions
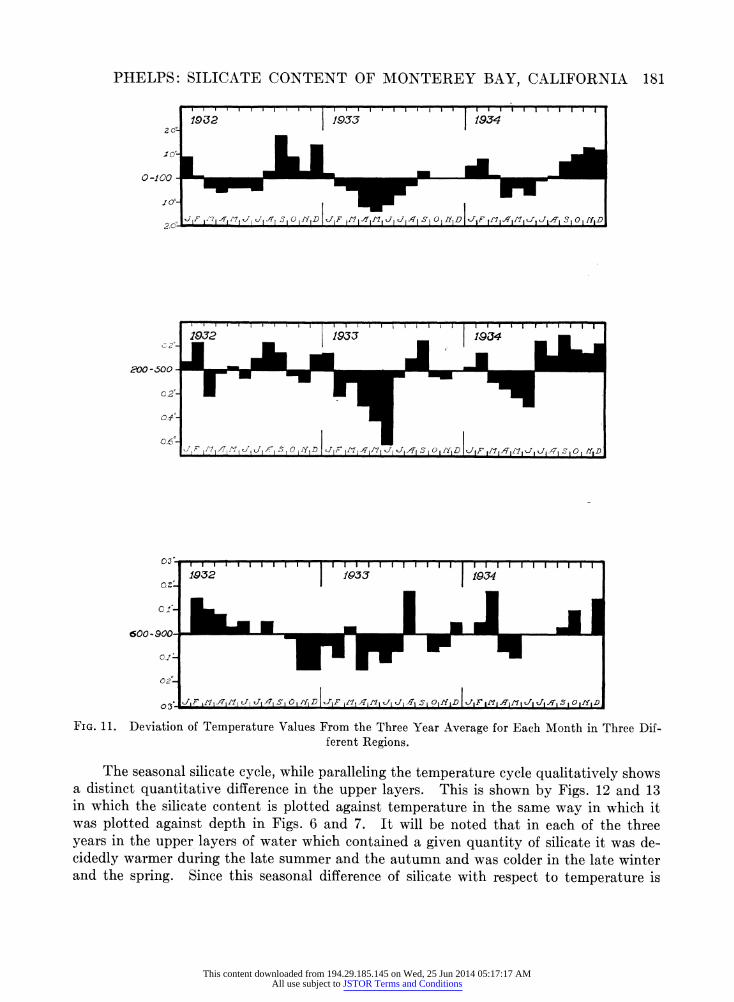
PHELPS: SILICATE CONTENT OF MONTEREY BAY, CALIFORNIA 181
o.2
?.6
0 1932 1 3 1 19R
02
600-900
03- 03- i i'I d 1 cJi fi.5 S 0, D -IF i,Ht, i l/YIt , J, -Tj S,I O| |2Y D |< d l |T v vxA I S |O1| HID
FIG. 11. Deviation of Temperature Values From the Three Year Average for Each Month in Three Dif- ferent Regions.
The seasonal silicate cycle, while paralleling the temperature cycle qualitatively shows a distinct quantitative difference in the upper layers. This is shown by Figs. 12 and 13 in which the silicate content is plotted against temperature in the same way in which it was plotted against depth in Figs. 6 and 7. It will be noted that in each of the three years in the upper layers of water which contained a given quantity of silicate it was de- cidedly warmer during the late summer and the autumn and was colder in the late winter and the spring. Since this seasonal difference of silicate with respect to temperature is
This content downloaded from 194.29.185.145 on Wed, 25 Jun 2014 05:17:17 AMAll use subject to JSTOR Terms and Conditions
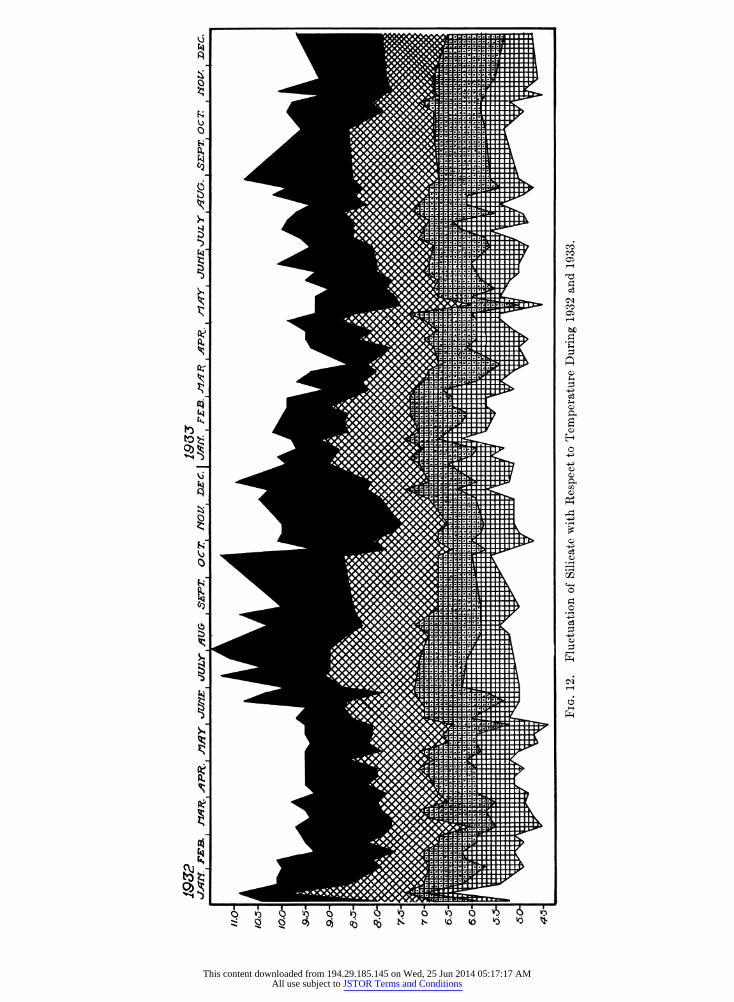
1932 1933 JJATPfI FEB. IJ1. API?. riffY JUZIE /JULY f/UG SEPT. OC7 NO1C DE2C. I JAffl. I FEB. I IAP?. I AY JUfIEUJVLY JUG. SEPT. OCT. O. DEC.
A A
&
k k.
v v
FIG. 12. Fluctuation of Silicate with Respect to Temperature During 1932 and 1933.
I1.0 o-
/103
/0.0
9.5
9.0
(9.0'
'.- 7O'
70
6.0
5.J
46.
6.05- _
&
This content downloaded from 194.29.185.145 on Wed, 25 Jun 2014 05:17:17 AMAll use subject to JSTOR Terms and Conditions
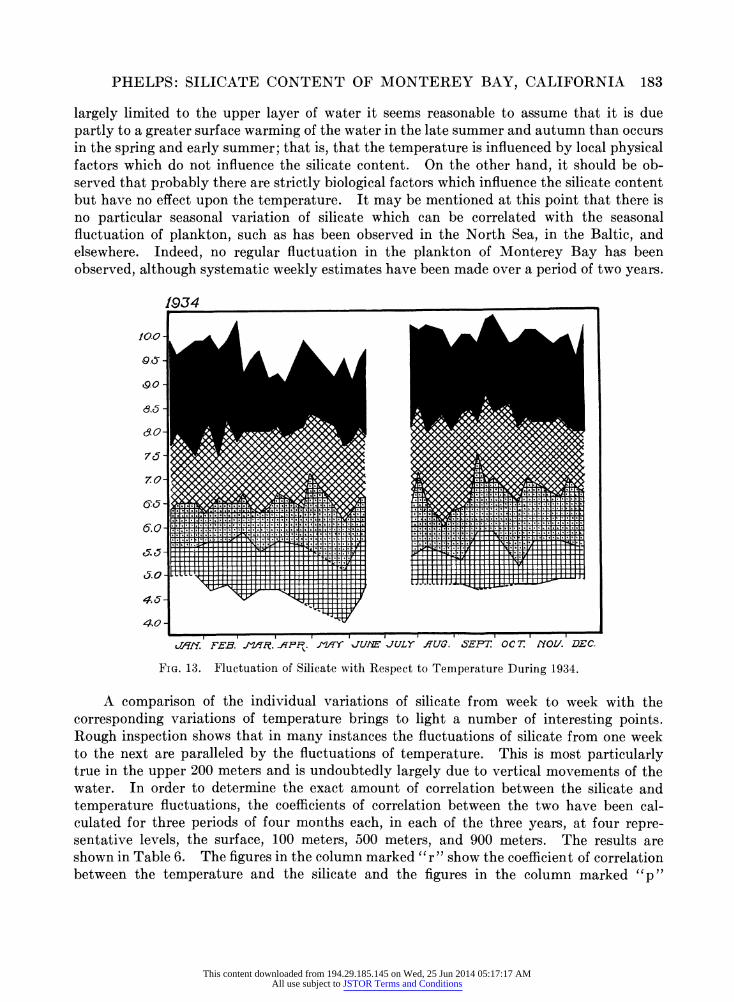
PHELPS: SILICATE CONTENT OF MONTEREY BAY, CALIFORNIA 183
largely limited to the upper layer of water it seems reasonable to assume that it is due partly to a greater surface warming of the water in the late summer and autumn than occurs in the spring and early summer; that is, that the temperature is influenced by local physical factors which do not influence the silicate content. On the other hand, it should be ob- served that probably there are strictly biological factors which influence the silicate content but have no effect upon the temperature. It may be mentioned at this point that there is no particular seasonal variation of silicate which can be correlated with the seasonal fluctuation of plankton, such as has been observed in the North Sea, in the Baltic, and elsewhere. Indeed, no regular fluctuation in the plankton of Monterey Bay has been observed, although systematic weekly estimates have been made over a period of two years.
f234
I0.0
9.o
.0-
7.0-
6.0
6.0 '
4.5]
4.0 I
JAfY. FEB. JATR. JfPF. P.JY IJUIE JULY .fUG. SEP7T OCT. OLI/. DEC.
FIG. 13. Fluctuation of Silicate with Respect to Temperature During 1934.
A comparison of the individual variations of silicate from week to week with the corresponding variations of temperature brings to light a number of interesting points. Rough inspection shows that in many instances the fluctuations of silicate from one week to the next are paralleled by the fluctuations of temperature. This is most particularly true in the upper 200 meters and is undoubtedly largely due to vertical movements of the water. In order to determine the exact amount of correlation between the silicate and temperature fluctuations, the coefficients of correlation between the two have been cal- culated for three periods of four months each, in each of the three years, at four repre- sentative levels, the surface, 100 meters, 500 meters, and 900 meters. The results are shown in Table 6. The figures in the column marked "r" show the coefficient of correlation between the temperature and the silicate and the figures in the column marked "p"
A % a dj._ i~~~~~~~~~~~~~~~~~~~~~~~~~~~~~~~~~~~~~~~~~~~~ A
This content downloaded from 194.29.185.145 on Wed, 25 Jun 2014 05:17:17 AMAll use subject to JSTOR Terms and Conditions
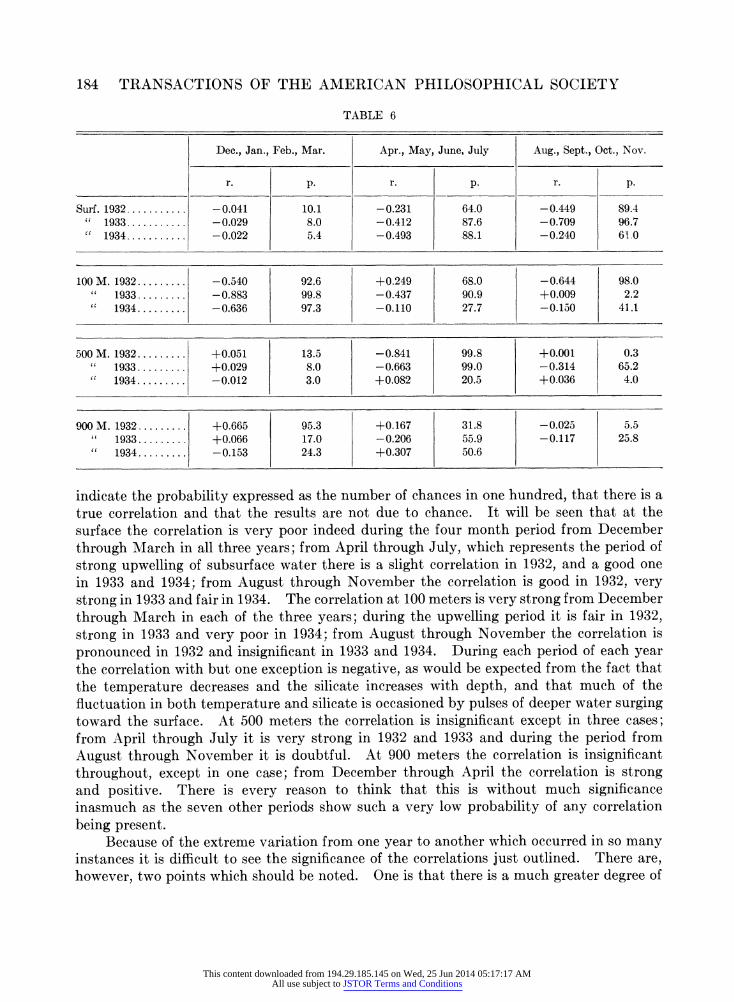
184 TRANSACTIONS OF THE AMERICAN PHILOSOPHICAL SOCIETY
TABLE 6
Dec., Jan., Feb., Mar. Apr., May, June, July Aug., Sept., Oct., Nov.
r. p. r. p. r. p.
Surf. 1932 ........... -0.041 10.1 -0.231 64.0 -0.449 89.4 1933 ........... -0.029 8.0 -0.412 87.6 -0.709 96.7
"
1934 ........... -0.022 5.4 -0.493 88.1 -0.240 61.0
100 M. 1932......... -0.540 92.6 +0.249 68.0 -0.644 98.0 1933 ........ -0.883 99.8 -0.437 90.9 +0.009 2.2
" 1934 ......... -0.636 97.3 -0.110 27.7 -0.150 41.1
500 M. 1932......... +0.051 13.5 -0.841 99.8 +0.001 0.3 1933......... +0.029 8.0 -0.663 99.0 -0.314 65.2
"
1934......... -0.012 3.0 +0.082 20.5 +0.036 4.0
indicate the probability expressed as the number of chances in one hundred, that there is a true correlation and that the results are not due to chance. It will be seen that at the surface the correlation is very poor indeed during the four month period from December through March in all three years; from April through July, which represents the period of
strong upwelling of subsurface water there is a slight correlation in 1932, and a good one in 1933 and 1934; from August through November the correlation is good in 1932, very strong in 1933 and fair in 1934. The correlation at 100 meters is very strong from December
through March in each of the three years; during the upwelling period it is fair in 1932, strong in 1933 and very poor in 1934; from August through November the correlation is
pronounced in 1932 and insignificant in 1933 and 1934. During each period of each year the correlation with but one exception is negative, as would be expected from the fact that the temperature decreases and the silicate increases with depth, and that much of the fluctuation in both temperature and silicate is occasioned by pulses of deeper water surging toward the surface. At 500 meters the correlation is insignificant except in three cases; from April through July it is very strong in 1932 and 1933 and during the period from August through November it is doubtful. At 900 meters the correlation is insignificant throughout, except in one case; from December through April the correlation is strong and positive. There is every reason to think that this is without much significance inasmuch as the seven other periods show such a very low probability of any correlation
being present. Because of the extreme variation from one year to another which occurred in so many
instances it is difficult to see the significance of the correlations just outlined. There are, however, two points which should be noted. One is that there is a much greater degree of
This content downloaded from 194.29.185.145 on Wed, 25 Jun 2014 05:17:17 AMAll use subject to JSTOR Terms and Conditions
PHELPS: SILICATE CONTENT OF MONTEREY BAY, CALIFORNIA 185
negative correlation at the surface and at 100 meters than at the two deeper strata. A second feature to be observed is the lack of correlation of any sort in the week to week fluctuation of silicate and of temperature which occurs so frequently in the upper layers and almost without exception in the deeper water. Temperature is generally considered to be one of the more reliable indices of the origin of a given body of water. Fluctuations in temperature in Monterey Bay are particularly significant in this respect and are due almost wholly to varying current phenomena, with the exception of course of the superficial stratum which is influenced by local action of air, and warming by the sun. This has been clearly brought out by Skogsberg ('36) in his study of the temperature conditions of Monterey Bay. Since the fluctuations of silicate values show on such frequent occasions lack of correlation with the fluctuations of temperature the conclusion seems evident that the silicate fluctuation is not due solely to the same factors which influence the temperature variation, viz., differences in origin. A factor which may suggest itself as an explanation of the variation from week to week is the error inherent in the method of testing. In order to determine the extent to which the fluctuations observed might be due to this error the average fluctuation from one week to the next was calculated at four representative levels, the surface, 100 meters, 500 meters, and 900 meters, for the three years under consideration. The fluctuation was calculated in terms of the percentage of deviation from the mean of each of the pairs of consecutive weeks. The average values obtained were as follows: For the surface, 18.9%; for 100 meters, 7.1%; for 500 meters 4.3%; and for 900 meters, 3.4%. It has been shown earlier that the method of testing gives a probable error of 2.05%; if the fluctuations from one week to the next which exceed three times the probable error of sampling be taken as significant the surface then shows a significant fluctuation from one week to the next 71% of the time, the 100 meter level fluctuates 42% of the time, the 500 meter level fluctuates 18% of the time, and the 900 meter level fluctuates 16% of the time.
Since neither the fluctuations of currents in the bay as indicated by temperature nor the errors inherent in thein method of sampling are sufficient to account for much of the weekly fluctuation in silicate content, the question arises as to the source of this variation. The most reasonable explanation would seem to be that it is due to biological causes. It has been observed for a long time and by many investigators that the plankton which utilize a considerable quantity of silicate in the formation of their tests, especially the diatoms, frequently occur in large numbers in relatively local patches in the ocean; statis- tical evidence of this "swarming" has been furnished by McEwen ('29). The reasons for this tendency to aggregate are still obscure; the fact remains that where it does occur the silicate must be taken from the surface water at a greater rate than it is elsewhere. It has been pointed out (Skogsberg, '36) that the water in Monterey Bay is in a continual state of flux, and is constantly being renewed by water from outside. The fluctuations in silicate content which are observed at the surface may thus be assumed to be frequently due to the arrival in the bay of water which contains or has contained a swarm of silicious plankton.
In considering the deeper water, again it seems probable that on the many occasions when the weekly fluctuation in silicate content does not show a good negative correlation with the fluctuation of temperature, the cause is biological. If we consider the local patches of silicious plankton which occur at the surface in the open ocean, it will be evident that upon the death of these forms they will sink and in the deeper water there will begin a slow process of dissolution. The deeper water which has lain beneath a local swarm of
This content downloaded from 194.29.185.145 on Wed, 25 Jun 2014 05:17:17 AMAll use subject to JSTOR Terms and Conditions
186 TRANSACTIONS OF THE AMERICAN PHILOSOPHICAL SOCIETY
silicious plankton will thus contain a higher concentration of soluble silicate than does the surrounding water. As the dead plankton organisms sink deeper and deeper they will tend to spread out horizontally more and more owing to the differences in direction and velocity of the deep currents, and the increased silicate content for which they are responsible will become more diffuse, due both to this spreading out of the dead plankton and to diffusion of soluble silicate. Thus the deeper the water the less heterogeneous it will be with respect to silicate. The observations reported above are thoroughly consistent with this hypothesis. It is seen that the percentage of significant fluctuation from week to week in the deeper water falls rapidly with increasing depth. On the other hand, much of this decrease in fluctuation with depth is of course undoubtedly due to the fact that the ocean currents have a considerably lower velocity in the deep water, so that the water in the bay is changed less rapidly at these levels.
While considering the fluctuations of silicate from one week to the next, and the frequent lack of correlation between such fluctuations and the variations in temperature, one must not lose sight of the fact which has been previously stressed, that the general annual cycle of silicate follows the cycle of temperature with but few and minor exceptions. Skogsberg ('36), following an analysis of the temperature conditions in Monterey Bay for the five years from 1928 to 1933, arrived at these conclusions in regard to the origins of the water in the bay: There is a period of strong upwelling'of deep water which is most apparent during the four months from March to July. This period is marked by cold water in the upper 100 meters. Following this there is a period extending from August through October when the bay is dominated by water from the edge of the California Current. This condition is indicated by warm water in the upper layers. Lastly, during December, January and the first part of February the water is strongly influenced by the intermittent northerly flowing Davidson Current, and is characterized by a very low thermal gradient in the upper 50 to 100 meters of water. A consideration of the silicate data shows clear evidence of two of these three annual current phenomena. Most strongly marked is the effect of the upwelling period extending from the latter part of February to the end of July. During these months the silicate content in the upper 100 meters of water is very much higher than it is during the rest of the year; it begins to increase in February and continues steadily until it reaches a maximum in July. This undoubtedly is due largely to the fact that the upwelling phenomenon brings deeper water having a higher silicate content to the surface.
The second annual current phenomenon which is reflected in the silicate data is the encroaching of the water of the Davidson Current during the winter months. This current tends to flow in a northwest direction along the California coast, and because of the deflec- tion to the right which is characteristic of all currents in the northern hemisphere and which is a resultant of the forces set up by the earth's rotation, the water is banked up against the coast. As a result of this superficial current against the coast the upper 50 to 100 meters are occupied largely by water which is of surface origin and therefore, as mentioned above, this period is marked by a low thermal gradient in the upper layers. It has been pointed out that this condition of low gradient is also found in the silicate distribution, the months of December, January and February showing a much lower gradient of silicate in the upper 50 meters than is found at any other time during the year.
The third period in the annual water cycle, the "oceanic period," which occurs in the latter part of August, September, and October, is less definitely marked in the silicate
This content downloaded from 194.29.185.145 on Wed, 25 Jun 2014 05:17:17 AMAll use subject to JSTOR Terms and Conditions
PHELPS: SILICATE CONTENT OF MONTEREY BAY, CALIFORNIA 187
content than in the temperature. There is a regular, uniform decrease in the silicate content from August through December in the upper 100 meters of water, and there is no definite evidence of the minimal values during September which would be expected if the silicate situation were completely dominated by the close approach of the California Current at this time. It is particularly unfortunate in this respect that data for September are available in only one of the three years under consideration. When a further study of the silicate content during this month is undertaken it may very possibly appear that the one year for which the September data are available, 1934, was irregular. That this was probably the case is indicated by the temperature data obtained during September of 1934, which, unlike those of most of the other years since 1928, do not show the usual maximum September values.
At present it would appear that the most probable explanation of the decrease in silicate content, during the autumn in the upper 100 meters of water, lies in the fact that the heavy upwelling of water which occurs during the spring and early summer comes to an end in August, leaving behind it water which is exceptionally rich in the nutrient salts, including silicate. During the autumn there is no further replenishing of these salts, and as a result they are steadily depleted by the plankton, this depletion continuing until the first signs of upwelling in the late winter and early spring.
CITATIONS ATKINS, W. R. G. 1923 The silica content of some natural waters and of culture media. Journ. Mar.
Biol. Assoc. N. S. 13, pp. 151-159. 1926 Seasonal changes in the silica content of natural waters in relation to the phytoplankton.
Journ. Mar. Biol. Assoc. N. S. 14, pp. 89-99. 1928 Seasonal variations in the phosphate and silicate content of sea-water during 1926 and
1927 in relation to the phytoplankton crop. Journ. Mar. Biol. Assoc. N. S. 15, pp. 191-205. 1930 Seasonal variations in the phosphate and silicate content of sea-water in relation to the
phytoplankton crop. Pt. V. November 1927 to April 1929, compared with earlier years from 1923. Journ. Mar. Biol. Assoc. N. S. 16, pp. 821-852.
, AND H. W. HARVEY. 1925 The variation with depth of certain salts utilized in plant growth in the sea. Nature 116, p. 784.
BIGELOW, H. B., AND MAURINE LESLIE. 1930 Reconnaissance of the waters and plankton of Monterey Bay, July, 1928. Bull. Mus. Comp. Zool. Harvard College 70, pp. 430-581.
BRANDT, K. 1919 tUber den Stoffwechsel im Meere. Dritte Abhandlung. Wiss. Meeresunter. Abt. Kiel 18, s. 187-429.
CARTER, N. M., E. G. MOBERG, TAGE SKOGSBERG, AND T. G. THOMPSON. 1933 The reporting of data in oceanographical chemistry. Fifth Pac. Sci. Cong., pp. 2123-2127.
DIENERT, F., AND F. WALDENBULCKE. 1923 Sur le dosage de la silice dans les eaux. C. R. Acad. des Sci., Paris 176, pp. 1478-1480.
GRAHAM, H. W., AND E. G. MOBERG. The distribution of silicate in the sea. Reports on the chemical results of cruise VII of the Carnegie during 1928-9 (unpublished).
HARVEY, H. W. 1933 On the rate of diatom growth. Journ. Mar. Biol. Assoc. N. S. 19, pp. 253-276. HUTCHINSON, A. H. 1928 A bio-hydrographical investigation of the sea adjacent to the Fraser River
mouth. Trans. Roy. Soc. Canada 3d series, 22, pp. 293-311. , C. C. LuCAS, AND M. MCPHAIL. 1929 Seasonal variations in the chemical and physical proper-
ties of the waters of the Straight of Georgia in relation to phytoplankton. Trans. Roy. Soc. Canada 3d series, 23, pp. 177-183.
JOHNSTONE, JAMES. 1908 Conditions of life in the sea. Cambridge University Press. KING, E. J., AND C. C. LUCAS. 1928 The use of picric acid as an artificial standard in the colorimetric
estimation of silica. Journ. Amer. Chem. Soc. 50, pp. 2395-2397.
This content downloaded from 194.29.185.145 on Wed, 25 Jun 2014 05:17:17 AMAll use subject to JSTOR Terms and Conditions
188 TRANSACTIONS OF THE AMERICAN PHILOSOPHICAL SOCIETY
MOBERG, E. G. 1926 The phosphate, silica, and fixed nitrogen content of seawater. Proc. 3d Pan- Pacific Sci. Cong., Tokyo, pp. 229-232.
1928 The interrelation between diatomes, their chemical environment, and upwelling water in the sea, off the coast of Southern California. Proc. Nat. Acad. Sci. 14, pp. 511-518.
RABEN, E. 1905 Weitere Mitteilungen fiber quantitative Bestimmungen von Stickstoffverbindungen und von gel6ster Kieselsiure im Meerwasser. Wiss. Meeresunter. Abt. Kiel 8, s. 279-287.
1910 Dritte Mitteilung fiber quantitative Bestimmungen von Stickstoffverbindungen und von gel6ster Kieselsaure im Meerwasser. Wiss. Meeresunter. Abt. Kiel 11, s. 305-319.
1913 Vierte Mitteilung fiber quantitative Bestimmungen von Stickstoffverbindungen im Meerwasser und Boden, sowie von geloster Kieselsaure im Meerwasser. Wiss. Meeresunter. Abt. Kiel 16, s. 209-229.
SKOGSBERG, TAGE. 1936 Hydrography of Monterey Bay, California.
THOMPSON, T. G., AND M. W. JOHNSON. 1930 The sea water at the Puget Sound Biological Station from
September 1928 to September 1929. Publ. Puget Sound Biol. Station, 7. THOMPSON, T. G., AND R. J. ROBINSON. 1932 Chemistry of the sea. Physics of the Earth-V Oceanog-
raphy. Bull. Nat. Res. Council 85. Nat. Res. Council of Nat. Acad. of Sciences, Washington, D. C. THOMPSON, T. G., B. D. THOMAS, AND C. A. BARNES. 1934 Distribution of oxygen in the North Pacific
Ocean. James Johnstone Memorial Volume, pp. 203-234, University Press of Liverpool. THOMPSON, T. G., AND F. A. ZEUSLER. 1935 Summary of the oceanographic investigations of Bering Sea
and Bering Strait. Trans. Amer. Geophys. Union, Sixteenth Meeting, pp. 258-264. UDA, MITITAKE. 1934 Hydrographical studies based on simultaneous oceanographical surveys made in
the Japan Sea and in its adjacent waters during May and June, 1932. Rec. Ocean. Works in Japan 6, pp. 19-107.
WELLS, R. C. 1922 Determination of silica in filtered sea-water. Journ. Am. Chem. Soc. 44, pp. 2187- 2193.
This content downloaded from 194.29.185.145 on Wed, 25 Jun 2014 05:17:17 AMAll use subject to JSTOR Terms and Conditions