Embed Size (px)
Citation preview
DIVISION S-7—FOREST AND RANGE SOILS
The Variability of Forest Soils of the Georgia Blue Ridge Mountains1
ALBERT F. IKE AND JEROME L. CLUTTER2
ABSTRACTData collected from 123 forested plots in the Blue Ridge
Mountains of northeast Georgia were used to (i) evaluatesample stratification criteria, ( i i ) estimate the variability ofphysical and chemical properties of the soil, and (iii) examinethe efficiency of sampling schemes.
Sample stratification seemed justified on the basis of soil se-ries, but not on the basis of soil type. For similar soils, maxi-mum efficiency in estimating means of soil series is obtainedwith one or two pits per plot. The number of plots (pedons) re-quired for adequate precision is greater than the number cus-tomarily sampled for soil series characterization studies.
Sampling to estimate plot mean values in soil-site studiesinvolves consideration of the variances of several properties tobe estimated from one soil sample. The use of two to fourpits (profiles) per plot in similar soils would seem to be ade-quate for most but not all commonly measured soil properties.
Additional Key Words for Indexing: soil sampling, soil heter-ogeneity.
IN SOIL SCIENCE in general, and in the field of forest soilsin particular, data regarding the variability of chemical
and physical properties of soils are meager in comparisonto information available on the influence of these propertieson plant growth. This paper utilizes data from a soil-siteinvestigation to obtain estimates of variance for several soilproperties (A. F. Ike and C. D. Huppuch. Predicting treeheight growth from soil and topographic site factors in theGeorgia Blue Ridge Mountains. Georgia Forest ResearchCouncil Paper 53. In Press.). The use of these estimatesin evaluating sample stratification criteria and in design-ing sampling schemes is also discussed.
PREVIOUS WORK
Although the variability of several agronomic soils hasbeen examined in detail (1, 6, 13, 17, 18), studies of forestsoils have been mainly concerned with soil properties asso-ciated with moisture (2, 3, 10, 11, 19).
McFee and Stone (14) discussed the large variations inweight of forest floor material, notably those caused bywind in the distribution of leaf and twig debris over andaround pits, mounds, stumps, and fallen trees. These samefactors, plus those associated with tree-throw and soil faunal
1 Contribution from the USDA Forest Service and Uni-versity of Georgia, Athens. Revision of a paper originally pre-sented before Div. S-7, Soil Science Society of America, atIthaca, N. Y., Aug. 1962. Received July 11, 1967. ApprovedOct. 9, 1967.
2 Research Soil Scientist, USDA Forest Service, Forestry Sci.Lab., and Professor of Forestry, School of Forestry, Univ. ofGeorgia, Athens, respectively.
activity, lead one to expect large variances for chemical andphysical properties of forest soils as well, especially in theupper horizons.
In a study of variability in soils supporting red pineplantations (Pinus resinosa Ait.) in Massachusetts, Mader(12) found that precise estimates of plot means for organicmatter and exchangeable cations in soil-site studies required"prohibitively" large numbers of pits per plot in compari-son to the number of pits needed to determine such prop-erties as bulk density and texture. He also reported thatvariation among plots greatly exceeded that among pitswithin a plot.
Krumbach and Bassett (9) examined in detail the vari-ability of soil properties on a 15.5 by 18.3 m (50 ft. by 60ft) plot of a Falaya silt loam, which is considered one ofthe more variable of the loessial-derived soils. To achievea confidence interval whose half-width (at the 95% level)is equal to 10% of the mean value for the plot [at the21-42 cm depth (6- to 12-inch)], they found that fiveobservations were required for moisture content, bulkdensity, and silt content; 10 observations for clay content;and 30 samples for sand content. For organic matter con-tent (coefficient of variation 0.39), approximately 60samples were needed to obtain this degree of precision.
PROCEDUREDescription of Study Area
The 123 sample plots were well distributed over the BlueRidge Mountain section of northeast Georgia. This area ischaracterized by high rainfall (132 to 183 cm), relatively longgrowing seasons (200 to 237 days), and mountainous topogra-phy (365 to 1,220 m elevation, averaging about 600).
Soils here have formed from granites, gneisses, and schists,and are generally acidic throughout, with sandy loam surfacesoils over sandy clay loam to clay loam subsoils. Most of thesesoils are Ultisols or Inceptisols.
Sampling ProceduresPlots were generally 800 sq. m (0.2 acre) in size and usually
circular, with occasional slight variations in both size and shapedictated by topography. Prior to sampling, each plot was ex-amined carefully with a sampling tube to verify relative homo-geneity of soil conditions, especially with respect to horizonationand gross morphology. Sites showing evidence of injury to treescaused by fire, disease, or insects were not sampled. No effortwas made to locate and sample modal or "representative" sites.
Four pits were dug at each plot, one near the center andthree others located at random within the plot boundary. Thecenter pit was usually the largest and served as the basis of aprofile description. Loose samples were removed from eachhorizon down to and including the B2.
Since the samples were collected from plots classified accord-ing to soil series and type, the variability of the various soil prop-erties with and without the use of these stratification criteriacould be examined. In addition, the use of a two-stage sampling
284
IKE AND CLUTTER: FOREST SOILS OF THE GEORGIA BLUE RIDGE MOUNTAINS 285
Table 1—Analysis of variance and reductions in variance achieved by sample stratification, A2 horizonMean square
Source of variation dfAmong all plots 122Among plots within series 106Among plots within type
within series 91
Percent variance reduction due tostratification by series
Percent variance reduction due tostratification by type
Organicmatter4.4273.063
2.937
30.8
33.7
PH0.1150.094
0.084
18.3
27.0
Sand72.8447.18
22.21
35.2
69.5
Silt39.4023.98
15.39
39.1
70.0
Clay15.5912.40
6.67
20.5
57.2
1/3atm.
moist.41.3523.95
24.53
42.1
40.7
15atm.
moist.20.4812.15
12.02
40.7
41.3
Avail,water13.0810.59
11.09
19.0
15.2
Avail.P
16.3116.61
15. 43
-1.8
5.4
ExchangeableK
1,9061,260
1,324
33.9
30.5
Ca42,32336,557
38,775
13.6
8.4
Mg1,4751,038
998
29.6
32.3
Table 2—Analysis of variance and reductions in variance achieved by sample stratification, B horizonMean square
Source of variation dfAmong all plots 122Among plots within series 106Among plots within type within series 91
Percent variance reduction due tostratification by series
Percent variance reduction due tostratification by type
PH0.0390.0340.036
%
12.8
8.8
Sand61.51.52.
°1<
16.
16.
.6040
. 27
.7
.2
Silt32.18.14.
al
41.
55.
509360
8
1
Clay73.46.46.
%
37.
36.
281893
0
0
1/3atm.
moist.17.7915. E616.77
%
12.5
6.7
ME* df
11.61 1179.25 IOI9. 33 87
%
20.3
19.6
Mean s"Uare Mean souare15
moist.10.90
8.278.27al
24.1
24.1
Av»(, Avai, Exchangeablewater df P K Ca Mg14.00 39 0.623 704 2,673 27311.04 36 0.363 506 2,662 21212.09 - - - -
% % % % %
21.1 41.7 28.1 0.4 22.3
13.6
* ME = moisture equivalent.
method (four pits within each plot) permitted the investigationof spatial variability for each soil variable and the efficiency ofvarious two-stage sampling allocations.
ObjectivesThe statistical analyses were concerned with these three ques-
tions:1) How much reduction in .among-plot variance of soil
properties is obtainable by stratifying plots (i) by soilseries and (ii) by soil types?
2) How many plots are required to estimate mean values ofsoil properties for a given soil series, and how many pitsshould be used per plot?
3) How many pits are required to estimate soil propertieson a single plot?
RESULTS
Effectiveness of Stratification Criteria
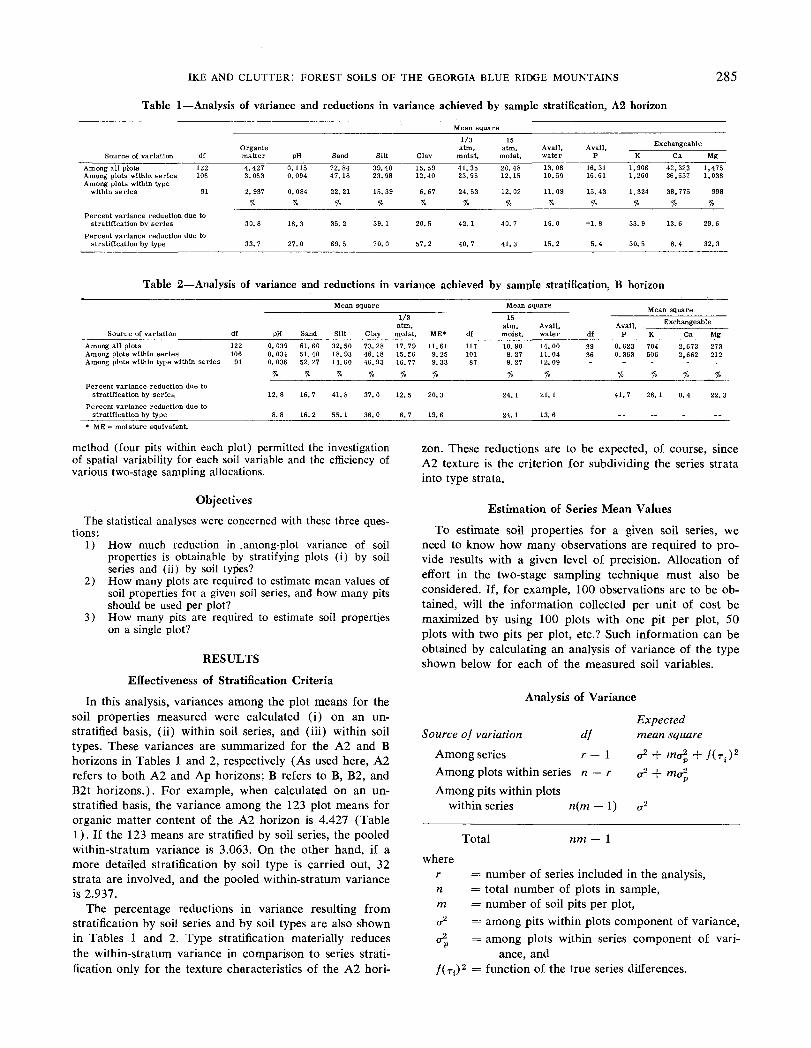
In this analysis, variances among the plot means for thesoil properties measured were calculated (i) on an un-stratified basis, (ii) within soil series, and (iii) within soiltypes. These variances are summarized for the A2 and Bhorizons in Tables 1 and 2, respectively (As used here, A2refers to both A2 and Ap horizons; B refers to B, B2, andB2t horizons.). For example, when calculated on an un-stratified basis, the variance among the 123 plot means fororganic matter content of the A2 horizon is 4.427 (Table1). If the 123 means are stratified by soil series, the pooledwithin-stratum variance is 3.063. On the other hand, if amore detailed stratification by soil type is carried out, 32strata are involved, and the pooled within-stratum varianceis 2.937.
The percentage reductions in variance resulting fromstratification by soil series and by soil types are also shownin Tables 1 and 2. Type stratification materially reducesthe within-stratum variance in comparison to series strati-fication only for the texture characteristics of the A2 hori-
zon. These reductions are to be expected, of course, sinceA2 texture is the criterion for subdividing the series stratainto type strata.
Estimation of Series Mean Values
To estimate soil properties for a given soil series, weneed to know how many observations are required to pro-vide results with a given level of precision. Allocation ofeffort in the two-stage sampling technique must also beconsidered. If, for example, 100 observations are to be ob-tained, will the information collected per unit of cost bemaximized by using 100 plots with one pit per plot, 50plots with two pits per plot, etc.? Such information can beobtained by calculating an analysis of variance of the typeshown below for each of the measured soil variables.
Analysis of Variance
Source of variation dfAmong series r — \Among plots within series n — rAmong pits within plots
within series n(m — 1)
Expectedmean squarea2 + mcr2, + /(Ti)2
Total nm — 1where
rnm<r2
= number of series included in the analysis,= total number of plots in sample,= number of soil pits per plot,= among pits within plots component of variance,
cr^ = among plots within series component of vari-ance, and
/(Ti)2 = function of the true series differences.
286 SOIL SCI. SOC. AMER. PROC., VOL. 32, 1968
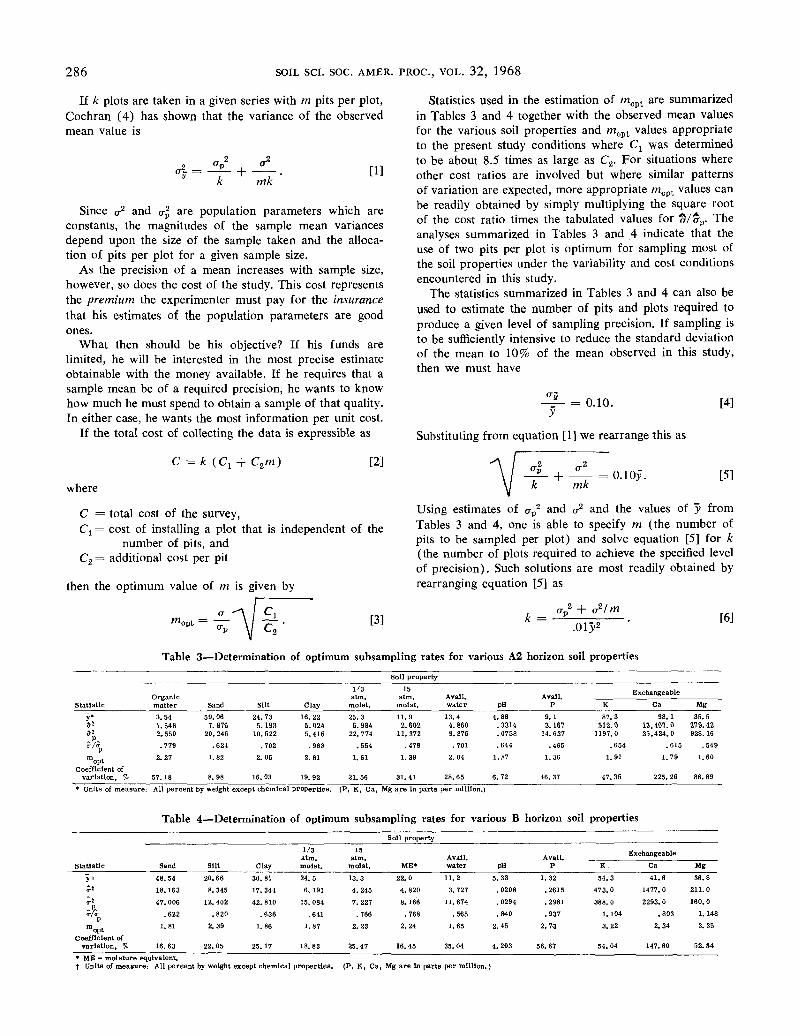
If k plots are taken in a given series with m pits per plot,Cochran (4) has shown that the variance of the observedmean value is
4 = mk[1]
Since a2 and o-| are population parameters which areconstants, the magnitudes of the sample mean variancesdepend upon the size of the sample taken and the alloca-tion of pits per plot for a given sample size.
As the precision of a mean increases with sample size,however, so does the cost of the study. This cost representsthe premium the experimenter must pay for the insurancethat his estimates of the population parameters are goodones.
What then should be his objective? If his funds arelimited, he will be interested in the most precise estimateobtainable with the money available. If he requires that asample mean be of a required precision, he wants to knowhow much he must spend to obtain a sample of that quality.In either case, he wants the most information per unit cost.
If the total cost of collecting the data is expressible as
C = k C2m ) [2]
where
C = total cost of the survey,Cj = cost of installing a plot that is independent of the
number of pits, andC2 = additional cost per pit
then the optimum value of m is given by
»»opt= [3]
Statistics used in the estimation of mopt are summarizedin Tables 3 and 4 together with the observed mean valuesfor the various soil properties and wopt values appropriateto the present study conditions where Cl was determinedto be about 8.5 times as large as C2. For situations whereother cost ratios are involved but where similar patternsof variation are expected, more appropriate mopt values canbe readily obtained by simply multiplying the square rootof the cost ratio times the tabulated values for £/£„. Theanalyses summarized in Tables 3 and 4 indicate that theuse of two pits per plot is optimum for sampling most ofthe soil properties under the variability and cost conditionsencountered in this study.
The statistics summarized in Tables 3 and 4 can also beused to estimate the number of pits and plots required toproduce a given level of sampling precision. If sampling isto be sufficiently intensive to reduce the standard deviationof the mean to 10% of the mean observed in this study,then we must have
—=- = 0.10.ySubstituting from equation [1] we rearrange this as
mk= O.lOy.
[4]
[5]
Using estimates of ap2 and o-2 and the values of ~y from
Tables 3 and 4, one is able to specify m (the number ofpits to be sampled per plot) and solve equation [5] for k(the number of plots required to achieve the specified levelof precision). Such solutions are most readily obtained byrearranging equation [5] as
k =op2 + o-2/m
.Oly2 [6]
Table 3—Determination of optimum subsampling rates for various A2 horizon soil properties
Soil property
Statistic
»'»'
*'*,mopt
Coefficient ofvariation, %
matter3.541.5482.550.779
2.27
57.18
Sand59.067.876
20.246.624
1.82
8.98
Silt24.735.193
10.522. 702
2.05
16.03
Clay16.225.0245.416.963
2.81
19.92
1/3
moist.25.36.984
22. 774.554
1.61
21.56
15
moist.11.92.602
11.372.478
1.39
31.41
Avail.water13.44.8609.876.701
2.04
28.65
pH
4.88.0314.0758.644
1.87
6.72
Avail.P
9.13.167
14.637.465
1.36
46.37
ExchangeableK87.3
512.01197.0
.654
1.91
47.35
Ca98.1
13,407.035,424.0
.6151.79
225. 26
Mg
35.5279.42928. 16
.5491.60
86.89* Units of measure; All percent by weight except chemical properties. (P, K, Ca, Mg are In parts per million.)
Table 4—Determination of optimum subsampling rates for various B horizon soil properties
Soil property
Statistic
ytr1
rrz
P
moptCoefficient of
variation, %
Sand48.5418.16347. 006
.6221.81
16.63
Silt20.668.345
12. 402.820
2.39
22.05
Clay30.8117. 34442.810
.6361.86
25.17
1/3atm.moist.24.56.191
15. 084.641
1.87
18.83
15atm.
moist.13.34.2457.227.766
2.23
25.47
ME*22.04.8208.166.768
2.24
16.45
Avail.water11.23.727
11.674.565
1.65
35.04
PH5.33
.0208
.0294
.8402.45
4.203
Avail.P
1.32.2615.2981.937
2.73
56.67
ExchangeableK54.3
473.0388.0
1.1043.22
54.04
Ca
41.6
1477. 0
2293. 0.803
2.34
147.60
Mg36.8
211.0160.0
1.1483.35
52.34ME = moisture equivalent,
t Units of measure: All percent by weight except chemical properties. (P, K, Ca, Mg are In parts per million.)
IKE AND CLUTTER: FOREST SOILS OF THE GEORGIA BLUE RIDGE MOUNTAINS 287
Table 5—Expected sample sizes required to obtain 10% standard errors on estimates of soil series mean valuesA2 Horizon properties
Soil propertyNumber of pits
per plot Organic(m) matter
1 332 274 248 22
PH
1111
Sand
1111
Silt
3222
Clay
4332
1/3atm.
moist.
15atm. Avail.moist. water
nt nlrt*o «anii(>.ar]
5 10 8444
9 7
8 6
8 6
Avail.P
22201918
K
22191717
ExchangeableOa
507438403386
Mg
96857976
Table 6—Expected sample sizes required to obtain 10% standard errors on estimates of soil series mean valuesB Horizon properties
Soil propertyNumber of pits
(m) PH
1 12 14 18 1
Sand
3222
Silt
5433
Clay
6555
1/3
moist.
4333
15
moist. ME*nf nlrttc i-nnlli
7 3554
222
Avail.water
12111010
Avail.P
32252119
K
29211715
ExchangeableCa
218175154153
Mg
27201614
* ME = moisture equivalent.
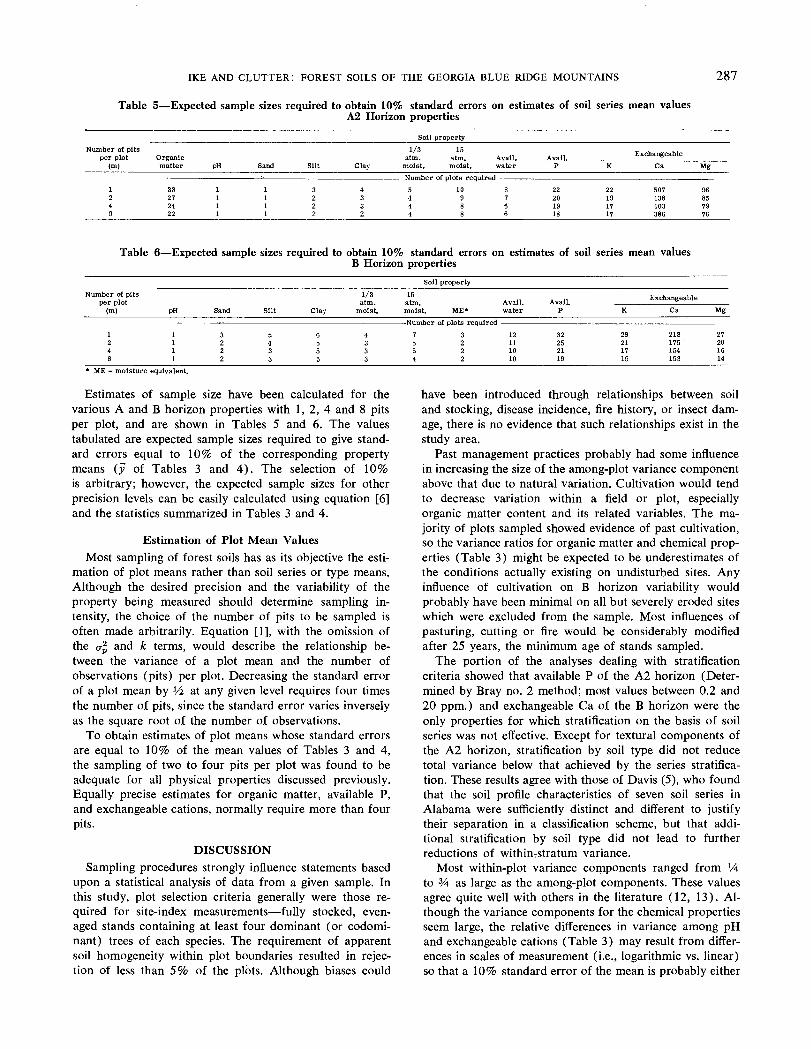
Estimates of sample size have been calculated for thevarious A and B horizon properties with 1, 2, 4 and 8 pitsper plot, and are shown in Tables 5 and 6. The valuestabulated are expected sample sizes required to give stand-ard errors equal to 10% of the corresponding propertymeans (y of Tables 3 and 4). The selection of 10%is arbitrary; however, the expected sample sizes for otherprecision levels can be easily calculated using equation [6]and the statistics summarized in Tables 3 and 4.
Estimation of Plot Mean ValuesMost sampling of forest soils has as its objective the esti-
mation of plot means rather than soil series or type means.Although the desired precision and the variability of theproperty being measured should determine sampling in-tensity, the choice of the number of pits to be sampled isoften made arbitrarily. Equation [1], with the omission ofthe 0-2 and k terms, would describe the relationship be-tween the variance of a plot mean and the number ofobservations (pits) per plot. Decreasing the standard errorof a plot mean by Vz at any given level requires four timesthe number of pits, since the standard error varies inverselyas the square root of the number of observations.
To obtain estimates of plot means whose standard errorsare equal to 10% of the mean values of Tables 3 and 4,the sampling of two to four pits per plot was found to beadequate for all physical properties discussed previously.Equally precise estimates for organic matter, available P,and exchangeable cations, normally require more than fourpits.
DISCUSSIONSampling procedures strongly influence statements based
upon a statistical analysis of data from a given sample. Inthis study, plot selection criteria generally were those re-quired for site-index measurements—fully stocked, even-aged stands containing at least four dominant (or codomi-nant) trees of each species. The requirement of apparentsoil homogeneity within plot boundaries resulted in rejec-tion of less than 5% of the plots. Although biases could
have been introduced through relationships between soiland stocking, disease incidence, fire history, or insect dam-age, there is no evidence that such relationships exist in thestudy area.
Past management practices probably had some influencein increasing the size of the among-plot variance componentabove that due to natural variation. Cultivation would tendto decrease variation within a field or plot, especiallyorganic matter content and its related variables. The ma-jority of plots sampled showed evidence of past cultivation,so the variance ratios for organic matter and chemical prop-erties (Table 3) might be expected to be underestimates ofthe conditions actually existing on undisturbed sites. Anyinfluence of cultivation on B horizon variability wouldprobably have been minimal on all but severely eroded siteswhich were excluded from the sample. Most influences ofpasturing, cutting or fire would be considerably modifiedafter 25 years, the minimum age of stands sampled.
The portion of the analyses dealing with stratificationcriteria showed that available P of the A2 horizon (Deter-mined by Bray no. 2 method; most values between 0.2 and20 ppm.) and exchangeable Ca of the B horizon were theonly properties for which stratification on the basis of soilseries was not effective. Except for textural components ofthe A2 horizon, stratification by soil type did not reducetotal variance below that achieved by the series stratifica-tion. These results agree with those of Davis (5), who foundthat the soil profile characteristics of seven soil series inAlabama were sufficiently distinct and different to justifytheir separation in a classification scheme, but that addi-tional stratification by soil type did not lead to furtherreductions of withinrStratum variance.
Most within-plot variance components ranged from Vkto % as large as the among-plot components. These valuesagree quite well with others in the literature (12, 13). Al-though the variance components for the chemical propertiesseem large, the relative differences in variance among pHand exchangeable cations (Table 3) may result from differ-ences in scales of measurement (i.e., logarithmic vs. linear)so that a 10% standard error of the mean is probably either
288 SOIL SCI. SOC. AMER. PROC., VOL. 32, 1968
unreasonably gross for estimates of pH or unrealisticallyprecise for exchangeable Ca or Mg (expressed as ppm).
These results have implications with respect to soil classi-fication. In 1949, Harradine (7) found that mature soilswere less variable than young soils and pointed out theneed for variability studies of soil taxonomic units. Nelsonand McCracken (15) subsequently reported that 15 profilesamples per series were adequate for characterization pur-poses for some properties but inadequate for others. Thechoice of soil properties considered as diagnostic for classi-fication purposes must involve consideration of their degreeof uniformity within a series. Correspondingly, the numberof profile (pedon) samples required to estimate a seriesmean value adequately is (or should be) a reflection of thevariability of the property involved.
The degree of precision specified here is greater thanthat used by Nelson and McCracken, but the same conclu-sions are reached: The number of samples ordinarily takento characterize a soil series is often inadequate. Samplingof representative or "modal" pedons often produces quiteaccurate estimates of population mean values, but such asample provides very little information as to the true natureof the pattern of variability for the soil properties measured.Furthermore, the precision of estimates obtained from "rep-resentative" samples selected by experienced scientists maynot be as great as has been assumed. McFee and Stone(14) have shown, for example, that measurements of hori-zon thickness based upon a single soil pit description areinadequate to characterize a plot as small as 0.1 acre inAdirondack Mountain podzol soils in New York State. Fora rather thorough discussion of the "judgment sample," andsoil sampling in general, the reader is referred to a recentcontribution by Petersen and Calvin (16).
The preceding discussion has dealt with the calculationof sample size for a given single measurement. Problemsarise when several determinations are to be made on asingle sample, as is the case with most soil-site studies.Some measurements are bound to be more variable thanothers. What then should be the basis for sample sizedetermination?
The safest—and most expensive—plan would be to sam-ple at an intensity great enough to estimate the most vari-able mean with the predesignated degree of precision. Forpractical purposes, a compromise will probably be made.A sample will be taken which estimates those parametersof greatest importance (known or expected) with the re-quired degree of precision, while sacrificing precision ofthe more variable but'less important measurements. Littlehas been done toward solving this problem since Jacob andKlute (8) pointed out the need for a solution to it in 1956.
Recognition and acceptance of the fact that forest soilsare variable is but the first step in designing an efficientsampling plan. Reference to reports in the literature canbe of considerable help where similar soils are to be sam-pled. When such reports are not available, the techniquesdescribed here will serve as a guide for determining thepattern of variability from a preliminary sample.
ACKNOWLEDGMENT
Dr. Carol Wells, Soil Scientist of the Forestry Sciences Lab-oratory, Research Triangle Park, North Carolina, performed orsupervised the analytical laboratory work which provided theraw data for this paper. His diligent efforts and attention todetail in the laboratory and his critical review of the manuscriptare greatly appreciated.