Embed Size (px)
Citation preview
Atmos. Chem. Phys., 10, 11753–11767, 2010www.atmos-chem-phys.net/10/11753/2010/doi:10.5194/acp-10-11753-2010© Author(s) 2010. CC Attribution 3.0 License.
AtmosphericChemistry
and Physics
The vapor pressures and activities of dicarboxylic acidsreconsidered: the impact of the physical state of the aerosol
V. Soonsin1, A. A. Zardini 2, C. Marcolli 1, A. Zuend3, and U. K. Krieger1
1Institute for Atmospheric and Climate Science, ETH Zurich, Zurich, Switzerland2Department of Chemistry, University of Copenhagen, Copenhagen, Denmark3Department of Chemical Engineering, California Institute of Technology, Pasadena, California, USA
Received: 23 July 2010 – Published in Atmos. Chem. Phys. Discuss.: 27 August 2010Revised: 2 December 2010 – Accepted: 3 December 2010 – Published: 10 December 2010
Abstract. We present vapor pressure data of the C2 to C5 di-carboxylic acids deduced from measured evaporation ratesof single levitated particles as both, aqueous droplets andsolid crystals. The data of aqueous solution particles overa wide concentration range allow us to directly calculate ac-tivities of the dicarboxylic acids and comparison of these ac-tivities with parameterizations reported in the literature. Thedata of the pure liquid state acids, i.e. the dicarboxylic acidsin their supercooled melt state, exhibit no even-odd alter-nation in vapor pressure, while the acids in the solid formdo. This observation is consistent with the known solubilitiesof the acids and our measured vapor pressures of the super-cooled melt. Thus, the gas/particle partitioning of the differ-ent dicarboxylic acids in the atmosphere depends strongly onthe physical state of the aerosol phase, the difference beinglargest for the even acids.
Our results show also that, in general, measurements ofvapor pressures of solid dicarboxylic acids may be com-promised by the presence of polymorphic forms, crystallinestructures with a high defect number, and/or solvent inclu-sions in the solid material, yielding a higher vapor pressurethan the one of the thermodynamically stable crystalline format the same temperature.
1 Introduction
There is a considerable interest in understanding thegas/particle partitioning of organic compounds, owing to thehigh abundance of organic species in the atmospheric aerosol(Zhang et al., 2007). In particular, for semivolatile sub-
Correspondence to:V. Soonsin([email protected])
stances the partitioning strongly influences the particulatematter burden in the troposphere, the radiative propertiesof the aerosol, the cloud processing and the heterogeneouschemistry (IPCC, 2007). While the organic fraction in atmo-spheric aerosol particles is likely to consist of a large numberof compounds (Goldstein and Galbally, 2007), it is crucial toknow the vapor pressure of the pure compounds under ambi-ent conditions to predict the partitioning (e.g.,Pankow, 1994;Clegg et al., 2008; Hallquist et al., 2009; Barley and McFig-gans, 2010; Zuend et al., 2010). Among the oxygenated or-ganic species short chain dicarboxylic acids are known to beubiquitous (e.g.,Decesari et al., 2006; Legrand et al., 2007)with average concentrations ranging from a few ng m−3 inremote marine aerosols (Wang et al., 2006) to 2 µg m−3 inbiomass burning aerosols (Kundu et al., 2010). Althoughthe vapor pressures of the dicarboxylic acids have been stud-ied intensely, the room temperature pressures of differentstudies disagree, with differences up to two orders of mag-nitude for some compounds. Equally important for a bet-ter understanding of gas/particle partitioning are thermody-namic models which allow estimating the activity of organicspecies in complex aqueous solutions (e.g.,Clegg and Sein-feld, 2006a,b; Chang and Pankow, 2006, 2010; Zuend et al.,2008, 2010). Activity data of binary, ternary, and multicom-ponent aqueous solutions over a wide range of concentrationsfrom dilute to supersaturated solutions are needed to furtherthe development of these models. Vapor pressure measure-ments over binary aqueous solutions allow the organic activ-ity to be directly obtained and hence serve as constraints forthese models.
Several techniques have been used to obtain vapor pres-sure data of dicarboxylic acids: Knudsen’s effusion meth-ods using different detection techniques, namely, gas phaseconcentration by condensation and subsequent titration(Noyes and Wobbe, 1926), torsion-effusion (de Kruif et al.,
Published by Copernicus Publications on behalf of the European Geosciences Union.
11754 V. Soonsin et al.: Vapor pressures and activities of dicarboxylic acids
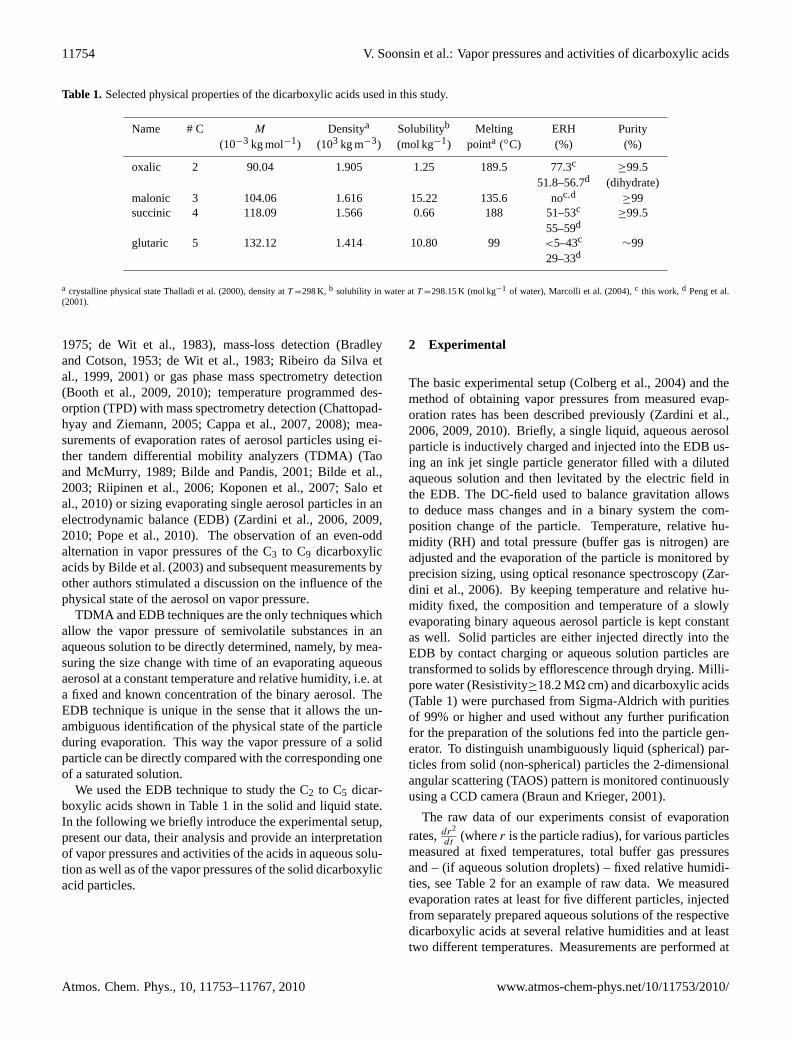
Table 1. Selected physical properties of the dicarboxylic acids used in this study.
Name # C M Densitya Solubilityb Melting ERH Purity(10−3 kg mol−1) (103 kg m−3) (mol kg−1) pointa (◦C) (%) (%)
oxalic 2 90.04 1.905 1.25 189.5 77.3c≥99.5
51.8–56.7d (dihydrate)malonic 3 104.06 1.616 15.22 135.6 noc,d
≥99succinic 4 118.09 1.566 0.66 188 51–53c
≥99.555–59d
glutaric 5 132.12 1.414 10.80 99 <5–43c ∼9929–33d
a crystalline physical stateThalladi et al.(2000), density atT =298K, b solubility in water atT =298.15K (mol kg−1 of water),Marcolli et al. (2004), c this work,d Peng et al.(2001).
1975; de Wit et al., 1983), mass-loss detection (Bradleyand Cotson, 1953; de Wit et al., 1983; Ribeiro da Silva etal., 1999, 2001) or gas phase mass spectrometry detection(Booth et al., 2009, 2010); temperature programmed des-orption (TPD) with mass spectrometry detection (Chattopad-hyay and Ziemann, 2005; Cappa et al., 2007, 2008); mea-surements of evaporation rates of aerosol particles using ei-ther tandem differential mobility analyzers (TDMA) (Taoand McMurry, 1989; Bilde and Pandis, 2001; Bilde et al.,2003; Riipinen et al., 2006; Koponen et al., 2007; Salo etal., 2010) or sizing evaporating single aerosol particles in anelectrodynamic balance (EDB) (Zardini et al., 2006, 2009,2010; Pope et al., 2010). The observation of an even-oddalternation in vapor pressures of the C3 to C9 dicarboxylicacids byBilde et al.(2003) and subsequent measurements byother authors stimulated a discussion on the influence of thephysical state of the aerosol on vapor pressure.
TDMA and EDB techniques are the only techniques whichallow the vapor pressure of semivolatile substances in anaqueous solution to be directly determined, namely, by mea-suring the size change with time of an evaporating aqueousaerosol at a constant temperature and relative humidity, i.e. ata fixed and known concentration of the binary aerosol. TheEDB technique is unique in the sense that it allows the un-ambiguous identification of the physical state of the particleduring evaporation. This way the vapor pressure of a solidparticle can be directly compared with the corresponding oneof a saturated solution.
We used the EDB technique to study the C2 to C5 dicar-boxylic acids shown in Table 1 in the solid and liquid state.In the following we briefly introduce the experimental setup,present our data, their analysis and provide an interpretationof vapor pressures and activities of the acids in aqueous solu-tion as well as of the vapor pressures of the solid dicarboxylicacid particles.
2 Experimental
The basic experimental setup (Colberg et al., 2004) and themethod of obtaining vapor pressures from measured evap-oration rates has been described previously (Zardini et al.,2006, 2009, 2010). Briefly, a single liquid, aqueous aerosolparticle is inductively charged and injected into the EDB us-ing an ink jet single particle generator filled with a dilutedaqueous solution and then levitated by the electric field inthe EDB. The DC-field used to balance gravitation allowsto deduce mass changes and in a binary system the com-position change of the particle. Temperature, relative hu-midity (RH) and total pressure (buffer gas is nitrogen) areadjusted and the evaporation of the particle is monitored byprecision sizing, using optical resonance spectroscopy (Zar-dini et al., 2006). By keeping temperature and relative hu-midity fixed, the composition and temperature of a slowlyevaporating binary aqueous aerosol particle is kept constantas well. Solid particles are either injected directly into theEDB by contact charging or aqueous solution particles aretransformed to solids by efflorescence through drying. Milli-pore water (Resistivity≥18.2 M� cm) and dicarboxylic acids(Table 1) were purchased from Sigma-Aldrich with puritiesof 99% or higher and used without any further purificationfor the preparation of the solutions fed into the particle gen-erator. To distinguish unambiguously liquid (spherical) par-ticles from solid (non-spherical) particles the 2-dimensionalangular scattering (TAOS) pattern is monitored continuouslyusing a CCD camera (Braun and Krieger, 2001).
The raw data of our experiments consist of evaporation
rates,dr2
dt(wherer is the particle radius), for various particles
measured at fixed temperatures, total buffer gas pressuresand – (if aqueous solution droplets) – fixed relative humidi-ties, see Table 2 for an example of raw data. We measuredevaporation rates at least for five different particles, injectedfrom separately prepared aqueous solutions of the respectivedicarboxylic acids at several relative humidities and at leasttwo different temperatures. Measurements are performed at
Atmos. Chem. Phys., 10, 11753–11767, 2010 www.atmos-chem-phys.net/10/11753/2010/
V. Soonsin et al.: Vapor pressures and activities of dicarboxylic acids 11755
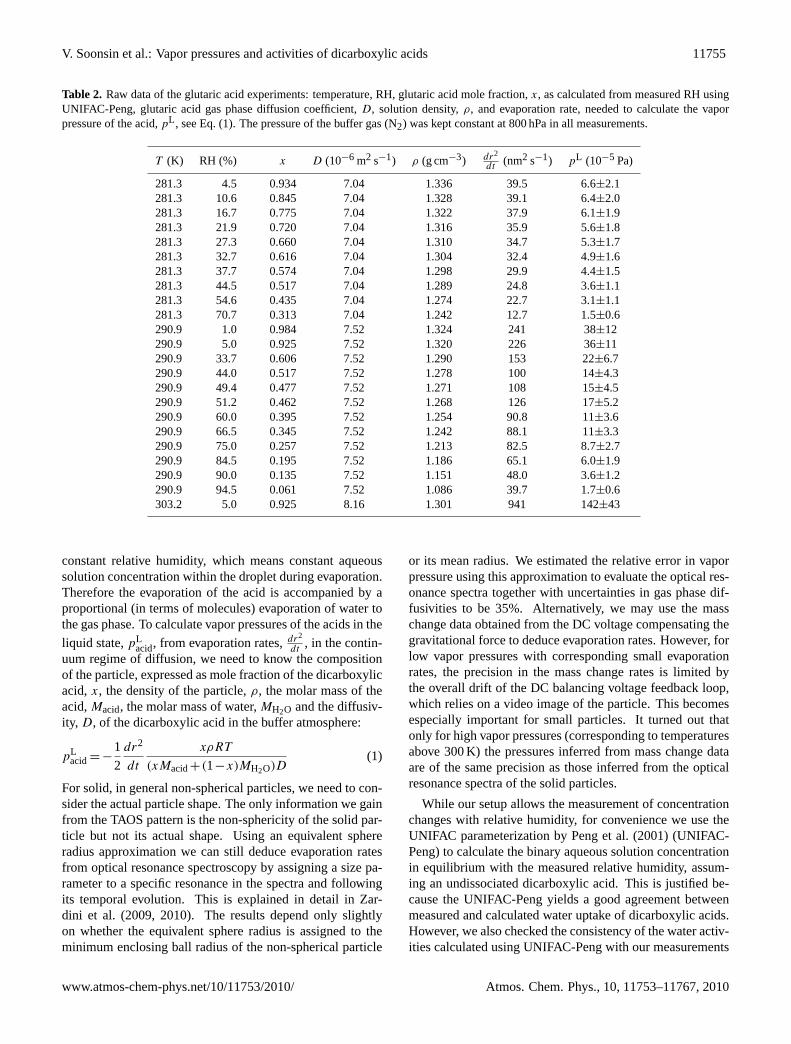
Table 2. Raw data of the glutaric acid experiments: temperature, RH, glutaric acid mole fraction,x, as calculated from measured RH usingUNIFAC-Peng, glutaric acid gas phase diffusion coefficient,D, solution density,ρ, and evaporation rate, needed to calculate the vaporpressure of the acid,pL , see Eq. (1). The pressure of the buffer gas (N2) was kept constant at 800 hPa in all measurements.
T (K) RH (%) x D (10−6 m2 s−1) ρ (g cm−3) dr2
dt(nm2 s−1) pL (10−5 Pa)
281.3 4.5 0.934 7.04 1.336 39.5 6.6±2.1281.3 10.6 0.845 7.04 1.328 39.1 6.4±2.0281.3 16.7 0.775 7.04 1.322 37.9 6.1±1.9281.3 21.9 0.720 7.04 1.316 35.9 5.6±1.8281.3 27.3 0.660 7.04 1.310 34.7 5.3±1.7281.3 32.7 0.616 7.04 1.304 32.4 4.9±1.6281.3 37.7 0.574 7.04 1.298 29.9 4.4±1.5281.3 44.5 0.517 7.04 1.289 24.8 3.6±1.1281.3 54.6 0.435 7.04 1.274 22.7 3.1±1.1281.3 70.7 0.313 7.04 1.242 12.7 1.5±0.6290.9 1.0 0.984 7.52 1.324 241 38±12290.9 5.0 0.925 7.52 1.320 226 36±11290.9 33.7 0.606 7.52 1.290 153 22±6.7290.9 44.0 0.517 7.52 1.278 100 14±4.3290.9 49.4 0.477 7.52 1.271 108 15±4.5290.9 51.2 0.462 7.52 1.268 126 17±5.2290.9 60.0 0.395 7.52 1.254 90.8 11±3.6290.9 66.5 0.345 7.52 1.242 88.1 11±3.3290.9 75.0 0.257 7.52 1.213 82.5 8.7±2.7290.9 84.5 0.195 7.52 1.186 65.1 6.0±1.9290.9 90.0 0.135 7.52 1.151 48.0 3.6±1.2290.9 94.5 0.061 7.52 1.086 39.7 1.7±0.6303.2 5.0 0.925 8.16 1.301 941 142±43
constant relative humidity, which means constant aqueoussolution concentration within the droplet during evaporation.Therefore the evaporation of the acid is accompanied by aproportional (in terms of molecules) evaporation of water tothe gas phase. To calculate vapor pressures of the acids in the
liquid state,pLacid, from evaporation rates,dr2
dt, in the contin-
uum regime of diffusion, we need to know the compositionof the particle, expressed as mole fraction of the dicarboxylicacid,x, the density of the particle,ρ, the molar mass of theacid,Macid, the molar mass of water,MH2O and the diffusiv-ity, D, of the dicarboxylic acid in the buffer atmosphere:
pLacid= −
1
2
dr2
dt
xρRT
(xMacid+(1−x)MH2O)D(1)
For solid, in general non-spherical particles, we need to con-sider the actual particle shape. The only information we gainfrom the TAOS pattern is the non-sphericity of the solid par-ticle but not its actual shape. Using an equivalent sphereradius approximation we can still deduce evaporation ratesfrom optical resonance spectroscopy by assigning a size pa-rameter to a specific resonance in the spectra and followingits temporal evolution. This is explained in detail inZar-dini et al. (2009, 2010). The results depend only slightlyon whether the equivalent sphere radius is assigned to theminimum enclosing ball radius of the non-spherical particle
or its mean radius. We estimated the relative error in vaporpressure using this approximation to evaluate the optical res-onance spectra together with uncertainties in gas phase dif-fusivities to be 35%. Alternatively, we may use the masschange data obtained from the DC voltage compensating thegravitational force to deduce evaporation rates. However, forlow vapor pressures with corresponding small evaporationrates, the precision in the mass change rates is limited bythe overall drift of the DC balancing voltage feedback loop,which relies on a video image of the particle. This becomesespecially important for small particles. It turned out thatonly for high vapor pressures (corresponding to temperaturesabove 300 K) the pressures inferred from mass change dataare of the same precision as those inferred from the opticalresonance spectra of the solid particles.
While our setup allows the measurement of concentrationchanges with relative humidity, for convenience we use theUNIFAC parameterization byPeng et al.(2001) (UNIFAC-Peng) to calculate the binary aqueous solution concentrationin equilibrium with the measured relative humidity, assum-ing an undissociated dicarboxylic acid. This is justified be-cause the UNIFAC-Peng yields a good agreement betweenmeasured and calculated water uptake of dicarboxylic acids.However, we also checked the consistency of the water activ-ities calculated using UNIFAC-Peng with our measurements
www.atmos-chem-phys.net/10/11753/2010/ Atmos. Chem. Phys., 10, 11753–11767, 2010
11756 V. Soonsin et al.: Vapor pressures and activities of dicarboxylic acids
of concentration changes at various relative humidities andfound agreement within experimental error. We calculatedthe gas phase diffusivities as described inBird et al.(2007),using the Lennard-Jones parameters as given inBilde et al.(2003).
3 Data analysis and results
Our data evaluation requires an iterative procedure to de-termine enthalpies of vaporization, activities of the solutes(dicarboxylic acids) and the vapor pressures of supercooledmelts and saturated solutions. We use glutaric acid as an ex-ample to illustrate this analysis in some detail and present thedata of the shorter chain dicarboxylic acids in the following.
3.1 Glutaric acid
We measured the evaporation rates of 5 different aque-ous glutaric acid particles at three different temperatures(281.3 K, 290.9 K and 303.2 K) and various relative humidi-ties as given in Table 2. Aqueous glutaric acid droplets ex-hibit a strong variability in efflorescence relative humidity(ERH) (Zardini et al., 2008). With some droplets we wereable to supersaturate the aqueous solution down to a RH ofabout 1% without the occurrence of crystallization. Whilethe reason for the variability in ERH remains unclear, it al-lows measurements over a wide range of concentrations.
For each measurement we adjusted temperature and rela-tive humidity and measured the evaporation rate over a timespan of at least 10 000 s and up to 100 000 s depending onthe magnitude of the rate. We used the measured RH to cal-culate the equilibrium concentration of the aqueous dropletusing UNIFAC-Peng (298.15 K) neglecting any temperaturedependence of water activity. To calculate vapor pressuresfrom the measured radius changes, knowledge of the den-sity of the particle as well as the diffusivity of glutaric acidin the gas phase is required (Zardini et al., 2006). Densi-ties as given in Table 2 were calculated assuming ideal mix-ing and taking the molar volume of glutaric acid from themeasurements ofBen-Hamo et al.(2007) at the highest con-centration (5.94 molar,VGlutaric(281.3 K) = 98.7 cm3 mol−1,VGlutaric(290.9 K) = 99.7 cm3 mol−1, VGlutaric(302.2 K) =
101.2 cm3 mol−1) interpolated to the respective temperature.It is difficult to calculate the cumulative error in vapor pres-sure, because we can only estimate the error in concentration,diffusivity and density, while the error in rate measurementis 5%±0.5 nm2 s−1. Overall, we estimate a relative errorin vapor pressure,pL , to be 30% plus an absolute error of±1.25×10⁻⁶ Pa, as given in the last column of Table 2.
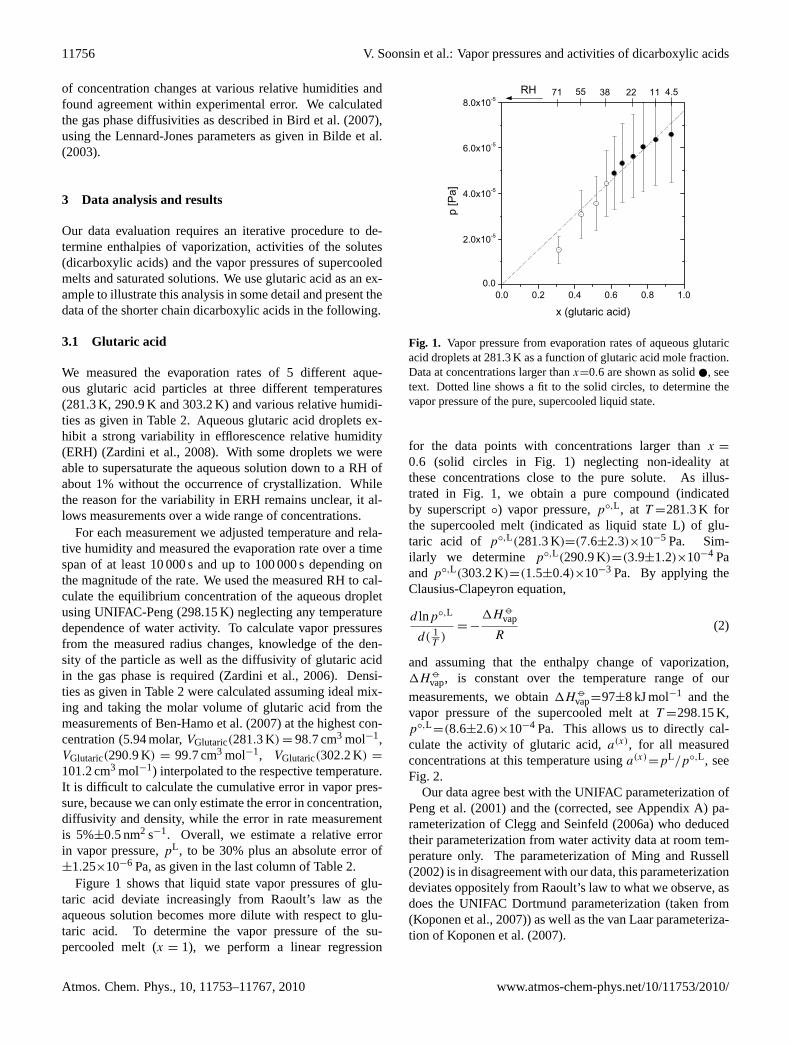
Figure 1 shows that liquid state vapor pressures of glu-taric acid deviate increasingly from Raoult’s law as theaqueous solution becomes more dilute with respect to glu-taric acid. To determine the vapor pressure of the su-percooled melt (x = 1), we perform a linear regression
Fig. 1. Vapor pressure from evaporation rates of aqueous glutaricacid droplets at 281.3 K as a function of glutaric acid mole fraction.Data at concentrations larger thanx=0.6 are shown as solid , seetext. Dotted line shows a fit to the solid circles, to determine thevapor pressure of the pure, supercooled liquid state.
for the data points with concentrations larger thanx =
0.6 (solid circles in Fig. 1) neglecting non-ideality atthese concentrations close to the pure solute. As illus-trated in Fig. 1, we obtain a pure compound (indicatedby superscript◦) vapor pressure,p◦,L , at T =281.3 K forthe supercooled melt (indicated as liquid state L) of glu-taric acid of p◦,L(281.3 K)=(7.6±2.3)×10−5 Pa. Sim-ilarly we determine p◦,L(290.9 K)=(3.9±1.2)×10−4 Paand p◦,L(303.2 K)=(1.5±0.4)×10−3 Pa. By applying theClausius-Clapeyron equation,
d lnp◦,L
d( 1T
)= −
1Hvap
R(2)
and assuming that the enthalpy change of vaporization,1H
vap, is constant over the temperature range of our
measurements, we obtain1Hvap=97±8 kJ mol−1 and the
vapor pressure of the supercooled melt atT =298.15 K,p◦,L
=(8.6±2.6)×10−4 Pa. This allows us to directly cal-culate the activity of glutaric acid,a(x), for all measuredconcentrations at this temperature usinga(x)
=pL/p◦,L , seeFig. 2.
Our data agree best with the UNIFAC parameterization ofPeng et al.(2001) and the (corrected, see AppendixA) pa-rameterization ofClegg and Seinfeld(2006a) who deducedtheir parameterization from water activity data at room tem-perature only. The parameterization ofMing and Russell(2002) is in disagreement with our data, this parameterizationdeviates oppositely from Raoult’s law to what we observe, asdoes the UNIFAC Dortmund parameterization (taken from(Koponen et al., 2007)) as well as the van Laar parameteriza-tion of Koponen et al.(2007).
Atmos. Chem. Phys., 10, 11753–11767, 2010 www.atmos-chem-phys.net/10/11753/2010/
V. Soonsin et al.: Vapor pressures and activities of dicarboxylic acids 11757
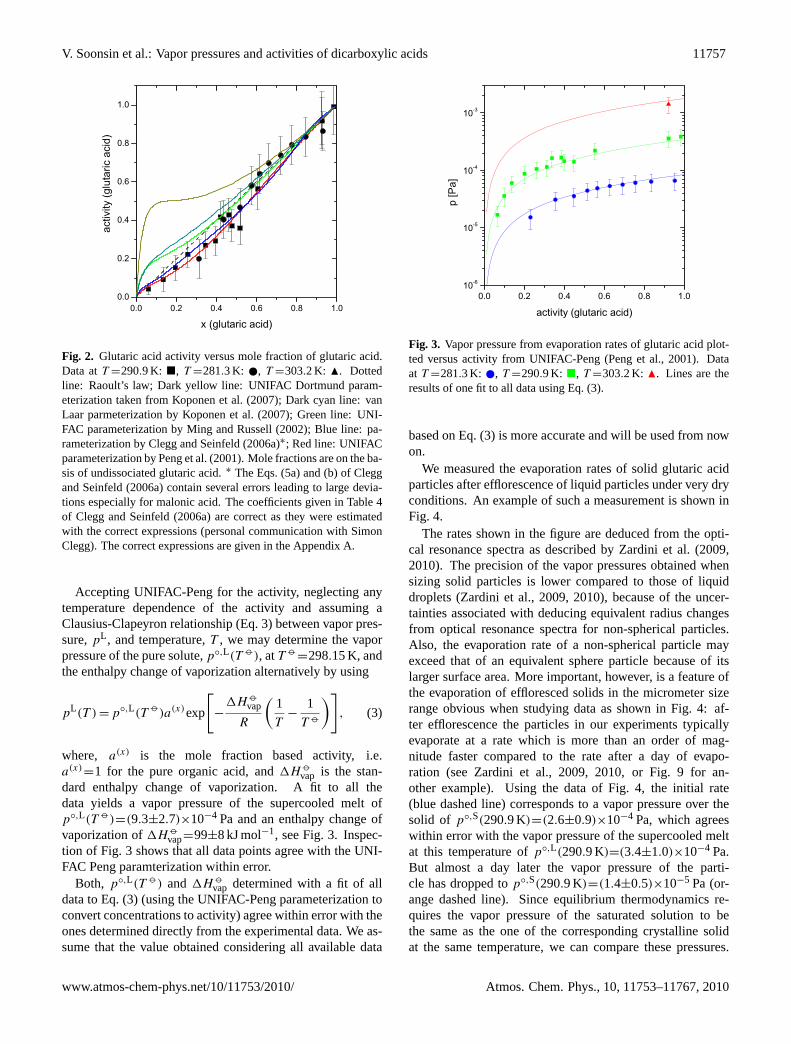
Fig. 2. Glutaric acid activity versus mole fraction of glutaric acid.Data atT =290.9 K: �, T =281.3 K: , T =303.2 K: N. Dottedline: Raoult’s law; Dark yellow line: UNIFAC Dortmund param-eterization taken fromKoponen et al.(2007); Dark cyan line: vanLaar parmeterization byKoponen et al.(2007); Green line: UNI-FAC parameterization byMing and Russell(2002); Blue line: pa-rameterization byClegg and Seinfeld(2006a)∗; Red line: UNIFACparameterization byPeng et al.(2001). Mole fractions are on the ba-sis of undissociated glutaric acid.∗ The Eqs. (5a) and (b) ofCleggand Seinfeld(2006a) contain several errors leading to large devia-tions especially for malonic acid. The coefficients given in Table 4of Clegg and Seinfeld(2006a) are correct as they were estimatedwith the correct expressions (personal communication with SimonClegg). The correct expressions are given in the AppendixA.
Accepting UNIFAC-Peng for the activity, neglecting anytemperature dependence of the activity and assuming aClausius-Clapeyron relationship (Eq.3) between vapor pres-sure,pL , and temperature,T , we may determine the vaporpressure of the pure solute,p◦,L(T ), atT
=298.15 K, andthe enthalpy change of vaporization alternatively by using
pL(T ) = p◦,L(T )a(x)exp
[−
1Hvap
R
(1
T−
1
T
)], (3)
where, a(x) is the mole fraction based activity, i.e.a(x)
=1 for the pure organic acid, and1Hvap is the stan-
dard enthalpy change of vaporization. A fit to all thedata yields a vapor pressure of the supercooled melt ofp◦,L(T )=(9.3±2.7)×10−4 Pa and an enthalpy change ofvaporization of1H
vap=99±8 kJ mol−1, see Fig.3. Inspec-tion of Fig. 3 shows that all data points agree with the UNI-FAC Peng paramterization within error.
Both, p◦,L(T ) and 1Hvap determined with a fit of all
data to Eq. (3) (using the UNIFAC-Peng parameterization toconvert concentrations to activity) agree within error with theones determined directly from the experimental data. We as-sume that the value obtained considering all available data
Fig. 3. Vapor pressure from evaporation rates of glutaric acid plot-ted versus activity from UNIFAC-Peng (Peng et al., 2001). Dataat T =281.3 K: , T =290.9 K: �, T =303.2 K: N. Lines are theresults of one fit to all data using Eq. (3).
based on Eq. (3) is more accurate and will be used from nowon.
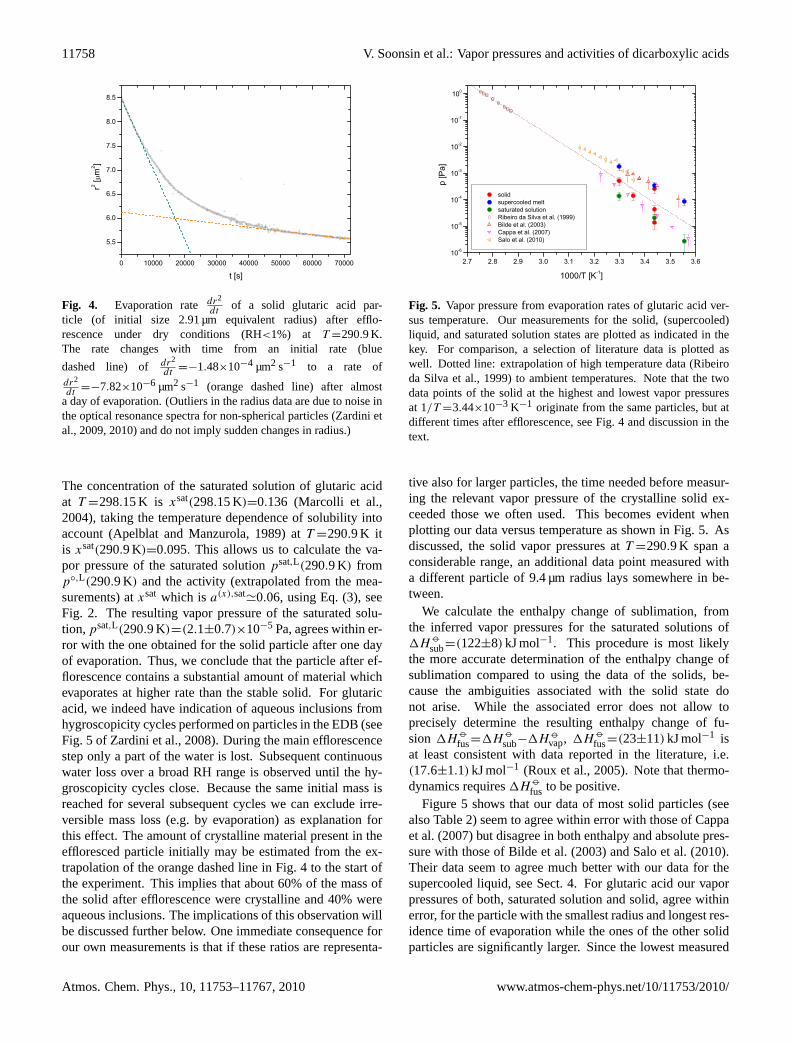
We measured the evaporation rates of solid glutaric acidparticles after efflorescence of liquid particles under very dryconditions. An example of such a measurement is shown inFig. 4.
The rates shown in the figure are deduced from the opti-cal resonance spectra as described byZardini et al.(2009,2010). The precision of the vapor pressures obtained whensizing solid particles is lower compared to those of liquiddroplets (Zardini et al., 2009, 2010), because of the uncer-tainties associated with deducing equivalent radius changesfrom optical resonance spectra for non-spherical particles.Also, the evaporation rate of a non-spherical particle mayexceed that of an equivalent sphere particle because of itslarger surface area. More important, however, is a feature ofthe evaporation of effloresced solids in the micrometer sizerange obvious when studying data as shown in Fig.4: af-ter efflorescence the particles in our experiments typicallyevaporate at a rate which is more than an order of mag-nitude faster compared to the rate after a day of evapo-ration (seeZardini et al., 2009, 2010, or Fig. 9 for an-other example). Using the data of Fig.4, the initial rate(blue dashed line) corresponds to a vapor pressure over thesolid of p◦,S(290.9 K)=(2.6±0.9)×10−4 Pa, which agreeswithin error with the vapor pressure of the supercooled meltat this temperature ofp◦,L(290.9 K)=(3.4±1.0)×10−4 Pa.But almost a day later the vapor pressure of the parti-cle has dropped top◦,S(290.9 K)=(1.4±0.5)×10−5 Pa (or-ange dashed line). Since equilibrium thermodynamics re-quires the vapor pressure of the saturated solution to bethe same as the one of the corresponding crystalline solidat the same temperature, we can compare these pressures.
www.atmos-chem-phys.net/10/11753/2010/ Atmos. Chem. Phys., 10, 11753–11767, 2010
11758 V. Soonsin et al.: Vapor pressures and activities of dicarboxylic acids
Fig. 4. Evaporation ratedr2
dtof a solid glutaric acid par-
ticle (of initial size 2.91 µm equivalent radius) after efflo-rescence under dry conditions (RH<1%) at T =290.9 K.The rate changes with time from an initial rate (blue
dashed line) of dr2
dt=−1.48×10⁻⁴ µm2 s−1 to a rate of
dr2
dt=−7.82×10⁻⁶ µm2 s−1 (orange dashed line) after almost
a day of evaporation. (Outliers in the radius data are due to noise inthe optical resonance spectra for non-spherical particles (Zardini etal., 2009, 2010) and do not imply sudden changes in radius.)
The concentration of the saturated solution of glutaric acidat T =298.15 K is xsat(298.15 K)=0.136 (Marcolli et al.,2004), taking the temperature dependence of solubility intoaccount (Apelblat and Manzurola, 1989) at T =290.9 K itis xsat(290.9 K)=0.095. This allows us to calculate the va-por pressure of the saturated solutionpsat,L(290.9 K) fromp◦,L(290.9 K) and the activity (extrapolated from the mea-surements) atxsat which isa(x),sat
'0.06, using Eq. (3), seeFig. 2. The resulting vapor pressure of the saturated solu-tion,psat,L(290.9 K)=(2.1±0.7)×10−5 Pa, agrees within er-ror with the one obtained for the solid particle after one dayof evaporation. Thus, we conclude that the particle after ef-florescence contains a substantial amount of material whichevaporates at higher rate than the stable solid. For glutaricacid, we indeed have indication of aqueous inclusions fromhygroscopicity cycles performed on particles in the EDB (seeFig. 5 ofZardini et al., 2008). During the main efflorescencestep only a part of the water is lost. Subsequent continuouswater loss over a broad RH range is observed until the hy-groscopicity cycles close. Because the same initial mass isreached for several subsequent cycles we can exclude irre-versible mass loss (e.g. by evaporation) as explanation forthis effect. The amount of crystalline material present in theeffloresced particle initially may be estimated from the ex-trapolation of the orange dashed line in Fig.4 to the start ofthe experiment. This implies that about 60% of the mass ofthe solid after efflorescence were crystalline and 40% wereaqueous inclusions. The implications of this observation willbe discussed further below. One immediate consequence forour own measurements is that if these ratios are representa-
Fig. 5. Vapor pressure from evaporation rates of glutaric acid ver-sus temperature. Our measurements for the solid, (supercooled)liquid, and saturated solution states are plotted as indicated in thekey. For comparison, a selection of literature data is plotted aswell. Dotted line: extrapolation of high temperature data (Ribeiroda Silva et al., 1999) to ambient temperatures. Note that the twodata points of the solid at the highest and lowest vapor pressuresat 1/T =3.44×10⁻³ K−1 originate from the same particles, but atdifferent times after efflorescence, see Fig.4 and discussion in thetext.
tive also for larger particles, the time needed before measur-ing the relevant vapor pressure of the crystalline solid ex-ceeded those we often used. This becomes evident whenplotting our data versus temperature as shown in Fig.5. Asdiscussed, the solid vapor pressures atT =290.9 K span aconsiderable range, an additional data point measured witha different particle of 9.4 µm radius lays somewhere in be-tween.
We calculate the enthalpy change of sublimation, fromthe inferred vapor pressures for the saturated solutions of1H
sub=(122±8) kJ mol−1. This procedure is most likelythe more accurate determination of the enthalpy change ofsublimation compared to using the data of the solids, be-cause the ambiguities associated with the solid state donot arise. While the associated error does not allow toprecisely determine the resulting enthalpy change of fu-sion 1H
fus=1Hsub−1H
vap, 1Hfus=(23±11) kJ mol−1 is
at least consistent with data reported in the literature, i.e.(17.6±1.1) kJ mol−1 (Roux et al., 2005). Note that thermo-dynamics requires1H
fus to be positive.Figure5 shows that our data of most solid particles (see
also Table 2) seem to agree within error with those ofCappaet al.(2007) but disagree in both enthalpy and absolute pres-sure with those ofBilde et al.(2003) andSalo et al.(2010).Their data seem to agree much better with our data for thesupercooled liquid, see Sect.4. For glutaric acid our vaporpressures of both, saturated solution and solid, agree withinerror, for the particle with the smallest radius and longest res-idence time of evaporation while the ones of the other solidparticles are significantly larger. Since the lowest measured
Atmos. Chem. Phys., 10, 11753–11767, 2010 www.atmos-chem-phys.net/10/11753/2010/
V. Soonsin et al.: Vapor pressures and activities of dicarboxylic acids 11759
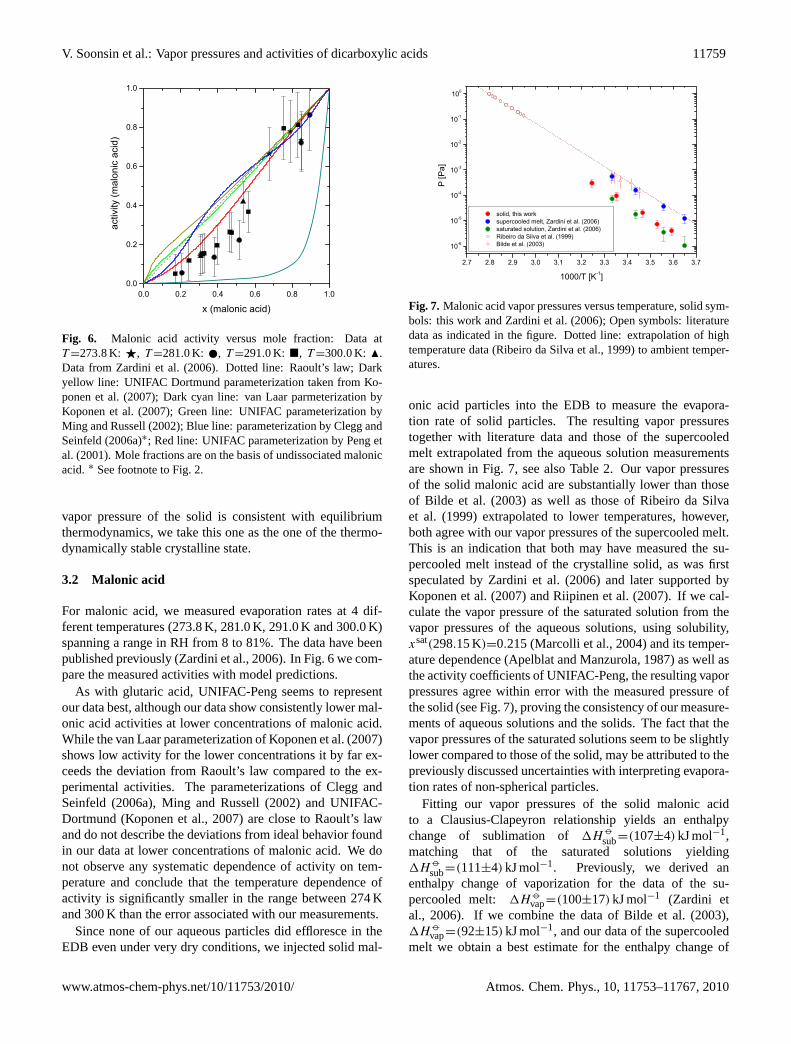
Fig. 6. Malonic acid activity versus mole fraction: Data atT =273.8 K: F, T =281.0 K: , T =291.0 K: �, T =300.0 K: N.Data fromZardini et al.(2006). Dotted line: Raoult’s law; Darkyellow line: UNIFAC Dortmund parameterization taken fromKo-ponen et al.(2007); Dark cyan line: van Laar parmeterization byKoponen et al.(2007); Green line: UNIFAC parameterization byMing and Russell(2002); Blue line: parameterization byClegg andSeinfeld(2006a)∗; Red line: UNIFAC parameterization byPeng etal. (2001). Mole fractions are on the basis of undissociated malonicacid.∗ See footnote to Fig.2.
vapor pressure of the solid is consistent with equilibriumthermodynamics, we take this one as the one of the thermo-dynamically stable crystalline state.
3.2 Malonic acid
For malonic acid, we measured evaporation rates at 4 dif-ferent temperatures (273.8 K, 281.0 K, 291.0 K and 300.0 K)spanning a range in RH from 8 to 81%. The data have beenpublished previously (Zardini et al., 2006). In Fig.6 we com-pare the measured activities with model predictions.
As with glutaric acid, UNIFAC-Peng seems to representour data best, although our data show consistently lower mal-onic acid activities at lower concentrations of malonic acid.While the van Laar parameterization ofKoponen et al.(2007)shows low activity for the lower concentrations it by far ex-ceeds the deviation from Raoult’s law compared to the ex-perimental activities. The parameterizations ofClegg andSeinfeld (2006a), Ming and Russell(2002) and UNIFAC-Dortmund (Koponen et al., 2007) are close to Raoult’s lawand do not describe the deviations from ideal behavior foundin our data at lower concentrations of malonic acid. We donot observe any systematic dependence of activity on tem-perature and conclude that the temperature dependence ofactivity is significantly smaller in the range between 274 Kand 300 K than the error associated with our measurements.
Since none of our aqueous particles did effloresce in theEDB even under very dry conditions, we injected solid mal-
Fig. 7. Malonic acid vapor pressures versus temperature, solid sym-bols: this work andZardini et al.(2006); Open symbols: literaturedata as indicated in the figure. Dotted line: extrapolation of hightemperature data (Ribeiro da Silva et al., 1999) to ambient temper-atures.
onic acid particles into the EDB to measure the evapora-tion rate of solid particles. The resulting vapor pressurestogether with literature data and those of the supercooledmelt extrapolated from the aqueous solution measurementsare shown in Fig.7, see also Table 2. Our vapor pressuresof the solid malonic acid are substantially lower than thoseof Bilde et al. (2003) as well as those ofRibeiro da Silvaet al. (1999) extrapolated to lower temperatures, however,both agree with our vapor pressures of the supercooled melt.This is an indication that both may have measured the su-percooled melt instead of the crystalline solid, as was firstspeculated byZardini et al.(2006) and later supported byKoponen et al.(2007) andRiipinen et al.(2007). If we cal-culate the vapor pressure of the saturated solution from thevapor pressures of the aqueous solutions, using solubility,xsat(298.15 K)=0.215 (Marcolli et al., 2004) and its temper-ature dependence (Apelblat and Manzurola, 1987) as well asthe activity coefficients of UNIFAC-Peng, the resulting vaporpressures agree within error with the measured pressure ofthe solid (see Fig.7), proving the consistency of our measure-ments of aqueous solutions and the solids. The fact that thevapor pressures of the saturated solutions seem to be slightlylower compared to those of the solid, may be attributed to thepreviously discussed uncertainties with interpreting evapora-tion rates of non-spherical particles.
Fitting our vapor pressures of the solid malonic acidto a Clausius-Clapeyron relationship yields an enthalpychange of sublimation of 1H
sub=(107±4) kJ mol−1,matching that of the saturated solutions yielding1H
sub=(111±4) kJ mol−1. Previously, we derived anenthalpy change of vaporization for the data of the su-percooled melt: 1H
vap=(100±17) kJ mol−1 (Zardini etal., 2006). If we combine the data ofBilde et al. (2003),1H
vap=(92±15) kJ mol−1, and our data of the supercooledmelt we obtain a best estimate for the enthalpy change of
www.atmos-chem-phys.net/10/11753/2010/ Atmos. Chem. Phys., 10, 11753–11767, 2010
11760 V. Soonsin et al.: Vapor pressures and activities of dicarboxylic acids
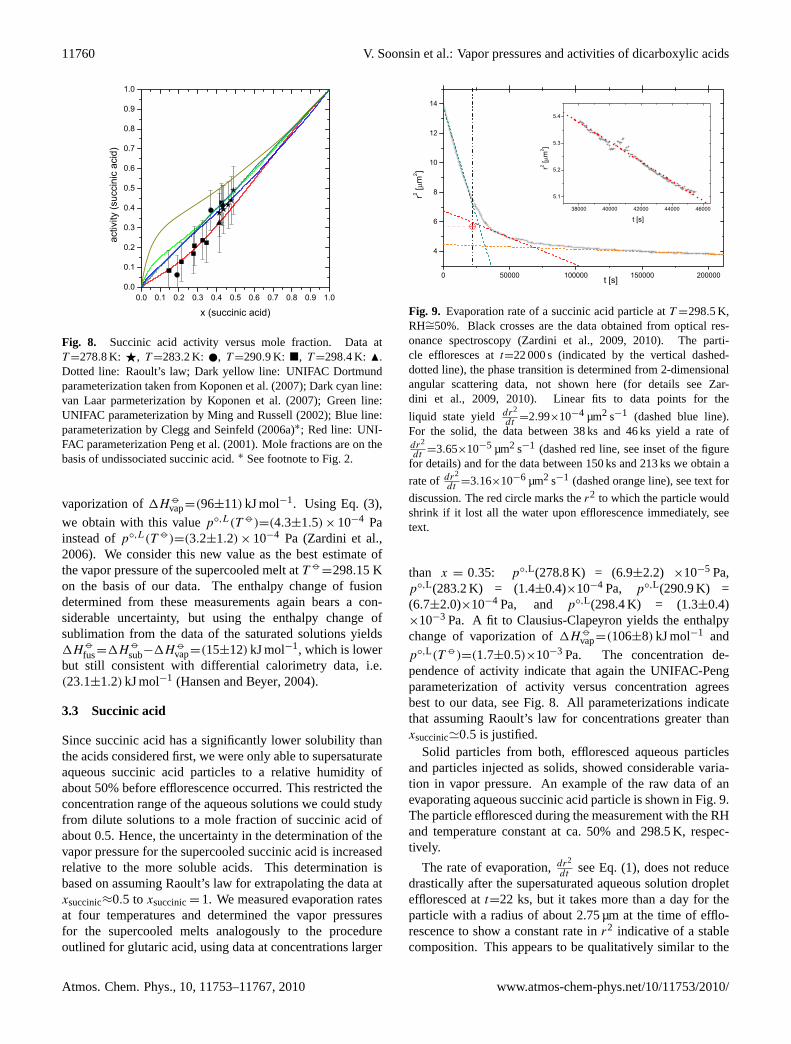
Fig. 8. Succinic acid activity versus mole fraction. Data atT =278.8 K: F, T =283.2 K: , T =290.9 K: �, T =298.4 K: N.Dotted line: Raoult’s law; Dark yellow line: UNIFAC Dortmundparameterization taken fromKoponen et al.(2007); Dark cyan line:van Laar parmeterization byKoponen et al.(2007); Green line:UNIFAC parameterization byMing and Russell(2002); Blue line:parameterization byClegg and Seinfeld(2006a)∗; Red line: UNI-FAC parameterizationPeng et al.(2001). Mole fractions are on thebasis of undissociated succinic acid.∗ See footnote to Fig.2.
vaporization of1Hvap=(96±11) kJ mol−1. Using Eq. (3),
we obtain with this valuep◦,L(T )=(4.3±1.5)×10−4 Painstead ofp◦,L(T )=(3.2±1.2)× 10−4 Pa (Zardini et al.,2006). We consider this new value as the best estimate ofthe vapor pressure of the supercooled melt atT
=298.15 Kon the basis of our data. The enthalpy change of fusiondetermined from these measurements again bears a con-siderable uncertainty, but using the enthalpy change ofsublimation from the data of the saturated solutions yields1H
fus=1Hsub−1H
vap=(15±12) kJ mol−1, which is lowerbut still consistent with differential calorimetry data, i.e.(23.1±1.2) kJ mol−1 (Hansen and Beyer, 2004).
3.3 Succinic acid
Since succinic acid has a significantly lower solubility thanthe acids considered first, we were only able to supersaturateaqueous succinic acid particles to a relative humidity ofabout 50% before efflorescence occurred. This restricted theconcentration range of the aqueous solutions we could studyfrom dilute solutions to a mole fraction of succinic acid ofabout 0.5. Hence, the uncertainty in the determination of thevapor pressure for the supercooled succinic acid is increasedrelative to the more soluble acids. This determination isbased on assuming Raoult’s law for extrapolating the data atxsuccinic≈0.5 to xsuccinic= 1. We measured evaporation ratesat four temperatures and determined the vapor pressuresfor the supercooled melts analogously to the procedureoutlined for glutaric acid, using data at concentrations larger
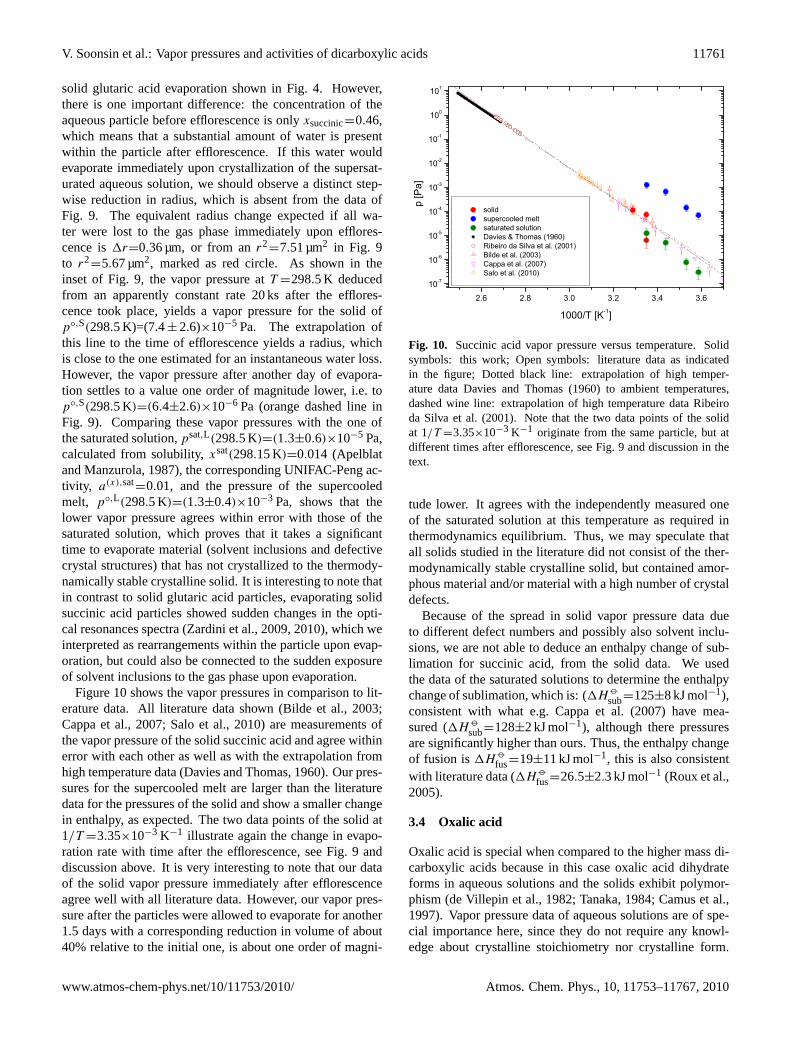
Fig. 9. Evaporation rate of a succinic acid particle atT =298.5 K,RH∼=50%. Black crosses are the data obtained from optical res-onance spectroscopy (Zardini et al., 2009, 2010). The parti-cle effloresces att=22 000 s (indicated by the vertical dashed-dotted line), the phase transition is determined from 2-dimensionalangular scattering data, not shown here (for details seeZar-dini et al., 2009, 2010). Linear fits to data points for the
liquid state yield dr2
dt=2.99×10⁻⁴ µm2 s−1 (dashed blue line).
For the solid, the data between 38 ks and 46 ks yield a rate ofdr2
dt=3.65×10⁻⁵ µm2 s−1 (dashed red line, see inset of the figure
for details) and for the data between 150 ks and 213 ks we obtain a
rate of dr2
dt=3.16×10⁻⁶ µm2 s−1 (dashed orange line), see text for
discussion. The red circle marks ther2 to which the particle wouldshrink if it lost all the water upon efflorescence immediately, seetext.
than x = 0.35: p◦,L(278.8 K) = (6.9±2.2) ×10−5 Pa,p◦,L(283.2 K) = (1.4±0.4)×10−4 Pa, p◦,L(290.9 K) =(6.7±2.0)×10−4 Pa, and p◦,L(298.4 K) = (1.3±0.4)×10−3 Pa. A fit to Clausius-Clapeyron yields the enthalpychange of vaporization of1H
vap=(106±8) kJ mol−1 and
p◦,L(T )=(1.7±0.5)×10−3 Pa. The concentration de-pendence of activity indicate that again the UNIFAC-Pengparameterization of activity versus concentration agreesbest to our data, see Fig.8. All parameterizations indicatethat assuming Raoult’s law for concentrations greater thanxsuccinic'0.5 is justified.
Solid particles from both, effloresced aqueous particlesand particles injected as solids, showed considerable varia-tion in vapor pressure. An example of the raw data of anevaporating aqueous succinic acid particle is shown in Fig.9.The particle effloresced during the measurement with the RHand temperature constant at ca. 50% and 298.5 K, respec-tively.
The rate of evaporation,dr2
dtsee Eq. (1), does not reduce
drastically after the supersaturated aqueous solution dropleteffloresced att=22 ks, but it takes more than a day for theparticle with a radius of about 2.75 µm at the time of efflo-rescence to show a constant rate inr2 indicative of a stablecomposition. This appears to be qualitatively similar to the
Atmos. Chem. Phys., 10, 11753–11767, 2010 www.atmos-chem-phys.net/10/11753/2010/
V. Soonsin et al.: Vapor pressures and activities of dicarboxylic acids 11761
solid glutaric acid evaporation shown in Fig.4. However,there is one important difference: the concentration of theaqueous particle before efflorescence is onlyxsuccinic=0.46,which means that a substantial amount of water is presentwithin the particle after efflorescence. If this water wouldevaporate immediately upon crystallization of the supersat-urated aqueous solution, we should observe a distinct step-wise reduction in radius, which is absent from the data ofFig. 9. The equivalent radius change expected if all wa-ter were lost to the gas phase immediately upon efflores-cence is1r=0.36 µm, or from anr2
=7.51 µm2 in Fig. 9to r2
=5.67 µm2, marked as red circle. As shown in theinset of Fig.9, the vapor pressure atT =298.5 K deducedfrom an apparently constant rate 20 ks after the efflores-cence took place, yields a vapor pressure for the solid ofp◦,S(298.5 K)=(7.4± 2.6)×10−5 Pa. The extrapolation ofthis line to the time of efflorescence yields a radius, whichis close to the one estimated for an instantaneous water loss.However, the vapor pressure after another day of evapora-tion settles to a value one order of magnitude lower, i.e. top◦,S(298.5 K)=(6.4±2.6)×10−6 Pa (orange dashed line inFig. 9). Comparing these vapor pressures with the one ofthe saturated solution,psat,L(298.5 K)=(1.3±0.6)×10−5 Pa,calculated from solubility,xsat(298.15 K)=0.014 (Apelblatand Manzurola, 1987), the corresponding UNIFAC-Peng ac-tivity, a(x),sat
=0.01, and the pressure of the supercooledmelt, p◦,L(298.5 K)=(1.3±0.4)×10−3 Pa, shows that thelower vapor pressure agrees within error with those of thesaturated solution, which proves that it takes a significanttime to evaporate material (solvent inclusions and defectivecrystal structures) that has not crystallized to the thermody-namically stable crystalline solid. It is interesting to note thatin contrast to solid glutaric acid particles, evaporating solidsuccinic acid particles showed sudden changes in the opti-cal resonances spectra (Zardini et al., 2009, 2010), which weinterpreted as rearrangements within the particle upon evap-oration, but could also be connected to the sudden exposureof solvent inclusions to the gas phase upon evaporation.
Figure10 shows the vapor pressures in comparison to lit-erature data. All literature data shown (Bilde et al., 2003;Cappa et al., 2007; Salo et al., 2010) are measurements ofthe vapor pressure of the solid succinic acid and agree withinerror with each other as well as with the extrapolation fromhigh temperature data (Davies and Thomas, 1960). Our pres-sures for the supercooled melt are larger than the literaturedata for the pressures of the solid and show a smaller changein enthalpy, as expected. The two data points of the solid at1/T =3.35×10⁻³ K−1 illustrate again the change in evapo-ration rate with time after the efflorescence, see Fig.9 anddiscussion above. It is very interesting to note that our dataof the solid vapor pressure immediately after efflorescenceagree well with all literature data. However, our vapor pres-sure after the particles were allowed to evaporate for another1.5 days with a corresponding reduction in volume of about40% relative to the initial one, is about one order of magni-
Fig. 10. Succinic acid vapor pressure versus temperature. Solidsymbols: this work; Open symbols: literature data as indicatedin the figure; Dotted black line: extrapolation of high temper-ature dataDavies and Thomas(1960) to ambient temperatures,dashed wine line: extrapolation of high temperature dataRibeiroda Silva et al.(2001). Note that the two data points of the solidat 1/T =3.35×10⁻³ K−1 originate from the same particle, but atdifferent times after efflorescence, see Fig.9 and discussion in thetext.
tude lower. It agrees with the independently measured oneof the saturated solution at this temperature as required inthermodynamics equilibrium. Thus, we may speculate thatall solids studied in the literature did not consist of the ther-modynamically stable crystalline solid, but contained amor-phous material and/or material with a high number of crystaldefects.
Because of the spread in solid vapor pressure data dueto different defect numbers and possibly also solvent inclu-sions, we are not able to deduce an enthalpy change of sub-limation for succinic acid, from the solid data. We usedthe data of the saturated solutions to determine the enthalpychange of sublimation, which is: (1H
sub=125±8 kJ mol−1),consistent with what e.g.Cappa et al.(2007) have mea-sured (1H
sub=128±2 kJ mol−1), although there pressuresare significantly higher than ours. Thus, the enthalpy changeof fusion is1H
fus=19±11 kJ mol−1, this is also consistentwith literature data (1H
fus=26.5±2.3 kJ mol−1 (Roux et al.,2005).
3.4 Oxalic acid
Oxalic acid is special when compared to the higher mass di-carboxylic acids because in this case oxalic acid dihydrateforms in aqueous solutions and the solids exhibit polymor-phism (de Villepin et al., 1982; Tanaka, 1984; Camus et al.,1997). Vapor pressure data of aqueous solutions are of spe-cial importance here, since they do not require any knowl-edge about crystalline stoichiometry nor crystalline form.
www.atmos-chem-phys.net/10/11753/2010/ Atmos. Chem. Phys., 10, 11753–11767, 2010
11762 V. Soonsin et al.: Vapor pressures and activities of dicarboxylic acids
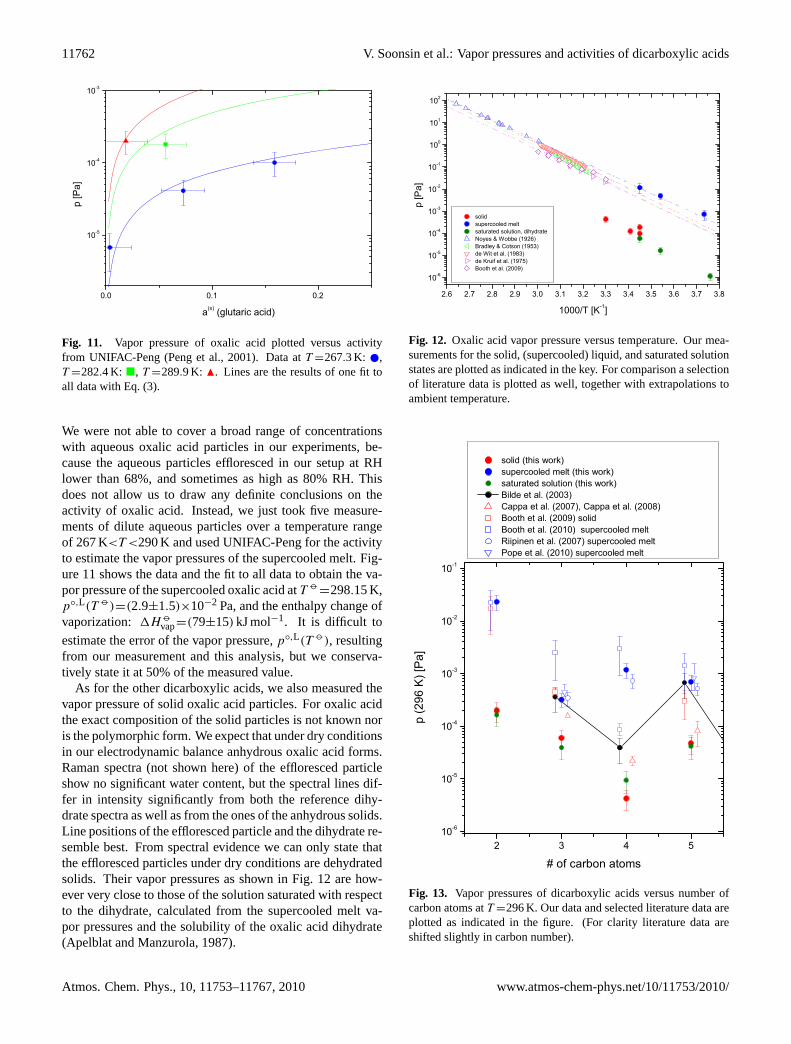
Fig. 11. Vapor pressure of oxalic acid plotted versus activityfrom UNIFAC-Peng (Peng et al., 2001). Data atT =267.3 K: ,T =282.4 K: �, T =289.9 K: N. Lines are the results of one fit toall data with Eq. (3).
We were not able to cover a broad range of concentrationswith aqueous oxalic acid particles in our experiments, be-cause the aqueous particles effloresced in our setup at RHlower than 68%, and sometimes as high as 80% RH. Thisdoes not allow us to draw any definite conclusions on theactivity of oxalic acid. Instead, we just took five measure-ments of dilute aqueous particles over a temperature rangeof 267 K<T <290 K and used UNIFAC-Peng for the activityto estimate the vapor pressures of the supercooled melt. Fig-ure11 shows the data and the fit to all data to obtain the va-por pressure of the supercooled oxalic acid atT
=298.15 K,p◦,L(T )=(2.9±1.5)×10−2 Pa, and the enthalpy change ofvaporization: 1H
vap=(79±15) kJ mol−1. It is difficult to
estimate the error of the vapor pressure,p◦,L(T ), resultingfrom our measurement and this analysis, but we conserva-tively state it at 50% of the measured value.
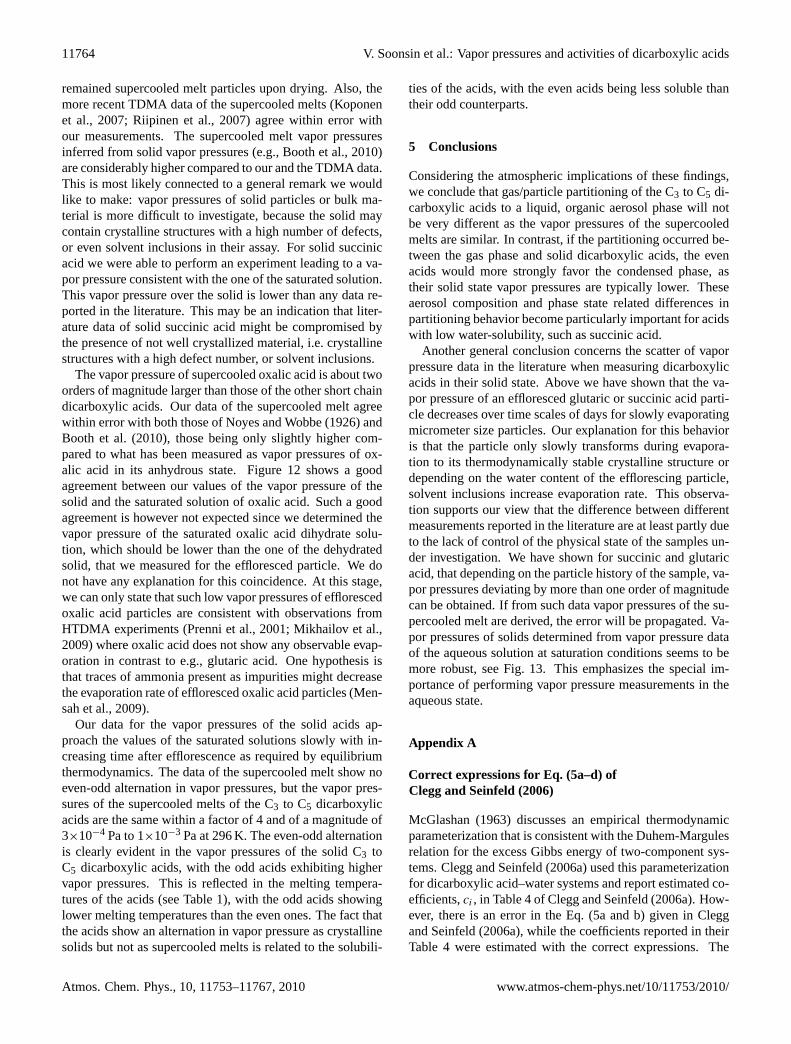
As for the other dicarboxylic acids, we also measured thevapor pressure of solid oxalic acid particles. For oxalic acidthe exact composition of the solid particles is not known noris the polymorphic form. We expect that under dry conditionsin our electrodynamic balance anhydrous oxalic acid forms.Raman spectra (not shown here) of the effloresced particleshow no significant water content, but the spectral lines dif-fer in intensity significantly from both the reference dihy-drate spectra as well as from the ones of the anhydrous solids.Line positions of the effloresced particle and the dihydrate re-semble best. From spectral evidence we can only state thatthe effloresced particles under dry conditions are dehydratedsolids. Their vapor pressures as shown in Fig.12 are how-ever very close to those of the solution saturated with respectto the dihydrate, calculated from the supercooled melt va-por pressures and the solubility of the oxalic acid dihydrate(Apelblat and Manzurola, 1987).
Fig. 12. Oxalic acid vapor pressure versus temperature. Our mea-surements for the solid, (supercooled) liquid, and saturated solutionstates are plotted as indicated in the key. For comparison a selectionof literature data is plotted as well, together with extrapolations toambient temperature.
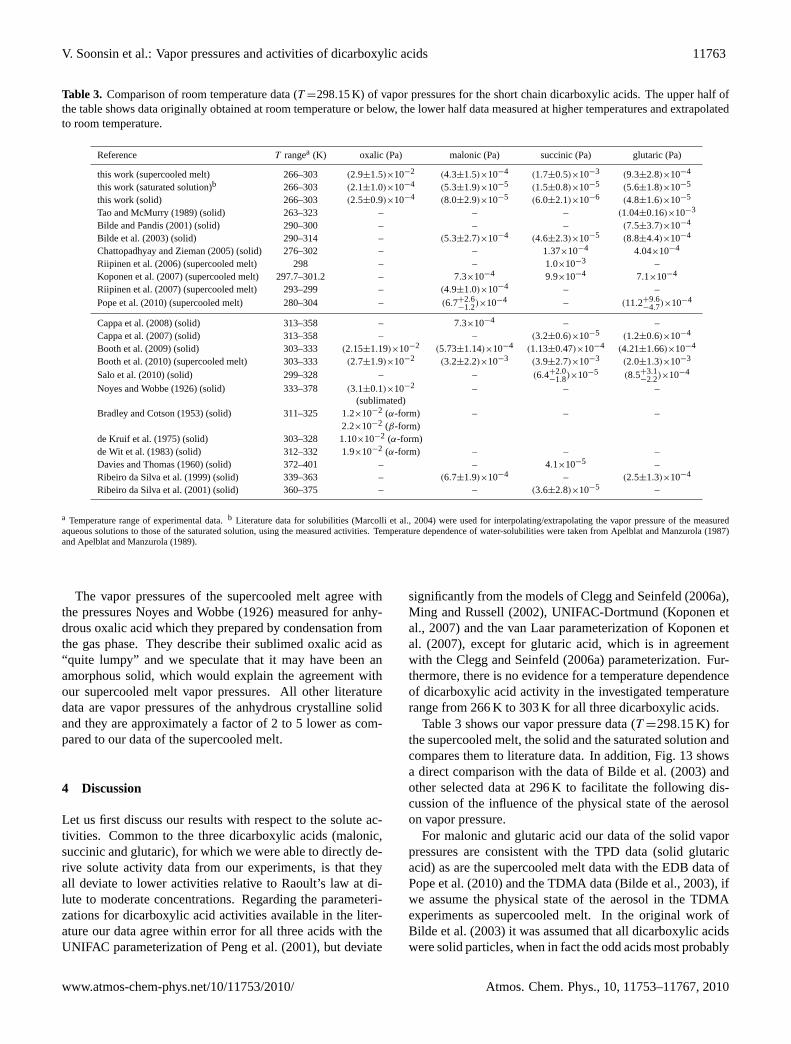
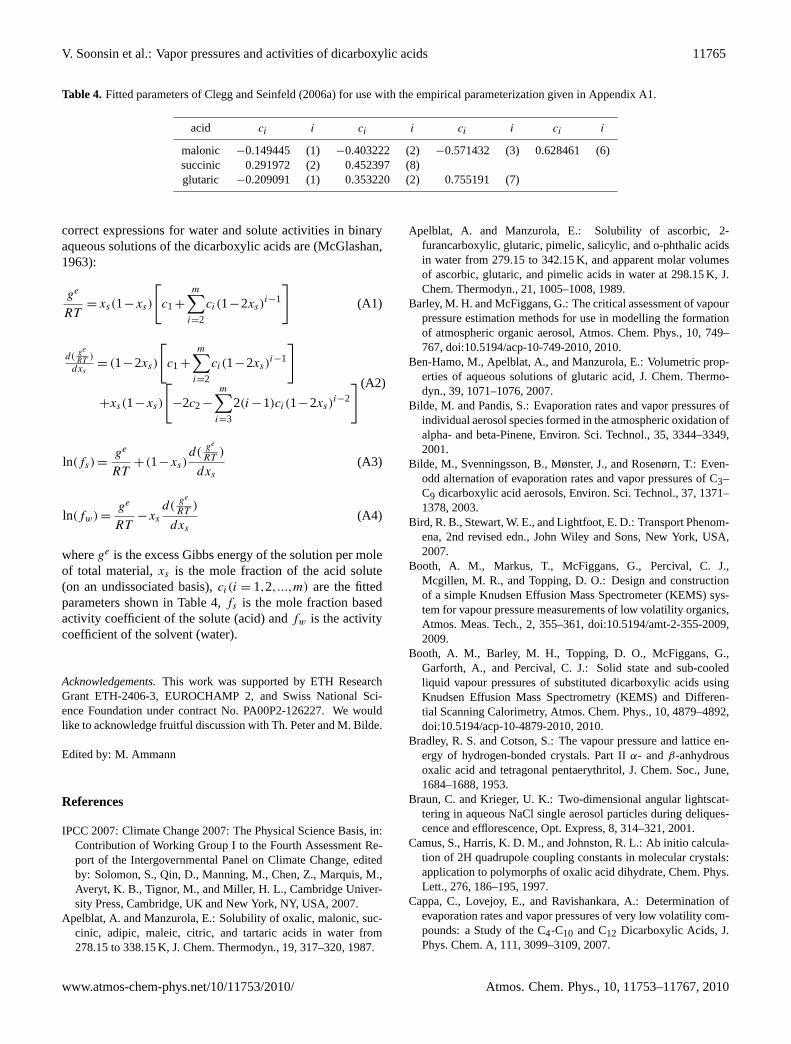
Fig. 13. Vapor pressures of dicarboxylic acids versus number ofcarbon atoms atT =296 K. Our data and selected literature data areplotted as indicated in the figure. (For clarity literature data areshifted slightly in carbon number).
Atmos. Chem. Phys., 10, 11753–11767, 2010 www.atmos-chem-phys.net/10/11753/2010/
V. Soonsin et al.: Vapor pressures and activities of dicarboxylic acids 11763
Table 3. Comparison of room temperature data (T =298.15 K) of vapor pressures for the short chain dicarboxylic acids. The upper half ofthe table shows data originally obtained at room temperature or below, the lower half data measured at higher temperatures and extrapolatedto room temperature.
Reference T rangea (K) oxalic (Pa) malonic (Pa) succinic (Pa) glutaric (Pa)
this work (supercooled melt) 266–303 (2.9±1.5)×10−2 (4.3±1.5)×10−4 (1.7±0.5)×10−3 (9.3±2.8)×10−4
this work (saturated solution)b 266–303 (2.1±1.0)×10−4 (5.3±1.9)×10−5 (1.5±0.8)×10−5 (5.6±1.8)×10−5
this work (solid) 266–303 (2.5±0.9)×10−4 (8.0±2.9)×10−5 (6.0±2.1)×10−6 (4.8±1.6)×10−5
Tao and McMurry (1989) (solid) 263–323 – – – (1.04±0.16)×10−3
Bilde and Pandis (2001) (solid) 290–300 – – – (7.5±3.7)×10−4
Bilde et al. (2003) (solid) 290–314 – (5.3±2.7)×10−4 (4.6±2.3)×10−5 (8.8±4.4)×10−4
Chattopadhyay and Zieman (2005) (solid) 276–302 – – 1.37×10⁻⁴ 4.04×10⁻⁴
Riipinen et al. (2006) (supercooled melt) 298 – – 1.0×10⁻³ –Koponen et al. (2007) (supercooled melt) 297.7–301.2 – 7.3×10⁻⁴ 9.9×10⁻⁴ 7.1×10⁻⁴
Riipinen et al. (2007) (supercooled melt) 293–299 – (4.9±1.0)×10−4 – –Pope et al. (2010) (supercooled melt) 280–304 – (6.7+2.6
−1.2)×10−4 – (11.2+9.6−4.7)×10−4
Cappa et al. (2008) (solid) 313–358 – 7.3×10⁻⁴ – –Cappa et al. (2007) (solid) 313–358 – – (3.2±0.6)×10−5 (1.2±0.6)×10−4
Booth et al. (2009) (solid) 303–333 (2.15±1.19)×10−2 (5.73±1.14)×10−4 (1.13±0.47)×10−4 (4.21±1.66)×10−4
Booth et al. (2010) (supercooled melt) 303–333 (2.7±1.9)×10−2 (3.2±2.2)×10−3 (3.9±2.7)×10−3 (2.0±1.3)×10−3
Salo et al. (2010) (solid) 299–328 – – (6.4+2.0−1.8)×10−5 (8.5+3.1
−2.2)×10−4
Noyes and Wobbe (1926) (solid) 333–378 (3.1±0.1)×10−2 – – –(sublimated)
Bradley and Cotson (1953) (solid) 311–325 1.2×10⁻² (α-form) – – –2.2×10⁻² (β-form)
de Kruif et al. (1975) (solid) 303–328 1.10×10⁻² (α-form)de Wit et al. (1983) (solid) 312–332 1.9×10⁻² (α-form) – – –Davies and Thomas (1960) (solid) 372–401 – – 4.1×10⁻⁵ –Ribeiro da Silva et al. (1999) (solid) 339–363 – (6.7±1.9)×10−4 – (2.5±1.3)×10−4
Ribeiro da Silva et al. (2001) (solid) 360–375 – – (3.6±2.8)×10−5 –
a Temperature range of experimental data.b Literature data for solubilities (Marcolli et al., 2004) were used for interpolating/extrapolating the vapor pressure of the measuredaqueous solutions to those of the saturated solution, using the measured activities. Temperature dependence of water-solubilities were taken fromApelblat and Manzurola(1987)andApelblat and Manzurola(1989).
The vapor pressures of the supercooled melt agree withthe pressuresNoyes and Wobbe(1926) measured for anhy-drous oxalic acid which they prepared by condensation fromthe gas phase. They describe their sublimed oxalic acid as“quite lumpy” and we speculate that it may have been anamorphous solid, which would explain the agreement withour supercooled melt vapor pressures. All other literaturedata are vapor pressures of the anhydrous crystalline solidand they are approximately a factor of 2 to 5 lower as com-pared to our data of the supercooled melt.
4 Discussion
Let us first discuss our results with respect to the solute ac-tivities. Common to the three dicarboxylic acids (malonic,succinic and glutaric), for which we were able to directly de-rive solute activity data from our experiments, is that theyall deviate to lower activities relative to Raoult’s law at di-lute to moderate concentrations. Regarding the parameteri-zations for dicarboxylic acid activities available in the liter-ature our data agree within error for all three acids with theUNIFAC parameterization ofPeng et al.(2001), but deviate
significantly from the models ofClegg and Seinfeld(2006a),Ming and Russell(2002), UNIFAC-Dortmund (Koponen etal., 2007) and the van Laar parameterization ofKoponen etal. (2007), except for glutaric acid, which is in agreementwith theClegg and Seinfeld(2006a) parameterization. Fur-thermore, there is no evidence for a temperature dependenceof dicarboxylic acid activity in the investigated temperaturerange from 266 K to 303 K for all three dicarboxylic acids.
Table 3 shows our vapor pressure data (T =298.15 K) forthe supercooled melt, the solid and the saturated solution andcompares them to literature data. In addition, Fig.13 showsa direct comparison with the data ofBilde et al.(2003) andother selected data at 296 K to facilitate the following dis-cussion of the influence of the physical state of the aerosolon vapor pressure.
For malonic and glutaric acid our data of the solid vaporpressures are consistent with the TPD data (solid glutaricacid) as are the supercooled melt data with the EDB data ofPope et al.(2010) and the TDMA data (Bilde et al., 2003), ifwe assume the physical state of the aerosol in the TDMAexperiments as supercooled melt. In the original work ofBilde et al.(2003) it was assumed that all dicarboxylic acidswere solid particles, when in fact the odd acids most probably
www.atmos-chem-phys.net/10/11753/2010/ Atmos. Chem. Phys., 10, 11753–11767, 2010
11764 V. Soonsin et al.: Vapor pressures and activities of dicarboxylic acids
remained supercooled melt particles upon drying. Also, themore recent TDMA data of the supercooled melts (Koponenet al., 2007; Riipinen et al., 2007) agree within error withour measurements. The supercooled melt vapor pressuresinferred from solid vapor pressures (e.g.,Booth et al., 2010)are considerably higher compared to our and the TDMA data.This is most likely connected to a general remark we wouldlike to make: vapor pressures of solid particles or bulk ma-terial is more difficult to investigate, because the solid maycontain crystalline structures with a high number of defects,or even solvent inclusions in their assay. For solid succinicacid we were able to perform an experiment leading to a va-por pressure consistent with the one of the saturated solution.This vapor pressure over the solid is lower than any data re-ported in the literature. This may be an indication that liter-ature data of solid succinic acid might be compromised bythe presence of not well crystallized material, i.e. crystallinestructures with a high defect number, or solvent inclusions.
The vapor pressure of supercooled oxalic acid is about twoorders of magnitude larger than those of the other short chaindicarboxylic acids. Our data of the supercooled melt agreewithin error with both those ofNoyes and Wobbe(1926) andBooth et al.(2010), those being only slightly higher com-pared to what has been measured as vapor pressures of ox-alic acid in its anhydrous state. Figure12 shows a goodagreement between our values of the vapor pressure of thesolid and the saturated solution of oxalic acid. Such a goodagreement is however not expected since we determined thevapor pressure of the saturated oxalic acid dihydrate solu-tion, which should be lower than the one of the dehydratedsolid, that we measured for the effloresced particle. We donot have any explanation for this coincidence. At this stage,we can only state that such low vapor pressures of efflorescedoxalic acid particles are consistent with observations fromHTDMA experiments (Prenni et al., 2001; Mikhailov et al.,2009) where oxalic acid does not show any observable evap-oration in contrast to e.g., glutaric acid. One hypothesis isthat traces of ammonia present as impurities might decreasethe evaporation rate of effloresced oxalic acid particles (Men-sah et al., 2009).
Our data for the vapor pressures of the solid acids ap-proach the values of the saturated solutions slowly with in-creasing time after efflorescence as required by equilibriumthermodynamics. The data of the supercooled melt show noeven-odd alternation in vapor pressures, but the vapor pres-sures of the supercooled melts of the C3 to C5 dicarboxylicacids are the same within a factor of 4 and of a magnitude of3×10−4 Pa to 1×10⁻³ Pa at 296 K. The even-odd alternationis clearly evident in the vapor pressures of the solid C3 toC5 dicarboxylic acids, with the odd acids exhibiting highervapor pressures. This is reflected in the melting tempera-tures of the acids (see Table 1), with the odd acids showinglower melting temperatures than the even ones. The fact thatthe acids show an alternation in vapor pressure as crystallinesolids but not as supercooled melts is related to the solubili-
ties of the acids, with the even acids being less soluble thantheir odd counterparts.
5 Conclusions
Considering the atmospheric implications of these findings,we conclude that gas/particle partitioning of the C3 to C5 di-carboxylic acids to a liquid, organic aerosol phase will notbe very different as the vapor pressures of the supercooledmelts are similar. In contrast, if the partitioning occurred be-tween the gas phase and solid dicarboxylic acids, the evenacids would more strongly favor the condensed phase, astheir solid state vapor pressures are typically lower. Theseaerosol composition and phase state related differences inpartitioning behavior become particularly important for acidswith low water-solubility, such as succinic acid.
Another general conclusion concerns the scatter of vaporpressure data in the literature when measuring dicarboxylicacids in their solid state. Above we have shown that the va-por pressure of an effloresced glutaric or succinic acid parti-cle decreases over time scales of days for slowly evaporatingmicrometer size particles. Our explanation for this behavioris that the particle only slowly transforms during evapora-tion to its thermodynamically stable crystalline structure ordepending on the water content of the efflorescing particle,solvent inclusions increase evaporation rate. This observa-tion supports our view that the difference between differentmeasurements reported in the literature are at least partly dueto the lack of control of the physical state of the samples un-der investigation. We have shown for succinic and glutaricacid, that depending on the particle history of the sample, va-por pressures deviating by more than one order of magnitudecan be obtained. If from such data vapor pressures of the su-percooled melt are derived, the error will be propagated. Va-por pressures of solids determined from vapor pressure dataof the aqueous solution at saturation conditions seems to bemore robust, see Fig.13. This emphasizes the special im-portance of performing vapor pressure measurements in theaqueous state.
Appendix A
Correct expressions for Eq. (5a–d) ofClegg and Seinfeld(2006)
McGlashan(1963) discusses an empirical thermodynamicparameterization that is consistent with the Duhem-Margulesrelation for the excess Gibbs energy of two-component sys-tems.Clegg and Seinfeld(2006a) used this parameterizationfor dicarboxylic acid–water systems and report estimated co-efficients,ci , in Table 4 ofClegg and Seinfeld(2006a). How-ever, there is an error in the Eq. (5a and b) given inCleggand Seinfeld(2006a), while the coefficients reported in theirTable 4 were estimated with the correct expressions. The
Atmos. Chem. Phys., 10, 11753–11767, 2010 www.atmos-chem-phys.net/10/11753/2010/
V. Soonsin et al.: Vapor pressures and activities of dicarboxylic acids 11765
Table 4. Fitted parameters ofClegg and Seinfeld(2006a) for use with the empirical parameterization given in Appendix A1.
acid ci i ci i ci i ci i
malonic −0.149445 (1) −0.403222 (2) −0.571432 (3) 0.628461 (6)succinic 0.291972 (2) 0.452397 (8)glutaric −0.209091 (1) 0.353220 (2) 0.755191 (7)
correct expressions for water and solute activities in binaryaqueous solutions of the dicarboxylic acids are (McGlashan,1963):
ge
RT= xs(1−xs)
[c1+
m∑i=2
ci(1−2xs)i−1
](A1)
d(ge
RT)
dxs= (1−2xs)
[c1+
m∑i=2
ci(1−2xs)i−1
]
+xs(1−xs)
[−2c2−
m∑i=3
2(i −1)ci(1−2xs)i−2
] (A2)
ln(fs) =ge
RT+(1−xs)
d(ge
RT)
dxs
(A3)
ln(fw) =ge
RT−xs
d(ge
RT)
dxs
(A4)
wherege is the excess Gibbs energy of the solution per moleof total material,xs is the mole fraction of the acid solute(on an undissociated basis),ci(i = 1,2,...,m) are the fittedparameters shown in Table 4,fs is the mole fraction basedactivity coefficient of the solute (acid) andfw is the activitycoefficient of the solvent (water).
Acknowledgements.This work was supported by ETH ResearchGrant ETH-2406-3, EUROCHAMP 2, and Swiss National Sci-ence Foundation under contract No. PA00P2-126227. We wouldlike to acknowledge fruitful discussion with Th. Peter and M. Bilde.
Edited by: M. Ammann
References
IPCC 2007: Climate Change 2007: The Physical Science Basis, in:Contribution of Working Group I to the Fourth Assessment Re-port of the Intergovernmental Panel on Climate Change, editedby: Solomon, S., Qin, D., Manning, M., Chen, Z., Marquis, M.,Averyt, K. B., Tignor, M., and Miller, H. L., Cambridge Univer-sity Press, Cambridge, UK and New York, NY, USA, 2007.
Apelblat, A. and Manzurola, E.: Solubility of oxalic, malonic, suc-cinic, adipic, maleic, citric, and tartaric acids in water from278.15 to 338.15 K, J. Chem. Thermodyn., 19, 317–320, 1987.
Apelblat, A. and Manzurola, E.: Solubility of ascorbic, 2-furancarboxylic, glutaric, pimelic, salicylic, and o-phthalic acidsin water from 279.15 to 342.15 K, and apparent molar volumesof ascorbic, glutaric, and pimelic acids in water at 298.15 K, J.Chem. Thermodyn., 21, 1005–1008, 1989.
Barley, M. H. and McFiggans, G.: The critical assessment of vapourpressure estimation methods for use in modelling the formationof atmospheric organic aerosol, Atmos. Chem. Phys., 10, 749–767, doi:10.5194/acp-10-749-2010, 2010.
Ben-Hamo, M., Apelblat, A., and Manzurola, E.: Volumetric prop-erties of aqueous solutions of glutaric acid, J. Chem. Thermo-dyn., 39, 1071–1076, 2007.
Bilde, M. and Pandis, S.: Evaporation rates and vapor pressures ofindividual aerosol species formed in the atmospheric oxidation ofalpha- and beta-Pinene, Environ. Sci. Technol., 35, 3344–3349,2001.
Bilde, M., Svenningsson, B., Mønster, J., and Rosenørn, T.: Even-odd alternation of evaporation rates and vapor pressures of C3–C9 dicarboxylic acid aerosols, Environ. Sci. Technol., 37, 1371–1378, 2003.
Bird, R. B., Stewart, W. E., and Lightfoot, E. D.: Transport Phenom-ena, 2nd revised edn., John Wiley and Sons, New York, USA,2007.
Booth, A. M., Markus, T., McFiggans, G., Percival, C. J.,Mcgillen, M. R., and Topping, D. O.: Design and constructionof a simple Knudsen Effusion Mass Spectrometer (KEMS) sys-tem for vapour pressure measurements of low volatility organics,Atmos. Meas. Tech., 2, 355–361, doi:10.5194/amt-2-355-2009,2009.
Booth, A. M., Barley, M. H., Topping, D. O., McFiggans, G.,Garforth, A., and Percival, C. J.: Solid state and sub-cooledliquid vapour pressures of substituted dicarboxylic acids usingKnudsen Effusion Mass Spectrometry (KEMS) and Differen-tial Scanning Calorimetry, Atmos. Chem. Phys., 10, 4879–4892,doi:10.5194/acp-10-4879-2010, 2010.
Bradley, R. S. and Cotson, S.: The vapour pressure and lattice en-ergy of hydrogen-bonded crystals. Part IIα- and β-anhydrousoxalic acid and tetragonal pentaerythritol, J. Chem. Soc., June,1684–1688, 1953.
Braun, C. and Krieger, U. K.: Two-dimensional angular lightscat-tering in aqueous NaCl single aerosol particles during deliques-cence and efflorescence, Opt. Express, 8, 314–321, 2001.
Camus, S., Harris, K. D. M., and Johnston, R. L.: Ab initio calcula-tion of 2H quadrupole coupling constants in molecular crystals:application to polymorphs of oxalic acid dihydrate, Chem. Phys.Lett., 276, 186–195, 1997.
Cappa, C., Lovejoy, E., and Ravishankara, A.: Determination ofevaporation rates and vapor pressures of very low volatility com-pounds: a Study of the C4-C10 and C12 Dicarboxylic Acids, J.Phys. Chem. A, 111, 3099–3109, 2007.
www.atmos-chem-phys.net/10/11753/2010/ Atmos. Chem. Phys., 10, 11753–11767, 2010
11766 V. Soonsin et al.: Vapor pressures and activities of dicarboxylic acids
Cappa, C., Lovejoy, E., and Ravishankara, A.: Evidence for liquid-like and nonideal behavior of a mixture of organic aerosol com-ponents, PNAS, 105, 18687–18691, 2008.
Chang, E. I. and Pankow, J. F.: Prediction of activity coefficients inliquid aerosol particles containing organic compounds, dissolvedinorganic salts, and water – Part 2: Consideration of phase sep-aration effects by an X-UNIFAC model, Atmos. Environ., 40,6422–6436, doi:10.1016/j.atmosenv.2006.04.031, 2006.
Chang, E. I. and Pankow, J. F.: Organic particulate matter forma-tion at varying relative humidity using surrogate secondary andprimary organic compounds with activity corrections in the con-densed phase obtained using a method based on the Wilson equa-tion, Atmos. Chem. Phys., 10, 5475–5490, doi:10.5194/acp-10-5475-2010, 2010.
Chattopadhyay, S. and Ziemann, P.: Vapor pressures of substitutedand unsubstituted monocarboxylic and dicarboxylic acids mea-sured using an improved thermal desorption particle beam massspectrometry method, Aerosol Sci. Tech., 39, 1085–1100, 2005.
Clegg, S. L. and Seinfeld, J. H.: Thermodynamic models of aque-ous solutions containing inorganic electrolytes and dicarboxylicacids at 298.15 K – I. The acids as nondissociating components,J. Phys. Chem. A, 110, 5692–5717, 2006.
Clegg, S. L. and Seinfeld, J. H.: Thermodynamic models of aque-ous solutions containing inorganic electrolytes and dicarboxylicacids at 298.15 K – II. Systems including dissociation equilibria,J. Phys. Chem. A, 110, 5718–5734, 2006.
Clegg, S. L., Kleeman, M. J., Griffin, R. J., and Seinfeld, J. H.: Ef-fects of uncertainties in the thermodynamic properties of aerosolcomponents in an air quality model – Part 1: Treatment of in-organic electrolytes and organic compounds in the condensedphase, Atmos. Chem. Phys., 8, 1057–1085, doi:10.5194/acp-8-1057-2008, 2008.
Colberg, C. A., Krieger, U. K., and Peter, T.: Morphological inves-tigations of single levitated H2SO4/NH3/H2O aerosol particlesduring deliquescence/efflorescence experiments, J. Phys. Chem.A, 108, 2700–2709, 2004.
Davies, M. and Thomas, G. H.: The lattice energies, infra-red spec-tra, and possible cyclization of some dicarboxylic acids, T. Fara-day Soc., 56, 185–192, 1960.
Decesari, S., Fuzzi, S., Facchini, M. C., Mircea, M., Emblico, L.,Cavalli, F., Maenhaut, W., Chi, X., Schkolnik, G., Falkovich, A.,Rudich, Y., Claeys, M., Pashynska, V., Vas, G., Kourtchev, I.,Vermeylen, R., Hoffer, A., Andreae, M. O., Tagliavini, E.,Moretti, F., and Artaxo, P.: Characterization of the organic com-position of aerosols from Rondnia, Brazil, during the LBA-SMOCC 2002 experiment and its representation through modelcompounds, Atmos. Chem. Phys., 6, 375–402, doi:10.5194/acp-6-375-2006, 2006.
de Kruif, C. G., van Ginkel, C. H. D., and Voogd, J.: Torsion-effusion vapour measurements of organic compounds, in: Qua-trieme Conference Internationale de Thermodynamique Chim-ique/sous les auspices de l’Union Internationale de Chimie Pureet Appliquee; comite scientifique: M. Laffitte, pres., Montpellier,France, 1975.
de Villepin, J., Novak, A., and Bougeard, D.: Alpha- and beta-phases of oxalic acid, H2C2O4: vibrational spectra, normal-coordinate calculations, and intermolecular forces, Chem. Phys.,73, 291–312, 1982.
de Wit, H. G. M., Bouwstra, J. A., Blok, J. G., and de Kruif, C. G.:
Vapor pressures and lattice energies of oxalic acid, mesotarticacid, phloroglucinol, myoinositol, and thier hydrates, J. Chem.Phys., 78, 1470–1475, 1983.
Goldstein, A. H. and Galbally, I. E.: Known and unexplored organicconstituents in the Earth’s atmosphere, Environ. Sci. Technol.,41, 1514–1521, 2007.
Gaman, A. I., Kulmala, M., Vehkamaki, H., Napari, I., Mircea, M.,Facchini, M. C., and Laaksonen, A.: Binary homogeneous nu-cleation in water–succinic acid and water–glutaric acid systems,J. Chem. Phys., 120, 282–291, 2004.
Hallquist, M., Wenger, J. C., Baltensperger, U., Rudich, Y., Simp-son, D., Claeys, M., Dommen, J., Donahue, N. M., George, C.,Goldstein, A. H., Hamilton, J. F., Herrmann, H., Hoffmann, T.,Iinuma, Y., Jang, M., Jenkin, M. E., Jimenez, J. L., Kiendler-Scharr, A., Maenhaut, W., McFiggans, G., Mentel, Th. F.,Monod, A., Prevot, A. S. H., Seinfeld, J. H., Surratt, J. D.,Szmigielski, R., and Wildt, J.: The formation, properties andimpact of secondary organic aerosol: current and emerging is-sues, Atmos. Chem. Phys., 9, 5155–5236, doi:10.5194/acp-9-5155-2009, 2009.
Hansen, A. R. and Beyer, K. D.: Experimentally determined ther-mochemical properties of the malonic acid/water system: impli-cations for atmospheric aerosols, J. Phys. Chem. A, 108, 3457–3466, 2004.
Koponen, I. K., Riipinen, I., Hienola, A., Kulmala, M., andBilde, M.: Thermodynamic properties of malonic, succinic, andglutaric acids: evaporation rates and saturation vapor pressures,Environ. Sci. Technol., 41, 3926–3933, 2007.
Kundu, S., Kawamura, K., Andreae, T. W., Hoffer, A., and An-dreae, M. O.: Molecular distributions of dicarboxylic acids,ketocarboxylic acids andα-dicarbonyls in biomass burningaerosols: implications for photochemical production and degra-dation in smoke layers, Atmos. Chem. Phys., 10, 2209–2225,doi:10.5194/acp-10-2209-2010, 2010.
Legrand, M., Preunkert, S., Oliveira, T., Pio, C. A., Hammer, S.,Gelencer, A., Kasper-Giebl, A., and Laj, P.: Origin of C2–C5 di-carboxylic acids in the European atmosphere inferred from year-round aerosol study conducted at a west-east transect, J. Geo-phys. Res., 112, D23S07, doi:10.1029/2006JD008019, 2007.
Marcolli, C., Luo, B. P., and Peter, T.: Mixing of the organic aerosolfractions: liquids as the thermodynamically stable phases, J.Phys. Chem. A, 108, 2216–2224, 2004.
McGlashan, M. L.: Deviations from Raoult’s law, J. Chem. Educ.,40, 516–518, 1963.
Mensah, A. A., Buchholz, A., Kiendler-Scarr, A., and Mentel, T. F.:Chemical and physical properties of oxalic acid and oxalateaerosol particles, European Aerosol Conference 2009, Karlsruhe,Abstract T043A14, 2009.
Mikhailov, E., Vlasenko, S., Martin, S. T., Koop, T., and Poschl, U.:Amorphous and crystalline aerosol particles interacting with wa-ter vapor: conceptual framework and experimental evidencefor restructuring, phase transitions and kinetic limitations, At-mos. Chem. Phys., 9, 9491–9522, doi:10.5194/acp-9-9491-2009,2009.
Ming, Y. and Russell, L. M.: Thermodynamic equilibrium oforganic-electrolyte mixtures in aerosol particles, AIChE J., 48,1331–1348, 2002.
Noyes, W. A. and Wobbe, D. E.: The vapor pressure of anhydrousoxalic acid, J. Am. Chem. Soc., 48, 1882–1887, 1926.
Atmos. Chem. Phys., 10, 11753–11767, 2010 www.atmos-chem-phys.net/10/11753/2010/
V. Soonsin et al.: Vapor pressures and activities of dicarboxylic acids 11767
Pankow, J. F.: An absorption-model of gas-particle partitioningof organic-compounds in the atmosphere, Atmos. Environ., 28,185–188, 1994.
Peng, C., Chan, M. N., and Chan, C. K.: The hygroscopic prop-erties of dicarboxylic and multifunctional acids: measurementsand UNIFAC predictions, Environ. Sci. Technol. 35, 4495–4501,2001.
Pope, F. D., Tong, H.-J., Dennis-Smither, B. J., Griffiths, P. T.,Clegg, S. L., Reid, J. P., and Cox, R. A.: Studies of SingleAerosol Particles Containing Malonic Acid, Glutaric Acid, andTheir Mixtures with Sodium Chloride. II. Liquid-State VaporPressures of the Acids, J. Phys. Chem. A, 114, 10156–10165,2010.
Prenni, A. J., DeMott, P. J., Kreidenweis, S., Sherman, D. E, Rus-sell, L. M., and Ming, Y..: The effects of low molecular weightdicarboxylic acids on cloud formation, J. Phys. Chem. A, 105,11240–11248, 2001.
Ribeiro da Silva, M. R. D., Monte, M., and Ribeiro, J.: Vapourpressures and the enthalpies and entropies of sublimation of fivedicarboxylic acids, J. Chem. Thermodyn., 31, 1093–1107, 1999.
Ribeiro da Silva, M. R. D., Monte, M., and Ribeiro, J.: Thermody-namic study on the sublimation of succinic acid and of methyl-and dimethylsubstituted succinic and glutaric acids, J. Chem.Thermodyn., 33, 23–31, 2001.
Riipinen, I., Svenningsson, B., Bilde, M., Gamana, A., Lehti-nenc, K. E. J., and Kulmalaa, M.: A method for determiningthermophysical properties of organic material in aqueous solu-tions: succinic acid, Atmos. Res., 82, 579–590, 2006.
Riipinen, I., Koponen, I. K., Frank, G. P., Hyvarinen, A.-P., Van-hanen, J., Lihavainen, H., Lehtinen, K. E. J., Bilde, M., and Kul-mala, M.: Adipic and malonic acid aqueous solutions: surfacetensions and saturation vapor pressures, J. Phys. Chem. A, 11,12995–13002, 2007.
Roux, M. V., Temprado, M., and Chickos, J. S.: Vaporization, fu-sion and sublimation enthalpies of the dicarboxylic acids fromC4 to C14 and C16, J. Chem. Thermodyn., 37, 941–953, 2005.
Rozaini, M. Z. H. and Brimblecombe, P.: The odd-even behaviourof dicarboxylic acids solubility in the atmospheric aerosols, Wa-ter Air Soil Poll., 198, 65–75, 2009.
Salo, K., Jonsson,A. M., Andersson, P. U., and Hallquist, M.:Aerosol volatility and enthalpy of sublimation of carboxylicacids, J. Phys. Chem. A, 114, 4586–4594, 2010.
Tanaka, H.: The kinetic study of thermal dehydration of oxalic aciddihydrate, J. Therm. Analysis, 29, 1115–1122, 1984.
Tao, Y. and McMurry, P.: Vapor pressures and surface free energiesof C14-C18 monocarboxylic acids and C5 and C6 dicarboxylicacids, Environ. Sci. Technol., 23, 1519, 1989.
Thalladi, V. R., Nusse, M., and Boese, R.: The melting point alter-nation inα,ω-alkanedicarboxylic acids, J. Am. Chem. Soc., 122,9227–9236, 2000.
Wang, H., Kawamura, K., and Yamazaki, K.: Water soluble di-carboxylic acids, ketoacids and dicarbonyls in the atmosphericaerosols over the Southern Ocean and Western Pacific Ocean, J.Atmos. Chem., 53, 43–61, 2006.
Zardini, A. A., Krieger, U. K., and Marcolli, C.: White light Mieresonance spectroscopy used to measure very low vapor pres-sures of substances in aqueous solution aerosol particles, Opt.Express, 14, 6951–6962, 2006.
Zardini, A. A., Sjogren, S., Marcolli, C., Krieger, U. K., Gy-sel, M., Weingartner, E., Baltensperger, U., and Peter, T.: A com-bined particle trap/HTDMA hygroscopicity study of mixed inor-ganic/organic aerosol particles, Atmos. Chem. Phys., 8, 5589–5601, doi:10.5194/acp-8-5589-2008, 2008.
Zardini, A. A. and Krieger U. K.: Evaporation kinetics of a non-spherical, levitated aerosol particle using optical resonance spec-troscopy for precision sizing, Opt. Express, 17, 4659–4669,2009.
Zardini, A. A. and Krieger U. K.: Evaporation kinetics of a non-spherical, levitated aerosol particle using optical resonance spec-troscopy for precision sizing: Errata, Opt. Express, 18, 10760–10761, 2010.
Zhang, Q., Jimenez, J. L., Canagaratna, M. R., Allan, J. D.,Coe, H., Ulbrich, I., Alfarra, M. R., Takami, A., Middle-brook, A. M., Sun, Y. L., Dzepina, K., Dunlea, E., Docherty, K.,De-Carlo, P. F., Salcedo, D., Onasch, T., Jayne, J. T., Miyoshi, T.,Shimono, A., Hatakeyama, S., Takegawa, N., Kondo, Y., Schnei-der, J., Drewnick, F., Borrmann, S., Weimer, S., Demer-jian, K., Williams, P., Bower, K., Bahreini, R., Cottrell, L.,Griffin, R. J., Rautiainen, J., Sun, J. Y., Zhang, Y. M., andWorsnop, D. R.: Ubiquity and dominance of oxygenated speciesin organic aerosols in anthropogenically-influenced NorthernHemisphere midlatitudes, Geophys. Res. Lett., 34, L13801,doi:10.1029/2007GL029979, 2007.
Zuend, A., Marcolli, C., Luo, B. P., and Peter, T.: A thermodynamicmodel of mixed organic-inorganic aerosols to predict activity co-efficients, Atmos. Chem. Phys., 8, 4559–4593, doi:10.5194/acp-8-4559-2008, 2008.
Zuend, A., Marcolli, C., Peter, T., and Seinfeld, J. H.: Computa-tion of liquid-liquid equilibria and phase stabilities: implicationsfor RH-dependent gas/particle partitioning of organic-inorganicaerosols, Atmos. Chem. Phys., 10, 7795–7820, doi:10.5194/acp-10-7795-2010, 2010.
www.atmos-chem-phys.net/10/11753/2010/ Atmos. Chem. Phys., 10, 11753–11767, 2010