Embed Size (px)
Citation preview

The Value of Natural Capital in Settled Areas of Canada

f o r e w o r dNatural areas within the settled regions of Canada provide numerous goods and services that have economic
values, not only for the people within or adjacent to these natural areas but also for the communities farther away.
Serving as sources of natural capital, these areas provide such goods and services as clean water supply, water flow
stabilization, greenhouse gas mitigation, erosion control, nutrient cycling, genetic resources, biodiversity, pest
management, habitat, recreation and cultural pursuits. Yet, these natural areas continue to be lost across Canada.
Undoubtedly, this occurs in part because the goods and services provided by natural areas are not precisely known,
despite the fact that recent studies outside of Canada suggest that the economic value of these natural areas to
society far outweighs any gains from converting them for human uses such as urban development or intensive
agriculture.
We believe that efforts to measure, protect, and enhance the natural capital of Canada must accelerate immediately.
Therefore, we must: (1) invest in the science to measure, value, and monitor ecological goods and services, and
(2) develop economic instruments that recognize and protect natural capital, rather than continue to reward its
destruction.
For many Canadians, a primary motivator for habitat conservation is the desire to leave for our children the natural
wealth that we inherited from our parents. Therefore, it seems logical that we equate Canada’s natural areas with
their true economic value and take the necessary actions to safeguard this capital for the future. Will we maintain
and build our natural capital for future generations? Or, will we continue to add to the growing debt? We sincerely
hope that this paper will inspire recognition and protection of Canada’s natural capital.
We believe that the estimates in this paper provide a conservative illustration of the economic values of natural
capital from four geographically diverse locations in Canada. Moreover, the case studies reveal that governments,
and society in general, may be making inefficient choices when they allocate land to uses that destroy natural capital.
Ducks Unlimited Canada, with the support of the Nature Conservancy of Canada, commissioned Dr. Nancy
Olewiler to develop this paper. We are extremely grateful that Dr. Olewiler, an internationally-recognized environ-
mental economist, developed this paper pro bono for us.
Brian T. Gray John Lounds
Director of Conservation Programs President
Ducks Unlimited Canada Nature Conservancy Canada
cove
r,be
low
:Dar
inLa
ngho
rst
The Value of Natural Capital in Settled Areas of Canada*
Nancy Olewiler1
Department of Economics & Public Policy ProgramSimon Fraser University, British Columbia
* Please cite this paper as follows: Olewiler, N. (2004). The Value of Natural Capital in Settled Areas of Canada.
Published by Ducks Unlimited Canada and the Nature Conservancy of Canada. 36 pp.

t a b l e o f c o n t e n t s
i Executive Summary i
ii Introduction and Overview 1
iii Case Studies: Illustrating the Value of Natural Capital 9
Lower Fraser Valley 9
Agricultural Case Studies 17
Grand River Watershed 17
Upper Assiniboine River Basin 20
Mill River Watershed 22
iv Conclusions 25
v Appendix: Methodology for Computation of Benefits and Costs of Conserving 26Natural Capital for the Agricultural Case Studies
vi Endnotes 32
left
:Ian
McC
ausl
and

e x e c u t i v e s u m m a r yThis paper illustrates the services provided by, and the importance of valuing, natural capital in the settled areas
of Canada. Natural capital consists of natural resources, environmental and ecosystem resources, and land. It is
capital in the sense that these resources are assets that yield goods and services over time – goods and services that
are essential to the sustained health of our environment and the economy. Protection and enhancement of natural
capital will improve water quality and decrease water treatment costs, increase recreational opportunities, mitigate
flooding, decrease net greenhouse gas emissions, lower dredging costs of waterways, improve air quality, provide
habitat, sustain food production and produce many more tangible and intangible benefits to society.
Destruction and degradation of natural capital occurs continually across Canada. Yet, we may not recognize the
full value of these losses until it is too late. Case studies in this paper illustrate that governments may be making
inefficient choices in allocating land to uses that destroy or degrade natural capital. For example, protecting the
existing natural capital in the Lower Fraser Valley may save society hundreds of millions, if not billions of dollars
every year. Yet, natural capital continues to be destroyed in this area. The agriculture lands case studies revealed that
the estimated net value of conserving or restoring natural areas is about $195/ha/yr in the Grand River Watershed
of Ontario, about $65/ha/yr in the Upper Assiniboine River Basin in eastern Saskatchewan and western Manitoba,
and about $126/ha/yr in the Mill River Watershed in P.E.I. These case studies reinforce that ignoring the value
of natural capital when making decisions about land use will likely result in the degradation and destruction of
natural capital and lead to outcomes that are very costly to society both now and into the future.
This paper does not propose specific policies or programs for the protection of natural capital; rather, it identifies
that governments have the following important roles to play:
• Provide essential data on the physical quantities and attributes of natural capital and their changes over time.
Efficient management of our natural capital resources requires knowing how much we have. No company would
stay in business long if its management did not know how much product was being produced, how much it
cost to produce it, or the market price for the product. Why should we treat our natural capital – capital that
sustains life on the planet – any differently?
• Assist in better decision making by coordinating and funding efforts to measure and value natural capital. Many
agencies, public and private, are engaged in measurement and valuation processes. A national clearinghouse
for information would greatly assist these efforts.
• On Crown lands, governments should ensure that estimates of the value of the many benefits from natural
capital attributes are compared to market values of the land before releasing that land for housing, commercial
or industrial uses.
• When land is privately held, governments have a role to play in designing policies that provide incentives for
landowners to conserve their land when the value of the natural capital from that land equals or exceeds its
value in other uses.
The federal government should take a strong leadership role by creating a national task force to: (1) fund and co-
ordinate the comprehensive measurement of baseline data on the state of Canada’s natural capital, to estimate its
loss over the past decades and to ensure sustained measurement into the future; (2) ensure traditional economic
analyses and forecasting approaches are revised to properly account for the services provided by natural capital
and integrate the true cost of its degradation with economic decision making.; and (3) to coordinate efforts to
conserve and restore natural capital.
i
i
No company would
stay in business long
if its management
did not know how
much product was
being produced,
how much it cost
to produce it, or the
market price for the
product.Why should
we treat our natural
capital – capital that
sustains life on the
planet – any
differently?
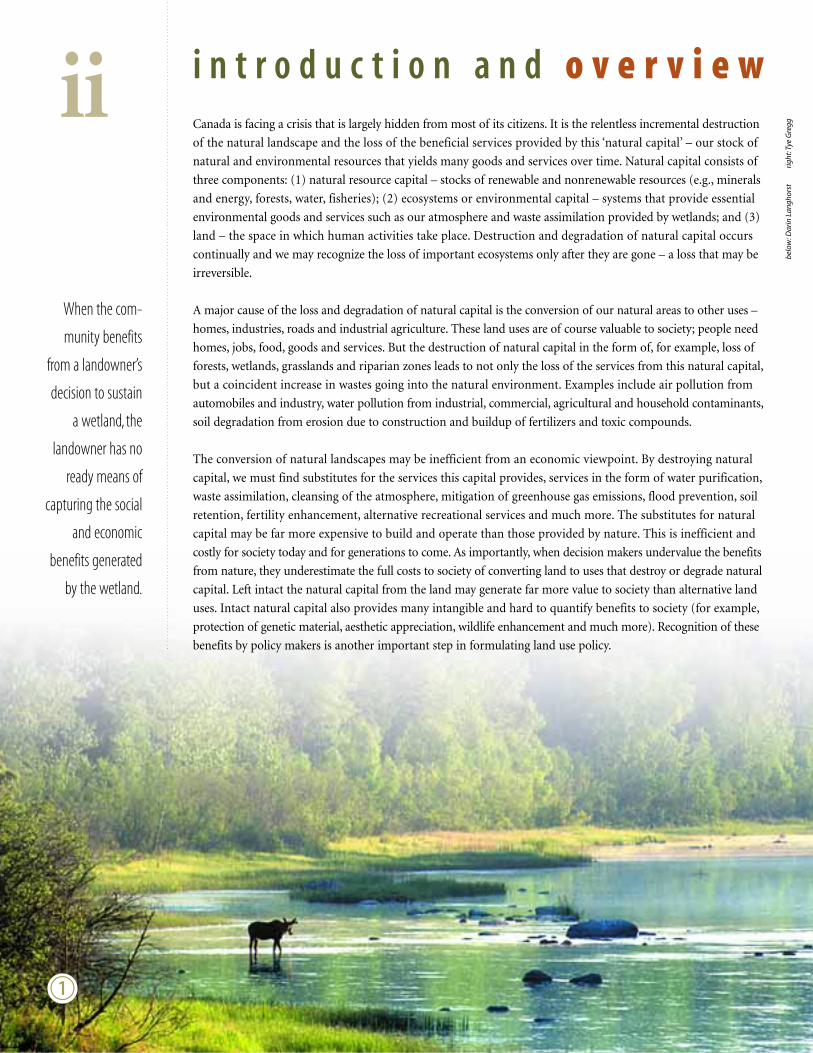
i n t r o d u c t i o n a n d o v e r v i e wCanada is facing a crisis that is largely hidden from most of its citizens. It is the relentless incremental destruction
of the natural landscape and the loss of the beneficial services provided by this ‘natural capital’ – our stock of
natural and environmental resources that yields many goods and services over time. Natural capital consists of
three components: (1) natural resource capital – stocks of renewable and nonrenewable resources (e.g., minerals
and energy, forests, water, fisheries); (2) ecosystems or environmental capital – systems that provide essential
environmental goods and services such as our atmosphere and waste assimilation provided by wetlands; and (3)
land – the space in which human activities take place. Destruction and degradation of natural capital occurs
continually and we may recognize the loss of important ecosystems only after they are gone – a loss that may be
irreversible.
A major cause of the loss and degradation of natural capital is the conversion of our natural areas to other uses –
homes, industries, roads and industrial agriculture. These land uses are of course valuable to society; people need
homes, jobs, food, goods and services. But the destruction of natural capital in the form of, for example, loss of
forests, wetlands, grasslands and riparian zones leads to not only the loss of the services from this natural capital,
but a coincident increase in wastes going into the natural environment. Examples include air pollution from
automobiles and industry, water pollution from industrial, commercial, agricultural and household contaminants,
soil degradation from erosion due to construction and buildup of fertilizers and toxic compounds.
The conversion of natural landscapes may be inefficient from an economic viewpoint. By destroying natural
capital, we must find substitutes for the services this capital provides, services in the form of water purification,
waste assimilation, cleansing of the atmosphere, mitigation of greenhouse gas emissions, flood prevention, soil
retention, fertility enhancement, alternative recreational services and much more. The substitutes for natural
capital may be far more expensive to build and operate than those provided by nature. This is inefficient and
costly for society today and for generations to come. As importantly, when decision makers undervalue the benefits
from nature, they underestimate the full costs to society of converting land to uses that destroy or degrade natural
capital. Left intact the natural capital from the land may generate far more value to society than alternative land
uses. Intact natural capital also provides many intangible and hard to quantify benefits to society (for example,
protection of genetic material, aesthetic appreciation, wildlife enhancement and much more). Recognition of these
benefits by policy makers is another important step in formulating land use policy.
ii
b
When the com-
munity benefits
from a landowner’s
decision to sustain
a wetland, the
landowner has no
ready means of
capturing the social
and economic
benefits generated
by the wetland.
belo
w:D
arin
Lang
hors
t
r
ight
:Tye
Gre
gg

c
Why does inefficient land use occur? A major difficulty is that private decision makers typically take into account
only the market values and personal benefits accruing from the natural capital assets they own and manage. When
the community benefits from a landowner’s decision to sustain a wetland, the landowner has no ready means of
capturing the social and economic benefits generated by the wetland. Hence, the landowner will find it difficult to
preserve the wetland, rather than, for example, drain it to use for agriculture or sell to a developer for home con-
struction. We have laws and regulations that apply to private lands (e.g., land use restrictions through zoning, pro-
hibition of building too close to streams and rivers), but regulation to protect the natural capital on private lands is
far from comprehensive. Landowners would expect compensation for conserving or enhancing the natural capital
on their property when it benefits society and when prior restrictions on land use do not exist. Compensation
should cover the opportunity costs of the land – the foregone profits from their next best viable and legal use. Public
decision makers face similar dilemmas when assessing development plans for their regions. If they do not recognize
the value of the benefits from the goods and services generated by natural capital, they will be more inclined to
favour land uses that do generate revenues (for example, property tax revenues and development fees).2
This paper explains the importance of valuing nature. The services provided by Canada’s natural capital are
described. Case studies illustrate that we may be making inefficient choices in allocating land to uses that destroy
and degrade natural capital. Society may therefore have to look for more expensive substitutes or to forego these
services at a loss to our well-being today and into the future.
Natural Capital: What it is and what it does
The stock of natural resources, environmental and ecosystem resources and land have been called natural capital –
capital in the sense that these resources are assets that yield goods and services over time (goods and services that
are essential to the sustained health and survival of our population and economy). Along with human capital and
produced or manufactured capital (e.g., machinery, structures), natural capital is an input into the production of
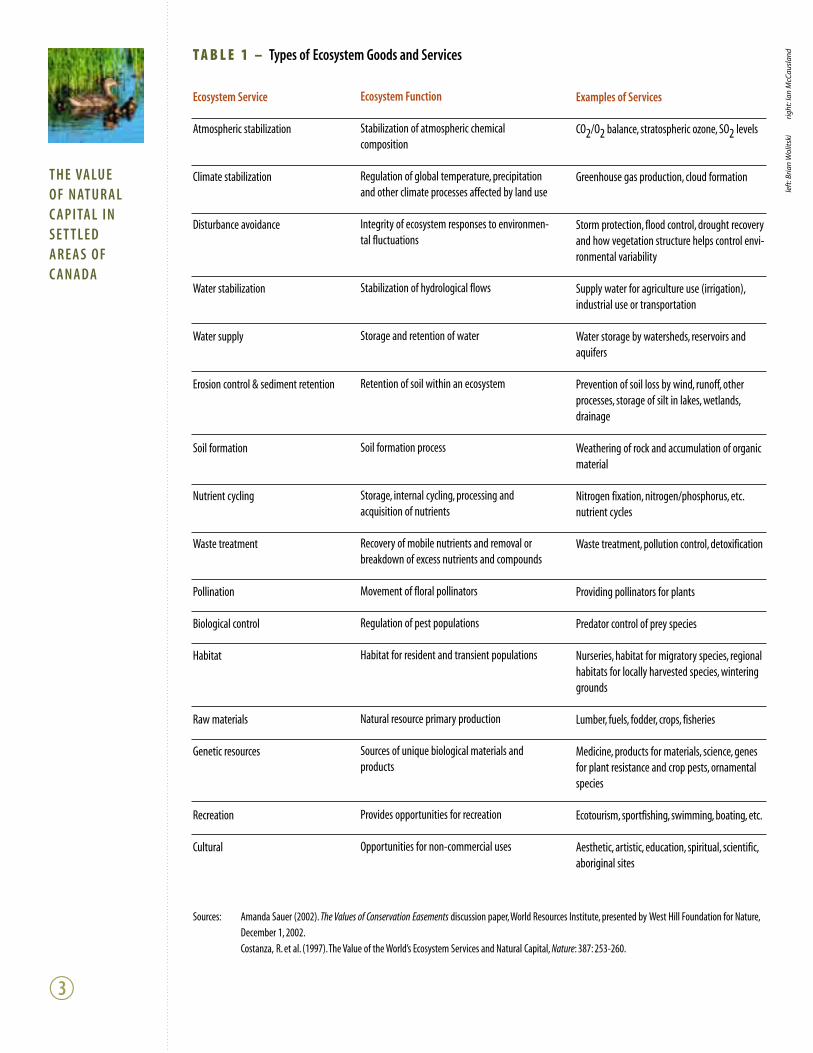
goods and services in addition to being enjoyed for its own sake. Table 1 provides a detailed list of the many goods
What can help reverse the loss of natural capital?
• Government decision makers and the public need to recognize that nature provides valuable services that should be factored into land
use decisions to help society make better choices about economic growth.Where lands are public, governments need to adopt land
use policies that explicitly take into account the value of nature to society rather than ignore its services and make decisions that may
be very costly to society now and into the future.
• Governments need to develop and implement policies that provide incentives for private landowners to make decisions commensurate
with valuing not only their own private returns, but also social returns to their land.
• We need to increase our efforts to measure and quantify the services of nature to assist government and individuals to make more
efficient land use decisions. A number of federal and provincial government agencies, non-governmental organizations, and individuals
are trying to value nature, but their activities are uncoordinated, and no one agency has the budget to undertake this task. A national
task force to fund and coordinate these activities could help supply the data and analysis badly needed now by decision makers.
d
T H E VA LU E O F N AT U R A LC A P I TA L I NS E T T L E D A R E A S O FC A N A D A
Ecosystem Function
Stabilization of atmospheric chemical composition
Regulation of global temperature, precipitationand other climate processes affected by land use
Integrity of ecosystem responses to environmen-tal fluctuations
Stabilization of hydrological flows
Storage and retention of water
Retention of soil within an ecosystem
Soil formation process
Storage, internal cycling, processing and acquisition of nutrients
Recovery of mobile nutrients and removal orbreakdown of excess nutrients and compounds
Movement of floral pollinators
Regulation of pest populations
Habitat for resident and transient populations
Natural resource primary production
Sources of unique biological materials and products
Provides opportunities for recreation
Opportunities for non-commercial uses
Examples of Services
CO2/O2 balance, stratospheric ozone, SO2 levels
Greenhouse gas production, cloud formation
Storm protection, flood control, drought recoveryand how vegetation structure helps control envi-ronmental variability
Supply water for agriculture use (irrigation),industrial use or transportation
Water storage by watersheds, reservoirs andaquifers
Prevention of soil loss by wind, runoff, otherprocesses, storage of silt in lakes, wetlands,drainage
Weathering of rock and accumulation of organicmaterial
Nitrogen fixation, nitrogen/phosphorus, etc.nutrient cycles
Waste treatment, pollution control, detoxification
Providing pollinators for plants
Predator control of prey species
Nurseries, habitat for migratory species, regionalhabitats for locally harvested species, winteringgrounds
Lumber, fuels, fodder, crops, fisheries
Medicine, products for materials, science, genesfor plant resistance and crop pests, ornamentalspecies
Ecotourism, sportfishing, swimming, boating, etc.
Aesthetic, artistic, education, spiritual, scientific,aboriginal sites
T A B L E 1 – Types of Ecosystem Goods and Services
Ecosystem Service
Atmospheric stabilization
Climate stabilization
Disturbance avoidance
Water stabilization
Water supply
Erosion control & sediment retention
Soil formation
Nutrient cycling
Waste treatment
Pollination
Biological control
Habitat
Raw materials
Genetic resources
Recreation
Cultural
Sources: Amanda Sauer (2002). The Values of Conservation Easements discussion paper,World Resources Institute, presented by West Hill Foundation for Nature,December 1, 2002.Costanza, R. et al. (1997).The Value of the World’s Ecosystem Services and Natural Capital, Nature: 387: 253-260.
left
:Bri
anW
olits
ki
righ
t:Ia
nM
cCau
slan
d

e
and services provided by natural capital. Table 2 illustrates examples of the types of goods and services provided
by different types of natural capital.
We do not fully understand all the complex relationships in ecosystems and the precise roles natural capital plays
in sustaining life. If science and technology could replicate all of the goods and services provided by these forms
of natural capital, society might be more sanguine about the loss of natural capital. We would then substitute other
forms of physical and human capital for the natural capital we have used up.3 For example, when natural waste
treatment provided by wetlands, grasslands and forests has been eliminated by their conversion into urban areas,
communities can construct water and waste treatment facilities. But is substitution of other forms of capital for
natural capital in society’s interest? The concern is twofold. First, before substituting produced capital for natural
capital, decision makers should ensure that the manufactured substitute replicates all the essential functions of
natural capital and costs no more than the natural capital. It is possible that the substitute for natural capital is far
more expensive than sustaining the natural capital services. New York City decided that it was far cheaper to pay
$1.8 billion to private landowners to protect 80,000 acres in the watersheds providing its drinking water than to
spend $8 billion to construct a new water filtration plant. The city not only saved the capital costs of the filtration
plant, but also an additional $300 million per year in operating costs.4 Second, there are many goods and services
only natural capital can provide – there are no substitutes.5 Some forms of natural capital are clearly essential –
water and our atmosphere for example. If the protective stratospheric ozone layer is lost, the amount of ultraviolet
radiation reaching the earth’s surface would exterminate most plant and animal life. We do not know how to
recreate our atmosphere or sequester large amounts of carbon dioxide without the use of natural capital.
Like other forms of capital, natural capital can be depreciated. Depreciation of natural capital arises from its
depletion or degradation. Examples of depletion include harvesting the resource (e.g., timber harvests, mineral
extraction) or conversion of natural ecosystems to other uses (e.g., draining wetlands, paving over grasslands).
T A B L E 2 – Examples of Ecosystem Services by Ecosystem Type
Ecosystem Goods and Services Provided
Forests Carbon storage and sequestration, soil formation, waste treatment, biological control, cultural,air quality, stormwater control, recreation, raw material (timber), genetic resources
Grasslands, rangelands Carbon storage and sequstration, water regulation, erosion control, soil formation, waste treatment,pollination, biological control, food production
Wetlands Disturbance regulation, water supply and treatment, food production, recreation, cultural,habitat/refuge, total ecosystem
Lakes, rivers, riparian zones Water supply, waste treatment, food production, recreation, total ecosystem
Croplands Food production, habitat/refuge, scenic
Undeveloped lands Scenic
Adapted from Amanda Sauer (2002), The Values of Conservation Easements discussion paper,World Resources Institute, presented byWest Hill Foundation for Nature, December 1, 2002.
When natural waste
treatment provided
by wetlands, grass-
lands and forests has
been eliminated by
their conversion
into urban areas,
communities can
construct water
and waste treat-
ment facilities.
But is substitution
of other forms of
capital for natural
capital in society’s
interest?

Degradation represents the declining quality of the natural capital. An example is the depletion of soil fertility
through contamination by pollutants or loss of nutrients. Destruction of natural capital adds costs to society. As
noted above, communities either lose directly by having to find substitutes for the goods and services provided by
the natural capital, or do without, causing loss in well-being, and in many cases, financial loss. As natural capital
is degraded and depleted, the economy’s ability to produce goods and services is hampered. Natural capital is
thus becoming a limiting factor in sustaining production over time.
Measurement of Canada’s natural capital has in recent years focused on stocks of land, energy, mineral and timber
reserves. While this is a good start to understanding how much natural capital we have, serious measurement defi-
ciencies exist. Firstly, we have very little data that show the changes in our natural capital over time; and we haven’t
even identified and measured all the components of natural capital. Secondly, many components of natural capital,
particularly the services embodied in natural and environmental resources, are not routinely calculated. This is a
difficult task, but made more so by the lack of funding. For example, while we have the technology to measure land
use changes over time through satellite imagery, governments in Canada have failed to provide the funding for
detailed analysis of the data. This means that we do not know how much natural capital we are losing each year.
Governments and society in general cannot make wise decisions about how to sustain production and consump-
tion over time when one of our essential inputs is not being measured. However, even for the forms of natural
capital that are more readily measurable (e.g., stocks of minerals, fish, and forests), there is still very little measure-
ment of the effects that losing this natural capital will have on the economy and our environment.6
Wetland ecosystems help illustrate the type of goods and services natural capital provides. The list of goods and
services shown in Table 2 includes water supply and treatment, food production, cultural benefits, habitat, distur-
bance regulation and total ecosystem values.
• Wetlands are essential components of watersheds and are critical for ecosystem maintenance. For example,
small headwater wetlands and stream systems are the source of our freshwater. Therefore, changes that degrade
these freshwater systems affect the health and productivity of streams, lakes and rivers downstream.7
• Wetlands are natural filters that improve water quality and help neutralize a number of different contaminants.8
Wetlands remove nutrients such as phosphorus and nitrogen from water flowing into lakes, streams and rivers, as
well as groundwater.9 Wetlands can reduce nitrate and phosphorus up to 80 percent10 and 94 percent11 respectively.
• Excessive nutrients in water bodies lead to eutrophication (excessive algae production), which reduces oxygen
content in the water to levels that kill fish and other creatures. Eutrophication also makes recreation unpleasant
or impossible. High levels of nutrients such as nitrates make water unsafe for drinking.12 Wetland plants such as
duckweed can remove between 116 and 400 kg/ha/yr of phosphorus and 350 to 1,700 kg/ha/yr of nitrogen.13
Other wetland plants have the capacity to remove or degrade toxic compounds such as heavy metals and pes-
ticides.
• Wetlands recharge water supplies. Canada’s rivers, lakes and streams originate from a myriad of small wetlands
and streams and are critical for influencing the character and quality of downstream waters.14 As well, wetland
depressions are important in both groundwater recharge and water storage in many physiographic settings,
including the northern glaciated prairies.15 Each wetland may have a small storage, however collectively, storage
is significant. For example, wetlands can store almost all of the snowmelt runoff generated in their respective
watersheds.16 Forest wetlands overlying permeable soil may release up to 100,000 gallons/acre/day into ground-
water. Conversely, if the wetland is destroyed (drained, converted to another land use), ground water levels can
be substantially reduced. For example, if 80 percent of a Florida cypress swamp were drained, the associated
groundwater would be reduced by approximately 45 percent.17
f
T H E VA LU E O F N AT U R A LC A P I TA L I NS E T T L E D A R E A S O FC A N A D A
We have very little
data that show the
changes in our
natural capital over
time; and we haven’t
even identified and
measured all the
components of
natural capital.
left
:Jeo
peW
olfe
ri
ght:
Bria
nW
olits
ki

g
• Wetlands help control floods by storing large amounts of water. Four-tenths of a hectare of wetlands can store
over 6,000 cubic metres of floodwater.18 Research in the Upper Mississippi and Missouri Basins showed that
wetland restoration would provide enough floodwater storage to accommodate excess river flows associated
with the 1993 flooding in the U.S. Midwest.19 Conversely, when wetlands are destroyed, the probability of a
given rainfall event causing flooding and floodwater damage increases significantly.20
• Wildlife viewing and photography is one of the fastest growing recreational activities in Canada. Many species
make wetlands their homes, notably many bird species, amphibians, fish and mammals. Wetlands also provide
for consumptive recreational activities such as fishing and hunting.
• Wetlands provide habitats for many plant and animal species. Approximately 600 species of wildlife, including
species at risk, use wetlands in North America during some part of their life cycle.
• We use a wealth of products from wetlands including fish and shellfish, blueberries, cranberries, timber and
wild rice, as well as medicines that are derived from wetland soils and plants. Commercial fisheries depend on
wetlands for spawning and nurseries, and to provide food for growing stocks of fish and shellfish.
Valuing Natural Capital
Measuring the amount of natural capital is an essential first step in helping society make better decisions about
land use and economic activity. Why then value natural capital and not just measure its quantity? First, one can-
not sensibly ‘add up’ different types of natural capital in physical units. Twenty tonnes of forest biomass cannot
be aggregated in a meaningful way with 20 hectares of wetlands or 100 litres of water purification provided by
the wetlands. Monetary conversions help us add up ‘apples and oranges’. Second, decision makers typically use
monetary measures to compare land use options. For example, a 10-hectare housing project will generate so many
dollars of property tax revenue each year. Having a value of the goods and services generated by the natural capital
on that 10 hectares will allow the decision maker to compare these alternatives more easily and can help in for-
mulating better regulatory policies.
Determining a value for natural capital can be very straightforward when the good or service has a market-
determined value. There are many products derived from natural capital such as fish, timber and agricultural
products, all of which have well-defined prices. However, for a great number of the goods and services natural
capital provides, markets do not exist to help establish a price. Economists have come up with a number of tech-
niques to help value these ‘non-market’ goods and services. The approaches fall into two main categories. Those
that focus on economic damages – measurement of loss of incomes and output, reduced productivity, expenditures
needed to offset loss of natural capital services and/or environmental damages (or, costs avoided if natural capital
is preserved). The second is willingness of individuals to pay for goods and services from natural capital or will-
ingness to accept compensation for the loss of natural capital as revealed through people’s behaviour or upon
direct questioning.
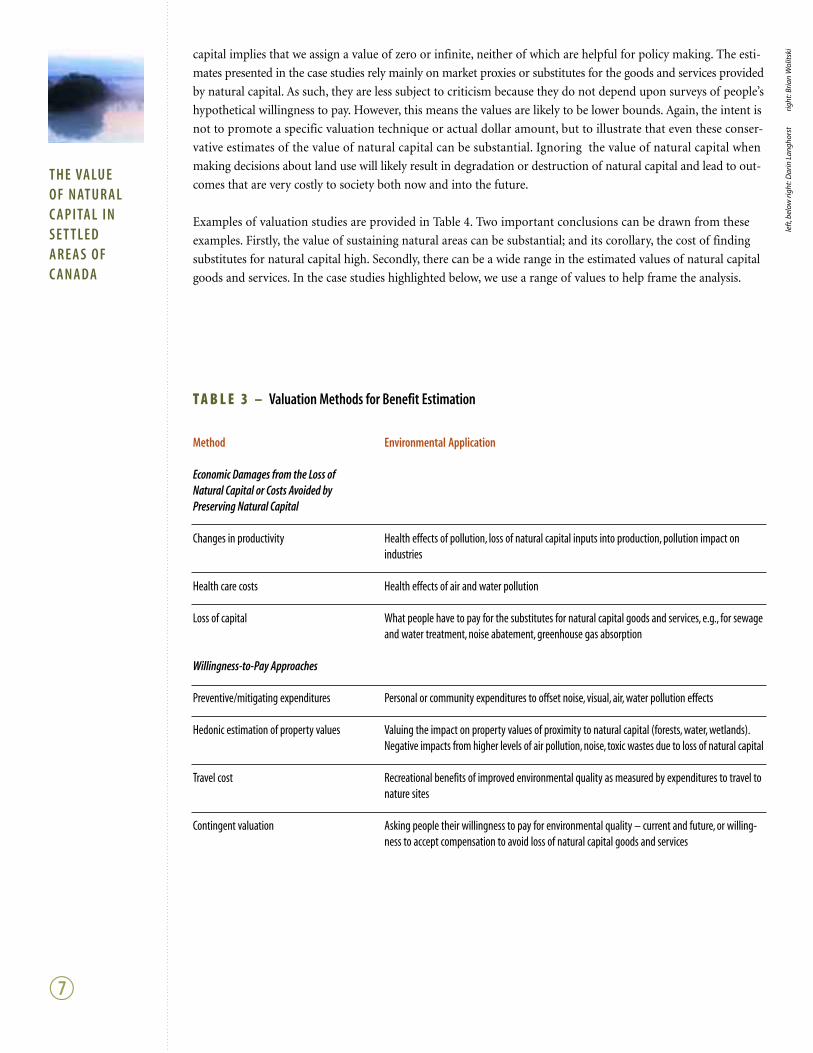
Table 3 lists the approaches taken and provides examples. All of these methods are imperfect in that they rely on
specific case studies and sampled populations, and encounter difficulties in linking the measurement technique to
the precise services provided by natural capital. That is why we present a range of estimates derived from different
approaches and studies. Another problem is that there are very few valuation studies done for Canada. One often
has to try to apply the values derived for one specific location to another. This process is called ‘benefit transfer’,
and is the approach taken for some of the case studies discussed below. There is extensive literature discussing
methodologies for valuing natural capital and the pitfalls encountered.21 While some critics of valuation argue the
techniques are so imperfect as to be worthless, others strongly disagree. To argue that we cannot value natural
h
T H E VA LU E O F N AT U R A LC A P I TA L I NS E T T L E D A R E A S O FC A N A D A
T A B L E 3 – Valuation Methods for Benefit Estimation
Method Environmental Application
Economic Damages from the Loss of Natural Capital or Costs Avoided by Preserving Natural Capital
Changes in productivity Health effects of pollution, loss of natural capital inputs into production, pollution impact on industries
Health care costs Health effects of air and water pollution
Loss of capital What people have to pay for the substitutes for natural capital goods and services, e.g., for sewageand water treatment, noise abatement, greenhouse gas absorption
Willingness-to-Pay Approaches
Preventive/mitigating expenditures Personal or community expenditures to offset noise, visual, air, water pollution effects
Hedonic estimation of property values Valuing the impact on property values of proximity to natural capital (forests, water, wetlands).Negative impacts from higher levels of air pollution, noise, toxic wastes due to loss of natural capital
Travel cost Recreational benefits of improved environmental quality as measured by expenditures to travel to nature sites
Contingent valuation Asking people their willingness to pay for environmental quality – current and future, or willing-ness to accept compensation to avoid loss of natural capital goods and services
capital implies that we assign a value of zero or infinite, neither of which are helpful for policy making. The esti-
mates presented in the case studies rely mainly on market proxies or substitutes for the goods and services provided
by natural capital. As such, they are less subject to criticism because they do not depend upon surveys of people’s
hypothetical willingness to pay. However, this means the values are likely to be lower bounds. Again, the intent is
not to promote a specific valuation technique or actual dollar amount, but to illustrate that even these conser-
vative estimates of the value of natural capital can be substantial. Ignoring the value of natural capital when
making decisions about land use will likely result in degradation or destruction of natural capital and lead to out-
comes that are very costly to society both now and into the future.
Examples of valuation studies are provided in Table 4. Two important conclusions can be drawn from these
examples. Firstly, the value of sustaining natural areas can be substantial; and its corollary, the cost of finding
substitutes for natural capital high. Secondly, there can be a wide range in the estimated values of natural capital
goods and services. In the case studies highlighted below, we use a range of values to help frame the analysis.
left
,bel
ow ri
ght:
Dar
in L
angh
orst
ri
ght:
Bria
nW
olits
ki

T A B L E 4 – Examples of Valuation Studies
The Value of Products from Wetlands 22
• Coastal wetlands provide life support for oysters valued at between $54 and $6,337 per acre per year in Virginia.• Willingness to pay for fish and wildlife habitat by non-users in Alberta ranges from $267 to $453 per person per year.• Willingness to pay for freshwater fishing in Lake St. Clair averages $97 per person per year.• Willingness to pay for hunting and fishing in Alberta averages $400 per person per year.• Willingness to pay for water quality improvement provided by riparian wetlands in the U.S. midwest ranges from $70 to $87 per person per year.• The present value (over 50 years at a 6 percent discount rate) per acre of flood control provided by wetlands in Massachusetts is $96,010, while
that of waste assimilation (nutrient filtering) is $75,196, and water supply services is $291,357.
Expenditures by British Columbians on Nature-Related Activities for the Year 1996 23
• Outdoor activities in natural areas = $1.5 billion• Wildlife viewing = $302 million• Recreational fishing = $329 million• Hunting wildlife = $112 million
Value of Goods and Services from Canadian Forests 24
• Market value of non-timber products (e.g., food, medicines, forage) = $.74 per hectare per year in British Columbia.• Willingness to pay for recreational fishing is $3.17 per hectare per year, while that from hunting is $12.50 per hectare per year, as estimated by
contingent valuation studies.• Canadians are willing to pay $57.65 per hectare per year to view wildlife, and $44.64 per hectare per year for recreational activities such as
camping, hiking, and kayaking as estimated by contingent valuation studies.• Carbon sequestered by forest biomass and soils ranges from $15 to over $600 per hectare per year.
Agricultural Lands 25
• Net income from farm production in British Columbia averaged $164 per hectare per year over the period 1997-2001.• Preservation and scenic values provided by agricultural land ranges from $1.33 to $2.42 per household per year.• Canadian farms could save between .94 and 1.9 tonnes of greenhouse gases per year if more conservation-oriented farming practices were
adopted.This would generate savings if the emissions were not released of between $5.48 and $34.34 per hectare per year in Saskatchewan, or $10.45 to $32.94 per hectare per year in Ontario.
Note: All values are in 2003 Canadian dollars.
i

c a s e s t u d i e s : i l l u s t r a t i n gt h e v a l u e o f n a t u r a l c a p i t a lThe following case studies were assembled to illustrate that the preservation or restoration of natural areas within
the settled areas of Canada will create substantial net benefits to society. The first case study illustrates the threats
to the lower Fraser Valley of British Columbia – an area rich in natural capital that is facing massive pressure from
urbanization and industrialization of agriculture that is destroying and degrading natural areas.26 Valuing the
natural capital from the Fraser Valley could help improve land use planning and save British Columbians millions
of dollars in avoiding the construction of costly substitutes for the services of natural capital and the loss of
these valuable goods and services. Three additional case studies show that the preservation and restoration of
natural areas within agricultural landscapes can create substantial net benefits to society and support the new
Agricultural Policy Framework (APF) of Canada.
The Lower Fraser Valley Case Study
The Lower Fraser Valley encompasses approximately 16,225 km2 and contains some of Canada’s best agricul-
tural land, sensitive wetlands, forests and other natural areas. It is home to about 57 percent of the population
of British Columbia. The Lower Fraser Valley encompasses two jurisdictions: the Greater Vancouver Regional
District (GVRD) and the Fraser Valley Regional District (FVRD).
j
iii
Lower Fraser Valley
righ
t:B.
Stan
ley
1)
Much natural capital in the watershed has already been degraded or destroyed by the growth of cities and
industrial agriculture in the region.
“That there is pressure on the land, competition between land users and degradation of the natural
environment is all too plain. Less evident is the burden that all this growth and the particular life-
styles of the inhabitants places on the stock of natural resources – the demand for water, energy,
leisure and recreation, food and industrial production. The ‘withdrawals’ from the ecosystem have
been growing alarmingly, but so too have the ‘additions’… The land, the air, the rivers, the lakes and
the Strait of Georgia are called upon to absorb more and more wastes generated by households, agri-
culture and industry.” 27
Threats from Urbanization
With an annual growth rate of 2.6 percent between 1990 and 2000 – a figure higher than megacities such as
Cairo, Jakarta and Rio de Janeiro, Greater Vancouver has experienced significant population increases, from
1.8 million in 1996 to almost 2 million inhabitants in just five years.28 A recent report estimates that the average
annual population growth over the coming years to 2020 will be approximately 1.7 percent for the GVRD and
2.4 percent for the FVRD. If this occurs, the population will total over 3 million by 2020.29
If, over time, existing urban areas increase their density by just over 6 inhabitants per hectare rather than
extend development to natural areas in the Fraser Valley, the expected population growth will not require
further consumption of agricultural, forested and other natural areas.30 However, given the existing patterns
of urbanization, current public policies and lack of incentives to private landowners and public officials to
incorporate the values of natural capital into their decision making, it is more likely that existing natural
areas will be converted to suburbs and commercial service areas. In Canada, the number of people living in
low-density neighbourhoods of single family detached houses has risen dramatically since the Second World
War. By 1970, more Canadians were living in suburbs than in either the countryside or the central city.31 In
Greater Vancouver in 1971, suburbs dominated by single family homes accounted for 61 percent of its pop-
ulation. By 1996, 72 percent of Greater Vancouver’s population resided in its suburbs.32 Recent data indicate
for every 1,000 new inhabitants in Vancouver, 28 hectares of land are urbanized because of low-density growth.33
At current population growth rates, 28,000 hectares of land will be consumed by 2026, 17 percent of what
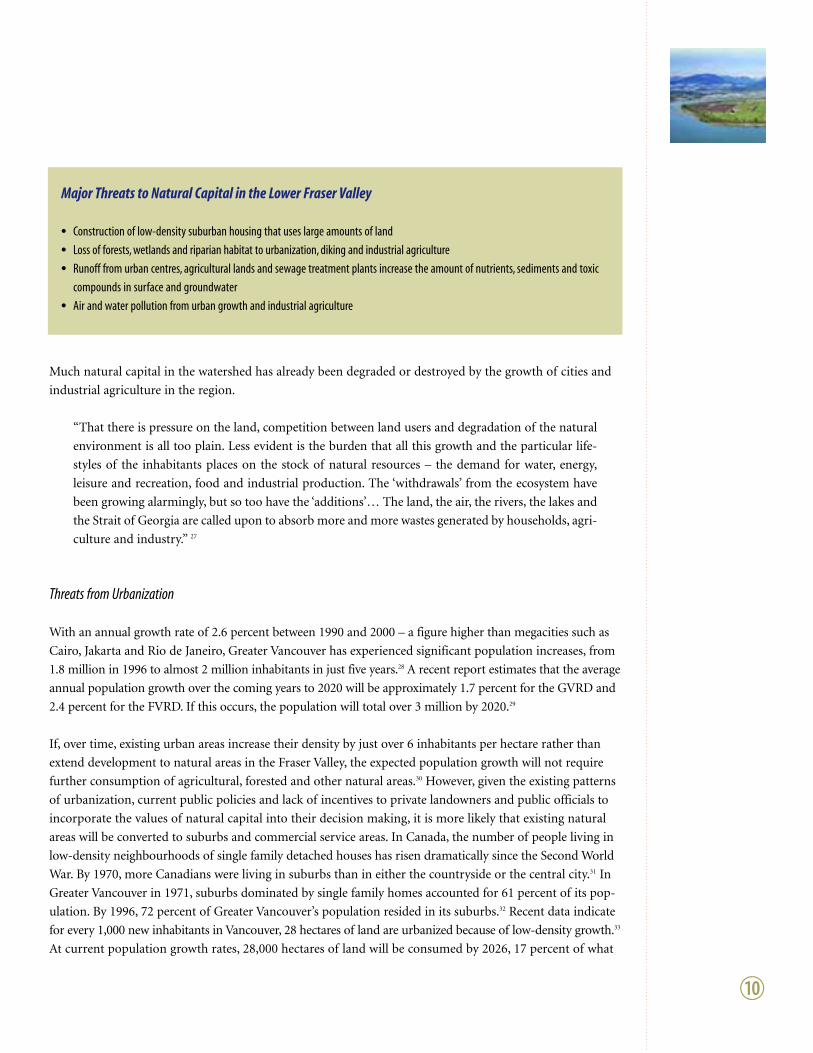
Major Threats to Natural Capital in the Lower Fraser Valley
• Construction of low-density suburban housing that uses large amounts of land
• Loss of forests, wetlands and riparian habitat to urbanization, diking and industrial agriculture
• Runoff from urban centres, agricultural lands and sewage treatment plants increase the amount of nutrients, sediments and toxic
compounds in surface and groundwater
• Air and water pollution from urban growth and industrial agriculture

remains of GVRD’s total non-developed land-base, and 28 percent of what remains of the GVRD’s non-
urbanized land base on the Fraser Valley floor.34
Land-intensive single-family homes constituted 41 percent of housing completions in the region in 2001,
the highest in five years. Less than half of the population growth between 1996 and 2001 occurred in the
extended metropolitan core of Vancouver, Burnaby, New-Westminster, Coquitlam, Port Coquitlam and Port
Moody. The remainder of this growth occurred mostly in the suburban municipalities of Langley, Surrey,
Richmond, Maple Ridge and Pitt Meadows.
Municipalities will likely pursue further sprawling development. One of the reasons for this is that property
taxes make up almost 52 percent of municipal revenues in British Columbia in 2000, a figure that has risen
in recent years.35 High property taxes in dense urban cores drive away artisans, families and small stores, who
relocate in suburbs where property taxes are lower. Suburban communities, because they equally rely on
property taxes, encourage this urban emigration, and accommodate development and construction of new
homes with a variety of policies that encourage conversion of natural areas to suburban housing develop-
ments and commercial use.36 Other factors encouraging sprawling development include government policies
such as those related to road construction, funding of sewer and water infrastructure servicing new suburban
communities, and subsidized public transportation that encourage development of suburban areas.
Urban and industrial development not only alters land use, but also creates significant environmental stress
in the form of air and water pollution. Non-point urban effluents occur mostly from urban runoff that finds
its way into waterways through storm drains. These waters are laced with contaminants including lead, zinc,
hydrocarbons and other sediments, and account for a significant portion of suspended solids loading in the
lower Fraser River and Burrard Inlet.37 Although storm water is connected with sewer mains in Vancouver
and thus treated under normal conditions, when there is heavy rain, sewer flows exceed treatment plant
capacity that results in spills of raw and untreated sewage directly into waterways. Approximately 25 tons of
organic material enters the Fraser River from sewage treatment plants daily and roughly an equivalent amount
of pollution is discharged from industrial sources.38 Point sources of water pollution come predominately
from municipal wastewater treatment plants (70 percent of the effluent into Vancouver’s waterways), the
balance from industrial sources. While sewage wastes are typically diluted enough by the flow of the Fraser
River to meet guidelines for industrial and irrigation uses, the water quality is below that safe for drinking
or direct-contact recreation.
T H E VA LU E O F N AT U R A LC A P I TA L I NS E T T L E D A R E A S O FC A N A D A
1!
Urban and indus-
trial development
not only alters land
use, but also creates
significant environ-
mental stress in the
form of air and
water pollution.
left
:Bri
anW
olits
ki
bel
ow,r
ight
:B.S
tanl
ey

1@
Loss of Natural Capital in the Fraser Valley
The loss of natural capital is seen in many dimensions. Historically, floodwaters brought nutrient-rich silt to
the valley floor and rejuvenated its wetlands each spring. Now wetlands have been drained, and much of the
land lies behind 600 kilometres of dikes. The dikes significantly altered the hydrology of the Fraser River
Valley, cutting the river off from some of its tributaries and flood plain, changing runoff patterns and fish
habitat. Approximately 70 percent of the river margin wetlands had been diked off from the river by the late
1970s. Their main purpose is flood control, but experts have predicted a one-in-three chance within the next
60 years of a “flood of record” event, which would breach or over-top many of the dikes, resulting in cata-
strophic damage.39 Had more of the natural capital of the Lower Fraser Valley’s wetlands been preserved, the
region would have both natural and physical capital to help absorb the many centimetres of precipitation
received each year, while simultaneously preserving the many other benefits from the natural capital.40
Much of the valley floor used to be forested, but by 1990, most of the forests and wetlands in the lowlands
were gone, replaced largely by agricultural and urban land. Extensive forests remain only in the mountains.
Dozens of streams once crisscrossed the lands. Of the 779 assessed streams in the Lower Fraser Valley, 15 per-
cent have been completely lost, and another 72 percent are threatened or endangered. Only 106 streams (14
percent) are in good condition and able to recover.41 Only Musqueam Creek remains within the city as a
salmon-bearing stream. From the late 1980s to late 1990s, almost 1,000 hectares of wetlands were lost in
the Lower Fraser Valley. The Fraser lowlands now have the second-highest number of species at risk in B.C.
Less than five percent of this ecosystem is currently protected under the province’s Protected Areas Strategy.42
The Fraser River estuary is a crucial staging area on the Pacific flyway for millions of migratory birds and
supports the highest density of water birds and raptors in Canada. The Fraser River estuary provides feeding
and roosting sites to about 1 million migrating and wintering waterfowl and 5 million shorebirds. Key species
include trumpeter swans, lesser snow geese, Pacific brant, northern pintail, American wigeon, dunlin and
western sandpipers. Loss of wetland habitat and increased industrialization of agriculture threaten these
species. These impacts reduce the amount of available wildlife habitat and food sources, provide additional
disturbances through increased human activity and habitat fragmentation and concentrate wildlife on the
remaining habitat patches thereby increasing mortality.
Threats to and from Agriculture
The Lower Fraser Valley has been one of the most productive agricultural regions in Canada. Agricultural land
in the GVRD and FVRD produced output valued at almost $1.4 billion in 2001, yielding an average of $16,887
per hectare of agricultural land.43 Agricultural land is both under threat and a source of degradation of nat-
ural capital. From 1961 to 1991, agricultural land in the Lower Fraser Valley declined by 23 percent and declined
a further 4 percent from 1991 to 2001 (from 111,120 to 85,825 to 82,361 hectares). The introduction of the
Agricultural Land Reserve (ALR) in 1973 with its protection of lands favourable to agriculture slowed the rate
of decline from what it had been from the 1960s to 1970s, but has not stopped the conversion of agricultural
land to urban development.44 However, in comparison to other regions, the ALR represents a very successful
policy. A recent study comparing growth patterns of Seattle, Washington and Vancouver45 emphasized the
success of the ALR in deterring urban sprawl, showing that the ALR obliged local governments to require
development in existing urbanized areas (densification) rather than convert natural lands to housing and
commercial uses. Had greater Vancouver sprawled like Seattle during the 1990s, it would have developed an
additional 18,000 acres – an area approximately four-fifths the size of Burnaby to accommodate residential
growth. And if greater Vancouver had the same overall population density as Seattle, an additional 650 km2 of
land would be covered with suburban development, which is equivalent to all of the remaining developable
land in the regional district, plus four-fifths of the remaining agricultural land.

A potentially more serious threat to natural capital comes not from the loss of agricultural land, but from
wastes from the ‘industrialization’ of agricultural lands without a corresponding increase in the treatment
or containment of waste products from agriculture. Agricultural industrialization of the Lower Fraser Valley
occurs in at least three ways: greater use of fertilizers and pesticides per hectare, an increase in livestock den-
sities, and the conversion of crop land to greenhouse production. Commercial fertilizer use increased 164
percent between 1971 and 1991, and spraying and dusting rose significantly.46 Changes from higher nitrogen
uptake crops such as forage to lower uptake crops such as raspberries has also led to greater nutrient loading
of the environment.
In the period from 1986 to 1991, the stock of pigs and chickens rose by approximately 50 percent (pigs from
24,947 to 37,540, chickens from 285,918 to 496,428).47 The average number of livestock per hectare was esti-
mated in the mid-1990s to be above the maximum carrying capacity estimated for the land.48 This leads to
animal waste being applied to the land in excess of the ability of the environment to absorb and neutralize
these nutrients.
Runoff of agricultural waste products is recognized as the prime contributor to the degradation of ground
and surface waters in the Fraser Valley.49 Wetlands and riparian areas adjacent to streams, because of the role
they play in filtering these effluents, become increasingly important in maintaining a healthy aquatic ecosystem.
The excess manure, in conjunction with the application of chemical fertilizers, has resulted in excessive nutrient
loads on substantial areas of farmland in the study area, leading to nutrient-laden runoff into water systems
and unbalanced soil conditions. An average of 273 kg of nitrogen, 84 kg of phosphorus and 165 kg of potas-
sium were applied per hectare per year on farms in the Fraser Valley, well above and sometimes twice what
was needed for the most nutrient-intensive crops.50 Of the total nitrogen, 17 to 48 percent found its way into
drainage ditches and thus surface water systems.51 Excess nutrients that are not absorbed into the water system
interact with soil to slow organic decomposition and destabilize nutrient and pH levels, leading to acidity
problems. Acidity problems in the study area are affecting more of the Valley’s land over time.
Nitrate levels in water, while generally below the limit considered unsafe in streams draining agricultural lands
in the region, are becoming an increasing concern in the groundwater of the Fraser Valley. For example,
nitrate levels in half of all well samples of the Abbotsford aquifer were higher than the safe limit. The ground-
water in both Abbotsford and Langley also contains inorganic chemicals (from herbicides, pesticides and
fumigants) in concentrations sufficient to cause concern. “The principle causes of this pollution are inade-
quate agricultural practices and badly constructed or maintained septic tanks.” 52
Between 1998 and 1999, the delta and farmlands around Boundary Bay and Roberts Bank experienced a 58
percent growth in glass greenhouses, and a significant reduction in available feeding grounds for ducks, shore-
birds and geese using the area. Coupled with the increase in extent of glass is an increase in the number and
size of buildings and storage areas required to service the greenhouses. Greenhouses are generally built adja-
cent to a dike to take advantage of the moderating effects of the ocean on temperature to reduce heating costs.
This may impede the daily movements of migratory waterfowl and shorebirds between the intertidal habitats
and agricultural lands. In 1999, greenhouses encased 1.4 percent of the delta’s agricultural land; five large-scale
greenhouses were being planned for the area and others possibly to follow. In 2001, the cities of Surrey and
Delta had 153 hectares of greenhouses, up from 55.5 hectares in 1996, an increase of 176 percent.53
Valuing the Lower Fraser Valley’s Natural Capital
Table 5 shows recent land uses in the floodplain portion of the GVRD and FVRD. If pressures to ‘suburbanize’
the natural lands within the basin continues without a change in public policy and creation of incentives for
1#
T H E VA LU E O F N AT U R A LC A P I TA L I NS E T T L E D A R E A S O FC A N A D A
Agricultural
industrialization of
the Lower Fraser
Valley occurs in at
least three ways:
greater use of ferti-
lizers and pesticides
per hectare, an in-
crease in livestock
densities, and the
conversion of crop
land to greenhouse
production.
left
:Bri
anW
olits
ki
righ
t:B.
Stan
ley

1$
private land owners to incorporate the value of nature in their land use decisions, British Columbians will
lose many goods and services from their natural capital. They will then either have to replace them at con-
siderable cost or forego them completely. Illustrations of the value of natural capital goods and services from
the region’s natural areas highlight the value of preserving nature and the costs of its destruction or degradation.
Table 5 shows that natural areas comprise a significant share of the land. These can constitute wetlands, lakes,
rivers and streams, the riparian lands surrounding them, estuaries, and so on. A further breakdown of natural
area is not possible because the Lower Fraser Valley lacks accurate documentation of existing land uses, let
alone any sort of estimates of the changes in land use over time. Environment Canada produced a detailed
inventory of land uses for the period between 1980 and 1987. That survey found that 644 hectares of land in
the Lower Fraser Valley were converted to urban land each year. We do not have a good estimate of what has
been lost over the past 17 years. The estimates below are thus only illustrative.
Goods and Services from Wetlands
Wetlands absorb considerable amounts of nitrogen and phosphorus and can serve as a natural waste treatment
plant for the excessive amounts of these fertilizers leaching from farms into the Fraser Valley’s water bodies.54
Estimates of the savings in waste treatment costs provided by nature likely underestimate the value of the
wetlands as a waste treatment facility because they do not reflect society’s total willingness to pay for water
quality. The costs of removing phosphorus vary from $21.85 to $61.20 per kilogram at Vancouver’s primary
T A B L E 5 – Land Use (hectares) in the Lower Fraser Valley
Land Use Catagory GVRD FVRD Study Area Total
Agricultural 37,064 45,296 82,361Urban 75,000 12,978 87,978Forest* 4,368Natural Areas
Open & Undeveloped 43,440Protected Watershed 46,880Recreation & Protected Natural Areas 63,880Residential - rural 11,150Park 12,197Resource 7,397Rural 9,383Other 6,544First Nations Reserve 2,514Limited Use 3,074Total Natural Areas 165,350 41,109 206,459
Total: All Categories 277,414 103,751 376,798
GRVD and FVRD total wetlands = 42,000 ha.
* Forest land estimates are included in the categories of natural areas and not identified separately for the GVRD.
Sources and dates: GVRD data is for 2001 and from communication with the GVRD and Ministry of Community Aboriginal and Women’s Services. FVRD data for agricul-ture is from the 2001 Census; for urban from the FVRD Planning Department, Choices for our Future: Planning for Urban Growth Boundaries in the Fraser Valley, 1999.Forest and natural areas data is from the FVRD, Phase 1, Technical Report: A Technical Report Outlining the Future Distribution of Population, Homes and Jobs in the FraserValley, 1998.Wetlands data is for 1992 and compiled under the Wetlands Inventory. http://www.bcwetlands.com/new/frasletters/Wetnet?news/95_03/fraser-valley.htm

and secondary waste treatment plants, while costs for nitrogen vary from $3.04 to $8.50 per kilogram.55 It is
not known exactly how much phosphorus and nitrogen a typical wetland can absorb because amounts depend
on the particular type of wetland, its location and plant composition, and the chemical and physical charac-
teristics of soil type.56 Some estimates from the literature are that wetland plants (duckweed and pennywort)
can remove between 116 and 770 kg/ha/yr of phosphorus and 350 to 32,000 kg/ha/yr of nitrogen.57 A quasi-
natural field of reeds can remove 101 kg/ha/yr of phosphorus and 1,910 kg/ha/yr of nitrogen.58 Estimates
from a North American database offer the conservative estimates of 80.3 kg/ha/yr for phosphorus, and 547.5
kg/ha/yr for nitrogen.59 While these estimates have a wide range, even the most conservative estimate exceeds
the amount of excess nitrogen and phosphorus that finds its way into the region’s water supplies from current
agricultural practices.60
The annual value of waste treatment of phosphorus and nitrogen produced by one hectare of the Fraser
Valley’s wetlands is estimated to be at least $452 and may be as high as $1,270. The annual nitrogen and
phosphorus waste treatment benefits received from the existing 40,000 hectares of wetlands in the Lower
Fraser Valley’s wetlands could thus amount to between $18 and $50 million per year.61
These waste treatment services are a small part of the total value of a wetland to the region. A number of
studies have put the annual value of all the goods and services generated by one hectare of wetlands (fish,
shellfish, waterfowl, mammal and reptile habitat; water supply; erosion, wind, wave barrier; storm and flood
control; and recreational opportunities) at between $5,792 and $24,330.62 If the approximately 40,000 hectares
of Lower Fraser Valley wetlands were valued at the lowest estimate, its annual value would be $231.7 million.
This is clearly an overestimate because not all of the wetlands provide each good and service indicated. Two
studies provide a bit of additional perspective. The ecological services from 1,890 hectares of the Burns Bog
in the Fraser Valley were estimated at approximately $60 million per year or $31,375 ha/yr.63 A study of flood
protection benefits alone for wetlands in the Seattle area found values ranging from $408 to $2,110 ha/yr.64
Goods and Services from Forest Lands
The Lower Fraser Valley has an estimated 6,132 hectares of forests in the floodplain area. These forests, if
uncut, provide some small amount of food harvest (berries, mushrooms), fishing and hunting terrain, wild-
life viewing, other forms of recreation such as camping and hiking and carbon sequestration. Using estimates
for temperate coniferous forests, the annual value of these goods and services from the forest is $134/ha/yr,
excluding the carbon sequestration services.65 Thus, a lower bound estimate of the Fraser Valley’s forests in
the floodplain yield over $824,000 worth of goods and services per year if uncut. This number does not
reflect the other services provided by forests such as erosion control, water storage and purification. Carbon
sequestration is not an annual benefit, because it reflects the total amount of carbon stored per hectare. This
estimate ranges from $150 to $6,080 per hectare, and can be converted to an annual benefit by assuming the
forest is sustained indefinitely. At a discount rate of 10 percent, the annual benefits are $15 to $608/ha/yr.
Recreational Benefits from Natural Areas
Recreational services can be in the form of wildlife viewing, hunting and fishing, camping and swimming,
hiking and skiing. No comprehensive study has been done to estimate the recreational benefits of the region.
Using a survey done by Environment Canada66 for British Columbia, a very rough estimate of the values can
be placed on some of the recreational services provided by the Fraser River Valley. The region may provide
$53.45/ha/yr per year in benefits from wildlife viewing and $36.40/ha/yr in benefits from hunting and fishing.
If all natural land in the region generates these benefits, the total would be approximately $19 million per
1%
T H E VA LU E O F N AT U R A LC A P I TA L I NS E T T L E D A R E A S O FC A N A D A
A number of
studies have put
the annual value of
all the goods and
services generated
by one hectare of
wetlands … at
between $5,792
and $24,330. If
the approximately
40,000 hectares of
Lower Fraser Valley
wetlands were
valued at the lowest
estimate, its annual
value would be
$231.7 million
left
,rig
ht:D
UC
anad
a

1^
year. This estimate probably significantly underestimates the annual benefits as it does not capture the other
recreational uses of the valley’s natural capital.
Ecological Services from Agricultural Lands
Properly valuing the net social benefits from agricultural lands involves a very complex computation of the
value of the agricultural products derived, net of production costs and the value of the waste byproducts
that must be treated by physical capital or the natural environment. These sorts of calculations have not been
done for the Fraser Valley, but are the focus of the next three case studies.
Goods and Services from Natural Areas
One estimate67 of the ecosystem values of natural areas provides some numbers for the land uses we are not
able to identify individually. Each hectare of an estuary may annually be worth $22,832; lakes and rivers –
$8,498; temperate/boreal forests – $2,007; and grass/rangelands – $232. These numbers are not for any spe-
cific country or region, but represent the value of the net primary production of each ecosystem. While these
numbers are highly speculative, they serve as a reminder of the potential value of lost production if ecosystems
are destroyed or degraded. The Lower Fraser Valley ecosystem epitomizes one where protecting nature may
save society hundreds of millions, if not billions of dollars every year.
Table 6 summarizes the values per hectare that may be obtained from components of the natural capital in
the Lower Fraser Valley. The estimates should be viewed as examples. While they cannot be aggregated
because they come from a number of different studies and hence some measure the same goods and services,
they clearly illustrate that each hectare of land in the Fraser River Basin can generate substantial values if
the natural capital is protected.
T A B L E 6 – The Current Value (per hectare per year) of Conserving Natural Capital in the Lower Fraser Valley
Type of good or service High Low Single Estimate
Waste treatment services – removal of nitrogen and phosphorus $ 1,270 $ 452All goods and services provided by wetlands $ 24,330 $ 5,792Flood protection from wetlands $ 2,110 $ 408Forests: food harvests, recreational uses $ 134Carbon sequestration from forests $ 608 $ 15Wildlife viewing $ 53Hunting and fishing $ 36Goods and services: Estuaries $ 22,800Goods and services: Lakes and rivers $ 8,500Goods and services:Temperal/boreal forest $ 2,000Goods and services: Grasslands and rangelands $ 230
The Lower Fraser
Valley ecosystem
epitomizes one
where protecting
nature may save
society hundreds
of millions, if not
billions of dollars
every year.
Agricultural Case Studies68
Canadian agriculture has adopted increasingly intensive management practices over the past 50-75 years. Pressures
to compete internationally, large capital costs for the increasing mechanization and industrial farming, high levels
of debt and uncertain crop prices make it difficult for farmers to focus on long-term sustainability of their agri-
cultural lands. To sustain their livelihoods, farmers must focus on their private net returns from food production.
As Table 2 notes, agricultural lands also produce ecosystem benefits to society. But because farmers typically
receive no payment for the ecosystem benefits generated by their lands and farming techniques, they have little
incentive or ability to protect nature. In addition, there is often poor understanding of how changes in farm man-
agement might increase natural capital while also providing private benefits to the farm. An example would be
allowing natural areas to persist and provide habitat for pollinators, predators for pest species, or water retention.
When the value of natural capital on a portion of land exceeds the value of that land used for agriculture, it would
be economically efficient to convert that land to some form of permanent vegetative cover (also known as conser-
vation cover) that is no longer used for agricultural purposes. Additionally, agricultural practices could be altered
to minimize and mitigate land degradation and enhance the natural capital on farm lands as is proposed through
various beneficial management practices (BMPs) under the new Agricultural Policy Framework.
Permanent vegetative cover and ecologically sound farming practices can help to:
• Improve water quality and decrease water treatment costs;
• Lower dredging costs to remove sediment from water conveyance and storage infrastructure;
• Increase recreational opportunities such as fishing, swimming, hunting and wildlife viewing;
• Decrease net greenhouse gas (GHG) emissions;
• Mitigate flooding; and
• Protect and enhance ecological services.
This section highlights three case studies from different agricultural regions of Canada. The cases present the
threats to natural capital in each region, provide estimates of the value of natural capital, and illustrate that there
are cases where it might be in society’s interest to change farming practices to protect natural areas. The cases also
repeatedly show that we lack good data measuring the physical amount of natural capital; where these fundamental
data are a prerequisite for estimating the value of conserving natural capital and are needed to help make informed
public policies about land use.
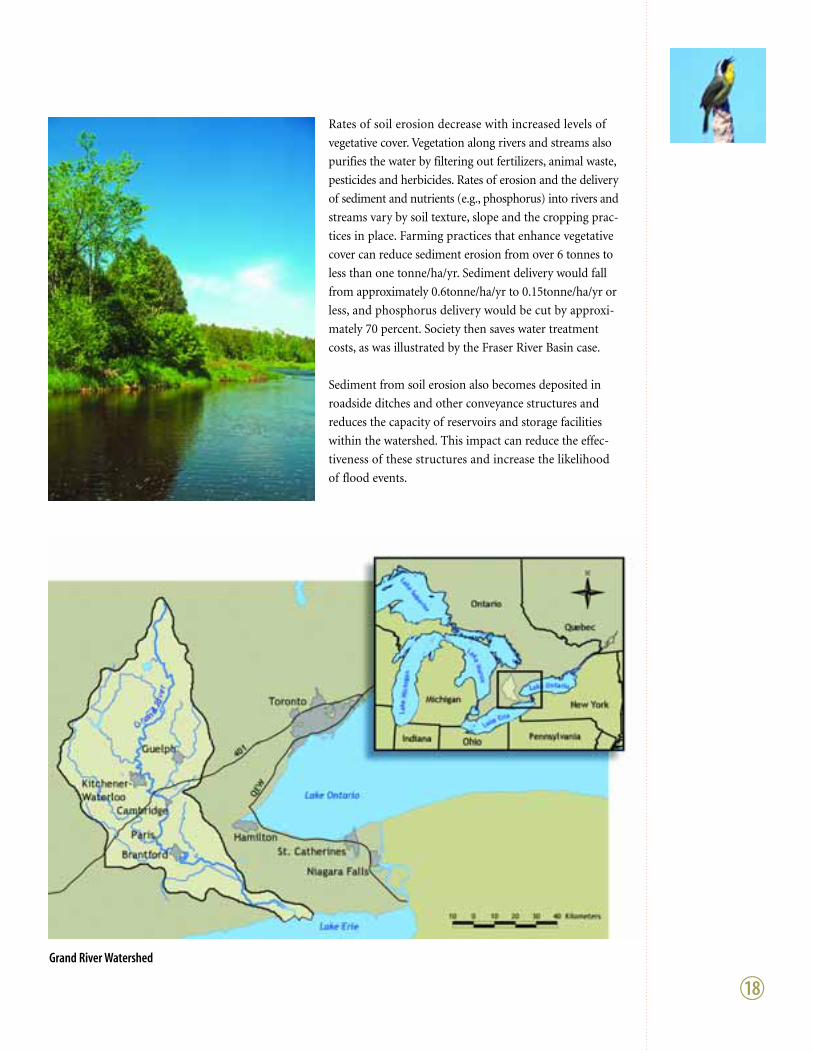
The Grand River Watershed
The Grand River watershed is the largest in southern Ontario covering approximately 6,800 km2, running from
Dundalk in the north to Lake Erie in the south. Of this total area, more than 75 percent of the watershed is agri-
cultural land. The cities of Guelph, Kitchener, Waterloo, Cambridge and Brantford are within the watershed with
a total watershed population of 875,000 in 2003, and a forecasted population of over 900,000 by 2021. These urban
areas depend on surface and ground water resources. The Grand River watershed is illustrative of the types and
values of natural capital that could be obtained from agricultural lands in watersheds of southern Ontario.
Twenty-six sewage treatment plants which service approximately 680,000 people discharge treated wastewater into
the Grand River. The cumulative pressures on the river from municipal sewage treatment plants and the growing
agricultural industry in the watershed question the future capacity of the watershed to assimilate wastewater.
1&
T H E VA LU E O F N AT U R A LC A P I TA L I NS E T T L E D A R E A S O FC A N A D A
The Grand River
watershed is illus-
trative of the types
and values of natural
capital that could be
obtained from agri-
cultural lands in
watersheds of
southern Ontario.
left
:Dar
inLa
ngho
rst
rig
ht:A
ndre
w M
cLac
hlan
fa
r rig
ht:D
UC
anad
a
1*
Rates of soil erosion decrease with increased levels of
vegetative cover. Vegetation along rivers and streams also
purifies the water by filtering out fertilizers, animal waste,
pesticides and herbicides. Rates of erosion and the delivery
of sediment and nutrients (e.g., phosphorus) into rivers and
streams vary by soil texture, slope and the cropping prac-
tices in place. Farming practices that enhance vegetative
cover can reduce sediment erosion from over 6 tonnes to
less than one tonne/ha/yr. Sediment delivery would fall
from approximately 0.6tonne/ha/yr to 0.15tonne/ha/yr or
less, and phosphorus delivery would be cut by approxi-
mately 70 percent. Society then saves water treatment
costs, as was illustrated by the Fraser River Basin case.
Sediment from soil erosion also becomes deposited in
roadside ditches and other conveyance structures and
reduces the capacity of reservoirs and storage facilities
within the watershed. This impact can reduce the effec-
tiveness of these structures and increase the likelihood
of flood events.
Grand River Watershed

The Grand River is considered a world class fishery with some upper tributaries providing high-quality trout
fishing. Sediment harms fish in lakes and streams by damaging spawning and feeding areas and by reducing res-
piratory efficiency. Permanent vegetative cover in riparian areas would help increase the productivity of streams for
high value fish, such as trout, because it reduces water temperature. Canoeing, kayaking, swimming and camping
are other recreational activities whose enjoyment may be enhanced by increased water quality and better scenic
amenities along the banks of the rivers and streams where riparian vegetation exists. Perennial vegetative cover
also increases wildlife habitat compared to land that is annually cropped. Both hunters and wildlife viewers bene-
fit from increased wildlife populations and diversity.
The Net Benefits of Protecting Natural Areas or Converting Tilled Lands to Natural Areas
Table 7 summarizes high, low and ‘best’ estimates for the net value of protecting natural areas in the Grand River
Watershed. The Appendix (p. 27) shows in more detail how Belcher et al. derived these values for this case and
the two that follow. The net benefits are significant, even at the low estimate. To provide perspective, these net
benefits of conserving natural areas can be compared to the market value of the land in the watershed. Belcher
et al. estimate a land supply curve using available information on land rental rates and prices for the crops grown
in the region. This information can be compared to the estimates of the value of natural capital. Average rental
rates for agricultural land in the Grand River watershed range from approximately $74/ha to $247.10/ha.70 The
estimates of the net benefits from conserving natural capital fall into the same range with the high estimate ex-
ceeding the high market value. It would be in society’s interest to find policies that will help conserve the natural
capital on the agricultural lands generating the highest net benefits to conservation.
T H E VA LU E O F N AT U R A LC A P I TA L I NS E T T L E D A R E A S O FC A N A D A
T A B L E 7 – The Net Value of Conserving Natural Capital in the Grand River Watershed71
Benefits (costs) $/hectare/year High Best Estimate Low
Saved government payments72 69.98 46.45 23.23Water Treatment: sediment reduction 10.27 5.60 1.87 Water Treatment: phosphorus reduction 44.50 23.50 2.50Decreased sedimentation of conveyance/storage 1.27 0.69 0.23 Decreased flooding 7.50 4.80 2.10 Increased recreational fishing 48.44 26.42 8.81 Other river-based recreation 2.80 1.40 0.70Reduction in GHG emissions 28.80 19.20 9.60 Carbon sequestration 26.85 17.90 8.95 Increased wildlife hunting 35.04 17.52 8.76 Increased wildlife viewing 68.97 34.49 17.24 Gross benefits 344.12 197.97 83.99
Program administration costs (1.04) (2.08) (3.12)Wildlife depredation compensation (0.32) (0.64) (0.96)
Net benefits 342.76 195.25 79.91
1(
Major Threats to Natural Capital in the Grand River Watershed
• Runoff from urban growth, agricultural lands and sewage treatment plants contribute to nutrients and sediments in the Grand River 69
• Soil erosion and sedimentation reduce water quality, increase costs of water treatment, and reduce recreation uses in the watershed
• Loss of wetlands and riparian habitat to agricultural use
left
:And
rew
McL
achl
an
righ
t:D
arin
Lang
hors
t
b
elow
righ
t:D
ave
Kost
ersk
y

The Upper Assiniboine River Basin
The Upper Assiniboine River Basin (UARB) is a region dependent predominately on agriculture. The UARB
consists of 21,000 km2 in east-central Saskatchewan and western Manitoba. There are 1,024,814 cultivated hectares
on 5,800 farms. Of the 60,000 people who live in the basin, 30 percent are considered rural residents. The basin
affects more than those residing in its boundaries. Residents of downstream communities including Brandon and
Portage la Prairie get their drinking water from the Assiniboine River. The basin is hummocky in the southern
portion with an abundance of streams and tributaries. Seventy percent of the soils are considered highly produc-
tive. Annual crops are the leading agricultural output, followed by livestock and forage production.
Over the past century, the land in the basin was cleared of trees and vegetative cover, and wetlands were drained.
The impact of this land conversion on hydrologic characteristics of the region has been a major concern. In the
late 1990s, following a major flood in 1995, a study was undertaken of water resource issues such as drainage and
flood control, and the degradation of valuable wetland habitat.73
Erosion rates for the black soil zone of Saskatchewan are highly variable in this landscape, depending on soil tex-
ture, slope and cropping practices in place. Sites in both the Saskatchewan and Manitoba portions of the basin
have been monitored for water quality. On average, most of the indicators were within the water quality objectives
set by the provinces. While water supplies in the basin are adequate for consumption and production, projected
Major Threats to Natural Capital in the Upper Assiniboine River Basin
• Loss of wetlands and riparian habitat to agricultural use
• Increased danger of flooding due to loss of wetlands
• Soil erosion from agricultural production leading to increased sedimentation of surface waters and wind-blown soil contributing to
respiratory health effects and loss of visibility
• Increasing concern about decline in water quality due to increased livestock densities
2)

increases in livestock numbers and density may begin to have a bigger effect on water quality. As indicated in the
Lower Fraser Valley case study, increasing livestock densities may lead to excessive nitrates and other compounds
contaminating water supplies, further increasing the benefits of converting land to wetlands and other natural areas.
Wind erosion is a problem in the basin. Blowing soil increases the costs of cleaning and maintenance for businesses
and households, damages non-farm machinery, and adversely affects health (especially children, the elderly and
those with lung disease).
The Net Benefits of Protecting Natural Areas or Converting Tilled Lands to Natural Areas
Table 8 presents high, low and ‘best’ estimates of the benefits and costs of protecting a natural area or converting
a hectare of agricultural land to permanent vegetative cover that does not deplete the natural capital on that land.74
Market lease rates for agricultural land comparable to that in the river basin range from approximately $28 to $52
per hectare. Table 8 shows that the low estimates of the net benefits from conserving natural capital are of the
same order of magnitude as the low lease rates, while the high estimates are considerably above the high lease rates.
Conserving natural capital could thus provide society with larger benefits than agricultural production on a portion
of the lands within the river basin. For example, if the net benefits of conserving natural capital are approximately
$33 per hectare, 22,000 hectares of land with lease rates below $33 could be conserved, yielding a net return to
society of $750,000 per year.
2!
T H E VA LU E O F N AT U R A LC A P I TA L I NS E T T L E D A R E A S O FC A N A D A
Upper Assiniboine River Basin
left
:Dar
inLa
ngho
rst
rig
ht:B
rian
Wol
itski
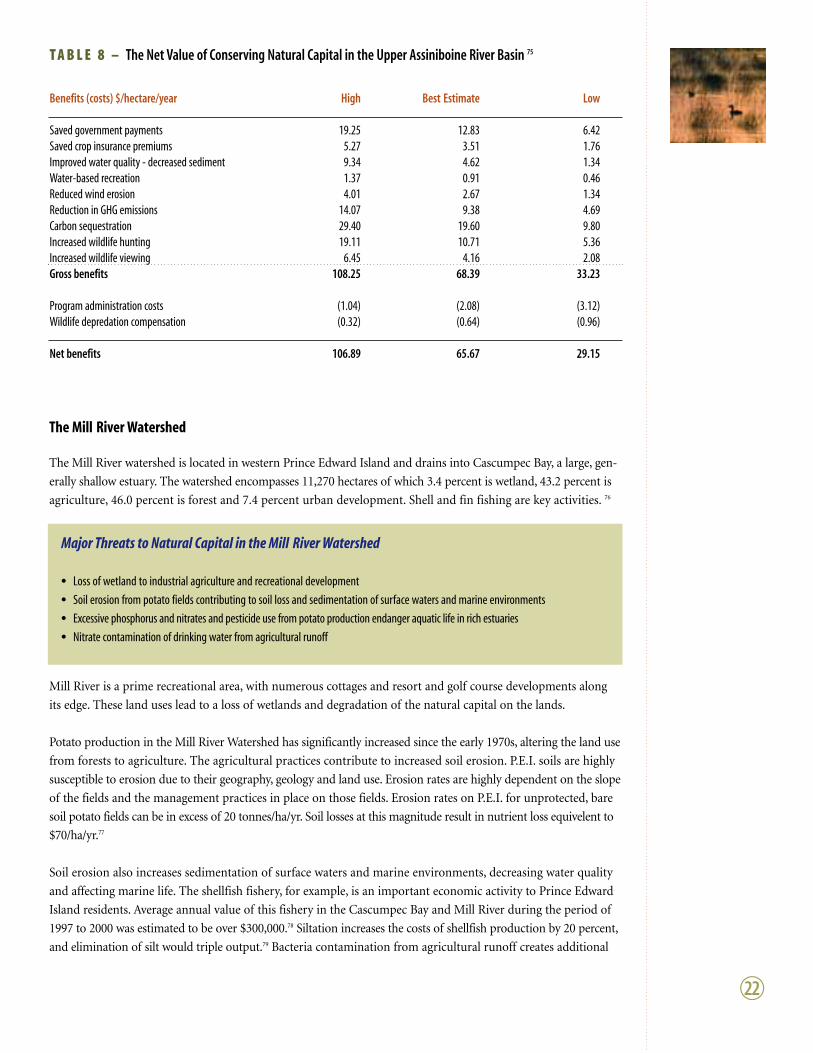
2@
T A B L E 8 – The Net Value of Conserving Natural Capital in the Upper Assiniboine River Basin 75
Benefits (costs) $/hectare/year High Best Estimate Low
Saved government payments 19.25 12.83 6.42Saved crop insurance premiums 5.27 3.51 1.76 Improved water quality - decreased sediment 9.34 4.62 1.34Water-based recreation 1.37 0.91 0.46 Reduced wind erosion 4.01 2.67 1.34Reduction in GHG emissions 14.07 9.38 4.69Carbon sequestration 29.40 19.60 9.80 Increased wildlife hunting 19.11 10.71 5.36Increased wildlife viewing 6.45 4.16 2.08Gross benefits 108.25 68.39 33.23
Program administration costs (1.04) (2.08) (3.12)Wildlife depredation compensation (0.32) (0.64) (0.96)
Net benefits 106.89 65.67 29.15
The Mill River Watershed
The Mill River watershed is located in western Prince Edward Island and drains into Cascumpec Bay, a large, gen-
erally shallow estuary. The watershed encompasses 11,270 hectares of which 3.4 percent is wetland, 43.2 percent is
agriculture, 46.0 percent is forest and 7.4 percent urban development. Shell and fin fishing are key activities. 76
Mill River is a prime recreational area, with numerous cottages and resort and golf course developments along
its edge. These land uses lead to a loss of wetlands and degradation of the natural capital on the lands.
Potato production in the Mill River Watershed has significantly increased since the early 1970s, altering the land use
from forests to agriculture. The agricultural practices contribute to increased soil erosion. P.E.I. soils are highly
susceptible to erosion due to their geography, geology and land use. Erosion rates are highly dependent on the slope
of the fields and the management practices in place on those fields. Erosion rates on P.E.I. for unprotected, bare
soil potato fields can be in excess of 20 tonnes/ha/yr. Soil losses at this magnitude result in nutrient loss equivelent to
$70/ha/yr.77
Soil erosion also increases sedimentation of surface waters and marine environments, decreasing water quality
and affecting marine life. The shellfish fishery, for example, is an important economic activity to Prince Edward
Island residents. Average annual value of this fishery in the Cascumpec Bay and Mill River during the period of
1997 to 2000 was estimated to be over $300,000.78 Siltation increases the costs of shellfish production by 20 percent,
and elimination of silt would triple output.79 Bacteria contamination from agricultural runoff creates additional
Major Threats to Natural Capital in the Mill River Watershed
• Loss of wetland to industrial agriculture and recreational development
• Soil erosion from potato fields contributing to soil loss and sedimentation of surface waters and marine environments
• Excessive phosphorus and nitrates and pesticide use from potato production endanger aquatic life in rich estuaries
• Nitrate contamination of drinking water from agricultural runoff

problems for shellfish harvesting. Due to contamination, 75 hectares of the upper Mill River are closed for shellfish
harvest, 82 hectares of the Mill River estuary are conditionally open, with the remaining 165 hectares uncondition-
ally open for harvest.
Potato production increases the amount of nutrients (phosphorus and nitrogen) in the watershed, leading to a
deterioration of water quality. Phosphorus and nitrogen loads from livestock produce approximately 323,000 kg
of waste nitrogen and 240,000 kg of waste phosphorus per year.80 In coastal P.E.I. waters, excessive sea lettuce
populations occur in nutrient-rich estuaries and the plant material can fill the water column over broad areas.
As the sea lettuce dies and decomposes, anoxic conditions (absence of oxygen) occur, resulting in the death of
benthic shellfish. Fin fish caught within the sea lettuce mat will also die due to the anoxic conditions.81 Pesticide
runoff from agricultural use has harmful effects on fisheries.
Two documented fish kills have occurred on the Mill River since 1995. One incident involved an agricultural
sprayer that overturned while moving to a potato field that resulted in product reaching a stream 33 metres away.
The result was the loss of 40,000 salmon being reared at an aquaculture pond and 700 wild brook trout below
the site of the spill. In 1996, 40,000 salmon were lost at the same aquaculture pond following 32mm of rain.
Pesticides were found at a low level in the pond but not at levels considered toxic. The kill may have occurred
as a result of problems compounded by silt and other substances found in runoff from agricultural lands.82
Although no economic analysis of the Mill River fish kills were completed, an analysis was conducted on a fish
kill on the Valleyfield River in eastern P.E.I. This analysis focused on a 1999 fish kill on the Valleyfield River,
where a minimum of 2,500 brook trout were killed after runoff from potato fields entered the river. Looking at
only the cost of the loss to the recreational brook trout fishery on this segment of the river, the author estimated
the loss to be approximately $40,000.83
One thousand-two hundred people live in the Mill River watershed, and all are dependent upon groundwater for
their drinking water. Evidence from research on P.E.I. is cause for concern both in terms of the distribution of
nitrates in groundwater and implications for the future. Nitrate levels in groundwater have increased where land
2#
T H E VA LU E O F N AT U R A LC A P I TA L I NS E T T L E D A R E A S O FC A N A D A
Mill River Watershed
left
:DU
Can
ada
ri
ght:
Gill
es D
aigl
e
belo
w ri
ght:
Ron
Gar
nett

has been converted to more intensive agricultural cultivation. On the Mill River over the past 30 years, the nitrate
levels have doubled. In some watersheds, 6 to 7 percent of household wells do not meet drinking water guidelines.84
The Net Benefits of Protecting Natural Areas or Converting Tilled Lands to Natural Areas
Table 9 presents high, low and ‘best’ estimates of the benefits and costs of protecting a natural area or converting a
hectare of agricultural land to permanent vegetative cover that does not deplete the natural capital on that land.85
They are modest compared to the estimates for the Grand River and Upper Assiniboine watersheds. This suggests
that it will be more difficult to conserve natural capital in Mill River because the value of the land might be higher
in agricultural and residential use than in a natural state. For example, at current average rental prices for agri-
cultural land (ranging from $250 to $625 per hectare), the numbers suggest it is unlikely that agricultural land
would be converted to natural areas because the net benefits are below these average rental rates. Belcher et al.
argue that this conclusion may be flawed for two reasons. Firstly, because there is insufficient data to capture all
the components of natural capital, the benefit estimates may be too low. Secondly, the buffer zones created by
government policy to protect natural areas may depress surrounding land values, making some lands a good
target for conservation. Table 9 is thus best viewed as a starting point for future work, rather than a definitive
indicator of the net benefits per hectare of natural capital.
T A B L E 9 – The Net Value of Conserving Natural Capital in the Mill River Watershed
Benefits (costs) $/hectare/year High Best Estimate Low
Saved in government payments 135.00 90.00 45.00Decreased sedimentation of conveyance/storage 2.35 1.15 0.57Increased recreational fishing 33.80 16.52 8.15Reduction in GHG emissions 13.35 8.90 4.45Carbon sequestration 10.79 7.19 3.60 Increased wildlife hunting 2.24 1.12 0.56Increased wildlife viewing 7.72 3.86 1.93Wildlife – non-use and aesthetic values 32.04 16.02 8.01Gross benefits 237.29 144.76 72.27
Program administration costs (1.04) (2.08) (3.12)
Net benefits 236.25 142.68 69.15
2$
On the Mill River
over the past 30
years, the nitrate
levels have doubled.
In some watersheds,
6 to 7 percent of
household wells do
not meet drinking
water guidelines.

c o n c l u s i o n sThis paper has illustrated the threats to Canada’s natural capital due to the loss of natural areas to residential,
commercial, industrial and agricultural use. These land uses are valuable to society, but they can also result in:
• Loss of wetlands, forests, riparian areas, and grasslands;
• Soil erosion and increased sedimentation of rivers and streams;
• Runoff of pesticides and nutrients from agricultural fertilizers and animal waste; and
• Air and water pollution from the resulting economic activities.
The paper has provided examples of how protecting and preserving natural areas adds to the wealth and well
being of society today and into the future by:
• Improving the quality of water in surface and groundwater;
• Decreasing water and waste treatment costs;
• Decreasing dredging costs to remove sediment from waterways;
• Increasing recreational opportunities such as fishing, swimming, hunting, and wildlife viewing;
• Providing aesthetic values;
• Protecting agricultural production on lands threatened by urbanization;
• Benefiting farm profits by engaging in beneficial management practices that coincide with protecting
natural capital;
• Decreasing net greenhouse gas (GHG) emissions;
• Mitigating flooding;
• Improving air quality by protecting forests and reducing urban sprawl; and
• Protecting and enhancing habitats and ecological services of all kinds.
Conversely, the loss of natural areas may require society to find substitutes for all the valuable services noted above.
The substitutes for natural capital may be far more expensive to build and operate than those provided by nature.
For example, the waste services of wetlands in the lower Fraser Valley are worth at least $230 million per year in
foregone treatment costs alone, and their value is many times higher if the infrastructure capital costs are added.
Ignoring the value of natural areas is thus inefficient and costly for society today and for generations to come.
Society also runs the risk of having no substitutes for natural capital, thus creating the potential for significant
losses in our ability to sustain our economy and well being. The values provided by natural capital are far in
excess of what has been illustrated in this paper because we do not attempt to compute many of the intangible
benefits of nature – attributes we know exist, but cannot place a value on. The focus has been to show that pro-
tecting natural areas can help society avoid significant costs both today and into the future.
While this paper does not propose specific policies or programs for the protection of natural capital, it reveals
that governments have the following important roles to play.
• Provide essential data on the physical quantities and attributes of natural capital and their changes over time.
The case studies repeatedly illustrate the woeful lack of even the most basic data on the amount of natural capital
in Canada. Efficient management of our natural capital resources requires knowing how much we have. The
February 2, 2004 Speech from the Throne stated “…building on recommendations of the National Roundtable
on the Environment and the Economy, the Government will start incorporating key indicators on clean water,
clean air and emissions reduction into its decision making.” However, without a far better understanding of our
current stocks of natural capital in Canada, adopting the ‘key indicator’ approach will be irrelevant. No company
2%
iv
Protecting
natural areas can
help society avoid
significant costs
both today and
into the future.
righ
t,be
low
righ
t:Br
ian
Wol
itski

would stay in business long if its management did not know how much product was being produced, how much
it cost to produce it, or the market price for the product. Why should we treat our natural capital – capital that
sustains life on the planet – any differently?
• Assist in better decision making by coordinating and funding efforts to measure and value natural capital.
Many agencies, public and private, are engaged in measurement and valuation processes. A national clearing-
house for information would greatly assist these efforts.
• On Crown lands, governments should ensure that estimates of the value of the many benefits from natural
capital attributes are compared to market values of the land before releasing that land for housing, commer-
cial or industrial uses.
• When land is privately held, governments have a role to play in designing policies that provide incentives for
landowners to conserve their land when the value of the natural capital from that land equals or exceeds its
value in other uses. A number of policy instruments including rental payments, conservation easements, pro-
perty tax rebates and a tradable conservation rights market have been used in other jurisdictions to meet
conservation targets.
The federal government should take a strong leadership role by creating a national task force to: (1) fund and
coordinate the comprehensive measurement of baseline data on the state of Canada’s natural capital, to estimate
its loss over the past decades and to ensure sustained measurement into the future; (2) ensure traditional eco-
nomic analyses and forecasting approaches are revised to properly account for the services provided by natural
capital and integrate the true cost of its degradation with economic decision making.; and (3) coordinate efforts
to conserve and restore natural capital.
2^
Without a
far better under-
standing of our
current stocks of
natural capital in
Canada, adopting
the ‘key indicator’
approach will be
irrelevant.

a p p e n d i x Methodology for Computation of Benefits and Costs of Conserving NaturalCapital for the Agricultural Case Studies
The derivations used by Belcher et al. (2001) to compute the benefits and costs of conserving natural capital in
the three agricultural case studies is detailed below. Similar measurement methodologies are used in each case.
Grand River Watershed
Foregone Government Program Costs
Converting land to permanent vegetative cover that is not used for agricultural production will save government
expenditures on assistance payments.86 On average, land withdrawn from producing row crops, used as pasture
and for hay production in the Upper Grand River basin at the time of the study would save about $46 per hectare
in government support.87
Erosion Control and Water Purification
Municipal water treatment costs in southern Ontario to remove sediment are estimated in the range of $9.34 to
$28.02 per tonne of sediment (with a mean of $18.68), while those to remove phosphorus fall in the range of $5
to $500 per kg ($50 is used in the computation).88
Reduced Sedimentation of Reservoirs and Flood Control
The costs associated with sedimentation are the maintenance costs of removing sediment. An estimate of the costs
of ditch maintenance is $0.69/tonne of sediment, while that of maintaining water storage reservoirs is $1.62/tonne
of sediment in the lake states, making total dredging costs equal to $2.31/tonne in year 2000 dollars.89 Converting
agricultural lands to permanent vegetative cover also reduces potential flood damage. Flood damage is estimated
to fall by $2.10 to $7.50 per hectare of vegetated riparian zones consisting of 100 metre buffers on both sides of
the stream channel.
Recreational Uses of the Grand’s Watershed
Ontario residents spent approximately $30 per day participating in recreational fishing.90 This translates to approxi-
mately 100 days per kilometre over the entire watershed area, or approximately 25 days per hectare of water.
Decreasing sediment loads by one tonne in creeks and rivers of southern Ontario increases the number of fishing
days by 1.47 and 4.41.91 The value of the increased days of fishing ranges from $44.04 to $132.12/tonne of sediment
removed from the rivers (with a mean of $88.08/tonne).
An estimate of the value of the services from natural capital for non-fishing freshwater recreation is $0.70 per
hectare of riparian cover.92 This value is conservative because the Grand River is a Canadian Heritage River, and
will likely provide greater recreational opportunities than an average river in the northeastern United States.
2&
v
righ
t:D
UC
anad
a

2*
Greenhouse Gas Services: Carbon Sequestration
The conversion of annual cropland to conservation cover will decrease net greenhouse gas (GHG) emissions in
two ways. Annual crop production consumes significant quantities of fossil fuels. A hectare of land devoted to
33 percent grain corn, 20 percent soybeans, 24 percent alfalfa and 23 percent grains will generate 1.92 tonnes of
GHG emissions per year from fossil fuel use.93 No emissions are created on land in permanent vegetative cover.
Land in permanent cover will also sequester more carbon in its soils than land tilled and planted annually due to
decreased decomposition rates and increased plant residue inputs into the soil. The sequestration rates depend
on the type of vegetative cover. A change from conventional crop tillage to permanent vegetative cover would
increase carbon sequestered by 1.79 tonnes of carbon dioxide/ha/yr. If a tonne of carbon emissions has an implicit
price of $10, the value of the incremental sequestration is $17.90/ha/yr.94
Wildlife
Ontario residents spent $200.6 million ($37/person/day) hunting wildlife in the province in 1996. The estimated
willingness to pay by hunters for specific animals is $19.90/day for large mammals, $16.20/day for waterfowl,
$11.60/day for other birds and $17.90/day for all hunting.95 U.S. studies of willingness to pay to hunt allow a con-
version of these figures to a per hectare measure. The increase in value associated with improved habitat from the
permanent cover is estimated at $26.68/ha/yr (year 2000 dollars).96
Ontario residents spent $410.9 million ($16/person/day) on wildlife viewing activities in the province in 1996.
This included expenditures on accommodation, transportation, food and equipment. The estimated consumer
surplus attributable to wildlife viewing was $7.50/day for Ontario residents. In 1996, in the Grand River watershed,
there were 812,000 people-days (or 180 days/km2/year) in wildlife viewing activities.97 The increase in value from
improved habitat is estimated at $46.97/ha/yr if expenditure estimates are used and $68.97/ha/yr if people’s willing-
ness to pay for wildlife viewing is also incorporated into the calculation.98
Administration Costs
If agricultural lands were converted from tillage to permanent cover (using a policy such as an annual payment to
farmers for their conserved land), administration costs would be incurred. The administration costs for a crop-
land conversion program undertaken by the Prairie Farm Rehabilitation Administration (PFRA) in the late 1980s
to 1990s in western Canada provides a benchmark estimate. Based on an enrollment of 306,044 hectares and total
costs of approximately $5 million, an upper limit for the average administration cost is approximately $16.34/ha.99
Assuming a 10-year agreement, the administration costs for the program are estimated to be approximately
$1.63/ha/yr. Costs of compliance are assumed to be $2.08 per hectare.
Wildlife Depredation Compensation Costs
Increased populations of wildlife resulting from greater quantity and quality of habitat may cause greater levels of
crop damage. In Ontario in 1998 wildlife damages cost field crop producers (corn, soybeans, wheat and forages)
$26 million with a total loss to all farmers of $41 million.100 Crop insurance does not appear to cover these costs.
The cost of wildlife depredation per hectare is estimated at less than $1.00/ha/yr.

Upper Assiniboine River Basin
Foregone Government Program Costs
Removing land from agricultural production in the UARB would save approximately $12 per ha in government
support. This estimate is based on government payments to producers in the UARB at the time of the study who
participated in various crop support programs in the region. Farmers also qualify for crop insurance under
Saskatchewan Crop Insurance Corporation (SCIC) programs. Data from that program indicate that taking land
out of annual crop production can save the $3.51 per ha payment made by government.101 Total savings in govern-
ment program costs are $16.34/ha.
Erosion Control and Water Purification
Unfortunately, there are no estimates for sediment delivery rates for the basin, therefore the estimates used for the
Grand River watershed are applied to this case. Data are not available to undertake the specific measurement of the
reduction in erosion costs, so estimates from the northern Great Plains of the U.S. are used to proxy the impact in
the UARB. Using erosion imposed costs of approximately $1.15/tonne, the potential benefits of a conservation cover
program in the UARB are between $1.34 and $9.34/ha/yr.102 Estimating the benefits of reduced wind erosion is
difficult due to limited data about both the sources and how people respond to blowing soil. Air quality benefits
from reducing wind erosion are derived from a study of wind erosion in the United States. The U.S. figures are
adjusted substantially downward to reflect the low population density of the UARB.103 A figure of $2.10/ha/yr
(year 2000 dollars) is used as the best estimate.104 Conversion of agricultural land to wetlands and riparian zones
is likely to provide relatively small direct water quality benefits in the basin.
Recreational Uses of the Upper Assiniboine’s Watershed
Recreational fishing is an important economic activity in the UARB, particularly in Lake of the Prairies, a reservoir
on the upper reaches of the Assiniboine River, and in the Assiniboine River down to its convergence with the Red
River in the City of Winnipeg. Saskatchewan and Manitoba residents spent $95.4 million ($29/person/day) and
$124 million ($41/person/day) respectively on recreational fishing in 1996.105 Willingness to pay for recreational
fishing was estimated to be $10.70/person/day in Saskatchewan and $14.60/person/day in Manitoba. Therefore, the
total willingness to pay per person per day was $39.70 in Saskatchewan and $55.60 in Manitoba in 1996 ($42.47/day
and $59.49/day respectively in year 2000 dollars). People spent approximately 612,000 days (13.5 days/km2) rec-
reational fishing in the UARB in 1996. Again using studies from the United States, an estimate of the value of
water-based recreational activities attributable to conversion of agricultural lands to natural areas is $0.91ha/yr.
Greenhouse Gas Services: Carbon Sequestration
Using the same methodology as in the Grand River case (i.e., using an estimate of $10 per tonne as the implicit
price of carbon), the benefits of converting cropland (in this case from wheat) to permanent cover is estimated at
$9.38/ha/yr. Enhanced soil uptake of carbon would result if the land is converted to grass, yielding $19.60/ha/yr.
Wildlife
Saskatchewan residents spent $33.7 million ($45/person/day) hunting wildlife in the province in 1996. The esti-
mated consumer surplus at that time for hunting activities was $11.40/day for large mammals, $18.00/day for
waterfowl, $12.40/day for other birds and $13.90/day for all types of hunting.106 People spent approximately 64,000
days hunting large mammals and 60,000 days hunting small mammals, waterfowl and other birds in the UARB.
Up-dating to year 2000 dollars, and assuming that cropland provides no habitat to game species of wildlife,
2(
T H E VA LU E O F N AT U R A LC A P I TA L I NS E T T L E D A R E A S O FC A N A D A
left
,rig
ht:D
arin
Lang
hors
t
3)
the average hunting value for lands in permanent cover is $10.71/ha/yr and an upper bound is $19.11/ha/yr.107
In 1995, Saskatchewan residents spent $39.3 million ($17/day or $18.19/day in year 2000 dollars) viewing wildlife
in the province. The estimated willingness to pay for wildlife viewing was $5.90/day in 1996 ($6.31/day in year
2000 dollars). People expended 608,000 days wildlife viewing in the UARB in 1996. Using the same methodology
as in the other cases, the average value of conservation cover for wildlife viewing is approximately $4.16/ha. Again,
using U.S. surveys, this translates into an upper bound total willingness to pay of $6.45/ha/yr (year 2000 dollars)
in incremental benefits for wildlife viewing from the conversion of agricultural lands to permanent cover.
Administration Costs
The costs for the Grand River watershed were based on calculations for the UARB, so the estimates used here are
identical.
Wildlife Depredation Compensation Costs
Wildlife depredation costs are estimated from compensation through crop insurance programs and crop depre-
dation prevention programs. Using data from the Saskatchewan Crop Insurance Corporation and Saskatchewan
Environment and Resource Management (SERM), Belcher et al. (2001) estimate the incremental costs associated
with wildlife depredation are $0.64 per hectare on average.
Mill River Watershed
Savings in Government Program Costs
Data on average payments for P.E.I. as a whole indicate the foregone program costs because data specifically for
Mill River are not available. A best guess estimate is that agricultural land in P.E.I. receives approximately $90/ha
in government program payments.
Erosion Control and Water Purification
Erosion and sedimentation delivery rates for the Grand River watershed were used as a proxy because data for Mill
River were not available. Unfortunately Belcher et al. (2001) found no data linking nitrogen and phosphorus ero-
sion to land use and they could not use the Grand River data as the region was too different from that of Mill River.
The costs of removing excess sediment from ditches and water storage facilities is estimated using data from the
northeast U.S. at $1.53 per tonne sediment removed. However, estimates of the cost of removing sediments from
highway ditches on P.E.I. by the Department of Transportation are estimated to be much higher at $35.00/ton. This
includes the cost of excavation, trucking, disposal, reshaping the ditch, seeding, and erosion control.108
Fisheries
Both recreational and commercial fishing are important in the watershed. The reduction in water quality (as des-
cribed above) has affected both types of fisheries, but precise data on the damages are not available. P.E.I. residents
spent $1.5 million ($7.49/person/day in year 2000 dollars) on recreational fishing in 1996.109 Non-resident recre-
ational fishers are also quite important to the local economy. The value of recreational fishing to P.E.I. residents in
2000 was $1.6 million per year and $14.6 million to all fishers regardless of residence.110 There are no estimates of
the impact of increased sedimentation on freshwater fisheries, so using Ontario figures, decreasing sediment loads
will increase recreational inland fishing benefits by $22.02/tonne for residents and $176.40/tonne for non-residents.
No data were available to quantify the change in freshwater fishery value associated with a change in nutrient (nitro-
gen and phosphorus) loads in P.E.I.
Greenhouse Gas Services: Carbon Sequestration
Following the same methodology as in the other agricultural case studies, converting agricultural land to perma-
nent cover would save 0.89 tonnes/ha/yr of CO2 equivalent emissions. Converting annual cropland to conservation
cover will increase soil carbon stocks by 0.719 tonnes/ha/yr, for a value of $11.60/ha/yr to $14.00/ha/yr.
Wildlife
P.E.I. residents spent $1.9 million over 5,000 person-days ($25.68/person/day in year 2000 dollars) hunting wildlife
in the province in 1996.111 The estimated consumer surplus for hunting activities were $14.87/person/day for all
hunting (year 2000 dollars). Converting these figures into a per hectare figure, the value of a marginal hectare of
conservation cover is approximately $0.56, a number considerably lower than in the other provinces.
Wildlife viewing expenditures by P.E.I. residents for 41,000 person-days totaled $3.1 million, or $10.70/person/day.
Willingness to pay for wildlife viewing was $5.46/person/day.112 The value of a marginal hectare of conservation
land thus equals $1.93, again substantially lower than in other provinces. The value may be affected by the ex-
clusion of non-resident tourists who annually spend $300 million in P.E.I.
Administration Costs
The costs for the Grand River watershed were based on calculations for the UARB, so the estimates used here
are identical.
Wildlife Depredation Compensation Costs
Because there are no wildlife depredation compensation programs in P.E.I., it is assumed that wildlife depredation
costs in the Mill River watershed are zero.
T H E VA LU E O F N AT U R A LC A P I TA L I NS E T T L E D A R E A S O FC A N A D A
3!
left
:And
rew
McL
achl
an
bel
ow:B
rian
Wol
itski
3@
e n d n o t e s1 Research assistance for this report was provided by
Matthew Bourke, Catherine Cheng, Judy Harris,
Shahrokh Shahabi-Aziz, James Steidle, Alex Tu and
Linda Wong. I am grateful for the insightful reviews
provided by C. Edwards, L. Brown, R. Trout and
K. Belcher.
2 It is beyond the scope of this paper to evaluate specific
land use policies. The effects on natural capital of
government regulation of land use is a complex subject
that merits its own study.
3 The notion that other forms of capital can be substituted
for natural capital has been called weak sustainability.
Sustainability, broadly defined, is the ability of the
economy to maintain a flow of production necessary
to ensure non-decreasing consumption per capita
indefinitely. To sustain production, the economy needs
a constant supply of the inputs that are essential in the
sense that without these inputs, no output could be
produced. The relationship between natural capital and
sustainable output then depends on whether natural
capital is essential or not, i.e., what are the substitution
possibilities between factor inputs.
4 Trust for Public Land (1999). The economic benefits
of parks and open space: How land conservation helps
communities grow smart and protect the bottom line,
as cited in A. Sauer (2002) The value of conservation
easements, the importance of protecting nature and
open space, world resources institute, discussion paper,
as presented by the West Hill Foundation for Nature,
Inc., December 1, 2002.
5 The concepts of weak and strong sustainability reflect
how essential natural capital is to the economy and
environment. Weak sustainability requires the main-
tenance of an aggregate stock of capital (natural, human
and manufactured) at a level necessary to ensure inde-
finite production. All of the forms of capital must
therefore be perfectly substitutable for each other.
Strong sustainability says that specific forms of natural
capital are essential (they do not have substitutes), and
stocks of these resources must remain intact over time
to ensure continued production. We have an imperfect
understanding of what forms and minimum amounts
(in terms of quantity and quality) of natural capital are
essential and how to sustain stock sizes needed to
ensure non-decreasing production, consumption, and
hence, human survival. Some forms of natural capital
are clearly essential – our atmosphere and water, for
example.
6 Statistics Canada’s Environment division is developing
natural capital stock accounts. Environment Canada
and the National Round Table on the Economy and
Environment have an environmental indicator series.
These efforts are a good start, but are not comprehensive.
7 Meyer, J.L., Kaplan, L.A., Newbold, D., Strayer, D.L.,
Woltemade, C.J., Zedler, J.B., et al.(2003). Where rivers
are born: The scientific imperative for protecting small
streams and wetlands. Retrieved August 2004, from
http://www.sierraclub.org/cleanwater/reports_factsheets.
8 Kadlec, R. H. and R. L. Knight (1996). Treatment
Wetlands. New York, NY: Lewis Publishers.
9 Mitsch, W. J. and J. G. Gosselink (2000). Wetlands (3rd
ed.). New York, NY: John Wiley and Sons, Inc.
10 Casey, R.E. and S.J. Klaine (2001). Nutrient attenuation
by a riparian wetland during natural and artificial
runoff events, Journal of Environmental Quality 30:
1720-1731.
11 Shan, B., C. Yin, and G. Li. (2002). Transport and
retention of phosphorus pollutants in the landscape
with a traditional, multipond system, Water, Air and
Soil Pollution 139:15-34.
12 Environment Canada (2001). Threats to sources of
drinking water and aquatic ecosystem health in Canada
(National Water Research Institute Scientific Assess-
ment Report Series No. 1). Retrieved August 2004,
from http://www.nwri.ca/threats/intro-e.html.
13 DeBusk , T.A. and K.R. Reddy (1987). Wastewater
treatment using floating aquatic macrophytes: Conta-
minant removal processes and management strategies.
In K.R. Reddy and W.H. Smith (eds.), Aquatic plants
for water treatment and resource recovery (pp. 643-656).
Orlando, FL: Magnolia Press.
14 Meyer, J.L., et. al. (2003).
15 Hayashi, M., van der Kamp, G., and R. Schmidt (2003).
Focused infiltration of snowmelt water in partially
frozen soil under small depressions, Journal of Hydrology
270: 214-229.
16 Ibid.
17 Ewel, K.C. (1990). Multiple demands on wetlands.
Bioscience 40: 660-666.
18 U.S. Environmental Protection Agency, as cited in
Antwi-Buadum, S. (2003). The economic value of natural
habitats, review of empirical literature, Ducks Unlimited
Canada, unpublished report.
19 Hey, D. L. and N. S. Philippi (1995). Flood reduction
through wetland restoration: the upper Mississippi
River basin as a case study, Restoration Ecology 3: 4-17.
20 Gabor, T.S., Kiers North, A., Ross, L.C.M., Murkin,
H.R., Anderson, J.S., and M. Raven (2004). Natural
Values. The importance of wetland and upland conser-
vation practices in watershed management: Functions
and values for water quality and quantity. Retrieved
August 2004, from http://www.ducks.ca/conserve/
wetland_values/conserve.html.
vi

21 See Bateman, I. J. and K. G. Willis (1999). Valuing
environmental preferences, theory and practice of the
contingent valuation method. Oxford, UK: Oxford Uni-
versity Press and the many references therein for a
compendium of readings on the practice and pitfalls
of valuation techniques.
22 These values are taken from Table 1 of the Appendix in
Heimlich, R. E., Wiebe, K.D., Claassen, R.D., Gadsby,
D., and R.M. House (1998). Wetlands and agriculture:
Private interests and public benefits (Agricultural Eco-
nomics Report No. 765), U.S. Department of Agricul-
ture, Economic Research Services, AER-765.
23 Environment Canada (2000). The importance of nature
to Canadians: The economic significance of nature-related
activities. Federal-Provincial-Territorial Task Force on
the Importance of Nature to Canadians. Retrieved
August 2004, from http://www.ec.gc.ca/nature/TofC.htm.
24 van Kooten, G.C. and E. Bulte (1998). How much ancient
forest should society retain: Carbon uptake, recreation,
and other value (working paper 1998-1, Sustainable
Forest Management Network). Edmonton, AB. http://
sfm-l.biology.ualberta.ca/english/pubs/PDF/WP_1998-1.
25 Bowker, J.M. and D. Diychuck (1994). Estimating the
nonmarket benefits of agricultural land retention in
Eastern Canada, Agricultural and Resource Economic
Review 23:218-25.
26 The Lower Fraser Valley case study was undertaken for
this paper by the author with assistance from Matthew
Bourke, Catherine Cheng, Judy Harris, Shahrokh
Shahabi-Aziz, James Steidle, Alex Tu and Linda Wong.
27 Elliot, B., Guppy, N., Mosher, C., and A.B. Arai (1999).
On the edge: Socio-demographic transformation in the
Lower Fraser Basin. In M. Healey (ed.), Seeking sustain-
ability in the Lower Fraser Basin (pp.135-169). Vancouver,
BC: Institute for Resources and the Environment Press,
Westwater Research.
28 Northwest Environmental Watch and Smart Growth BC
(2000). Sprawl and smart growth in Greater Vancouver-
A comparison of Vancouver, British Columbia, with
Seattle, Washington. Retrieved August 2004, from www.
northwestwatch.org/press/vancouvergrowth.html. The
figure of 1.99 million in 2001 was an increase of 158
thousand compared to 1996, and an increase of 384.4
thousand compared to 1991.
29 Transboundary Georgia Basin-Puget Sound Environ-
mental Indicators Working Group (2002). Georgia
Basin-Puget Sound ecosystem indicator report. Retrieved
August 2004, from http://wlapwww.gov.bc.ca/cppl/
gbpsei/index.html.
30 Ibid.
31 Fowler, E. P. (1992). Building cities that work. Montreal,
QC: McGill-Queen’s University Press.
32 Hodge, G. and I. M. Robinson (2001). Planning
Canadian regions. Vancouver, BC: University of British
Columbia Press.
33 Moore, K. E. (1992). Urbanization in the Lower Fraser
Valley, 1980-1987 (Canadian Wildlife Service Technical
Report No. 120). Delta, BC: Canadian Government
Publishing.
34 According to 2001 GVRD land use compilations, there
are 207,280 hectares of non-disturbed, agricultural,
harvesting/research and recreational lands left in the
GVRD. Excluding those lands in the North Shore and
Electoral Area A (which also excludes the University
Endowment Lands outside the University of British
Columbia), there are 96,348 hectares of the mentioned
land types remaining, most of which lies in the Fraser
Valley floor.
35 Information provided by 2001 GVRD land use
compilations.
36 Palda, F. (1997). The zero-tax city: Without civilizing
the financing of city services, cities are doomed to
decline, The Next City (Spring): 40-47.
37 Lavkulich, L. M., Hall, K. J. and H. Schreier (1999).
Land and water interactions: Present and future. In M.
Healey (ed.), Seeking sustainability in the Lower Fraser
Basin: Issues and choices (pp. 170-201). Vancouver, BC:
Institute for Research and the Environment Press
Westwater Research.
38 Healey, M., (ed.) (1999). Seeking sustainability in the
Lower Fraser Basin: Issues and choices. Vancouver, BC:
Institute for Research and the Environment Press,
Westwater Research.
39 For example, over half of the 118 kilometers of dikes
from Hope to Mission are considered to be too low,
with about 17 percent low by more than 0.4 meters,
due in part to improved flood modeling, changes in
river alignment and sediment deposition. See Fraser
Basin Council (2003). A snapshot on sustainability:
State of the Fraser Basin report. Retrieved August 2004,
from http://www.fraserbasin.bc.ca/publications.
40 The 2001 Canadian census showed that over 325,000
people live in 100,000 homes in the floodplain of the
Fraser River. This constitutes a 168 percent increase in
the last 20 years. “Considering the huge amount of
residential, commercial and infrastructure develop-
ment on the floodplain since 1948, if dikes failed and
we had a similar flood today, estimates for damage and
recovery range from $2-10 billion.” (Fraser Basin News,
vol. 6. no. 2. Fall 2003).
41 Fraser River Action Plan (1998). Wild, threatened,
endangered and lost streams of the Lower Fraser Valley:
Summary report 1997. Lower Fraser Valley stream
review, Vol. III. Retrieved August 2004, from http://
collection.nlc-bnc.ca/100/200/301/dfo-mpo/lower_
fraser_valley/wild_threatened_endangered/229864.pdf
3#
T H E VA LU E O F N AT U R A LC A P I TA L I NS E T T L E D A R E A S O FC A N A D A
left
:Dar
inLa
ngho
rst
rig
ht:D
UC
anad
a

3$
42 The B.C. government initiated the Protected Areas
Strategy in 1993 to develop a comprehensive protected
area network in B.C. The Protected Area Strategy forms
part of the Regional and Land Resource Management
Planning for the Province, which has completed strategic
planning on 73 percent of the Province. See http://
srmwww.gov.bc.ca/md/lrmp/data/policy/slupmap.htm.
43 2001 Census of Canada.
44 The objective of the Agricultural Land Reserve (ALR)
was to “protect high-quality agricultural land for future
food production rather than to convert such land to
urban uses.” Lavkulich, L., K.J. Hall and H. Schreier
(1999) Land and Water Interactions: Present and Future.
In M. Healey (ed.), Seeking sustainability in the Lower
Fraser Basin: Issues and choices (pp. 170-201). Vancouver,
BC: Institute for Research and the Environment Press,
Westwater Research. The ALR is a controversial policy.
For example, from the late 1980s to 1994, the develop-
ment of golf courses was allowed on the ALR. In
November 2002, the rules governing the ALR were
changed again to decentralize and devolve authority
from the Agricultural Land Commission to six regional
panels. The impact of this change is not yet known, but
there is concern due to pressures on regional commis-
sions to allow land conversion to other uses.
45 Northwest Environment Watch and Smart Growth BC
(2002). Sprawl and smart growth in Greater Vancouver –
A comparison of Vancouver, British Columbia, with
Seattle, Washington. Retrieved August 2004, from www.
northwestwatch.org/press/vancouvergrowth.html.
46 Table 1. Agricultural Production in the Fraser Valley –
1986-1996 from p. 12 derived from Statistics Canada
Census of Agriculture 1986, 1991, 1996.
47 Elliot, B. et al. (1999). p. 160.
48 Lavkulich, L.M. (1999). p. 179.
49 Ibid. p. 187.
50 Schreier, H., Hall, K. J., and S. J. Brown (1999). Agri-
culture: An important non-point source of pollution.
In C. Gray and T. Tuominen (eds.), Health of the Fraser
River aquatic ecosystem Vol. III (pp. 83-99). Vancouver,
BC: Fraser River Action Plan.
51 Nagpal, N.K., Holms, G.B., and S.T. Chieng (1990). Nitro-
gen leaching from a subsurface drained agricultural field
in the Lower Fraser Valley Victoria: Proceedings of the
13th Soil Science Workshop, BC Land Resource Science
Lead Committee, in Lavkulich et al. (1999) p. 187.
52 Elliot, B. et al. (1999). p. 162.
53 IBA News Canada (1999), as cited in the BC Naturalist
Magazine, Fall 1999.
54 Kadlec and Knight (1996).
55 These costs were calculated based on self-monitoring
and GVRD sampling data for the period between July 1,
2001 and June 30, 2002 and include amortized capital
costs and maintenance costs, as cited in Greater Van-
couver Regional District (2003). Industrial pricing
strategy. Retrieved August 2004, from http://www.gvrd.
bc.ca/sewerage/industrial_pricing.htm
56 Richardson, C. J. (1985). Mechanisms controlling
phosphorus retention capacity in freshwater wetlands,
Science 228: 1424-7.
57 DeBusk, T.A. and K.R. Reddy (1987). Wastewater treat-
ment using floating aquatic macrophytes: Contanimant
removal processes and management strategies. In K.R.
Reddy and W. H. Smith, (eds.), Aquatic plants for water
treatment and resource recovery (pp. 643-656). Orlando,
FL: Magnolia Press.
58 Obarska-Pempkowiak, H. (1997). Seasonal variations
in the efficiency of nutrient removal from eomestic
effluent in a quasi-natural field of reeds. In C.Etnier
and B. Guterstam (eds.), Ecological engineering for
wastewater treatment (2nd ed.), (pp 213-214). Boca
Raton, FL: CRC Press.
59 Knight, R.L., Ruble, R.W., Kadlec, R.H. and S.C. Reed
(1994). Wetlands for wastewater treatment performance
database. In G.A. Moshiri, (ed.), Constructed wetlands
for water quality improvement (pp. 35-58). Boca Raton,
FL:Lewis Publishers.
60 For example, the low estimate of 17 percent of the 273
kg/ha/yr of nitrogen applied to agricultural land gets
into surface water. This means that 46.4 kg/ha/yr of
excess nitrogen must be removed by water treatment
plants to prevent an increase in nitrogen levels. This
number is well within the estimates of nitrogen
absorption by wetlands. A similar calculation for phos-
phorus requires wetlands to absorb 14.3 kg/ha/yr, again
well below the lowest estimate of the wetland capacity.
61 This assumes that 46.4 kg of excess nitrogen/ha and
14.3 kg of excess phosphorus/ha must be removed each
year, amounts within the removal capacity of the wet-
lands. The opportunity cost of removing these nutrients
if done by a waste treatment plant, using the lowest
estimate is $3.04/kg for nitrogen and $21.85/ kg for
phosphorus, which means that the total cost per hec-
tare is approximately $140 for nitrogen and $312 for
phosphorus. That means that each hectare of wetlands
removes $452 worth of nitrogen and phosphorus per
year. If 40,000 hectares of the Fraser Valley’s wetlands
were involved in this process, their total value per year
would be $18 million. Similar calculations are done for
higher costs of physical treatment.
62 These numbers come from a variety of studies. The
dollar amounts assume 2 percent inflation per year
since the mid-1990s and a Canadian-U.S. exchange rate
of 1.35.
63 Optimax Consulting (1999). Burns Bog sustainable
development strategy – A model for ecological and eco-
nomic balance. Delta, BC: Burns Bog Conservation
Society. Values are converted from U.S. to Canadian
dollars and presented in 2004 dollars.
64 Leschine, T., Wellman, K. and T. Green (1997). The
economic value of wetlands: Wetlands’ role in flood pro-
tection in Western Washington (Ecology Publication No.
97-100). Values are converted from U.S. to Canadian
dollars and presented in 2004 dollars.
65 These estimates come from van Kooten, G.C. and E.
Bulte (1998). How much ancient forest should society
retain: Carbon uptake, recreation, and other value,
(Sustainable Forest Management Network working
paper 1998-1). Retrieved August 2004 from http://
sfm-1.biology.ualberta.ca/english/pubs/PDF/WP_1998-
1.pdf. Values are expressed in current 2004 dollars.
66 Environment Canada (2000). The importance of nature
to Canadians: The economic significance of nature-related
activities. Retrieved August 2004, from http://www.ec.
gc.ca/nature/TofC.htm. Values are expressed in current
2004 dollars.
67 Costanza, R., d’Arge, R., deGroot, R., Farber, S., Grasso,
M., Hannon, B. et al. (1998). The value of ecosystem
services: Putting the issue in perspective, Ecological
Economics 25: 67-72.
68 All information for the agricultural case studies is
taken from Belcher, K., C. Edwards, C., and B. Gray
(2001). Ecological fiscal reform and agricultural land-
scapes, analysis of economic instruments: Conservation
Cover Incentive Program, Background Paper, Ecological
Fiscal Reform, National Roundtable on the Economy
and Environment.
69 Grand River Conservation Authority (2000). Grand
River conservation strategy. Retrieved August 2004, from
http://www.grandriver.ca/Grandstrategy/background.cfm.
70 Grand River Conservation Authority (2001). Personal
Communication to Belcher et al. Belcher et al. note
that the amount of land identified as appropriate for
conservation cover will be sensitive to grain prices with
higher (lower) prices decreasing (increasing) the supply.
71 See Table 7 in Belcher et al. (2001).
72 The values for reduction in government payments to
agriculture reflect programs in place at the time the
case studies were done. As these programs change over
time, the numbers may not reflect the current situation.
Also note that whether one views a reduction in govern-
ment payments to a sector as a benefit or not depends
on a host of complex factors such as the perspective of
the study (national or local, what type of program is in
place, how are the funds are raised to pay for the pro-
gram, and so on). As the estimates of the benefits of
conserving natural capital on agricultural likely under-
estimate the total benefits, inclusion of this item is
warranted.
73 Environment Canada, SaskWater and Manitoba
Conservation (2000). Upper Assiniboine River basin
study, Main Report.
74 Methods used to compute the benefits and costs for
the Upper Assiniboine River Basin are shown in the
Appendix.
75 These data are taken from Belcher et al. (2001). See
Table 22 for notes explaining each measure.
76 Belcher et al. (2001).
77 Jacobs, P. (2000). Soil conservation for potato production.
A booklet on best management practices for potato
production. Prepared for the Canada-PEI Water Annex
to the Federal/Provincial Framework Agreement for
Environmental Cooperation in Atlantic Canada.
78 Gloutney, M. (2001). Ducks Unlimited Canada, Personal
Communication to Belcher et al. (2001).
79 Thompson, G.R.(1998). Bacterial contamination in
Prince Edward Island surface waters from agricultural
sources. Prepared for Canada-Prince Edward Island
water annex to the federal/provincial framework agree-
ment for environmental cooperation in Canada, as
cited in Belcher et al. (2001). Unfortunately, Belcher et
al. were unable to quantify changes in shellfish produc-
tivity associated with a decrease in sediment or nutrient
loads in incoming fresh water due to a lack of data.
80 Gloutney, M. (2001). Ducks Unlimited Canada, Personal
Communication to Belcher et al. (2001).
81 Raymond, B.B. (2002). Nutrient and chlorophyll trends
in Prince Edward Island estuaries. In D.K. Cairns (ed.),
Effects of land use on fish, shellfish, and their habitats on
Prince Edward Island (Can. Tech. Rep. Fish Aquat. Sci.
No. 2408).
82 Anon. (1998). Summary of activities surrounding recent
fish kills on P.E.I., October 1998, Government of Prince
Edward Island Report, Contact: James Mutch, Hydro-
geologist, 902-368-5599, [email protected]
83 MacDonald, K., Dewis, S., Hennigar, P., Percy, R.,
Boyce, D., and D. Sawyer (2000). Application of envi-
ronmental damage assessment and resource valuation
processes in the Atlantic Region. Presented at the 43rd
Annual International Conference, Great Lake, Great
Rivers 2000: A Vision for Tomorrow.
84 Somers, G., B. Raymond and W. Uhlman (1999). P.E.I.
Water Quality Interpretive Report. Pp 22-25. A report
prepared for the Canada-Prince Edward Island Water
Annex Agreement.
85 Methods used to compute the benefits and costs for
Mill River are shown in the Appendix.
86 Government support programs in place in this region
include the federal-provincial crop insurance program,
the Net Income Stabilization Account (NISA), Market
3%
T H E VA LU E O F N AT U R A LC A P I TA L I NS E T T L E D A R E A S O FC A N A D A
left
:Dar
inLa
ngho
rst
rig
ht:A
ndre
w M
cLac
hlan
3^
Revenue Insurance (MRI), the Canadian Farm Income
Program (CFIP), and other programs.
87 This estimate is based on government payments to
producers in the Upper Grand River basin who partici-
pated in the NISA program in 1999. It includes the
government share of payments for crop insurance,
NISA, MRI, AIDA (Agricultural Income Disaster
Assistance, the precursor to CFIP) and other programs.
A similar analysis for Ontario as a whole resulted in an
estimate of average income support of approximately
$65/ha, significantly higher than the value calculated
here for the Upper Grand watershed.
88 Estimates for sediment treatment are from Fox, G. and
E.J. Dickson (1990). The economics of erosion and
sediment control in southwestern Ontario, Canadian
Journal of Agricultural Economics 38: 23-44; and those
for phosphorus control from D.W. Draper and Associates
Ltd. (1997). Phosphorus trading program evaluation and
design: Bay of Quinte remedial action plan. Prepared for
the Ontario Ministry of Environment and Energy,
Environment Canada, Lower Trent Region Conservation
Authority, Trent-Severn Waterway and the Bay of
Quinte RAP Implementation Advisory Committee.
89 Ribaudo, M.O. (1989). Water quality benefits from the
Conservation Reserve Program. Economic Research
Service, U.S. Department of Agriculture, (Agricultural
Economic Report No. 606). Washington, D.C.: U.S.
Government Printing Office.
90 Environment Canada (2000). Numbers are in year 2000
dollars, converted from Environment Canada’s 1996
dollars estimates. Note that the estimates below are one
way to value the benefits of recreational fishing in the
Grand River. Other studies may provide additional
estimates.
91 Fox, G. and E.J. Dickson, (1990). The economics of
erosion and sediment control in southwestern Ontario,
Canadian Journal of Agricultural Economics 38: 23-44.
92 Feather, P., Hellerstein, D., and L. Hansen (1999). Eco-
nomic Valuation of Environmental Benefits and Targeting
of Conservation Programs: The Case of the CRP. U.S.
Department of Agriculture (Agricultural Economic
Report No. 778). These researchers estimated that 39
percent of the total freshwater recreation value can be
attributed to non-fishing freshwater based recreation. In
the Northeast States Region, approximately 17 percent
of this non-fishing recreation value can be attributed to
river recreation. Using estimates of total willingness to
pay for freshwater recreation of $10.60/ha, the value of
other freshwater recreation on rivers is estimated to be
$0.70/ha of conservation land ($10.60*0.39 (proportion
attributable to other freshwater recreation)*0.17 (pro-
portion attributable to river recreation)).
93 Based on weighted sum of 1996 Census of Agriculture
statistics on cropping patterns for the municipalities of
Wellington, Waterloo, Perth and Brant. Statistics
Canada (1997). Census of Agriculture: Agricultural
Profile of Ontario.
94 Smith, W.N., Desjardins , R.L., and B. Grant (2001).
Estimated changes in soil carbon associated with agri-
cultural practices in Canada, Canadian Journal of Soil
Science 81: 221-227.
95 Environment Canada (2000).
96 The estimates are derived from a conservative adapt-
ation of hunters’ willingness to pay for pheasant hunting
trips as found in Feather et al. (1999). See Belcher et al.
(2001) for details on the computation.
97 Environment Canada (2000).
98 The average value of one hectare of land converted to
permanent cover is $37.71/ha/yr.
99 Prairie Farm Rehabilitation Administration (2001).
Personal communication with Mark Dumanski as cited
in Belcher et al. (2001).
100 Ontario Soil and Crop Improvement Association (2000).
Wildlife impact assessment of Ontario agriculture. Sub-
mitted to Ontario Agriculture Commodity Council
and Agricultural Adaptation Council.
101 The data are for a period in which no major crop fail-
ures occurred. They thus may understate the savings in
insurance payments made by government.
102 Ribaudo, M.O. et al. (1989). CRP What Economic
Benefits? Journal of Soil and Water Conservation 44(5):
421-424.
103 Ibid.
104 The figure derived from Ribaudo, M.O. et al. (1989) of
$42.11/ha/yr was obtained from a survey of wind ero-
sion damages in New Mexico. It was discounted by
95 percent to reflect Belcher et al.’s (2001) estimate of
the differences in the population densities between
New Mexico and the UARB.
105 Environment Canada (2000).
106 Ibid.
107 See Belcher et al. (2001) for the computations of these
estimates. The methodology is the same as in the
Grand River case.
108 Personal Communication with Brian Thompson,
Environmental Engineer, P.E.I. Department of Trans-
portation, Charlottetown, P.E.I. 902 368-5185,
109 Environment Canada (2000).
110 ASE Consultants and Island International Consultants
(1992). A recreational fisheries development plan for
Prince Edward Island.
111 Environment Canada (2000).
112 All values are adjusted to year 2000 dollars.

National OfficeSuite 400, 110 Eglinton Avenue WestToronto ONM4R 1A3
Tel: (416) 932-3202Toll-free: 1-800-465-0029Fax: (416) [email protected]
www.natureconservancy.ca
National OfficeOak Hammock Marsh Conservation CentreP.O. Box 1160, Stonewall MBR0C 2Z0
Tel: (204) 467-3000Toll-free: 1-800-665-3825Fax: (204) [email protected]
www.ducks.ca
Ducks Unlimited conserves, restores and
manages wetlands and associated habitats
for North America’s waterfowl. These habitats
also benefit other wildlife and people.
The Nature Conservancy of Canada’s goal is to
preserve Canada’s biological diversity by taking
direct action to secure ecologically significant
landscapes.